
Submitted:
22 July 2025
Posted:
24 July 2025
You are already at the latest version
Abstract
Search and rescue (SAR) operations with unmanned aerial vehicles (UAVs) have been the subject of numerous scientific studies. Their effectiveness relies on intelligent and efficient path planning. Not only can they save expensive resources, they can minimize potential risks for the rescue team. This paper deals with optimal path planning for automated UAV-SAR operations, tailored specifically to the challenging inter-tidal environment of the Wadden Sea. The aim is to minimize the search time and maximize the discovery probability of lost persons (LP) with intelligent UAV path-planning strategies. To achieve this, first a dynamic probability map (PM) of the lost person’s possible location is generated. Two distinct methods are evaluated for this purpose: Monte Carlo Simulations (MCS) and a more efficient Markov Chain (MAC) model. The PM then directly informs the UAV’s decision making process. Then, several automated search strategies are systematically evaluated and compared in a comprehensive simulation study, from simple coverage patterns to advanced PM-driven algorithms. MAC-generated PMs prove to provide a fast and reliable foundation for time-critical applications such as SAR operations. Additionally, PM-based search strategies outperform standard search patterns, especially in larger search regions. Furthermore, the evaluation is extended to multi-UAV scenarios, showing in this case that an area-segmentation approach is most effective. The results validate and provide a considerable contribution for an efficient, time-critical framework for UAV deployment in complex, real-world SAR operations.
Keywords:
UAV automation
; probability maps generation for SAR operations
; UAV path planning
; Monte Carlo simulation
; Markov Chain
; greedy search
1. Introduction
1.1. Motivation
The Wadden Sea is a vast inter-tidal zone stretching from the Netherlands over Germany to Denmark and one of the world’s largest systems of sand and mudflats [1]. Its landscape is dynamic, altered by the ebb and flow of the tides. At high tide, much of the Wadden Sea is covered with water. At low tide, it reveals an extensive area of mudflat that can be explored on barefoot, a practice known as ’mudflat walking’ or ’wadden hiking’. Although this is a unique experience that attracts both tourists and locals alike, it also poses significant dangers. The primary threat is the returning water after a low tide, which may advance faster than a person can walk back to safety, cutting off routes back to mainland or the Wadden Islands. This situation may be aggravated by low visibility, e.g., due to sudden fog. Additional disorientation is often caused by the irregular shape of tidal creeks carved by water. Therefore, search and rescue (SAR) operations are necessary every year to find and rescue lost or distressed hikers in the Wadden Sea.
Traditionally, SAR teams rely on boats, specialized ground vehicles, and helicopters [2] [3], but these face limitations due to the characteristics of the terrain or due to the high operational costs and limited availabiliy, which highlights the need for advanced technological solutions. The motivation of this paper is to enhance SAR capabilities by deploying Unmanned Aerial Vehicles (UAVs), commonly known as drones. They can significantly improve SAR operations in complex environments, such as the Wadden Sea. The unique flight characteristics of UAVs, namely their speed, top-down aerial perspective and the ability to traverse difficult terrain like tidal creeks, make them ideal platforms for this environment. UAVs can therefore provide assistance to find lost persons more quickly and efficiently, while also minimizing the risk to human rescuers. By automating their search patterns, a fleet of UAVs could act simultaneously and cover a large area efficiently.
1.2. Related Work
The integration of UAVs into SAR operations is a growing field of research, with reports highlighting their significant potential, e.g., in the maritime sector [4]. However, in most current SAR operations, UAVs are manually piloted [5], which introduces human-related limitations, such as time delays. Automating UAV deployment is therefore a critical next step, especially considering that human survival time in water is strongly related to temperature, with the highest survival rates limited to the first few hours [6]. This makes time efficiency an essential factor.
Modern SAR missions often rely on the creation of a probability map (PM), which represents the probability that a lost person (LP), or target, is at a particular location, based on known information. In one of the first documented approaches, Sava et al. presented a method that divides a region into cells and assigns probabilities based on a structured combination of subjective and objective information [7]. Over time, these methods have evolved into dedicated, software-driven solutions for specific areas such as Yosemite National Park (USA) [8]. These programs rely on large databases containing information from previous SAR operations, as well as a terrain and weather analysis. However, these maps lack dynamism, i.e., they only represent the probability at the time when the information was collected. To effectively address this problem, researchers have previously explored advanced probabilistic modeling. Lin and Goodrich introduced a Bayesian approach to model the behavior of LPs. Their method handles the subject’s movement using transition matrices that incorporate terrain preferences and uses Monte Carlo simulations to estimate the posterior distributions of the parameters [9]. Building on probabilistic modeling techniques, Bugajski et al. adapted the Monte Carlo method to incorporate dynamic factors like wind and currents in maritime environments [10]. Other approaches have implemented fuzzy logic to estimate risk or occupancy levels on a grid map. Their UAV-based system incorporates automated map generation and discrete path planning [11].
The accuracy of any dynamic PM is fundamentally dependent on the model of LP behavior and is critical for the success of any search strategy, whether conducted on foot, by boat, or using UAVs. This has been an active area of research since the pioneering work of William Syrotuck in the 1970s [12]. Early efforts have used simple circular search regions based on the straight line distance from the Last Known Position (LKP) [13]. Subsequent studies have continued to refine these behavioral models [14], with recent work by Hashimoto et al. using an agent-based model to simulate LP behavior in wilderness areas [15]. This paper adapts these principles specifically to the unique geography of the Wadden Sea.
Once a PM is generated, the challenge shifts to optimal path planning for the UAV. Research in this area is abundant, mainly differing in the number of targets and whether these are static or dynamic. San Juan et al. examined heuristic approaches for static targets using potential fields and fuzzy logic [11]. In an extensive overview by Waharte and Trigoni, various greedy search heuristics are analyzed and compared with potential field-based algorithms [16]. However, these strategies are evaluated only in a single test scenario with a static target. More recent work has explored search strategies with multiple UAVs. For example, Ge et al. [17] propose a dynamic, distributed multi-UAV search and rescue method for wilderness environments. This method uses smart agent-based probability models that incorporate LP behavior and terrain characteristics to improve search efficiency for a dynamic target. Liu et al. present a method based on ’local rules’ for a cooperative UAV swarm search, improving UAV coordination and adaptability compared to traditional approaches, by achieving better coverage and reducing search time [18]. Similarly, Cheng et al. developed a cooperative search optimization for a dynamic target using a modified PM and a combination of ant colony and potential field algorithms [19]. However, while these cooperative methods show clear benefits, they do not always address the challenge of tracking a mobile target on a dynamically updated PM in a systematic, comparative study.
In summary, while substantial research exists for PM generation and UAV path planning as separate components, there is no methodological work investigating the effectiveness of different search strategies for a single (or multiple) UAV(s) on a dynamic PM with a mobile LP. Moreover, the literature on the use of UAVs for SAR missions in the unique environment of the Wadden Sea is very scarce. Little or no prior results are available on behavioral models for the Wadden Sea hikers, and hence on the creation of a PM for this type of landscape.
1.3. Contributions
The key contributions of this work can be summarized as follows:
- Creation of a lost-person model (LPM) specifically tailored for UAV-assisted SAR operations in the Wadden Sea, addressing its unique environmental and geographical features. The model is based on established behavioral principles, adapted through expert opinion, simulations, and experiments.
- The introduction of two methods, Monte Carlo Simulation (MCS) and Markov Chain (MAC), for generating the dynamic PM for a mobile PM.
- The design and adaptation of multiple approaches for optimal UAV path planning for SAR missions based on a PM. The combination of a path planning method with any of the two PM generation methods is defined as the search strategy.
- An extensive simulation study comparing different search strategies for a single (or multiple) UAV(s). The presented analysis evaluates the effectiveness and limitations of PM-based and non-PM-based search approaches in the context of SAR missions in the Wadden Sea.
Collectively, these contributions advance the automation of SAR missions, paving the way for fully autonomous operations improving search efficiency in the Wadden Sea and other challenging environments.
2. Probability Map Generation
The initial step in the search process is the determination of a search region, i.e., a bounded area in which the LP, who may by in motion, will be located with certainty, or at least with a reasonably high degree of confidence. This work focuses exclusively on maps for low tide scenarios, i.e., the tide dynamics of the Wadden Sea are neglected. However, the presented concepts can be extended to time-varying tidal flood maps, if this is essential for a particular application scenario.
The proposed algorithm generates a PM for the search region, essentially consisting of a grid where each grid cell of fixed size is assigned a value representing the probability that it contains the LP. Let denote the probability that the LP is in cell m. Then
where for a given set of terrain cells in the grid, is the total number of cells on the map. For a search field arranged as a square grid with N cells along each side, the total number of cells in the field is therefore .
In the following, two approaches to generate a PM are presented: Monte Carlo Simulation (MCS) and Markov Chain (MAC) model. Both methods rely on the behavioral model of a lost hiker in the Wadden Sea (detailed in Section 2.1) applied to a labeled terrain map of the search region. This terrain map is derived from satellite imagery and classifies each grid cell into a distinct surface type: for `sand’, for `wet sand’, for `water’ and for the `edges of the tidal channels or pathways’. These values are obtained by image analysis techniques, including grayscale processing, variance measurement, and edge detection. The exact procedure is not explained here in further detail, as this is beyond the scope of this paper. The corresponding values for each surface type are presented in Section 4.1.
2.1. Lost Person Model for hikers in the Wadden Sea
The modeling of the behavior of LPs is based on the approach of Hashimoto et al. [15], simulating human behavior in wilderness areas. Geographical features such as predefined paths—including trails, roads, railway lines, power lines, and waterways—are modeled as linear features. Similarly, the Wadden Sea is characterized by geographical features such as footpaths, tidal flats, and tidal creeks. Lost hikers are likely to exhibit a certain behavior, for example following common footpaths or walking along the banks of the creeks. In addition, tidal creeks can become impassable obstacles for hikers when the water rises, increasing the likelihood that hikers are located near those areas.
Hashimoto et al. [15] propose six possible movement patterns, each of which is assigned a specific probability. Four of them are adopted for the Wadden Sea environment. The movement pattern ’View Enhancing’ (move to adjacent cell with highest elevation) does not occur at all in the Wadden Sea, as it is completely flat; and the movement pattern ’Backtracking’ (move back to previous non-backtrack position) is covered adequately by the ’Random walk’ behavior. Hence, the Lost Person Model (LPM) incorporates the following four basic behavioral strategies for the Wadden Sea environment, each with an individual probability variable (, , , ):
- Trail walking (): The person walks along a hiking path, or an edge of the tideways, upon encountering one.
- Direction walking (): The person continues to walk in a fixed direction, regardless of encountering a trail.
- Random walk (): The person changes direction randomly within the interval from 0 to 360 degrees.
- Rest at the current position (): The person remains stationary for a random period of time followed by a random change of direction.
To account for physical exhaustion, a fatigue factor F is applied to the person’s speed at each simulation step. This factor is modeled as:
where t represents the time in motion and K denotes the fatigue rate governing the exponential decay. For cells representing water, a pure exponential reduction is applied to model the significantly higher fatigue rate. The velocity of LP at time t is defined as follows:
where . The function defines a surface scaling factors based on the terrain type at position :
The represents the fatigue contribution at simulation step i, depending on the terrain:
Note that the above models and behavioral parameters have been chosen on established principles of LP behavior adapted for the Wadden Sea. While future research and additional field data could help refine the model parameters, the primary focus of this study is the comparative performance of the PM generation and search methodologies. Minor variations in the underlying LPM parameters do not affect the conclusions drawn in this paper.
2.2. Monte Carlo Simulation
The first method to generate the PM is Monte Carlo simulation (MCS) [20]. To generate the PM, simulation instances are run, with one instance initialized in each of the M cells of the discretized grid. This setup ensures a uniformly sampled initial position of the LP, reflecting the uncertainty in their exact location. Each instance is then simulated for a period of time T according to the LPM (Section 2.1). The probability for each cell is then defined as the number of visits for that cell divided by the sum of all visits for the entire grid. The algorithm is considered to have converged when the variance difference between two consecutive simulations reaches a value below a predefined threshold , set to . This value is reached after 15 iterations.
An illustration of this process is provided in Figure 1. The left panel shows a satellite image of an exemplary section of the Wadden Sea, taken from the ArcGIS [21]. The center panel displays the corresponding terrain map, where each cell is labeled according to the surface type (, , , or ). The right panel shows the final PM generated via the MCS method.
2.3. Markov Chain
The second method to generate the PM is based on a Markov Chain (MAC), i.e., a stochastic process that models the evolution of a system over time [22]. In this context, the system state is defined as the location (in a specific cell) of the LP on the map at a particular point in time. Time is modeled in discrete steps, where each time step represents the estimated duration of a person’s transition from one cell in the PM to an adjacent one. This formulation allows for an efficient prediction of the probability distribution of the person’s location after a given time period by repeated multiplication of a transition matrix. This significantly reduces the computational complexity in comparison with running numerous random simulations as in the MCS method.
The system, i.e., the LP, transitions from one state to another according to certain probability laws. These probability laws, in our case, are based on the LPM (Section 2.1). According to the Markov property (first-order), the next state depends only on the current state, not on the previous states. A sequence forms a Markov Chain if
where indicates that the LP is in cell i at time step t. The process is defined by a transition matrix , whose elements represent the probability of moving from cell i to cell j in a single time step:
where S denotes the state space, which corresponds to the set of cells in the PM, with cardinality . The probabilities are calculated from the LPM behavioral strategies (Section 2), based on the environmental features of the current cell i and its neighbors. Hence, for a search field of dimension , the transition matrix consequently has the dimensions . Since the LP can only move to the adjacent cell due to our definition of a time interval, each row of this matrix has only the entries in the columns that correspond to the adjacent cells. All other entries are zero. The values are determined by whether the adjacent cell contains a geographical feature and the predefined values for the LPM. The sum of all entries in each row of the transition matrix is equal to one.
Let be the state vector of the PM at time t, which is the list of probabilities for all grid cells. Note that the state vector reflects uncertainty over system states, while the system state itself is a single position. Given some initial state vector , the state vector at some step can be calculated as
where is the transition matrix at time step k. As with MCS, the initial location is unknown, so the process is initialized with a uniform probability distribution.
3. UAV Path Planning
The goal of this paper is to explore how to employ optimal path planning for the SAR mission based on the PM (Section 2). This section describes the path planning algorithms evaluated in this work. First, several simple, non-PM-based search patterns are introduced which serve as experimental baselines. Second, more advanced strategies are proposed that actively use the PM to guide the search effectively. Finally, extensions of these strategies for collaborative search with multiple UAV scenarios are described.
3.1. Simple Search Patterns
To establish a performance baseline, three simple, non-probabilistic search patterns are evaluated. These patterns cover the search region systematically without reference to the PM. For all patterns, the UAV begins at a predefined starting coordinate :
- Random Direction (RD): The UAV selects a random direction at each step and travels in a straight line until it reaches a boundary of the search region. A new random direction is then chosen, and the process repeats. can be any angle relative to its current position within the search region.
- Lawn Mower (LM): This strategy involves the UAV systematically sweeping back and forth across the search region in parallel lines, resembling the movement of a lawn mower, ensuring full coverage.
- Square spiral (SQ): the UAV starts at an outer edge and moves clockwise along the boundary, spiraling inward with step sizes progressively reducing until the entire search region is covered.
Figure 2 illustrates the three search patterns. The main advantage of them is their simplicity of implementation. LM and SQ are particularly efficient in that they cover each area of the map only once, i.e., with minimal overlap. For all three search patterns, however, a significant disadvantage is that they are unable to prioritize regions with a higher probability of containing the LP. Furthermore, since the LP is in motion, a single pass over the area does not guarantee detection. Nonetheless, these patterns serve as a benchmark against which the PM-based strategies are evaluated.
3.2. PM-Based Search Patterns
In contrast to the simple systematic coverage strategies, PM-based search patterns dynamically adapt to the available information about the most likely locations of the LP. Three such advanced variants, adapted from existing algorithms, are introduced below.
3.2.1. Probabilistic Path-Weighted Greedy Search (PPWGS)
The Probabilistic Path-Weighted Greedy Search (PPWGS) algorithm is based on a greedy search approach, which belongs to the class of best-first search algorithms [23]. In a first step, all grid cells are sorted according to a priority function. For a cell m , this function is defined as the average probability over its Moore neighborhood (including m itself), divided by the squared Euclidean distance, , from the UAV’s current position:
where is the probability of cell m, is the set of neighbors and denotes the cardinality of the set , i.e., the number of neighboring cells of m.
A simple greedy selection based solely on this score might lead the UAV on a long inefficient journey that passes through low-probability regions. To mitigate this, a path-weighting step is included. It is assumed that the UAV can continuously search for the LP during flight. Therefore, the probability of detection along the path to a candidate cell is considered. The selection process is as follows:
- (i)
- The five unvisited cells with the highest priority scores, (9), are selected as candidates.
- (ii)
- For each candidate, the cumulative transition probability of detection along the straight-line path from the current location of the UAV is computed. This is done by summing the probability values, , of all cells j that intercept the path.
- (iii)
- The candidate cell corresponding to the path with the highest cumulative probability is selected as the next search cell, representing the specific grid cell the UAV targets at each step.
3.2.2. Exponential Priority Distance Greedy Search (EPDGS)
A potential limitation of the PPWGS is that it may overemphasize distance with respect to probability, leading to a skewed prioritization. This might cause the search to neglect high-probability regions that are far away. The Exponential Priority Distance Greedy Search (EPDGS) approach addresses this issue by using a modified priority function which includes an exponential decay for distance:
The scaling factor L governs the rate of decay, i.e., the rate at which the influence of distance diminishes. Here, it is defined as half the diagonal of the search region:
where W and H represent the width and height of the search region, respectively. After using this heuristic function, the subsequent search cell selection process is identical to that of PPWGS: the top five candidate cells are identified using (10), and the one with the highest cumulative path probability is chosen.
3.2.3. Probabilistic Horizon Search (PHS)
The third PM-based strategy is Probabilistic Horizon Search (PHS). This method evaluates all grid cells located at a fixed distance h from the current position of the UAV, forming a search boundary. For each candidate cell, it calculates the cumulative transition probability of detection along the straight-line path from the UAV’s current location to that cell, based on the PM. The cell with the highest cumulative probability is selected as the next search cell, and it becomes the center of the next search range. This strategy ensures a consistent search advancement while still prioritizing high-probability areas within the immediate vicinity.
Figure 3 illustrates the PHS process. The dark gray circle represents the field of view (FoV) of the UAV, defining the area that it can currently observe. Green cells indicate all potential search cells along the search boundary. The cell with the highest underlying probability, in red, is selected as the next search cell.
3.3. Multi-UAV Path Planning Strategies
The search strategies described previously can be extended to multi-UAV search to improve efficiency, scalability, and coverage. Three distinct multi-UAV strategies are evaluated.
3.3.1. Non-PM-Based Area Segmentation
A straightforward coordination method is to partition the search region into areas of equal size equal to the number of UAVs, with each UAV conducting a search of the dedicated field in accordance with the specified search pattern (e.g., LM or SQ). For instance, in the case of two UAVs, the area is divided into two parts in the x-direction, while with four drones the search region is additionally divided in the y-direction. In this approach, there is no direct collaboration or information sharing between the UAVs during the search.
3.3.2. PM-Based Search Patterns
For the search with multiple UAVs, two main options are considered in this paper:
- (i)
- PM-based area segmentation: Divide the search region, and assign each UAV a dedicated subregion. Then proceed with advanced search patterns, as described in Section 3.2.
- (ii)
- Shared-PM search: All UAVs operate simultaneously on the entire search region. The PM is updated according to the plan of each UAV, in a specific order, before being sent to the next UAV to determine a new way point.
3.3.3. Border-Center Greedy Search
For comparison purposes, an additional search pattern is defined for searching with two UAVs, each with a distinct role: One UAV continuously circles the perimeter of the search region, while the other UAV conducts a greedy search based on the PM in the interior of the search region, according to one of the methods described in Section 3.2. This cooperative search pattern is termed Border-Center Greedy Search (BCGS).
4. Simulation Setup and Evaluation Metrics
This section details the specific parameters used to configure the simulation environment, the models, and the search algorithms. It also defines the metrics used to evaluate their performance.
4.1. Simulation Parameters
The simulation experiments were configured using the following set of parameters for the terrain, the lost person model, the PM generation, and the UAV search.
4.1.1. Terrain Parameters
For the PM, as described in Section 2, six distinct regions have been selected from the ArgGIS World Imagery satellite images, all located in the vicinity of the Wadden Sea near St. Peter-Ording in Northern Germany [21]. These consist of two different regions for each of three section sizes: (, and ), hereafter referred to as the , , and maps, respectively. Each of these search regions is divided into a terrain map consisting of 25 x 25 m grid cells. Each cell in the resulting labeled image is assigned a terrain type. The corresponding velocity scaling factors are selected as for `sand’, for `wet sand’, for `water’, and for `pathway/edge’.
4.1.2. LPM Parameters and Trajectory Generation
The LPM, as described in Section 2.1, is parameterized with the following behavioral probabilities: trail walking , directional walking , random walk , and rest at current position . The fatigue rate is set to . To guarantee a fair comparison between algorithms, two independent sets of 500 pre-generated LP trajectories are stored for each of the six maps. A LP’s walking speed is randomly assigned for each simulation run from a uniform distribution between to . The starting position for each trajectory is sampled probabilistically from the terrain map, with a higher likelihood of starting in cells corresponding to sand or hiking paths.
4.1.3. PM Generation Parameters
For each of the six terrain maps, PMs are generated using both the MCS and MAC methods. The time period T used for the MCS method is set to to match the UAV’s estimated maximum flight time. In generating PM using MAC, the total number of simulated time steps corresponds to the number of cells along one edge of the grid N. Figure 4 presents an example of the original region, once for the map and once for the map. The figure also displays the corresponding probability distributions for these areas, generated by each method, MCS and MAC. A high degree of similarity can be observed between the two PMs.
4.1.4. UAV and Search Parameters
The search UAV is simulated with a constant speed of , and modeled as having a circular Field of View (FoV) with a diameter of . A detection is considered successful if the LP enters this FoV. The maximum allowed search time for a single simulation is limited to . To ensure hardware-independent results, the simulation time is scaled based on defined UAV speed. This guarantees that all evaluated search durations correspond to real time, regardless of simulations performance. In the context of EPDGS search, , corresponding to the respective map size. For the PHS algorithm, the boundary distance is set to . In all movement patterns, the UAVs start in the lower left corner of the search area.
4.2. Dynamic PM Updates
To simulate a dynamic search environment where the LP’s location estimate evolves, the PM is updated cyclically throughout the search. This process involves two components: an update according to the UAV’s searched areas and a propagation of the LP’s movement according to the LPM. First, after each UAV’s motion, the probabilities of the cells searched by the UAV are set to zero. To maintain a valid probability distribution, i.e., property (1), the probability mass of the searched cells is redistributed proportionally across all remaining unsearched cells. Second, the LP’s movement is propagated at regular intervals, corresponding to the person’s average cell-to-cell transition time when assuming an average walking speed. For all search simulations, regardless of whether the PM is generated by MCS or MAC, this propagation is handled by multiplying the current probability vector by the pre-computed MAC transition matrix, with elements (7). The reason lies in the computational efficiency of this approach, compared to re-running a full MCS for each update step.
4.3. Performance Metrics
The performance of each search strategy is evaluated based on two primary metrics: success rate and search time. The success rate is defined as the percentage of simulation runs in which the LP was successfully located within the maximum allowed search time . There are two ways of considering the search time: the first variant computes the average time for successful (’positive’) searches only, while the second variant includes all cases and assigns a maximum search time to unsuccessful searches. Thus, the second variant not only provides an explicit average search time, but also implicitly reflects the number of LPs not found. The evaluation function for this case is expressed in the following form:
where R is the total number of simulation runs, L is the number of successfully located LPs.
5. Results
This section presents the simulation results. First, the two PM generation methods are compared. Second, the performance of the single-UAV search strategies is evaluated. Third, the results for the multi-UAV scenarios are presented.
5.1. Comparison of PM Generation Methods
Figure 4 provides a visual, qualitative comparison of the PM outputs for two exemplary search regions. The cosine similarity measure [24] is calculated to quantify this observed similarity. This metric quantifies the angular similarity between the two probability distributions in the corresponding PMs by treating them as high-dimensional vectors, where a score of 1 represents perfect agreement. Conversely, a value close to 0 indicates a considerable divergence of the spatial probability distributions. Table 1 provides a comparison for all six search regions. These show a cosine similarity consistently above 0.91 for all scenarios. This high degree of similarity shows that the MAC-generated maps are structurally almost identical to the MCS-generated maps and validates the use of the MAC method as a reliable and efficient alternative for generating PMs.
5.2. Single-UAV LP Search
Figure 5 presents a comparison of the results of the evaluation function (11) for simple motion patterns—RD, LM, and SQ—against the PM-based motion strategies PPWGS, EPDGS, and PHS. The evaluation is carried out on PMs generated using MCS and MAC methods, applied to six distinct image sections. Table 2 reports the average time taken to successfully locate a LP across the three search regions, as well as the percentage of LPs found for each of the two trajectory sets. The cumulative number of LPs found over the simulation time is shown in Figure 6, illustrating the rate at which each strategy locates LPs.
5.3. Multi-UAV LP Search
The search performance was also evaluated for a two-UAV search for the and fields, as deploying additional UAVs in such relatively small region would be inefficient and unnecessary. Each search region is divided in the middle along the x-axis. Each UAV starts in a subarea located in the bottom left corner, as in the case of a single UAV. For these simulations, the search is restricted to PMs generated using only the MAC method. The results are presented in Figure 7 and Table 3. The cumulative detection curves for the two-UAV scenario are presented in Figure 8.
6. Discussion
6.1. PM Generation
The PM generation methods produce visually coherent and plausible results, with cosine similarity values consistently above 90% (Table 1) in all areas for both MCS and MAC, meaning that the MAC-generated PMs are nearly identical to those generated with the resource-intensive MCS. This is an important outcome, since it validates the use of the MAC method as a fast and reliable tool for generating the dynamic PMs in a time-critical SAR context. A MAC-based PM can be generated or updated in seconds once the transition matrix is computed, making it practical for UAV-SAR operations. On the other hand, MCS may take several hours to compute equivalent maps.
6.2. UAV Search Performance
6.2.1. Simple vs PM-Based Strategies
A certain degree of variance is observed between the two independent trajectory sets, Set 1 and Set 2, with respect to the values of the evaluation function (11). This can be attributed to the methodology used to generate the LP trajectories, i.e., the differences in how comprehensively start cells are sampled across fields of different sizes. Although the selection of LP start cells aims to ensure comprehensive spatial coverage, it is also influenced by geographical features, which are incorporated through probabilistic weighting, e.g., a higher likelihood of starting on sand. This environmentally informed sampling introduces slight unavoidable variance in the spatial clustering of LP start cells between trajectory sets, which in turn affects the search dynamics and efficiency metrics for any given algorithm. Although the absolute overall performance values fluctuate slightly, the relative performance ranking among the algorithms remains largely stable between the two trajectory sets. This consistency demonstrates that the comparative effectiveness of the algorithms is robust.
Table 2 shows that the LM search pattern outperforms all simple search patterns in all search regions. In terms of successful searches, the LM search is 4 to 10 percent more effective than a random search in and search regions and 9 to 12.5 percent more effective in a meter regions. The LM pattern notably outperforms the SQ pattern in all evaluated areas, even though both patterns cover the map once with minimal overlap. This is probably due to the timely scanning of adjacent areas, which appears to improve overall performance. Consistent with expectation, RD delivered the weakest performance. LM search proved to be highly effective within a search region size. PM-based strategy achieves a search that is almost 10% faster, it detects 1-2% fewer LPs. Figure 6 shows that, from around five minutes of search time onward, LM consistently outperforms all other search methods in terms of the cumulative number of LPs found over time in a search region (first column).
However, as the size of the search region increases, the advantage of PM-based becomes evident. In the and regions, PPWGS, EPDGS and PHS outperform LM in terms of average search time. This demonstrates the added value of using probabilistic information to prioritize the search in large, complex environments where full coverage is time-critical. The cumulative curves in Figure 6 illustrate this, showing that PM-based methods find LPs much more faster in the initial phase of the search.
Among the PM-based methods, PPWGS and PHS perform better than EDPGS. This suggests that prioritizing probability over distance is not necessarily more efficient, i.e., prioritizing nearby high-probability cells (as PPWGS and PHS) is a more effective strategy than traveling further to more distant, high-probability regions. This observation could also explain the strong performance of the PHS algorithm on the search region, as it aligns more effectively with region size.
6.2.2. Multi-UAV Strategies
The results from the two-UAV simulations in Table 3 show that employing a second UAV dramatically reduces the average search time, as expected. More importantly, the results indicate that the area segmentation strategy is more efficient than the cooperative strategies in terms of average search time. As seen in the cumulative plots in Figure 8, the segmented search approach yields faster results. A possible explanation for this is that UAVs in a cooperative search guided by the same global PM, may tend to focus on the same general area, such as shared edge of the search region, particularly if their assigned search cells are located nearby. This can result in inefficient use of resources, i.e., redundant efforts and inefficient travel paths. In contrast, the area segmentation strategy guarantees that the UAVs systematically cover distinct, non-overlapping regions. Regardless of the coordination method, the use of two UAVs with a PM-based search consistently outperforms the conventional pattern search.
7. Conclusions
This paper presents a comprehensive framework for automated UAV search in the challenging Wadden Sea environment. The focus is on the generation of dynamic PMs and the evaluation of intelligent search strategies. The key findings demonstrate the viability of an automated, probability-driven approach to SAR operations.
The results have demonstrated that PMs generated using the computationally efficient MAC method are nearly identical in quality to those from MCS, thus validating MAC as the superior method for time-critical applications, in particular autonomous UAV-based SAR operations. Moreover, the PM creation process can easily be transferred to other environments.
The simulation results confirm that simple coverage patterns are effective in small areas. PM-based search strategies outperform simple pattern-based methods in larger operational areas. Furthermore, for collaborative multi-UAV searches, a decentralized area segmentation strategy has been found to be more efficient than approaches where the UAVs collectively search the full area.
This work has certain methodological limitations that should be addressed in future work. First, the current approach does not account for detection errors, such as false positives or missed detections, which can impact real-world performance in UAV-based SAR operations. Incorporating a realistic sensor error model would enhance the robustness of the results. Second, while the division of the search region among multiple UAVs proved effective, it was implemented using a fixed sample strategy. A more intelligent allocation, such as dynamically partitioning the area based on probability weights derived from the PM, could further improve the search efficiency, e.g., by assigning higher-probability regions to UAVs more strategically.
Acknowledgments
This work was conducted as part of the Water Rescue Drones research project [grant number 03WIR3906B][25], which is funded by the German Federal Ministry of Research, Technology and Space (BMFTR) under the UAM-InnoRegion-SH program. We thank our Water Rescue Drones project partners, FH Westküste and NXP Semiconductors Germany GmbH, for their valuable collaboration.
Conflicts of Interest
The authors declare that there are no conflicts of interest regarding the publication of this article.
References
- World Wide Fund for Nature. WWF.. WWF: Wadden Sea - National Park and World Heritage Site on the North Sea coast. Available online: https://www.wwf.de/themen-projekte/projektregionen/wattenmeer.
- Cuxhaven-Duhnen. FF Cuxhaven-Duhnen: Mudflat and water rescue. Available online: https://www.ff-duhnen-stickenbuettel.de/watt-und-wasserrettung/teil-1-ffd/teil-2.
- Cuxhaven-Duhnen. FF Cuxhaven-Duhnen: Operations of the volunteer fire brigade Cuxhaven-Duhnen. Available online: https://www.ff-duhnen-stickenbuettel.de/einsätze/.
- Yeong, S.; King, L.; Dol, S. A review on marine search and rescue operations using unmanned aerial vehicles. International Journal of Marine and Environmental Sciences 2015, 9, 396–399. [Google Scholar]
- FF Cuxhaven-Duhnen. FF Cuxhaven-Duhnen: Search for people in the mudflats. Available online: https://www.ff-duhnen-stickenbuettel.de/einsätze/einsatzordner-2023/230728-2344/.
- Tipton, M.; McCormack, E.; Elliott, G.; Cisternelli, M.; Allen, A.; Turner, A.C. Survival time and search time in water: Past, present and future. Journal of Thermal Biology 2022, 110, 103349. [Google Scholar] [CrossRef] [PubMed]
- Sava, E.; Twardy, C.; Koester, R.; Sonwalkar, M. Evaluating lost person behavior models. Transactions in GIS 2016, 20, 38–53. [Google Scholar] [CrossRef]
- Esri ArcGIS. Esri ArcGIS: Prepare for search and rescue incidents. Available online: https://www.arcgis.com/home/item.html?id=b03bf318c74042078aa28c6676dca98a#overview.
- Lin, L.; Goodrich, M.A. A Bayesian approach to modeling lost person behaviors based on terrain features in wilderness search and rescue. Computational and Mathematical Organization Theory 2010, 16, 300–323. [Google Scholar] [CrossRef]
- Bugajski, G. Using the Monte Carlo method to create probability maps for search and rescue operations at sea. Zeszyty Naukowe Akademii Morskiej w Szczecinie 2016, pp. 71–74.
- San Juan, V.; Santos, M.; Andújar, J.M. Intelligent UAV map generation and discrete path planning for search and rescue operations. Complexity 2018, 2018, 6879419. [Google Scholar] [CrossRef]
- Syrotuck, W.G. Analysis of Lost Person Behavior: An Aid to Search Planning; Barkleigh Productions, 1977.
- Frost, J.R. ; Soza & Company, L. The Theory of Search: A Simplified Explanation, Ed.; Office of Search and Rescue, U.S. Coast Guard: Washington, DC, USA, 1996. [Google Scholar]
- Hill, K. The psychology of lost. Lost person behavior 1998, 116. [Google Scholar]
- Hashimoto, A.; Heintzman, L.; Koester, R.; Abaid, N. An agent-based model reveals lost person behavior based on data from wilderness search and rescue. Scientific reports 2022, 12, 5873. [Google Scholar] [CrossRef] [PubMed]
- Waharte, S.; Trigoni, N. Supporting search and rescue operations with UAVs. In Proceedings of the 2010 international conference on emerging security technologies. IEEE; 2010; pp. 142–147. [Google Scholar]
- Ge, Z.; Jiang, J.; Coombes, M. Multi-UAV Search and Rescue in Wilderness Using Smart Agent-Based Probability Models. https://arxiv.org/abs/2411.10148, 2024.
- Liu, S.; Yao, W.; Zhu, X.; Zuo, Y.; Zhou, B. Emergent Search of UAV Swarm Guided by the Target Probability Map. Applied Sciences 2022, 12, 5086. [Google Scholar] [CrossRef]
- Cheng, K.; Wu, D.; Hu, T.; Wei, J.; Tian, Z. Cooperative search optimization of an unknown dynamic target based on the modified TPM. International Journal of Aerospace Engineering 2022, 2022, 8561245. [Google Scholar] [CrossRef]
- Mooney, C.Z. Monte Carlo Simulation; Sage Publications: Thousand Oaks, California, 1997. [Google Scholar]
- Esri et al.. Esri ArcGIS World Imagery. Satellite imagery of Wadden Sea National Park. Available online: https://services.arcgisonline.com/ArcGIS/rest/services/World_Imagery/MapServer/export.
- Serfozo, R. Basics of applied stochastic processes; Springer Science & Business Media, 2009.
- Russell, S.J.; Norvig, P. Artificial intelligence: a modern approach; Pearson, 2016.
- Oniani, D. Cosine Similarity and Its Applications in the Domains of Artificial Intelligence 2020. Available online.
- WaterRescueDrones. Available online: https://www.uam-innoregion-sh.de/waterrescuedrones.
Figure 1.
Left: Satellite image [21] of the exemplary search region, . Center: labeled terrain map based on the surface types, Right: PM generated by Monte Carlo simulation. The probability values for the cells are scaled for readability.
Figure 1.
Left: Satellite image [21] of the exemplary search region, . Center: labeled terrain map based on the surface types, Right: PM generated by Monte Carlo simulation. The probability values for the cells are scaled for readability.
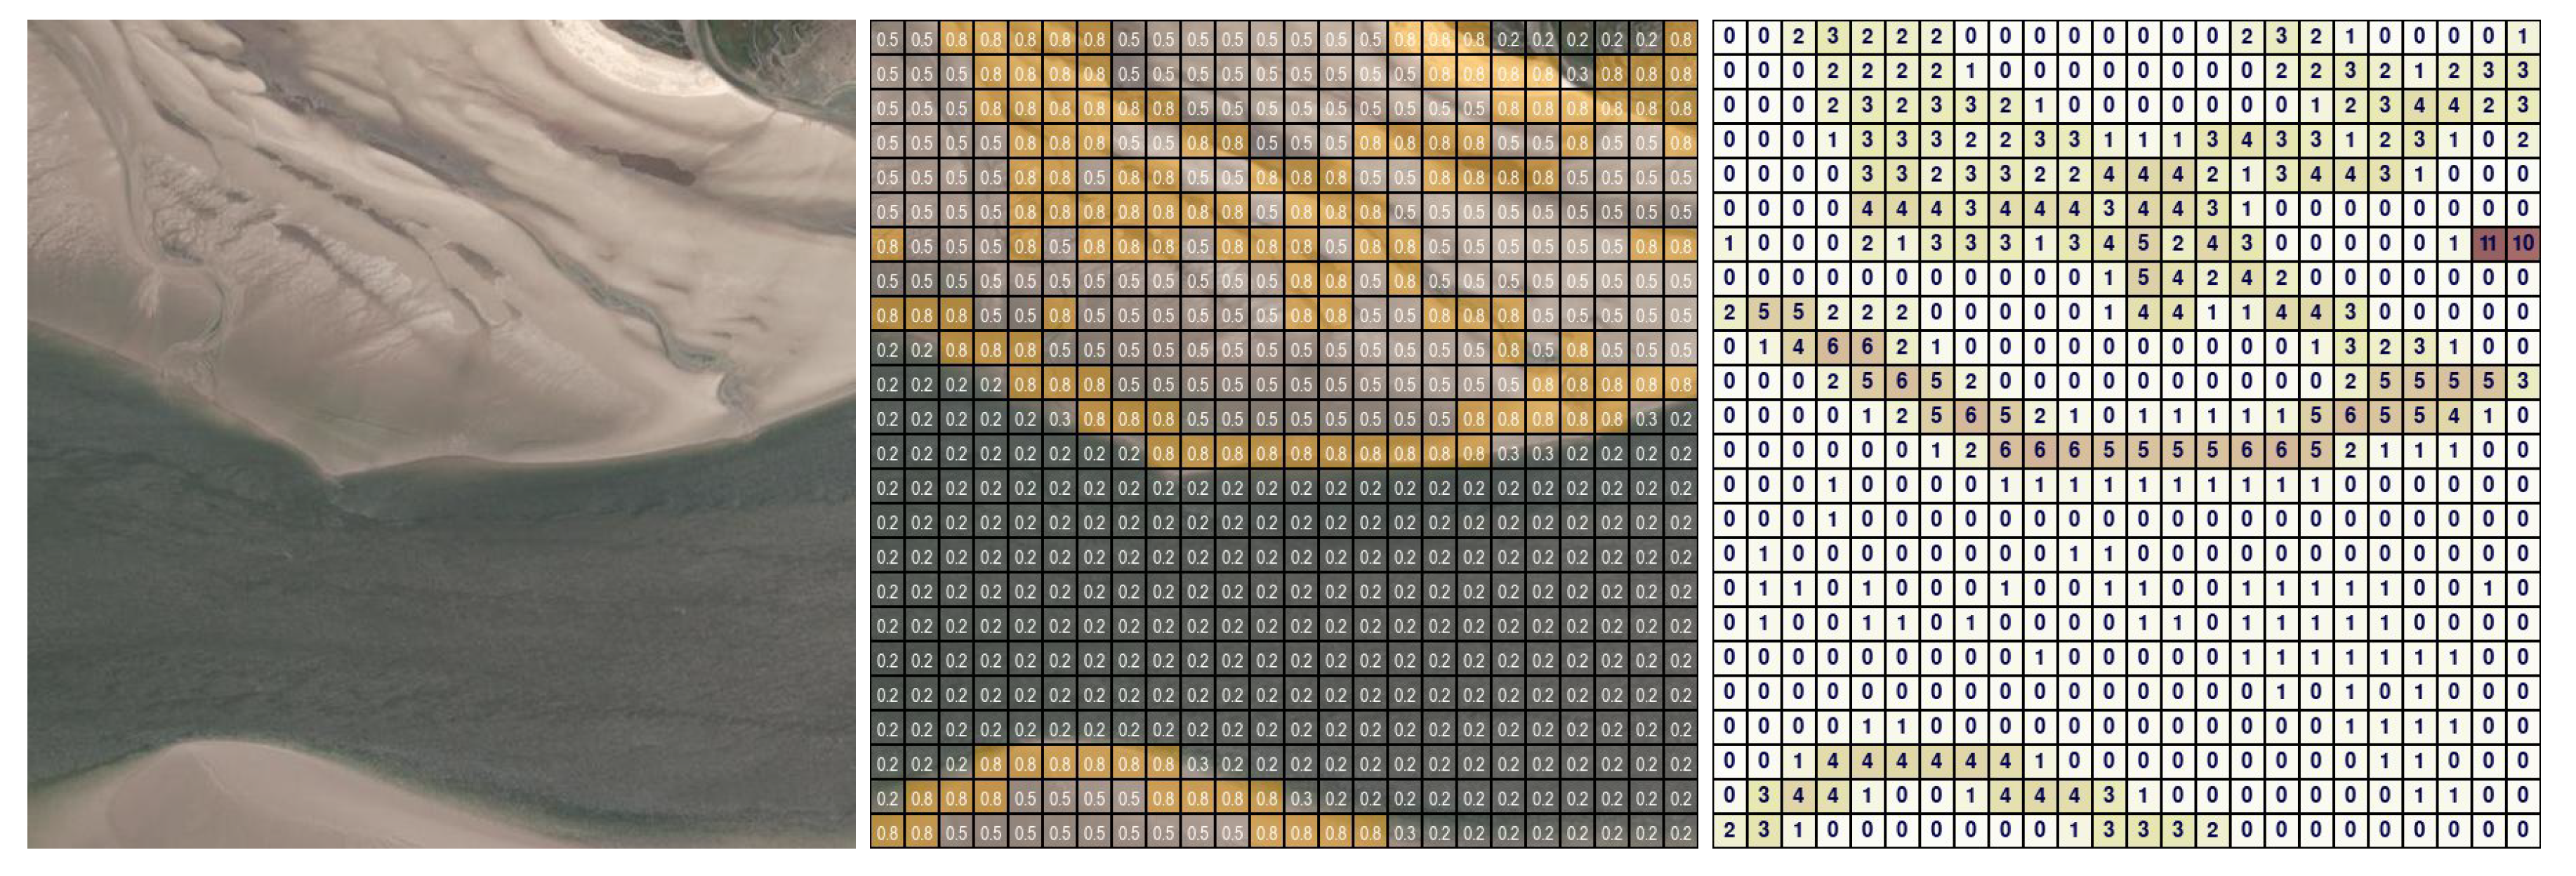
Figure 2.
Left to Right: Random Direction, Lawn Mower and Square Spiral movement patterns.
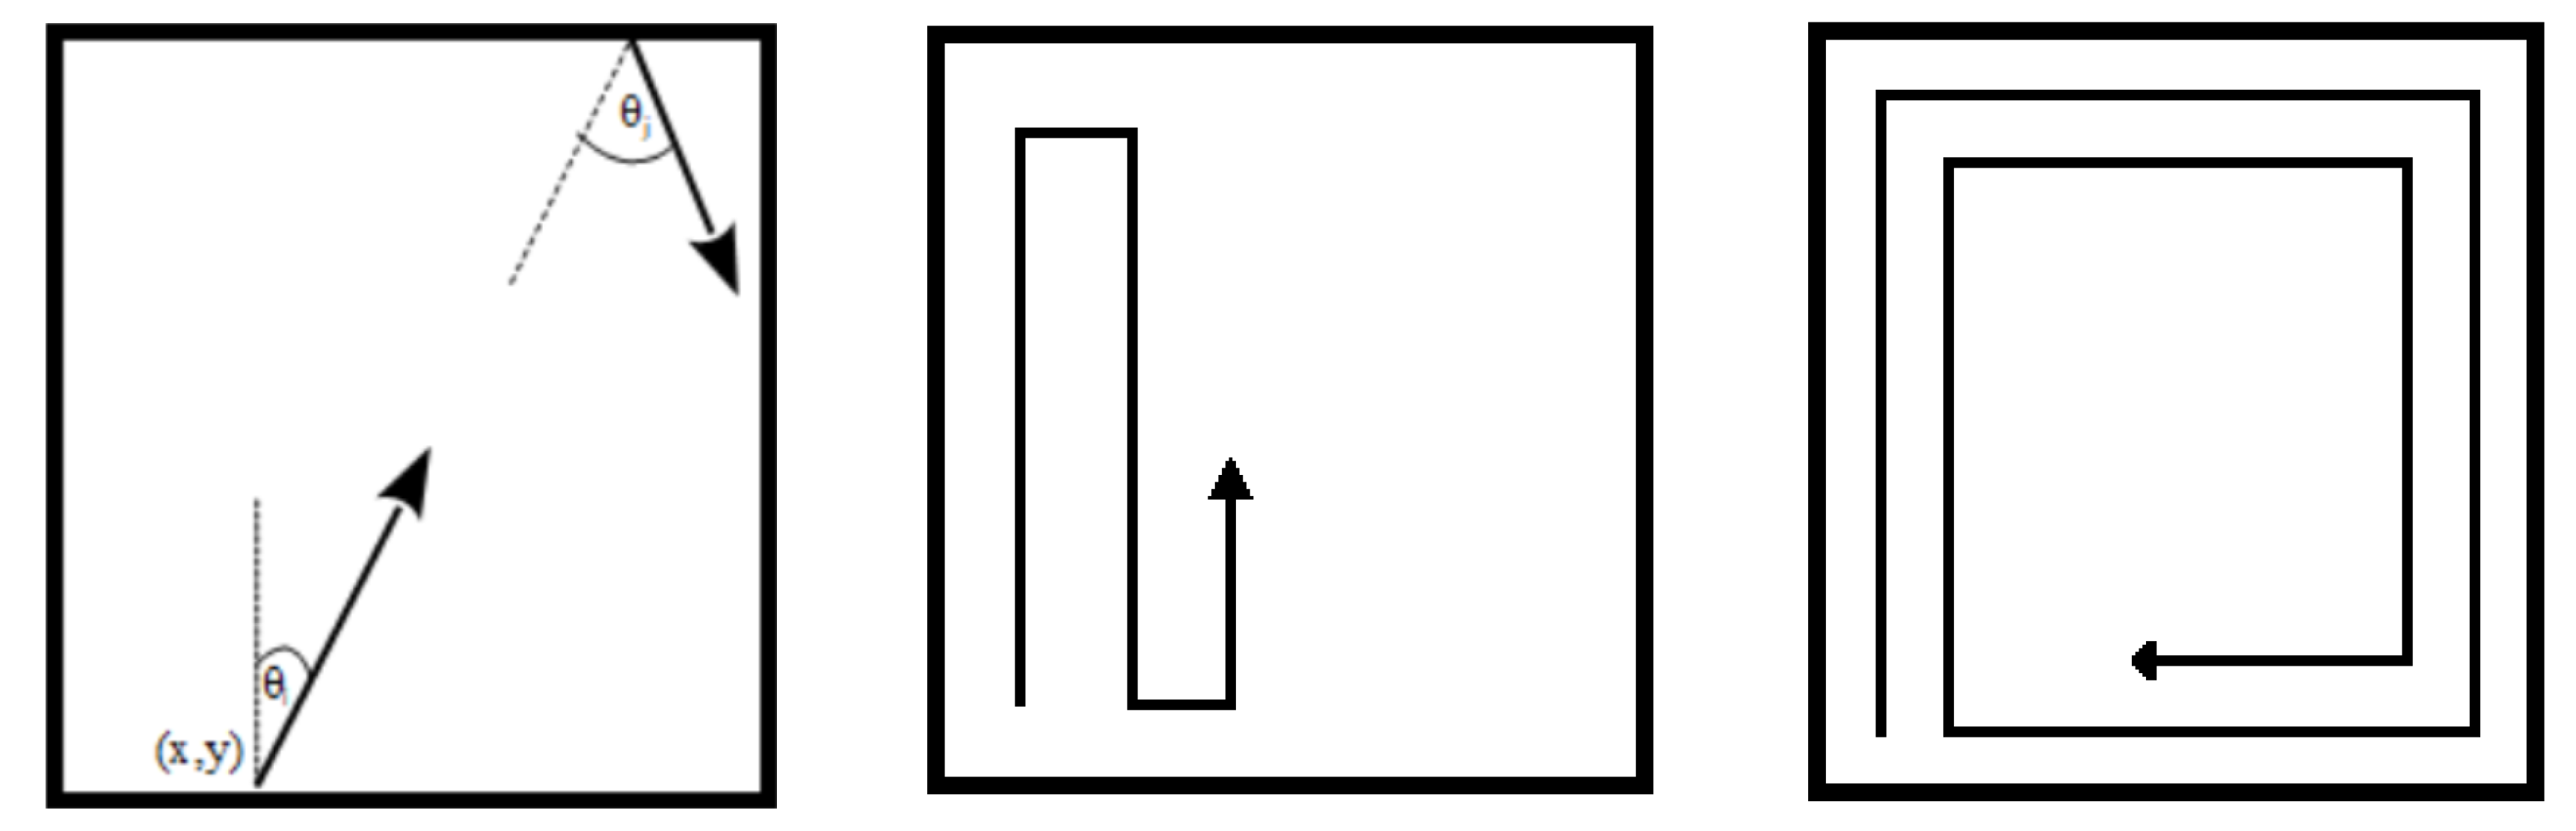
Figure 3.
The Probabilistic Horizon Search (PHS) concept. The UAV considers all cells (green) on a fixed radius search boundary (black) and selects the one with the highest probability (red) as the next search cell.
Figure 3.
The Probabilistic Horizon Search (PHS) concept. The UAV considers all cells (green) on a fixed radius search boundary (black) and selects the one with the highest probability (red) as the next search cell.
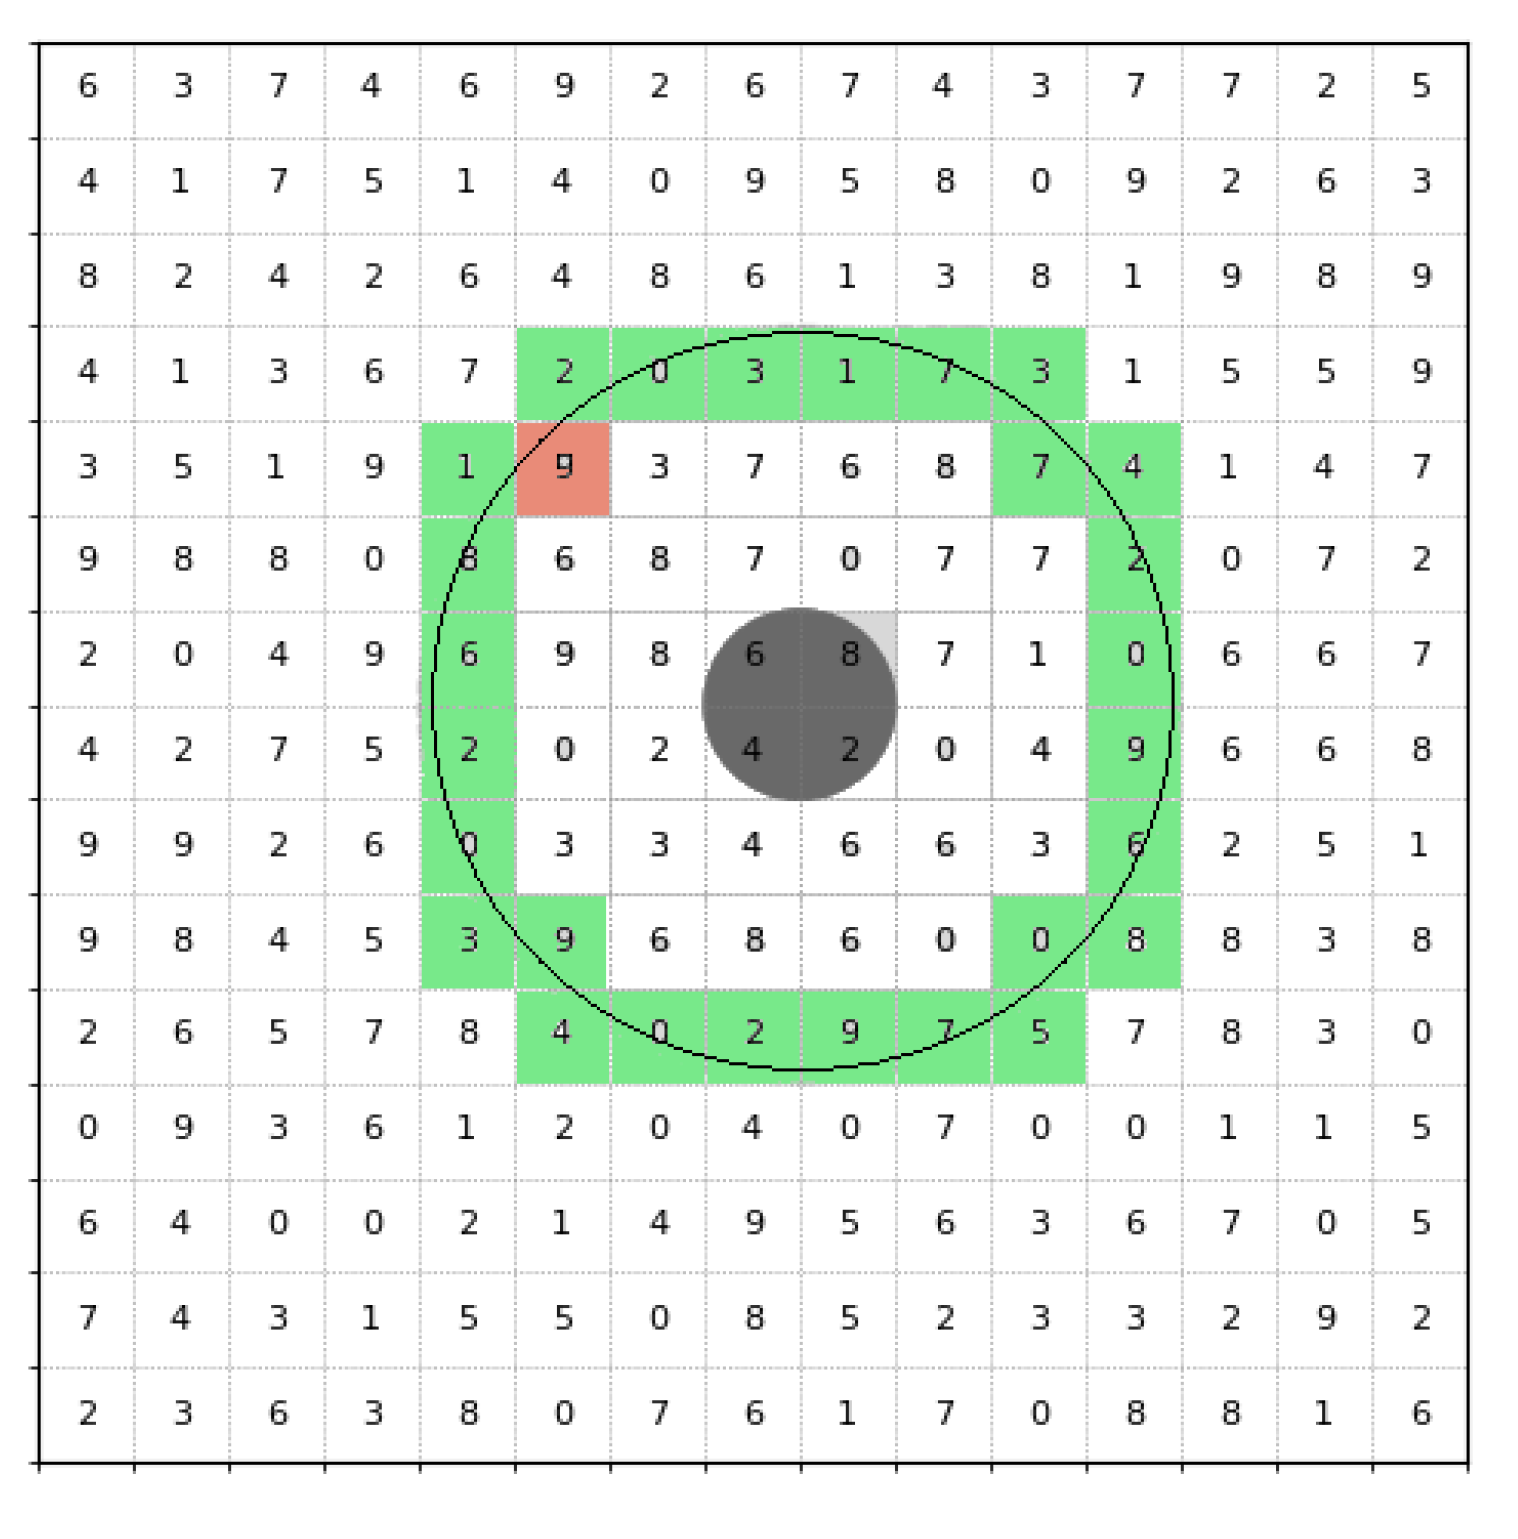
Figure 4.
Top row (from left to right ): Original image section, PM based on MCS, PM based on MAC. Bottom row (from left to right ): Original image section, PM based on MCS, PM based on MAC.
Figure 4.
Top row (from left to right ): Original image section, PM based on MCS, PM based on MAC. Bottom row (from left to right ): Original image section, PM based on MCS, PM based on MAC.
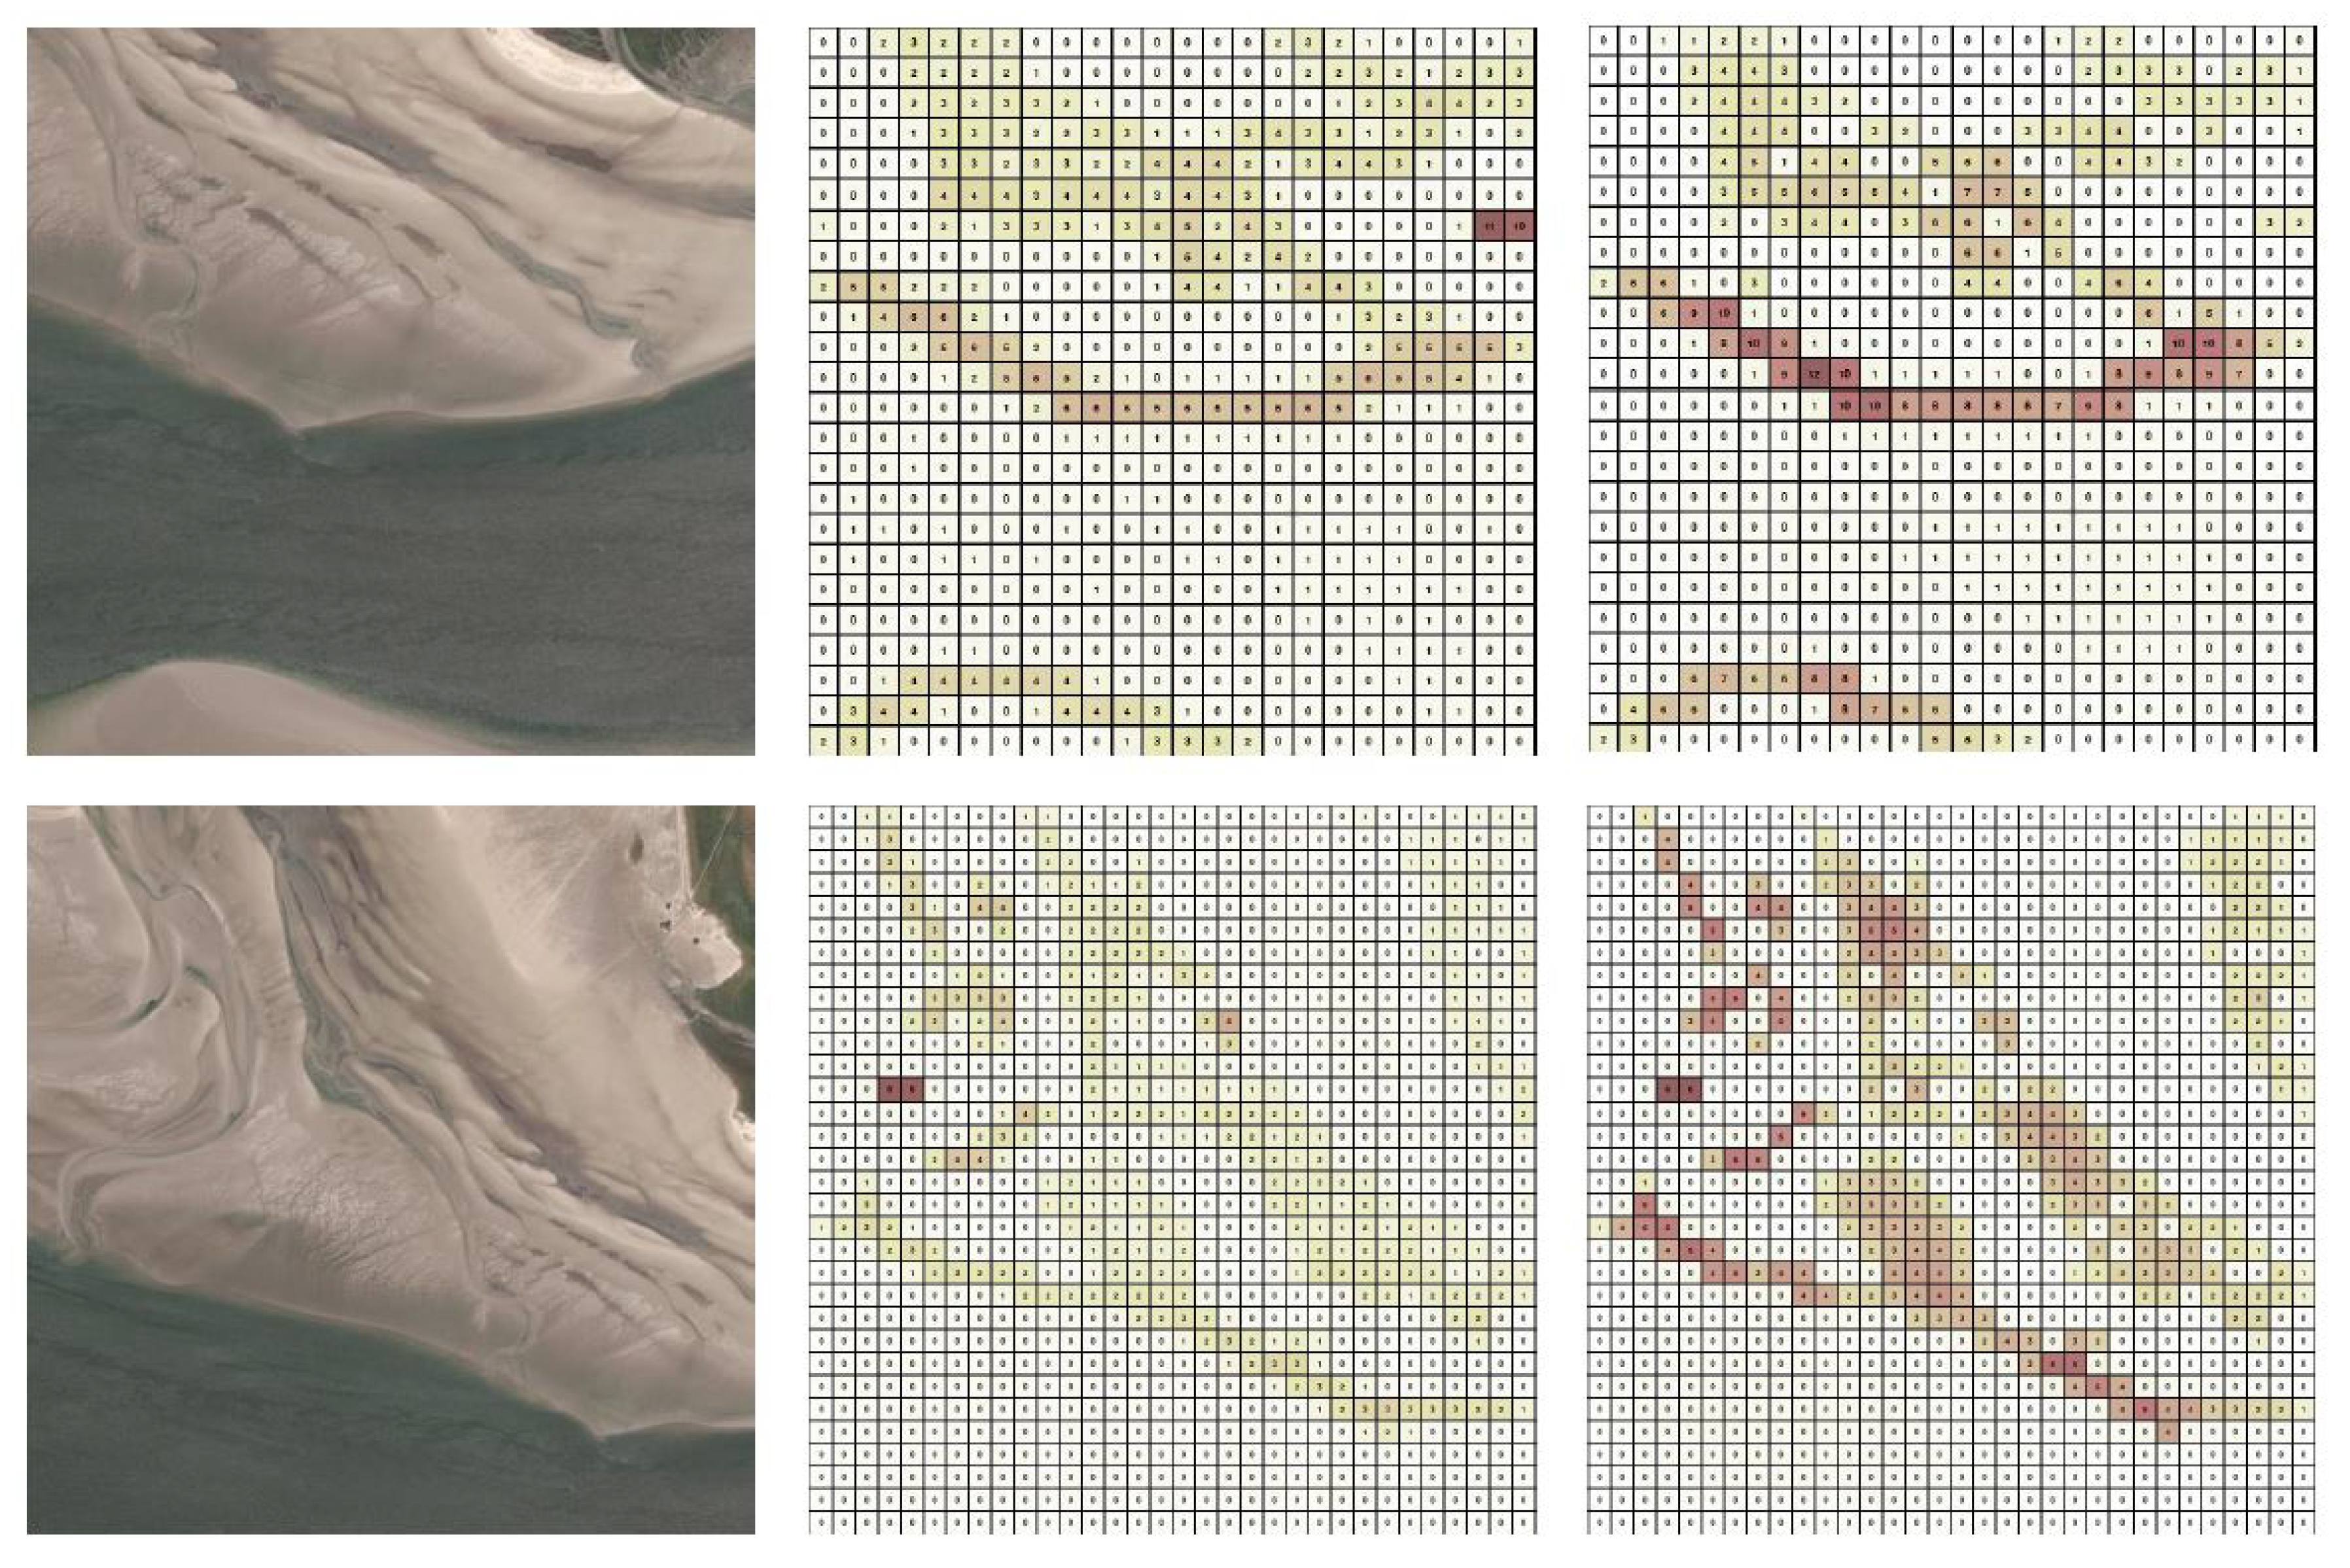
Figure 5.
Evaluation function MV mult for multiple search strategies on three search region size (, , and ) and two terrain maps.
Figure 5.
Evaluation function MV mult for multiple search strategies on three search region size (, , and ) and two terrain maps.
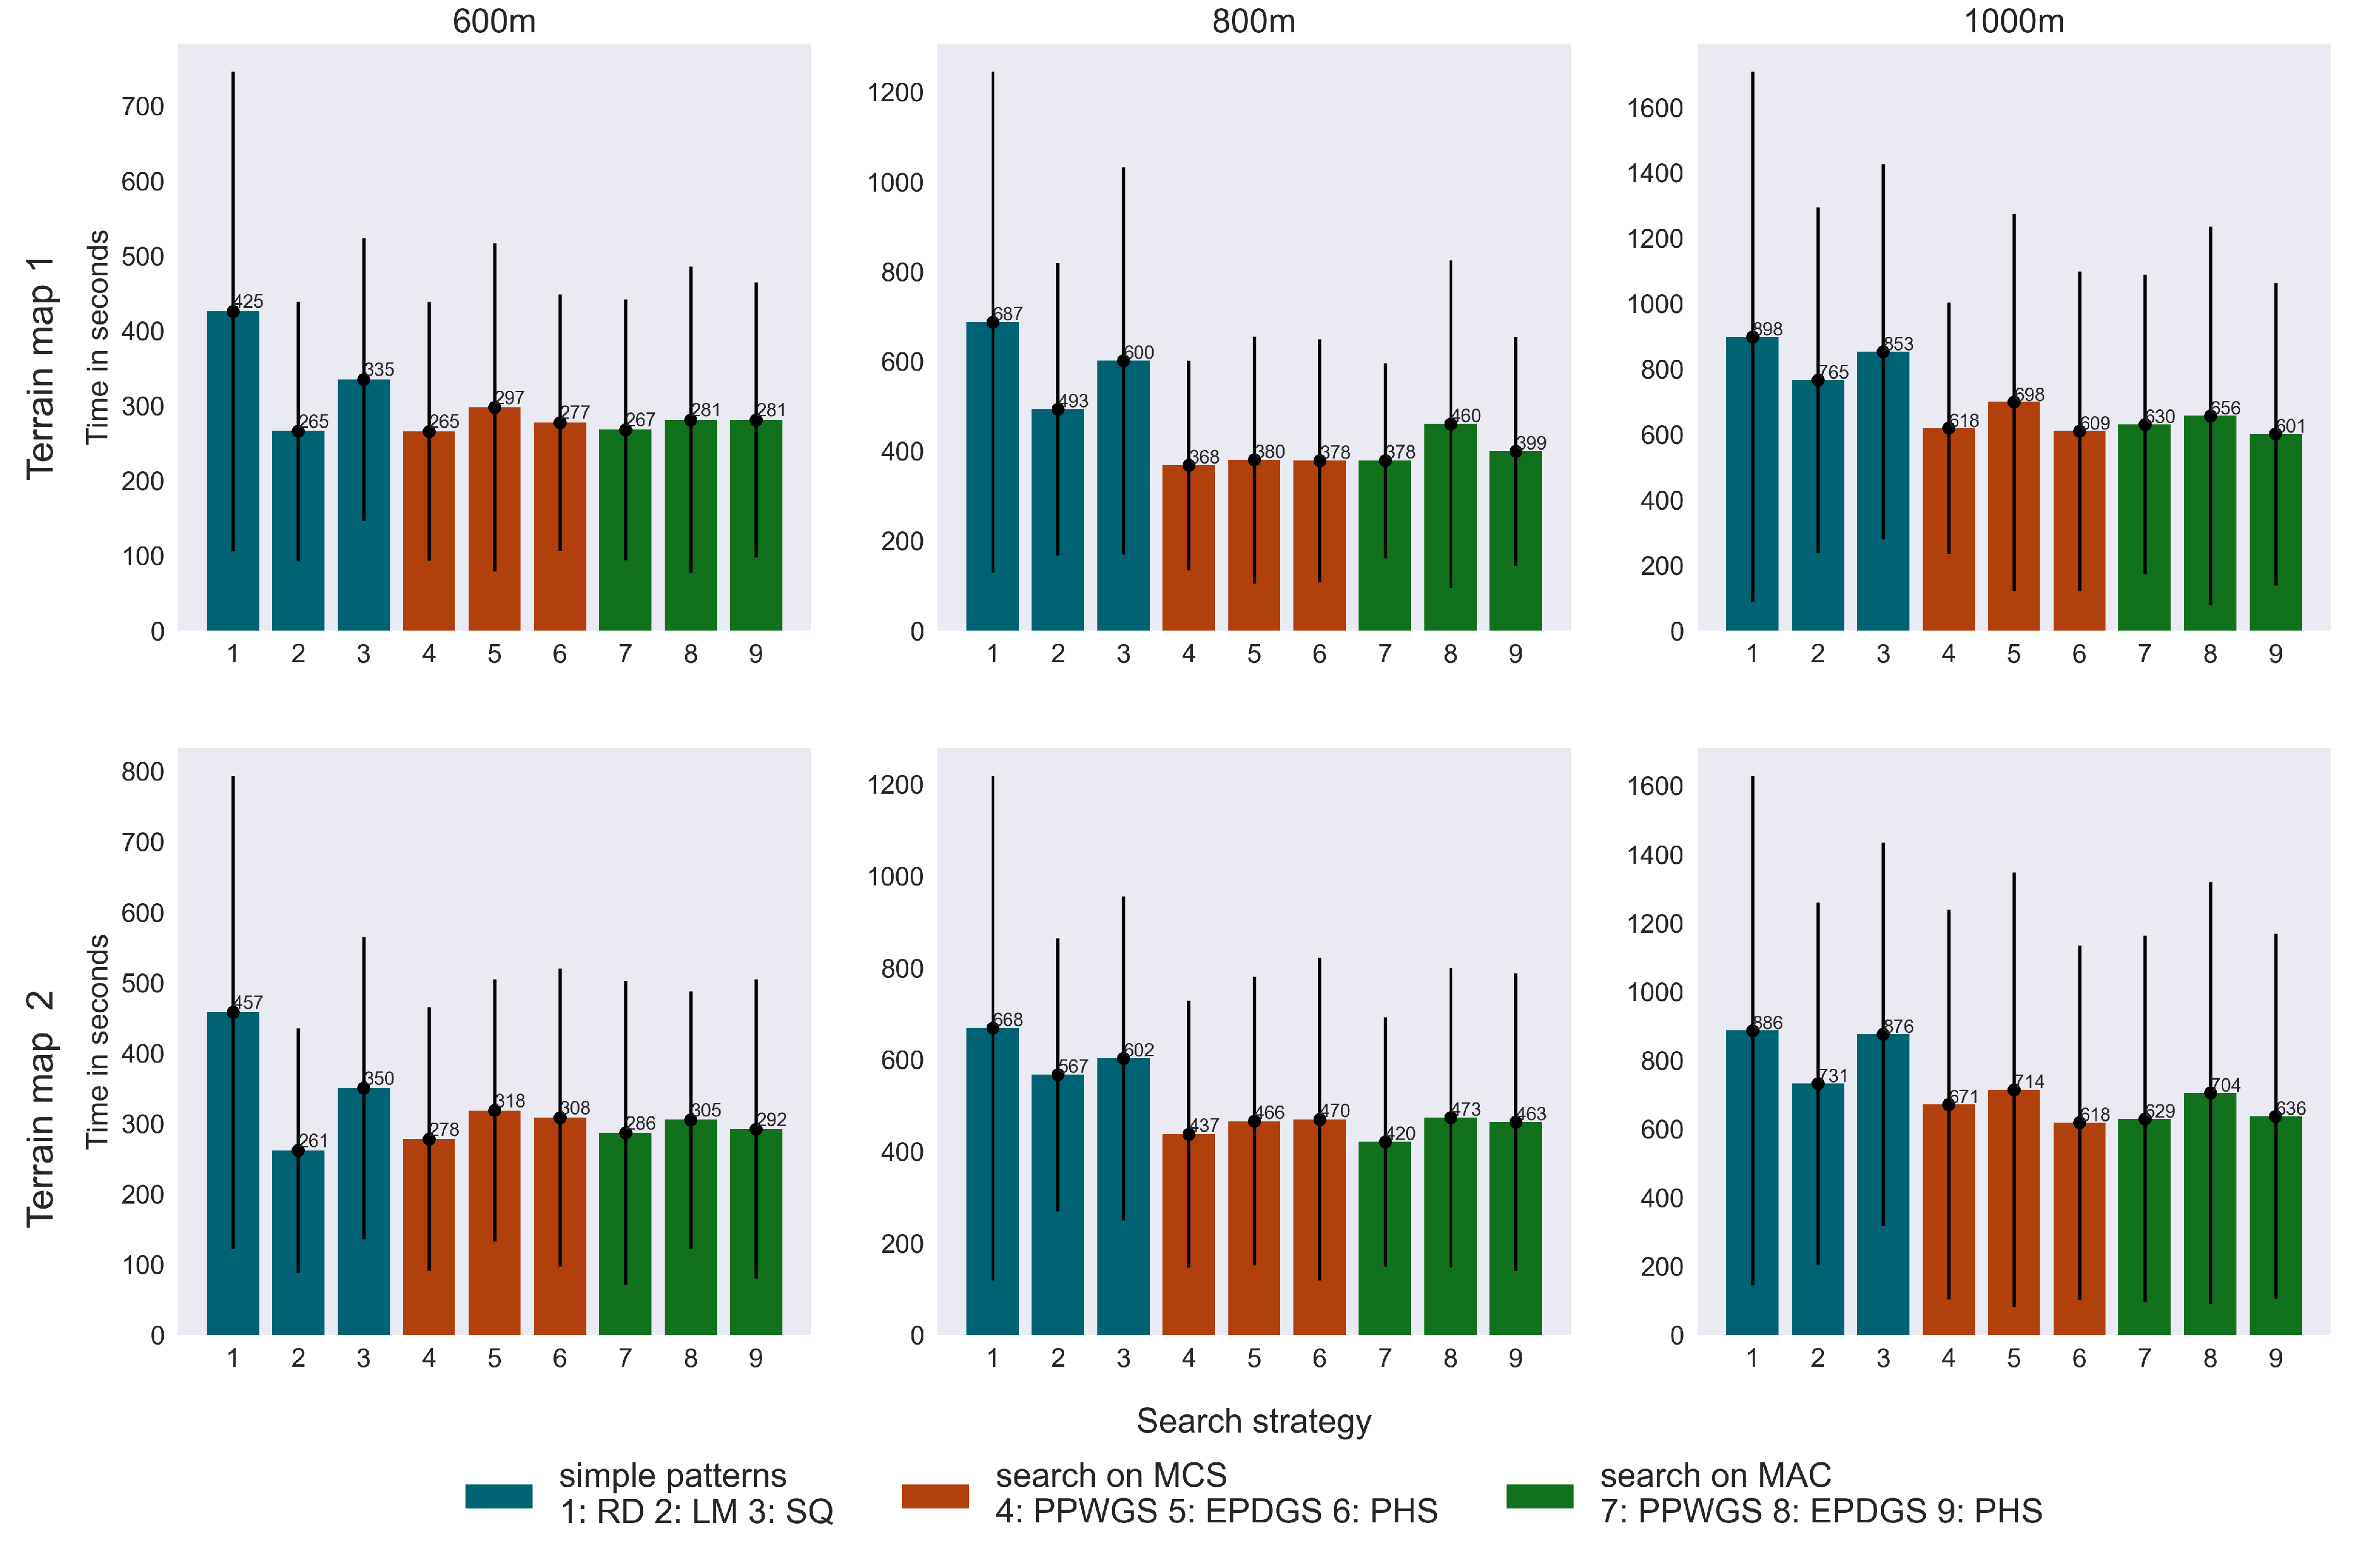
Figure 6.
Cumulative number of LPs found over time for each of the three search regions and two terrain maps.
Figure 6.
Cumulative number of LPs found over time for each of the three search regions and two terrain maps.
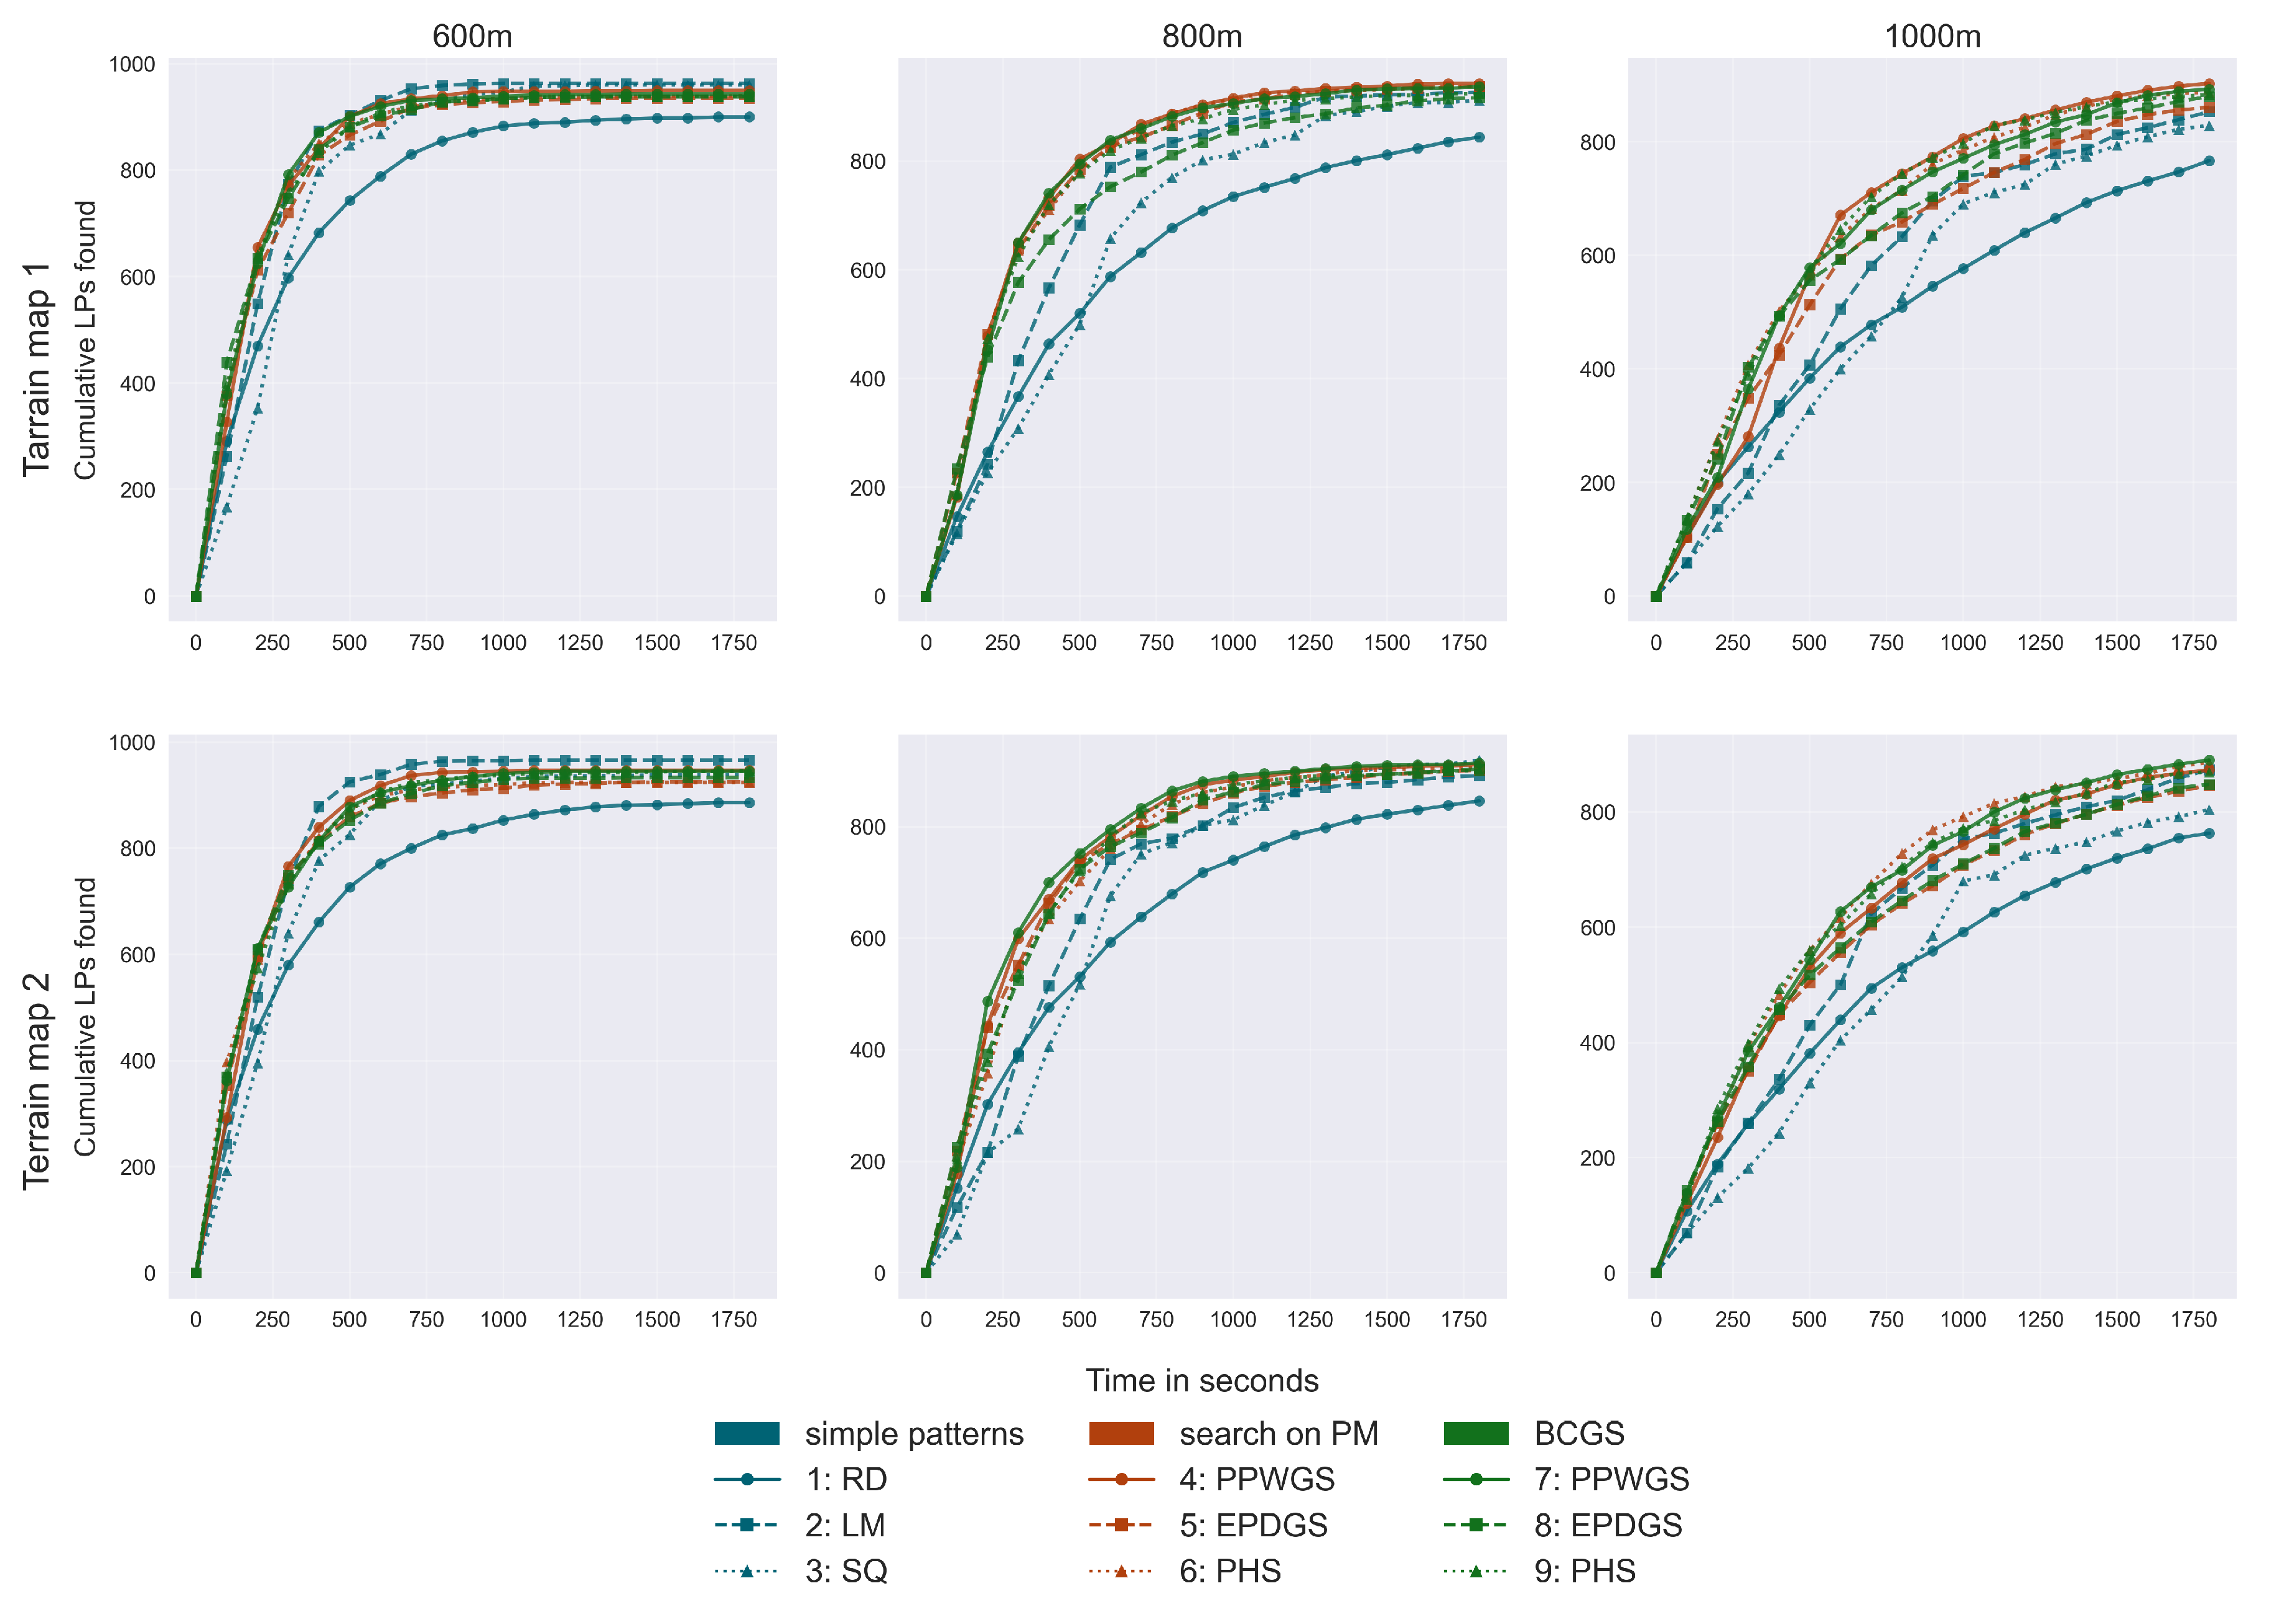
Figure 7.
Evaluation function MV mult for multiple search strategies for two UAVs on search regions and and two terrain maps.
Figure 7.
Evaluation function MV mult for multiple search strategies for two UAVs on search regions and and two terrain maps.
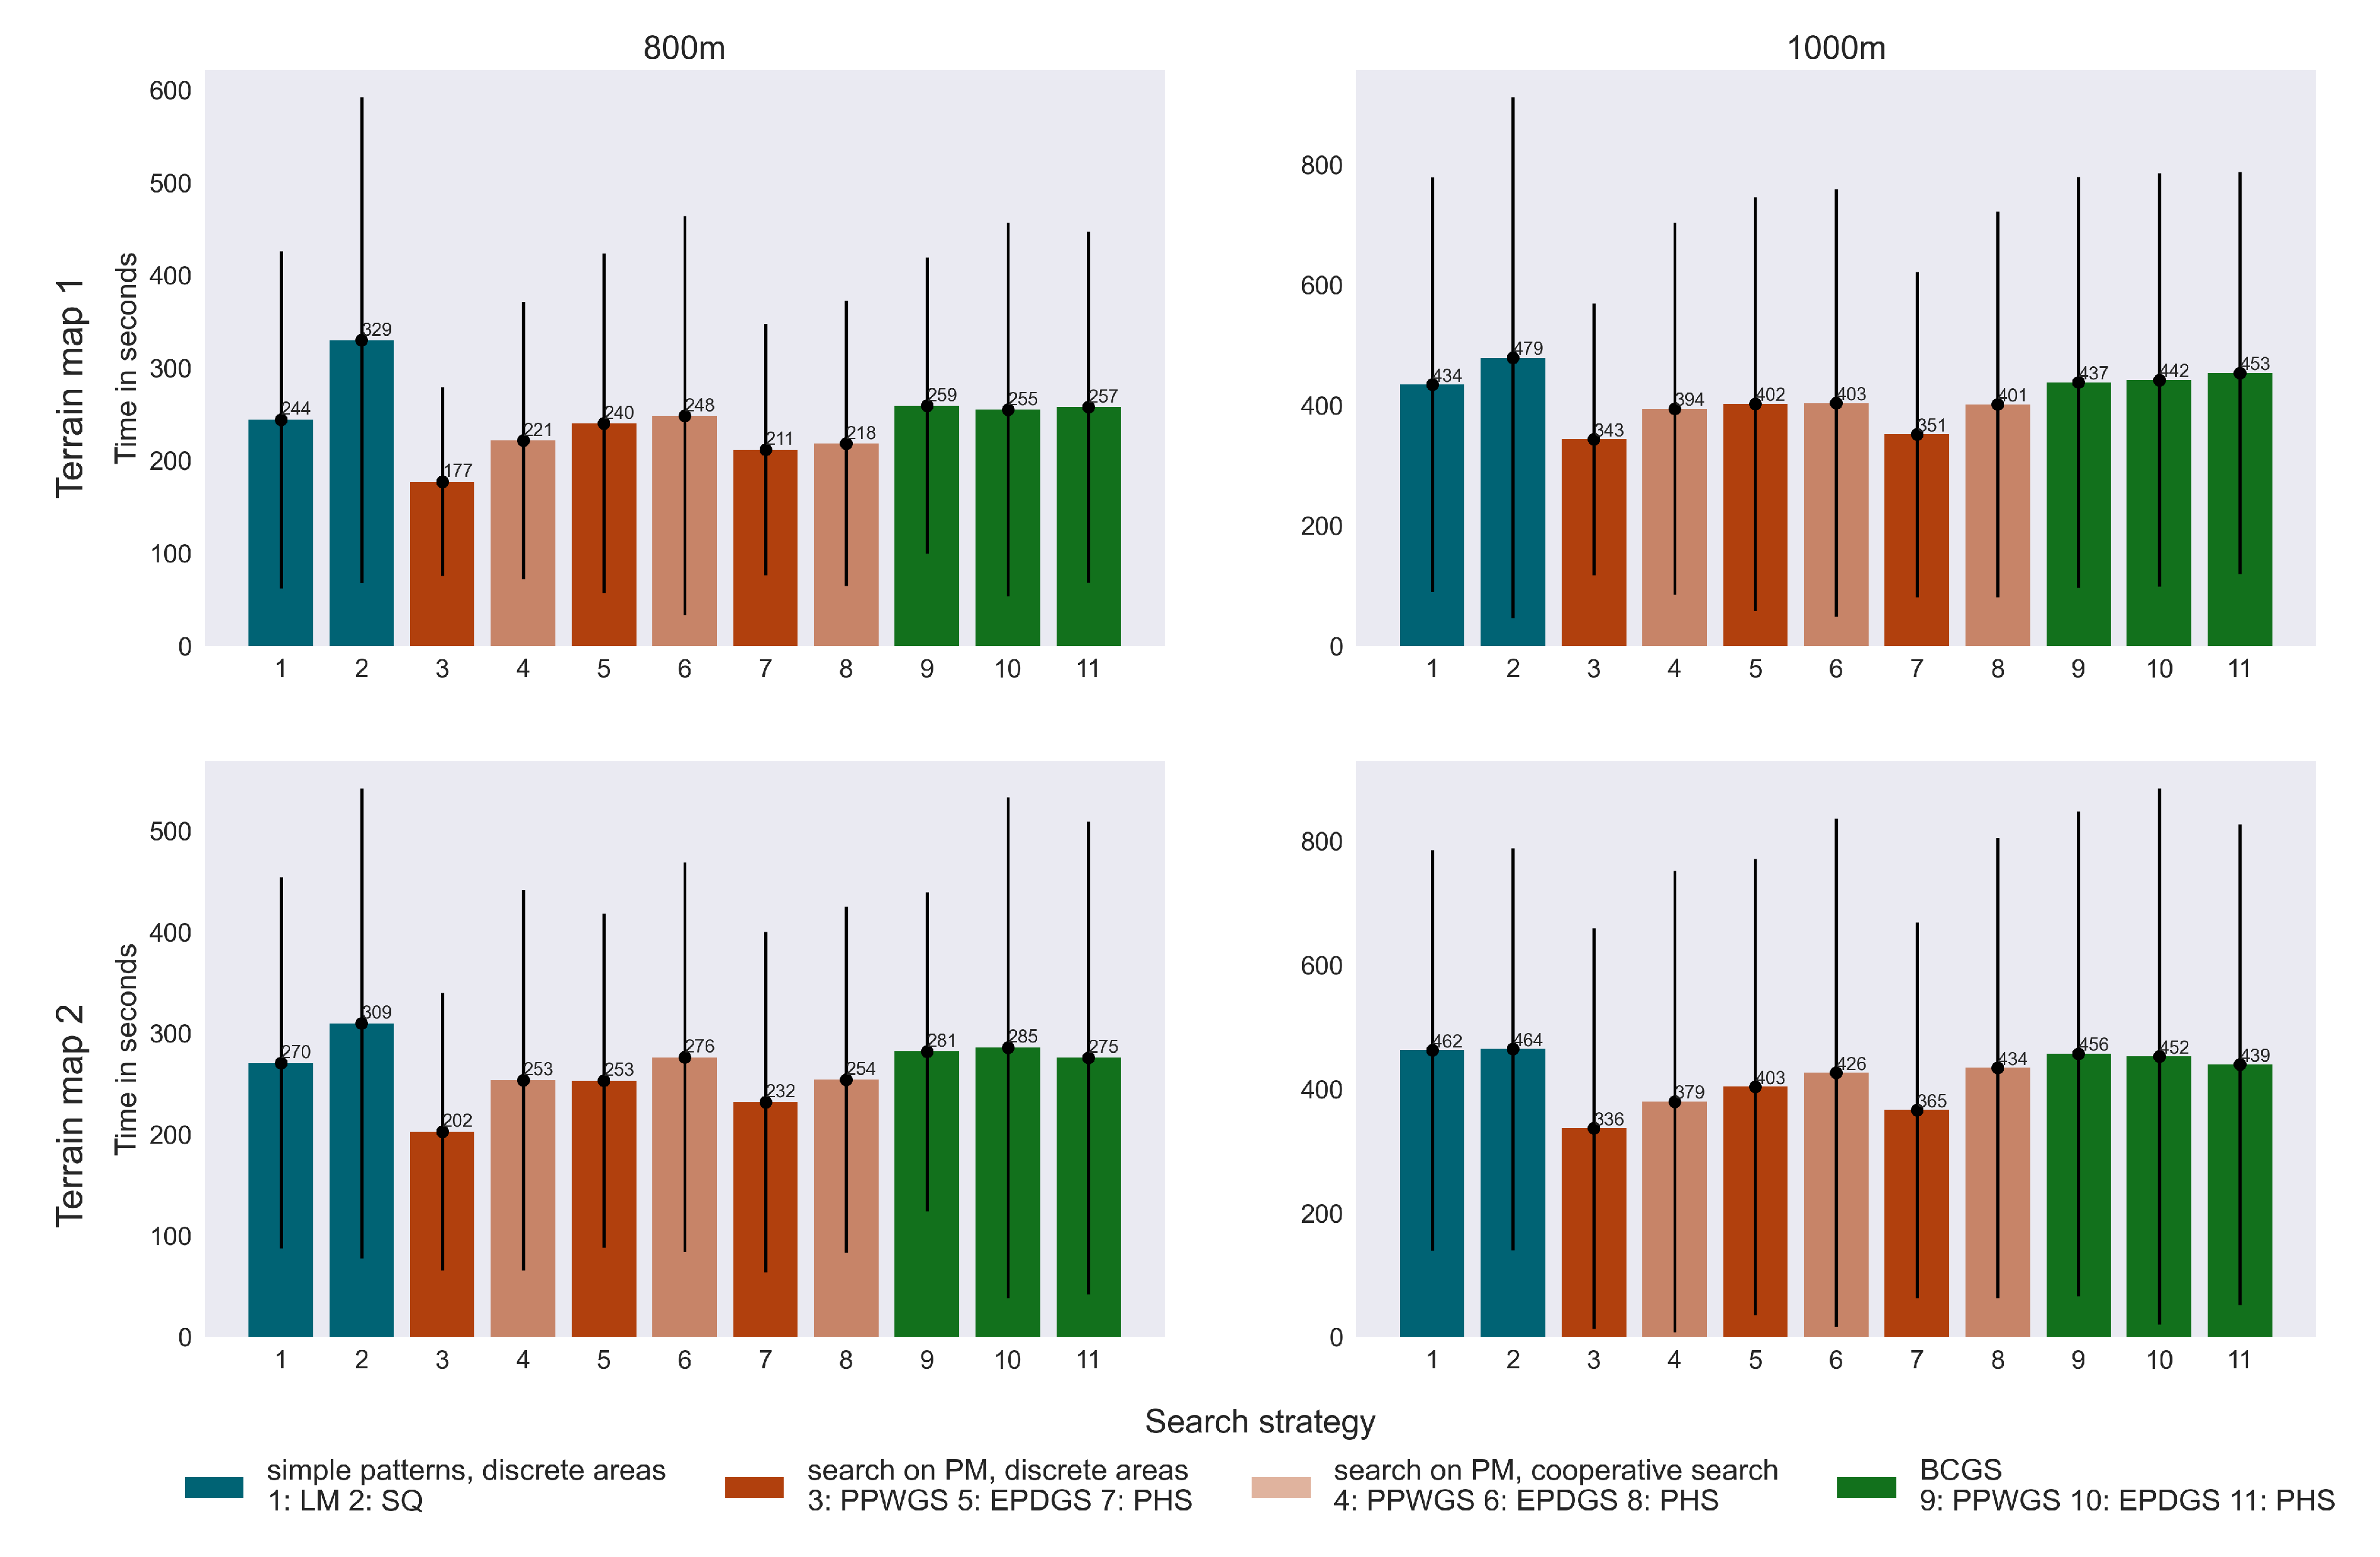
Figure 8.
Cumulative number of LPs found over time fot two UAVs and two terrain maps, for search regions and .
Figure 8.
Cumulative number of LPs found over time fot two UAVs and two terrain maps, for search regions and .
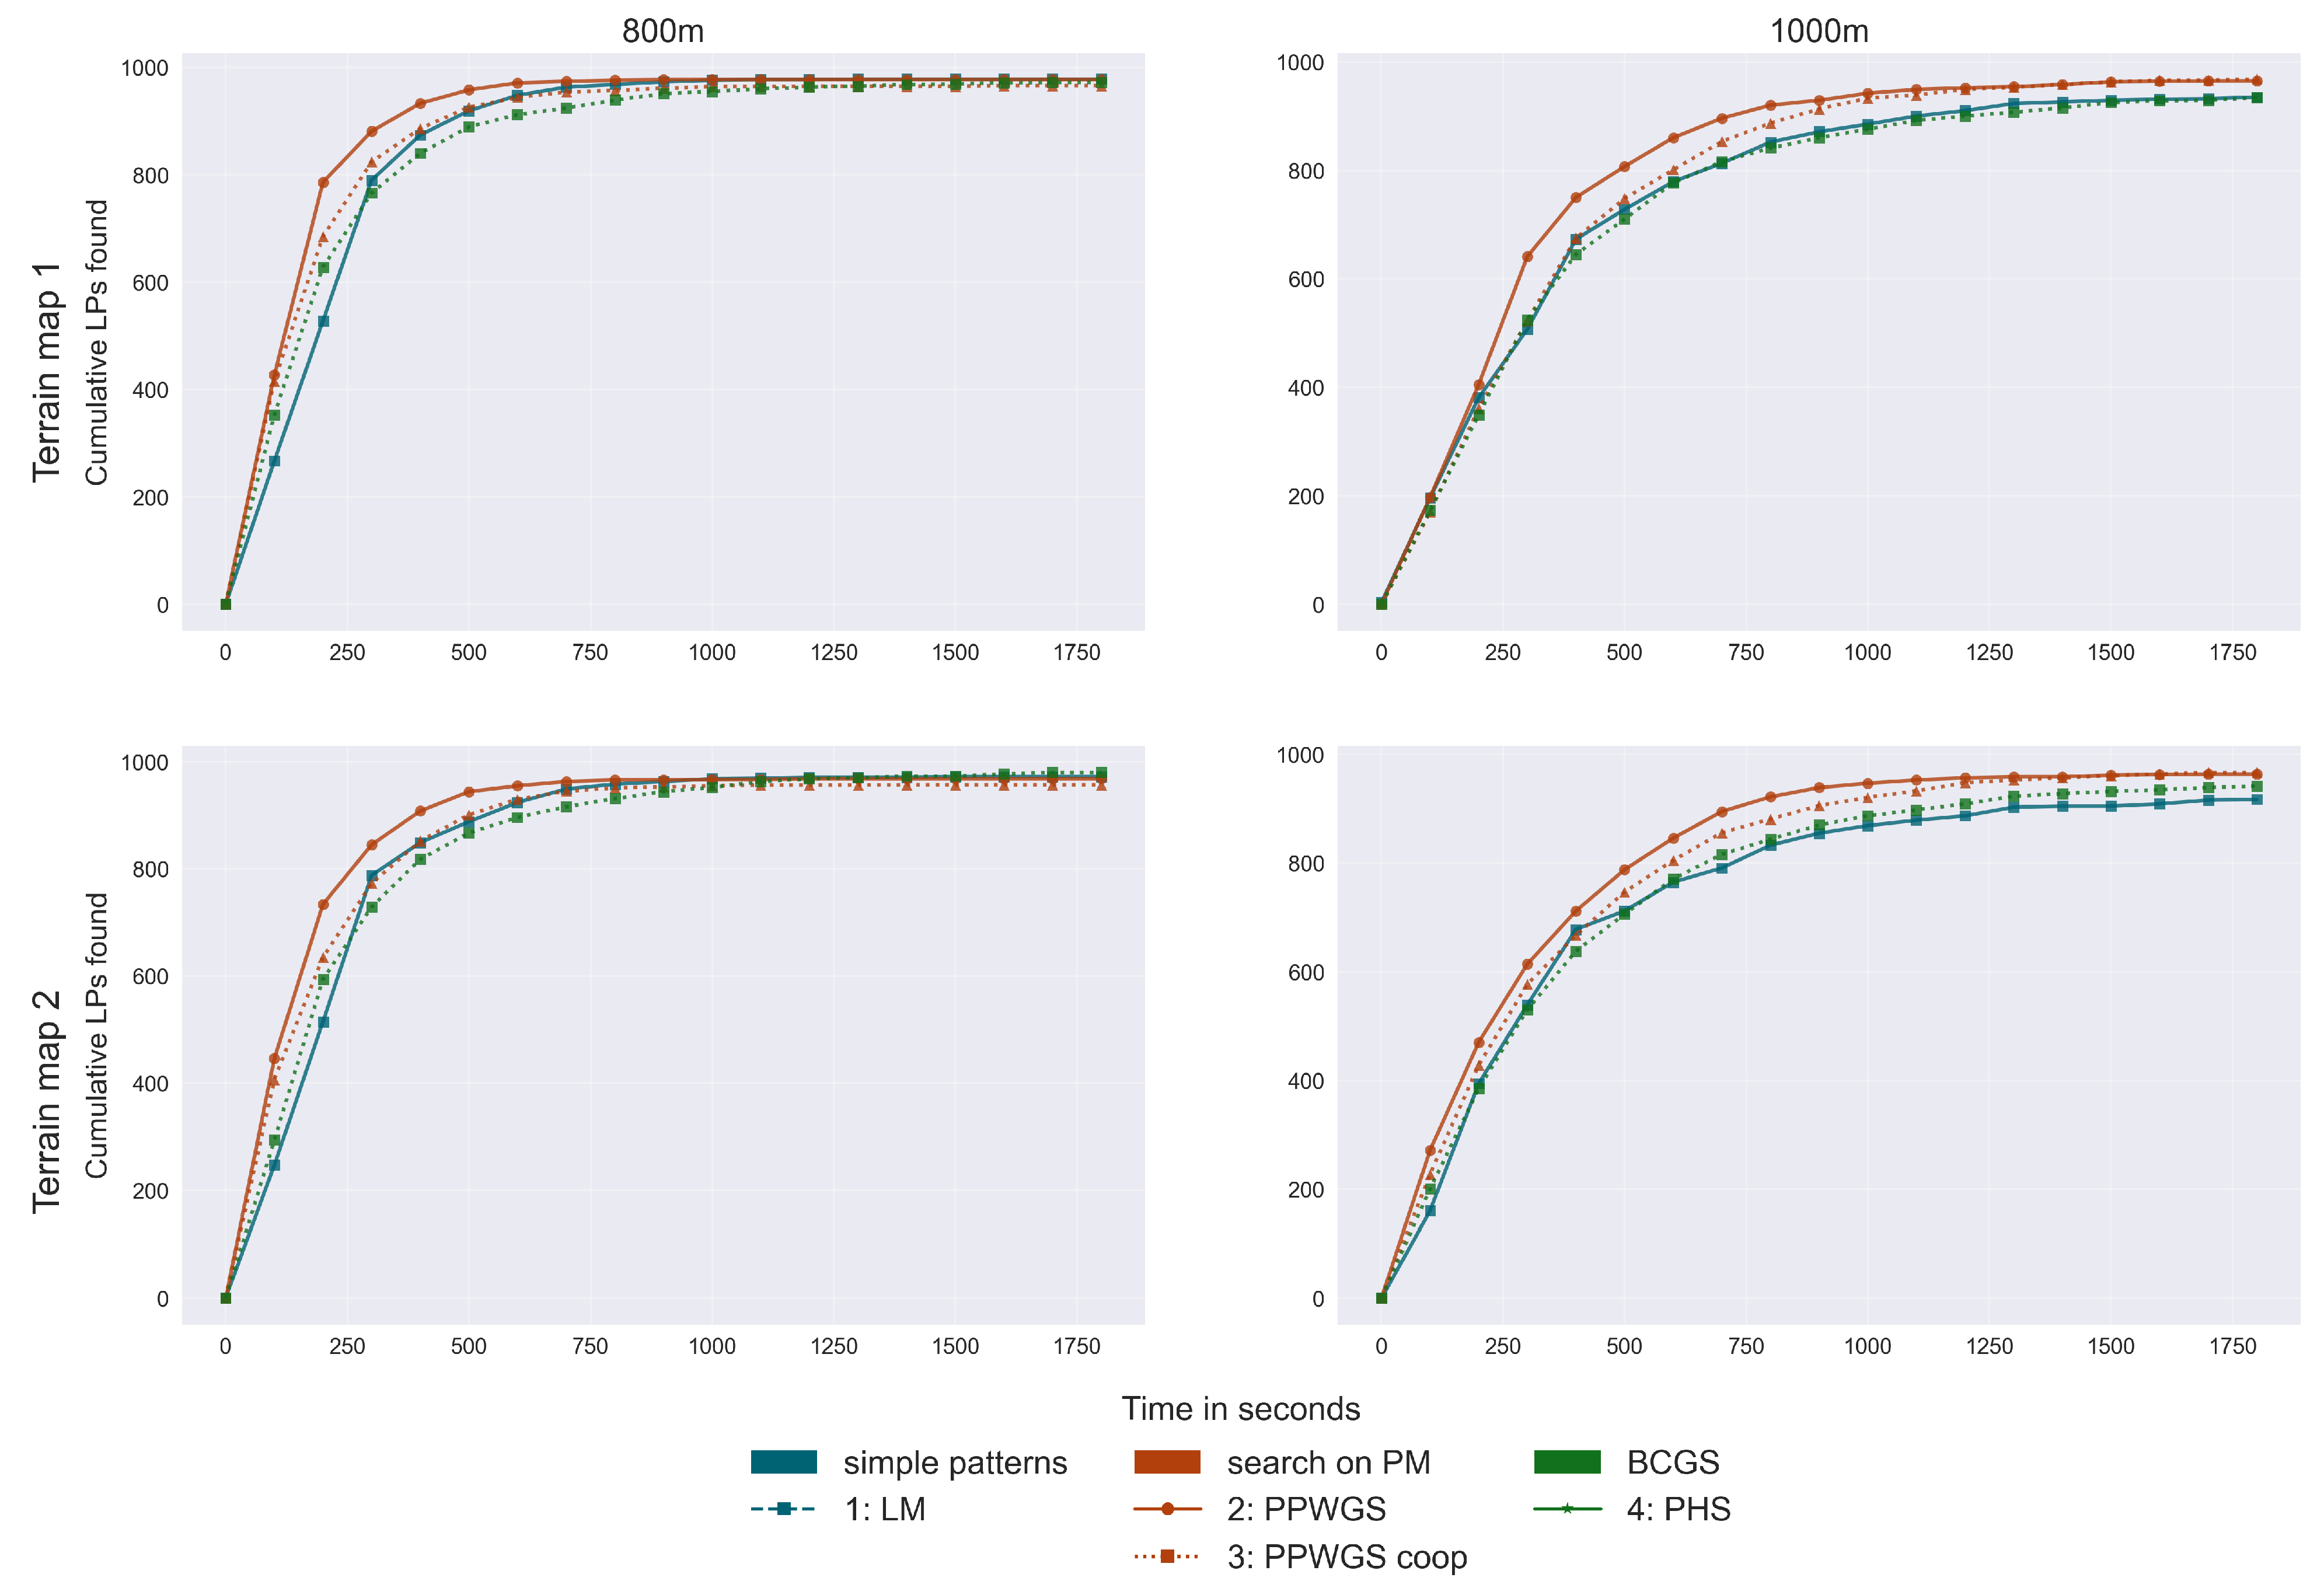
Figure 9.
Comparison of evaluation function MV mult for multiple search strategies on three search regions (, , and ) and two trajectory sets.
Figure 9.
Comparison of evaluation function MV mult for multiple search strategies on three search regions (, , and ) and two trajectory sets.
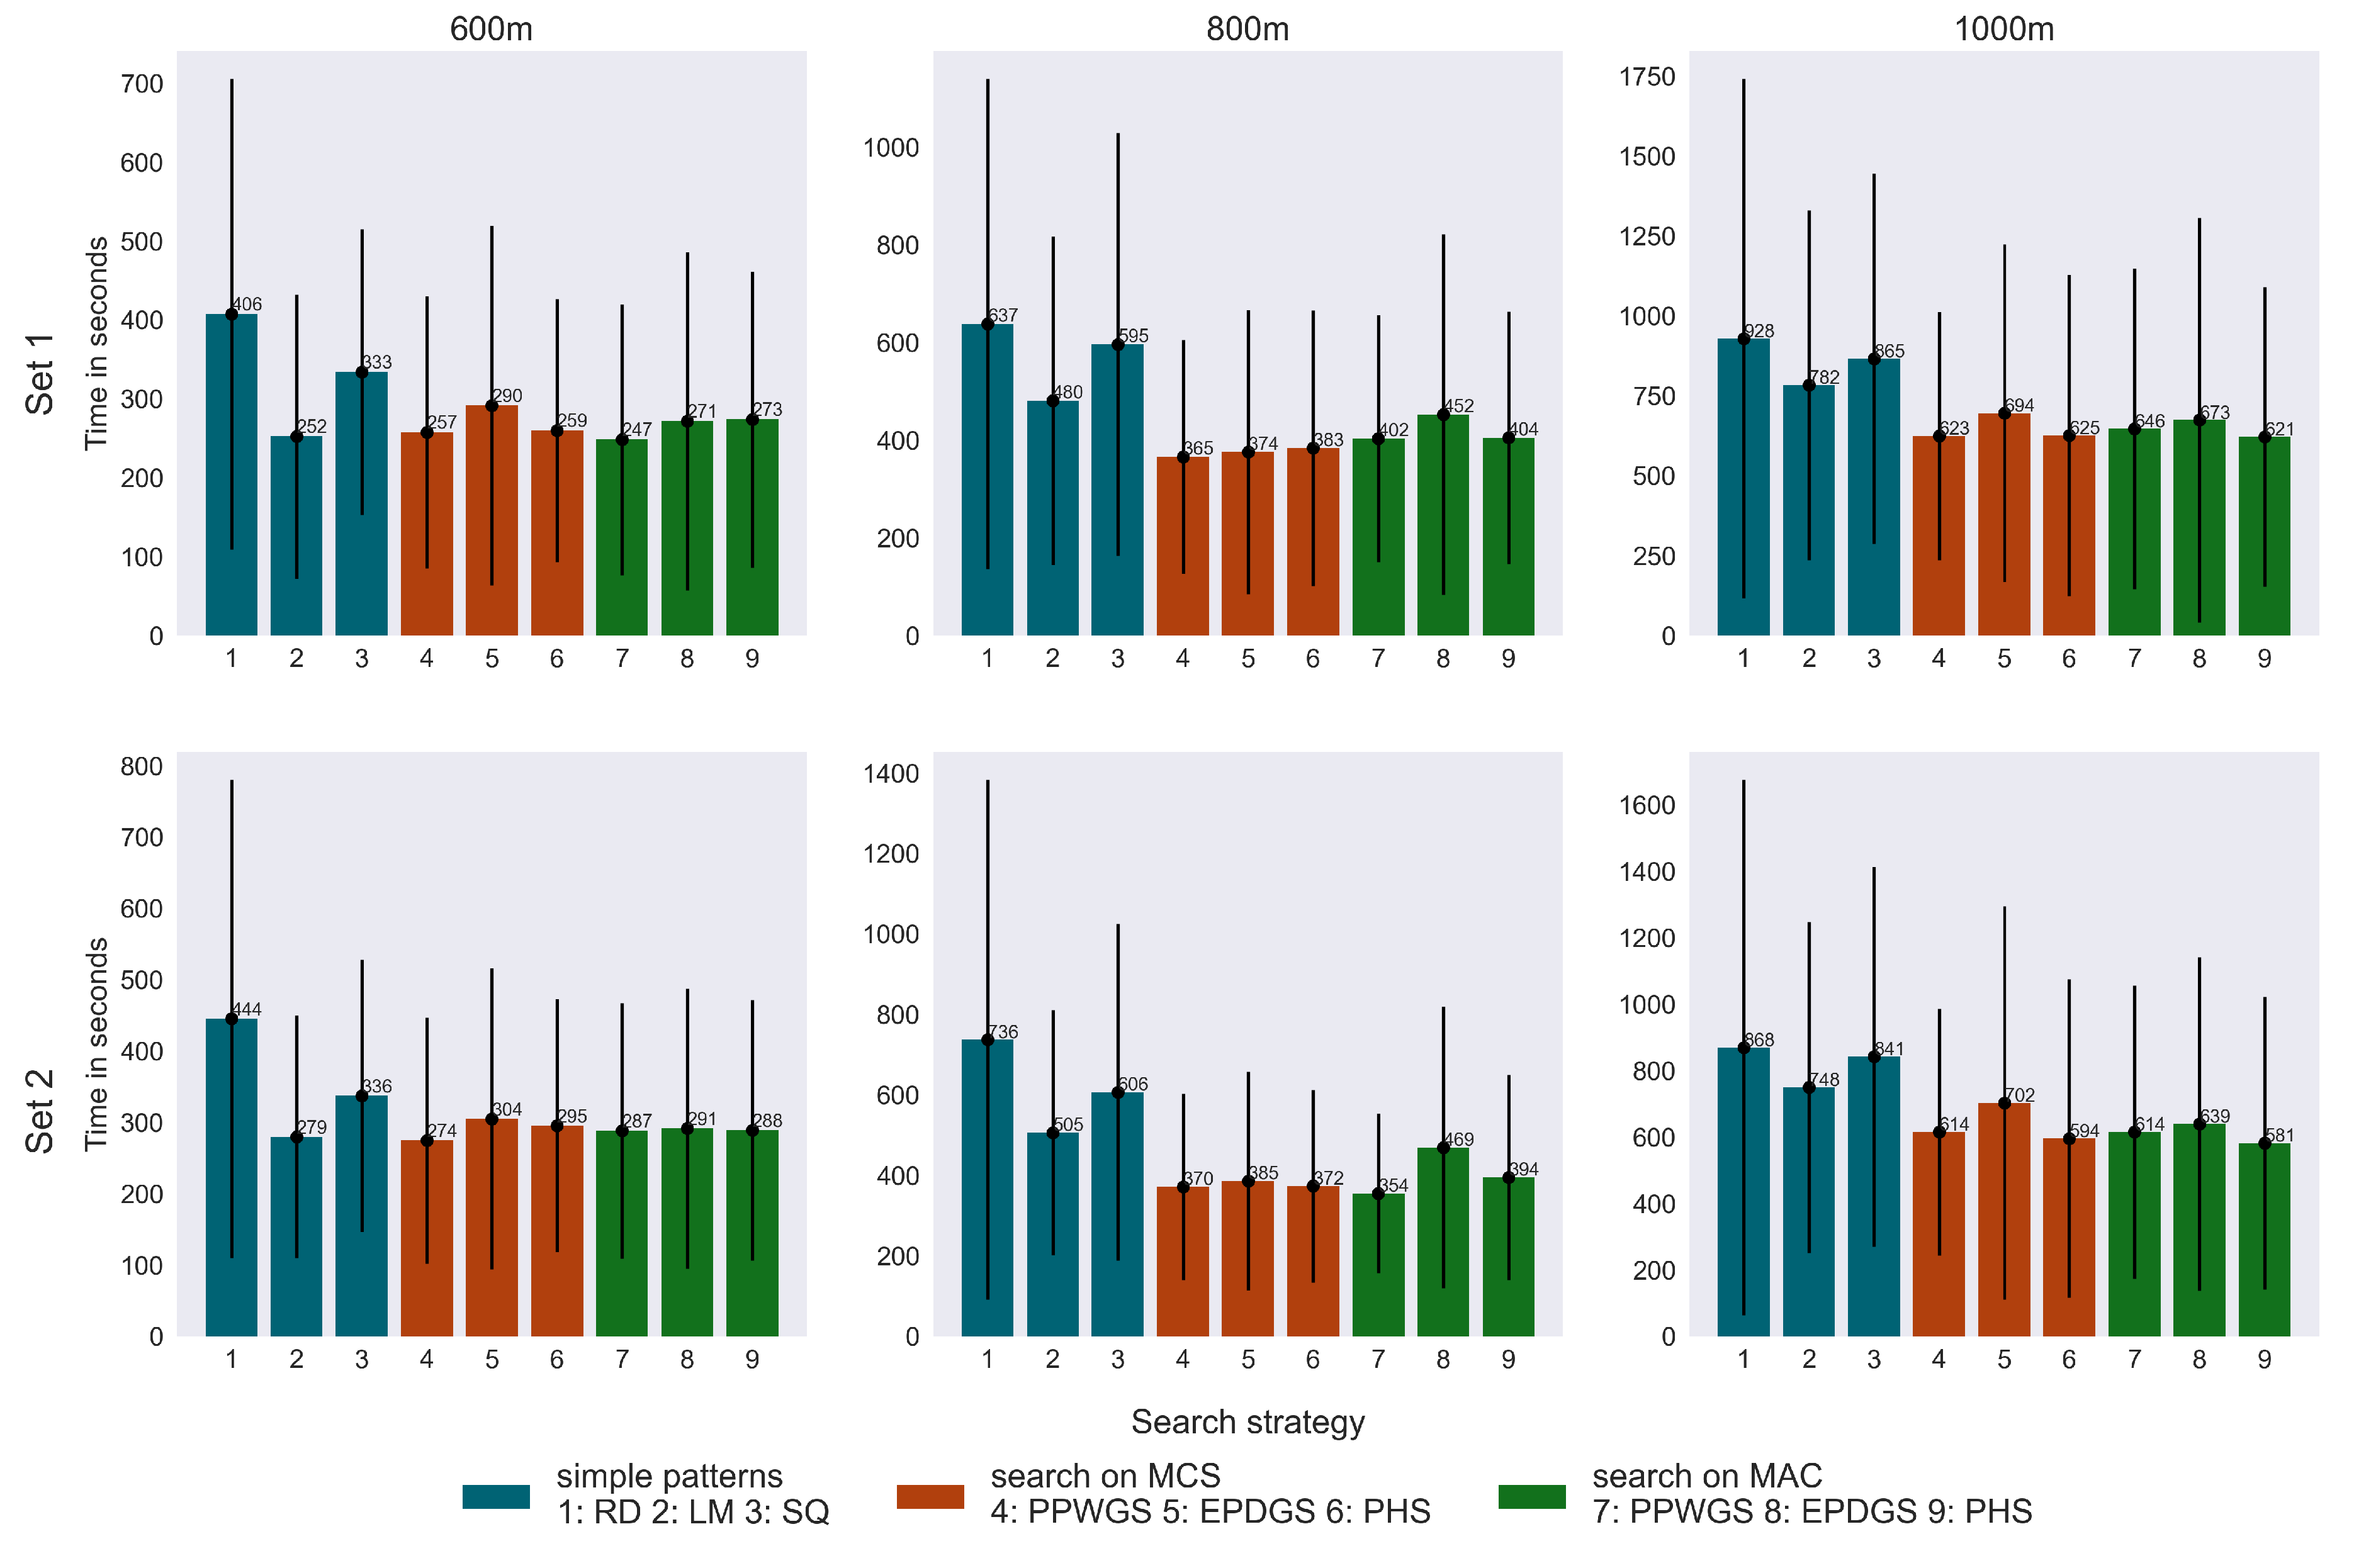

Table 1.
Cosine similarity values between PMs generated by MCS and MAC.
| Image size | Terrain map | Cosine similarity |
|---|---|---|
| map 1 | 0.9245 | |
| map 2 | 0.9215 | |
| map 1 | 0.9410 | |
| map 2 | 0.9265 | |
| map 1 | 0.9289 | |
| map 2 | 0.9196 |
Table 2.
Comparison of search methods for two trajectory sets within a , and regions. The best results are shown in bold font.
Table 2.
Comparison of search methods for two trajectory sets within a , and regions. The best results are shown in bold font.
| Search region | ||||||||||||
|---|---|---|---|---|---|---|---|---|---|---|---|---|
| Search method | Avg. time (s) | LPs found (%) | Avg. time (s) | LPs found (%) | Avg. time (s) | LPs found (%) | ||||||
| Map 1 | Map 2 | Map 1 | Map 2 | Map 1 | Map 2 | Map 1 | Map 2 | Map 1 | Map 2 | Map 1 | Map 2 | |
| Random Direction | 273 | 285 | 90.0 | 88.6 | 482 | 462 | 82.0 | 84.6 | 624 | 603 | 76.7 | 76.3 |
| Lawn Mover | 207 | 207 | 96.3 | 96.6 | 390 | 416 | 91.0 | 89.1 | 587 | 576 | 85.3 | 87.3 |
| Square Spiral | 274 | 256 | 96.0 | 93.8 | 485 | 497 | 90.2 | 91.9 | 657 | 652 | 82.9 | 80.4 |
| PPWGS on MCS | 185 | 192 | 95.0 | 94.7 | 281 | 304 | 93.6 | 91.1 | 492 | 507 | 90.3 | 87.3 |
| EPDGS on MCS | 193 | 198 | 93.5 | 92.5 | 286 | 319 | 93.0 | 90.1 | 520 | 517 | 86.1 | 84.6 |
| PHS on MCS | 180 | 186 | 94.0 | 92.4 | 284 | 332 | 93.2 | 90.6 | 458 | 466 | 88.7 | 88.6 |
| PPWGS on MAC | 175 | 199 | 94.3 | 94.5 | 283 | 291 | 94.0 | 91.4 | 490 | 484 | 89.3 | 89 |
| EPDGS on MAC | 180 | 198 | 93.8 | 93.3 | 339 | 331 | 90.6 | 90.3 | 502 | 508 | 88.1 | 84.8 |
| PHS on MAC | 182 | 206 | 93.9 | 94.6 | 284 | 315 | 91.8 | 90 | 443 | 461 | 88.3 | 86.9 |
Table 3.
Comparison of search methods with two UAVs for two trajectory sets within a and regions. To facilitate easy comparison, the best results are shown in bold
Table 3.
Comparison of search methods with two UAVs for two trajectory sets within a and regions. To facilitate easy comparison, the best results are shown in bold
| Search region | ||||||||
|---|---|---|---|---|---|---|---|---|
| Search method | Avg. time (s) | LPs found (%) | Avg. time (s) | LPs found (%) | ||||
| Map 1 | Map 2 | Map 1 | Map 2 | Map 1 | Map 2 | Map 1 | Map 2 | |
| Lawn Mover | 209 | 226 | 97.8 | 97.2 | 339 | 341 | 93.5 | 91.7 |
| Square Spiral | 296 | 285 | 97.8 | 98.4 | 405 | 391 | 94.7 | 94.8 |
| PPWGS | 130 | 150 | 97.7 | 96.8 | 290 | 281 | 96.5 | 96.4 |
| PPWGS cooperative | 166 | 184 | 96.6 | 95.7 | 348 | 331 | 96.8 | 96.7 |
| EPDGS | 178 | 173 | 96.2 | 95.1 | 338 | 326 | 95.6 | 94.8 |
| EPDGS cooperative | 185 | 199 | 96.1 | 95.2 | 340 | 353 | 95.5 | 95.0 |
| PHS | 162 | 166 | 97.0 | 96.0 | 283 | 275 | 95.5 | 94.1 |
| PHS cooperative | 162 | 189 | 96.6 | 96.0 | 355 | 354 | 96.8 | 94.5 |
| BCGS PPWGS | 191 | 184 | 95.8 | 94.0 | 347 | 354 | 93.8 | 92.9 |
| BCGS EPDGS | 199 | 232 | 96.5 | 96.6 | 347 | 381 | 93.5 | 95 |
| BCGS PHS | 213 | 244 | 97.2 | 98.0 | 358 | 355 | 93.4 | 94.2 |
Disclaimer/Publisher’s Note: The statements, opinions and data contained in all publications are solely those of the individual author(s) and contributor(s) and not of MDPI and/or the editor(s). MDPI and/or the editor(s) disclaim responsibility for any injury to people or property resulting from any ideas, methods, instructions or products referred to in the content. |
© 2025 by the authors. Licensee MDPI, Basel, Switzerland. This article is an open access article distributed under the terms and conditions of the Creative Commons Attribution (CC BY) license (http://creativecommons.org/licenses/by/4.0/).
Copyright: This open access article is published under a Creative Commons CC BY 4.0 license, which permit the free download, distribution, and reuse, provided that the author and preprint are cited in any reuse.


