
Submitted:
14 February 2023
Posted:
17 February 2023
You are already at the latest version
Abstract
With Unmanned Aerial Vehicles (UAV), a swift response to urgent needs like search \& rescue missions or medical deliveries can be realized. Simultaneously, the legislator is establishing so-called geographical zones, which restrict UAV operations to mitigate the air and ground risk to third parties. These geographical zones serve a particular safety interest, but they may also hinder the efficient usage of UAVs on time-critical missions with a range-limiting battery capacity. In this study, we address a facility location problem for up to two UAV hangars with a robust optimization model considering demand hotspots, geographical zones as restricted areas, a standard mission to satisfy battery capacity constraints, and the impact of wind scenarios. To this end, water rescue missions are used exemplary, for which positive and negative location factors for UAV hangars and areas of increased drowning risk as demand points are derived from open-source georeferenced data. Optimal UAV mission trajectories are computed with an A* algorithm considering five different restriction scenarios. As this pathfinding is very time-consuming, binary occupancy grids and image processing algorithms accelerate the computation by identifying either entirely inaccessible or restriction-free connections beforehand. For the optimal UAV hangar locations, we maximize accessibility while minimizing the service time to the hotspots, resulting in a decrease from the average service time of 570.4 s for all facility candidates to 351.1 s for one and 287.2 s for two optimal UAV hangar locations.
Keywords:
Unmanned Aerial Vehicle
; Facility Location Problem
; Mission Planning
; Restricted Airspace
; UAS Geographical Zone
; Water Search & Rescue
; Open Source Georeferenced Data
1. Introduction
According to the World Health Organization [1], drowning is the third leading cause (7%) of unintentional injury-related deaths worldwide. The 2021 DLRG annual report [2] shows that around 85% of all victims drowned in inland waters in Germany. Therefore, alerting emergency responders and localizing victims in the water constitute particular challenges within the rescue chain. Autonomous Unmanned Aircraft Systems (UAS) for Search & Rescue (SAR) operations may detect persons in distress faster than helicopters, boats, or lifeguards. Furthermore, the precise dropping of a flotation device may extend the chance of survival until conventional rescue services arrive on site. However, such UAS also require safe integration into the airspace, well-suited operation automation, and ensuring the safety of third parties on the ground, e.g. according to the UAS geographical zones of the Commission Implementing Regulation (EU) 2019/947 [3].
The research project RescueFly studies the prototypical implementation of two non-holonomic THOLEG1 Unmanned Aerial Vehicle (UAV) for inland water SAR at the remote Lusatian Lake District located in the Federal State of Brandenburg and the Free State of Saxony in Germany. The UAVs will act automatically once an emergency call has provided an initial search location. Therewith, RescueFly covers all elements from UAS and intelligent UAV hangar development, safe and efficient mission planning, autonomous detection of persons in distress, automatic dropping of flotation devices, and the operational integration in the existing rescue chains of the two federal states.
This paper focuses on the determination of optimized locations for decentralized autonomous UAV considering areas with increased potential for incidents (hotspots), standard mission profiles respecting UAS geographical zones and potentially crowded areas, and requirements for the UAV hangar location. Figure 1 shows the 109 geo-referenced layers from open data sources, which we discretize and merge to determine the solution space, plan safe flight routes, and solve the Uncapacitated Facility Location Problem (UFLP) given two finite sets of potential hangar locations and hotspots. The geo-referenced data are transformed into a binary occupancy grid image and labeled using a fast connected-component algorithm to identify non-permissible connections between potential UAV hangar locations and hotspots to reduce computational effort during the path search. In addition, direct connections, i.e., paths not affected by restrictive areas, are identified using a fast ray-occupancy-intersection algorithm. Finally, the A* algorithm serves to compute all remaining paths. Since the battery capacity constrains the UAV mission, the accessibility and service time are determined considering a standard SAR mission including a safe return to the UAV hangar.
This section continues with a review of the state of the art, focusing on other SAR applications for UAS, UAV mission planning, automated detection of persons in distress, and approaches to the Facility Location Problem (FLP) for UAS. The following chapter then describes the methodology for solving the FLP with a multi-objective optimization, considering positive and negative location factors and constraints like the battery capacity or the external risk for up to two locations. Subsequently, the results of our work are shown, indicating candidate locations for the UAV hangars. Finally, an outlook on the next steps concludes the paper.
1.1. SAR Concepts with UAS
Various SAR concepts have been studied using UAS as a component in the rescue chain. Ajgaonkar et al. [7] developed a UAV to assist lifeguards at coastal beaches. They assumed that the lifeguard provides the initial identification of the person in distress to a UAV operator, who then searches the area to drop a flotation device. Similarly, Seguin et al. [8] conducted a study with UAV delivering flotation devices to swimmers at the lifeguard’s remote control, showing that the faster delivery compared to the lifeguard or a jetski reduces the submersion time and therefore the risk of drowning significantly. Dufek and Murphy [9] introduced a concept of combining an UAV with an Unmanned Surface Vehicle (USV) for offshore emergencies, which searches the person in distress and serves as a flotation device. The UAV serves to first guide the USV to the victims and then to track the drift of USV for the emergency responders.
Liu et al. [10] presented an operational concept for UAV usage in SAR missions over rivers, in which they predicted the drift using Monte-Carlo simulations to delimit the search area. For the faster coverage of larger areas, authors like Ruetten et al. [11] proposed swarm networks consisting of many UAVs that organize themselves to reach optimal search coverage with minimal overlapping. While this approach ensures fast detection over large areas, it poses an additional external risk to persons and significantly increases the required infrastructure and equipment. Thus, it is deemed unfeasible for SAR missions at bathing lakes.
1.2. UAV Flight Path Planning for SAR
The most crucial factor in SAR is the time since the early detection of a drowning person substantially improves the chances of survival. From the technical standpoint, the battery capacity also limits the flight time of an UAV, which requires efficient path planning from the UAS hangar to identify, reach and search the target area. Brühl et al. [12] provided a methodology to estimate energy consumption based on the flight phase for various large air taxis, including multi-copter designs similar to UAVs for SAR. Chu et al. [13] analyzed the impact of wind on the battery capacity for small quad-copter UAV, considering wind speed, direction, and turbulence in a simulation. They found wind conditions up to 11 suitable for surveying crash areas regarding the additional energy consumption, but also emphasized the significant increase in consumption in higher turbulence.
Lin and Goodrich [14] created a probability distribution map to accelerate wilderness SAR with a UAV flying 60 m above ground. With this map, they converted the path search into a discretized combinatorial optimization problem and applied variants of Complete-coverage, Local Hill Climbing, and Evolutionary algorithms with and without a defined destination, finding that the Local Hill climbing algorithm with a convolution kernel performs best. Hayat et al. [15] developed a multi-objective path planning based on a genetic algorithm that minimizes the search time, which balances the search area coverage with the network connectivity coverage to ensure communication to the emergency responders. Wang et al. [16] proposed a vortex search algorithm for multi-objective path optimization to guide UAV to forest fires, considering obstacles and terrain described with a cubic interpolation method.
After reaching the search area, an efficient method for scanning this area is required. Zuo et al. [17] suggested an extended square search, which expands from the center of the search area, assuming that positions closer to the center are more likely than distant ones. Liang et al. [18] developed a heuristic to avoid redundant image coverage and maximize image quality during a SAR mission with an energy-constrained UAV. Dakulović et al. [19] developed a complete coverage D* algorithm for a floor-cleaning mobile robot, minimizing path length and search time in a constrained area with unknown obstacles. Xu et al. [20] studied a Complete Coverage Neural Network (CCNN) for an unmanned surface vehicle for complete coverage of a search area and combined it with an improved A* algorithm to escape deadlock situations efficiently. Sun et al. [21] proposed a two-step auction method to coordinate multiple UAV to cover a mutual search area, considering the avoidance of obstacles and the energy constraints of the UAV.
1.3. Automated Detection of a Person in Distress
When covering the search area with the UAV, the person in distress must be detected swiftly, even when large groups are swimming simultaneously. For this, Qingqing et al. [22] analyzed different altitudes and camera angles for human detection in marine SAR to find a trade-off between speed and detection accuracy with the real-time object detection model of YOLOv3. They found that persons can be detected farther away the closer the camera angle is to facing straight down, i.e., nadir. Above 100 m, however, confidence and accuracy drop significantly since it is a function of the camera lens and image resolution. Rudol and Doherty [23] presented a method to detect human bodies lying or sitting on the ground by combining video and thermal sensors. For maritime SAR, it remains unclear if a thermal sensor can produce similar results, especially for submerged persons. Bejiga et al. [24] trained a Convolutional Neural Network (CNN) to assist avalanche SAR with faster detection of victims utilizing optical cameras fitted to UAV. Lygouras et al. [25] used CNN to detect persons swimming in open water with an autonomous UAV. Feraru et al. [26] proposed a concept to deploy autonomous UAV for man-overboard incidents using a probabilistic leeway model with a Faster Region-based Convolutional Neural Network (R-CNN) to detect a person in the water. Liu and Szirányi [27] studied a two-stage approach, in which they first detected persons in UAV video footage and then interpreted basic gestures used by persons in distress using neural networks. Wang et al. [28] proposed a different two-stage approach: First, persons are located with simpler features to reduce the search space, and second, a CNN is applied to the previously selected areas.
1.4. Facility Location Problem
A FLP models the selection and localization of facilities to serve demand at specific points or areas, e.g., for applications like hospitals, fire stations, or warehouses. The UFLP is one of the most commonly considered combinatorial optimization problems, in which two finite sets of potential facilities and demand points are considered by assessing the associated costs for the facility construction and the distance or cost for each combination of demand point and facility location. The objective of the optimization problem is to select the facility locations to be established and allocate the demand points by minimizing the total operational costs [29,30]. The k-facility problem is a UFLP with the additional constraint of facilities being allowed to open. For facility construction costs equal to zero, k-median clustering can be applied to determine centroids as optimized facility locations. This approach, however, assumes that all distances are as the crow flies [31]. Another option is the lower-bounded FLP, e.g., with the algorithm of Ahmadian and Swamy [32], where each facility must serve a certain minimum amount of demand.
For UAV delivering first-aid products, Zhu et al. [33] developed a two-stage FLP approach for robust optimization considering customers demand uncertainty. They proposed three models for the problem that outperform a deterministic FLP. Lynskey et al. [34] studied the distribution of UAV ground facilities. They solved the problem with k-means clustering while adding the energy consumption of the UAV as costs using a traveling salesman algorithm to enable UAV to perform multiple tasks with one flight.
According to our understanding, restricted areas for the UAV, such as the UAS geographical zones according to EU 2019/947 [3] and § 21h Luftverkehrsordnung (LuftVO)2 [35], have not been considered in a FLP problem for UAV yet. As these regulations aim to reduce external risk, they also impact the routing significantly. In some cases, they may prohibit the placement of a UAV hangar entirely, so the geographical zones should be considered in the FLP problem and the related standard SAR mission.
2. Materials and Methods
2.1. Overview of the Approach
The RescueFly concept of operations plans to assist SAR missions at Lake Geierswalde and Lake Partwitz utilizing automated UAS based in decentralized hangars. To this end, the hangar location(s) shall provide minimal service time to hotspot areas where accidents are expected more frequently due to their geographic characteristics and nearby amenities while considering positive and negative hangar location factors. For this purpose, the shortest restriction-free flight trajectories from all candidate locations to all hotspots are computed, considering national and European regulations and external risk factors like potentially crowded areas, to identify the location(s) serving all hotspots with minimized service time. To this end, we utilize open-source geographical data to determine an optimal location of the UAV hangar.
A hangar facility must provide solid ground, power supply, and reasonable access for installing and maintaining the system while being located outside restrictive areas (e.g., hazard areas, UAS geographical zones, natural reserves). In addition, vegetation shading must be avoided to permit reliable communication links to the emergency centers. Furthermore, the location shall grant swift access to designated beaches, recreation sites, hotel and camping facilities, grasslands, and other facilities where people are engaged in activities adjacent to lakes, e.g., barbecue areas, boat slipways, and boat rentals because these areas increase the intrinsic risk for accidents in water bodies. When planning a SAR mission, the risk to third parties, i.e., the air and ground risk, must be considered. SAR operations are excluded from the remit of Regulation (EU) 2018/1139 [36], so the competent national authority is responsible for regulating SAR operations. According to § 21k LuftVO [35], authorities conducting SAR operations are permitted to fly through UAS geographical zones defined by EU 2019/947 [3] and § 21h LuftVO [35]. As the UAV hangar locations shall provide a robust and optimal solution considering various types of restricted areas, complying with or flying through UAS geographical zones can be selected operationally, e.g., depending on the urgency or the exposed crowd size at beaches. For this purpose, this paper considers five different scenarios:
- Restriction-free flight from the hangar to the hotspot by invoking the special rights of authorities conducting SAR missions according to § 21k LuftVO [35];
- Compliance with specified air and ground risk relevant UAS geographical zones;
- Compliance with all specified UAS geographical zones; and
- Compliance with all specified UAS geographical zones and avoidance of potentially crowded areas.
Furthermore, the solution should be robust against wind. Therefore, different wind cases are considered for each of the above scenarios, which are based on the extensive study of Chu et al. [13].
2.2. Acquisition of Open Source Data
This section reviews open source data to retrieve relevant information for identifying UAV hangar location candidates, divided into three georeferenced data requirements groups. First are positive and negative location factors for establishing UAV hangars. Second, data is required to identify areas of high intrinsic risk for a waterside accident. Third, the UAS geographical zones according to EU 2019/947 [3] and § 21h LuftVO [35] must be identified for the mission planning with incrementally minimized external risk and environmental impact according to our scenarios.
The primary source for the former two is the OpenStreetMap (OSM)3, a community-driven database for georeferenced data layers. OSM defines the georeferenced data with nodes, ways, and relations to describe the geometry, supplemented by tags (key-value principle) describing the object’s function. Using the Overpass API4, it is possible to define queries for extracting data based on region, layers, and tags. The location factors are based on the surface and its ability to accommodate a UAV hangars. As listed in Table 1, six tags for areas with grass and minimal vegetation are considered positive. Eight tags for areas with forest, large groups of trees, or wetlands will require additional construction work or shade the communication links, leading to negative location factors in Table 2. Furthermore, each potential UAV hangar location requires road access for maintenance with a maximum permitted distance of 20 m from the road tags in Table 3. In addition, the UAV hangar cannot be established on water surfaces, provided as Web Map Service (WMS)5. Finally, the power supply should be another positive location factor, but the required data is not public.
Table 4 lists 34 map features representing hotspot indicators. We assume that these features increase the probability of an accident on the water. For this purpose, we extrude the resulting map feature nodes and areas with a radius of 150 m in size, followed by an intersection with the water surfaces of the investigated lakes. If an area is a subset of the extruded hotspot indicators and a subset of either of the water areas at the same time, it is identified as an hotspot area. The radius of 150 m is based on the distance between buoys and shore of approximately 120 m plus an additional 30 m buffer, since the OSM features may georeference slightly outside the shore lines. We assume that most swimmers tend to stay within the prescribed limits, increasing the risk of accidents in these areas.
For the planning of the standard SAR mission, the UAS geographical zones [3,35] are required. For UAV operations in Germany, the Digital Platform for Unmanned Aviation (dipul) provides a map tool6 and web map service indicating the UAS geographical zones as separate layers. For the data transmission, the availability of a sufficient board-band connection should be considered as well. However, the so-called Breitband-Monitor7 of the German Bundesnetzagentur provides only coverage at ground level, so open-source data at cruising and search altitude cannot be retrieved so far.
2.3. Definition of the Standard SAR Mission
As the battery capacity limits the operation duration of the UAV, a restriction-free flight path between each potential UAV hangar location and each hotspot, and a standard search mission must be defined to assess the accessibility of the hotspot and feasibility of the search mission, given varying UAS geographical zones and wind scenarios. Each standard SAR mission consists of the three phases approach, search mission, and return to the hangar. For consistent consideration, we assume that the approach and return flights have the same paths and vertical profiles. Furthermore, as shown in Figure 2, we assume a vertical climb at the UAV hangar to the approach altitude , which is maintained until the UAV reaches the hotspot area. There, the UAV descends vertically to the search altitude , which depends on the required resolution to detect a person in distress, and continues with a search pattern at . After the search, the UAV climbs to maintain the return altitude until reaching the hangar.
A maximum altitude of m above ground is assumed for approach and return, leaving a safety buffer to the maximum permitted altitude of 120 m for the ´specific’ category [3]. depends on the characteristics and orientation of the camera and the required resolution for the automated detection of a person in distress. The camera of our UAV has an aspect ration of with a resolution of Mpx, a lateral field of view , a vertical field of view , and a 1/2.3" CMOS sensor.
The camera is facing down perpendicular, i.e., nadir, to the water surface, guaranteeing the best coverage and detection [22]. Furthermore, the larger is perpendicular to the search direction so that the UAV is centered above the middle of the covered surface in a single camera frame, as shown in Figure 3. Then, the achieved pixel density D in [px ] per frame is given with the search width and length in [m] according to:
Using the tangent of two assumed right-angle triangles, and can be determined at given with and :
The required minimum pixel density significantly drives the optimal to detect persons in distress autonomously. A trade-off is necessary between a high-as-possible for minimum-time coverage of the search area for the fastest SAR, and a sufficiently high pixel density to solve the detection and recognition task reliably, i.e., to distinguish persons in distress from all other swimmers. For estimating , a set of test images of 35 swimming volunteers has been taken at Lake Partwitz under sunny and clear conditions without any significant wind. From the set, 96 images of different pixel densities between 5 to 3300 px have been generated, an example set is shown in Figure 4. Those images were presented to 10 test persons (3 female, 7 male) aged 30 to 40 (), thus equals 960 samples. The test person’s tasks are (a) detecting objects in the image and (b) recognizing and describing the activity of the swimming persons. If all persons per image are detected, task (a) is classified as positive; if at least one person remains undetected, it is considered negative. If the test persons describe all activities of the swimmers correctly (e.g., breaststroke with drawn legs), task (b) is classified as positive.
The experiments show an average px with px , and px with px . The task complexity correlates strongly with the number and types of objects per test image resulting in high standard deviations. Thus, images containing few volunteers or volunteers on floating objects (e.g., surfboards) show significantly lower due to contrast and size. Also, their activities are recognized more reliably than images with many volunteers swimming closely together. The obtained from the test persons serve as estimates for the DCNN intended to automatically detect a person in distress, assuming it will not perform significantly better or worse than humans. van Dyck et al. [37] confirm this hypothesis, in which the DCNNs ResNet18 and vNet achieved and accuracy, respectively, compared to of human observers. With , eqs. (1)–(3) are rearranged to solve for :
Since the goal of the search mission is the reliable recognition of the person in distress, it is assumed that px is required to avoid misdetection, which is a ground sampling distance of 0.0225 m. With eq. (4), m is determined to fulfill the task (b).
With the standard UAV mission, a set can be generated from the potential UAV hangar location F (Facility), a hotspot D (Demand), a wind scenario W, and a UAS geographical zone scenario Z. The corresponding total flight time , for , , constitutes the evaluation metric. The flight distance results from the shortest restriction-free flight path from to considering . For this, the approach and return flight are assumed identical, i.e., . Since various shapes of hotspot areas exist and the search time depends on the coverage algorithm, we simplify the resulting hotspot areas [] to rectangles with the identical area and the edge length [m] of Figure 3. Furthermore, an additional detour factor accounts for different coverage algorithms and shapes, resulting in a search distance :
According to the UAV manufacturer, a reliable cruise speed during approach and return and a vertical rate 2.5 is achieved. During the search phase, we assume a slower search speed 5 to provide suitable coverage and reduced motion blur. The total flight time for successive maneuvers (cf. Figure 2) is:
in eq. (6) represents the detour factor per wind scenario . The actual values are derived from Chu et al. [13], using windspeeds below 11 as recommended. We computed for seven wind scenarios in Table 5 with the battery use from Table 10 [13], averaging over all wind directions and normalized on 1 s of flight time. Furthermore, the wind scenario with 0 and turbulence index 0 is added as a baseline case with .
Given the flight endurance min, each rescue mission from i to j is evaluated, so from eq. (6) are only classified as accessible:
Thus, is the binary accessibility variable from to , avoiding and considering , with the Big-M parameter M and an infinitesimally small positive quantity .
2.4. Optimization Model for UAV Hangar Positions
This section describes the FLP model to determine optimal UAV hangar locations with maximum accessibility to all hotspots across all wind scenarios and all UAS geographical zone scenarios while minimizing the respective total flight time. For that, we consider a finite set D of hotspots and finite set F of potential facilities with the binary success variable from eq. (7) and total flight time from eq. (6), such that:
With the binary parameter and P facility locations to be established, while ensures that each i is connected to only one j:

To this end, we process the data of Section 2.2 in a georeferenced 5 m 5 m grid inside latitude and longitude. Then, the location factors from identify the solution space for candidate locations. To reduce the computational effort, a spacing of 50 m between the candidates for UAV hangar locations is chosen, resulting in candidate locations. The hotspot areas from Section 2.2 are processed with a Connected Component labeling, resulting in 11 separate hotspot areas of varying extents across the two lakes. Each hotspot area is represented by hotspot centroids of a k-means clustering algorithm where k is the quotient of the respective hotspot area and the smallest hotspot area as an integer, resulting in a total of hotspot locations. Consequently, a total of path computations for one optimal facility location and calculations for two hangar locations is required. Since the restriction-free pathfinding with the A* algorithm has a high computational effort, we reduce the number of paths by applying the two techniques illustrated in Figure 5.
First, we label the discretized binary occupancy grid using a Connected Components algorithm removing all inaccessible candidates due to restrictions. Figure 5a illustrates the method using , as an example. All candidate locations labeled ’yellow’ are valid connections to the hotspots, removing invalid candidate locations (e.g., ’purple’) from the later pathfinding.
Second, a Fast Ray Occupancy Intersection algorithm checks if straight paths from j to i exist that do not infringe on restricted areas. If this is the case, the shortest path is already found, and the A* pathfinding around restricted areas is not required for this particular combination. Figure 5b illustrates the procedure using , as an example. Green-marked location candidates permit direct paths, given one example hotspot at Lake Geierswalde. Red borders show interruptions due to the occupancy envelope, respectively, invalid direct paths.
With these two steps, all UAV hangar candidates without valid connections have been removed, and the shortest path to all candidates with unrestricted straight connections have been successfully found. Accordingly, only the candidates with the same connected-component label in Figure 5a and intersecting with the occupancy envelope in Figure 5b require calculating a restriction-free path with the A* algorithm in the two-dimensional discretized operation space. Horizontal, vertical, and diagonal movements are allowed. The cumulative great circle distance of the georeferenced path nodes along the shortest path from each source to each sink was subsequently calculated, considering UAS geographical zones for all .
3. Results
Using and planned UAV hangar facilities as examples, we demonstrate the resulting optimal locations according to eqs. (8)–(11), and compare their performance with the remaining candidates. For the shortest path calculation, the two methods described in Section 2.4, cf. Figure 5, predetermine 100% of the distances for , 79.89% for , 73.94% for , 66.51% for and 47.15% for , resulting in a significant reduction of the computational time. The remaining shortest paths are calculated with an A* algorithm to determine for eq. (6).
Figure 6 visualizes the accessibility score derived from the accessibility from eqs. (8)–(11) normalized over all n and m based on the maximum number of accessible hotspots. indicates that any hotspot cannot be reached over all scenarios m and n, while represents the hangar location with the most accessible hotspots over all scenarios. Different shades of gray indicate the UAS geographical zones depending on the different scenarios n.
Since some hotspots, e.g., , are located inside UAS geographical zones, they cannot be reached from any location candidate in those scenarios containing this particular UAS geographical zone. For , all hotspots are located outside UAS geographical zones, so they can be served as desired. For , two hotspots are inside a UAS geographical zone, reducing the maximum accessible hotspots to 25. In this case, the inaccessible hotspots are removed from the score, resulting in for the best candidates. Analogously, a maximum of hotspots is achievable for all n. So for , five potential locations exist that cover the most hotspots across all scenarios and . Table 6 shows the resulting number of hotspots covered by them.
Figure 7 summarizes per wind scenario m, in which the zero- and low-wind cases provide a high median accessibility of approx. 60% for all location candidates. Furthermore, the optimal locations for both and guarantee 100% accessibility in all wind scenarios except , where the optimal solution for achieves an mean accessibility of approx. 65%. In this high-wind-high-turbulence case, E is smaller than a subset j of , so some hotspots cannot be reached in such weather conditions.
For analyzing the SAR performance, we compute the service time in [s], which is the duration until the search mission ends and the return to the UAV hangar starts. Thus, it indicates the worst case until the person in distress will be discovered in the search area, with:
Figure 8 summarizes the service times across all for all as a box plot. As indicated by the markers, the and optimized locations provide excellent service times compared to all other candidates, significantly below the median and close to the minimum for each hotspot. This results in a decrease from the average service time of 570.4 s for all facility candidates and weather scenarios to 351.1 s for and 287.2 s for , respectively. Only hotspots to , located at the farther side of Lake Partwitz, cf. Figure 9, show a slightly worse service time due to the balanced optimization among all hotspots.
Figure 9 shows the optimal location for , satisfying eqs. (8)–(11), and the shortest flight paths from the optimal facility to all hotspots while respecting the UAS geographical zones, using as an example. The heatmap indicates the average service time to all j across all and as a normalized score for all facility candidates with indicating near-optimal locations with a slightly inferior result, which may be used as alternatives if the optimal location is not available for building the UAV hangar.
For , 40 possible combinations of candidates achieve the maximum accessibility score. Figure 10 shows the combination satisfying eq. (8). The plotted paths indicate the hotspot assignment according to eqs. (9)–(11) for as an example. This assignment is part of the optimization process and represents the shortest service time in each case. However, for operational reasons, the other facility may also serve the hotspot if satisfying eq. (7). Furthermore, the service time eq. (12) is significantly better compared to , especially for hotspots to , cf. Figure 8.
4. Discussion
4.1. Validation of the Hotspots Obtained from Open Source Data
As described before, the determination of the hotspots is built on public georeferenced data. As the RescueFly project also plans to install emergency phones around the two lakes, an inspection of the shorelines has been conducted. Those observations serve to validate the hotspots generated from the open-source data to identify possible shortcomings. The inspection found most of the OSM hotspots to be suitable. However, the northernmost hotspot is a larger beach area, which OSM identifies as a single point (with tag leisure=beach_resort, see Figure 6), which underestimates the search area at Lake Partwitz. Furthermore, the inspection found the marinas at both lakes to be less significant for the aims of RescueFly, as swimmers are not expected in these areas. However, it may be argued that a marina still induces the risk of water-related incidents according to our initial assumptions.
For the validation of our open-source approach, we computed the service times from our optimal UAV hangar locations for and with the hotspots from the inspection. For , the previously determined UAV hangar location performs better than 94.9% of the candidates. Furthermore, the average service time per hotpots increased from 400 s to 421 s for and from 307 s to 311 s for . Thus, the determined UAV hangar locations are close to optimal even if a few nearby areas are added afterwards.
Our methodology is purposely based on open-source data, as it should be applicable to any similar problem without needing an inspection. Especially for , an error of 4 s in the average service time is deemed to be very low. Yet, it highlights the need for validation of the input data, especially on community-drive platforms like OSM.
4.2. Analysis of the Applicability of the Hangar Locations
Using open-source data, we demonstrated a fast and robust method for optimizing UAV hangar locations considering restrictive areas and wind scenarios. The optimal locations show significantly greater accessibility and lower service time than the other hangar location candidates. Furthermore, the rescue times are significantly below the maximum response time regulated for each federal state in Germany. Typically, rescue stations shall be established to reach any emergency site along a public road within 15 min for of all annual cases, e.g., in Brandenburg [38]. Consequently, emergency services should arrive at the closest public road to the accident site at the lake in about 900 s. Then, additional time is required to reach the shoreline area, which may be difficult to access, and the SAR time in the water. With the optimal UAV hangar locations, average service times over all for of s and s, respectively, were achieved. During this time, the UAV will provide a flotation device to the person in distress. Thus, it reacts earlier than required, provides measures to increase survivability, and guides emergency responders to the right location faster. If even faster UAV responses are deemed necessary, a maximum permissible service time may serve as an additional constraint to our optimization model.
However, the currently defined standard SAR mission uses a worst-case approach in which an unfavorable wind delays the arrival of the UAV at the hotspot, and the person in distress is only detected after the search area has been overflown completely. For the facility location problem, we deem this assumption effective as the given service times are guaranteed even in adverse situations. In reality, the person in distress will be detected earlier in most cases, especially if the distress call specifies the position with sufficient precision or the wind accelerates the UAV on the approach. Furthermore, the search phase may be accelerated by surveying the area on approach and selecting an appropriate search pattern based on the current conditions, e.g., the number of persons in the water, precision of the emergency call, and wind conditions. Such a refinement from the standard SAR mission to a case-by-case mission trajectory will be studied further to enable online mission planning in RescueFly.
The currently used positive and negative location factors are selected according to the needs of the UAV hangar FLP, but also based on data availability. Accordingly, the electricity supply and property situation could not be assessed, as the required data is not accessible to the public. However, if suitable information will be available, our methodology is able to incorporate it as another data layer in the optimization. Additionally, our work provides a set of second-best options based on in case the optimal spot is unavailable, as indicated by the heatmap in Figure 9.
5. Conclusions
The identified UAV hangar locations are an optimal solution concerning the determined hotspots, the derived positive and negative location factors, and the defined standard SAR mission. Thus, optimal coverage is provided in these hotspot areas. Nevertheless, the RescueFly concept of operations also plans SAR missions outside these hotspot areas. Therefore, our concept of hotspots successfully prioritizes areas with a high probability of swimming accidents. However, it does not exclude the UAV from operating over other parts of the lakes. The accessibility of eq. (7) indicates if the endurance permits these operations, given the selected UAS geographical zones and wind scenario.
Next, we plan to integrate a UAV flight performance model for a more precise estimation of the energy consumption, thus, considering the UAV endurance as a dynamic value affected by the weather and other operating conditions. In addition, the RescueFly project partners work on the automated recognition of persons in distress, leading to a more precise definition of the standard SAR mission. Finally, flight demonstrations are planned for the proof of concept.
Author Contributions
Conceptualization, H.B. and T.Z.; methodology, H.B. and T.Z.; software, H.B.; validation, H.B. and T.Z.; formal analysis, H.B.; investigation, H.B. and T.Z.; resources, H.B., T.Z. and H.F.; data curation, H.B.; writing—original draft preparation, H.B. and T.Z.; writing—review and editing, H.B., T.Z., A.E. and H.F.; visualization, H.B. and T.Z.; supervision, H.F.; project administration, H.F.; funding acquisition, H.F. All authors have read and agreed to the published version of the manuscript.
Funding
The research is part of the project ‘RescueFly’, number 45ILM1016D, which is funded by the German Federal Ministry for Digital and Transport.
Informed Consent Statement
Informed consent was obtained from all subjects involved in the study.
Data Availability Statement
The study relies on open source data, as indicated in the document. The corresponding authors may provide assistance on request.
Acknowledgments
The authors like to thank Joachim von Beesten of Björn Steiger Stifung SbR, and Thomas Zügel of THOLEG Civil Protection Systems for surveying the lake area to validate the hotspot locations.
Conflicts of Interest
The authors declare no conflict of interest.
| 1 | |
| 2 | German Federal Regulation for aircraft operations, which supplements EU 2019/947. |
| 3 | |
| 4 | |
| 5 | |
| 6 | |
| 7 |
References
- World Health Organization. Drowning. https://www.who.int/news-room/fact-sheets/detail/drowning, 2021.
- Jahresbericht 2021. Technical report, Deutsche Lebens-Rettungs-Gesellschaft e.V. (DLRG), Bad Nenndorf, 2021.
- Commission Implementing Regulation (EU) 2019/947 of 24 May 2019 on the Rules and Procedures for the Operation of Unmanned Aircraft, 2019.
- Esri. "World Imagery" [Basemap]. Scale Not Given. https://www.arcgis.com/apps/mapviewer/index.html?layers=10df2279f9684e4a9f6a7f08febac2a9, Janary 19, 2023.
- Land Brandenburg. Geoportal Brandenburg: Start. https://geoportal.brandenburg.de/de/cms/portal/start, 2023.
- Bundesministerium für Digitales und Verkehr. Digital Platform for Unmanned Aviation (Dipul). https://maptool-dipul.dfs.de/, 2023.
- Ajgaonkar, K.; Khanolkar, S.; Rodrigues, J.; Shilker, E.; Borkar, P.; Braz, E. Development of a Lifeguard Assist Drone for Coastal Search and Rescue. In Proceedings of the Global Oceans 2020: Singapore – U.S. Gulf Coast, 2020, pp. 1–10. [CrossRef]
- Seguin, C.; Blaquière, G.; Loundou, A.; Michelet, P.; Markarian, T. Unmanned Aerial Vehicles (Drones) to Prevent Drowning. Resuscitation 2018, 127, 63–67. [Google Scholar] [CrossRef] [PubMed]
- Dufek, J.; Murphy, R. Visual Pose Estimation of USV from UAV to Assist Drowning Victims Recovery. In Proceedings of the 2016 IEEE International Symposium on Safety, Security, and Rescue Robotics (SSRR), 2016, pp. 147–153. [CrossRef]
- Liu, Z.; Chen, H.; Wen, Y.; Xiao, C.; Chen, Y.; Sui, Z. Mode Design and Experiment of Unmanned Aerial Vehicle Search and Rescue in Inland Waters *. In Proceedings of the 2021 6th International Conference on Transportation Information and Safety (ICTIS), 2021, pp. 917–922. [CrossRef]
- Ruetten, L.; Regis, P.A.; Feil-Seifer, D.; Sengupta, S. Area-Optimized UAV Swarm Network for Search and Rescue Operations. In Proceedings of the 2020 10th Annual Computing and Communication Workshop and Conference (CCWC), 2020, pp. 0613–0618. [CrossRef]
- Brühl, R.; Fricke, H.; Schultz, M. Air Taxi Flight Performance Modeling and Application. In Proceedings of the USA/Europe ATM R&D Seminar, 2021.
- Chu, T.; Starek, M.J.; Berryhill, J.; Quiroga, C.; Pashaei, M. Simulation and Characterization of Wind Impacts on sUAS Flight Performance for Crash Scene Reconstruction. Drones 2021, 5, 67. [Google Scholar] [CrossRef]
- Lin, L.; Goodrich, M.A. UAV Intelligent Path Planning for Wilderness Search and Rescue. In Proceedings of the 2009 IEEE/RSJ International Conference on Intelligent Robots and Systems, 2009, pp. 709–714. [CrossRef]
- Hayat, S.; Yanmaz, E.; Brown, T.X.; Bettstetter, C. Multi-Objective UAV Path Planning for Search and Rescue. In Proceedings of the 2017 IEEE International Conference on Robotics and Automation (ICRA), 2017, pp. 5569–5574. [CrossRef]
- Wang, C.; Liu, P.; Zhang, T.; Sun, J. The Adaptive Vortex Search Algorithm of Optimal Path Planning for Forest Fire Rescue UAV. In Proceedings of the 2018 IEEE 3rd Advanced Information Technology, Electronic and Automation Control Conference (IAEAC), 2018, pp. 400–403. [CrossRef]
- Zuo, J.; Chen, J.; Li, Z.; Li, Z.; Liu, Z.; Han, Z. Research on Maritime Rescue UAV Based on Beidou CNSS and Extended Square Search Algorithm. In Proceedings of the 2020 International Conference on Communications, Information System and Computer Engineering (CISCE), 2020, pp. 102–106. [CrossRef]
- Liang, Y.; Xu, W.; Liang, W.; Peng, J.; Jia, X.; Zhou, Y.; Duan, L. Nonredundant Information Collection in Rescue Applications via an Energy-Constrained UAV. IEEE Internet of Things Journal 2019, 6, 2945–2958. [Google Scholar] [CrossRef]
- Dakulović, M.; Horvatić, S.; Petrović, I. Complete Coverage D* Algorithm for Path Planning of a Floor-Cleaning Mobile Robot. IFAC Proceedings Volumes 2011, 44, 5950–5955. [Google Scholar] [CrossRef]
- Xu, P.F.; Ding, Y.X.; Luo, J.C. Complete Coverage Path Planning of an Unmanned Surface Vehicle Based on a Complete Coverage Neural Network Algorithm. Journal of Marine Science and Engineering 2021, 9, 1163. [Google Scholar] [CrossRef]
- Sun, Y.; Tan, Q.; Yan, C.; Chang, Y.; Xiang, X.; Zhou, H. Multi-UAV Coverage through Two-Step Auction in Dynamic Environments. Drones 2022, 6, 153. [Google Scholar] [CrossRef]
- Qingqing, L.; Taipalmaa, J.; Queralta, J.P.; Gia, T.N.; Gabbouj, M.; Tenhunen, H.; Raitoharju, J.; Westerlund, T. Towards Active Vision with UAVs in Marine Search and Rescue: Analyzing Human Detection at Variable Altitudes. In Proceedings of the 2020 IEEE International Symposium on Safety, Security, and Rescue Robotics (SSRR), 2020, pp. 65–70. [CrossRef]
- Rudol, P.; Doherty, P. Human Body Detection and Geolocalization for UAV Search and Rescue Missions Using Color and Thermal Imagery. In Proceedings of the 2008 IEEE Aerospace Conference, 2008, pp. 1–8. [CrossRef]
- Bejiga, M.B.; Zeggada, A.; Nouffidj, A.; Melgani, F. A Convolutional Neural Network Approach for Assisting Avalanche Search and Rescue Operations with UAV Imagery. Remote Sensing 2017, 9, 100. [Google Scholar] [CrossRef]
- Lygouras, E.; Santavas, N.; Taitzoglou, A.; Tarchanidis, K.; Mitropoulos, A.; Gasteratos, A. Unsupervised Human Detection with an Embedded Vision System on a Fully Autonomous UAV for Search and Rescue Operations. Sensors 2019, 19, 3542. [Google Scholar] [CrossRef] [PubMed]
- Feraru, V.A.; Andersen, R.E.; Boukas, E. Towards an Autonomous UAV-based System to Assist Search and Rescue Operations in Man Overboard Incidents. In Proceedings of the 2020 IEEE International Symposium on Safety, Security, and Rescue Robotics (SSRR), 2020, pp. 57–64. [CrossRef]
- Liu, C.; Szirányi, T. Real-Time Human Detection and Gesture Recognition for On-Board UAV Rescue. Sensors 2021, 21, 2180. [Google Scholar] [CrossRef] [PubMed]
- Wang, S.; Han, Y.; Chen, J.; Zhang, Z.; Wang, G.; Du, N. A Deep-Learning-Based Sea Search and Rescue Algorithm by UAV Remote Sensing. In Proceedings of the 2018 IEEE CSAA Guidance, Navigation and Control Conference (CGNCC), 2018, pp. 1–5. [CrossRef]
- Cornuejols, G.; Nemhauser, G.; Wolsey, L. The uncapacitated, facility location problem. Discrete Location Theory 1990, p. 119–171.
- Shmoys, D. Approximation algorithms for facility location problems. Proceedings of the 3rd International Workshop on Approximation Algorithms for Combinatorial Optimization 2000, p. 27–33.
- Arya, V.; Garg, N.; Khandekar, R.; Meyerson, A.; Munagala, K.; Pandit, V. Local Search Heuristic for K-Median and Facility Location Problems. In Proceedings of the Proceedings of the Thirty-Third Annual ACM Symposium on Theory of Computing; Association for Computing Machinery: New York, NY, USA, 2001; STOC ’01, pp. 21–29. [CrossRef]
- Ahmadian, S.; Swamy, C. Improved Approximation Guarantees for Lower-Bounded Facility Location. CoRR 2011, abs/1104.3128, [1104.3128]. [CrossRef]
- Zhu, T.; Boyles, S.D.; Unnikrishnan, A. Two-stage robust facility location problem with drones. Transportation Research Part C: Emerging Technologies 2022, 137, 103563. [Google Scholar] [CrossRef]
- Lynskey, J.; Thar, K.; Oo, T.; Hong, C.S. Facility Location Problem Approach for Distributed Drones. Symmetry 2019, 11, 118. [Google Scholar] [CrossRef]
- Luftverkehrs-Ordnung Vom 29. Oktober 2015 (BGBl. I S. 1894), zuletzt geändert durch Artikel 2 Des Gesetzes Vom 14. Juni 2021 (BGBl. I S. 1766).
- Regulation (EU) 2018/1139 of the European Parliament and of the Council of 4 July 2018 on Common Rules in the Field of Civil Aviation and Establishing a European Union Aviation Safety Agency [...], 2018.
- van Dyck, L.E.; Kwitt, R.; Denzler, S.J.; Gruber, W.R. Comparing Object Recognition in Humans and Deep Convolutional Neural Networks—An Eye Tracking Study. Frontiers in Neuroscience 2021, 15. [Google Scholar] [CrossRef]
- Gesetz über den Rettungsdienst im Land Brandenburg (Brandenburgisches Rettungsdienstgesetz - BbgRettG) vom 14. Juli 2008.
Figure 1.
Area of interest in the Lusatian Lake District [4], with the 109 different open source layers, e.g. bodies of water (blue) [5], flight restriction zones (red), inhabited areas (yellow), and nature reserves (green) [6].
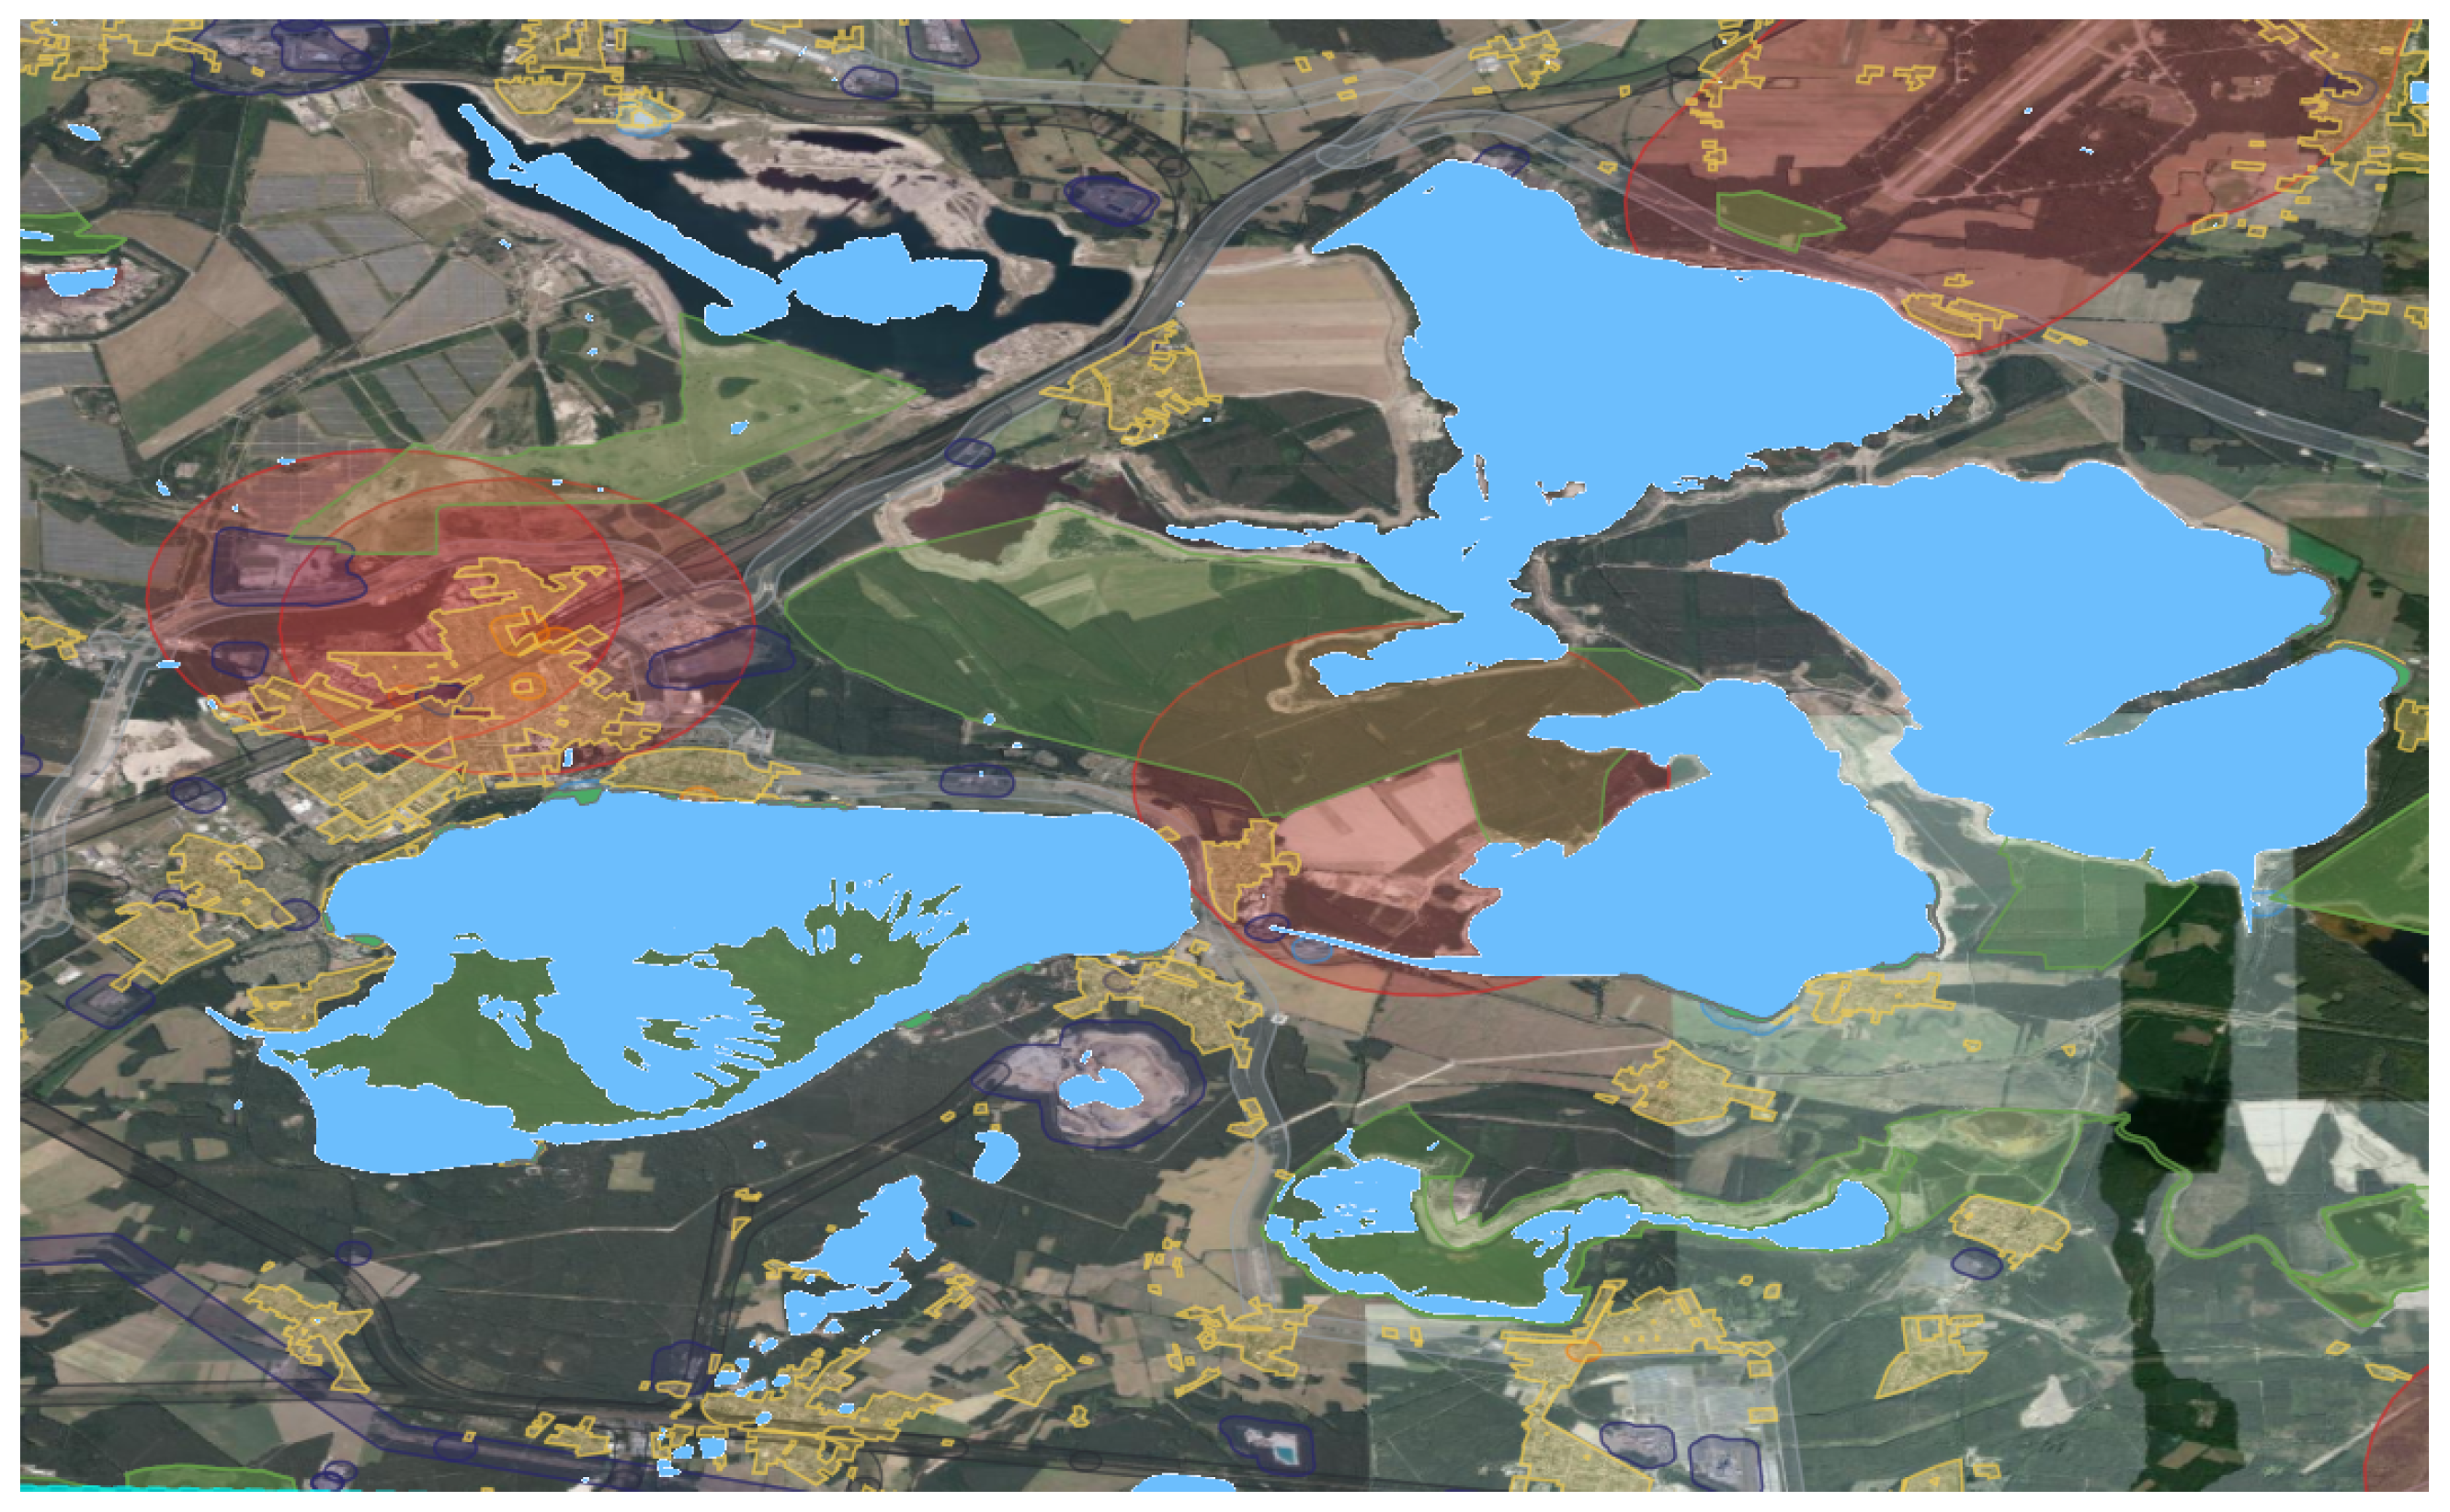
Figure 2.
Vertical profile of the standard SAR mission divided into the approach to the hotspot area, the search to cover the whole hotspot area and the return to the UAV hangar.
Figure 2.
Vertical profile of the standard SAR mission divided into the approach to the hotspot area, the search to cover the whole hotspot area and the return to the UAV hangar.
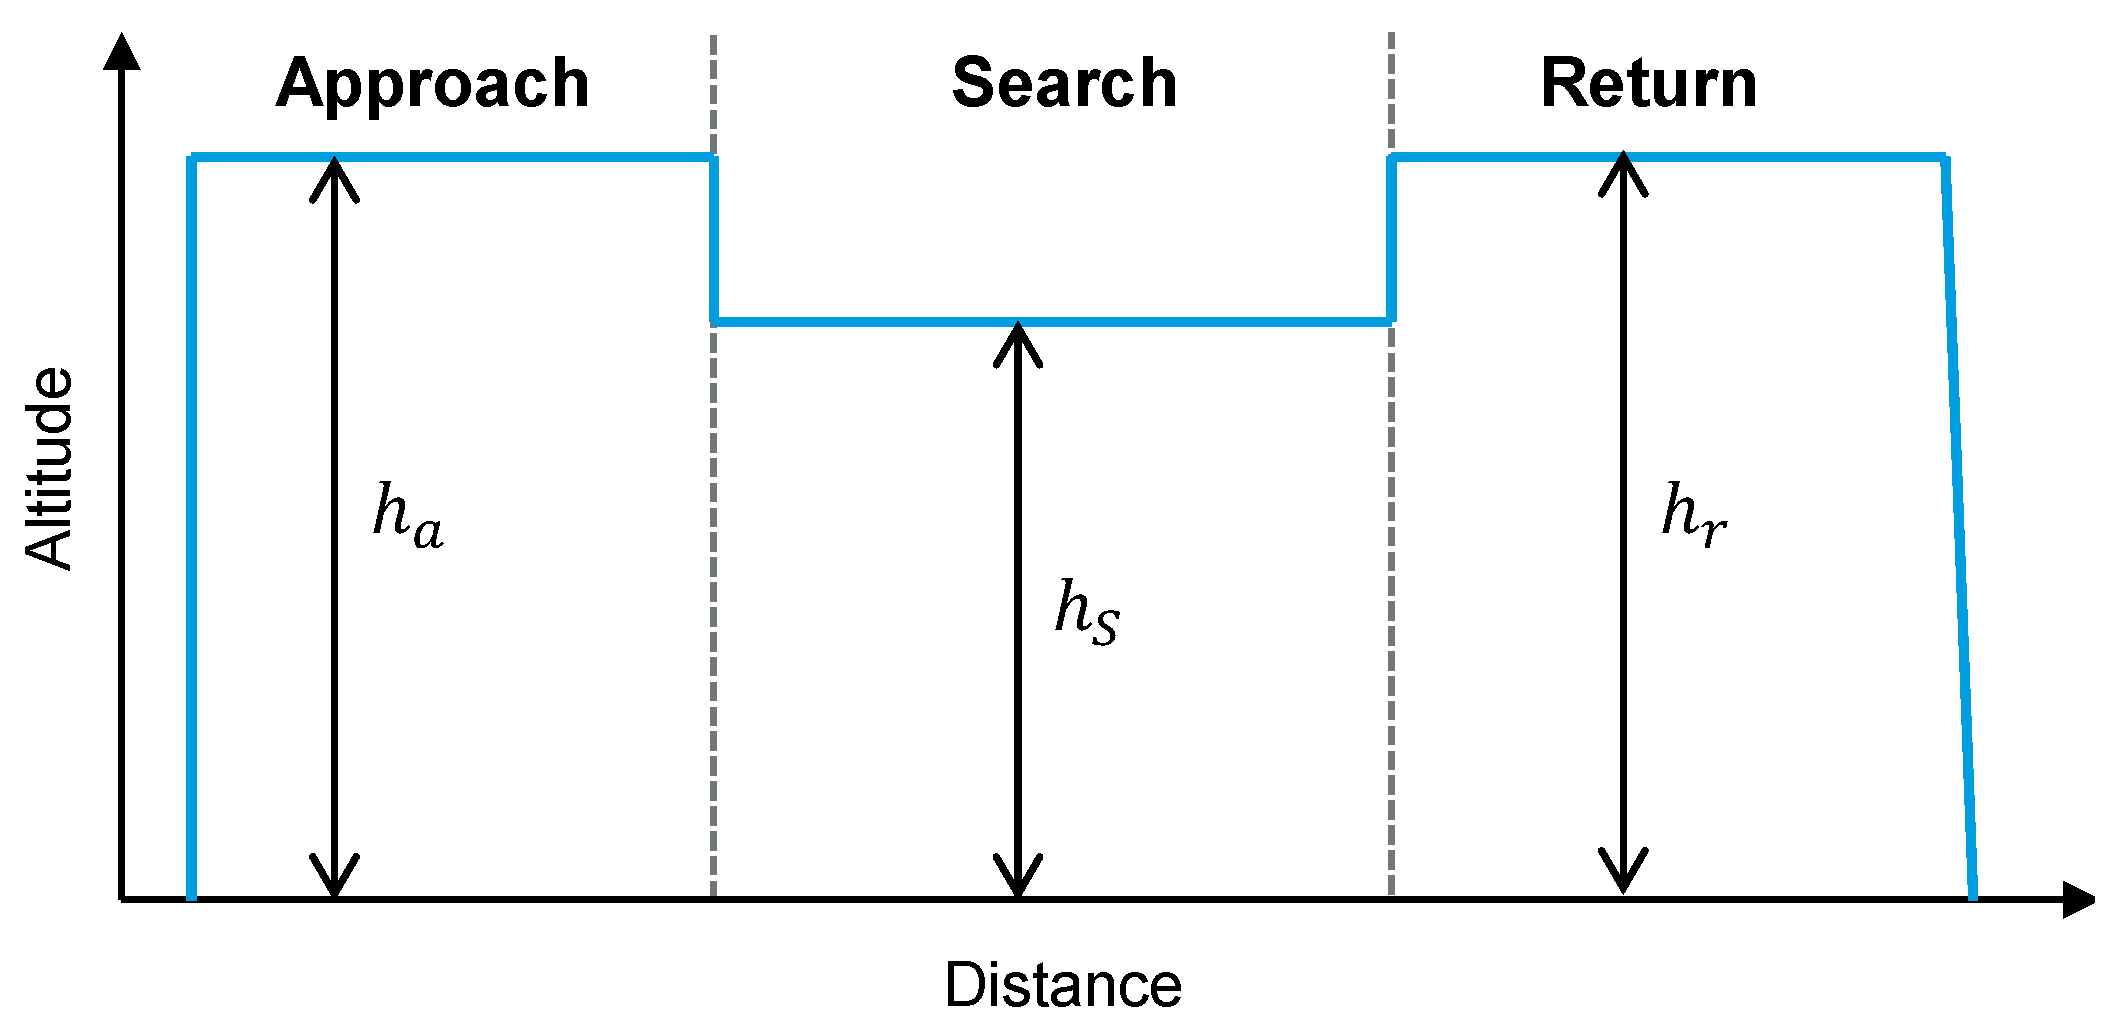
Figure 3.
Covered search surface in one image frame given with search width and length as a function of the camera’s lateral and vertical field of view ( and , respectively) for a defined search altitude .
Figure 3.
Covered search surface in one image frame given with search width and length as a function of the camera’s lateral and vertical field of view ( and , respectively) for a defined search altitude .
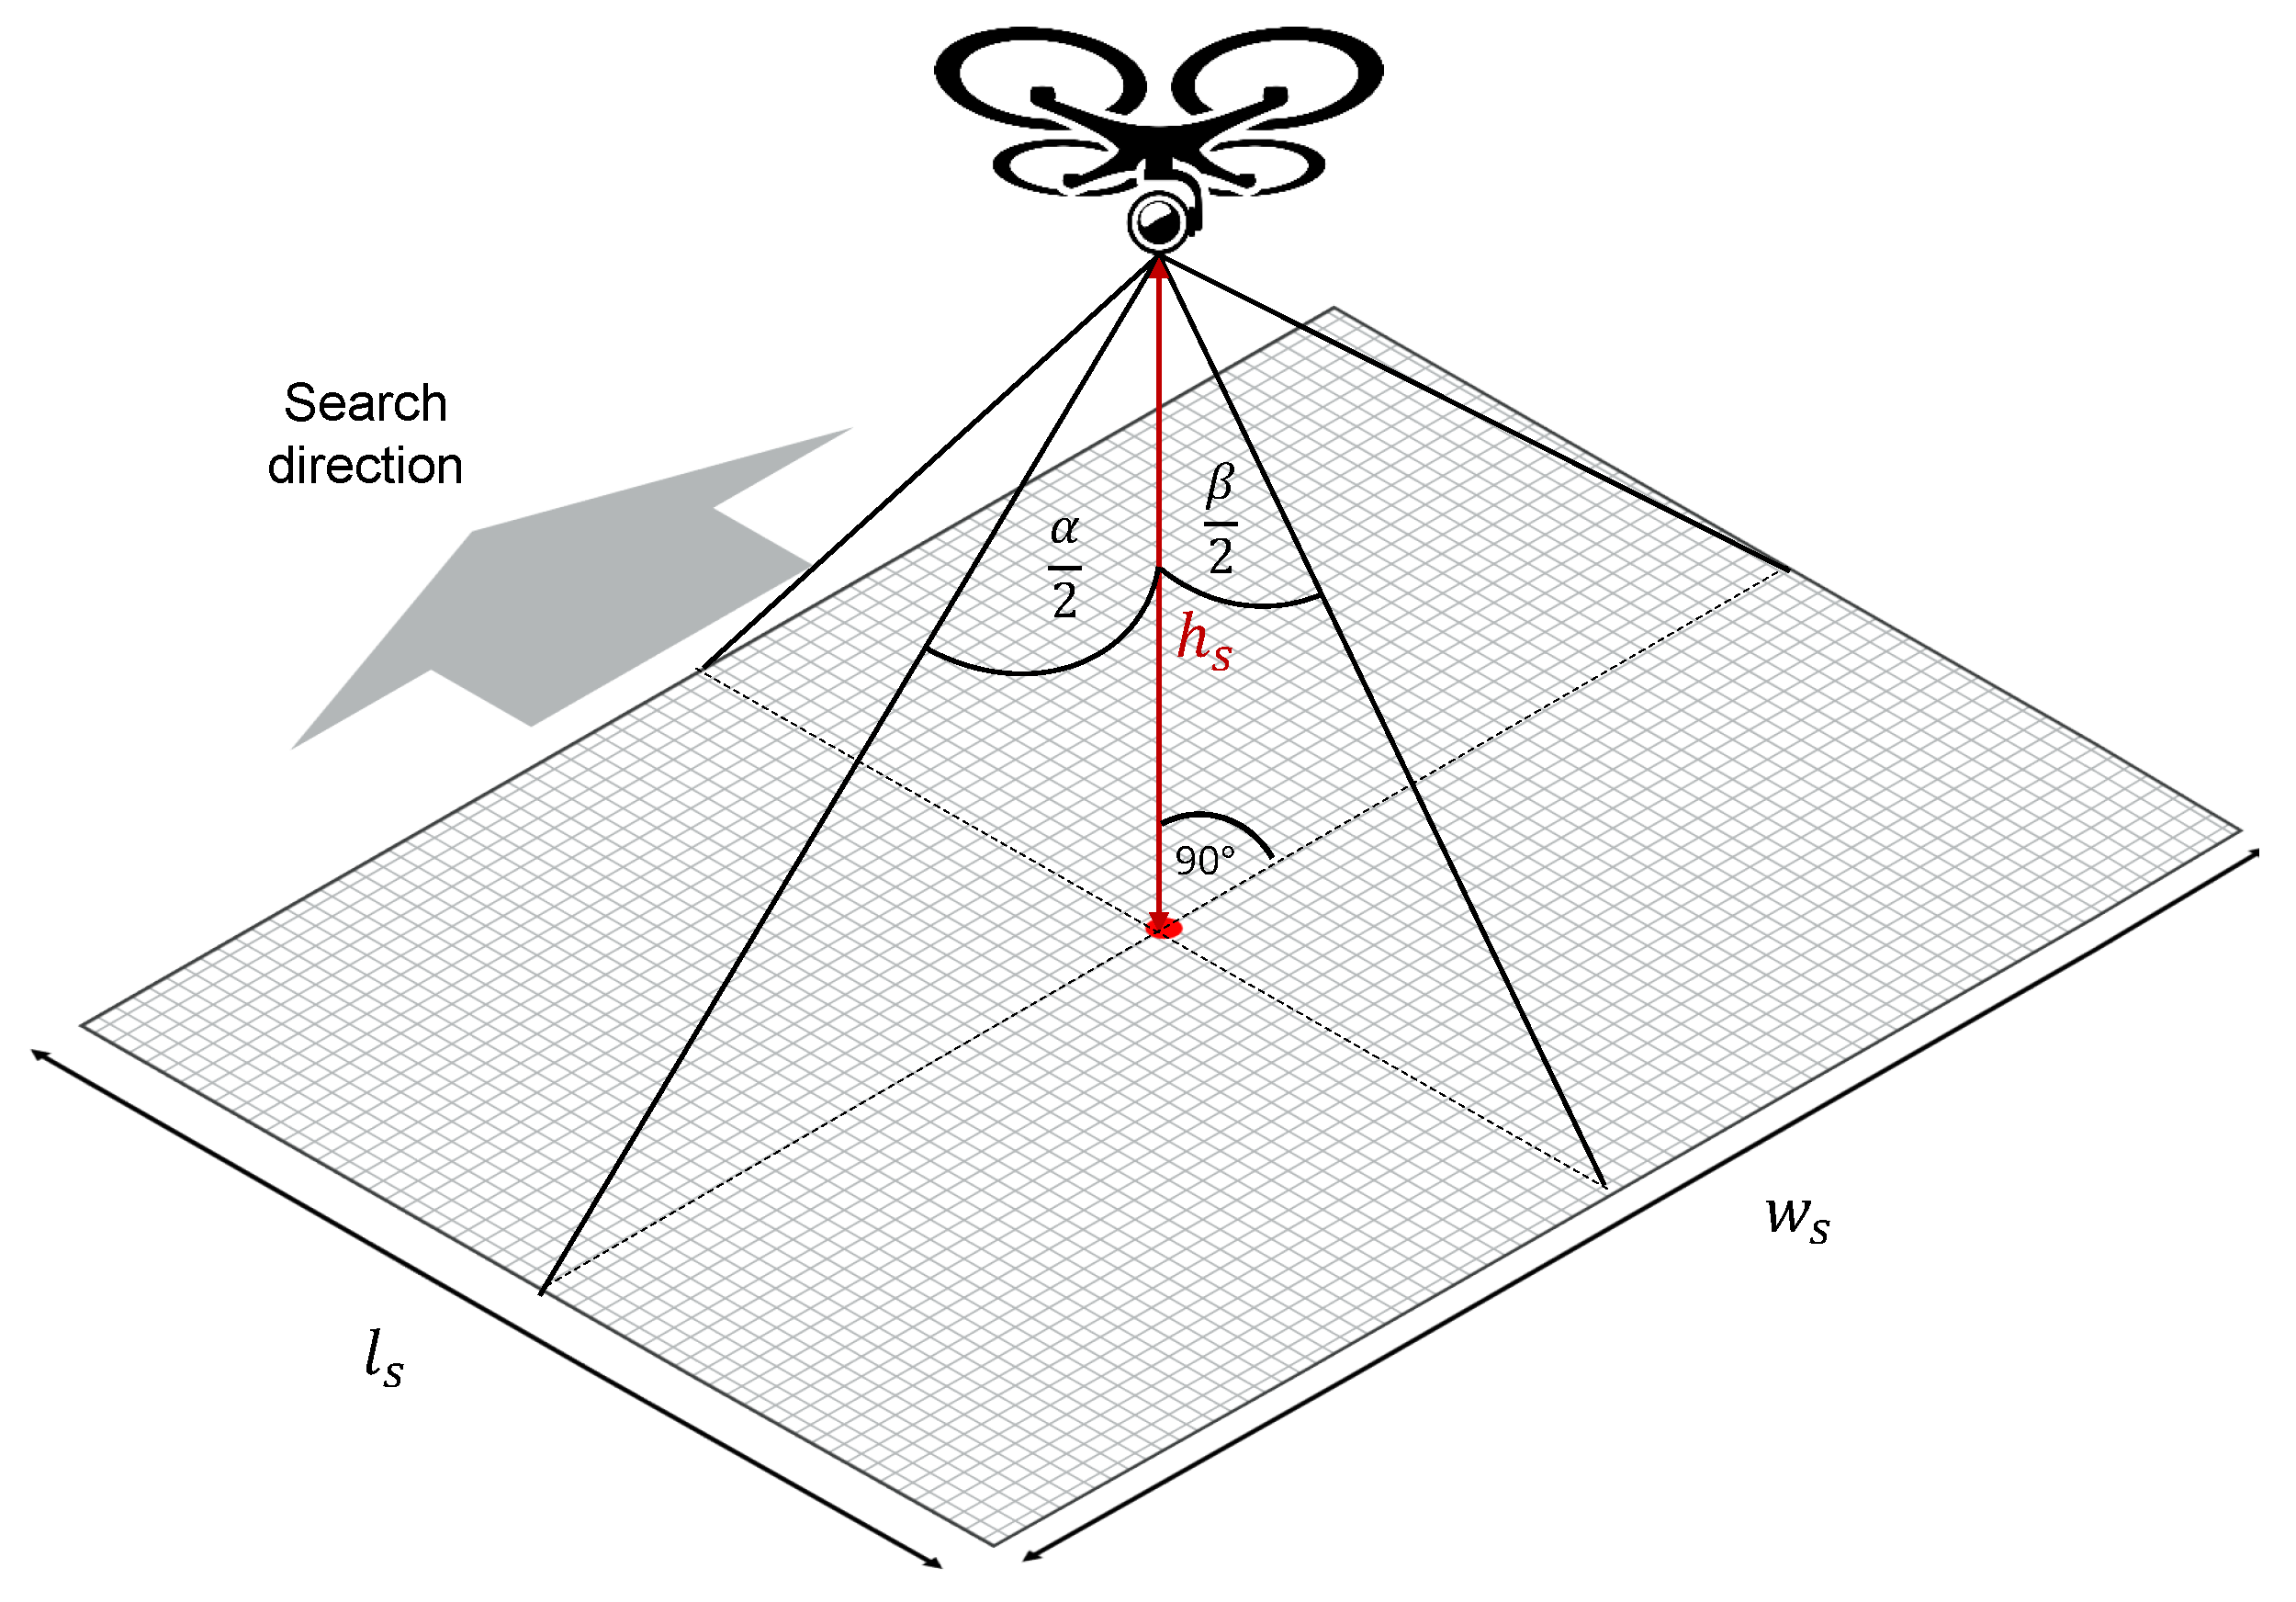
Figure 4.
Test images of swimmers at Lake Partwitz for the image detection with increasing resolutions from 5 px (left), to 250 px (middle), and 3300 px (right).
Figure 4.
Test images of swimmers at Lake Partwitz for the image detection with increasing resolutions from 5 px (left), to 250 px (middle), and 3300 px (right).
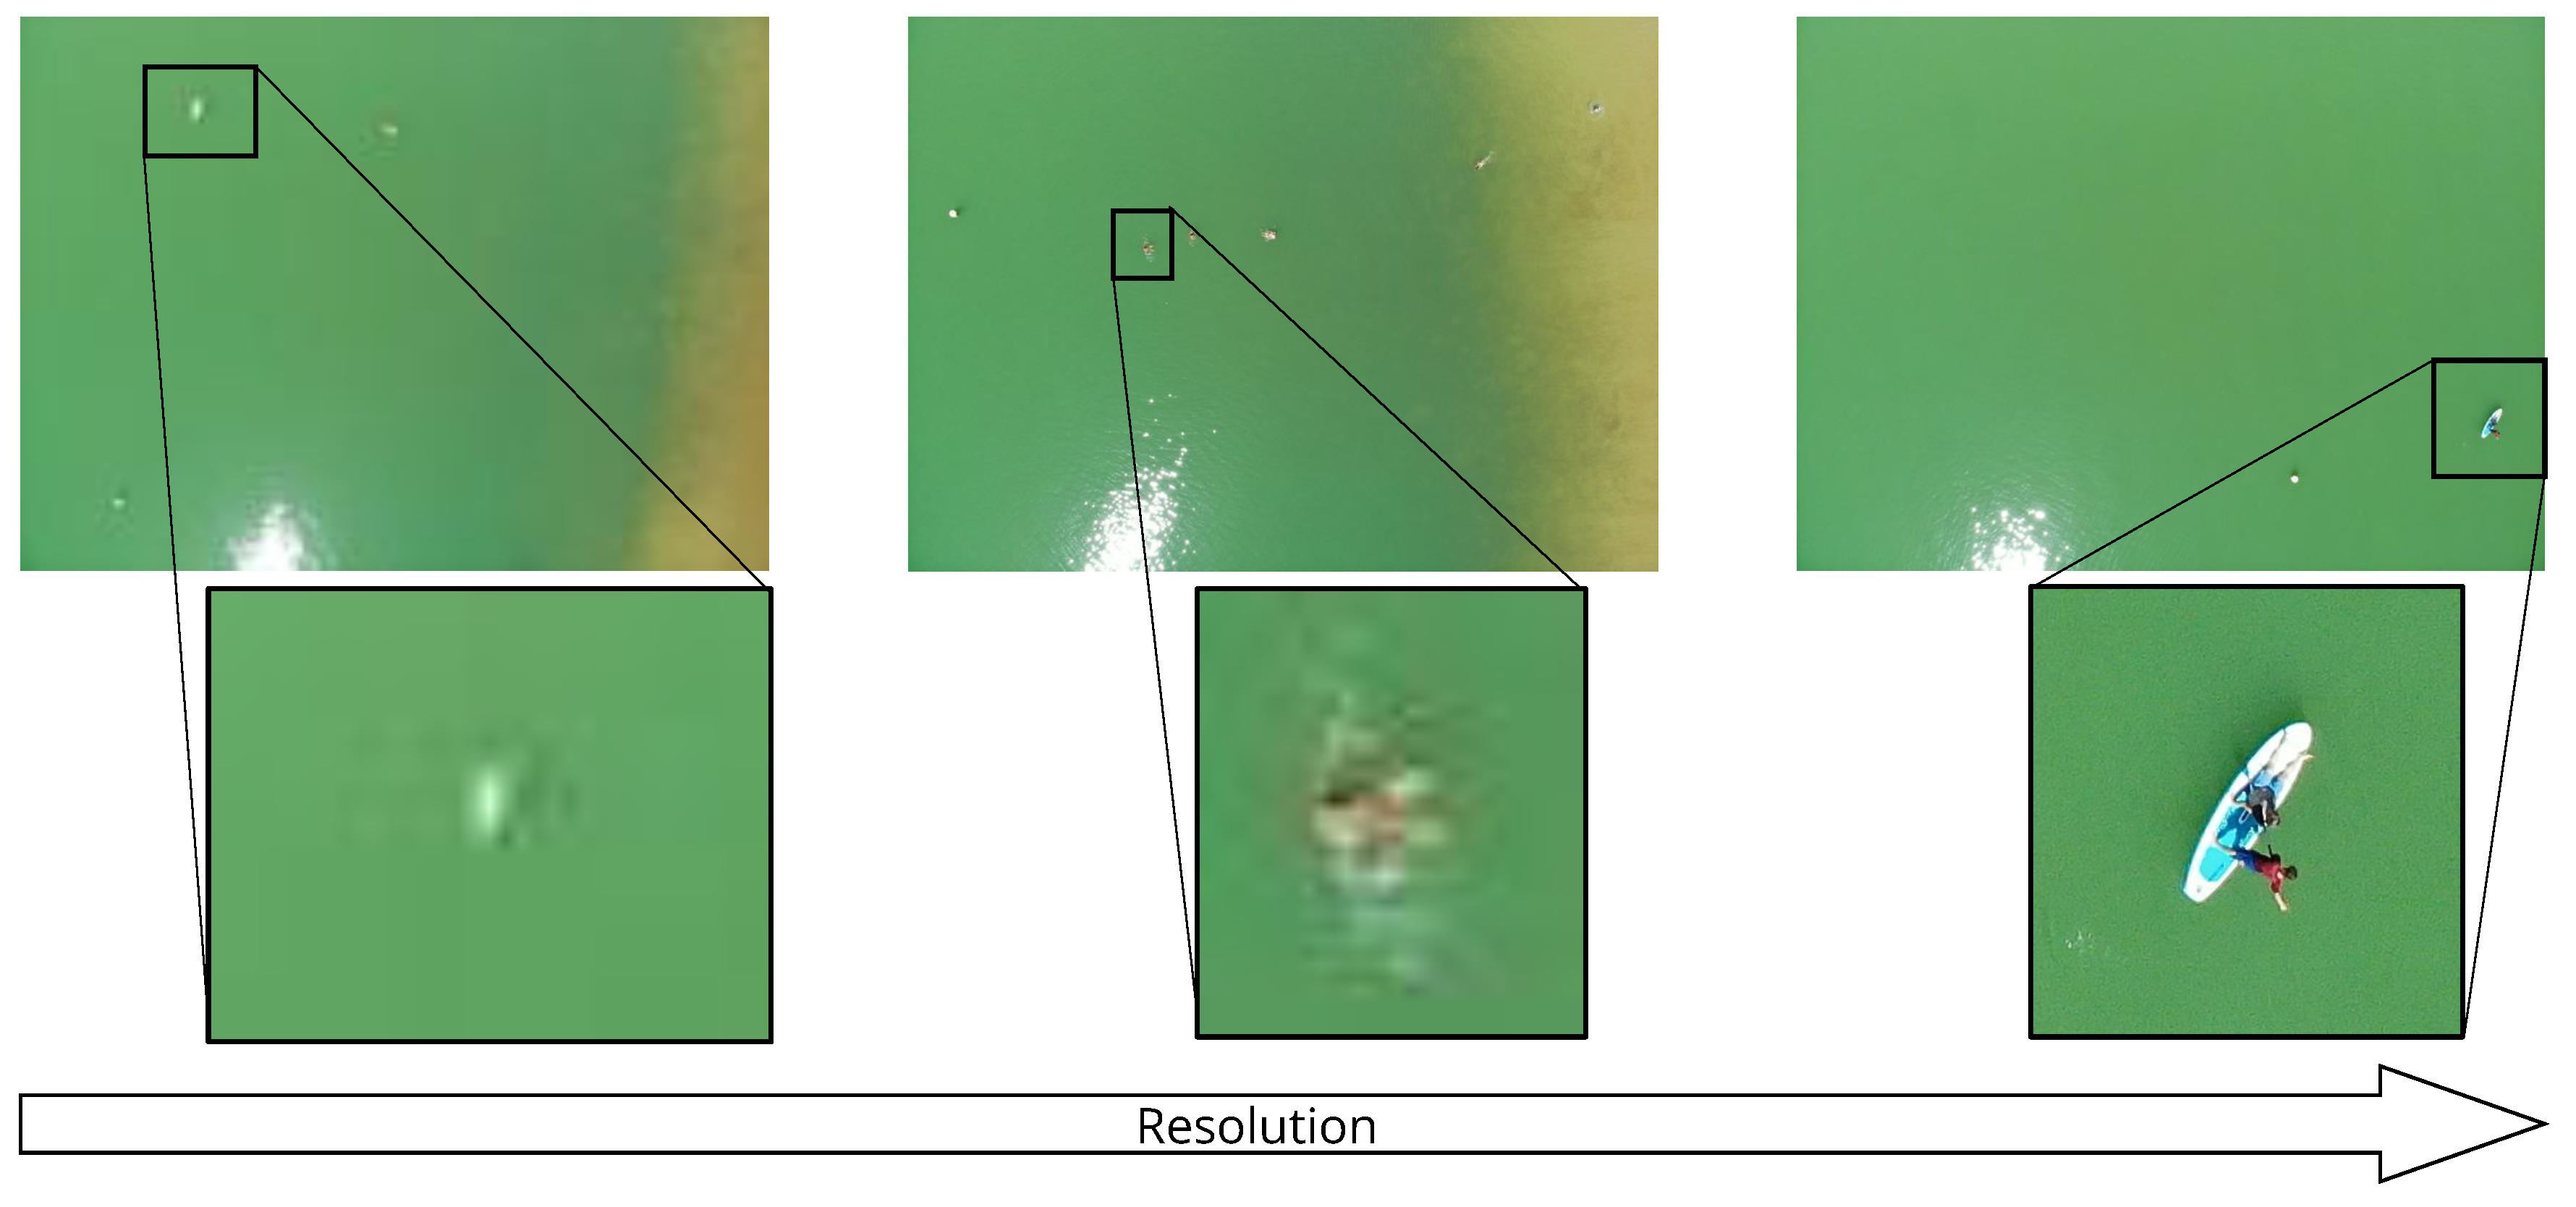
Figure 5.
Techniques to reduce the computational effort of the pathfinding: (a) Connected Component Labeling of the target area for (left), indicating all candidate locations (white dots) with valid connection in yellow, and invalid connections in other colors. (b) Ray Occupancy Intersection (right) for finding candidate locations with direct, hangar candidates with unrestricted flight paths (green) to one exemplary hotspot (red cross).
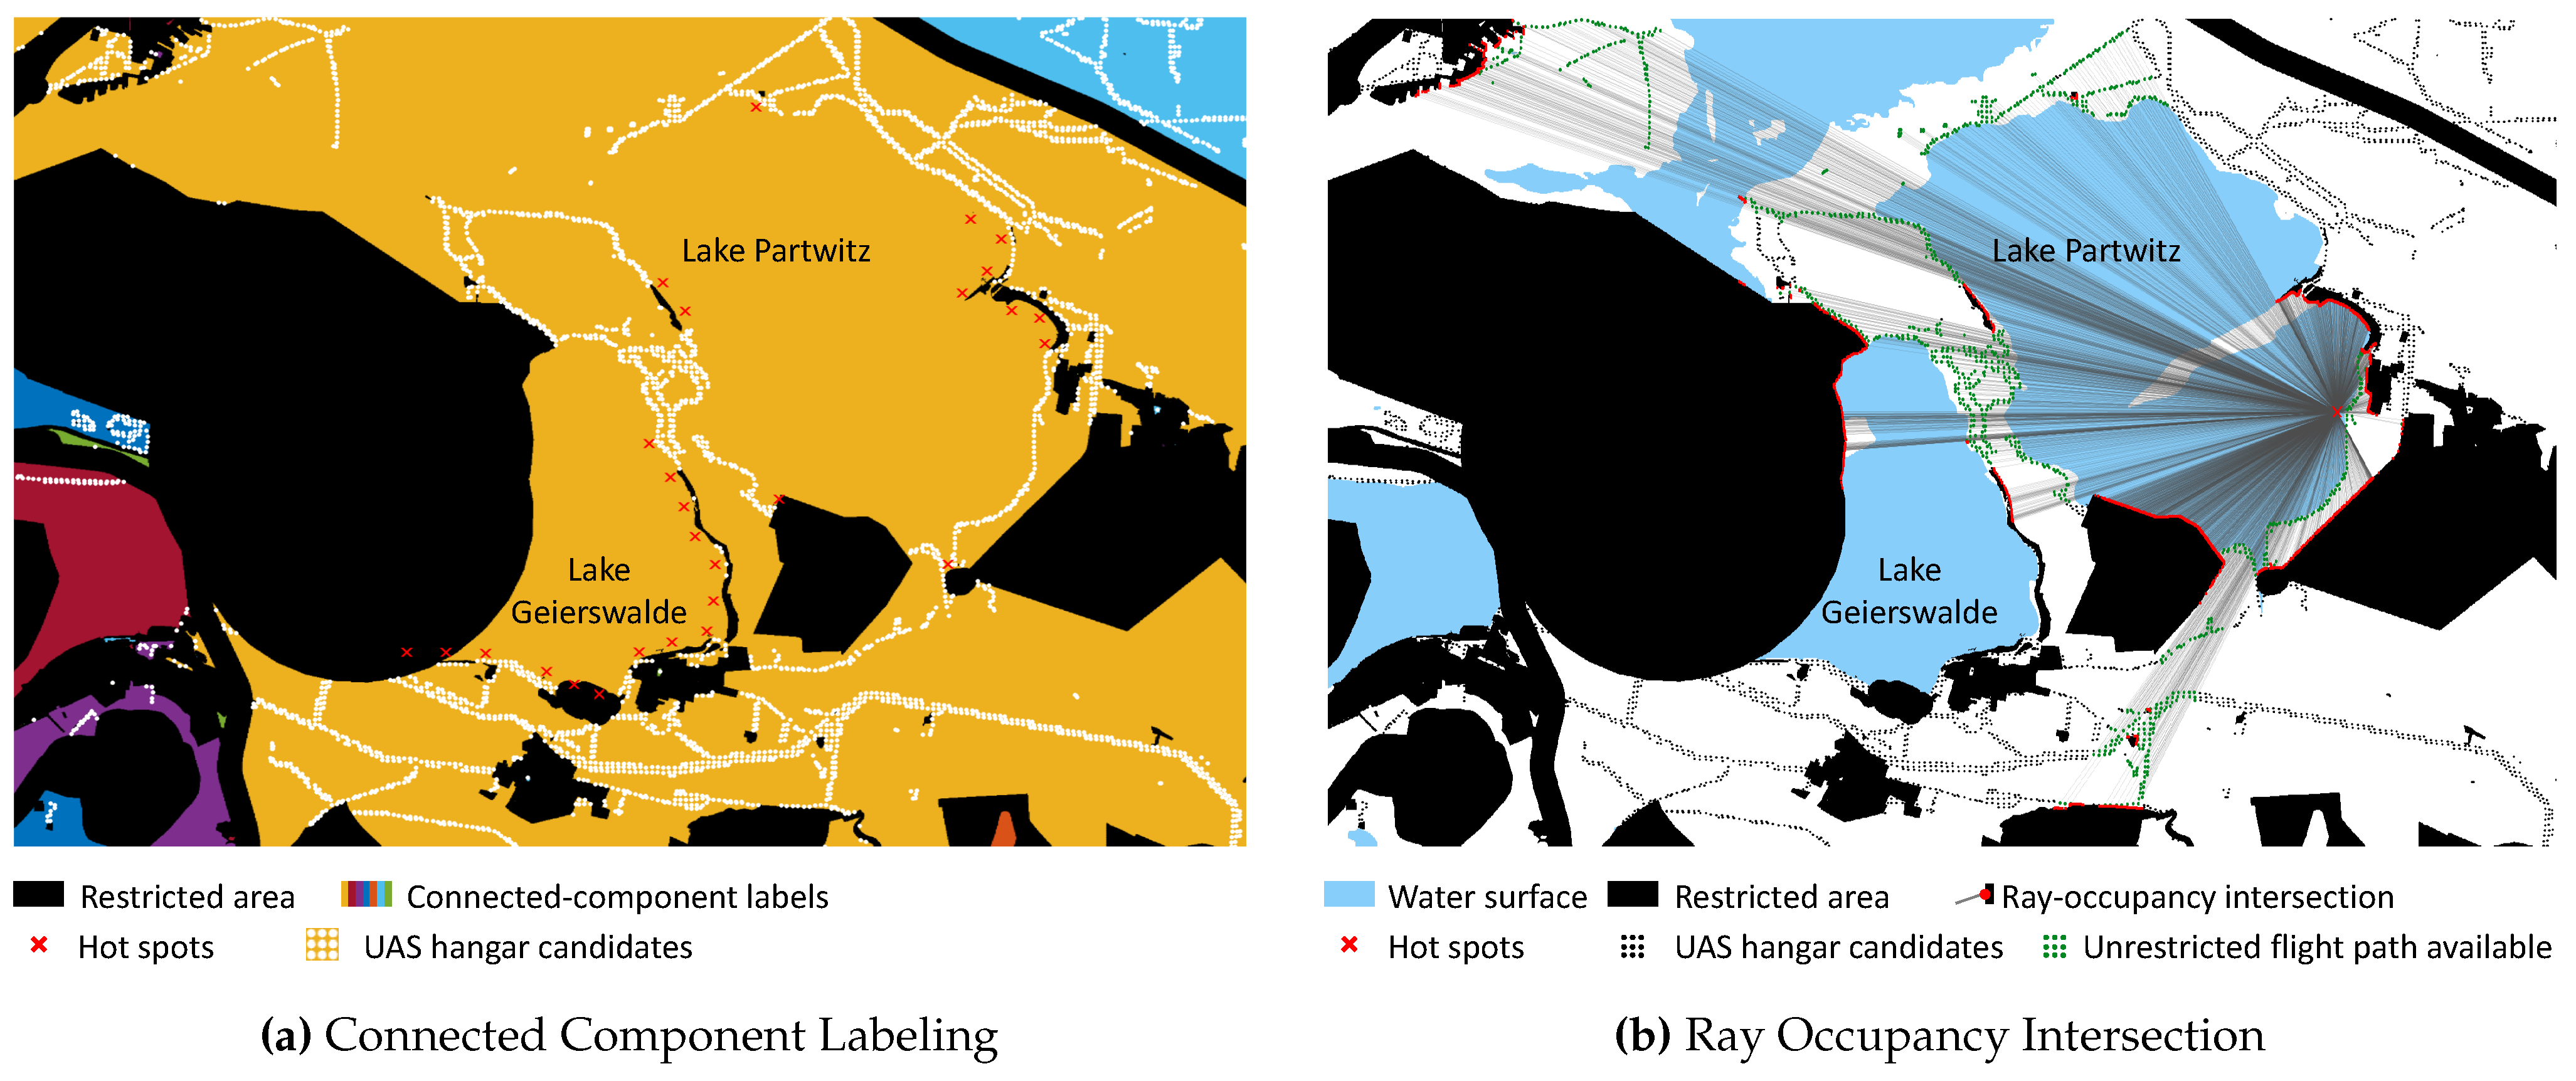
Figure 6.
Accessibility score for all UAV hangar location candidates, normalized over all hotspots, UAS geographical zones (gray-shaded areas) and weather scenarios, with for candidates with maximum access to the hotspots.
Figure 6.
Accessibility score for all UAV hangar location candidates, normalized over all hotspots, UAS geographical zones (gray-shaded areas) and weather scenarios, with for candidates with maximum access to the hotspots.
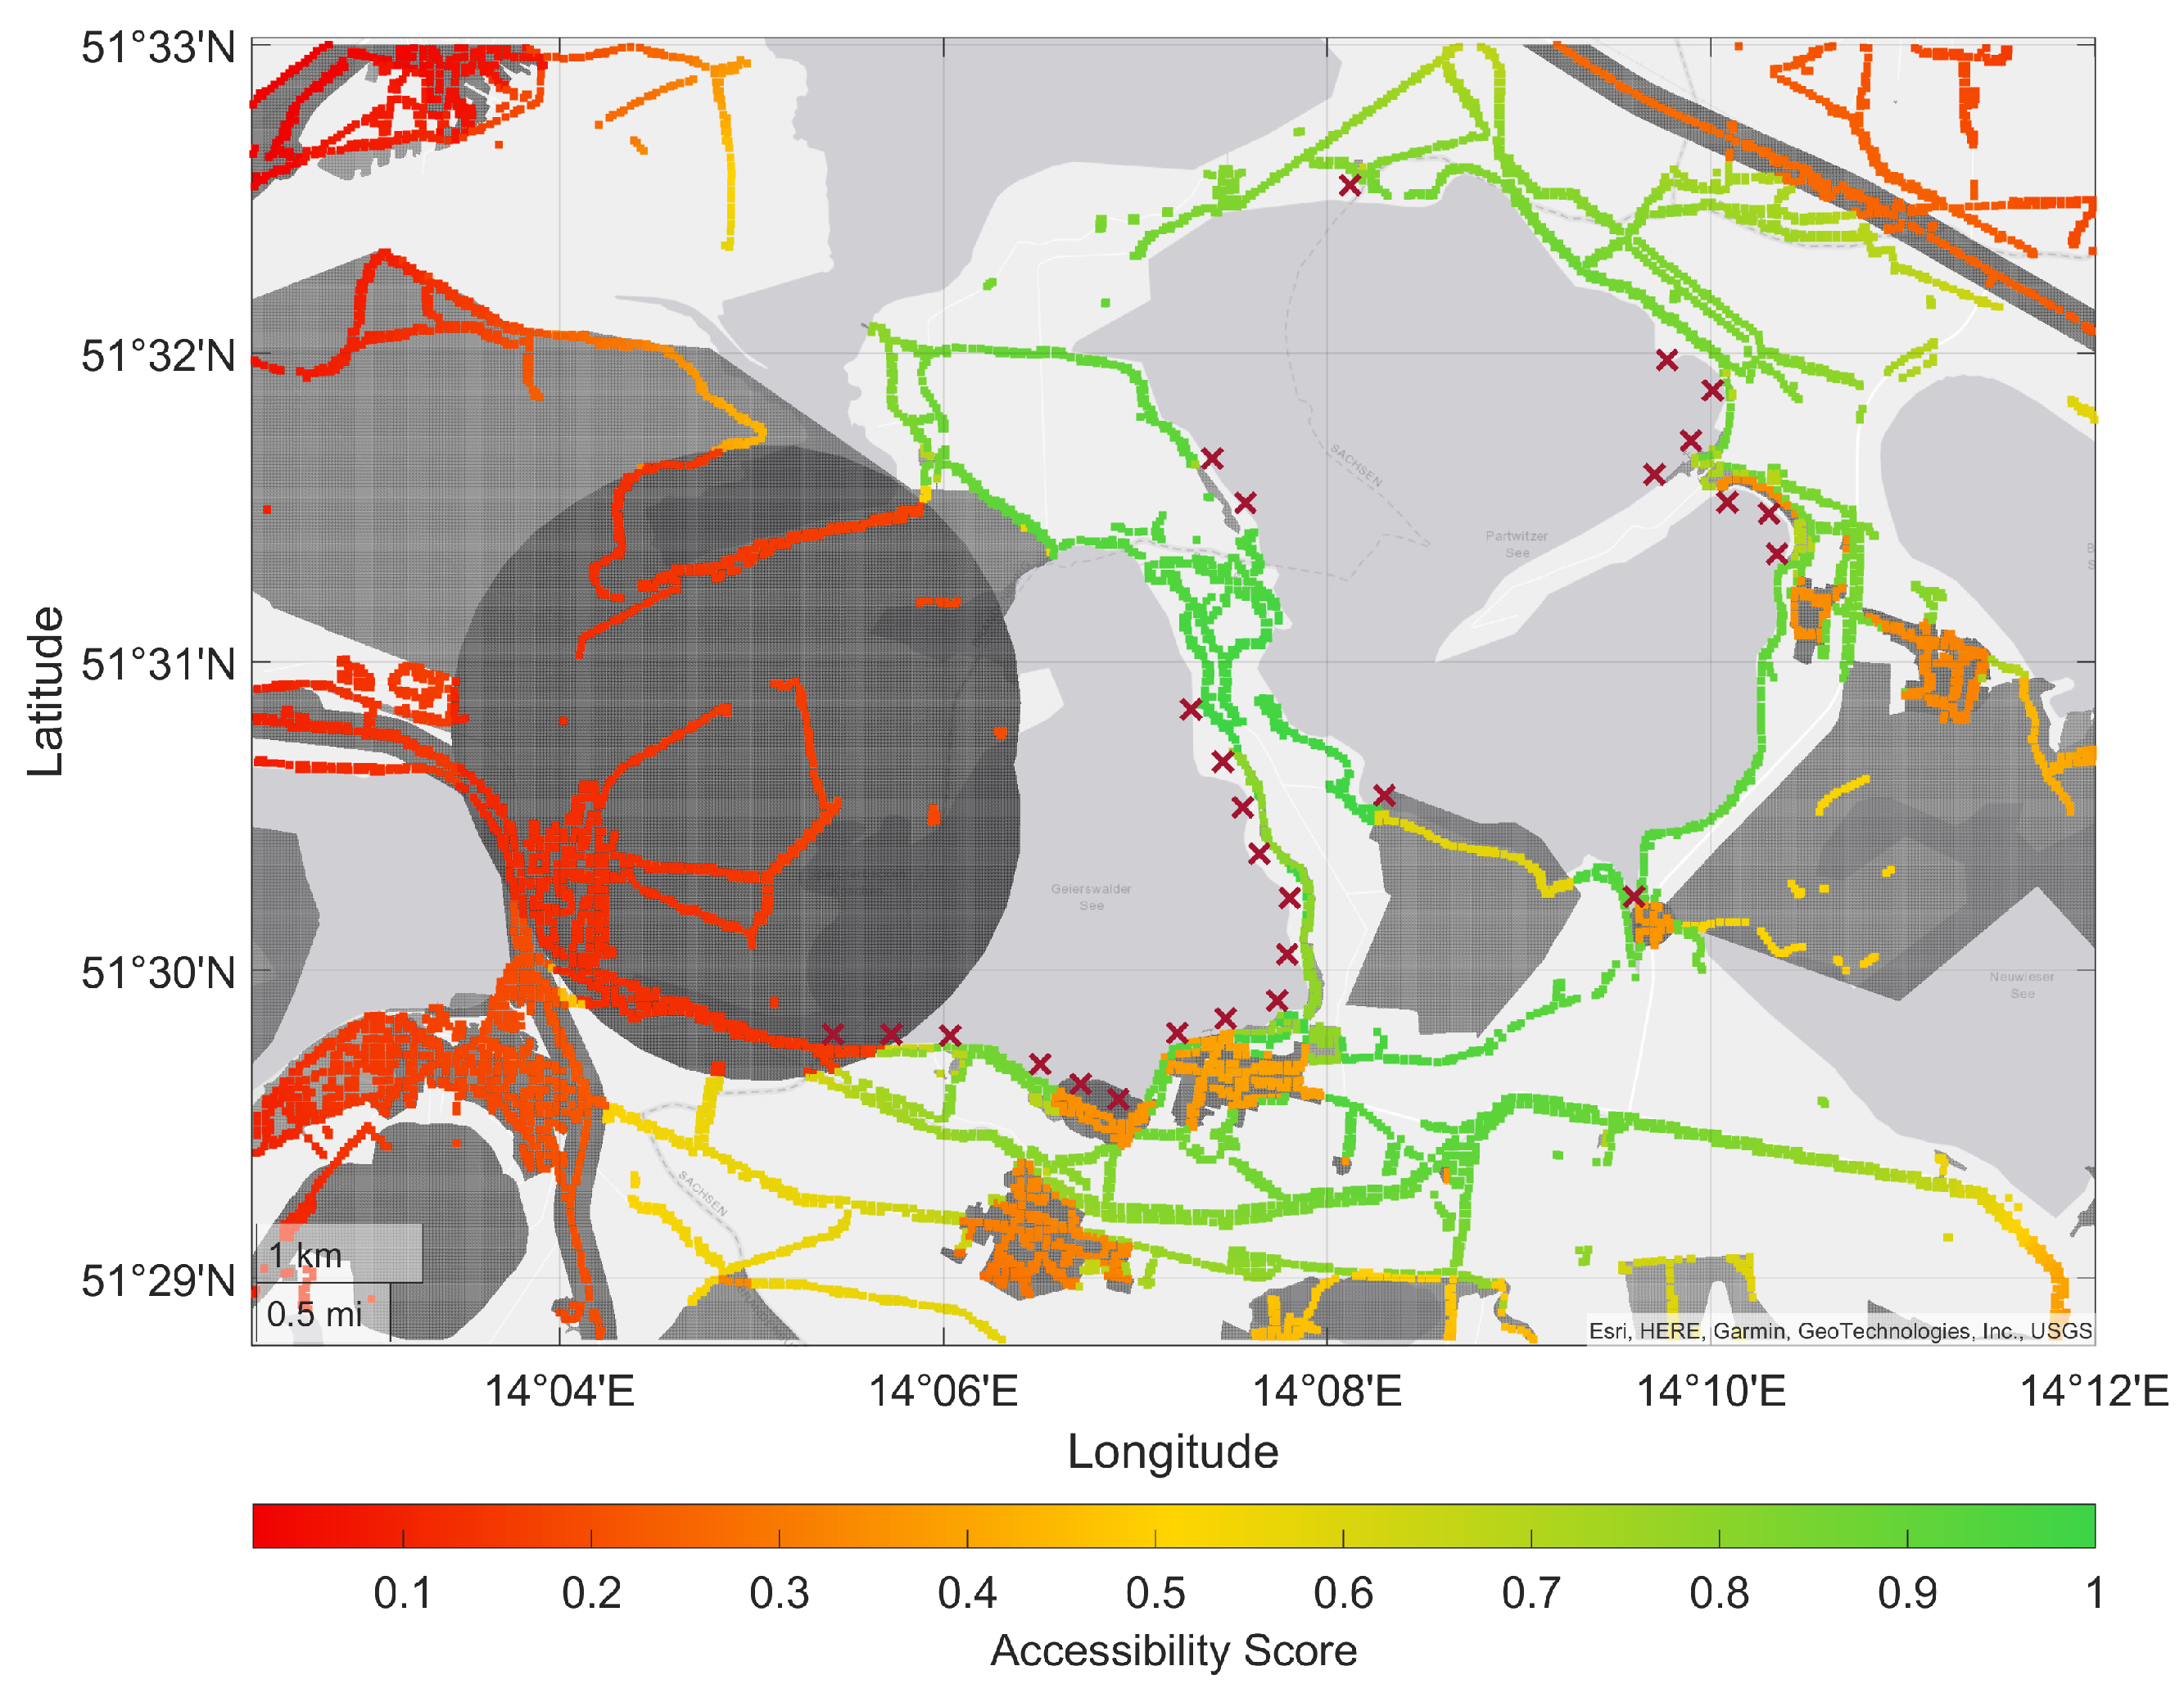
Figure 7.
Mean accessibility for all location candidates per weather scenario m, indicating 100% accessibility for and optimal locations except for .
Figure 7.
Mean accessibility for all location candidates per weather scenario m, indicating 100% accessibility for and optimal locations except for .
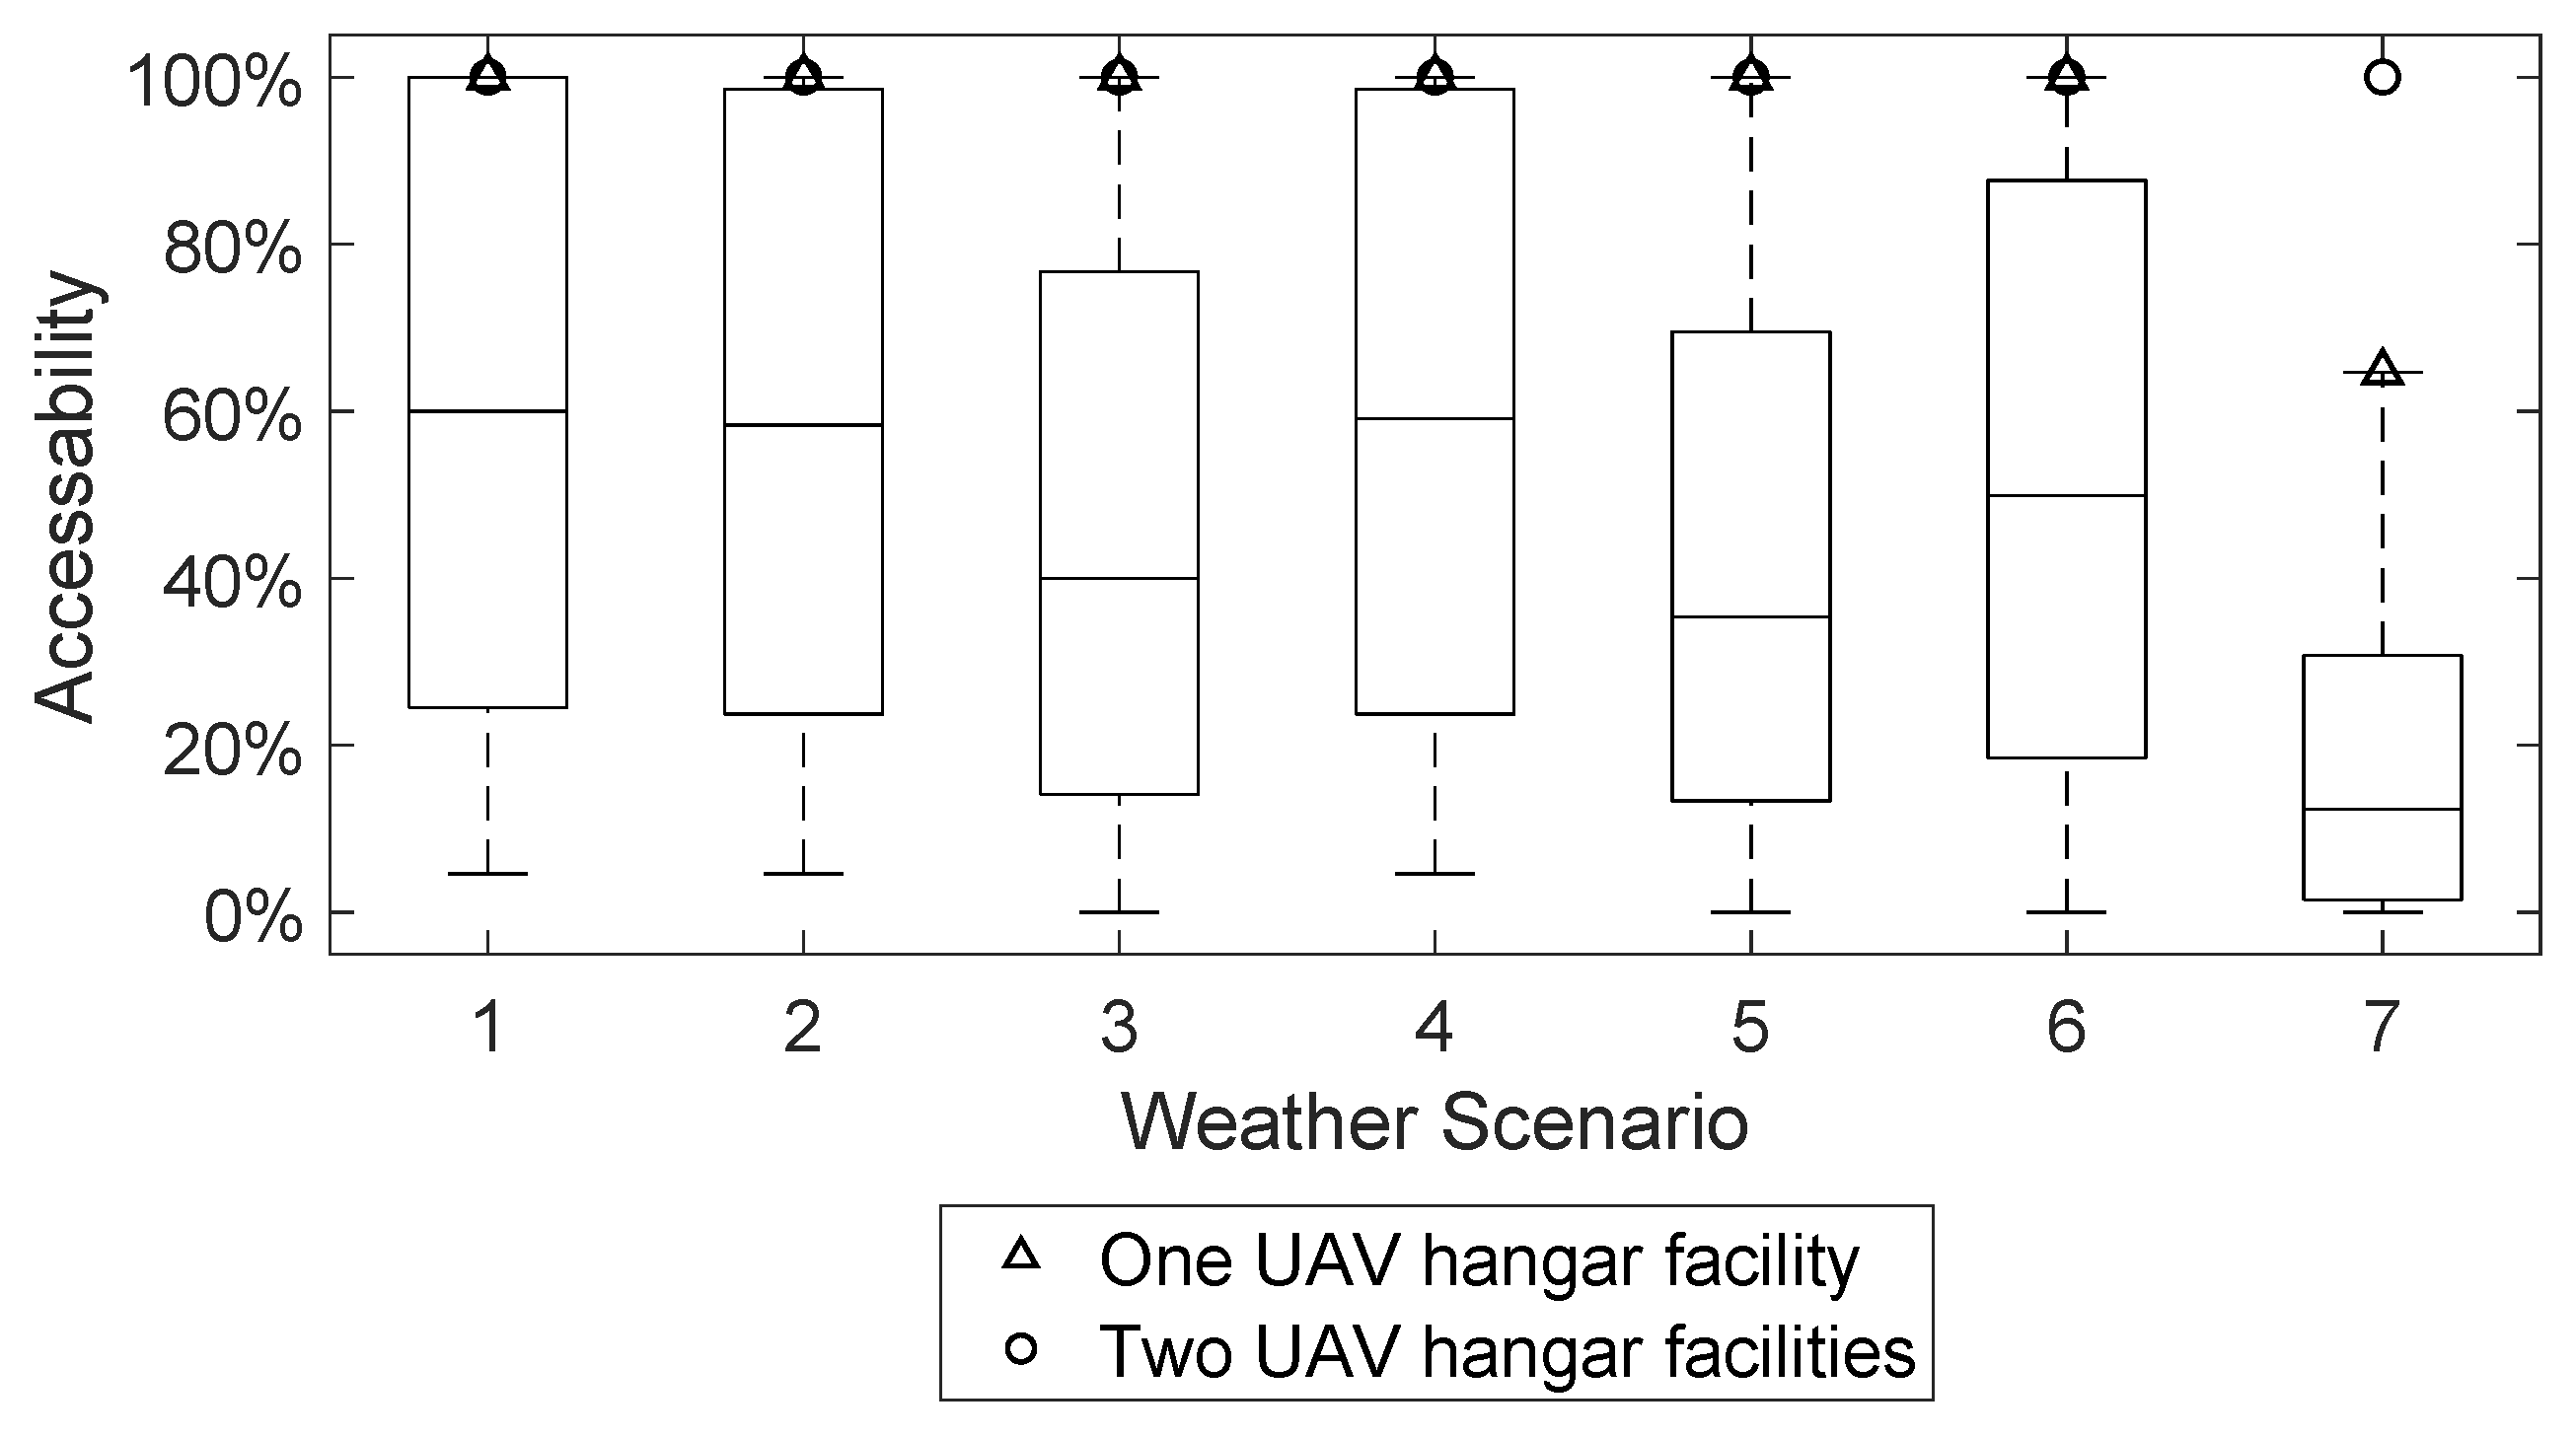
Figure 8.
Service time of all location candidates per hotspot, with markers indicating the optimal UAV hangar locations for and .
Figure 8.
Service time of all location candidates per hotspot, with markers indicating the optimal UAV hangar locations for and .
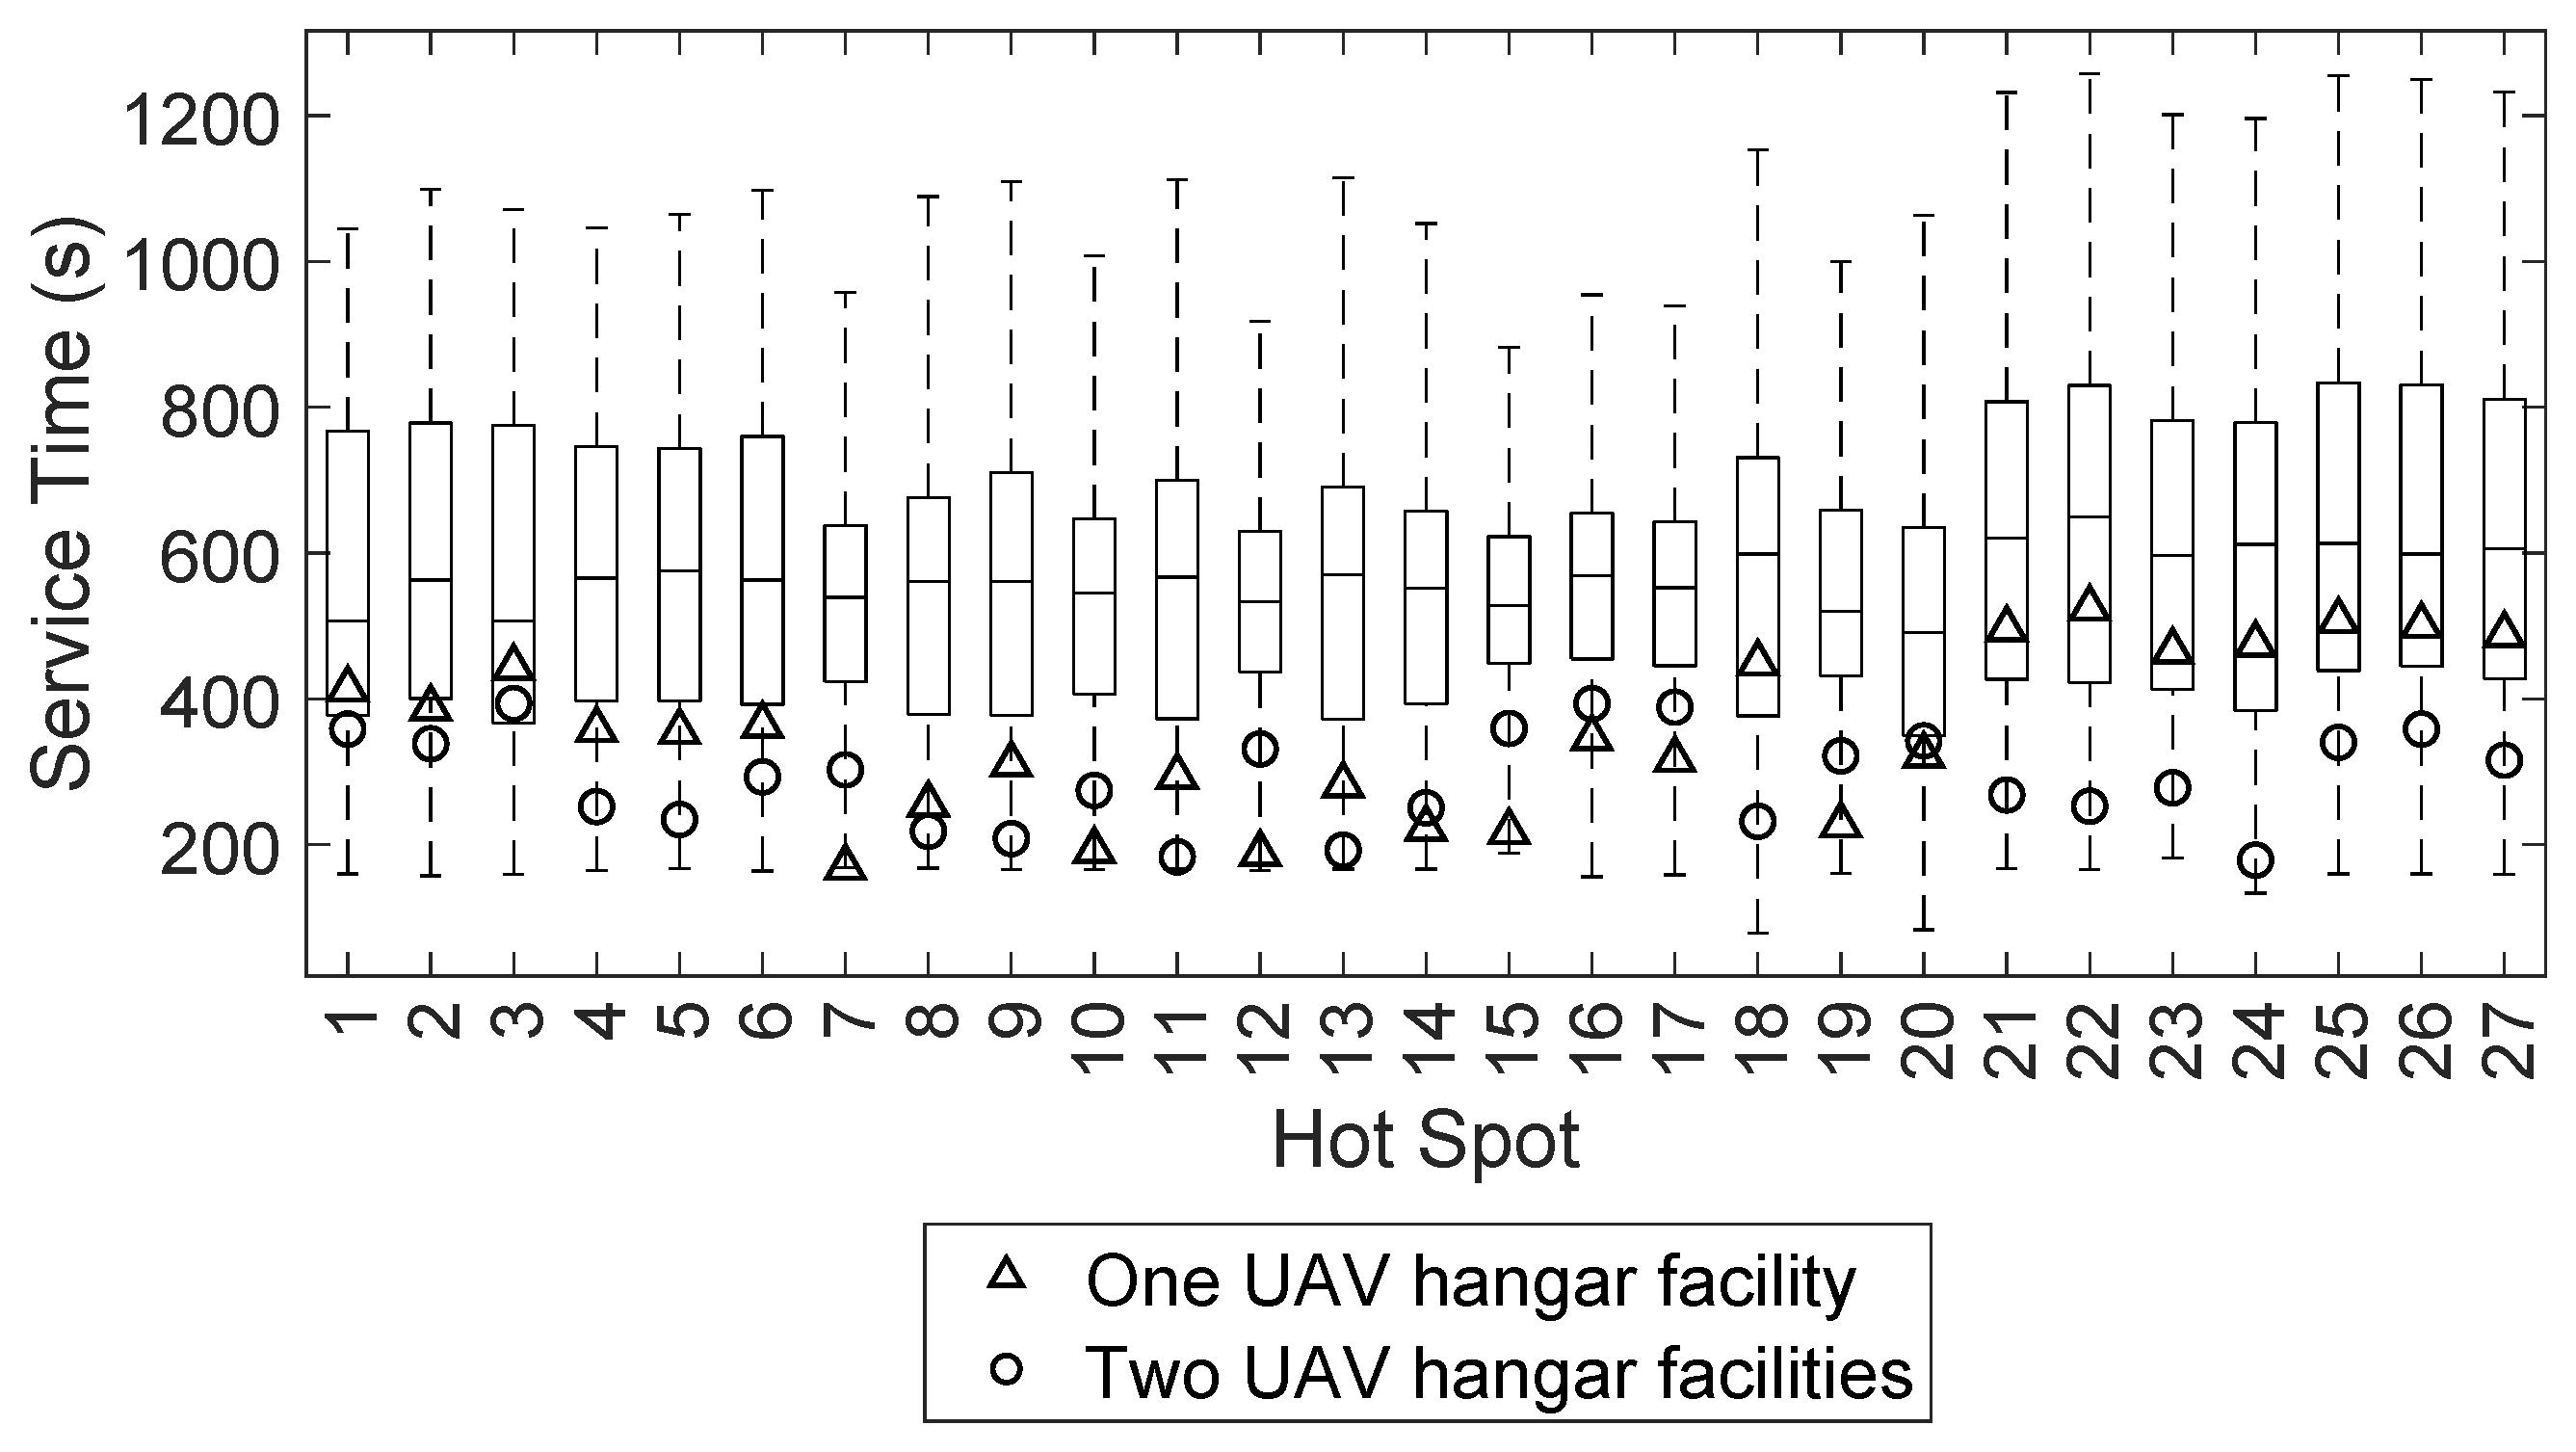
Figure 9.
Optimal UAV hangar location for (square) and the optimal flight paths for (black) to the hotspots (red) with the restricted areas in gray. The heatmap indicates the service time score for candidates with , if the optimal site is not available.
Figure 9.
Optimal UAV hangar location for (square) and the optimal flight paths for (black) to the hotspots (red) with the restricted areas in gray. The heatmap indicates the service time score for candidates with , if the optimal site is not available.
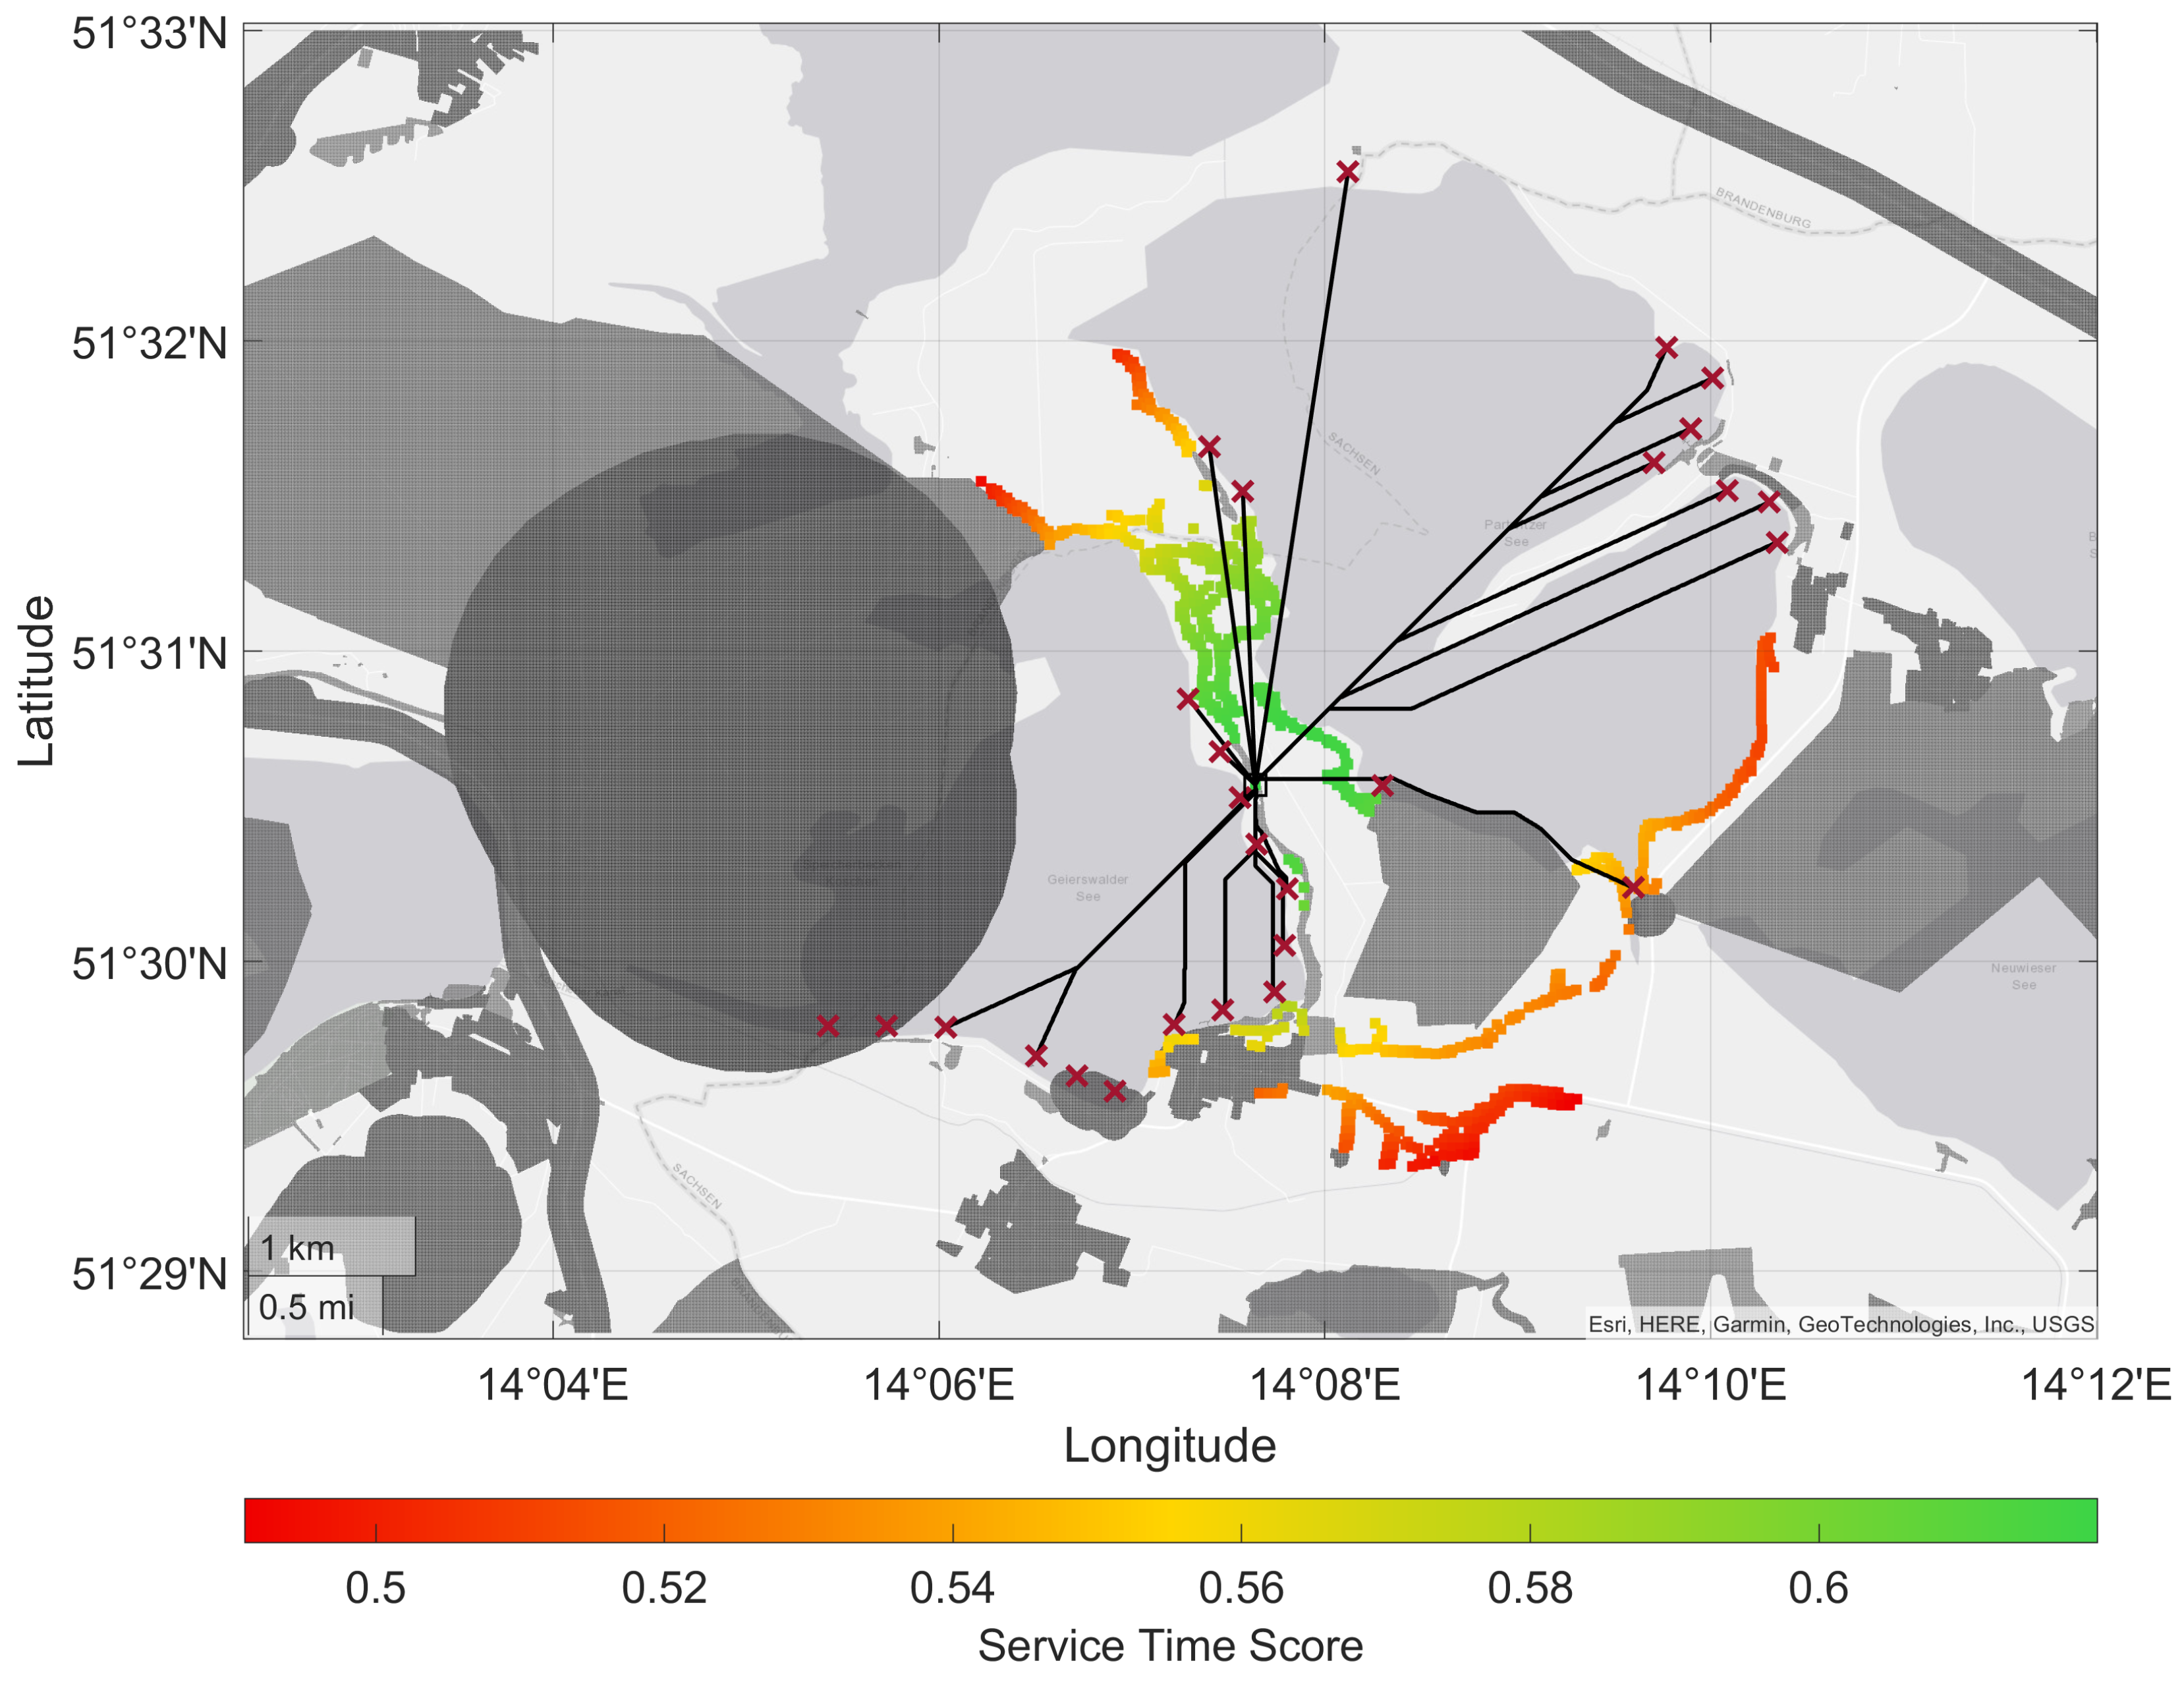
Figure 10.
Optimal UAV hangar locations for (squares) and the optimal flight paths with the allocation to the hangars for (green and orange) to the hotspots (red) with the restricted areas in gray.
Figure 10.
Optimal UAV hangar locations for (squares) and the optimal flight paths with the allocation to the hangars for (green and orange) to the hotspots (red) with the restricted areas in gray.
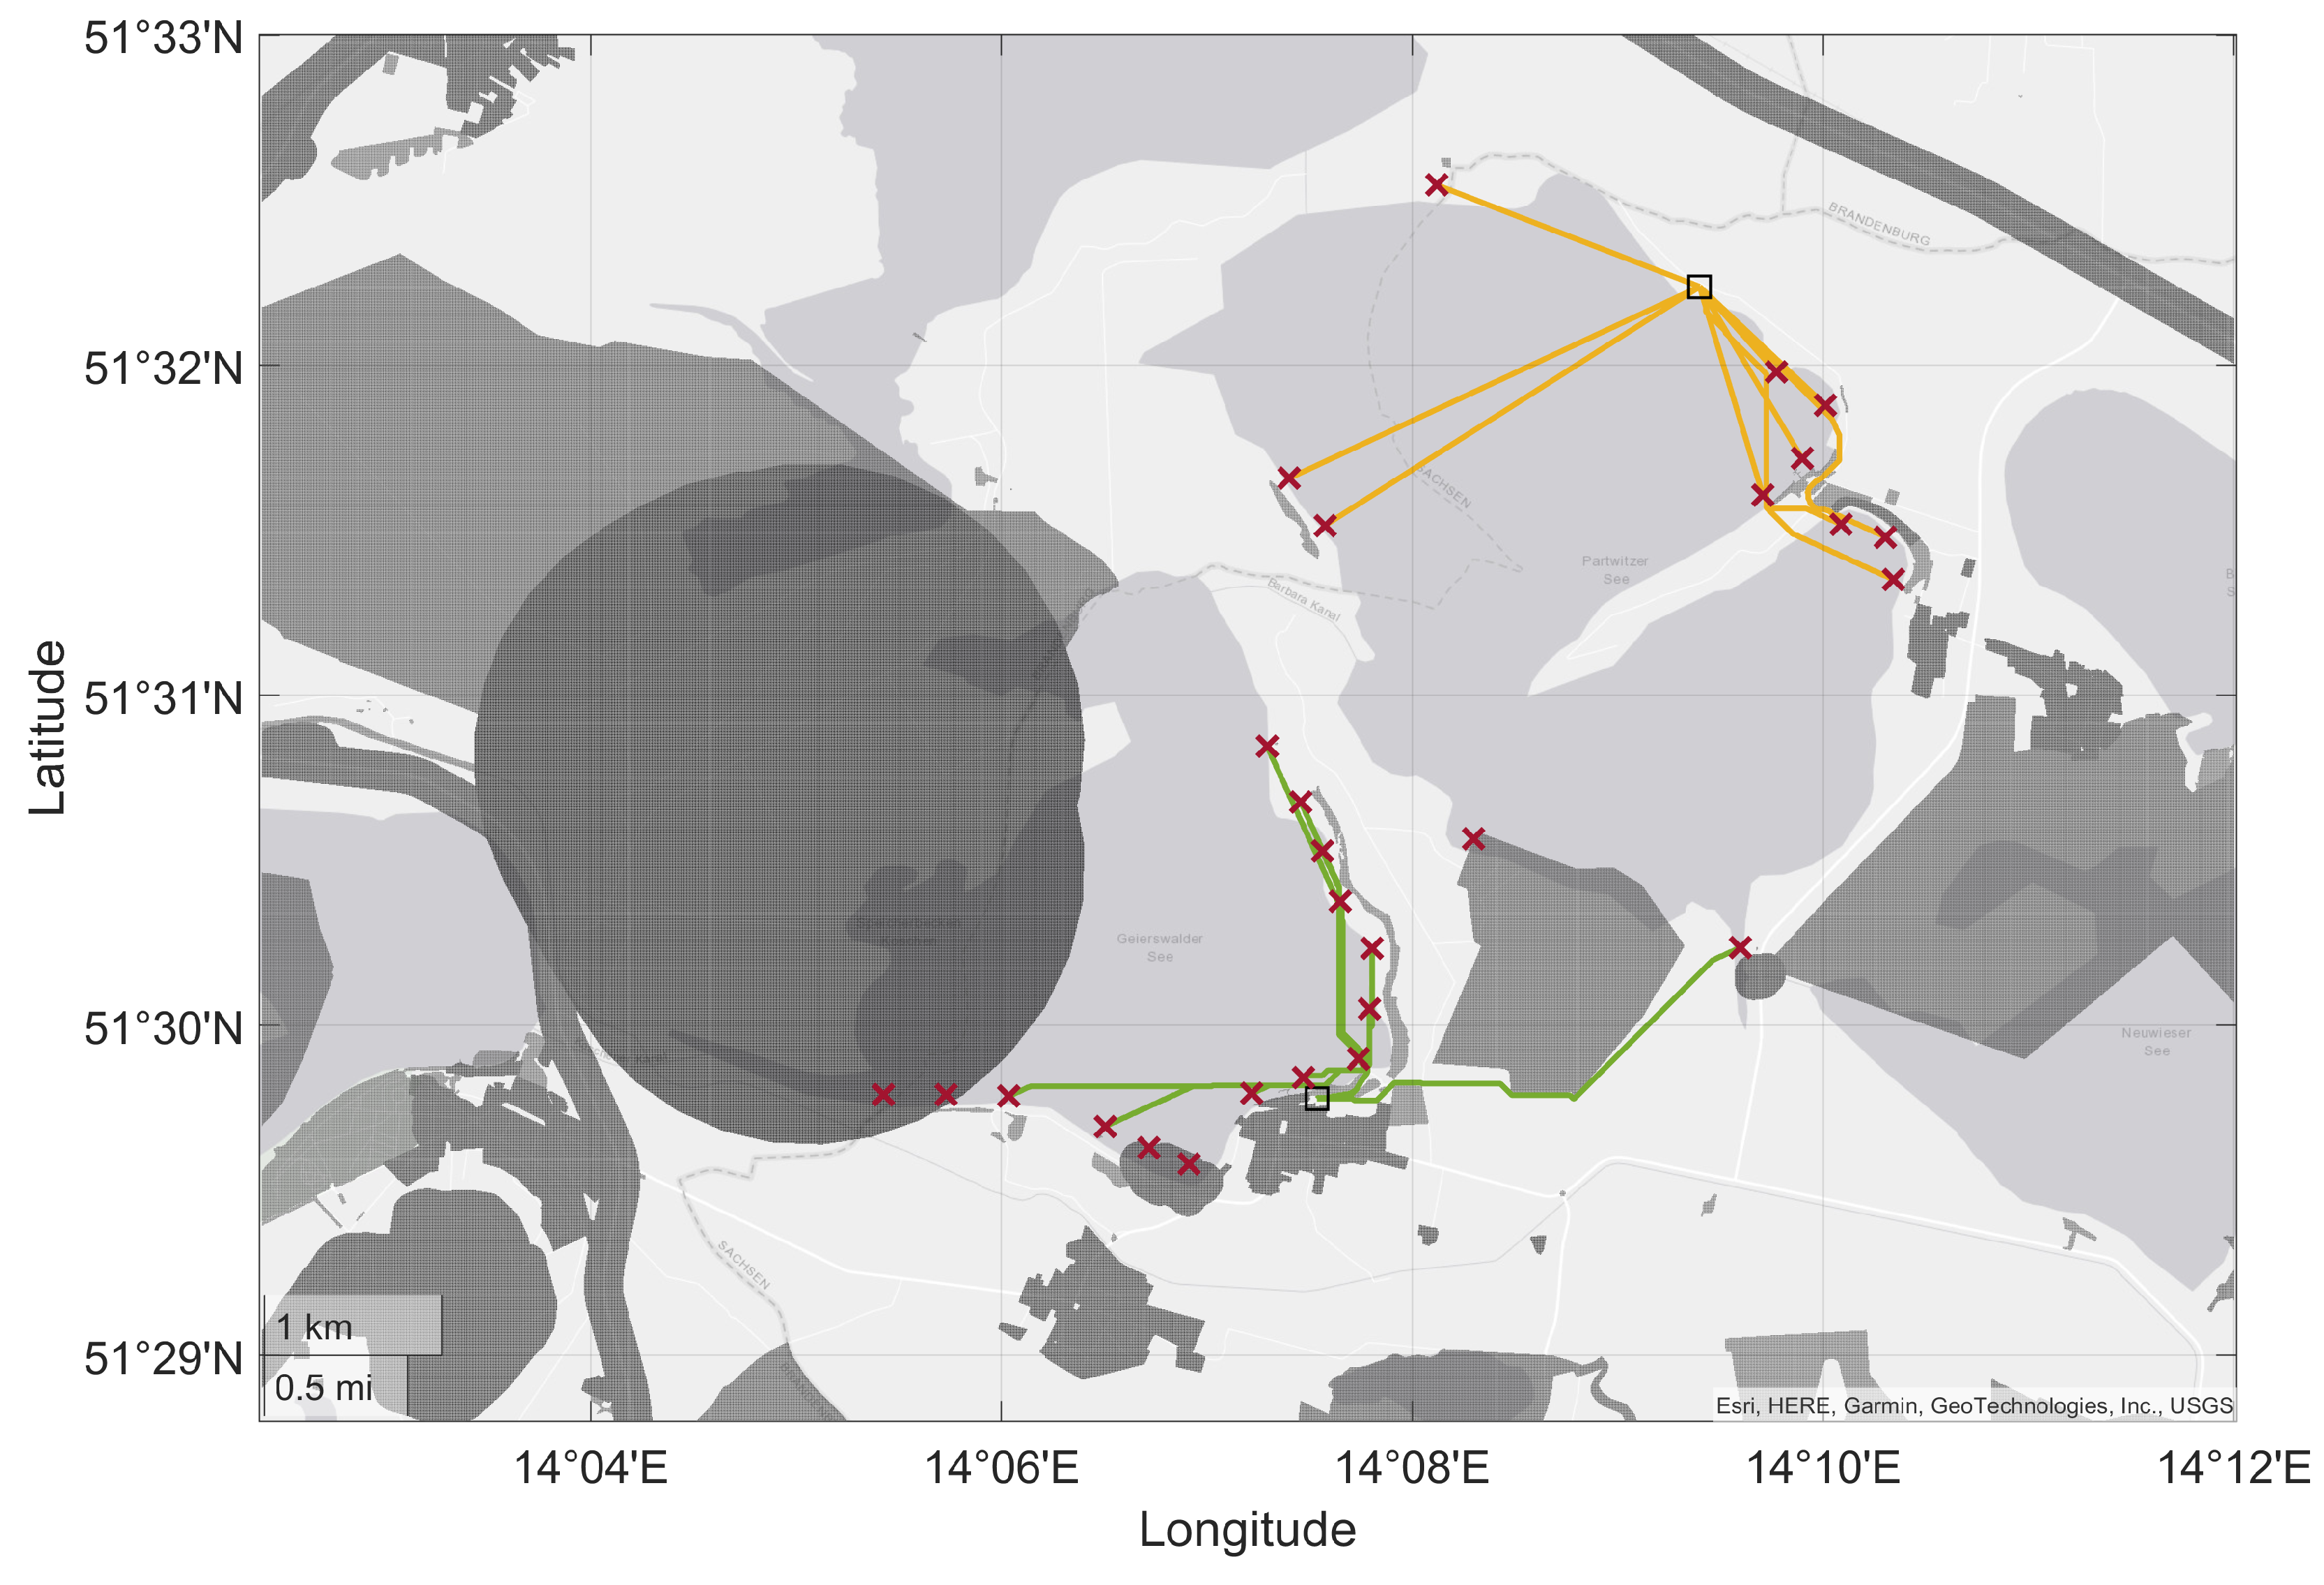

Table 1.
OSM map features for positive UAV hangar location factors.
| Key | Values |
|---|---|
| landuse | grass, greenfield |
| natural | grassland, heath, srub, scree |
Table 2.
OSM map features for negative UAV hangar location factors.
| Key | Value(s) |
|---|---|
| boundary | forest, forest_compartment, hazard |
| landuse | forest |
| natural | tree, tree_row, wood, wetland |
Table 3.
OSM map features for road access to the UAV hangar location with maximum distance 20 m.
| Key | Values |
|---|---|
| highway | motorway, trunk, primary, secondary, tertiary, unclassified, residential, motorway_link, trunk_link, primary_link, secondary_link, living_street, service, pedestrian, track, bus_guideway, escape, raceway, road, busway, cycleway |
| tracktype | grade1, grade2, grade3 |
Table 4.
OSM map features for hotspot areas.
| Key | Value(s) |
|---|---|
| amenity | boat_rental, boat_sharing, ferry_terminal, public_bath, parking, parking_space, lounger |
| building | beach_hut |
| emergency | lifeguard, life_ring, phone |
| landuse | grass |
| leisure | marina, slipway, swimming_area, swimming_pool, water_park, beach_resort, park, picnic_table |
| lifeguard | tower |
| man_made | pier |
| natural | beach, shingle, shoal, sand |
| sport | sailing, swimming, surfing, wakeboarding, water_polo, water_ski |
| tourism | camp_site, caravan_site |
Table 5.
Wind scenarios with detour factors derived from the battery use studied by Chu et al. [13].
Table 5.
Wind scenarios with detour factors derived from the battery use studied by Chu et al. [13].
| Wind Scenario | Windspeed | Turbulence Index | Detour Factor |
|---|---|---|---|
| [] | |||
| 1 | 0 | 0 | 1.0 |
| 2 | 3.5 | 0 | 1.023 |
| 3 | 10.5 | 0 | 1.237 |
| 4 | 3.5 | 10 | 1.018 |
| 5 | 10.5 | 10 | 1.311 |
| 6 | 3.5 | 20 | 1.109 |
| 7 | 10.5 | 20 | 2.199 |
Table 6.
Number of hotspots served by the optimal UAV hangar locations per wind and UAS geographical zone scenario.
Table 6.
Number of hotspots served by the optimal UAV hangar locations per wind and UAS geographical zone scenario.
| Geographical Zone | Wind Scenarios | ||||||
|---|---|---|---|---|---|---|---|
| 1 | 2 | 3 | 4 | 5 | 6 | 7 | |
| 1 | 27 | 27 | 27 | 27 | 27 | 27 | 17 |
| 2 | 25 | 25 | 25 | 25 | 25 | 25 | 17 |
| 3 | 23 | 23 | 23 | 23 | 23 | 23 | 15 |
| 4 | 22 | 22 | 22 | 22 | 22 | 22 | 14 |
| 5 | 22 | 22 | 22 | 22 | 22 | 22 | 14 |
Disclaimer/Publisher’s Note: The statements, opinions and data contained in all publications are solely those of the individual author(s) and contributor(s) and not of MDPI and/or the editor(s). MDPI and/or the editor(s) disclaim responsibility for any injury to people or property resulting from any ideas, methods, instructions or products referred to in the content. |
© 2023 by the authors. Licensee MDPI, Basel, Switzerland. This article is an open access article distributed under the terms and conditions of the Creative Commons Attribution (CC BY) license (http://creativecommons.org/licenses/by/4.0/).
Copyright: This open access article is published under a Creative Commons CC BY 4.0 license, which permit the free download, distribution, and reuse, provided that the author and preprint are cited in any reuse.


