
Submitted:
14 July 2025
Posted:
22 July 2025
You are already at the latest version
Abstract
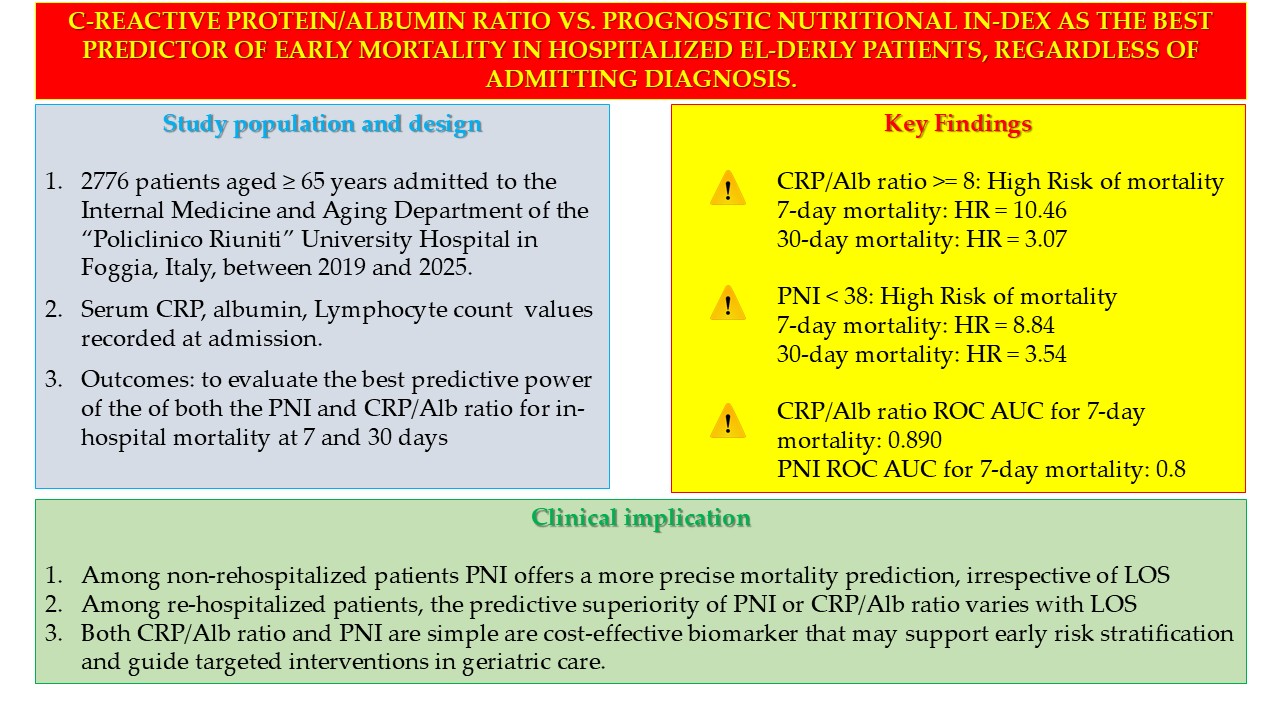
Background: Among elderly hospitalized individuals, factors like malnutrition and systemic inflammation significantly influence clinical outcomes such as length of hos-pital stay (LOS), mortality, and readmission risk. The C-reactive protein to albumin (CRP/Alb) ratio serves as a valuable prognostic indicator, reflecting both inflammatory and nutritional status. Additionally, the Prognostic Nutritional Index (PNI) offers a straightforward method to assess both the nutritional state and mortality risk in older patients. Objective: This study aimed to evaluate the prognostic utility of both the PNI and CRP/Alb ratio in forecasting hospital mortality at 7- and 30-days post-admission. We also sought to compare their predictive performance within a large cohort of elderly patients, irrespective of their admitting diagnosis. Methods: We conducted a retro-spective observational study, analyzing data from 2776 patients, aged 65 years or older, who were admitted to the Internal Medicine and Aging Department at the "Policlinico Riuniti" University Hospital in Foggia, Italy, between 2019 and 2025. Upon admission, serum C-reactive protein (CRP), albumin levels, and Total Lymphocyte Count (TLC) were recorded. To determine the predictive capacity of the CRP/Alb ratio and PNI for in-hospital mortality at 7 and 30 days, we performed ROC curve analysis, Cox regres-sion, and Kaplan–Meier survival analyses. Furthermore, the Positive Predictive Value (PPV) for mortality was calculated for both the CRP/Alb ratio and PNI. Likelihood-ratio test was also performed to compare the mortality PPVs of mortality of the CRP/Alb ratio and the PNI, at 30 and 7 days, both for all patients and for re-hospitalized patients. Results: In-hospital mortality occurred in 444 patients (16%). Our findings indicated that deceased patients exhibited notably higher CRP/Alb ratios and lower PNI values compared to survivors (p < 0.001). Both the CRP/Alb ratio and PNI demonstrated a ro-bust correlation with early mortality, particularly within the initial 7 days (AUC = 0.89 and AUC = 0.87, respectively). A CRP/Alb ratio exceeding 8 independently predicted 30-day mortality (HR = 3.07; 95% CI: 2.33–4.03) and 7-day mortality (HR = 10.46; 95% CI: 6.32–17.32). Similarly, a PNI below 38 was an independent predictor for 30-day mortality (HR = 3.54; 95% CIs = 2.70–4.64) and 7-day mortality (HR = 8.84; 95% CIs = 5.67–13.77). When comparing the PPVs, PNI emerged as a more refined mortality predictor than the CRP/Alb ratio among non-rehospitalized patients, regardless of LOS (p < 0.001). For re-hospitalized patients, PNI was a better predictor only for those with a LOS under 7 days, whereas the CRP/Alb ratio was superior for those with a LOS of 7 days or more. Conclusion: Among non-rehospitalized patients, PNI offers a more precise mortality prediction, irrespective of the length of stay. Among re-hospitalized patients, the pre-dictive superiority of PNI or CRP/Alb ratio varies with the length of stay. Anyway, both CRP/Alb ratio and PNI are simple, cost-effective biomarker that may support early risk stratification and guide targeted interventions in geriatric care.
Keywords:
malnutrition
; inflammation
; elderly
; mortality
; albumin
; C reactive protein
; PCR/Alb ratio
; lymphocytes
; Prognostic Nutritional Index
1. Introduction
Population aging is a global trend with significant implications for healthcare systems. According to the World Health Organization (WHO), by 2030, one in six individuals worldwide will be aged 60 years or older, and by 2050, this demographic is projected to double, reaching 2.1 billion people. Notably, the population over 80 years of age is expected to triple during the same period, surpassing 426 million. This demographic shift is especially pronounced in countries like Japan and Italy, where projections indicate that older adults will represent a substantial portion of the population.
Population aging is a global trend with significant implications for healthcare systems. According to the World Health Organization (WHO), by 2030, one in six individuals worldwide will be aged 60 years or older, and by 2050, this demographic is projected to double, reaching 2.1 billion people. Notably, the population over 80 years of age is expected to triple during the same period, surpassing 426 million [1]. What is new is that two-thirds of the world's population aged 60 and over will live in low- and middle-income countries. The phenomenon of population aging began over 40 years ago in high-income countries. Among high-income countries, this demographic shift is especially pronounced in Japan, where it is estimated that by 2030 the over-sixty-five age group will be 31.6% of the population [2], and Italy, where in 2025 the over-sixty-five age group will be 21.6% of the population [3].
Despite increasing longevity, aging is a heterogeneous process. While some individuals remain physically and cognitively robust into their 80s, others exhibit early declines in function, often developing frailty, that is a multidimensional syndrome characterized by decreased physiological reserves and increased vulnerability, or rather reduced resilience, to stressors. Frail older adults frequently face adverse health outcomes such as falls, cognitive impairment, and disability, often resulting in multiple and prolonged hospitalizations and increased healthcare costs [4,5,6,7,8].
A common feature of frail elderly people is a significant increase in care burden and expenses due to numerous and repeated hospital admissions [9,10,11].
Malnutrition, particularly undernutrition, is a key contributor to frailty and poor clinical outcomes in hospitalized patients. It encompasses inadequate intake of energy or protein, micronutrient deficiencies, and significant weight loss [12]. In hospital settings, malnutrition is prevalent at admission and often worsens during the hospital stay. Estimates suggest that 15–70% of hospitalized individuals show evidence of undernutrition, depending on patient characteristics and care settings. Contributing factors include chronic disease burden, reduced appetite, complex medication regimens, and inadequate nutritional monitoring or intervention [13,14,15,16,17,18,19,20].
To date, a significant proportion of hospital patients show signs of malnutrition upon admission and continue to deteriorate nutritionally during their hospital stay.
Elderly patients, who are admitted to acute care units, already suffer from chronic diseases at the time of admission, cognitive deterioration, malnutrition, and complex home therapies with intake of numerous drugs [21].
in addition to the performance of hospital medical procedures, diagnostic or therapeutic, which affect food intake, poor monitoring of the patient's nutritional status and lack of knowledge of standardized nutritional protocols [22,23,24].
Among inpatients, malnutrition at admission is one of the most important negative predictors of the risk of a higher incidence of complications (e.g., in-hospital infections, pressure ulcers in bedridden patients), as well as responsible for a longer length of hospital stay (LOS), frequent rehospitalizations, poor response to treatments of the primary disease, and increased in-hospital mortality of patients [25,26,27,28].
Serum albumin (Alb), synthesized in the liver, serves not only as a nutritional marker but also as an acute-phase reactant [29]. Low albumin levels have been associated with increased morbidity, prolonged hospitalization, and higher mortality, especially in older populations [30-37].
Since Alb reflects hepatic protein synthesis and is reduced in catabolic states, serum Alb levels are a well-established surrogate marker in the measurement of malnutrition, being indicative of both hepatic synthesis, plasma distribution, and overall protein loss [38-44], particularly in elderly patients.
Similarly, total lymphocyte count (TLC) is a useful indicator of nutritional status. It is a readily available laboratory measure, and it is appropriate for all age groups. TLC declines in malnutrition and correlates with immune suppression and poor outcomes, that is morbidity and mortality in hospitalized patients [45,46,47].
The Prognostic Nutritional Index (PNI) [48,49,50], calculated from Alb and TLC values [10 × Alb (g/dL)] + [0.005 × TLC (cells/mm3), has been widely studied as a predictor of mortality across various clinical conditions, mainly cancer and surgical settings [51,52,53,54,55]. The PNI is a simple and rapid calculation tool that can help classify the conditions of elderly patients admitted to hospital, based on their nutritional status, both to assess their risk of mortality where the PNI is assessed at the time of admission, and to assess their risk of rehospitalization in the following thirty days, where the PNI is assessed at the time of discharge, since rehospitalization in turn constitutes a risk factor for adverse outcomes, namely death, irreversible loss of autonomy, institutionalization.
On the other hand, systemic inflammation plays a central role in catabolic states, contributing to hypoalbuminemia and functional decline. C-reactive protein (CRP) is a sensitive inflammatory marker. When considered in conjunction with albumin levels, the CRP/Albumin (CRP/Alb) ratio captures both nutritional and inflammatory status and has emerged as a strong predictor of early mortality, particularly in older hospitalized patients [60,61,62,63,64,65].
On the other hand, systemic inflammation plays a central role in catabolic states, contributing to hypoalbuminemia and functional decline. C-reactive protein (CRP) is an unexpensive, sensitive inflammatory marker. Measurement of CRP at hospital admission can help identify patients at increased risk of adverse outcomes, such as short- and long-term mortality. Elevated CRP levels are known to be associated with an increased risk of all-cause mortality [56,57,58,59].
Considered in combination with albumin levels, the CRP/Albumin (CRP/Alb) ratio reflects both nutritional and inflammatory status. It has emerged as a strong predictor of early mortality, particularly in hospitalized elderly patients [60,61,62,63,64,65]. Even among non-critically ill patients, the CRP/Alb ratio, together with measurement of anthropometric parameters as part of a thorough clinical assessment, is a readily obtainable indicator of impaired energy and protein intake and poor clinical outcomes among hospitalized elderly [66].
CRP/Alb ratio has been shown to be a significant independent predictor of clinical outcome among hospitalized elderly patients, regardless of admission diagnosis. The predictive value of this readily available biomarker is particularly relevant in the geriatric setting, where systemic inflammation and malnutrition frequently coexist and contribute to adverse outcomes, according to previous studies [37,61–65, 67–70].
PNI has also been shown to be a significant predictor of clinical outcome among hospitalized elderly patients, especially among patients hospitalized for acute heart failure, or acute myocardial infarction, or undergoing coronary artery bypass grafting [71,72,73,74], or after hip fracture [75], or with chronic kidney disease [76], or with cancer, for example, prostate cancer or lymphoma [77,78].
Having established that both PNI and CRP/Alb ratio are accessible and objective tools that can improve risk assessment and clinical decision-making in hospitalized elderly patients, our retrospective observational study aimed to investigate the prognostic significance of these two indices – PNI and CRP/Alb ratio – in predicting hospital mortality at 7 and 30 days after admission, and to compare their predictive performance in a population of elderly patients admitted to an Internal Medicine and Aging department.
2. Materials and Methods
2.1. Patients
A cohort of 3760 elderly patients admitted to the Department of Internal Medicine and Aging of the Policlinico Riuniti di Foggia, between 1 January 2019 and 29 May 2025, was screened. The exclusion criteria from the study were as follows: age less than 65 years at the time of admission; patients discharged against medical advice; patients transferred to other departments of the same hospital or other acute hospitals; patients discharged to nursing homes or rehabilitation institutions; patients with missing laboratory tests. The above patients were excluded to ensure a homogeneous sample of elderly patients with complete data for key biomarkers (CRP, Alb, TLC) at admission and definitive in-hospital outcomes. The final cohort consisted of 2776 subjects.
2.2. Methods
For all patients involved in the study, the following parameters were considered: serum C-reactive protein (CRP), TLC and albumin values detected at the time of admission; length of stay (LOS); outcome of admission, i.e., discharge or death. All patients analysed in our study were treated with medical therapy, either newly prescribed or confirming therapy already underway at home, total or partial, based on the clinical conditions of the patients. Comorbidity indices were not available in the hospital medical records and could not be derived retrospectively. The presence of a previous hospitalization in the thirty days preceding hospitalization was considered a severity marker. As for the causes of death, these were obtained from the hospital discharge forms present in the medical records, classified according to the ICD-9.
2.3. Statistics
The Kolmogorov–Smirnov test was performed to verify whether the data of the cohort under examination were normally distributed. Having verified that the examined data did not follow the normal distribution (p < 0.001), we decided to perform the non-parametric Mann–Whitney U test for the comparison of means for independent samples, corrected with the exact Monte Carlo test; the non-parametric Spearman test was also performed to calculate correlations. The chi-square test, corrected with the Monte Carlo test, was performed to calculate the difference in frequencies between groups (males vs. females, deceased vs. non-deceased). Cohen’s d coefficient was performed to calculate the effect size on values expressed as mean and SD, assuming the following values of d: 0.2 = small effect; 0.5 = medium effect; 0.8 = large effect. Cohen’s h coefficient was performed to calculate the effect size on values expressed as percentages, i.e., deceased and non-deceased, or male and female, assuming the following values of phi, according to Cohen’s Guidelines: 0.2 = small effect; 0.5 = medium effect; 0.8 = large effect. The Phi coefficient was performed to calculate the effect size on the percentage values, i.e., deceased and non-deceased, stratified by sex, assuming the following values of phi: 0.1 = small effect; 0.3 = medium effect; 0.5 = large effect [69,70].
Both sensitivity and specificity, i.e., the predictive value of mortality of the CRP/Alb ratio and PNI, were calculated using ROC curve analysis; the optimal threshold value (optimal cut-off) was also identified. The Hazard Ratio (HR) for predicting mortality was calculated using Cox regression. Both the ROC curve analysis and the calculation of HR with Cox regression were performed after correction for sex.
Patient survival at 7 and 30 days from admission was estimated about the parameters examined, using Kaplan–Meier analysis, obtaining the relative survival curves. The presence of significant differences between the two survival curves, both at 7 and 30 days, was then analyzed using the Log-rank test, stratified by age at admission. We also performed sensitivity analyses, both including all subjects and after excluding those with a LOS equal to or greater than seven days. In addition, we performed the calculation of the Positive Predictive Value (PPV) of mortality of both the PCR/Alb ratio and the PNI. We then performed Likelihood-ratio tests to compare the mortality PPVs of mortality of the CRP/Alb ratio and the PNI, respectively at thirty and seven days, both for all patients and for re-hospitalized patients.
The statistical packages IBM SPSS version 25 (Armonk, NY, USA) and STATA SE 14.2 (College Station, TX, USA) were used. p values lower than 0.05 were considered statistically significant.
3. Results
The features of the cohort examined are presented in Table 1. Women were more represented than men (p = 0.003) in our cohort and, as expected, were older than men (p < 0.001). We did not find any statistically significant differences between men and women concerning both LOS and serum values of Albumin. We found higher CRP values (p = 0.001) and higher CRP/Alb ratio values among men (p = 0.005) than among women. In addition, women had higher TCL values than men (p = 0.001). Nevertheless, we did not find any statistically significant differences between men and women concerning PNI value (p = 0.098).
Aware that the simple definition of patients over 65 years of age might be too broad, we stratified the cohort by age subgroups [79,80], i.e., “young old” (65–74 years old), “old” (75–84 years old), “very old” (85 + years old), as presented in Table 2. Men were more represented than women among the young elderly (p < 0.001), while women were more represented than men among the very old (p < 0.001). No statistically significant difference was found between men and women among the elderly (p = 0.705). No further analyses were conducted in subgroups by age group in this study, but these are planned in future works, certainly in a larger cohort of subjects.
After correction for sex, correlation analysis revealed a statistically significant direct relationship between CRP and the CRP/Alb ratio, as well as LOS (p < 0.001), consistent with our previous study findings [81]; a statistically significant inverse relationship was highlighted between serum albumin values and LOS (p < 0.001); no statistically significant correlation was observed between the age of the patients at admission and LOS (p = 0.434). No statistically significant correlation was observed between the TLC values and LOS (p = 0.829), while a statistically significant inverse relationship was highlighted between PNI and LOS (p < 0.011); The results of the correlation analysis are shown in Table 3.
Four hundred and forty-four patients died during their hospital stay. The main causes of death are reported in Table 4. According to previous studies, and according to data collected by the Italian National Cause of Death Register, managed by the Italian National Institute of Statistics (ISTAT) [81,82], severe sepsis is the most frequent cause of in-hospital death. We did not perform any inferential statistical comparisons between causes of death, as these were reported primarily for descriptive purposes.
Deceased subjects were older than non-deceased subjects (p < 0.001); no significant differences were found between males and females for the proportion of deaths (p = 0.276) or for LOS (p = 0.367). Compared with non-deceased subjects, serum albumin values were lower, and CRP values were higher among deceased subjects; consequently, the CRP/Alb ratio was significantly higher among deceased subjects (p < 0.001) compared with non-deceased patients. In addition, TLC values were higher among non-deceased subjects (p < 0.001); the PNI was significantly higher among non-deceased subjects (p < 0.001) compared with deceased patients. Characteristics of deceased and non-deceased patients and serum albumin, CRP values, Alb/CRP ratio, and TLC and PNI values (all expressed as mean and SD) are reported in Table 5.
ROC curve analysis highlighted the significant predictive role of PNI (Figure 1a) and CRP/Alb ratio (Figure 1b) in mortality. The most accurate predictor of mortality seemed to be PNI, with an AUC of 0.769, with respect to the CRP/ALB ratio, with an AUC of 0.730. After dividing the sample according to hospital stay days less than seven days or equal to or greater than seven days, the PNI showed an excellent discriminative ability among subjects with hospital stays less than seven days, with an AUC of 0.871 and the best cut-off value of 38 (Figure 1c), then subjects with hospital stays equal to or greater than seven days (p < 0.001), consistent with previous findings [83]. The CRP/Alb ratio demonstrated also an excellent discriminative ability among subjects with hospital stays less than seven days, with an AUC of 0.890 and the best cut-off value of 8 (Figure 1d), then subjects with hospital stays equal to or greater than seven days (p < 0.001).
The best cut-off value of CRP/Alb ratio of 8 was identified via ROC analysis as the point of highest combined sensitivity and specificity for 7-day mortality, with a sensitivity of 89%, a specificity of 66% and a Youden Index of 0.546. Sensitivity analyses performed subsequently showed that the CRP/Alb ratio greater than 8 had a sensitivity of 85.4% in predicting mortality for all patients, while it had a sensitivity of 89% in predicting mortality for patients with a LOS of less than seven days.
The best cut-off value of PNI of 38 was identified via ROC analysis as the point of highest combined sensitivity and specificity for 7-day mortality, with a sensitivity of 87%, a specificity of 69% and a Youden Index of 0.562. Sensitivity analyses performed subsequently showed that the CRP/Alb ratio greater than 8 had a sensitivity of 84.9% in predicting mortality for all patients, while it had a sensitivity of 85.2% in predicting mortality for patients with a LOS of less than seven days.
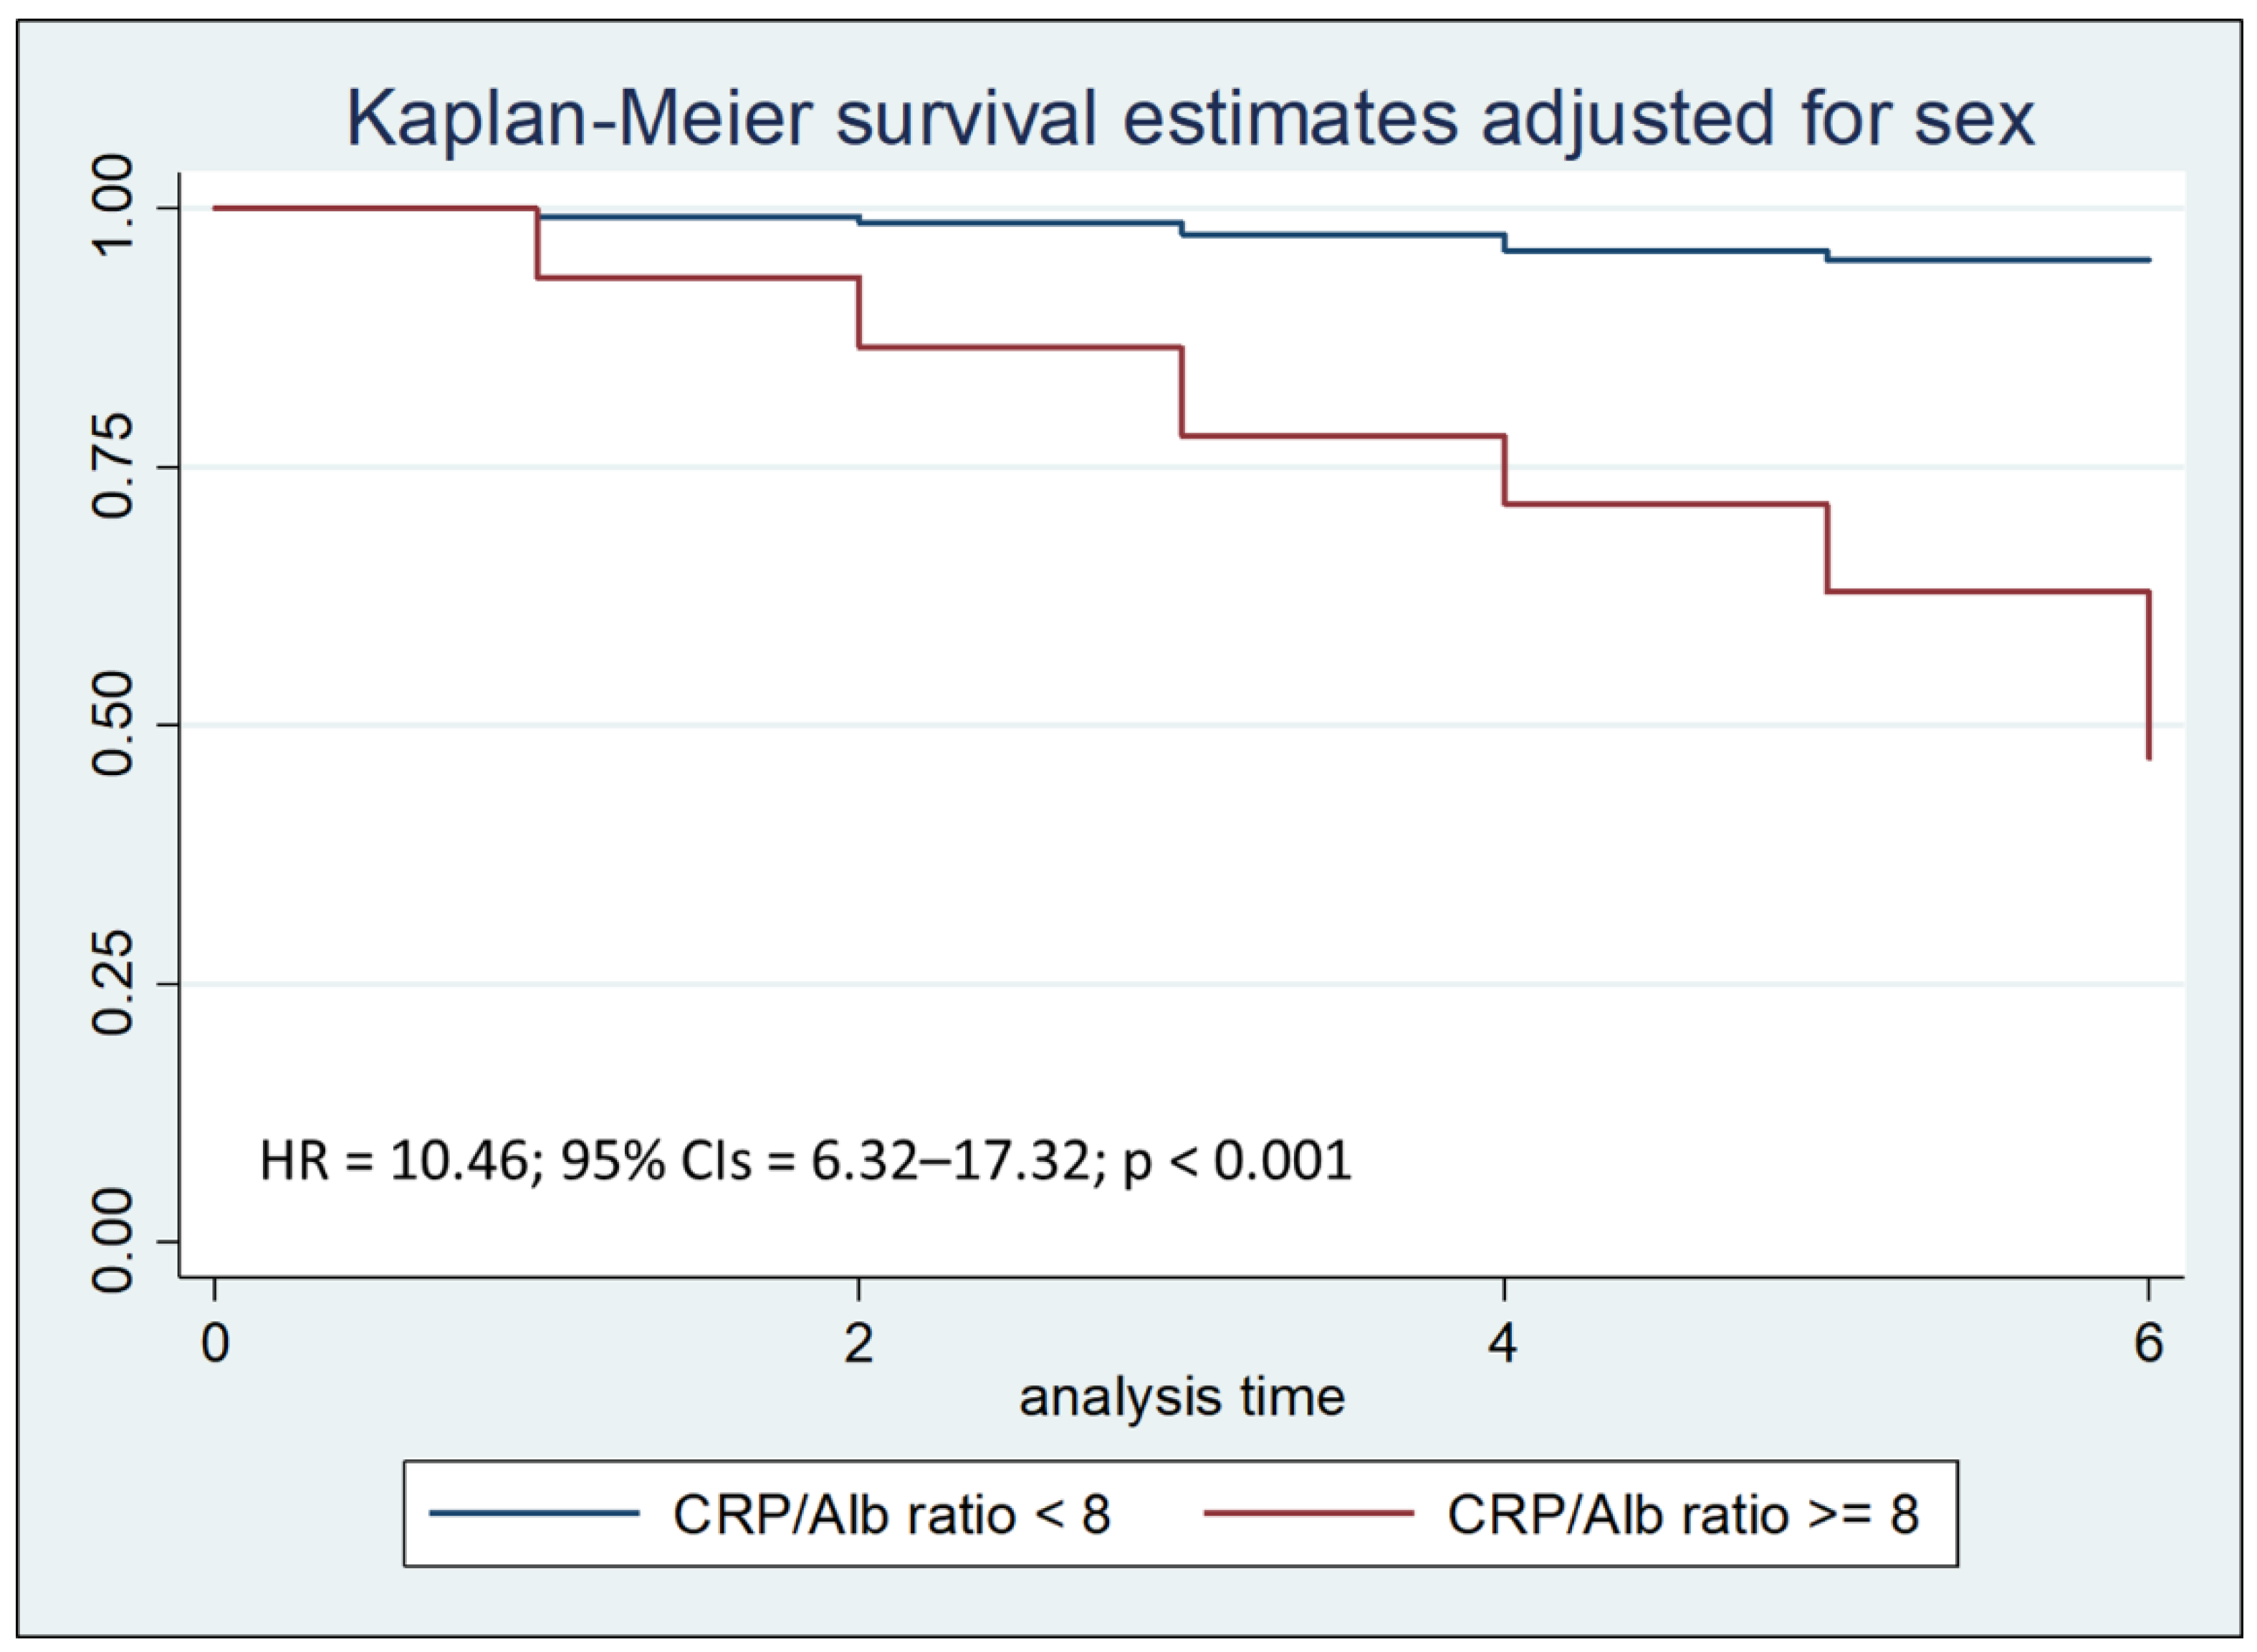
Cox regression analysis with the Breslow method, adjusted for sex and hospital stay days less than, equal to, or greater than seven days, highlighted that a CRP/Alb ratio greater than 8 is an independent risk factor for mortality during the first thirty days of hospitalization, with a Hazard Ratio (HR) of 3.07 (Figure 2a). In particular, a CRP/Alb ratio greater than 8 is a significant risk factor for mortality during the first seven days of hospitalization, with a HR of 10.46 (Figure 2b).
Figure 2a.
Kaplan–Meier survival estimates adjusted for sex stratified by CRP/Alb ratio < 8 vs CRP/Alb ratio >= 8 (chi-square 82.26; p < 0.001).
Figure 2a.
Kaplan–Meier survival estimates adjusted for sex stratified by CRP/Alb ratio < 8 vs CRP/Alb ratio >= 8 (chi-square 82.26; p < 0.001).
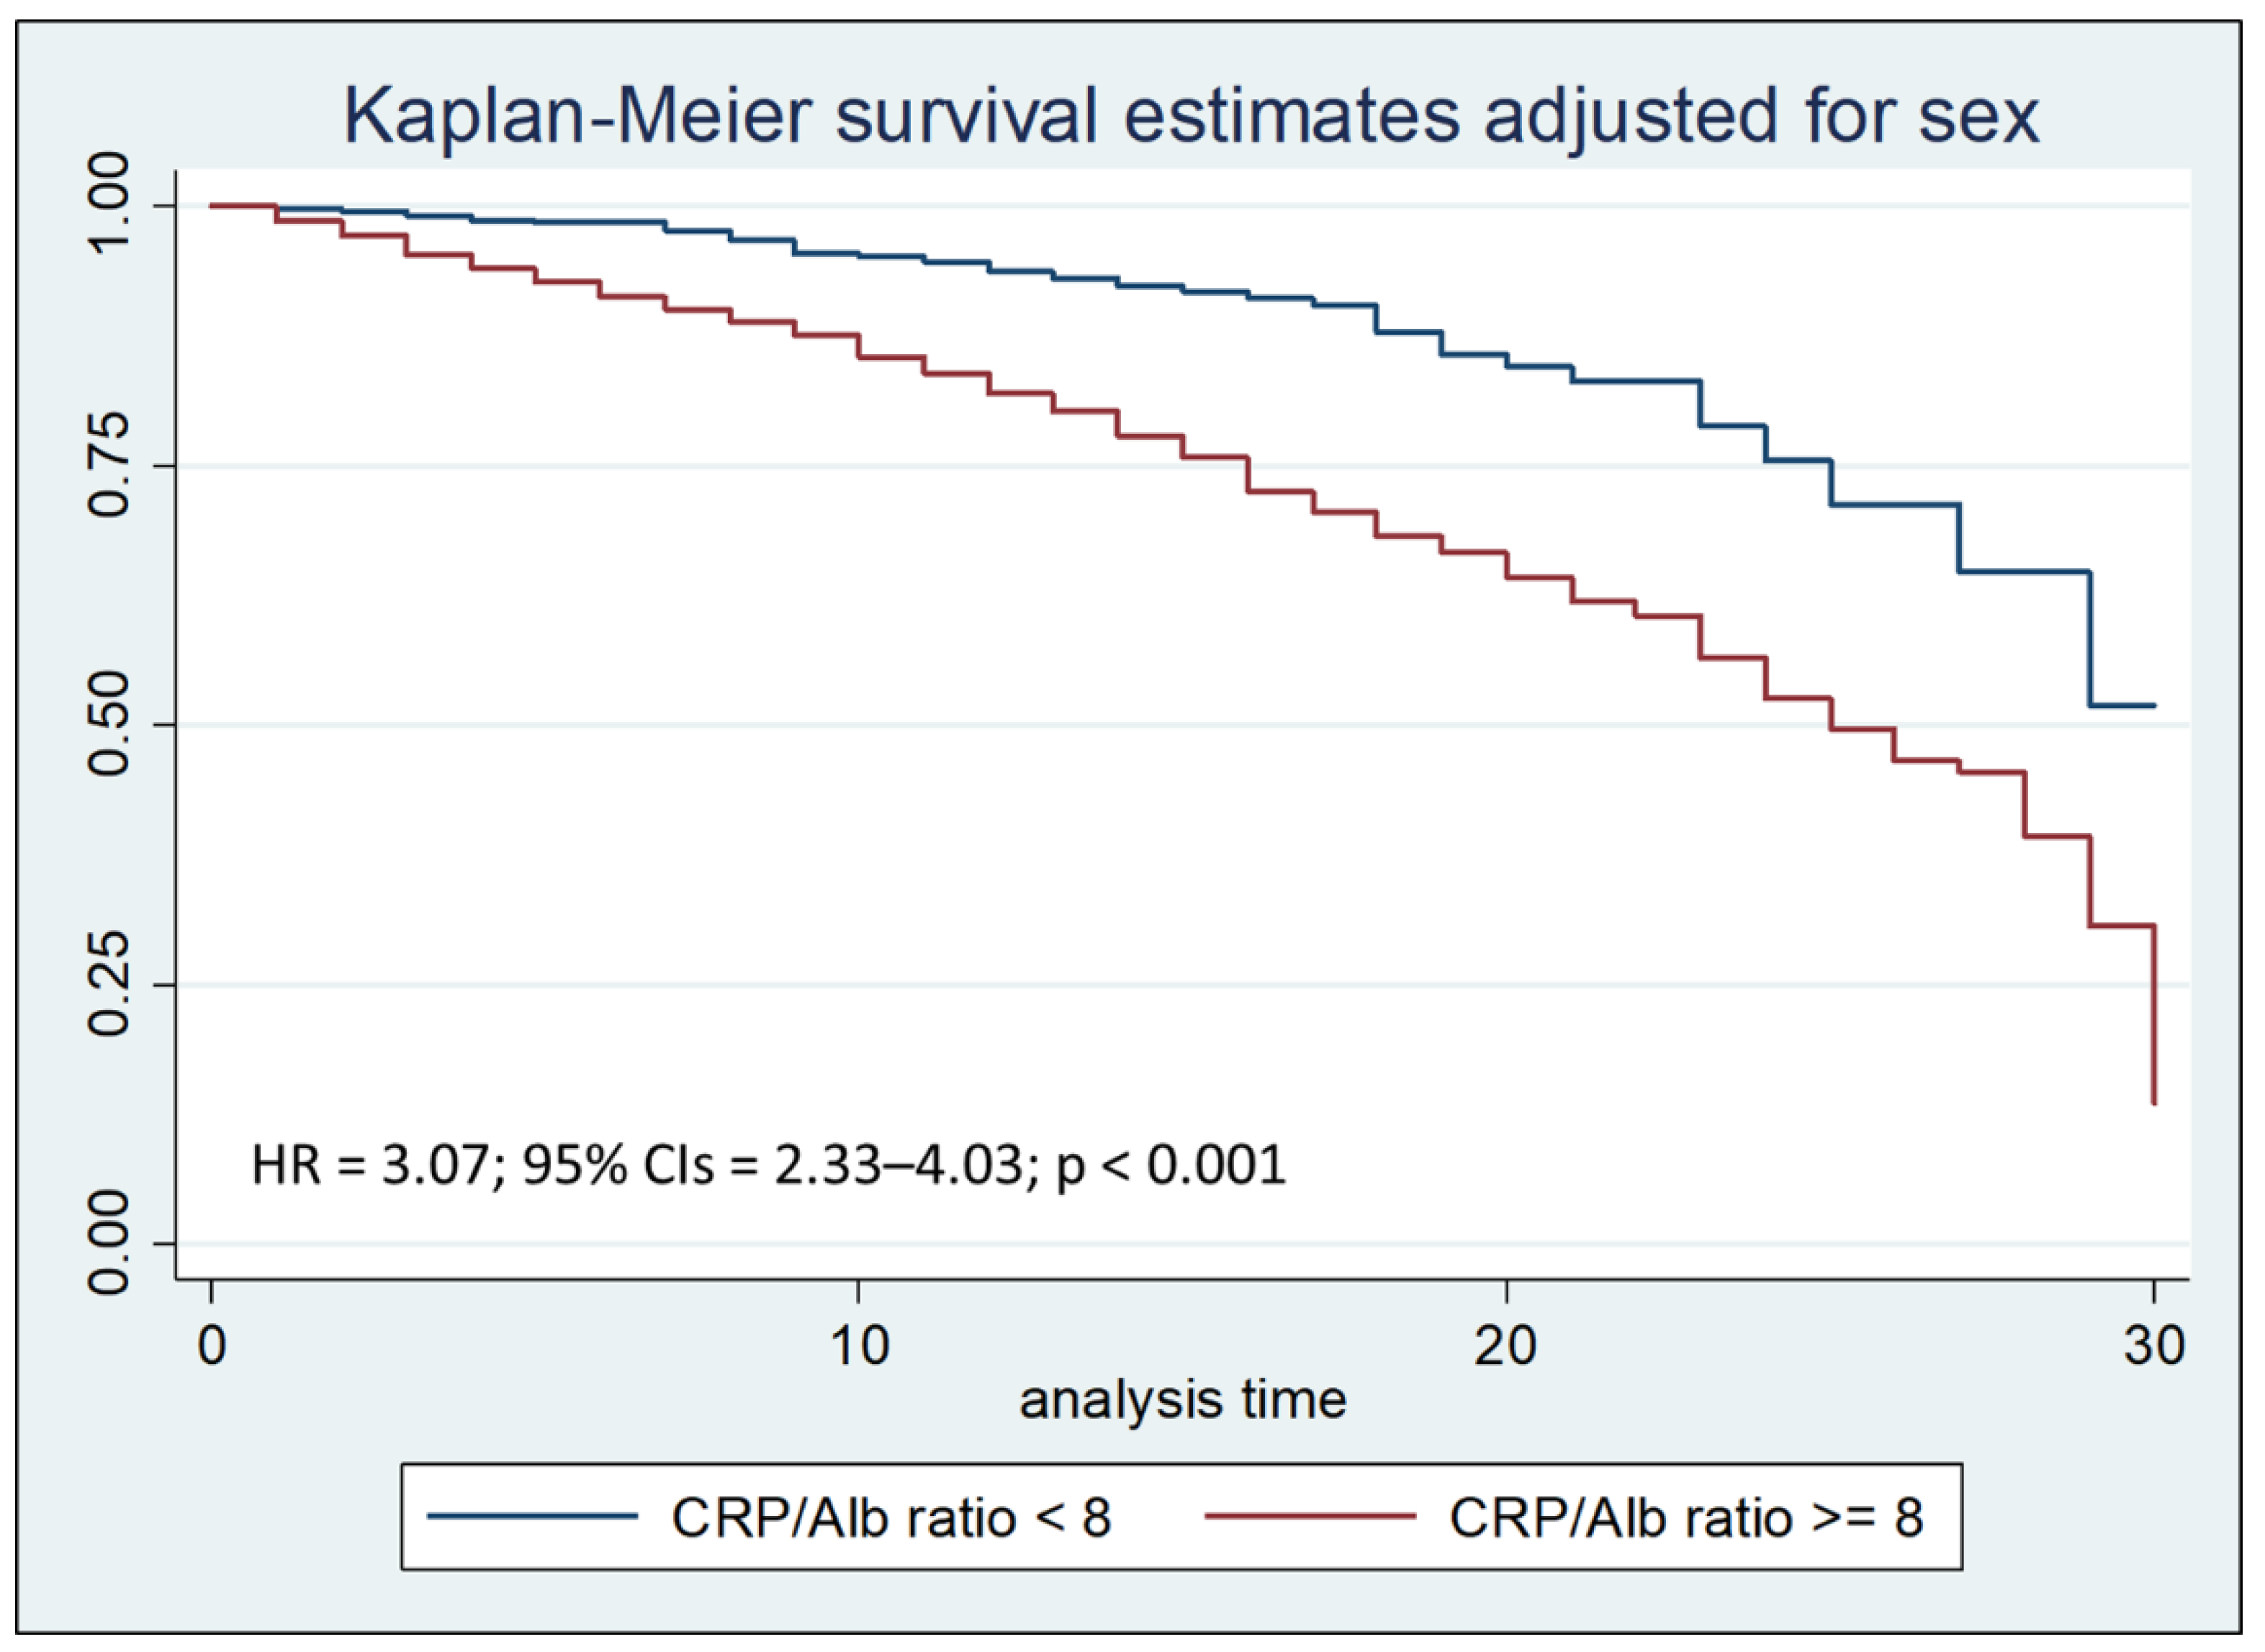
Figure 2b.
Kaplan–Meier survival estimates adjusted for sex stratified by PCR/Alb ratio < 8 vs PCR/Alb ratio >= 8 during the first seven days of hospitalization (chi-square 140.29; p < 0.001).
Figure 2b.
Kaplan–Meier survival estimates adjusted for sex stratified by PCR/Alb ratio < 8 vs PCR/Alb ratio >= 8 during the first seven days of hospitalization (chi-square 140.29; p < 0.001).
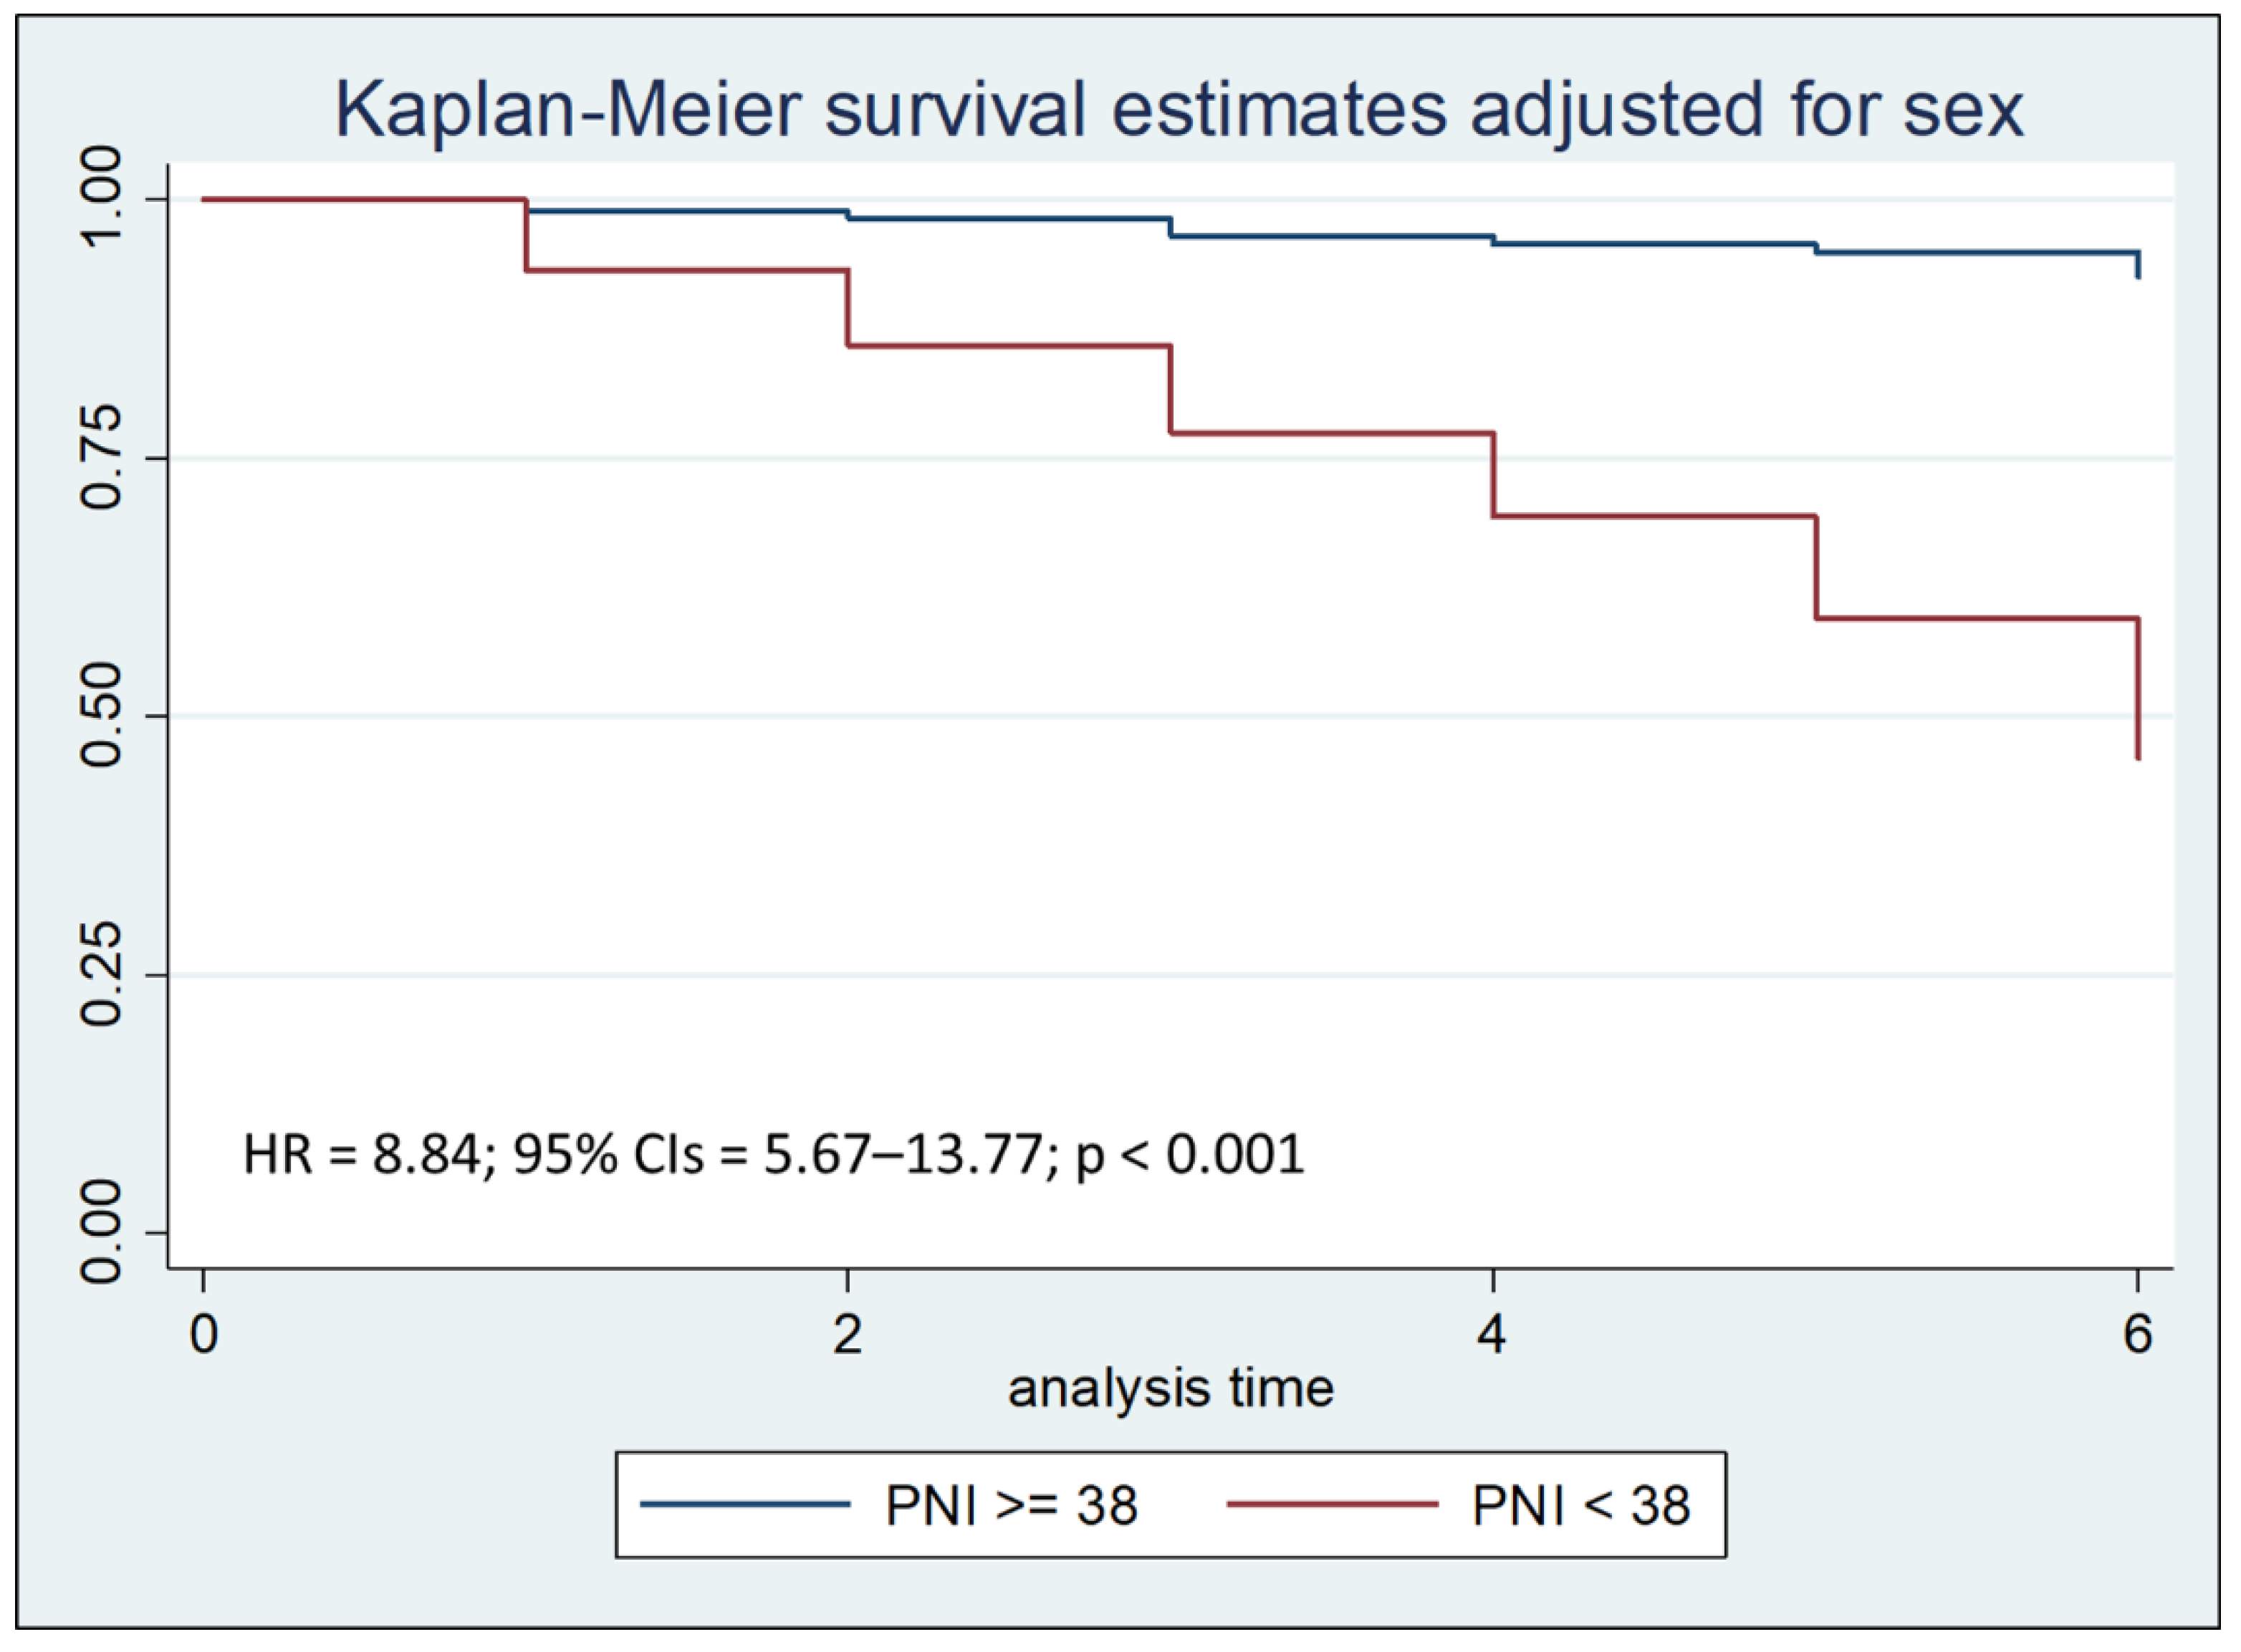
Cox regression analysis with the Breslow method, adjusted for sex and hospital stay days less than, equal to, or greater than seven days, highlighted that a PNI lower than 38 is an independent risk factor for mortality during the first thirty days of hospitalization, with a Hazard Ratio (HR) of 3.54 (Figure 3a). In particular, a PNI lower than 38 is a significant risk factor for mortality during the first seven days of hospitalization, with a HR of 8.84 (Figure 3b).
Figure 3a.
Kaplan–Meier survival estimates adjusted for sex stratified by PNI < 38 vs PNI >= 38 (chi-square 108.82; p < 0.001).
Figure 3a.
Kaplan–Meier survival estimates adjusted for sex stratified by PNI < 38 vs PNI >= 38 (chi-square 108.82; p < 0.001).
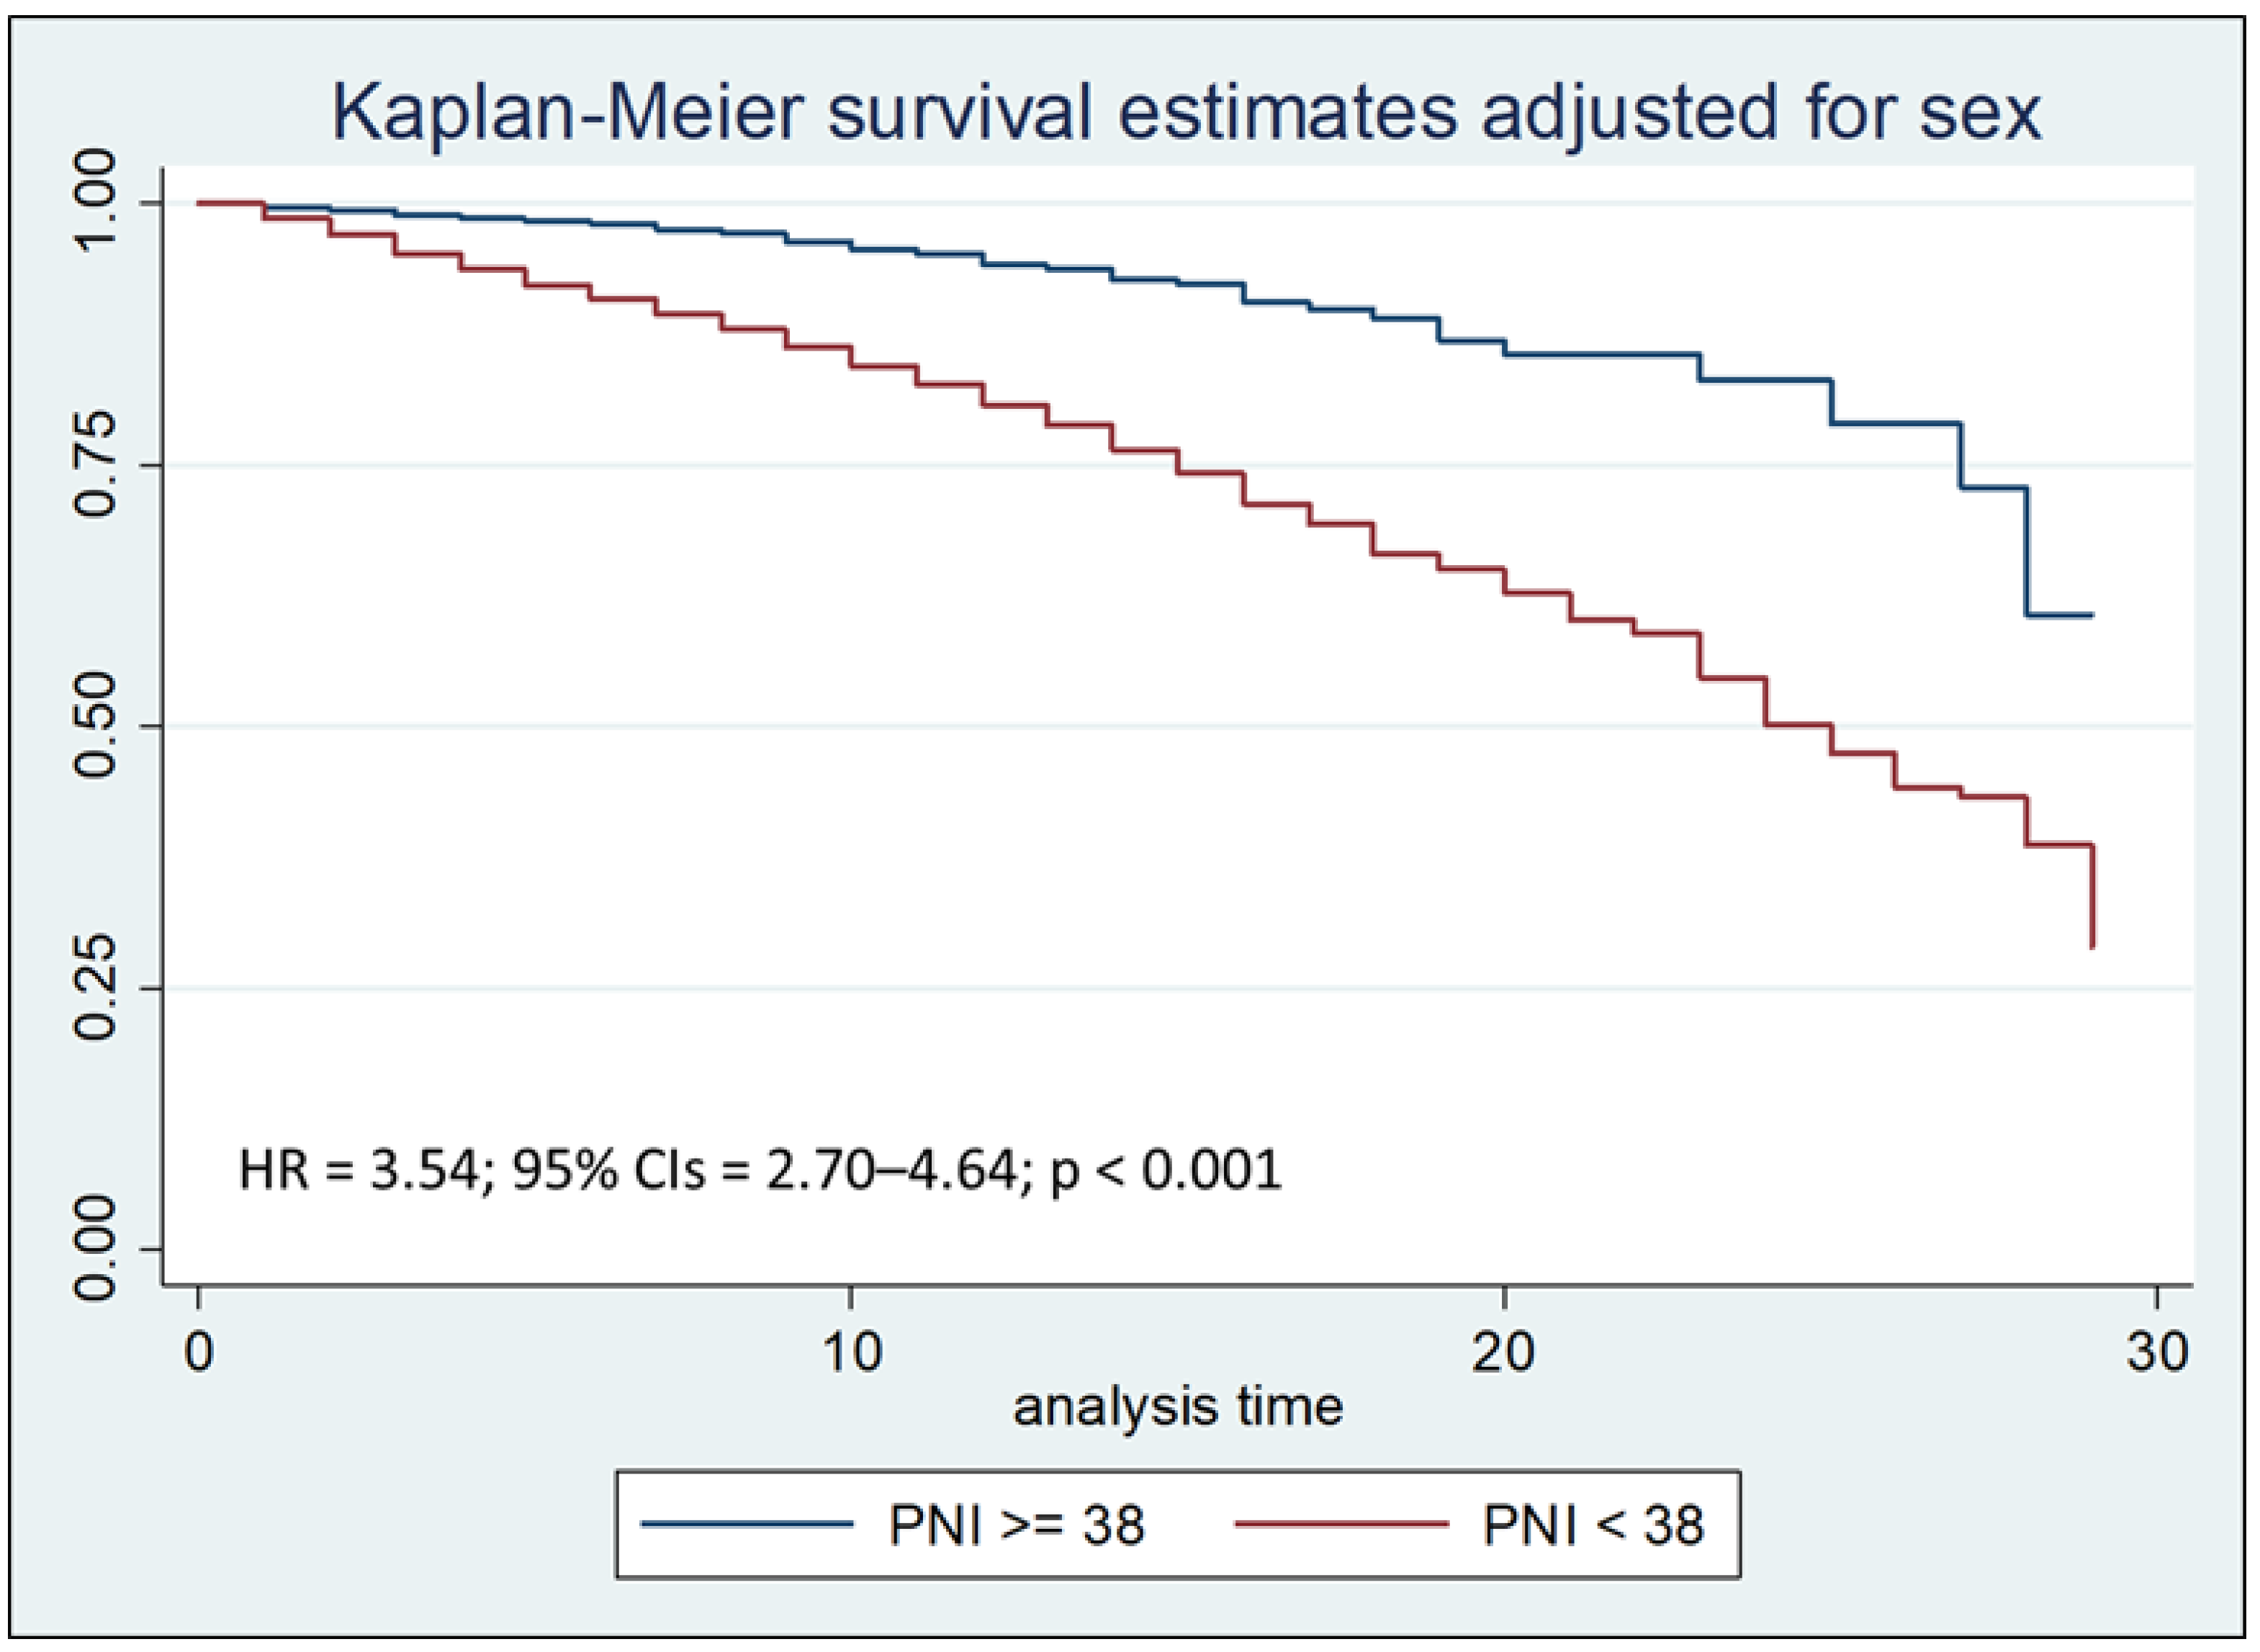
Figure 3b.
Kaplan–Meier survival estimates adjusted for sex stratified by PNI < 38 vs PNI >= 38 during the first seven days of hospitalization (chi-square 138.31; p < 0.001).
Figure 3b.
Kaplan–Meier survival estimates adjusted for sex stratified by PNI < 38 vs PNI >= 38 during the first seven days of hospitalization (chi-square 138.31; p < 0.001).
Survival analysis to compare the two Kaplan-Meier curves, performed with the Logrank test, after stratifying the sample by age at admission, showed that the PCR/Alb ratio higher than 8 was associated with a reduction in survival (p < 0.001), both after thirty days and after seven days from hospitalization.
The same test, after stratifying the sample by by age at admission, was also performed to compare the two Kaplan-Meier curves concerning PNI; Logrank test showed that PNI value lower than 38 was associated with a reduction in survival (p < 0.001), both after thirty days and after seven days from hospitalization
For 369 patients, hospital admission was considered a rehospitalization, defined as a return to the hospital within 30 days of discharge. For these patients, a CRP/Alb ratio of 8 or higher was associated with a significantly increased risk of mortality (p < 0.001), especially during the first seven days of hospitalization, with an odds ratio (OR) of 16.03; similarly, a PNI value less than 38 was associated with a significantly increased risk of mortality (p < 0.001) during the first seven days of hospitalization, with an OR of 48.4 (Table 6).
A similar pattern was observed among patients who were non-rehospitalized; also for these subjects, a PCR/Alb ratio equal to or greater than 8 was associated with a significant increase in the risk of mortality (p < 0.001) during the first seven days of hospitalization, with an OR of 15.02, while a PNI value lower than 38 was associated with an OR of 11.07 (p < 0.001) of the risk of mortality during the first seven days of hospitalization (Table 7).
We then calculated the PPV of mortality of the CRP/Alb ratio and PNI, respectively, both in non-rehospitalized patients (Table 8) and in re-hospitalized patients (Table 9); the Likelihood Ratio Test was then applied to verify which of the two models (CRP/Alb ratio vs PNI) was the most adequate as a predictor of mortality. The Likelihood Ratio Test analysis highlighted that, if among non-rehospitalized patients the PNI certainly represents a more refined mortality predictor than the CRP/Alb ratio, both among patients with LOS greater than or equal to seven days and among patients with LOS less than seven days (p<0.001), among re-hospitalized patients the PNI represents a more refined mortality predictor than the CRP/Alb ratio only among patients with LOS less than seven days (PPV CRP/Alb ratio= 51.67, PPV NPI= 52.38%; LR chi2= 9.25; p= 0.002); on the contrary, among patients with LOS greater than or equal to seven days, the most refined mortality predictor was represented by the CRP/Alb ratio (PPV CRP/Alb ratio = 32.98%, PPV NPI = 31.09%; LR chi2 = 13.6; p < 0.001).
4. Discussion
Population aging presents significant challenges to healthcare systems globally, with a notable increase in multi-morbid and frail older adults who often experience prolonged and recurrent hospitalizations, along with heightened healthcare costs. Malnutrition, particularly undernutrition, is a critical factor contributing to frailty and adverse clinical outcomes in hospitalized patients, encompassing inadequate energy and protein intake, micronutrient deficiencies, and substantial weight loss. This phenomenon is prevalent upon admission and frequently worsens during hospitalization, affecting a significant proportion of inpatients and leading to increased complications, longer lengths of stay (LOS), frequent rehospitalizations, poor treatment response, and elevated in-hospital mortality.
Our retrospective observational study aimed to investigate the prognostic significance of two readily accessible indices, the PNI and the CRP/Alb ratio, in predicting in-hospital mortality at 7- and 30-days post-admission in a cohort of elderly patients admitted to an Internal Medicine and Aging department.
The mean age of deceased patients in our cohort was 84 ± 8 years, significantly higher than that of non-deceased patients, who were 80 ± 8 years, respectively. Patients who died also had lower serum albumin (2.6 ± 0.6 g/dL vs. 3.1 ± 0.6 g/dL) and higher CRP levels (123.6 ± 95.9 mg/L vs. 67.6 ± 84.2 mg/L) compared to non-deceased patients. These demographic and biochemical differences further support the association of these markers with adverse outcomes. The leading cause of death was severe sepsis (49.8%), followed by pulmonary edema and respiratory failure (9.9%).
Both serum Alb and TLC are established markers of nutritional status, with low Alb levels indicating reduced hepatic protein synthesis and catabolic states, and declining TLC correlating with immune suppression and poor outcomes. The PNI, calculated from Alb and TLC, serves as a simple yet effective tool for classifying the nutritional status of elderly hospitalized patients and assessing their risk of mortality upon admission, as well as their risk of rehospitalization, which itself is a risk factor for adverse outcomes like death or loss of autonomy.
Furthermore, systemic inflammation significantly contributes to catabolic states and hypoalbuminemia. CRP, an inexpensive and sensitive inflammatory marker, when combined with albumin in the CRP/Alb ratio, provides a comprehensive assessment of both nutritional and inflammatory status. This ratio has consistently emerged as a strong predictor of early mortality, particularly in older hospitalized patients, regardless of admission diagnosis, and is highly relevant in the geriatric setting where inflammation and malnutrition often coexist.
Our findings corroborate and extend previous research on the predictive value of PNI and CRP/Alb ratio. [84,85]. In our study, a CRP/Alb ratio equal to or greater than 8 was associated with a significant increase in the risk of mortality (p < 0.001) during the first seven days of hospitalization, with an OR of 15.02, while, a PNI value lower than 38 was associated with an OR of 11.07 (p < 0.001) for the risk of mortality during the first seven days of hospitalization. These results highlight the critical importance of these markers for early risk stratification.
Notably, the Likelihood Ratio Test analysis revealed distinct predictive strengths for PNI and CRP/Alb ratio depending on patient subsets. Among non-rehospitalized patients, PNI consistently demonstrated superior predictive power for mortality compared to the CRP/Alb ratio, irrespective of the LOS (p < 0.001). However, among re-hospitalized patients, PNI was a more refined mortality predictor than the CRP/Alb ratio only among those with a LOS of less than seven days, with a PPV of 52.38% respect to the PPV of 51.67% of the CRP/Alb ratio. Conversely, for re-hospitalized patients with a LOS greater than or equal to seven days, the CRP/Alb ratio was the more refined mortality predictor, with a PPV CRP/Alb ratio of 32.98%. These findings, while nuanced, underscore the context-dependent utility of these biomarkers.
Our findings also provide additional comparative analyses of PNI and CRP/Alb ratio. While prior studies established the individual prognostic value of these indices, this work offers a deeper exploration into their differential predictive capabilities across various clinical scenarios, specifically distinguishing their performance in re-hospitalized versus non-rehospitalized patients and considering the impact of LOS. The current study’s emphasis on these distinct patient populations and the head-to-head comparison of PNI and CRP/Alb ratio for early mortality prediction represent novel contributions to the existing literature, highlighting the specific circumstances under which one marker may outperform the other.
Our findings reinforce the necessity of early identification of older adults at high risk of in-hospital mortality. The PNI and CRP/Alb ratio, being easily calculated from routine laboratory tests, offer valuable tools for risk stratification at admission. Given the observed differences in predictive performance based on rehospitalization status and LOS, a personalized approach to patient assessment and management is crucial. Tailored interventions, including optimized nutritional support and inflammation management, can potentially improve clinical outcomes and reduce mortality in these vulnerable populations.
The fact that this is a retrospective study also constitutes a limitation, as it allowed us to collect biochemical data from medical records only at the time of hospital admission; in many cases, updated biochemical parameters before discharge or death were missing. Another limitation of our study was the lack of comorbidity indices in hospital medical records, which could not be obtained retrospectively. Future research could explore integrating these markers with comprehensive geriatric assessments and comorbidity data to develop even more robust predictive models.
5. Conclusions
This study demonstrates that both the PNI and the CRP/Alb ratio are significant and accessible early predictors of in-hospital mortality in elderly patients. While both markers are valuable, their predictive strengths vary depending on the patient's rehospitalization status and LOS. PNI generally serves as a more refined mortality predictor in non-rehospitalized patients, whereas the CRP/Alb ratio can be more indicative in certain re-hospitalized subgroups with longer LOS. These findings underscore the importance of utilizing these simple yet powerful biomarkers for early risk stratification and highlight the critical need for personalized assessment and targeted interventions to improve outcomes in high-risk older adults.
The strengths of this study include its large sample size and the homogeneity of the population, limited to patients aged 65 and above, which enhances its applicability to geriatric care. However, its retrospective nature and reliance on admission-only laboratory data are notable limitations. The lack of discharge or pre-mortem values limits the capacity to track biomarker evolution and treatment response.
Despite these limitations, the findings underscore the clinical utility of the CRP/Alb ratio an PNI as simple, cost-effective tools for early mortality risk stratification in elderly hospitalized patients. Future prospective studies with serial biomarker measurements and more detailed clinical data are warranted to validate these findings and integrate the CRP/Alb ratio into comprehensive geriatric assessment protocols. Integrating this biomarker into routine evaluation could support timely interventions and improve outcomes in a rapidly aging patient population.
Author Contributions
Conceptualization, C.C., A.L.B. and F.B.; methodology, C.C. and A.L.B.; software, C.C..; validation, G.S.; formal analysis, C.C. and F.B.; investigation, C.C.; data curation, C.C.; writing and original draft preparation, C.C.; writing and review and editing, G.S. All authors have read and agreed to the published version of the manuscript.
Funding
This research received no external funding
Institutional Review Board Statement
The study was conducted in accordance with the Declaration of Helsinki and approved by the Ethics Committee of Policlinico Riuniti di Foggia (protocol code 161/2023, approval date 23 October 2023).
Informed Consent Statement
Informed consent was obtained from all subjects involved in the study.
Data Availability Statement
Data is unavailable due to privacy restrictions.
Acknowledgments
The Fondazione Dieta Mediterranea, Roma, Italy endorsed this article. https://www.fondazionedietamediterranea.it/ (accessed on 14 July 2025).
Conflicts of Interest
The authors declare no conflicts of interest.
References
- World Health Organization. Available online: https://www.who.int/news-room/fact-sheets/detail/ageing-and-health (accessed on 25 June 2025).
- National Institute of Population and Social Security Research. Population Projections for Japan (January 2012): 2011 to 2060. Available online: https://www.ipss.go.jp/index-e.asp (accessed on 25 June 2025).
- National Institute of Statistics. Available online: https://www.istat.it/produzione-editoriale/rapporto-annuale-2025-la-situazione-del-paese-il-volume (accessed on 25 June 2025).
- Volkert, D.; Beck, A.M.; Cederholm, T.; Cereda, E.; Cruz-Jentoft, A.; Goisser, S.; de Groot, L.; Großhauser, F.; Kiesswetter, E.; Norman, K.; et al. Management of Malnutrition in Older Patients—Current Approaches, Evidence and Open Questions. J. Clin. Med. 2019, 8, 974. [Google Scholar] [CrossRef] [PubMed]
- Cederholm, T.; Barazzoni, R.; Austin, P.; Ballmer, P.; Biolo, G.; Bischoff, S.C.; Compher, C.; Correia, I.; Higashiguchi, T.; Holst, M.; et al. ESPEN guidelines on definitions and terminology of clinical nutrition. Clin. Nutr. 2017, 36, 49–64. [Google Scholar] [CrossRef] [PubMed]
- Fried, L.P.; Tangen, C.M.; Walston, J.; Newman, A.B.; Hirsch, C.; Gottdiener, J.; Seeman, T.; Tracy, R. ; Kop,W. J.; Burke, G.; et al. Frailty in older adults: Evidence for a phenotype. J. Gerontol. A Biol. Sci. Med. Sci. 2001, 56, M146–M156. [Google Scholar]
- Walston, J.; Hadley, E.C.; Ferrucci, L.; Guralnik, J.M.; Newman, A.B.; Studenski, S.A.; Ershler, W.B.; Harris, T.; Fried, L.P. Research agenda for frailty in older adults: Toward a better understanding of physiology and etiology: Summary from the American Geriatrics Society/National Institute on Aging Research Conference on Frailty in Older Adults. J. Am. Geriatr. Soc. 2006, 54, 991–1001. [Google Scholar] [CrossRef]
- Eeles, E.M.; White, S.V.; O’Mahony, S.M.; Bayer, A.J.; Hubbard, R.E. The impact of frailty and delirium on mortality in older inpatients. Age Ageing 2012, 41, 412–416. [Google Scholar] [CrossRef]
- Garagnani, P.; Capri, M.; Salvioli, S.; Santoro, A.; Morsiani, C.; Franceschi, C.; Monti, D.; Conte, M.; Grignolio, A. The Continuum of aging and age-related diseases: Common mechanisms but different rates. Front. Med. 2018, 5, 61. [Google Scholar] [CrossRef]
- Pisano, C.; Polisano, D.; Balistreri, C.R.; Altieri, C.; Nardi, P.; Bertoldo, F.; Trombetti, D.; Asta, L.; Ferrante, M.S.; Buioni, D.; et al. Role of cachexia and fragility in the patient candidate for cardiac surgery. Nutrients 2021, 13, 517. [Google Scholar] [CrossRef]
- Petermann-Rocha, F.; Pell, J.P.; Celis-Morales, C.; Ho, F.K. Frailty, sarcopenia, cachexia and malnutrition as comorbid conditionsvand their associations with mortality: A prospective study from UK Biobank. J. Public Health 2022, 44, e172–e180. [Google Scholar] [CrossRef]
- World Health Organization. Available online: https://www.who.int/news-room/fact-sheets/detail/malnutrition (accessed on 26 June 2025).
- Guigoz, Y. The mini nutritional assessment (MNA) review of the literature e what does it tell us? J. Nutr. Health Aging 2006, 10, 466–485. [Google Scholar]
- Wolf, C.; Jauch, K.-W.; Bischoff, S.C.; Lochs, H.; Weimann, A.; Schindler, K.; Frieling, T.; Bolder, U.; Schütz, T.; Pirlich, M.; et al. The German hospital malnutrition study. Clin. Nutr. 2006, 25, 563–572. [Google Scholar] [CrossRef]
- Banks, M.; Ash, S.; Bauer, J.; Gaskill, D. Prevalence of malnutrition in adults in Queensland public hospitals and residential aged care facilities. Nutr. Diet. 2007, 64, 172–178. [Google Scholar] [CrossRef]
- Kondrup, J.; Sorensen, J.M. The magnitude of the problem of malnutrition in Europe. Nestle Nutr. Workshop Ser. Clin. Perform. Program 2009, 12, 1–14. [Google Scholar]
- Waitzberg, D.L.; Caiaffa, W.T.; Correia, M.I.T.D. Hospital malnutrition: The Brazilian national survey (IBRANUTRI): A study of 4000 patients. Nutrition 2001, 17, 573–580. [Google Scholar] [CrossRef]
- Aghdassi, E.; McArthur, M.; Liu, B.; McGeer, A.; Simor, A.; Allard, J.P. Dietary intake of elderly living in Toronto long-term care facilities: Comparison to the dietary reference intake. Rejuvenation Res. 2007, 10, 301–309. [Google Scholar] [CrossRef] [PubMed]
- Singh, H.; Watt, K.; Veitch, R.; Cantor, M.; Duerksen, D.R. Malnutrition is prevalent in hospitalized medical patients: Are housestaff identifying the malnourished patient? Nutrition 2006, 22, 350–354. [Google Scholar] [CrossRef] [PubMed]
- Villalon, L.; Laporte, M.; Carrier, N. Nutrition screening for seniors in health care facilities: A survey of health professionals. Can. J. Diet. Pract. Pract. Res. 2011, 72, 162–169. [Google Scholar] [CrossRef] [PubMed]
- Slee, A.; Birch, D.; Stokoe, D. The relationship between malnutrition risk and clinical outcomes in a cohort of frail older hospital patients. Clin. Nutr. ESPEN 2016, 15, 57–62. [Google Scholar] [CrossRef]
- Amaral, T.F.; Matos, L.C.; Teixeira, M.A.; Tavares, M.M.; Alvares, L.; Antunes, A. Undernutrition and associated factors among hospitalized patients. Clin. Nutr. 2010, 29, 580–585. [Google Scholar] [CrossRef]
- Kondrup, J.; Johansen, N.; Plum, L.M.; Bak, L.; Larsen, I.H.; Martinsen, A.; Andersen, J.R.; Baernthsen, H.; Bunch, E.; Lauesen, N. Incidence of nutritional risk and causes of inadequate nutritional care in hospitals. Clin. Nutr. 2002, 21, 461–468. [Google Scholar] [CrossRef]
- Lou, W.; Gramlich, L.; Jeejeebhoy, K.N.; Laporte, M.; Allard, J.P.; Davidson, B.; Keller, H.; Bernier, P.; Teterina, A.; Duerksen, D.R.; et al. Decline in nutritional status is associated with prolonged length of stay in hospitalized patients admitted for 7 days or more: A prospective cohort study. Clin. Nutr. 2016, 35, 144–152. [Google Scholar] [CrossRef]
- Omran, M.L.; Morley, J.E. Evaluation of protein-energy malnutrition in older people, Part II: Laboratory evaluation. Nutrition 2000, 16, 131–140. [Google Scholar] [CrossRef]
- Lowrie, E.; Lew, N. Death risk in hemodialysis patients: The predictive value of commonly measured variables and an evaluation of death rate differences between facilities. Am. J. Kidney Dis. 1990, 15, 458–482. [Google Scholar] [CrossRef] [PubMed]
- United States Renal Data System. Combined conditions and correlation with mortality risk among 3399 incident hemodialysis patients. Am. J. Kidney Dis. 1992, 20 (Suppl. S2), 32.
- Guijarro, C.; Massy, Z.A.; Wiederkehr, M.R.; Ma, J.Z.; Kasiske, B.L. Serum albumin and mortality after renal transplantation. Am. J. Kidney Dis. 1996, 27, 117–123. [Google Scholar] [CrossRef] [PubMed]
- Tal, S.; Guller, V.; Shavit, Y.; Stern, F.; Malnick, S. Mortality predictors in hospitalized elderly patients. Q. Jour Med. 2011, 104, 933–938. [Google Scholar] [CrossRef]
- Lyons, O.; Whelan, B.; Bennett, K.; O’Riordan, D.; Silke, B. Serum albumin as an outcome predictor in hospital emergency medical admissions. Eur. J. Int. Med. 2010, 21, 17–20. [Google Scholar] [CrossRef]
- Marik, P.E. The treatment of hypoalbuminemia in the critically ill patient. Heart Lung 1993, 22, 166–170. [Google Scholar]
- Haller, C. Hypoalbuminemia in Renal Failure. Pathogenesis and Therapeutic Considerations. Kidney Blood Press Res. 2005, 28, 307–310. [Google Scholar] [CrossRef]
- Namendys-Silva, S.A.; Gonzalez-Herrera, M.O.; Herrera-Gomez, A. Hypoalbuminemia in Critically Ill patients With Cancer: Incidence and Mortality. Am. J. Hosp. Palliat. Med. 2011, 28, 253–257. [Google Scholar] [CrossRef]
- Oster, H.S.; Dolev, Y.; Kehat, O.; Weis-Meilik, A.; Mittelman, M. Serum Hypoalbuminemia Is a Long-Term Prognostic Marker in Medical Hospitalized Patients, Irrespective of the Underlying Disease. J. Clin. Med. 2022, 11, 1207. [Google Scholar] [CrossRef]
- Akirov, A.; Masri-Iraqi, H.; Atamna, A.; Shimon, I. Low Albumin Levels Are Associated with Mortality Risk in Hospitalized Patients. Am. J. Med. 2017, 130, 1465. [Google Scholar] [CrossRef] [PubMed]
- Goldwasser, P.; Feldman, J. Association of serum albumin and mortality risk. J. Clin. Epidemiol. 1997, 50, 693–703. [Google Scholar] [CrossRef] [PubMed]
- Carriere, I.; Dupuy, A.-M.; Lacroux, A.; Cristol, J.-P.; Delcourt, C. ; Pathologies Oculaires Liées à l’Age Study Group. Biomarkers of Inflammation and Malnutrition Associated with Early Death in Healthy Elderly People. J. Am. Geriatr. Soc. 2008, 56, 840–846. [Google Scholar]
- Knaus, W.A.; Wagner, D.P.; Draper, E.A.; Zimmerman, J.E.; Bergner, M.; Bastos, P.G.; Sirio, C.A.; Murphy, D.J.; Lotring, T.; Damiano, A.; et al. The APACHE III prognostic system-risk prediction of hospital mortality for critically ill hospitalized adults. Chest 1991, 100, 1619. [Google Scholar] [CrossRef]
- Phillips, A.; Shaper, A.G.; Whincup, P.H. Association between serum albumin and mortality from cardiovascular disease, cancer, and other causes. Lancet 1989, 2, 1434–1436. [Google Scholar] [CrossRef]
- Gillum, R.F.; Makuc, D.M. Serum albumin, coronary heart disease, and death. Am. Heart J. 1992, 123, 507–513. [Google Scholar] [CrossRef]
- Klonoff-Cohen, H.; Barrett-Connor, E.L.; Edelstein, S.L. Albumin levels as a predictor of mortality in the healthy elderly. J. Clin. Epidemiol. 1992, 45, 207–212. [Google Scholar] [CrossRef]
- Corti, M.C.; Guralnik, J.M.; Salive, M.E.; Sorkin, J.D. Serum albumin level and physical disability as predictors of mortality in older persons. J. Am. Med. Assoc. 1994, 272, 1036–1042. [Google Scholar] [CrossRef]
- Law, M.R.; Morris, J.K.; Wald, N.J.; Hale, A.K. Serum albumin and mortality in the BUPA study. Int. J. Epidemiol. 1994, 23, 38–41. [Google Scholar] [CrossRef]
- Kuller, L.H.; Eichner, J.E.; Orchard, T.J.; Grandits, G.A.; McCallum, L.; Tracy, R.P. The relation between serum albumin and risk of coronary heart disease in the multiple risk factor intervention trial. Am. J. Epidemiol. 1991, 134, 1266–1277. [Google Scholar] [CrossRef]
- Lewis, E.J.; Stacey, J.B. Nutritional assessment of the elderly. In Geriatric Nutrition; Morley, J.E., Glick, Z., Rubenstein, L.Z., Eds.; Raven Press: New York, NY, USA, 1990; Volume 73. [Google Scholar]
- Silver, A.J.; Morley, J.E.; Strome, L.S.; Jones, D.; Vickers, L. Nutritional status in academic nursing home. J. Am. Geriatr. Soc. 1988, 36, 487–491. [Google Scholar] [CrossRef]
- Mitchell, C.O.; Lipschitz, D.A. The effect of age and sex on the routinely used measurements to assess the nutritional status. Am. J. Clin. Nutr. 1982, 36, 340–349. [Google Scholar] [CrossRef] [PubMed]
- Buzby, G.P.; Mullen, J.L.; Matthews, D.C.; Hobbs, C.L.; Rosato, E.F. Prognostic nutritional index in gastrointestinal surgery. Am. J. Surg. 1980, 139, 160–167. [Google Scholar] [CrossRef] [PubMed]
- Onodera, T.; Goseki, N.; Kosaki, G. Prognostic nutritional index in gastrointestinal surgery of malnourished cancer patients. Nihon Geka Gakkai Zasshi 1984, 85, 1001–1005. [Google Scholar] [PubMed]
- Cadwell, J.B.; Afonso, A.M.; Shahrokni, A. Prognostic nutritional index (PNI), independent of frailty is associated with six-month postoperative mortality. J. Geriatr. Oncol. 2020, 11, 880–884. [Google Scholar] [CrossRef]
- Tokunaga, R.; Sakamoto, Y.; Nakagawa, S.; Miyamoto, Y.; Yoshida, N.; Oki, E.; Watanabe, M.; Baba, H. Prognostic nutritional index predicts severe complications, recurrence, and poor prognosis in patients with colorectal cancer undergoing primary tumor resection. Dis. Colon. Rectum. 2015, 58, 1048–1057. [Google Scholar] [CrossRef]
- Mohri, Y.; Inoue, Y.; Tanaka, K.; Hiro, J.; Uchida, K.; Kusunoki, M. Prognostic nutritional index predicts postoperative outcome in colorectal cancer. World J. Surg. 2013, 37, 2688–2692. [Google Scholar] [CrossRef]
- Kanda, M.; Fujii, T.; Kodera, Y.; Nagai, S.; Takeda, S.; Nakao, A. Nutritional predictors of postoperative outcome in pancreatic cancer. Br. J. Surg. 2011, 98, 268–274. [Google Scholar] [CrossRef]
- Mohri, T.; Mohri, Y.; Shigemori, T.; Takeuchi, K.; Itoh, Y.; Kato, T. Impact of prognostic nutritional index on long-term outcomes in patients with breast cancer. World J. Surg. Oncol. 2016, 14, 170. [Google Scholar] [CrossRef]
- Mori, S.; Usami, N.; Fukumoto, K.; Mizuno, T.; Kuroda, H.; Sakakura, N.; Yokoi, K.; Sakao, Y. The significance of the prognostic nutritional index in patients with completely resected non-small cell lung cancer. PLoS ONE 2015, 10, e0136897. [Google Scholar] [CrossRef]
- Cao, J.J.; Arnold, A.M.; Manolio, T.A.; Polak, J.F.; Psaty, B.M.; Hirsch, C.H.; Kuller, L.H.; Cushman, M. Association of carotid artery intima-media thickness, plaques, and C-reactive protein with future cardiovascular disease and all-cause mortality: The Cardiovascular Health Study. Circulation 2007, 116, 32–38. [Google Scholar] [CrossRef]
- Currie, C.J.; Poole, C.D.; Conway, P. Evaluation of the association between the first observation and the longitudinal change in C-reactive protein, and all-cause mortality. Heart 2008, 94, 457–462. [Google Scholar] [CrossRef] [PubMed]
- Zacho, J.; Tybjærg-Hansen, A.; Nordestgaard, B.G. C-reactive protein and all-cause mortality—The Copenhagen City Heart Study. Eur. Heart J. 2010, 31, 1624–1632. [Google Scholar] [CrossRef] [PubMed]
- Jellinge, M.E.; Henriksen, D.P.; Hallas, P.; Brabrand, M. Hypoalbuminemia Is a Strong Predictor of 30-Day All-Cause Mortality in Acutely Admitted Medical Patients: A Prospective, Observational, Cohort Study. PLoS ONE 2014, 9, e105983. [Google Scholar] [CrossRef] [PubMed]
- Quispe, E.A.; Li, X.M.; Yi, H. Comparison and relationship of thyroid hormones, il-6, il-10 and albumin as mortality predictors in case-mix critically ill patients. Cytokine 2016, 81, 94–100. [Google Scholar] [CrossRef]
- Dominguez de Villota, E.; Mosquera, J.M.; Rubio, J.J.; Galdos, P.; Diez Balda, V.; de la Serna, J.L.; Tomas, M.I. Association of a low serum albumin with infection and increased mortality in critically ill patients. Intensive Care Med. 1980, 7, 19–22. [Google Scholar] [CrossRef]
- Povoa, P. C-reactive protein: A valuable marker of sepsis. Intensive Care Med. 2002, 28, 235–243. [Google Scholar] [CrossRef]
- Oh, T.K.; Ji, E.; Na, H.-s.; Min, B.; Jeon, Y.-T.; Do, S.-H.; Song, I.-A.; Park, H.-P.; Hwang, J.-W. C-Reactive Protein to Albumin Ratio Predicts 30-Day and 1-Year Mortality in Postoperative Patients after Admission to the Intensive Care Unit. J. Clin. Med. 2018, 7, 39. [Google Scholar] [CrossRef]
- Devran, Ö.; Karakurt, Z.; Adıgüzel, N.; Güngör, G.; Moçin, Ö.Y.; Balcı, M.K.; Saltürk, C.; Takır, H.B.; Kargın, F.; Yılmaz, A. C-reactive protein as a predictor of mortality in patients affected with severe sepsis in intensive care unit. Multidiscip. Respir. Med. 2012, 7, 47. [Google Scholar] [CrossRef]
- Quispe, E.A.; Li, X.M.; Yi, H. Comparison and relationship of thyroid hormones, il-6, il-10 and albumin as mortality predictors in case-mix critically ill patients. Cytokine 2016, 81, 94–100. [Google Scholar] [CrossRef]
- Sanson, G.; Bertocchi, L.; Dal Bo, E.; Di Pasquale, C.L.; Zanetti, M. Identifying reliable predictors of protein-energy malnutrition in hospitalized frail older adults: A prospective longitudinal study. Int. J. Nurs. Stud. 2018, 82, 40–48. [Google Scholar] [CrossRef]
- Kim, M.H.; Ahn, J.Y.; Song, J.E.; Choi, H.; Ann, H.W.; Kim, J.K.; Kim, J.H.; Jeon, Y.D.; Kim, S.B.; Jeong, S.J.; et al. The C-reactive protein/albumin ratio as an independent predictor of mortality in patients with severe sepsis or septic shock treated with early goal-directed therapy. PLoS ONE 2015, 10, e0132109. [Google Scholar] [CrossRef]
- Ranzani, O.T.; Zampieri, F.G.; Forte, D.N.; Azevedo, L.C.; Park, M. C-reactive protein/albumin ratio predicts 90-day mortality of septic patients. PLoS ONE 2013, 8, e59321. [Google Scholar] [CrossRef] [PubMed]
- Iwata, M.; Kuzuya, M.; Kitagawa, Y.; Iguchi, A. Prognostic value of serum albumin combined with serum C-reactive protein levels in older hospitalized patients: Continuing importance of serum albumin. Aging Clin. Exp. Res. 2006, 18, 307–311. [Google Scholar] [CrossRef] [PubMed]
- Donini, L.M.; Savina, C.; Ricciardi, L.M.; Coletti, C.; Paolini, M.; Scavone, L.; De Felice, M.R.; Laviano, A.; Fanelli, F.R.; Cannella, C. Predicting the outcome of artificial nutrition by clinical and functional indices. Nutrition 2009, 25, 11–19. [Google Scholar] [CrossRef] [PubMed]
- Candeloro, M.; Di Nisio, M.; Balducci, M.; Genova, S.; Valeriani, E.; Pierdomenico, S.D.; Porreca, E. Prognostic nutritional index in elderly patients hospitalized for acute heart failure. ESC Heart Fail 2020, 7(5), 2479–2484. [Google Scholar] [CrossRef]
- Nakamura, T.; Matsumoto, M.; Haraguchi, Y.; Ishida, T.; Momomura, S. Prognostic impact of malnutrition assessed using geriatric nutritional risk index in patients aged ≥ 80 years with heart failure. Eur J Cardiovasc Nurs 2020, 19(2), 172–177. [Google Scholar] [CrossRef]
- Li, M.; Cai, J.; Jiang, K.; Li, Y.; Li, S.; Wang, O.; Liu, H.; Qu, X.; Kong, C.; Shi, K. Prognostic nutritional index during hospitalization correlates with adverse outcomes in elderly patients with acute myocardial infarction: a single-center retrospective cohort study. Aging Clin Exp Res 2024, 36(1), 56. [Google Scholar] [CrossRef]
- Liu, Z.; Wang, Z.; Huang, Q.; Hu, B.; Li, M.; Pan, Y.; Sun, Y.; Cao, H.; Xu, K.; Yang, L.; Li, Z.; Zhang, Y.; Zhao, X. The association between lower prognostic nutritional index and higher short- & long-term mortality in older adults (≥ 70 years) undergoing coronary artery bypass grafting: a retrospective study. BMC Geriatr 2025, 25, 175. [Google Scholar]
- Chen, Y.; Bei, M.; Liu, G.; Zhang, J.; Ge, Y.; Tan, Z.; Peng, W.; Gao, F.; Tu, C.; Tian, M.; Yang, M.; Wu, X. Prognostic nutritional index (PNI) is an independent predictor for functional outcome after hip fracture in the elderly: a prospective cohort study. Arch Osteoporos 2024, 19, 107. [Google Scholar] [CrossRef]
- Barutcu Atas, D.; Tugcu, M. ; Asicioglu, E; Velioglu, A. ; Arikan, H.; Koc, M.; Tuglular, S. Prognostic nutritional index is a predictor of mortality in elderly patients with chronic kidney disease. Int Urol Nephrol 2022, 54, 1155–1162. [Google Scholar]
- Li, S-y. ; Wan, L-l.; Liu, Y-f.; Li, Y-W.; Huang, X.; Liu, R-j. (2024) Prognostic value of three clinical nutrition scoring system (NRI, PNI, and CONUT) in elderly patients with prostate cancer. Front. Nutr 2024, 11, 1436063.
- Yan, D.; Shen, Z.; Zhang, S.; Hu, L.; Sun, Q.; Xu, K.; Jin, Y.; Sang, W. Prognostic values of geriatric nutritional risk index (GNRI) and prognostic nutritional index (PNI) in elderly patients with Diffuse Large B-Cell Lymphoma. J Cancer 2021, 12(23), 7010–7017. [Google Scholar] [CrossRef] [PubMed]
- Neugarten, B.L. Age groups in American society and the rise of the young-old. Ann. Am. Acad. Political Soc. Sci. 1974, 415, 187–198. [Google Scholar] [CrossRef]
- Forman, D.E.; Berman, A.D.; McCabe, C.H.; Baim, D.S.; Wei, J.Y. PTCA in the elderly: The “young-old” versus the “old-old”. J. Am. Geriatr. Soc. 1992, 40, 19–22. [Google Scholar] [CrossRef]
- Grande, E.; Grippo, F.; Frova, L.; Pantosti, A.; Pezzotti, P.; Fedeli, U. The increase of sepsis-related mortality in Italy: A nationwide study, 2003–2015. Eur. J. Clin. Microbiol. Infect. Dis. 2019, 38, 1701–1708. [Google Scholar] [CrossRef]
- National Institute of Statistics. Available online: https://esploradati.istat.it/databrowser/#/it/dw/categories/IT1,Z0810HEA,1.0/HEA_DEATH/DCIS_CMORTEM (accessed on 25 June 2025).
- Shao, Y.; Lai, Qc.; Duan, Q.; Ge, P.; Yeet, L. Nutritional indices at admission are associated with mortality rates of patients in the intensive care unit. Eur J Clin Nutr 2022, 76, 557–563. [Google Scholar] [CrossRef]
- Capurso, C.; Lo Buglio, A.; Bellanti, F.; Vendemiale, G. Prognostic Nutritional Index and Instant Nutritional Assessement Are Associated with Clinical Outcomes in a Geriatric Cohort of Acutely Inpatients. Nutrients 2024, 16, 1359. [Google Scholar] [CrossRef]
- Capurso, C.; Lo Buglio, A.; Bellanti, F.; Serviddio, G. C-Reactive Protein to Albumin Ratio Predicts Early Mortality in Hospitalized Older Patients, Independent of the Admission Diagnosis. Nutrients 2025, 17, 1984. [Google Scholar] [CrossRef]
Figure 1.
Analysis of ROC curves of PNI (a), CRP/Alb ratio (b), CRP/Alb ratio among LOS less than seven days or equal to or greater than seven days (c), CRP/Alb ratio among LOS less than seven days or equal to or greater than seven days (d) as predictors of mortality, compared with the reference line (red line).
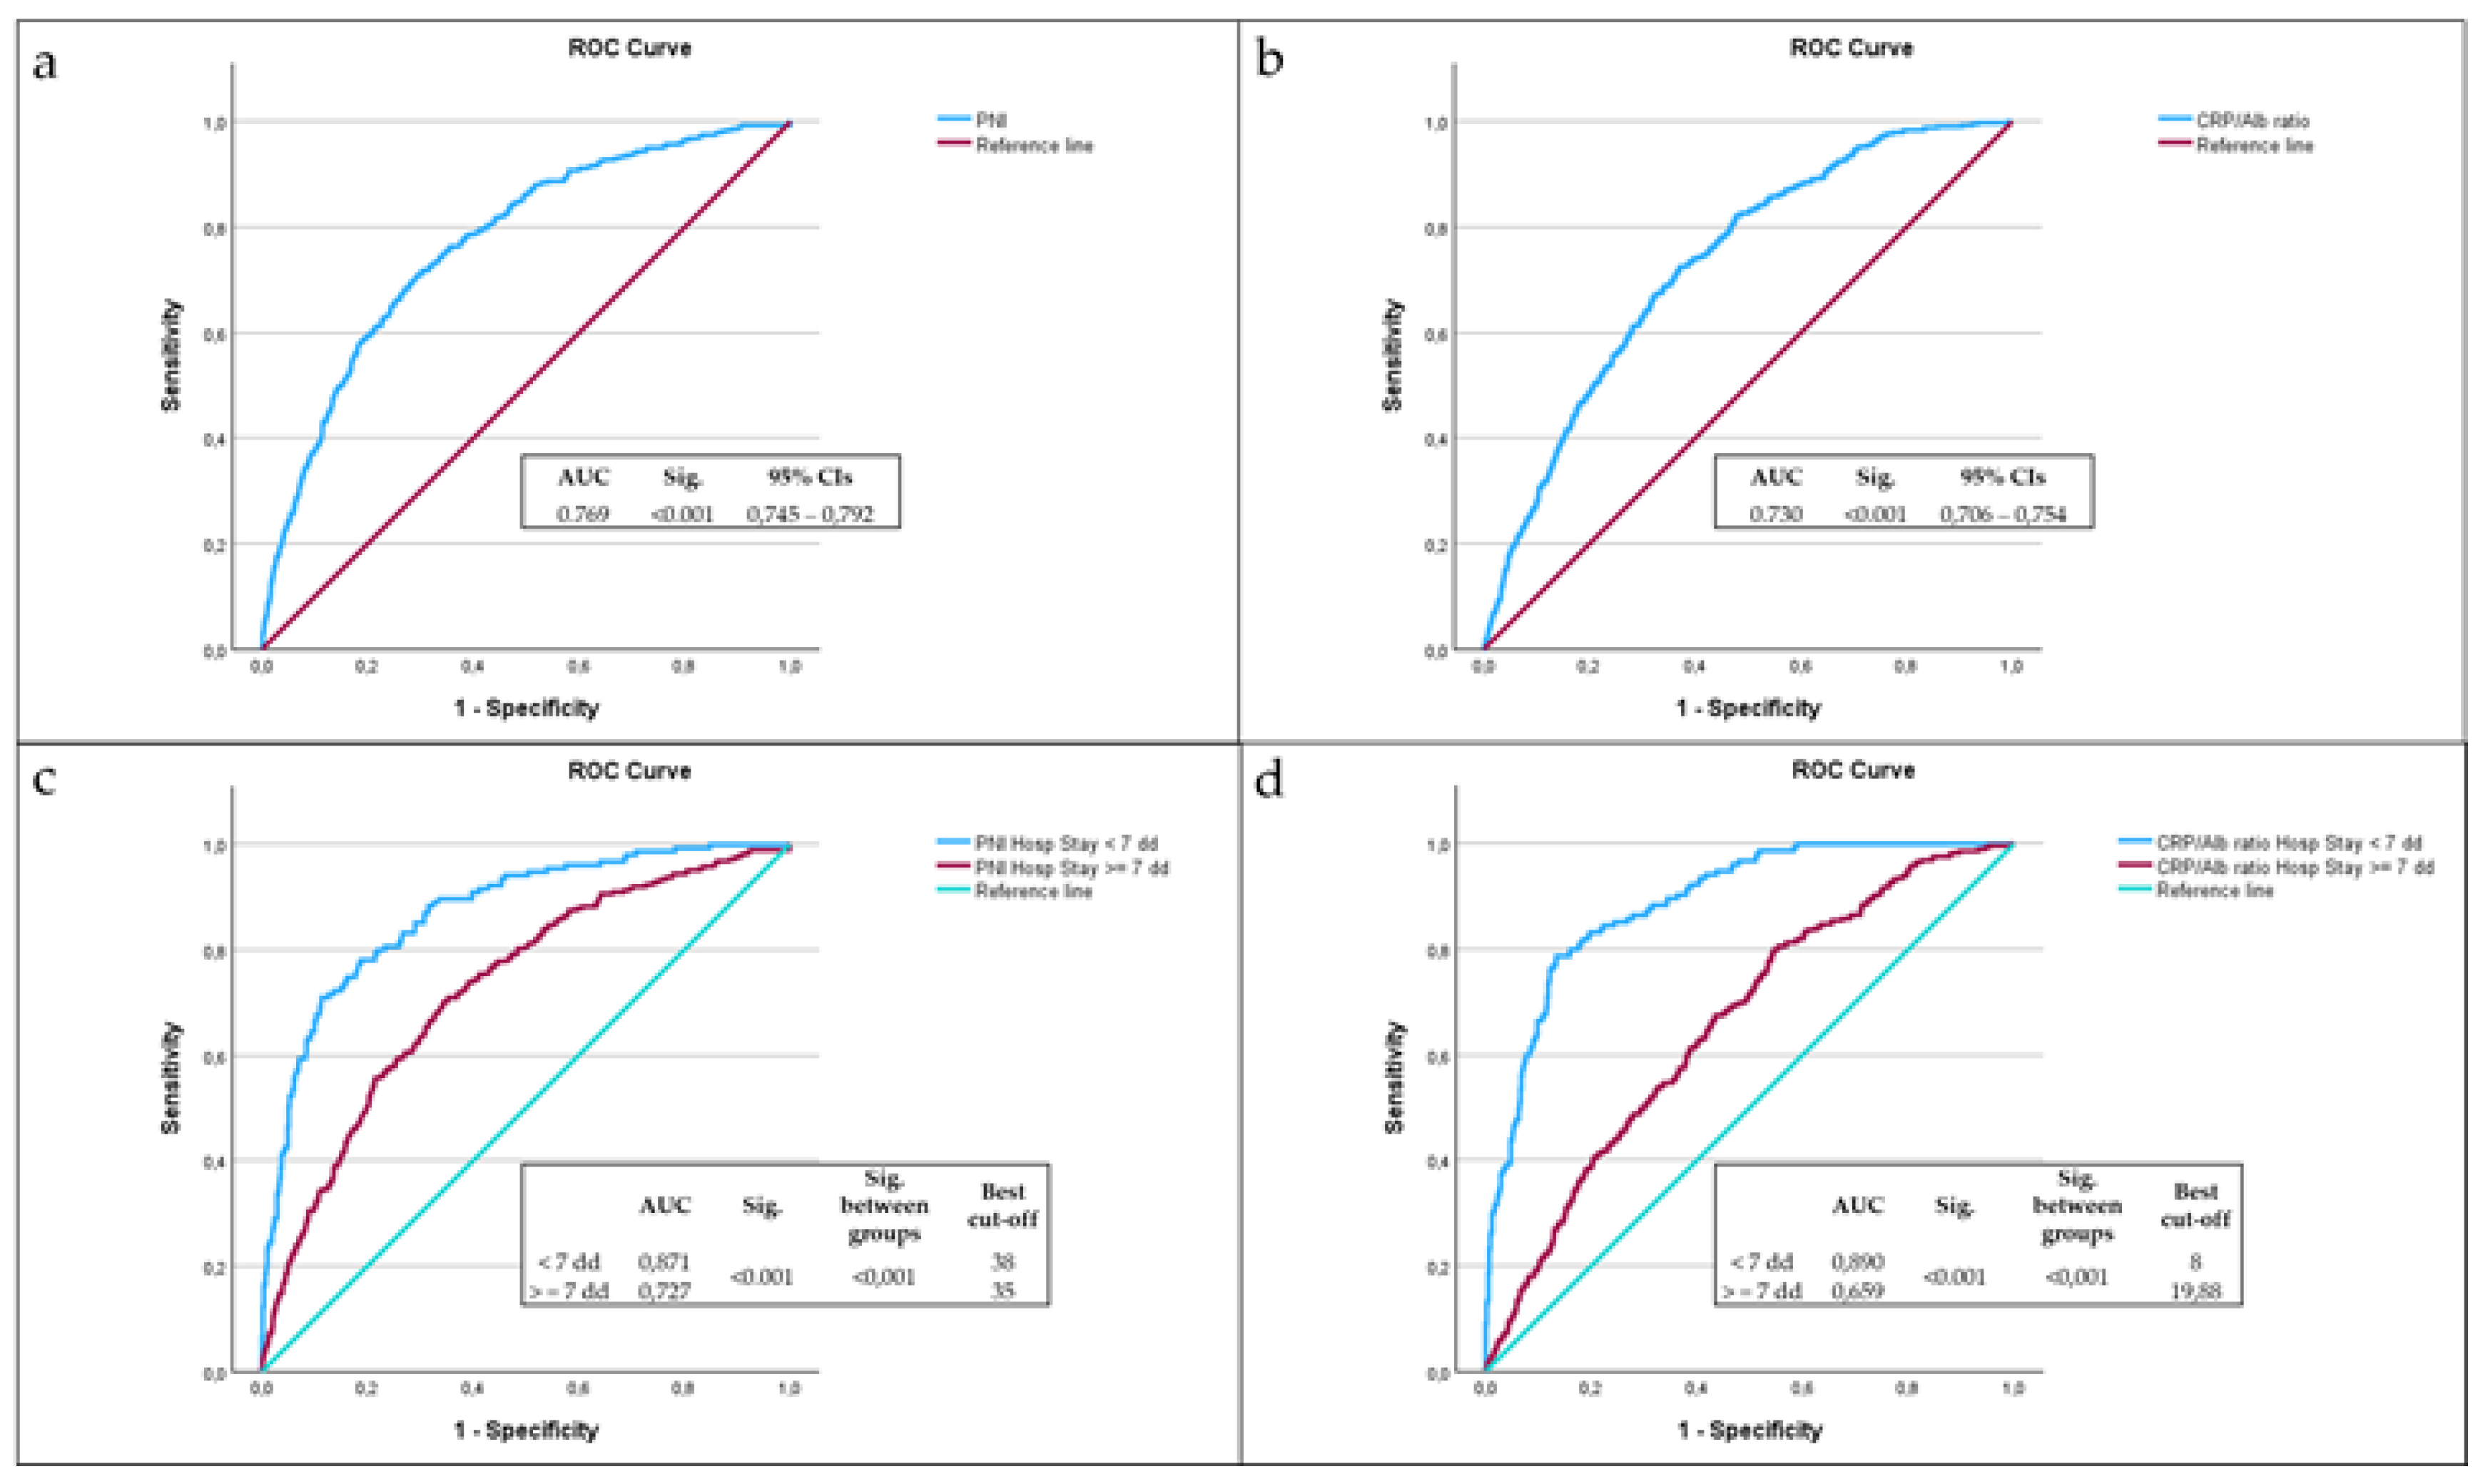

Table 1.
Clinical features of patients, stratified by sex. Values are expressed as number (%) or as mean ± SD.
Table 1.
Clinical features of patients, stratified by sex. Values are expressed as number (%) or as mean ± SD.
| Male | Female | Effect size Cohen’s h |
Sig. (99% CIs) |
|
|---|---|---|---|---|
| Subjects N (%) | 1314 (47.3%) | 1462 (52.7%) | 0.11 | 0.003 (0.000 – 0.006) |
| Male | Female |
Effect size Cohen’s d |
Sig. (99% CIs) |
|
|
Age at hospitalization (Mean ± SD) |
79 ± 8 | 82 ± 8 | 0.38 | < 0.001 (0.000 – 0.002) |
|
LOS (Mean ± SD) |
11 ± 7 | 11 ± 7 | 0.00 | 0.489 (0.464 – 0.513) |
|
Albuminemia (Mean ± SD) |
3.05 ± 0.6 | 3.03 ± 0.6 | 0.03 | 0.329 (0.306 – 0.352) |
|
CRP (Mean ± SD) |
80.2 ± 89 | 73.3 ± 88 | 0.08 | 0.001 (0.000 – 0.003) |
|
TLC (Mean ± SD) |
1405.3 ± 1886.5 | 1542.2 ± 3598.4 | 0.05 | 0.001 (0.000 – 0.003) |
|
CRP/Alb ratio (Mean ± SD) |
31.3 ± 38 | 29.3 ± 40 | 0.05 | 0.005 (0.001 – 0.008) |
|
PNI (Mean ± SD) |
37.6 ± 12 | 39.0 ± 39 | 0.05 | 0.098 (0.084 – 0.113) |
Table 2.
Stratification of the cohort of by age subgroups.
| Male | Female | Effect size Cohen’s h |
Sig. (99% CIs) |
|
|---|---|---|---|---|
|
Young old N (%) (65-74 years old) |
381 (57%) | 288 (43%) | 0.28 | <0.001 (0.000 – 0.007) |
|
Old N (%) (75-84 years old) |
551 (49.4%) | 564 (50.6%) | 0.02 | 0.705 (0.670 – 0.740) |
|
Very Old N (%) (85 + years old) |
382 (38.5%) | 610 (61.5%) | 0.46 | <0.001 (0.000 – 0.005) |
Table 3.
Correlation between LOS and age at admission, CRP, serum albumin, TLC, CRP/Alb ratio, and PNI after correcting by sex.
Table 3.
Correlation between LOS and age at admission, CRP, serum albumin, TLC, CRP/Alb ratio, and PNI after correcting by sex.
| Length Of Stay | |||
|---|---|---|---|
| Age at admission | Partial correlation |
−0.015 | |
| Significance (2-tailed) | 0.434 | ||
| CRP | Partial correlation | 0.148 | |
| Significance (2-tailed) | <0.001 | ||
| Albuminemia | Partial correlation | −0.189 | |
| Significance (2-tailed) | <0.001 | ||
| TLC | Partial correlation | −0.004 | |
| Significance (2-tailed) | 0.829 | ||
| CRP/Alb ratio | Partial correlation | 0.150 | |
| Significance (2-tailed) | <0.001 | ||
| PNI | Partial correlation | −0.048 | |
| Significance (2-tailed) | 0.011 | ||
Table 4.
Main causes of death among study subjects. Values are expressed as number (%).
| Deceased | |
|---|---|
| Severe Sepsis N (%) | 221 (49.8%) |
| Pulmonary edema and respiratory failure N (%) | 44 (9.9%) |
| Any respiratory infection and inflammation with complications N (%) | 36 (8.1%) |
| Pleural effusion with complications N (%) | 19 (4.3%) |
| Heart failure and shock N (%) | 19 (4.3%) |
| Malignant neoplasms of digestive system with complications N (%) | 9 (2.0%) |
| Any infectious disease N (%) | 9 (2.0%) |
| Severe renal failure N (%) | 8 (1.8%) |
| All other causes N (%) | 79 (17.8%) |
| Total number of deaths N (%) | 444 (100.0%) |
Table 5.
Clinical features of patients, stratified by deceased and not deceased. Values are expressed as number (%) or as mean ± SD.
Table 5.
Clinical features of patients, stratified by deceased and not deceased. Values are expressed as number (%) or as mean ± SD.
| Deceased | Non-Deceased | Effect size Cohen’s h |
Sig. (99% CIs) |
|
|---|---|---|---|---|
| Subjects N (%) | 444 (16%) | 2332 (84%) | 1.50 | <0.001 (0.000 – 0.002) |
| Deceased | Non-Deceased |
Effect size Phi Coefficient |
Sig. | |
| Male N (%) | 221 (49.8%) | 1093 (46.9%) | 0.02 | 0.276 |
| Female N (%) | 223 (50.2%) | 1239 (53.1%) | ||
| Deceased | Non-Deceased |
Effect size Cohen’s d |
Sig. (99% CIs) |
|
|
Age at hospitalization (Mean ± SD) |
84 ± 8 | 80 ± 8 | 0.5 | <0.001 (0.000 – 0.002) |
|
LOS (Mean ± SD) |
12 ± 10 | 11 ± 7 | 0.12 | 0.367 (0.344 – 0.391) |
|
Albuminemia (Mean ± SD) |
2.6 ± 0.6 | 3.1 ± 0.6 | 0.8 | <0.001 (0.000 – 0.002) |
|
CRP (Mean ± SD) |
123.6 ± 95.9 | 67.6 ± 84.2 | 0.62 | <0.001 (0.000 – 0.002) |
|
TLC (Mean ± SD) |
1432.7 ± 6016 | 1485.9 ± 1802 | 0.01 | <0.001 (0.000 – 0.002) |
|
PNI (Mean ± SD) |
32.7 ± 30.6 | 39.4 ± 29.5 | 0.22 | <0.001 (0.000 – 0.002) |
|
CRP/Alb ratio (Mean ± SD) |
54.8 ± 47.8 | 25.6 ± 35.8 | 0.69 | <0.001 (0.000 – 0.002) |
Table 6.
Relationship between PCR/Alb ratio >= 8, PNI < 38, LOS, and risk of death, among re-hospitalized patients.
Table 6.
Relationship between PCR/Alb ratio >= 8, PNI < 38, LOS, and risk of death, among re-hospitalized patients.
| CRP/Alb ratio >= 8 | OR | 95% CIs | Sig. |
| LOS >= 7 days | 6.69 | 2.53–22.22 | <0.001 |
| LOS < 7 days | 16.03 | 4.29–87.16 | |
| PNI < 38 | OR | 95% CIs | Sig. |
| LOS >= 7 days | 3.93 | 1.66–10.75 | <0.001 |
| LOS < 7 days | 48.4 | 7.08–2012.05 |
Table 7.
Relationship between PCR/Alb ratio >= 8, PNI < 38, LOS, and risk of death, among non-rehospitalized patients.
Table 7.
Relationship between PCR/Alb ratio >= 8, PNI < 38, LOS, and risk of death, among non-rehospitalized patients.
| CRP/Alb ratio >= 8 | OR | 95% CIs | Sig. |
| LOS >= 7 days | 2.75 | 1.92–3.98 | <0.001 |
| LOS < 7 days | 15.02 | 8.24–29.14 | |
| PNI < 38 | OR | 95% CIs | Sig. |
| LOS >= 7 days | 4.53 | 3.11–6.72 | <0.001 |
| LOS < 7 days | 11.07 | 6.60–19.11 |
Table 8.
Best PPV between PCR/Alb ratio and PNI among non-rehospitalized patients.
| PPV | ||||
|---|---|---|---|---|
| CRP/Alb ratio (%) | NPI (%) | LR chi2 | Sig. | |
| All patients | 20.35 % | 22.81% | 31.2 | <0.001 |
| LOS >= 7 days | 16.13% | 18.57% | 6.9 | 0.009 |
| LOS < 7 days | 37.94% | 39.76% | 43.44 | <0.001 |
Table 8.
Best PPV between PCR/Alb ratio and PNI among rehospitalized patients.
| PPV REOSP | ||||
|---|---|---|---|---|
| CRP/Alb ratio (%) | NPI (%) | LR chi2 | Sig. | |
| All patients | 37.50 % | 36.33% | 21.57 | <0.001 |
| LOS >= 7 days | 32.98% | 31.09% | 13.6 | <0.001 |
| LOS < 7 days | 51.67% | 52.38% | 9.25 | 0.002 |
Disclaimer/Publisher’s Note: The statements, opinions and data contained in all publications are solely those of the individual author(s) and contributor(s) and not of MDPI and/or the editor(s). MDPI and/or the editor(s) disclaim responsibility for any injury to people or property resulting from any ideas, methods, instructions or products referred to in the content. |
© 2025 by the authors. Licensee MDPI, Basel, Switzerland. This article is an open access article distributed under the terms and conditions of the Creative Commons Attribution (CC BY) license (http://creativecommons.org/licenses/by/4.0/).
Copyright: This open access article is published under a Creative Commons CC BY 4.0 license, which permit the free download, distribution, and reuse, provided that the author and preprint are cited in any reuse.


