
Submitted:
19 July 2025
Posted:
22 July 2025
You are already at the latest version
Abstract
The demand for sustainable energy generation and storage methods has become inevitable. As a result, numerous sectors are investing in research focused on energy harvesting (EH) techniques. In this context, a promising area involves integrating piezoelectric materials into unmanned aerial vehicles (UAVs) – an application that enables electrical energy generation from the kinetic energies produced during flight. This article aims to use polyvinylidene fluoride (PVDF) piezoelectric transducers coupled to an EH power management unit (LTC35881) to convert and store electrical energy generated by wind from the propellers and motor vibration. Methodologically, the motor and transducers are characterized, a model is developed using LTSpice®, and experimental validation of the performance of this coupling is carried out for output voltages (Vout) of 1.8 V, 2.5 V, 3.3 V, and 3.6 V. With a motor rotation speed of 3975 rpm, the transducers generated a voltage amplitude of 17.3 V, enabling the capacitor coupled to the EH power management unit – adjusted to the highest Vout – to be charged in approximately 162 s. Thus, this study demonstrated the feasibility of using PVDF as a piezoelectric nanogenerator in UAVs, enabling onboard electronic circuits and sensors to be powered while reserving the battery solely for propulsion, thereby increasing flight autonomy.
Keywords:
energy harvesting
; piezoelectricity
; PVDF
; unmanned aircraft system
; vibration energy
; wind energy
; aerial systems
; drones
1. Introduction
Since the advent of electrical machines and electronic devices, the demand for energy has increased substantially, stimulated by technological advancements and its increasing presence in society.
Many of these devices depend on a continuous power supply to operate, whether connected to the power grid via wires or through storage systems such as batteries. However, both during the generation and distribution processes and in the operation of these machines, significant energy losses occur, often dissipated in the form of heat, vibration, or electromagnetic radiation.
Given this scenario, the concept of EH emerges as an innovative solution to capture and convert small amounts of energy, commonly wasted, into electrical energy. This process can occur through different mechanisms, such as the conversion of residual thermal energy [1,2,3,4], the utilization of mechanical energy [5,6,7,8,9], or the capture of dispersed electromagnetic fields [7,10,11]. Additionally, the technology seeks ways to generate energy from its own environment, harnessing natural sources and human activities to power small devices.
The concept of low-power energy harvesting opens a vast field of research, encouraging the development of new technologies to increase energy efficiency and to broaden the applicability of this technique across different sectors. Researchers around the world are exploring ways to integrate energy harvesting into areas such as wearable electronics [12,13,14,15], biomedical devices [16,17,18,19], and engineering systems [20,21,22,23,24,25,26,27,28,29,30,31], with the goal of enhancing the autonomy of electronic devices while reducing their reliance on conventional energy sources.
In this context, there are EH applications focused on unmanned aerial vehicles (UAVs), which are aircraft that operate without an onboard pilot and fly either autonomously or remotely, such as drones. In addition, according to the Drone Market Report 2025–2030 [32], the global drone market generated nearly USD 33.7 billion in revenue in 2023. Furthermore, revenue is expected to reach USD 40.6 billion by 2025 and USD 57.8 billion by 2030.
Thus, the versatility of drones, combined with high levels of investment, has attracted a wide range of sectors, contributing to significant growth in strategic domains such as the military, where UAVs are used for reconnaissance of hard-to-access areas [33,34], as well as in the delivery sector, replacing human drivers in delivery operations [35,36,37], wireless communication systems [38], maritime communication [39], animal [40,41,42,43,44] and fire [45,46] monitoring, and in agriculture, where they assist in crop surveillance and the application of pesticides and fertilizers [47,48,49,50,51].
On the other hand, the flight efficiency of UAVs is directly dependent on their energy consumption. Consequently, some studies have explored viable strategies to reduce power consumption and extend flight autonomy, such as minimizing the mass and size of the drone [52,53].
Therefore, due to their advantages in power density, the use of batteries is increasingly noteworthy in this scenario. Therefore, due to their advantages in power density, the use of batteries stands out more in this scenario. However, the drone’s potential performance is strongly tied to its autonomy, which is limited by the battery’s capacity. Moreover, drone flight control systems depend on onboard electronic circuits and sensors that also require electrical power, thereby contributing to battery consumption and reducing flight duration. As a consequence, there is a constant need for recharging, which imposes unwanted time costs and limits UAVs operational autonomy.
So, it is necessary to find a balance to increase battery life without significantly affecting the drone's mass. In this sense, energy harvesting is opening a promising approach to overcome these adversities and make UAVs more self-sufficient while also being a sustainable strategy due to the energy source used.
Among the possible energy sources for EH in UAVs, solar [54,55,56,57,58,59], mechanical [60,61,62,63], and electromagnetic radiation [64,65] stand out. Notably, the most developed and well-established approach is solar energy, with its first recorded implementation dating back to 1974 [54,55], when Roland Boucher demonstrated the feasibility of powering the Sunrise aircraft solely through solar energy. In contrast, the use of mechanical vibration as a source of energy harvesting in UAVs was reported only in 2008 [66], highlighting the growing interest in alternative and sustainable solutions for powering such systems.
In the context of mechanical EH, the conversion of kinetic energy into electrical energy is carried out through piezoelectric, electromagnetic, or triboelectric transducers, each relying on distinct physical principles to capture and convert the energy generated by motion or vibration.
Regarding the piezoelectricity-based transducer, its operating principle is motivated by the intrinsic polarization of piezoelectric materials. That is, when subjected to mechanical stresses, they present an asymmetric displacement of charge of positive and negative ions [67,68].
Considering these aspects, several studies have investigated the aerodynamic behavior of wings and hydrofoils constructed from or integrated with piezoelectric materials, aiming to convert structural vibrations and deformations into electrical energy. Commonly, perovskite ceramics such as lead zirconate titanate (PZT), known for their high piezoelectric coefficient [67], are the most widely explored materials [60,66,69,70,71,72,73,74,75,76]. However, due to their low density and flexible nature, polymers like PVDF are gaining increasing attention in UAV energy harvesting applications.
Liu et al. [63] designed and fabricated a wing composed of carbon fiber and a PVDF membrane measuring 124 mm in length, capable of withstanding high flapping frequencies without breaking and generating a power output and voltage of 21 μW and 6 V, respectively, at a flapping frequency of 12 Hz – sufficient to power 14 LEDs.
Sharma et al. [77] proposed a sensor named Hermes to simultaneously measure the angle of attack and wind speed in UAVs. Additionally, the sensor is composed of five PVDF piezoelectric films from TE Connectivity, which generate voltage signals in response to aerodynamic vibrations in the airflow. The system can produce an average power output of 440 μW, thus enabling Hermes to operate as a self-powered device.
Astan et al. [78] developed a transducer based on a piezoelectric composite consisting of a polymeric matrix (PVDF) and zinc oxide–reduced graphene oxide (ZnO–rGO) nanoparticles, designed to harvest vibrational energy from the arm of a multirotor UAV. To achieve this, the transducer was bonded to the drone’s arm and tested during a 30 s flight, generating a maximum voltage of 64 mV at frequencies of 3.54 Hz, 49.8 Hz, and 0.48 Hz along the x-, y-, and z-axes, respectively.
Wei et al. [61] demonstrated the feasibility of fabricating a wing-shaped energy harvester by combining PVDF-based piezoelectric generators with triboelectric generators to power microelectronic devices. Regarding the piezoelectric device, the active area measured 15.4 cm² and produced a maximum open-circuit voltage of 3.2 V and a short-circuit current of 2.8 nA at a flapping frequency of 14 Hz.
Gunasekaran and Ross [52], aiming to enable flight control and power onboard sensors, explored the dual use of a flexible inverted piezo-embedded PVDF structure as both a wake sensor and an energy harvester, generating an average voltage amplitude of 20 V at a distance of 5.08 cm downstream of the NACA 0012 airfoil.
In this context, the present research aims to contribute to the advancement of polymer-based energy harvesting in UAVs. To this end, it is proposed to use PVDF transducers attached to the drone arm to convert the wind energy generated by the propellers, and the vibration caused by the engine, into electrical energy. Furthermore, in order to efficiently harness the energy generated by the piezoelectric material and convert it into a format compatible with the devices to be powered, the feasibility of using the LTC3588-1 energy management integrated circuit (IC) was demonstrated. This approach allows the direct conversion of the mechanical energy present in the system into electricity, thereby enhancing UAV autonomy.
This article is structured to clearly and thoroughly present each stage of the study. Following this introduction, Section 2 describes the materials and methods used in the simulations and experiments, detailing the components and techniques employed. Next, Section 3 presents the results obtained through both computational simulations and experimental tests, allowing for a comparative analysis between theory and practice and discussing the project’s development. Finally, Section 4 outlines the study’s conclusions and provides suggestions for future work, indicating possible improvements and applications of this technology in further research.
Materials and Methods
2.1. PVDF Transducers
PVDF is a polymer composed of ordered regions, where the chains are aligned (crystalline phase), and disordered regions, where the chains are entangled (amorphous phase). Morphologically, the crystalline regions of this material can present five distinct crystalline phases – α, β, γ, δ e ε – which differ in their molecular conformations [79].
Regarding the α phase, its conformation is of the TGTG ̅ type (trans-gauche), providing characteristics such as thermodynamic stability at ambient temperature and pressure. Furthermore, the packing of the chains within the unit cell is such that the molecular dipoles cancel each other out; that is, this phase does not exhibit piezoelectricity [79,80].
In turn, the β and γ phases are polar and exhibit piezoelectric properties; however, when compared, the piezoelectric effect of the γ phase is weaker than that of the β phase, due to the presence of one gauche (G) conformer in every fourth repeat unit along its chain conformation [81].
On the other hand, the β phase features chains that follow an all-trans planar zig-zag (TTT) conformation, allowing the induction of a significant dipole moment and consequently displaying the better piezoelectric, ferroelectric and pyroelectric properties among the five PVDF polymorphs [79,81].
Considering the above-mentioned, it becomes clear that, for piezoelectric energy harvesting applications, the β phase must be predominant in PVDF. For this reason, the present study employed the LDT0-028K transducer (Figure 1), which is a thin-film transducer optimized for piezoelectric applications – manufactured by TE Connectivity [82].
The transducer in focus consists of a 28 μm thick PVDF polymer film on which silver ink electrodes are deposited using the screen printing technique on a 125 μm thick polyester (mylar) substrate. The device also has two crimped contacts. Additionally, when configured as a cantilever beam – with one end fixed and the other free – the thin-film transducer functions as an accelerometer or vibration sensor. Thus, the mechanical deformation of the piezoelectric film, due to the deflection of the free end, generates an electrical charge in the PVDF material, which can be detected through an appropriate electronic circuit.
Moreover, this transducer is valued for its high sensitivity, flexibility, and low density, making it ideal for applications requiring lightweight and adaptable sensors. In addition, its polymeric composition allows it to withstand mechanical stress without fracturing, justifying its suitability for the proposed system.
Therefore, the main objective of using this transducer in the present research is to convert the mechanical energy generated by the drone during flight into electrical energy capable of powering some of its onboard sensors, such as cameras, distance sensors, and motion detectors, thus creating a self-sustaining energy source. This process allows the battery to be used solely for drone propulsion, consequently reducing the need for frequent recharging and extending the potential operational time of the vehicles.
2.2. Integrated Circuit For Energy Storage
In general, the electrical energy produced by piezoelectric materials is not immediately suitable for powering most electronic devices. It is necessary to use integrated circuits to properly condition the generated energy. In the case of vibrational energy harvesting, for example, the produced energy is in the form of alternating voltage or current, which needs to be rectified and then stored in a capacitor or battery.
With the development of research on energy harvesting from diverse forms and sources, albeit in smaller quantities – i.e., relatively low power levels (in the range of microwatts to milliwatts) – more complete and versatile techniques have been created for integrated circuits that condition the generated energy to achieve maximum energy transfer. This enables the charging of a battery or capacitor to extend the device's autonomy or power an auxiliary component.
Typically, the techniques used in these ICs include rectifier circuits (such as a bridge rectifiers), the addition of a switched inductor in series – or in parallel – with the transducer (Synchronized Switch Harvesting on Inductor, SSHI), and interface circuits such as Synchronous Electric Charge Extraction (SECE) and Pulsed Synchronous Charge Extractor (PSCE) [83].
In addition, boost, buck, and buck-boost converters are used for power management in ICs [84,85]. The Boost converter improves the input voltage to a higher output voltage. For that, an inductor stores energy while the switch is closed, and upon opening, the energy stored in the inductor is transferred to the load and the output capacitor, boosting the voltage above the input level.
In turn, the Buck converter works by reducing the input voltage to a lower output voltage, and its operating principle is the rapid switching of a switch that connects and disconnects the voltage to an inductor. The energy stored in the inductor is then transferred to the load, resulting in an output voltage lower than the input voltage. Regarding the Buck-Boost converter, it can either increase or decrease the input voltage to provide an output voltage, which can be higher or lower than the input voltage [84,85].
It is worth noting that, in all cases, the power is conserved between the input and output of the chip. However, some energy generated by the transducer is inevitably lost to the IC’s internal consumption. For this reason, a detailed study is necessary of which EH power management to use according to the needs of each project, based on the type of energy generation, input voltage magnitudes and limits, and the desired output voltage.
Given these considerations, the power-management IC used in this project is the model LTC3588-1 from Analog Devices [86]. This energy harvesting manager is designed for small-scale applications such as piezoelectric transducers. It can convert the alternating input voltage (generated by the transducers) to a direct voltage using a full-wave rectifier.
Figure 2 shows the printed circuit board (PCB) previously developed by our research group that implements a test board for the LTC3588-1 chip, allowing the user to configure several of its features via jumpers. The maximum input voltage is 20 V, and the maximum current is 50 mA. Its output voltages can be set to 1.8 V, 2.5 V, 3.3 V, or 3.6 V, depending on the D0 and D1 settings. After rectification, the energy is stored in the input capacitor (Cin), and its voltage rises until reaching a threshold that enables the charging of the output capacitor (Cout). For the first two configurations, charging begins when the voltage across Cin reaches a range of 3.77 V to 4.30 V, while for the last two configurations, it occurs at a higher range of 4.73 V to 5.37 V [86]. When the voltage on the output capacitor (Vout) reaches 92 % of the set output voltage, the output Pgood is triggered (e.g., Pgood is turned on when the voltage at Vout reaches 1.656 V and the set output voltage is 1.8 V), indicating that the stored energy is available to power other circuits.
2.3. Characterization of Motor and PVDF Transducer Performance
In order to experimentally simulate the arm of a UAV, a test bench (Figure 3) was assembled using a 35 cm-long square carbon fiber profile, a motor (PROPDRIVE v2 2826s 1200 kV from HobbyKing), a propeller with a diameter of 330 mm and a pitch of 102 mm (manufactured by RCTimer), a speed controller (CCPM Servo Consistency Master from Turnigy), a power supply (HIKARI HF 3205D), a power regulator connecting the supply to the motor (Castle Phoenix ESC 100), a tachometer (DT-2234C+ from Vectus), an oscilloscope (KEYSIGHT DSOX1204G), and LDT0-028K piezoelectric transducers connected in series via a breadboard and interfaced with the LTC3588-1 integrated circuit through its terminals. Additionally, to secure the piezoelectric transducers to the arm, a 15 cm-long support was designed using OnShape® software (version 1.193.50202.2394) and fabricated using a 3D printer (GTMax3D Core H5) with polylactic acid (PLA) material.
Firstly, in order to understand the characteristics of the motor in relation to the power supplied to it and those of the transducers due to flexion at different motor rotation frequencies, two characterizations were conducted. The first focused on analyzing the motor's rotational speed response as a function of increasing supplied power, while the second examined the electrical voltage generated by the PVDF transducers due to excitation from the propeller-induced airflow and the vibrations produced by the propeller/motor assembly.
The motor characterization was conducted using the previously described test bench. However, the transducers, the support structure, and the integrated circuit were removed from the setup. Methodologically, the current supplied by the power source was varied from 0 A to 5.2 A, while the voltage was held constant at 12 V. As a result, the power delivered to the motor ranged from 0 W to 62.4 W. So, the motor was then activated via the ESC and the knob on the servo tester, and as the current was gradually increased, the rotational speed data were collected using the tachometer, establishing a relationship between the motor's rotational frequency and the supplied power. From this relationship, a regression equation and the coefficient of determination (R²) were obtained.
In turn, the characterization of the piezoelectric transducers in series was carried out using the test bench without the LTC3588-1 IC. The transducers were positioned on the support and fixed to the carbon fiber rod. Then, as in the first characterization, the motor was operated within a power range from 0 W to 62.4 W, and the measurement in terms of electrical signal amplitude was performed using the oscilloscope. It is worth noting that different quantities of transducers and various positions along the rod were tested. This characterization made it possible to evaluate which configuration maximizes the generation of the electrical signal resulting from the deformation caused by the propeller/motor, enabling the operation of the IC. Moreover, it allowed verification that the maximum alternating voltage generated by the transducers did not exceed 20 V, ensuring the safe operation of the LTC3588-1 IC, which has a Zener diode that limits the input voltage to 20 V but whose maximum current is 50 mA.
2.4. Computational simulation of EH electronic Circuits
The LTspiceXVII® software (version 17.0.36.0) was used to simulate the behavior of the coupling between the three PVDF transducers connected in series and the LTC3588-1 integrated circuit, in order to predict the activation of the Pgood signal and the charging time of the input and output capacitors, as well as to properly select the values of their capacitances (Figure 2). To achieve this, two computational models were developed – one representing the piezoelectric transducer and the other the electronic circuit of the energy storage chip (Figure 4).
Regarding the modeling of the three transducers in series, the simplified equivalent circuit method was used, which includes only an alternating voltage source (in this research, configured as a sinusoidal function) in series with a resistor and a capacitor. Additionally, to define the voltage source parameters, such as frequency and amplitude, the results of the characterizations described in section 2.3 were used.
The operating frequency of the transducers was defined based on the system's dynamics. Considering that the films are subjected to the wind action from the two propeller blades with each complete rotation of the motor, the frequency to which the transducers were subjected in the simulations was established as double the motor's frequency.
To ensure the accuracy of the simulations, it was necessary to consider the impact of the instrumentation. The oscilloscope's internal resistance (10 MΩ) was incorporated into the simulation model because it acts as a voltage divider, influencing the reading of the voltage generated by the films. Through a voltage divider simulation, the actual voltage generated by the films was determined by adjusting the model's input voltage until the voltage measured at the simulated oscilloscope's internal resistance terminal was equivalent to the experimental value.
Furthermore, the IC internal resistance was considered in the context of how the input voltage is limited and stabilized, which is fundamental for safe operation.
With the previously determined operating frequency of the transducers, the simulation aimed to identify an input voltage value that would allow for reproducing the experimentally observed Cout charging times and Pgood pin activation times. To achieve this, some simplifications were adopted, such as disregarding the reactive effect on the voltage observed at the oscilloscope and assuming an ideal sinusoidal behavior for the generated voltage.
Additionally, to determine the resistance and capacitance values, a handheld LCR meter (KEYSIGHT U1733C) was used to measure these parameters from a single transducer. Based on the measurements, the equivalent values for three films connected in series were calculated. Consequently, the equivalent resistance and capacitance used in the simulation were set to 54 kΩ and 191.1 pF, respectively.
In turn, the modeling of the EH power supply electronic circuit was based on the computational model provided by the manufacturer, Analog Devices [86]. As shown in Figure 2, the components D0 and D1 – used as output voltage select bit – and C1 and C2 – corresponding to Cin and Cout, respectively – can be configured for different output voltages and capacitance values.
Then, computational modeling was performed by testing the capacitance values of C1 and C2 with Vout fixed at 1.8 V, firstly, so that a large amount of energy generated by the transducers would not be necessary for the charging process of Cin and Cout. Finally, with the values of Cin and Cout defined, the four possible combinations of D0 and D1 were tested to determine the charging time of the input and output capacitors and subsequently compare the results with the behavior observed during experimental validation.
2.5. Experimental Evaluation of the EH System
Finally, an experimental validation was carried out with the aim of corroborating the simulations performed and demonstrating the applicability of the proposed system – generating electrical energy from the mechanical energy of the propeller–motor assembly using piezoelectric transducers and storing the harvested energy in an integrated circuit.
For this purpose, the experimental simulation was conducted using the setup shown in Figure 3, connected to an oscilloscope. Additionally, three probes were connected to the oscilloscope channels – the hook tip of the Pgood signal was connected to the Pgood pin of the integrated circuit, while the ground leads of the input and output capacitors, as well as that of the Pgood, were connected to the ground (GND) of the IC.. The Cin and Cout probes were used to measure the voltage across the capacitors. Furthermore, as in the computational simulation, the capacitance values for the input and output capacitors were fixed according to the values defined in the tests of Section 2.4, and all four possible output voltage configurations were tested.
Methodologically, for the first three configurations (Vout = 1.8 V and 2.5 V), the probe was touched to the Vin and Vout pins every 5 s and every 10 s for the last two configurations (Vout = 3.3 V and 3.6 V). It is worth noting that, due to the oscilloscope's input resistance being 10 MΩ, which is very close to the equivalent capacitive reactance of the PVDF films (approximately 6.3 MΩ); the probe contacts for voltage visualization were made quickly to prevent energy dissipation and possible alterations in the circuit charging time.
3. Results and Discussion
In this section, we present the motor behavior under variations of the power supplied by the source (motor characterization), the transducers' behavior when subjected to variations in the motor's rotation frequency (series transducers characterization), and, finally, a simulation in LTSpice® software aiming to predict the performance of the integrated circuit (LTC3588-1), along with experimental validation to corroborate the simulations and demonstrate the system's applicability.
3.1. Results of the Motor and PVDF transducer characterizations
Figure 5 illustrates the relationship between the motor's rotational frequency and the power supplied to it by the source. We can observe that the higher the speed, the more difficult it becomes to increase it further. Beyond manufacturing considerations, one reason for this is that with a fixed voltage of 12 V, the current is responsible for increasing the power supplied to the motor, and higher current leads to greater losses. To establish a trend line from the collected data, a polynomial equation was generated: with a coefficient of determination (R²) of 0.9865.
The transducers were subjected to bench tests, and it was observed that the voltage they generated, measured as amplitude, grew until it reached a peak of 11.8 V when the motor's rotational frequency was 2400 rpm, which identifies the first vibration frequency of the bench structure. Immediately after this point, the generated voltage decreased from 11.8 V at 2400 rpm to 5.2 V at 2500 rpm and then gradually increased to 19.2 V at 3990 rpm, as can be seen in Figure 6. At speeds close to 4000 rpm, the films become very sensitive to increases in speed, thus exhibiting even higher growth rates than in the range of speeds around the natural vibration frequency.
Throughout the project, the motor was characterized based on its speed as a function of increased power supply, which helped us understand its dynamic behavior. Following this characterization, various tests were conducted with piezoelectric films in different configurations and quantities to assess their efficiency in converting mechanical energy into electrical energy.
It was observed that new films exhibited greater resistance to the wind force generated by the motor's propellers. However, with continuous use, the films became more pliable, indicating that their initial stiffness progressively decreased due to accumulated deformations during testing.
One of the primary analyses involved measuring the voltage generated by three films connected in series in the middle of the support when subjected to a rotational frequency of 3975 rpm, resulting in a voltage of 17.3 V. This value was crucial for selecting the power management integrated circuit, considering its maximum supported input voltage limits (20 V), without accounting for the IC's internal resistance, and a maximum input current of 50 mA.
Another relevant point was identifying the primary sources of transducer deformation. Although the vibration generated by the test bench is significant when the motor operates at 2400 rpm, tests demonstrated that the predominant factor in film deformation is the wind force generated by the propellers.
Finally, when testing the same three films in parallel in the middle of the support, a significant reduction in generated voltage was observed, accompanied by an increase in current. This behavior aligns with the electrical characteristics of parallel connections, highlighting the need for an appropriate balance between voltage and current when choosing the connection topology to optimize energy harvesting.
3.2. Simulation and Experimental Results of the EH Electronic Circuits
As mentioned earlier, based on the results obtained from the motor and series transducers' characterization, it was possible to determine the frequency and amplitude used in both the computational simulation and experimental validation.
First, for both tests, a power of 57 W was selected, resulting in a rotational frequency of 3975 rpm (calculated using the regression equation derived from the motor characterization) and an output voltage of 17.3 V. However, regarding the adjustments of the computational simulation parameters, it was necessary to specify certain conditions.
Regarding frequency, the transducers coupled to the rod are subjected to the action of the wind from the propeller’s two blades with each full rotation of the motor. This means the frequency to which the transducers are exposed is twice the motor’s frequency – 66.25 Hz – resulting in 132.5 Hz.
Additionally, it's important to note that the oscilloscope's internal resistance of 10 MΩ acts as a voltage divider. This means the voltage read by the oscilloscope isn't the actual voltage generated by the films. To find the true generated voltage, a voltage divider was simulated, and the film-generated voltage was increased until the voltage measured at the oscilloscope's internal resistance's first terminal equaled 17.3 V. This process yielded a result of 21 V. Although this value of 21 V exceeds the chip’s safety parameter of 20 V, the integrated circuit’s input resistance limits and stabilizes the voltage at the circuit input below 15 V, ensuring operational safety.
After this correction and considering the adopted simplifications – such as neglecting the reactive effect on the voltage observed in the oscilloscope, assuming an ideal sinusoidal behavior, and including the IC’s internal resistance – the simulation with a fixed frequency of 132.5 Hz aimed to find a voltage value that best replicated the experimentally observed charging times of Cout and the triggering of the Pgood pin. The value that showed the closest match was 18 V. Thus, for the computational simulation, the voltage source amplitude was set to 18 V, and the frequency to 132.5 Hz.
3.2.1. Output Voltage of 1.8 V
Figure 7 (a) shows the LTspice simulation of the circuit operation when the IC is configured for a 1.8 V output (D0 = 0 and D1 = 0). In this case, Cin discharges twice to charge Cout before stabilization, and Pgood triggers at approximately 64 seconds. It is also observed that the first charging cycle occurs at 47.7 seconds, while the second happens close to the Pgood triggering moment. For this first configured output voltage, the IC begins charging Cout when Cin reaches 4.0575 V.
In bench tests with the IC set to a 1.8 V output, represented in Figure 7 (b), the charging mode is reached at 54 seconds. Here, just as in the simulation, there are two charging cycles before the target output voltage is achieved. Pgood triggers at around 71 s, after which the voltage at Cin continues to rise, acting as an energy reserve for Cout.
It is worth noting that the Pgood signal drops seen in this and subsequent graphs (which represent experiments for each output voltage case) are caused by voltage drops in Vout, as data acquisition losses occur during oscilloscope readings.
3.2.2. Output Voltage of 2.5 V
Figure 8 (a) shows the LTspice simulation of the circuit operation when the IC is configured for a 2.5 V output (D0 = 1 and D1 = 0). Similarly to the 1.8 V output configuration, Cₒᵤₜ receives energy from Cᵢₙ when it reaches 4.0575 V. However, in this case, four charging cycles are required before the voltage across Cₒᵤₜ stabilizes. It's worth noting that during the fourth charging cycle, Cᵢₙ doesn't need to transfer significant energy to Cₒᵤₜ for it to reach 2.5 V, which is why Pgood only triggers near the fourth charging event, at 97 seconds.
Consistent with the simulation, Figure 8 (b) shows bench test results with the output voltage set to 2.5 V, demonstrating that four charging stages are required for Cₒᵤₜ to reach the target 2.5 V. The first charging cycle occurs at 45 seconds, the second at 69 seconds, the third at 89 seconds, and the final one at 107 seconds - the exact moment when the Pgood pin triggers.
3.2.3. Output Voltage of 3.3 V
Figure 9 (a) shows the LTspice simulation of the circuit operation when the IC is configured for a 3.3 V output (D0 = 0 and D1 = 1). The charging of Cₒᵤₜ occurs in 5 stages until its voltage stabilizes. Similar to the simulation with 2.5 V output, the fifth charging process involves less energy transfer. Near this fifth charging event, the Pgood pin triggers at approximately 133 seconds. Unlike the 1.8 V and 2.5 V output configurations, in this case the IC initiates the charging process when Cᵢₙ reaches 4.8319 V.
Figure 9 (b) presents bench test results with the output voltage set to 3.3 V, now with a lower data sampling rate (every 10 seconds). As in the simulation, five charging cycles were required for Pgood to trigger, though the actual triggering time was about 165 seconds compared to 133 seconds in simulation. The charging cycles occurred at 60 s, 80 s, 109 s, 139 s, and 165 s.
3.2.4. Output Voltage of 3.6 V
Figure 10 (a) displays the LTspice simulation of the circuit operation when the IC is configured for a 3.6 V output (D0 = 1 and D1 = 1). In this configuration, Cᵢₙ discharges five times to charge Cₒᵤₜ before voltage stabilization, with each charging cycle initiated when Cin reaches 5.0428 V, as expected for this design. Notably, while both 3.3 V and 3.6 V output settings require the same number of charging cycles (5), the energy transfer during the fifth cycle is significantly greater for the 3.6 V configuration. Consequently, Pgood triggers at approximately 138.6 seconds during this final charging phase.
Figure 10 (b) presents experimental results with the output voltage set to 3.6 V. The bench tests required six charging cycles for Pgood activation - one more than simulated. This discrepancy arises because the actual IC implementation experiences Cₒᵤₜ discharging due to the oscilloscope's internal resistance, affecting both the trigger timing and number of charging cycles.
Table 1 provides a detailed comparison between simulation and experimental results for the different output voltage configurations of the LTC3588-1 (1.8 V, 2.5 V, 3.3 V, and 3.6 V). The parameters analyzed include the number of Cout charging cycles and charging initiation time, and the Pgood activation time. In general, the simulated and experimental results show close alignment, with discrepancies in timing limited to just a few seconds. For higher output voltages (3.3 V and 3.6 V), the number of charging cycles increases, reflecting the greater energy required to stabilize the system. The additional charging cycle observed experimentally at 3.6 V is likely due to losses caused by the oscilloscope’s input resistance and capacitor discharge during the measurement process.
Finally, it is worth highlighting that, based on the results presented, it is observed that the internal circuit of the IC begins the charging process of Cout only when the voltage at Cin reaches a certain value, which varies depending on the selected output voltage. As expected, for Vout set to 1.8 V and 2.5 V, the values are between 3.77 V and 4.3 V, whereas for Vout of 3.3 V and 3.6 V, they range from 4.73 V to 5.37 V [86]. Afterward, the voltage at Cin decreases in order to charge Cout, and once the voltage at Cout reaches 92 % of the set output voltage, the Pgood pin is activated. Therefore, considering what was mentioned, the results presented demonstrate the reliability of the computational and experimental tests conducted and the applicability of the proposed system.
4. Conclusions
This study successfully demonstrated the feasibility of using PVDF piezoelectric transducers coupled with an integrated power management circuit (LTC3588-1) for energy harvesting in UAVs. The results showed that the transducers, when exposed to the vibration and wind generated by the drone's motor and propellers, were capable of producing a significant voltage (17.3 V at 3975 rpm). This allowed for the efficient charging of the LTC3588-1 chip to a 3.6 V output in 162 seconds. Furthermore, the computational modeling performed in LTspice® software corroborated the experimental data, validating the effectiveness of the proposed system.
Integrating this technology into UAVs offers promising potential for increasing flight autonomy. The harvested energy can power onboard sensors and electronic circuits, reducing the exclusive reliance on the battery for energy supply. This not only contributes to energy sustainability but also leads to reduced operational costs and expands drone applications in sectors such as agriculture, environmental monitoring, and deliveries.
As suggestions for future work, it is expected to optimize the positioning and quantity of transducers to maximize energy harvesting, as well as to improve the transducer support in order to mitigate the added mass.
Additionally, analyses focused on the piezoelectric material are suggested, aiming to increase energy generation. For this purpose, a viable solution is to use energy harvesting devices based on piezoelectric composite materials, which combine the advantages of both ceramics and polymers. Therefore, a careful and detailed study of the possible materials to be used is necessary, as well as how the piezoelectric property of the composite may be affected by characteristics of the ceramic material, such as the presence of defects in its structure, for example, oxygen vacancies. In this context, the replacement of PVDF-based transducers with materials composed of two different piezoelectric phases, such as PVDF and lithium niobate (LiNbO₃), is also suggested.
Finally, further studies could focus on integrating this technology into real-world flight conditions, considering more complex environmental and aerodynamic variations.
In summary, this research underscores the role of energy harvesting as an efficient and sustainable solution to the limitations faced by UAVs, driving technological advancements that combine efficiency, autonomy, and environmental sustainability.
Author Contributions
Methodology, L.d.S.G., R.M.L.P., R.S.T., M.C.M. and C.R.H.B.; software, L.d.S.G., R.M.L.P. and C.R.H.B.; validation, L.d.S.G., R.M.L.P., R.S.T., M.C.M. and C.R.H.B.; formal analysis, L.d.S.G., R.M.L.P., R.S.T., M.C.M. and C.R.H.B.; investigation, L.d.S.G., R.M.L.P., R.S.T., M.C.M. and C.R.H.B.; resources, C.R.H.B.; data curation, L.d.S.G., R.M.L.P. and R.S.T.; writing—original draft, L.d.S.G., R.M.L.P. and R.S.T.; writing—review & editing, L.d.S.G., R.M.L.P. and C.R.H.B.; visualization, L.d.S.G. and R.M.L.P.; supervision, C.R.H.B.; project administration, C.R.H.B.; funding acquisition, C.R.H.B.. All authors have read and agreed to the published version of the manuscript
Funding
This study was financed in part by the Coordenação de Aperfeiçoamento de Pessoal de Nível Superior-Brasil (CAPES)-Finance Code 001.
Data Availability Statement
Not applicable.
Acknowledgments
The authors thank, for the financial support provided, the Brazilian funding agencies CNPq, CAPES, FINEP, and FAPERJ.
Conflicts of Interest
The authors declare no conflicts of interest. In addition, the funders had no role in the design of the study; in the collection, analyses, or interpretation of data; in the writing of the manuscript; or in the decision to publish the results.
Abbreviations
The following abbreviations are used in this manuscript:
| EH | Energy harvesting |
| UAV | Unmanned Aerial Vehicle |
| PVDF | Polyvinylidene fluoride |
| IC | Integrated circuit |
| Vin | Input Voltage |
| Vout | Regulated Output Voltage |
| Cin | Input capacitor |
| Cout | Output capacitor |
| Pgood | Power good comparator |
| GND | Ground |
References
- Na, Y.; Kim, S.; Mallem, S.P.R.; Yi, S.; Kim, K.T.; Park, K. Energy harvesting from human body heat using highly flexible thermoelectric generator based on Bi2Te3 particles and polymer composite. J. Alloys Compd. 2022, 924, 166575. [Google Scholar] [CrossRef]
- Yuan, J.; Zhu, R. A fully self-powered wearable monitoring system with systematically optimized flexible thermoelectric generator. Appl. Energy 2020, 271, 115250. [Google Scholar] [CrossRef]
- Yang, Y.; Hu, H.; Chen, Z.; Wang, Z.; Jiang, L.; Lu, G.; Li, X.; Chen, R.; Jin, J.; Kang, H.; et al. Stretchable nanolayered thermoelectric energy harvester on complex and dynamic surfaces. Nano Lett. 2020, 20, 4445–4453. [Google Scholar] [CrossRef] [PubMed]
- Kim, M.K.; Kim, M.S.; Lee, S.; Kim, C.; Kim, Y.J. Wearable thermoelectric generator for harvesting human body heat energy. Smart Mater. Struct. 2014, 23. [Google Scholar] [CrossRef]
- Feenstra, J.; Granstrom, J.; Sodano, H. Energy harvesting through a backpack employing a mechanically amplified piezoelectric stack. Mech. Syst. Signal Process. 2008, 22, 721–734. [Google Scholar] [CrossRef]
- Hu, C.; Behdinan, K.; Moradi-Dastjerdi, R. PVDF energy harvester for prolonging the battery life of cardiac pacemakers. Actuators 2022, 11. [Google Scholar] [CrossRef]
- Zhang, S.L.; Jiang, Q.; Wu, Z.; Ding, W.; Zhang, L.; Alshareef, H.N.; Wang, Z.L. Energy harvesting-storage bracelet incorporating electrochemical microsupercapacitors self-charged from a single hand gesture. Adv. Energy Mater. 2019, 9. [Google Scholar] [CrossRef]
- Jeong, S.Y.; Xu, L.L.; Ryu, C.H.; Kumar, A.; Hong, S. Do; Jeon, D.H.; Cho, J.Y.; Ahn, J.H.; Joo, Y.H.; Jeong, I.W.; et al. Wearable shoe-mounted piezoelectric energy harvester for a self-powered wireless communication system. Energies 2022, 15. [Google Scholar] [CrossRef]
- Keddis, S.; Mitry, R.; Schwesinger, N. Piezoelectric flow harvesting for in-pipe metering systems. In Proceedings of the Active and Passive Smart Structures and Integrated Systems XII, Denver, Colorado, United States, Vol. 10595., 15 March 2018. [Google Scholar]
- Li, L.; Zhang, X.; Song, C.; Huang, Y. Progress, challenges, and perspective on metasurfaces for ambient radio frequency energy harvesting. Appl. Phys. Lett. 2020, 116. [Google Scholar] [CrossRef]
- Sherazi, H.H.R.; Zorbas, D.; O’flynn, B. A comprehensive survey on RF energy harvesting: applications and performance determinants. Sensors 2022, 22. [Google Scholar] [CrossRef]
- Selim, K.K.; Smaili, I.H.; Yehia, H.M.; Ahmed, M.M.R.; Saleeb, D.A. piezoelectric sensors pressed by human footsteps for energy harvesting. Energies 2024, 17, 2297. [Google Scholar] [CrossRef]
- Tahir, H.R.; Malengier, B.; Sujan, S.; Langenhove, L.V. Embroidery triboelectric nanogenerator for energy harvesting. Sensors 2024, 24, 3782. [Google Scholar] [CrossRef] [PubMed]
- Duan, Z.; Cai, F.; Chen, Y.; Chen, T.; Lu, P. Advanced applications of porous materials in triboelectric nanogenerator self-powered sensors. Sensors 2024, 24, 3812. [Google Scholar] [CrossRef] [PubMed]
- Newby, S.; Mirihanage, W.; Fernando, A. Wearable, knitted 3D spacer thermoelectric generator with detachable p-n junctions for body heat energy harvesting. Sensors 2024, 24, 5140. [Google Scholar] [CrossRef] [PubMed]
- Nekui, O.D.; Wang, W.; Liu, C.; Wang, Z.; Ding, B. IoT-based heartbeat rate-monitoring device powered by harvested kinetic energy. Sensors 2024, 24, 4249. [Google Scholar] [CrossRef]
- Qian, C.; Ye, F.; Li, J.; Tseng, P.; Khine, M. Wireless and battery-free sensor for interstitial fluid pressure monitoring. Sensors 2024, 24, 4429. [Google Scholar] [CrossRef]
- Han, S.; Xiao, Q.; Liang, Y.; Chen, Y.; Yan, F.; Chen, H.; Yue, J.; Tian, X.; Xiong, Y. using flexible-printed piezoelectric sensor arrays to measure plantar pressure during walking for sarcopenia screening. Sensors 2024, 24, 5189. [Google Scholar] [CrossRef]
- Dan, S.; Yano, Y.; Wang, J. Batteryless BLE module with a piezoelectric element mounted on a shoe sole. Sensors 2024, 24, 2829. [Google Scholar] [CrossRef]
- Jamil, M.N.B.M.; Omar, M.; Ibrahim, R.; Bingi, K.; Faqih, M. Rectenna system development using harmonic balance and s-parameters for an RF energy harvester. Sensors 2024, 24, 2843. [Google Scholar] [CrossRef]
- Li, J.; Ren, W.; Luo, Y.; Zhang, X.; Liu, X.; Zhang, X. Design of fluxgate current sensor based on magnetization residence times and neural networks. Sensors 2024, 24, 3752. [Google Scholar] [CrossRef]
- Du, X.; Zhang, H.; Cao, H.; Hao, Z.; Nakashima, T.; Tanaka, Y.; Jiao, P.; Mutsuda, H. double-swing spring origami triboelectric nanogenerators for self-powered ocean monitoring. Energies 2024, 17, 2981. [Google Scholar] [CrossRef]
- Wang, Q.; Yu, G.; Lou, Y.; Li, M.; Hu, J.; Li, J.; Cui, W.; Yu, A.; Zhai, J. Elastic self-recovering hybrid nanogenerator for water wave energy harvesting and marine environmental monitoring. Sensors 2024, 24, 3770. [Google Scholar] [CrossRef] [PubMed]
- Zhou, T.; Cai, J.; Zhu, X. An advanced Hall element array-based device for high-resolution magnetic field mapping. Sensors 2024, 24, 3773. [Google Scholar] [CrossRef] [PubMed]
- Wang, Y.-R.; Huang, P.-C.A.; Wang, Y.-R.; Huang, P.-C. A magneto-electric device for fluid pipelines with vibration damping and vibration energy harvesting. Sensors 2024, 24, 5334. [Google Scholar] [CrossRef] [PubMed]
- Ligęza, P. Electromagnetic energy harvester using pulsating airflows—reeds waving in the wind. Energies 2024, 17, 4834. [Google Scholar] [CrossRef]
- Soares, I.N.; Altafim, R.A.C.; Altafim, R.A.P.; Moreira, M. de M.A.C.; Sousa, F.S.I. de; Afonso, J.A.; Carmo, J.P.; Flauzino, R. de A. Investigation of a magnetic levitation architecture with a ferrite core for energy harvesting. Energies 2024, 17, 5315. [Google Scholar] [CrossRef]
- Chukwurah, U.; McTaggart-Cowan, G. Harvesting electric energy using thermoelectric generators in a residential heating application. Energies 2024, 17, 2562. [Google Scholar] [CrossRef]
- Markakis, E.K.; Alonistioti, N.; Aragonés, R.; Oliver, J.; Ferrer, C. Transforming industrial maintenance with thermoelectric energy harvesting and NB-IoT: a case study in oil refinery applications. Sensors 2025, 25, 703. [Google Scholar] [CrossRef]
- Shen, H.; Lv, Y.; Kong, Y.; Han, Q.; Chen, K.; Geng, Z.; Dong, M.; Chu, F. Triboelectric nanogenerator-embedded intelligent self-aligning roller bearing with the capability of self-sensing, monitoring, and fault diagnosis. Sensors 2024, 24, 7618. [Google Scholar] [CrossRef]
- Huang, X.; Wei, B.; Ling, Z.; Yang, F.; Pang, H. A low-frequency vibration sensor based on ball triboelectric nanogenerator for marine pipeline condition monitoring. Sensors 2024, 24, 3817. [Google Scholar] [CrossRef]
- Wackwitz, K.; Bodecker, H. Drone Market Size, Forecast 2025-2030, Market Developments & Regulations. Drone Industry Insights, Hamburg, Germany, 2025. Available online: https://droneii.com/product/drone-market-report (accessed on 29 April 2025).
- Kazak, A.; Grishin, I.; Makoveichuk, K.; Dorofeeva, A.; Mayorova, A. The use of UAVS and helicopters in forest fires monitoring and extinguishing in hard-to-reach areas. E3S Web Conf. 2023, 402, 02008. [Google Scholar] [CrossRef]
- Fernández, L.J.C.; Castañeda, M.A.P.; Ariza, L.L.C.; Gómez, Y.T.B. UAV data collection in hard-to-reach areas from a wireless sensor network. In Proceedings of the 2022 IEEE 40th Central America and Panama Convention (CONCAPAN), Panama, Panama, 09-12 November 2022. [Google Scholar]
- Rigoni, G.; Pinotti, C.M. ; Bhumika; Das, D., Ed.; Das, S.K. Delivery with UAVs: a simulated dataset via ATS. In Proceedings of the 2022 IEEE 95th Vehicular Technology Conference: (VTC2022-Spring), Helsinki, Finland, 22 June 2022. [Google Scholar] [CrossRef]
- Park, J.; Kim, S.; Suh, K. A comparative analysis of the environmental benefits of drone-based delivery services in urban and rural areas. Sustain. 2018, 10, 888. [Google Scholar] [CrossRef]
- Cui, S.; Yang, Y.; Gao, K.; Cui, H.; Najafi, A. Integration of UAVs with public transit for delivery: Quantifying system benefits and policy implications. Transp. Res. Part A Policy Pract. 2024, 183, 104048. [Google Scholar] [CrossRef]
- Mahbub, M.; Saym, M.M.; Jahan, S.; Paul, A.K.; Vahid, A.; Hosseinalipour, S.; Barua, B.; Yeh, H.G.; Shubair, R.M.; Taleb, T. A holistic survey of UAV-assisted wireless communications in the transition from 5G to 6G: State-of-the-art intertwined innovations, challenges, and opportunities. J. Netw. Comput. Appl. 2025, 237, 104131. [Google Scholar] [CrossRef]
- Nomikos, N.; Gkonis, P.K.; Bithas, P.S.; Trakadas, P. A survey on UAV-aided maritime communications: deployment considerations, applications, and future challenges. IEEE Open J. Commun. Soc. 2023, 4, 56–78. [Google Scholar] [CrossRef]
- Michez, A.; Broset, S.; Lejeune, P. Ears in the sky: potential of drones for the bioacoustic monitoring of birds and bats. Drones 2021, 5, 9. [Google Scholar] [CrossRef]
- Nielsen, M.L.K.; Sprogis, K.R.; Bejder, L.; Madsen, P.T.; Christiansen, F. Behavioural development in southern right whale calves. Mar. Ecol. Prog. Ser. 2019, 629, 219–234. [Google Scholar] [CrossRef]
- Kavwele, C.M.; Hopcraft, J.G.C.; Davy, D.; Torney, C.J. Automated and repeated aerial observations of GPS-collared animals using UAVs and open-source electronics. Ecosphere 2024, 15. [Google Scholar] [CrossRef]
- Colefax, A.P.; Kelaher, B.P.; Pagendam, D.E.; Butcher, P.A. assessing white shark (carcharodon carcharias) behavior along coastal beaches for conservation-focused shark mitigation. Front. Mar. Sci. 2020, 7, 519539. [Google Scholar] [CrossRef]
- Zhang, H.; Wang, C.; Turvey, S.T.; Sun, Z.; Tan, Z.; Yang, Q.; Long, W.; Wu, X.; Yang, D. Thermal infrared imaging from drones can detect individuals and nocturnal behavior of the world’s rarest primate. Glob. Ecol. Conserv. 2020, 23, e01101. [Google Scholar] [CrossRef]
- Sherstjuk, V.; Zharikova, M.; Sokol, I. Forest fire-fighting monitoring system based on UAV team and remote sensing. In Proceedings of the 2018 IEEE 38th International Conference on Electronics and Nanotechnology (ELNANO), Kyiv, UKraine, 24-26 April 2018. [Google Scholar] [CrossRef]
- Wardihani, E.D.; Ramdhani, M.; Suharjono, A.; Setyawan, T.A.; Hidayat, S.S.; Helmy; Widodo, S. ; Triyono, E.; Saifullah, F. Real-time forest fire monitoring system using unmanned aerial vehicle. J. Eng. Sci. Technol. 2018, 13, 1587–1594. [Google Scholar]
- Jibon, Z.A.; Adnan, M.A.; Nora, N.T.; Akash, M.M.H.; Ahammed, F. Development of an autonomous UAV for seed and fertilizer distribution in precision agriculture. In Proceedings of the 2023 14th International Conference on Computing Communication and Networking Technologies (ICCCNT), Delhi, India, 06-08 July 2023. [Google Scholar] [CrossRef]
- Macedo, F.L.; Nóbrega, H.; de Freitas, J.G.R.; Ragonezi, C.; Pinto, L.; Rosa, J.; Pinheiro de Carvalho, M.A.A. Estimation of productivity and above-ground biomass for corn (zea mays) via vegetation indices in Madeira Island. Agric. 2023, 13, 1115. [Google Scholar] [CrossRef]
- Maktab Dar Oghaz, M.; Razaak, M.; Kerdegari, H.; Argyriou, V.; Remagnino, P. Scene and environment monitoring using aerial imagery and deep learning. In Proceedings of the 2019 15th International Conference on Distributed Computing in Sensor Systems (DCOSS), Santorini, Greece, 29-31 May 2019. [Google Scholar] [CrossRef]
- Hentschke, M.; de Freitas, E.P.; Hennig, C.H.; da Veiga, I.C.G. Evaluation of altitude sensors for a crop spraying drone. Drones 2018, 2, 25. [Google Scholar] [CrossRef]
- Nanavati, R. V.; Meng, Y.; Coombes, M.; Liu, C. Generalized data-driven optimal path planning framework for uniform coverage missions using crop spraying UAVs. Precis. Agric. 2023, 24, 1497–1525. [Google Scholar] [CrossRef]
- Gunasekaran, S.; Ross, G. Effect of piezo-embedded inverted flag in free shear layer wake. Aerosp. 2019, 6, 33. [Google Scholar] [CrossRef]
- Wei, X.; Yi, Z.; Li, W.; Zhao, L.; Zhang, W. Energy harvesting fueling the revival of self-powered unmanned aerial vehicles. Energy Convers. Manag. 2023, 283, 116863. [Google Scholar] [CrossRef]
- Boucher, R.A.; Boucher, R.J.; Remotely controlled electric airplane. US3957230A. 1975. Available online: https://patents.google.com/patent/US3957230 (accessed on 16 May 2025).
- Boucher, R.J. Sunrise, the World’s First Solar-Powered Airplane. J. Aircr. 1985, 22, 840–846. [Google Scholar] [CrossRef]
- Irving, F.; Morgan, D. The feasibility of an aircraft propelled by solar energy. In Proceedings of the 2nd International Symposium on the Technology and Science of Low Speed and Motorless Flight, Cambridge,MA,U.S.A., 11-13 September 1974. [Google Scholar] [CrossRef]
- MacCready, P.B.; Lissaman, P.B.S.; Morgan, W.R.; Burke, J.D. Sun-powered aircraft designs. J. Aircr. 1983, 20, 487–493. [Google Scholar] [CrossRef]
- Salem, M.S.; Zekry, A.; Shaker, A.; Abouelatta, M. Design and simulation of proposed low cost solar cell structures based on heavily doped silicon wafers. In Proceedings of the 2016 IEEE 43rd Photovoltaic Specialists Conference (PVSC), Portland, OR, USA, 05-10 June 2016. [Google Scholar] [CrossRef]
- Liller, J.; Goel, R.; Aziz, A.; Hester, J.; Nguyen, P. Development of a battery free, solar powered, and energy aware fixed wing unmanned aerial vehicle. Sci. Rep. 2025, 15, 6141. [Google Scholar] [CrossRef]
- Koszewnik, A.; Oldziej, D. Performance assessment of an energy harvesting system located on a copter. Eur. Phys. J. Spec. Top. 2019, 228, 1677–1692. [Google Scholar] [CrossRef]
- Wei, G.; Bi, Y.; Li, X.; Xu, D.; Xu, W.; Yang, L.J.; Qin, Y.; Guo, H.; Zhao, X.; Chen, X.; et al. Self-powered hybrid flexible nanogenerator and its application in bionic micro aerial vehicles. Nano Energy 2018, 54, 10–16. [Google Scholar] [CrossRef]
- Tao, K.; Chen, Z.; Yi, H.; Zhang, R.; Shen, Q.; Wu, J.; Tang, L.; Fan, K.; Fu, Y.; Miao, J.; et al. Hierarchical honeycomb-structured electret/triboelectric nanogenerator for biomechanical and morphing wing energy harvesting. Nano-Micro Lett. 2021, 13, 1–16. [Google Scholar] [CrossRef]
- Liu, Q.; Li, Q.; Fang, Z.; Zhou, X.; Wang, R.; Zuo, C. Piezoelectric energy harvesting for flapping wing micro air vehicle and flapping wing sensing based on flexible Polyvinylidene Fluoride. Appl. Sci. 2021, 11, 1166. [Google Scholar] [CrossRef]
- Salah, I.; Hafid, T.; Abdelmajid, B.; Ahmed, E.A.; Jaouad, F. Design of a new antenna structure for an RF energy recovery system on a Uav. In Proceedings of the 2019 7th Mediterranean Congress of Telecommunications (CMT), Fez, Morocco, 24-25 October 2019. [Google Scholar] [CrossRef]
- Pandey, G.K.; Gurjar, D.S.; Yadav, S.; Jiang, Y.; Yuen, C. UAV-assisted communications with RF energy harvesting: a comprehensive survey. IEEE Commun. Surv. Tutorials 2024. [Google Scholar] [CrossRef]
- Anton, S.R.; Inman, D.J. Vibration energy harvesting for unmanned aerial vehicles. In Proceedings of the SPIE 6928, U.S.A., 2008. [Google Scholar] [CrossRef]
- Sezer, N.; Koç, M. A comprehensive review on the state-of-the-art of piezoelectric energy harvesting. Nano Energy 2021, 80, 105567. [Google Scholar] [CrossRef]
- Ramadan, K.S.; Evoy, D.; Sameoto, S. A review of piezoelectric polymers as functional materials for electromechanical transducers. Smart Mater. Struct. 2014, 23. [Google Scholar] [CrossRef]
- Magoteaux, K.C.; Sanders, B.; Sodano, H.A. Investigation of an energy harvesting small unmanned air vehicle. In Proceedings of the SPIE 6928, Active and Passive Smart Structures and Integrated Systems, San Diego, California, U.S.A.. [CrossRef]
- Anton, S.R.; Erturk, A.; Inman, D.J. Multifunctional unmanned aerial vehicle wing spar for low-power generation and storage. J. of Aircraft 2012, 49. [Google Scholar] [CrossRef]
- Singh, P.; Ansari, M.A.; Bisoi, A. An analytical analysis of vibrational energy harvesting using piezoelectric energy harvester in a fixed wing unmanned aerial vehicle. Proc. Inst. Mech. Eng. Part L J. Mater. Des. Appl. 2024, 238, 1514–1525. [Google Scholar] [CrossRef]
- Erturk, A.; Renno, J.M.; Inman, D.J. Modeling of piezoelectric energy harvesting from an L-shaped beam-mass structure with an application to UAVs. J. Intell. Mater. Syst. Struct. 2009, 20, 529–544. [Google Scholar] [CrossRef]
- Pozzi, M.; Guo, S.; Zhu, M. Harvesting energy from the dynamic deformation of an aircraft wing under gust loading. In Proceedings of the SPIE 8348, Health Monitoring of Structural and Biological Systems, 2012. [Google Scholar] [CrossRef]
- Erturk, A.; Bilgen, O.; Fontenille, M.; Inman, D.J. Piezoelectric energy harvesting from macro-fiber composites with an application to morphing-wing aircrafts. In Proceedings of the 19th International Conference on Adaptive Structures and Technologies, Ascona, Switzerland, 06-09 October 2008. [Google Scholar]
- Pozzi, M.; Canziani, A.; Durazo-Cardenas, I.; Zhu, M. Experimental characterisation of macro fibre composites and monolithic piezoelectric transducers for strain energy harvesting. In Proceedings of the SPIE 8348, Health Monitoring of Structural and Biological Systems, 2012. [Google Scholar] [CrossRef]
- Atique, M.S.A.; Yang, C.X. Energy harvesting & wing morphing design using piezoelectric macro fiber composites. In Proceedings of the Proceedings of the ASME 2022 International Mechanical Engineering Congress and Exposition (IMECE2022), Columbus, Ohio, October 30-November 3 2022. [Google Scholar]
- Sharma, S.; Simha, A.; Venkatesha, R.; Gokhale, V.; Narayana, S. Hermes - wind energy harvesting wireless system for sensing AoA and wind speed. IEEE Robot. Autom. Lett. 2021, 6, 7097–7104. [Google Scholar] [CrossRef]
- Astan, N.; Mohammadzamani, D.; Gholami Parashkoohi, M.; Ebrahimi, E. Energy harvesting and ANFIS modeling of a PVDF/GO-ZNO piezoelectric nanogenerator on a UAV. Open Agric. 2024, 9. [Google Scholar] [CrossRef]
- Martins, P.; Lopes, A.C.; Lanceros-Mendez, S. Electroactive phases of poly(vinylidene fluoride): Determination, processing and applications. Prog. Polym. Sci. 2014, 39, 683–706. [Google Scholar] [CrossRef]
- Zhang, W.; Wu, G.; Zeng, H.; Li, Z.; Wu, W.; Jiang, H.; Zhang, W.; Wu, R.; Huang, Y.; Lei, Z. The preparation, structural design, and application of electroactive Poly(vinylidene fluoride)-based materials for wearable sensors and human energy harvesters. Polymers (Basel). 2023, 15. [Google Scholar] [CrossRef]
- Ruan, L.; Yao, X.; Chang, Y.; Zhou, L.; Qin, G.; Zhang, X. Properties and applications of the β phase poly(vinylidene fluoride). Polymers (Basel). 2018, 10, 1–27. [Google Scholar] [CrossRef]
- TE Connectivity, LDT with Crimps Vibration Sensor/Switch. Available online: https://www.te.com/commerce/DocumentDelivery/DDEController?Action=showdoc&DocId=Data+Sheet%7FLDT_with_Crimps%7FA1%7Fpdf%7FEnglish%7FENG_DS_LDT_with_Crimps_A1.pdf%7FCAT-PFS0006 (accessed on 11 June 2023).
- Priya, S.; Song, H.C.; Zhou, Y.; Varghese, R.; Chopra, A.; Kim, S.G.; Kanno, I.; Wu, L.; Ha, D.S.; Ryu, J.; et al. A review on piezoelectric energy harvesting: materials, methods, and circuits. Energy Harvest. Syst. 2017, 4, 3–39. [Google Scholar] [CrossRef]
- Tripathi, P.R.; Thakura, P.; Keshri, R.K.; Ghosh, S.; Guerrero, J.M. Twenty-five years of single-stage buck-boost inverters: development and challenges. IEEE Ind. Electron. Mag. 2022, 16, 4–10. [Google Scholar] [CrossRef]
- Restrepo, C.; Gonzalez-Castano, C.; Giral, R. The Versatile Buck-Boost Converter as Power Electronics Building Block: Changes, Techniques, and Applications. IEEE Ind. Electron. Mag. 2023, 17, 36–45. [Google Scholar] [CrossRef]
- Analog Devices, LTC3588-1 – Nanopower Energy Harvesting Power Supply. Available online: https://www.analog.com/en/products/ltc3588-1.html#part-details (accessed on 01 November 2024).
Figure 1.
Piezoelectric transducer based on PVDF - LDT0-028K model.

Figure 2.
EH power management chip LTC3588-1.
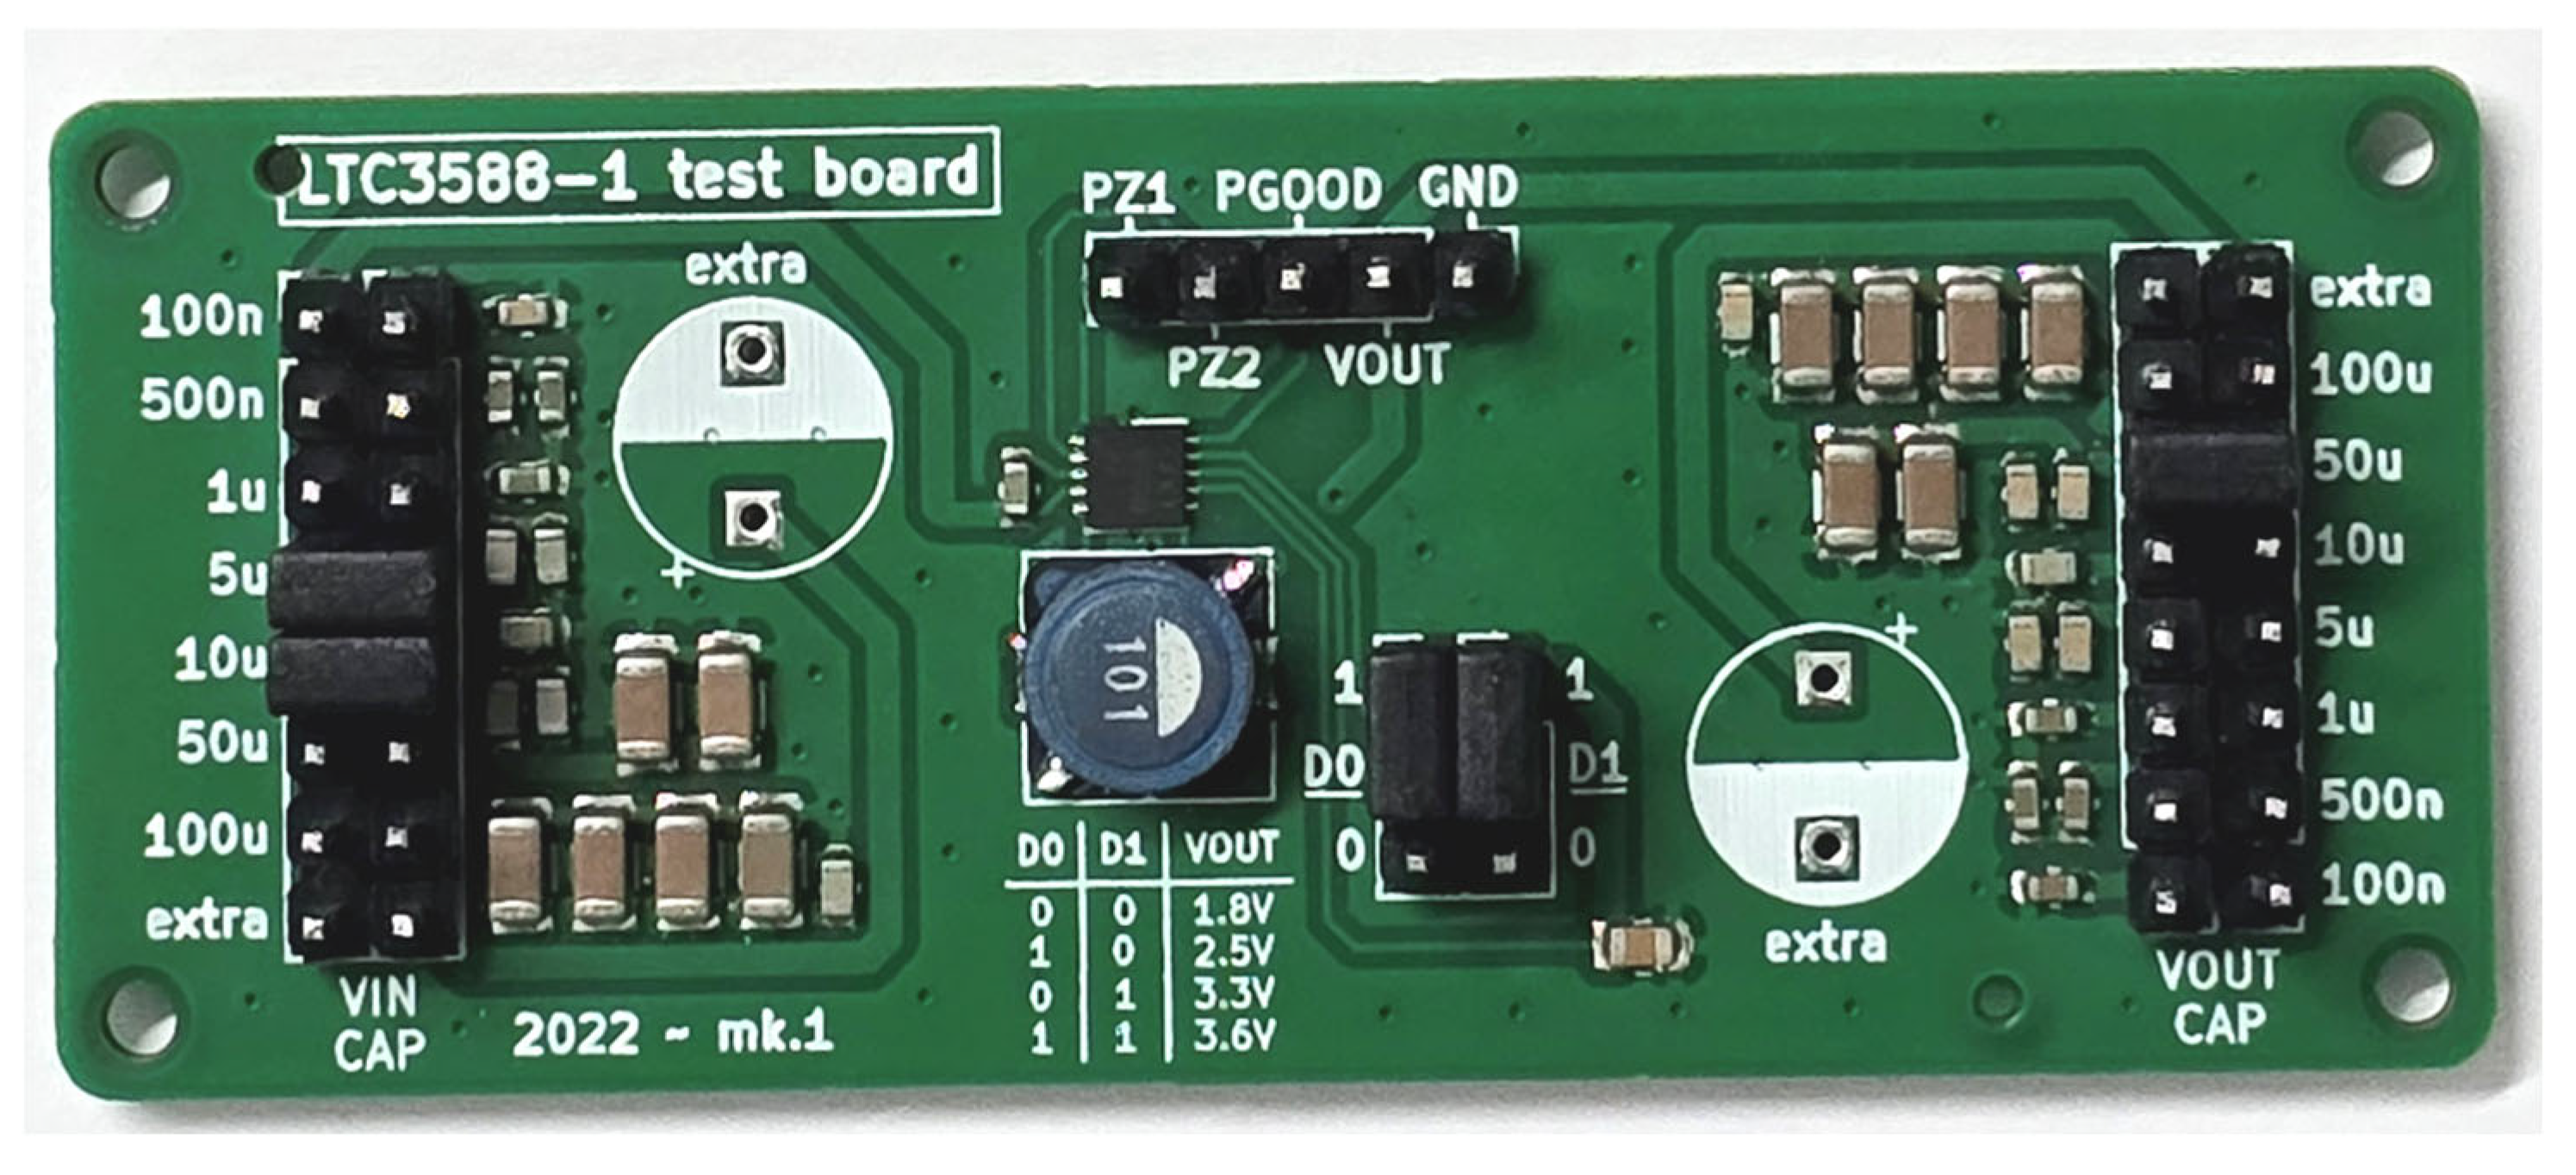
Figure 3.
Schematic representation of the test bench.
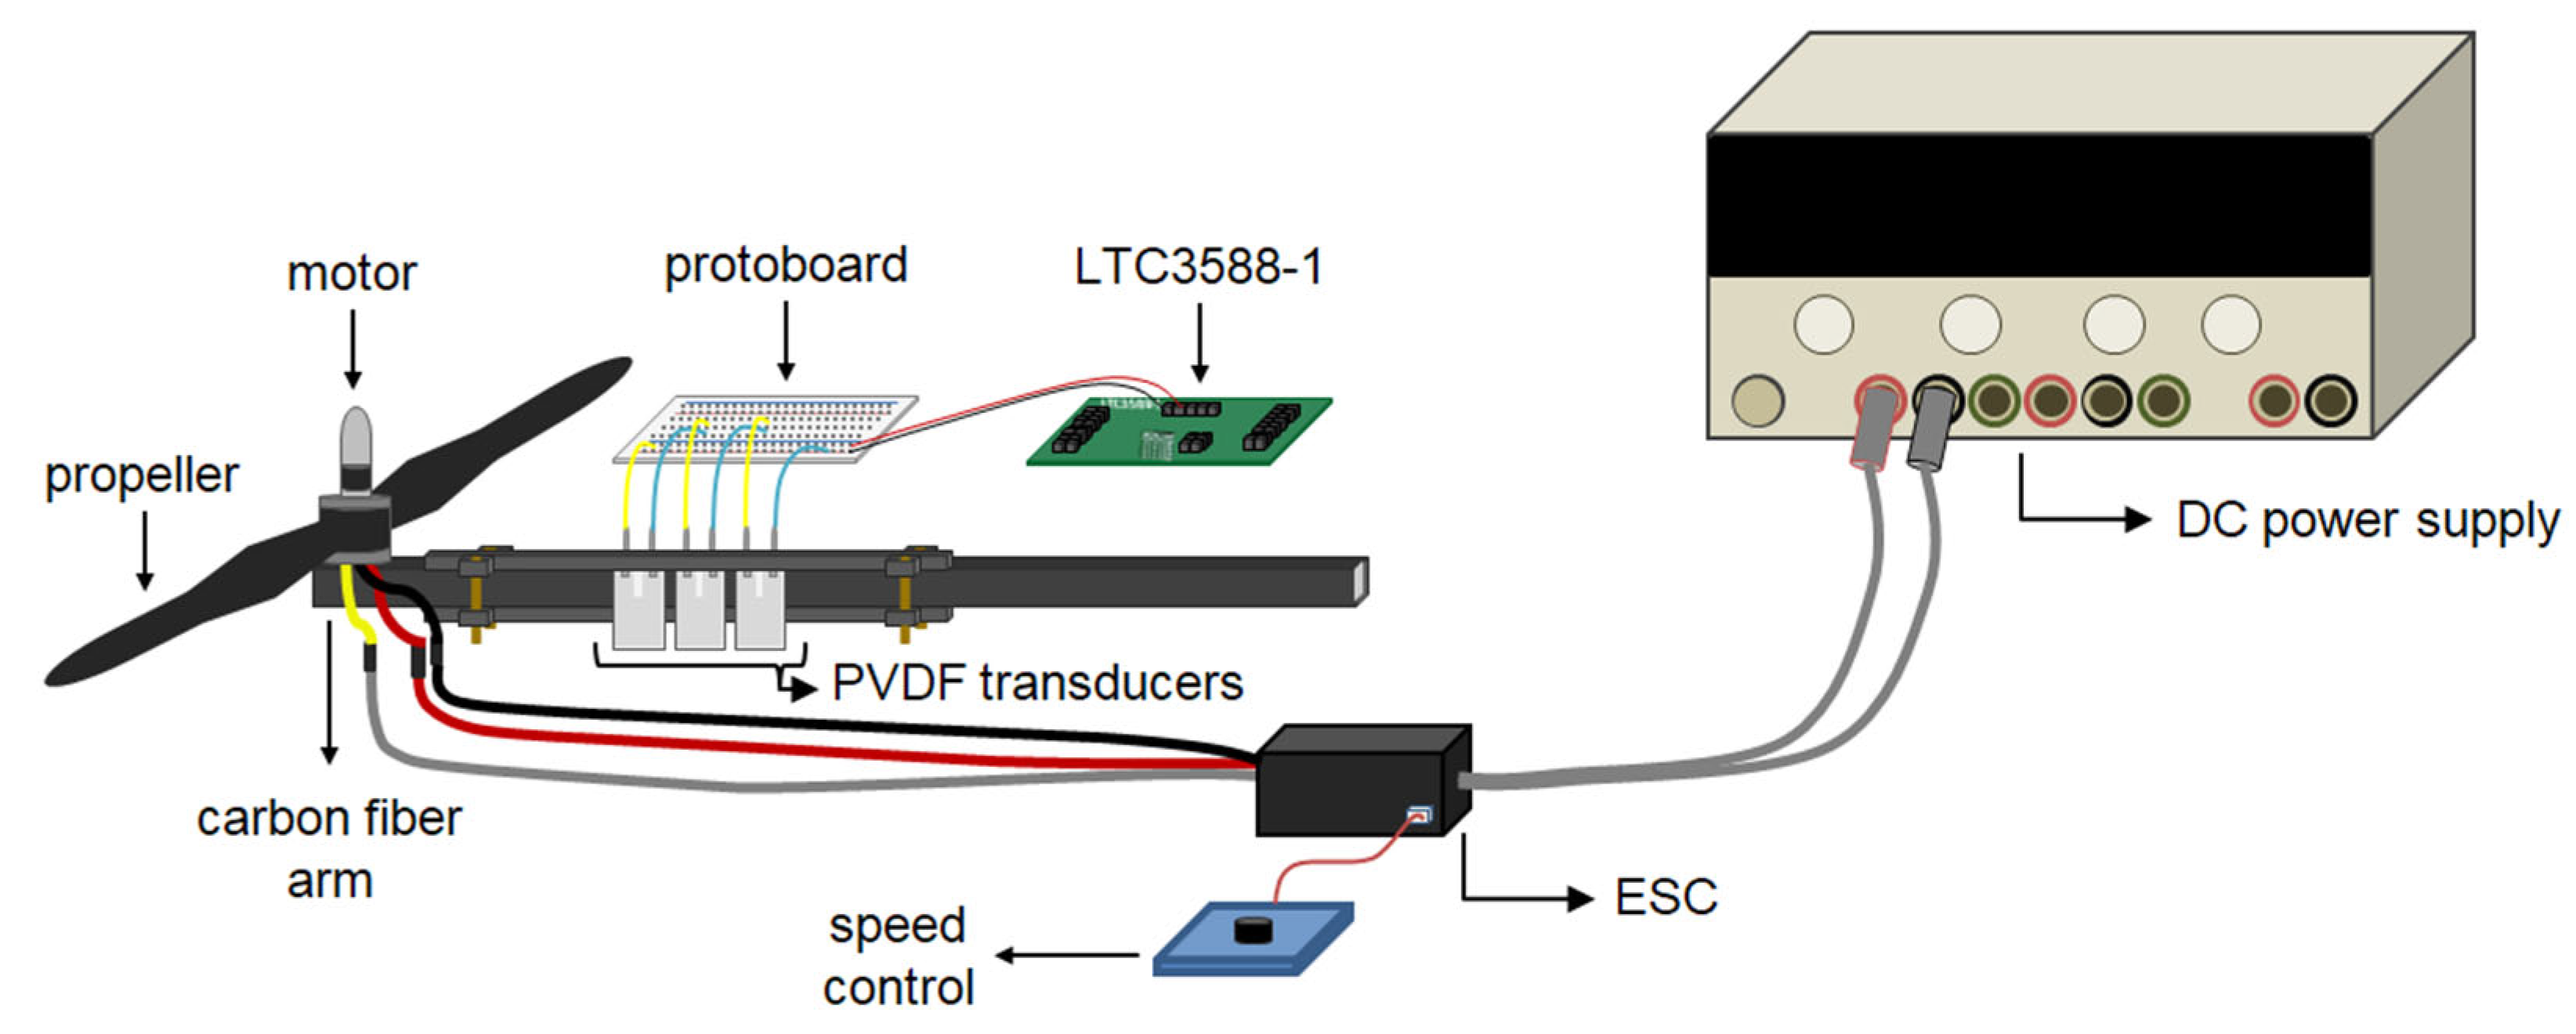
Figure 4.
Representation of three transducers in series and the external components connected to the LTC3588-1.
Figure 4.
Representation of three transducers in series and the external components connected to the LTC3588-1.
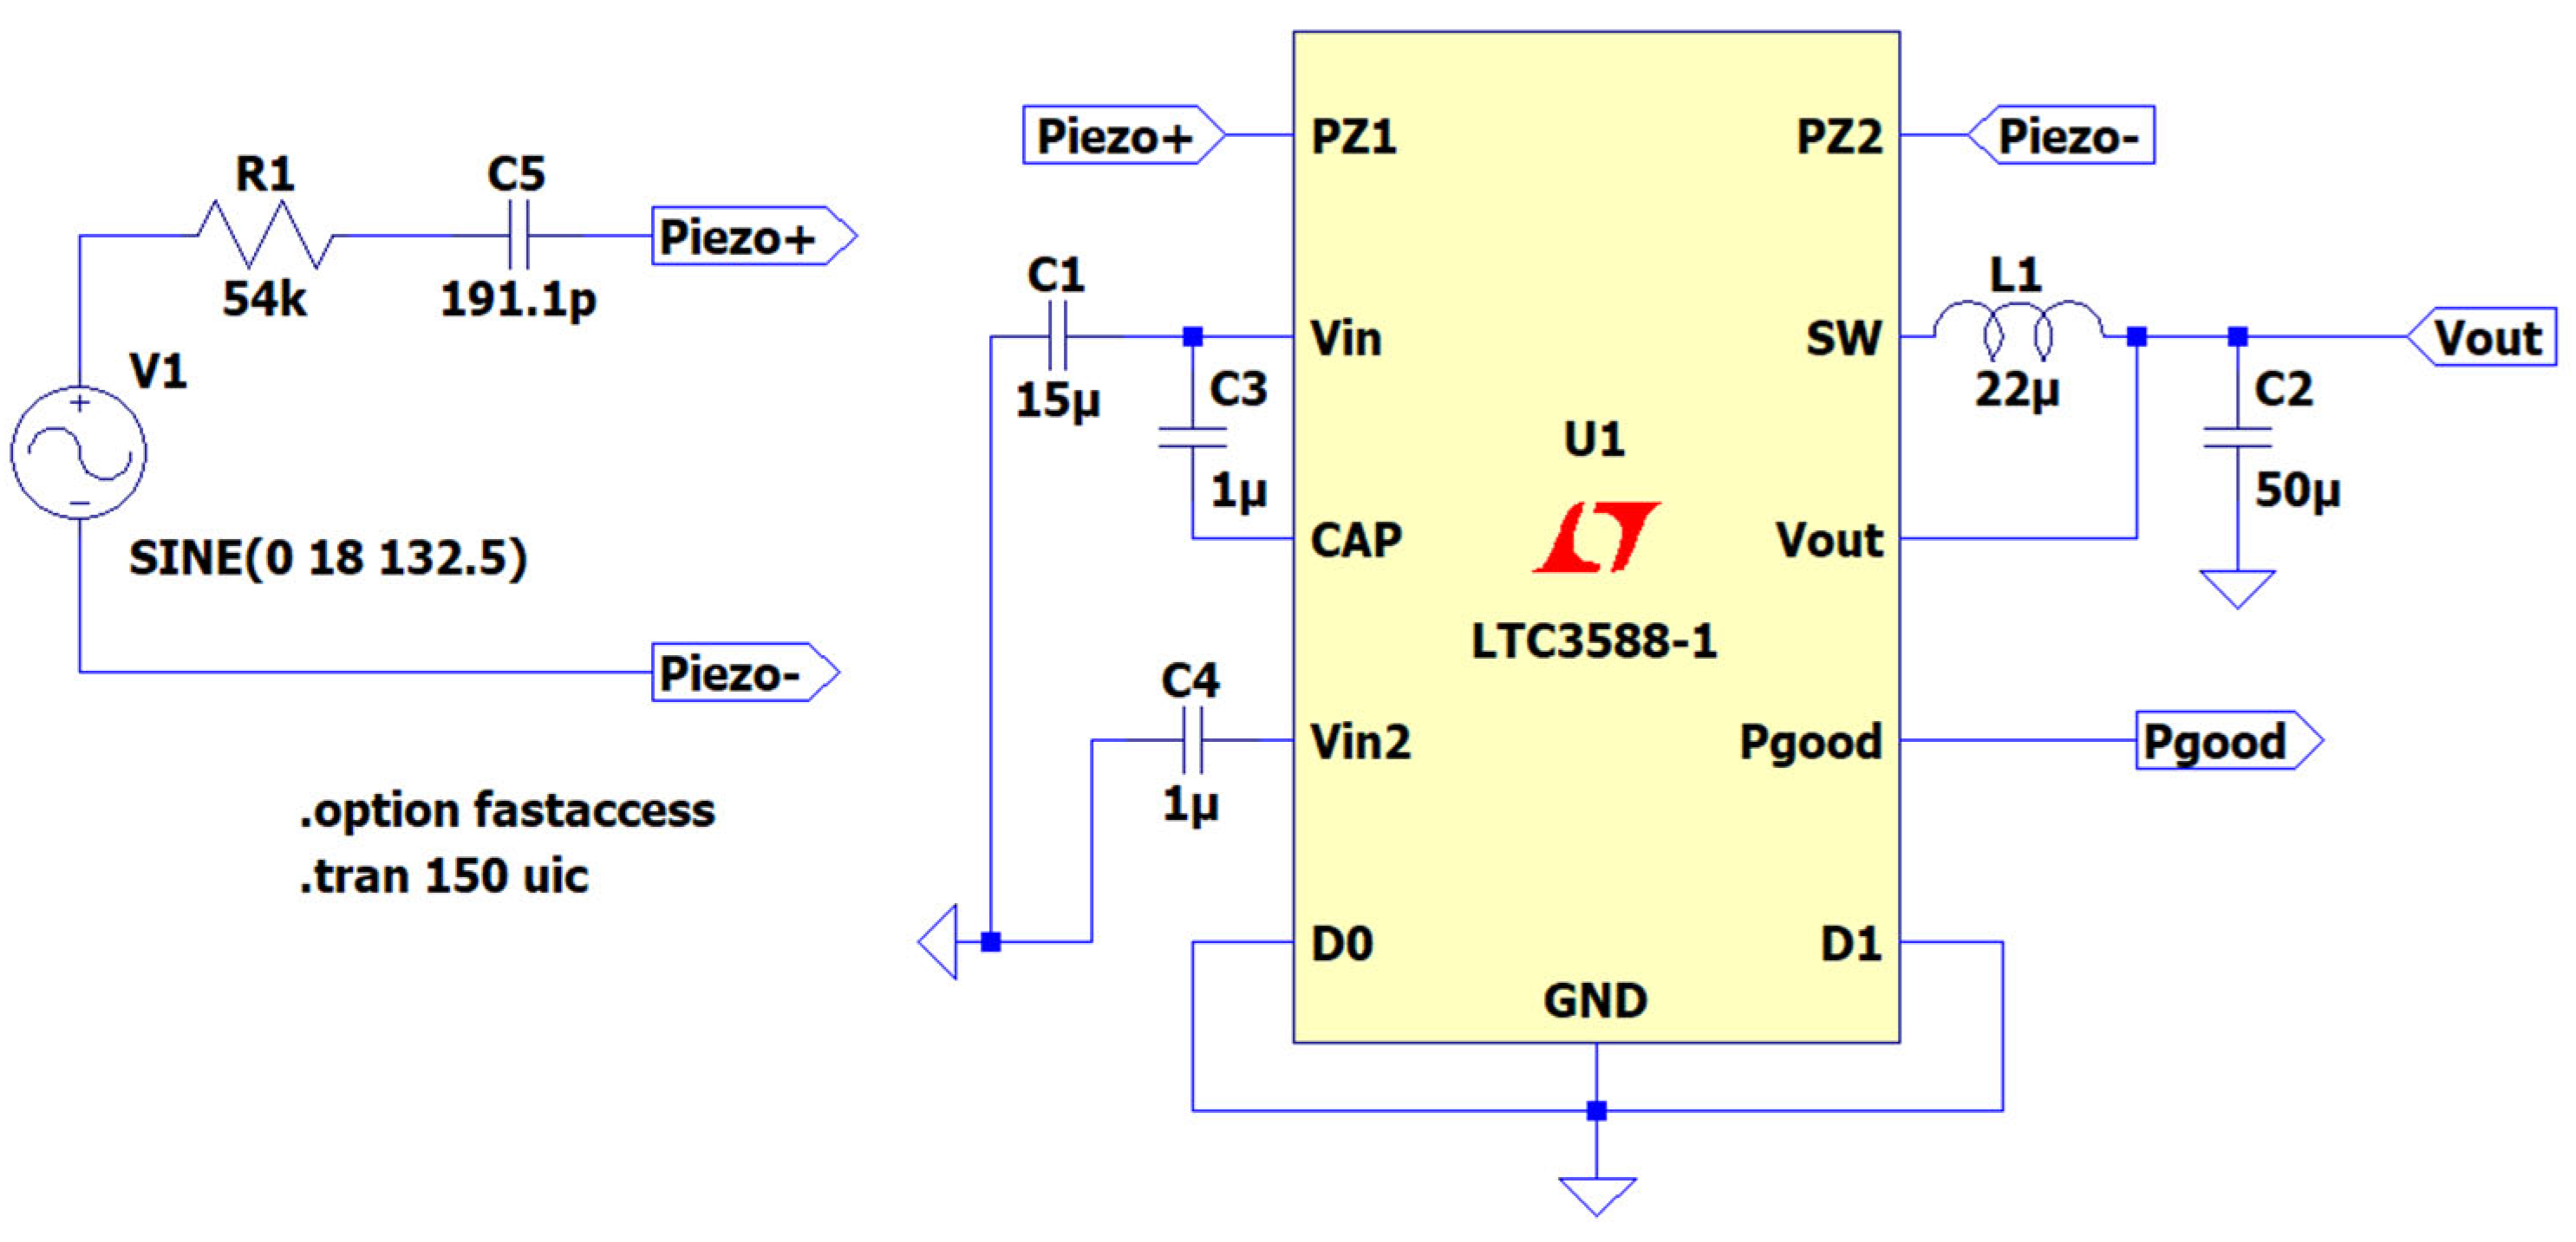
Figure 5.
Motor rotational frequency as a function of power supplied by the source.
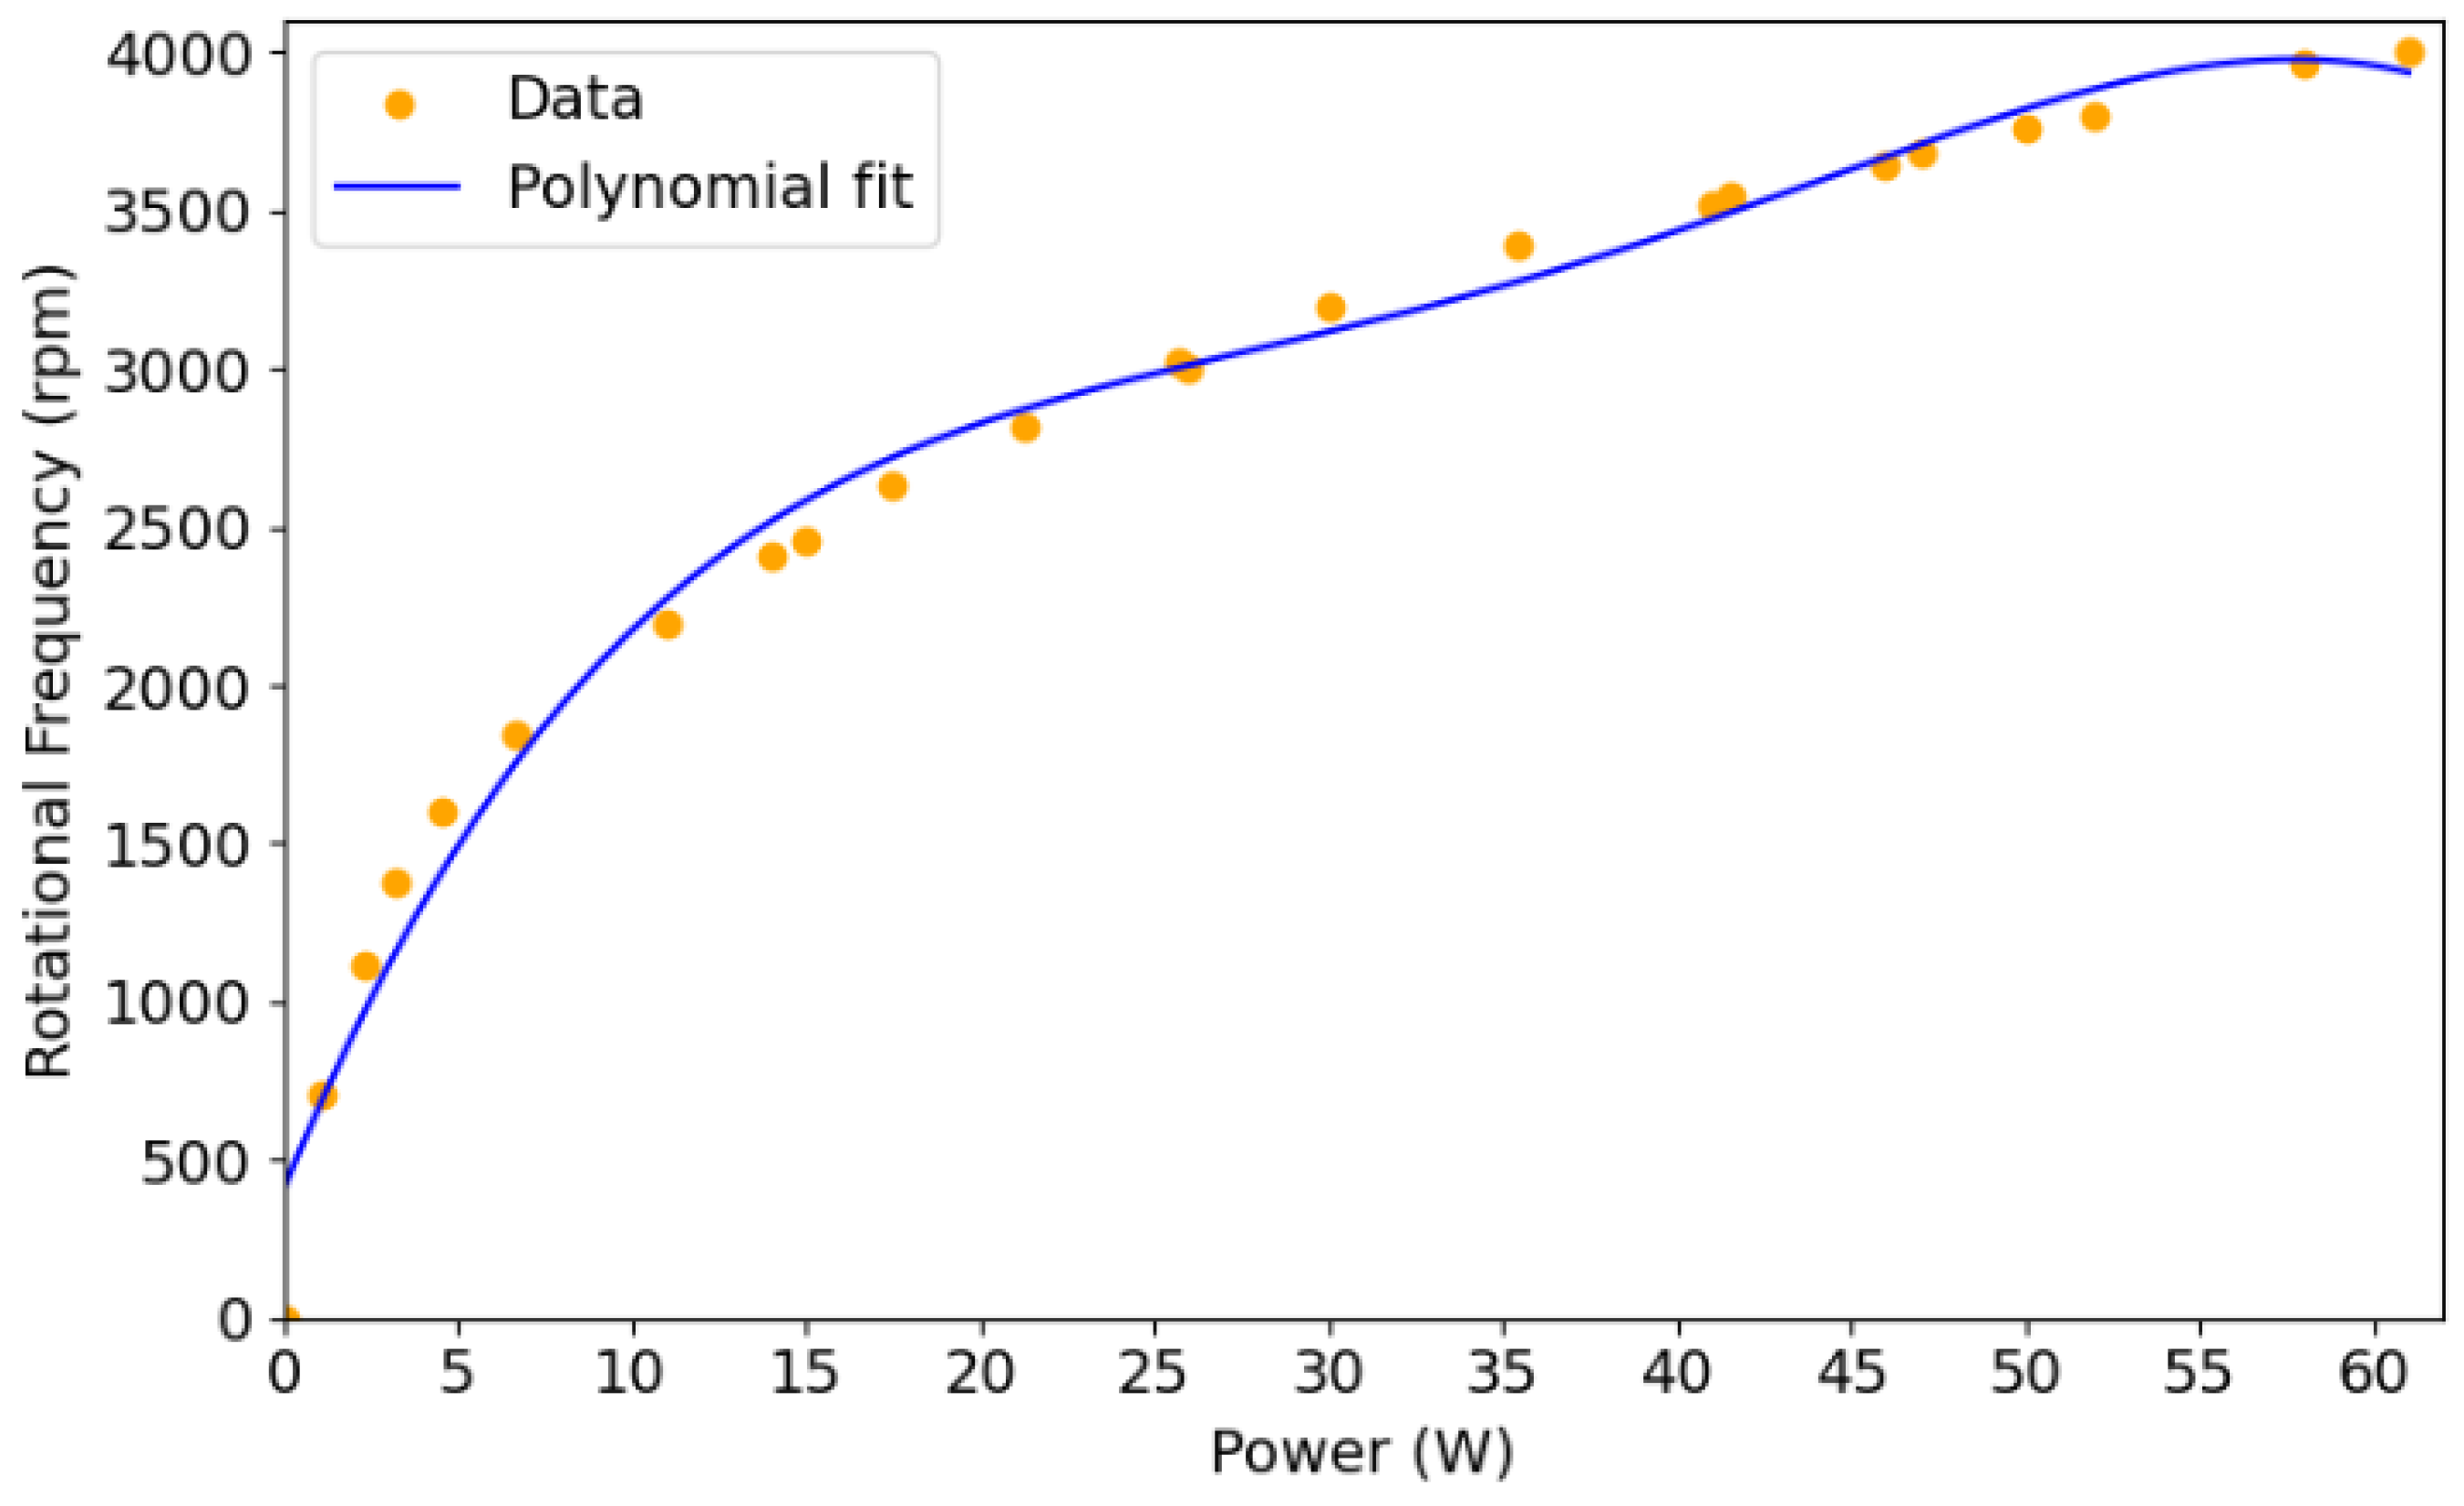
Figure 6.
Voltage generated by films as a function of motor rotational frequency.
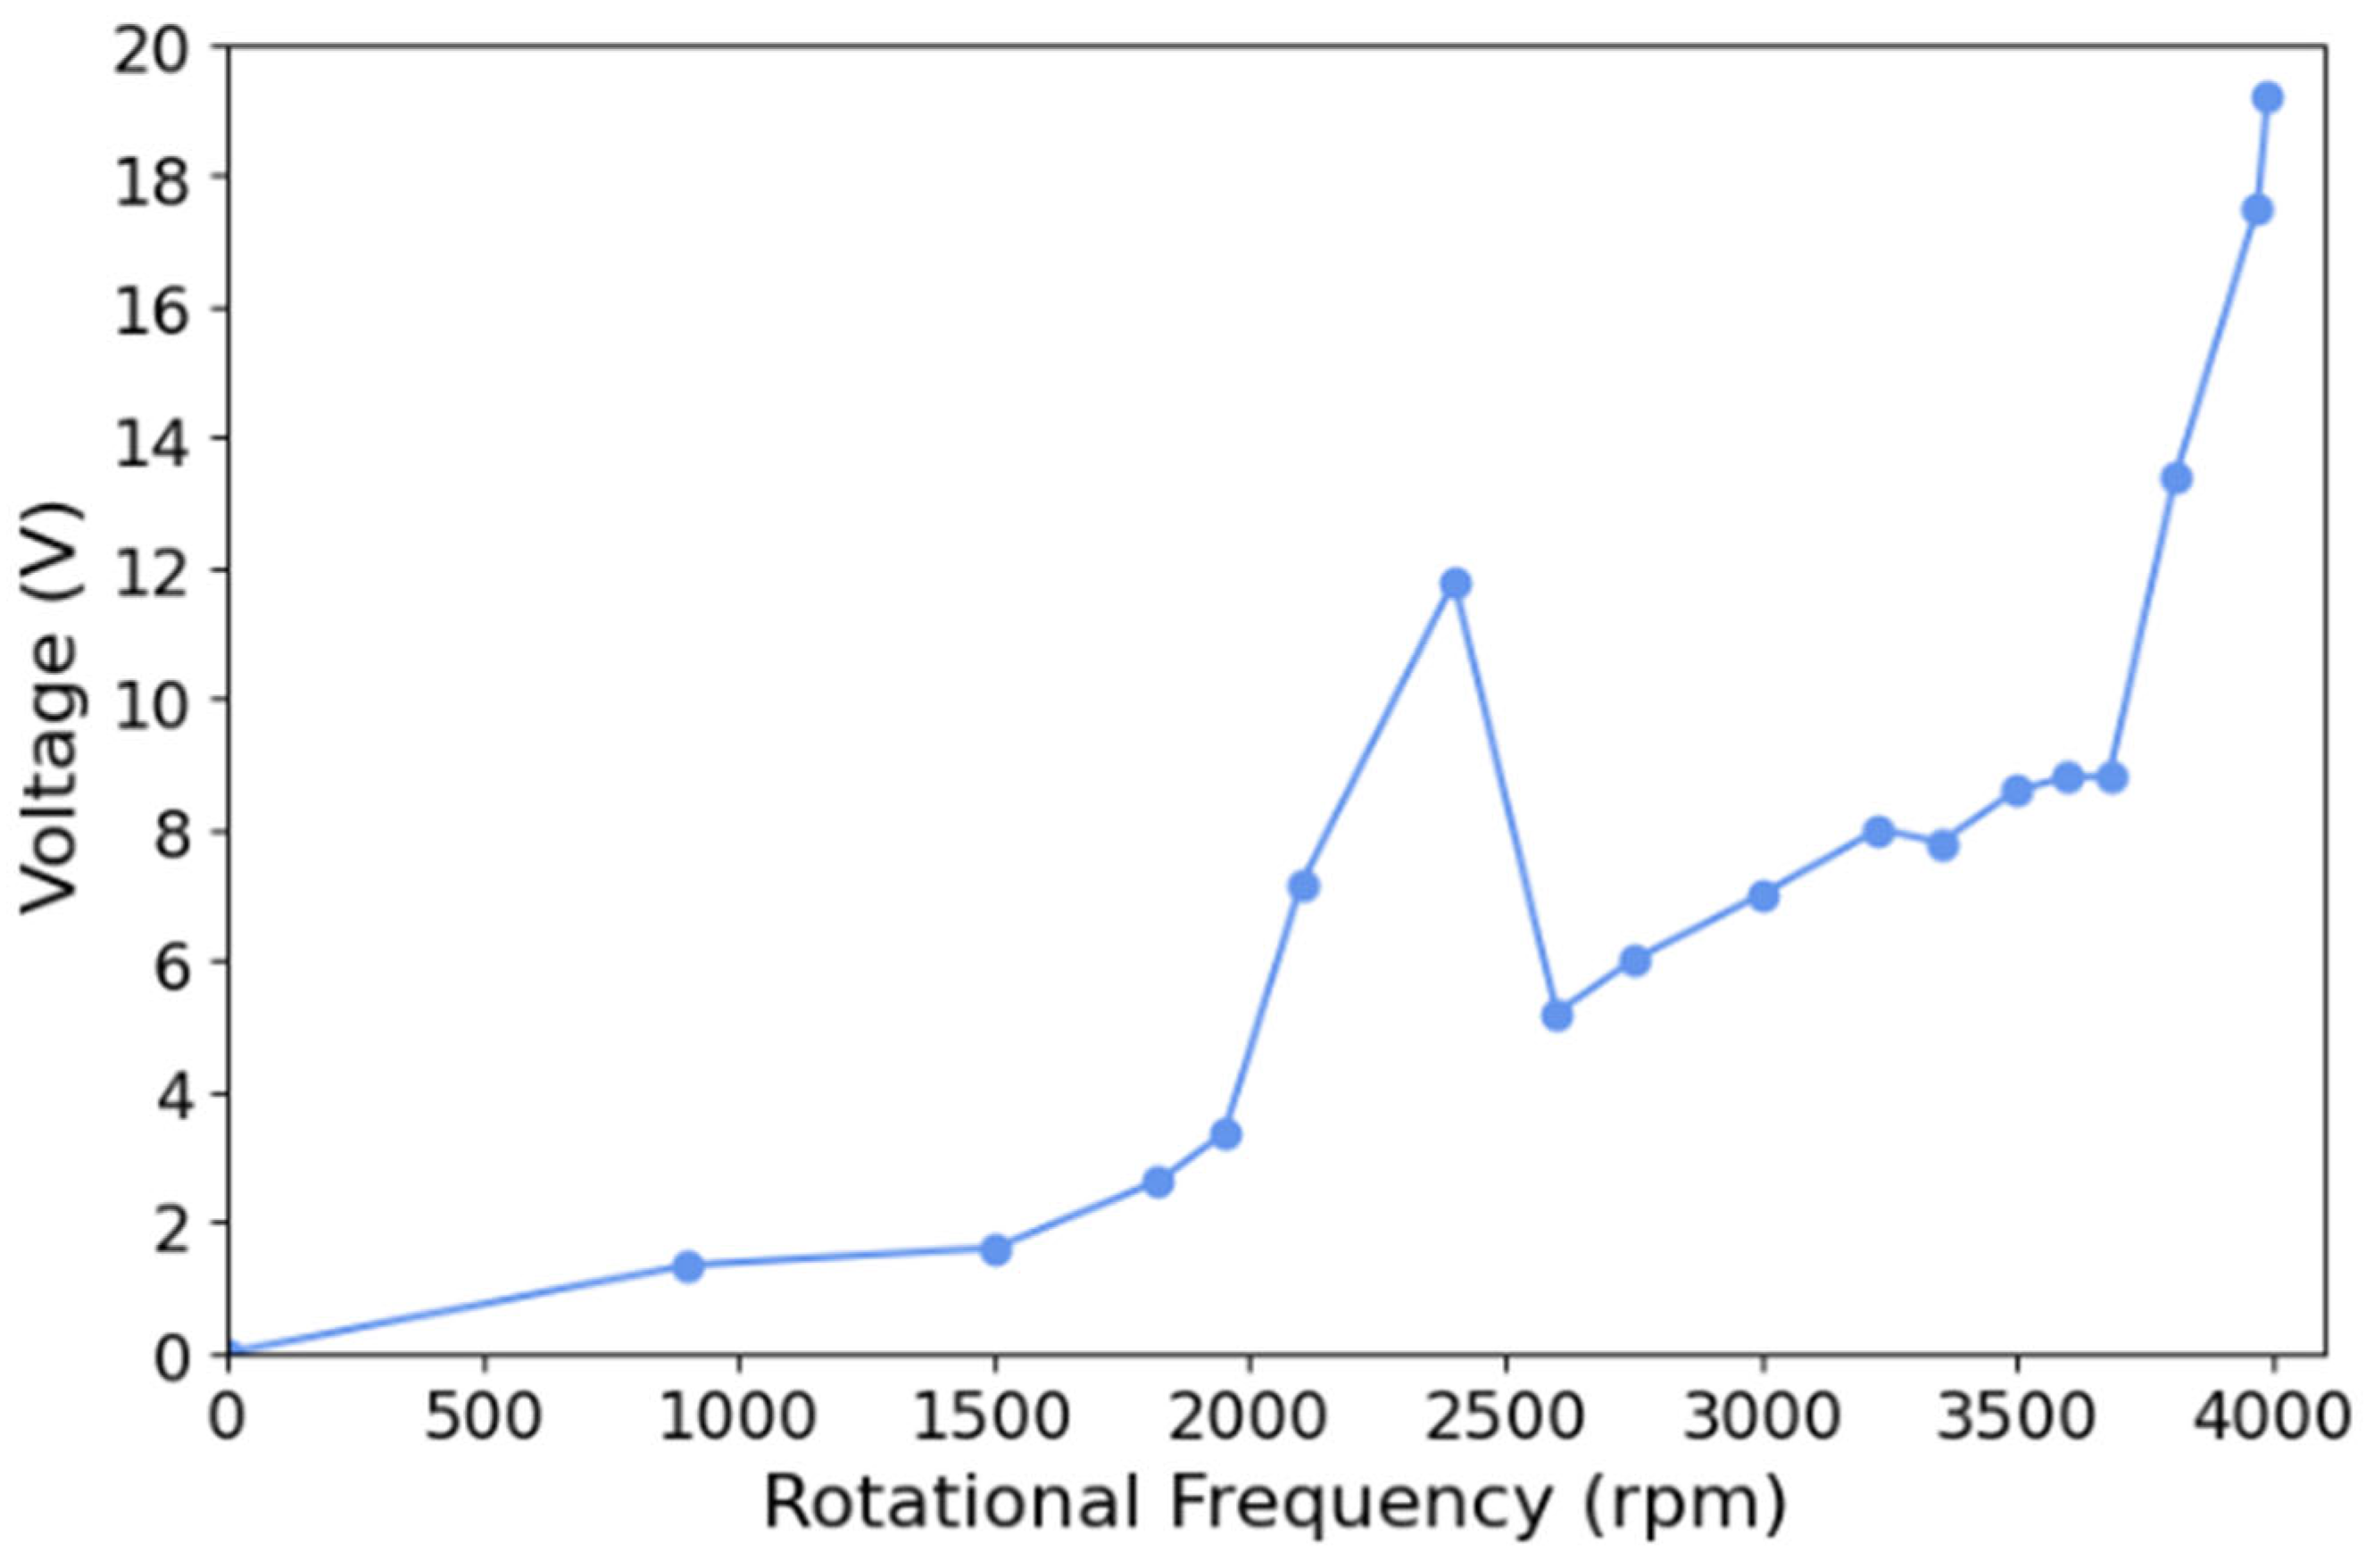
Figure 7.
Voltage across Cin, Cout e Pgood as function of time, with output voltage set to 1.8 V: (a) Simulation; (b) Experimental.
Figure 7.
Voltage across Cin, Cout e Pgood as function of time, with output voltage set to 1.8 V: (a) Simulation; (b) Experimental.
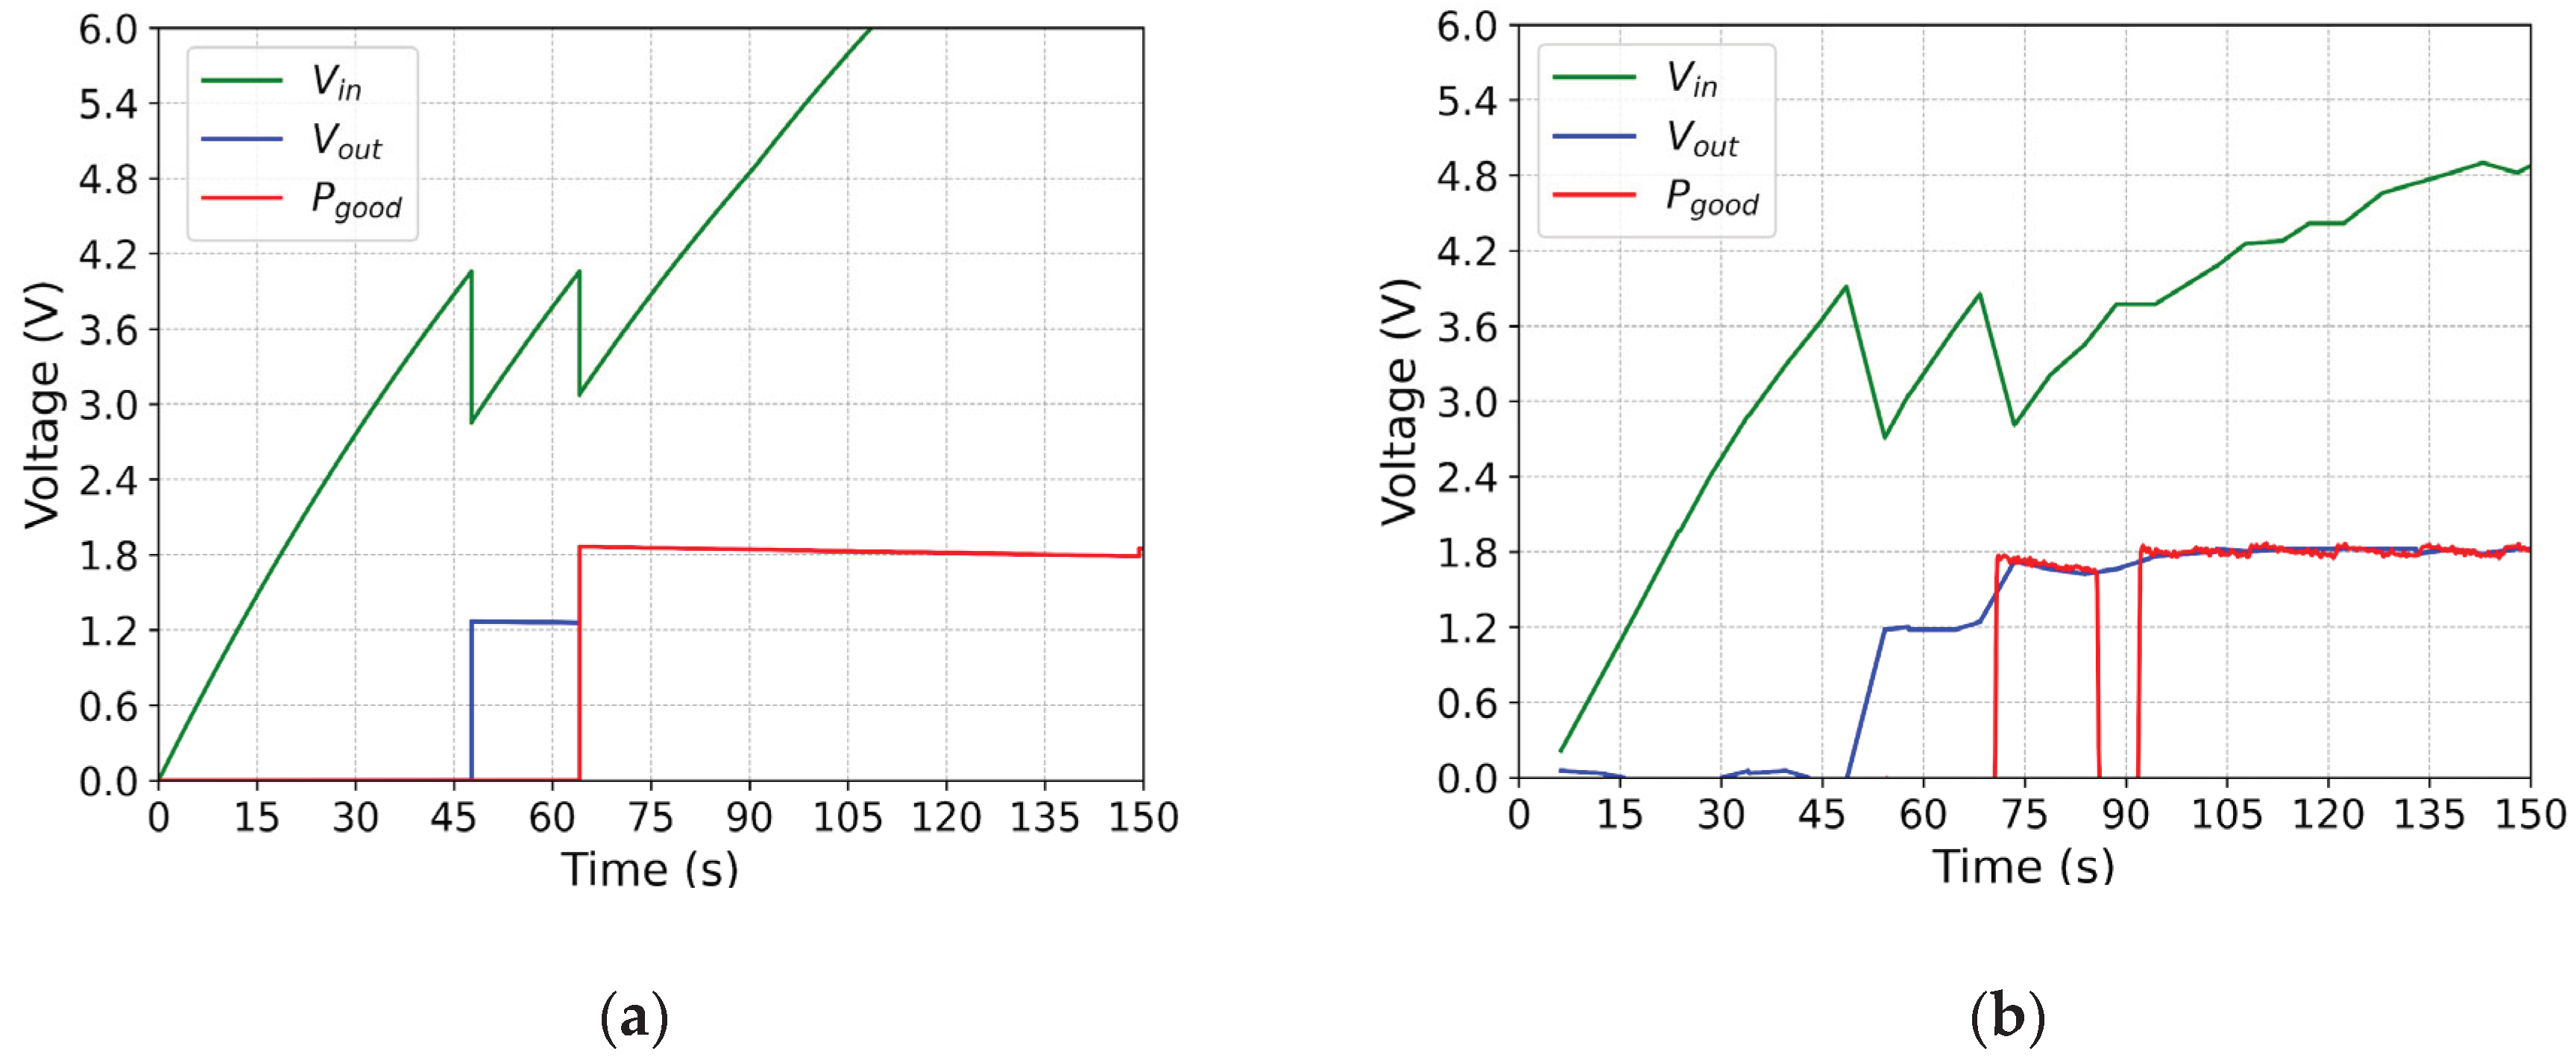
Figure 8.
Voltage across Cin, Cout e Pgood as function of time, with output voltage set to 2.5 V: (a) Simulation; (b) Experimental.
Figure 8.
Voltage across Cin, Cout e Pgood as function of time, with output voltage set to 2.5 V: (a) Simulation; (b) Experimental.
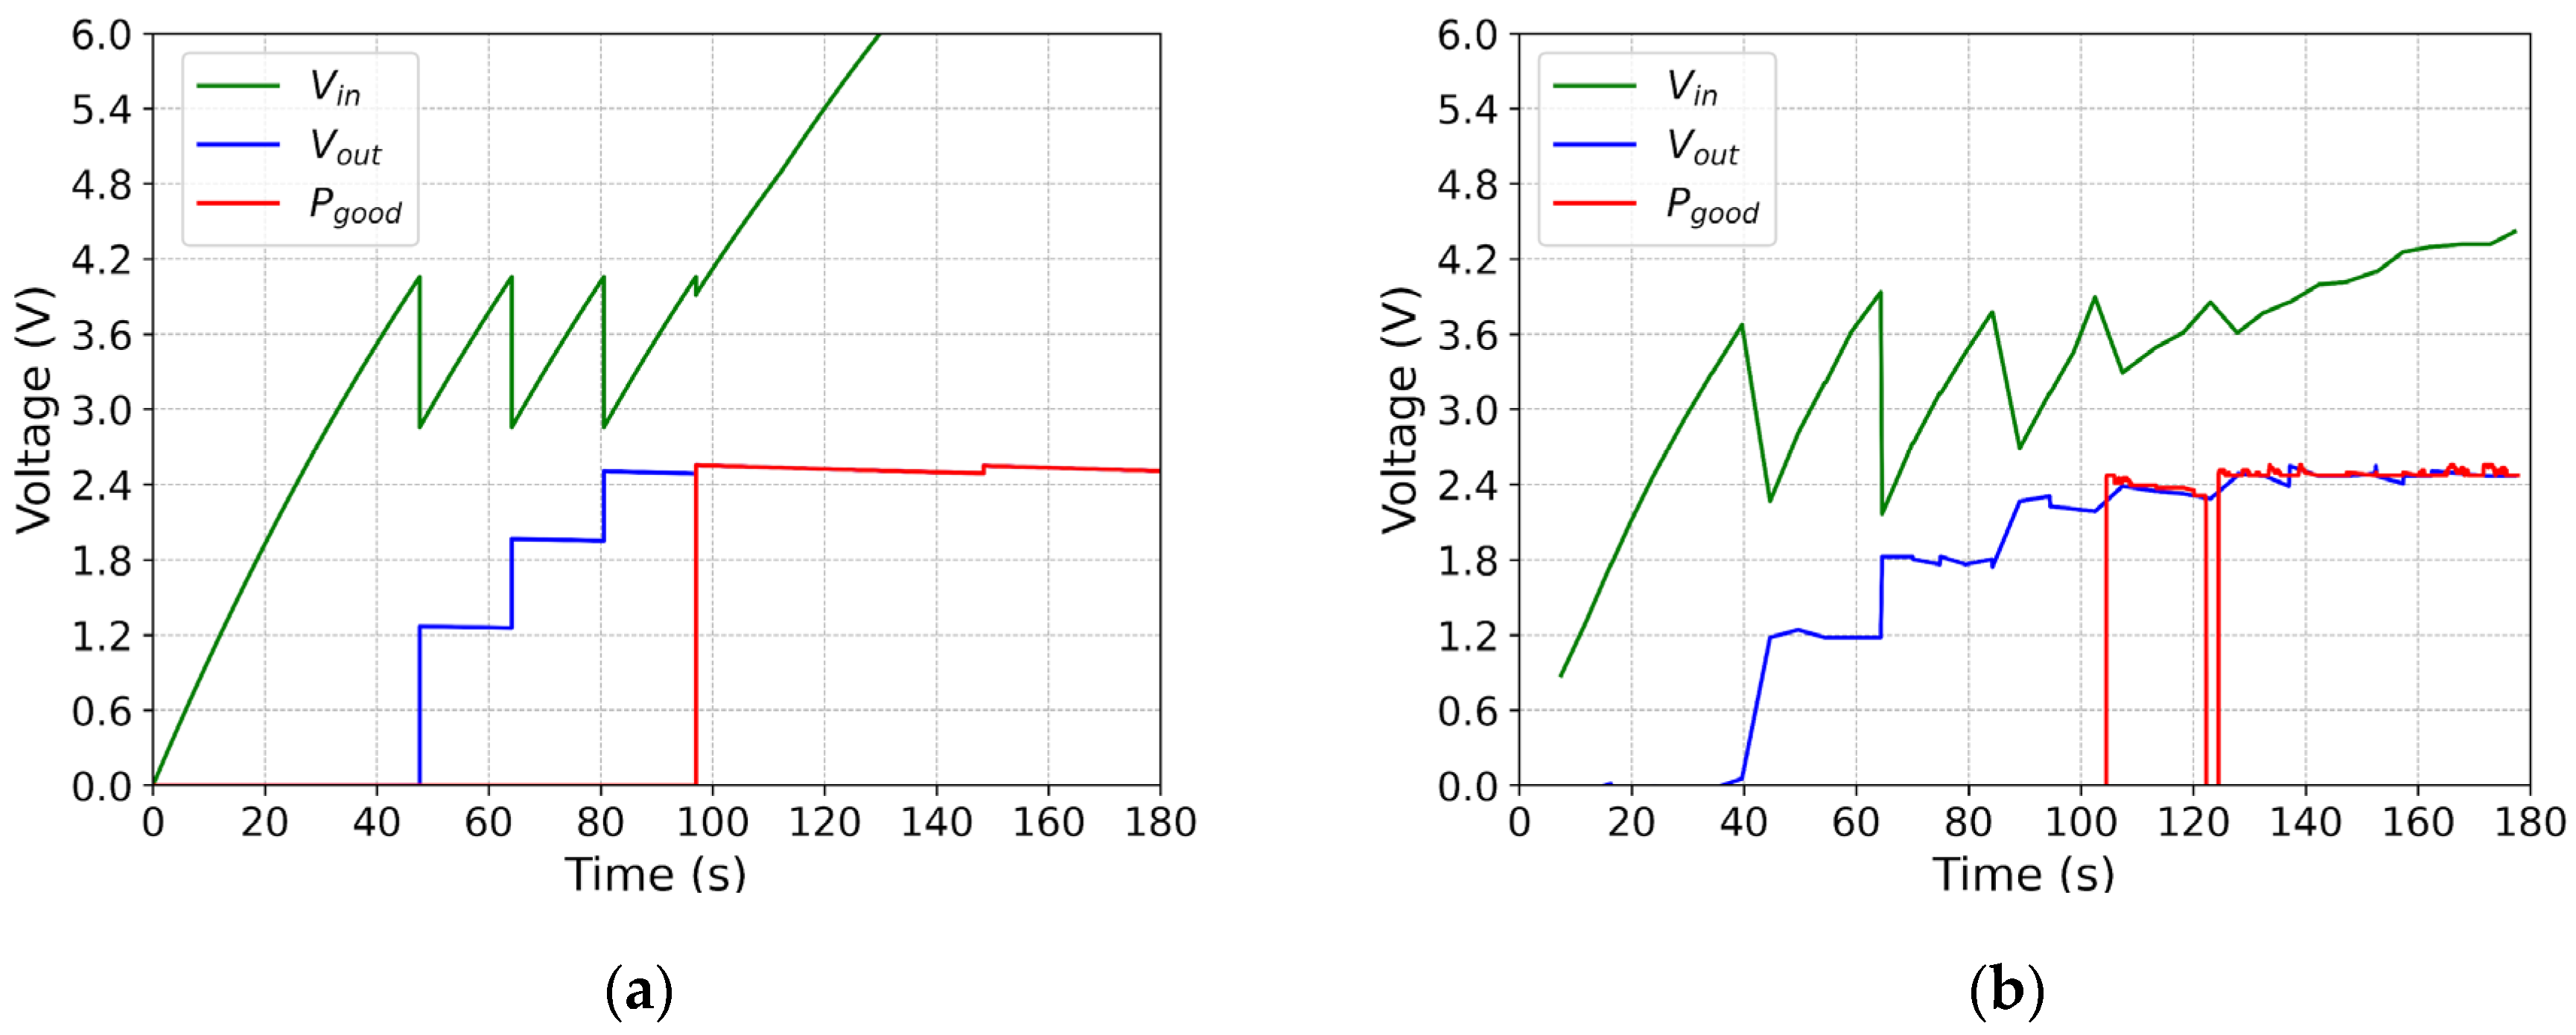
Figure 9.
Voltage across Cin, Cout e Pgood as function of time, with output voltage set to 3.3 V: (a) Simulation; (b) Experimental.
Figure 9.
Voltage across Cin, Cout e Pgood as function of time, with output voltage set to 3.3 V: (a) Simulation; (b) Experimental.

Figure 10.
Voltage across Cin, Cout e Pgood as function of time, with output voltage set to 3.6 V: (a) Simulation; (b) Experimental.
Figure 10.
Voltage across Cin, Cout e Pgood as function of time, with output voltage set to 3.6 V: (a) Simulation; (b) Experimental.
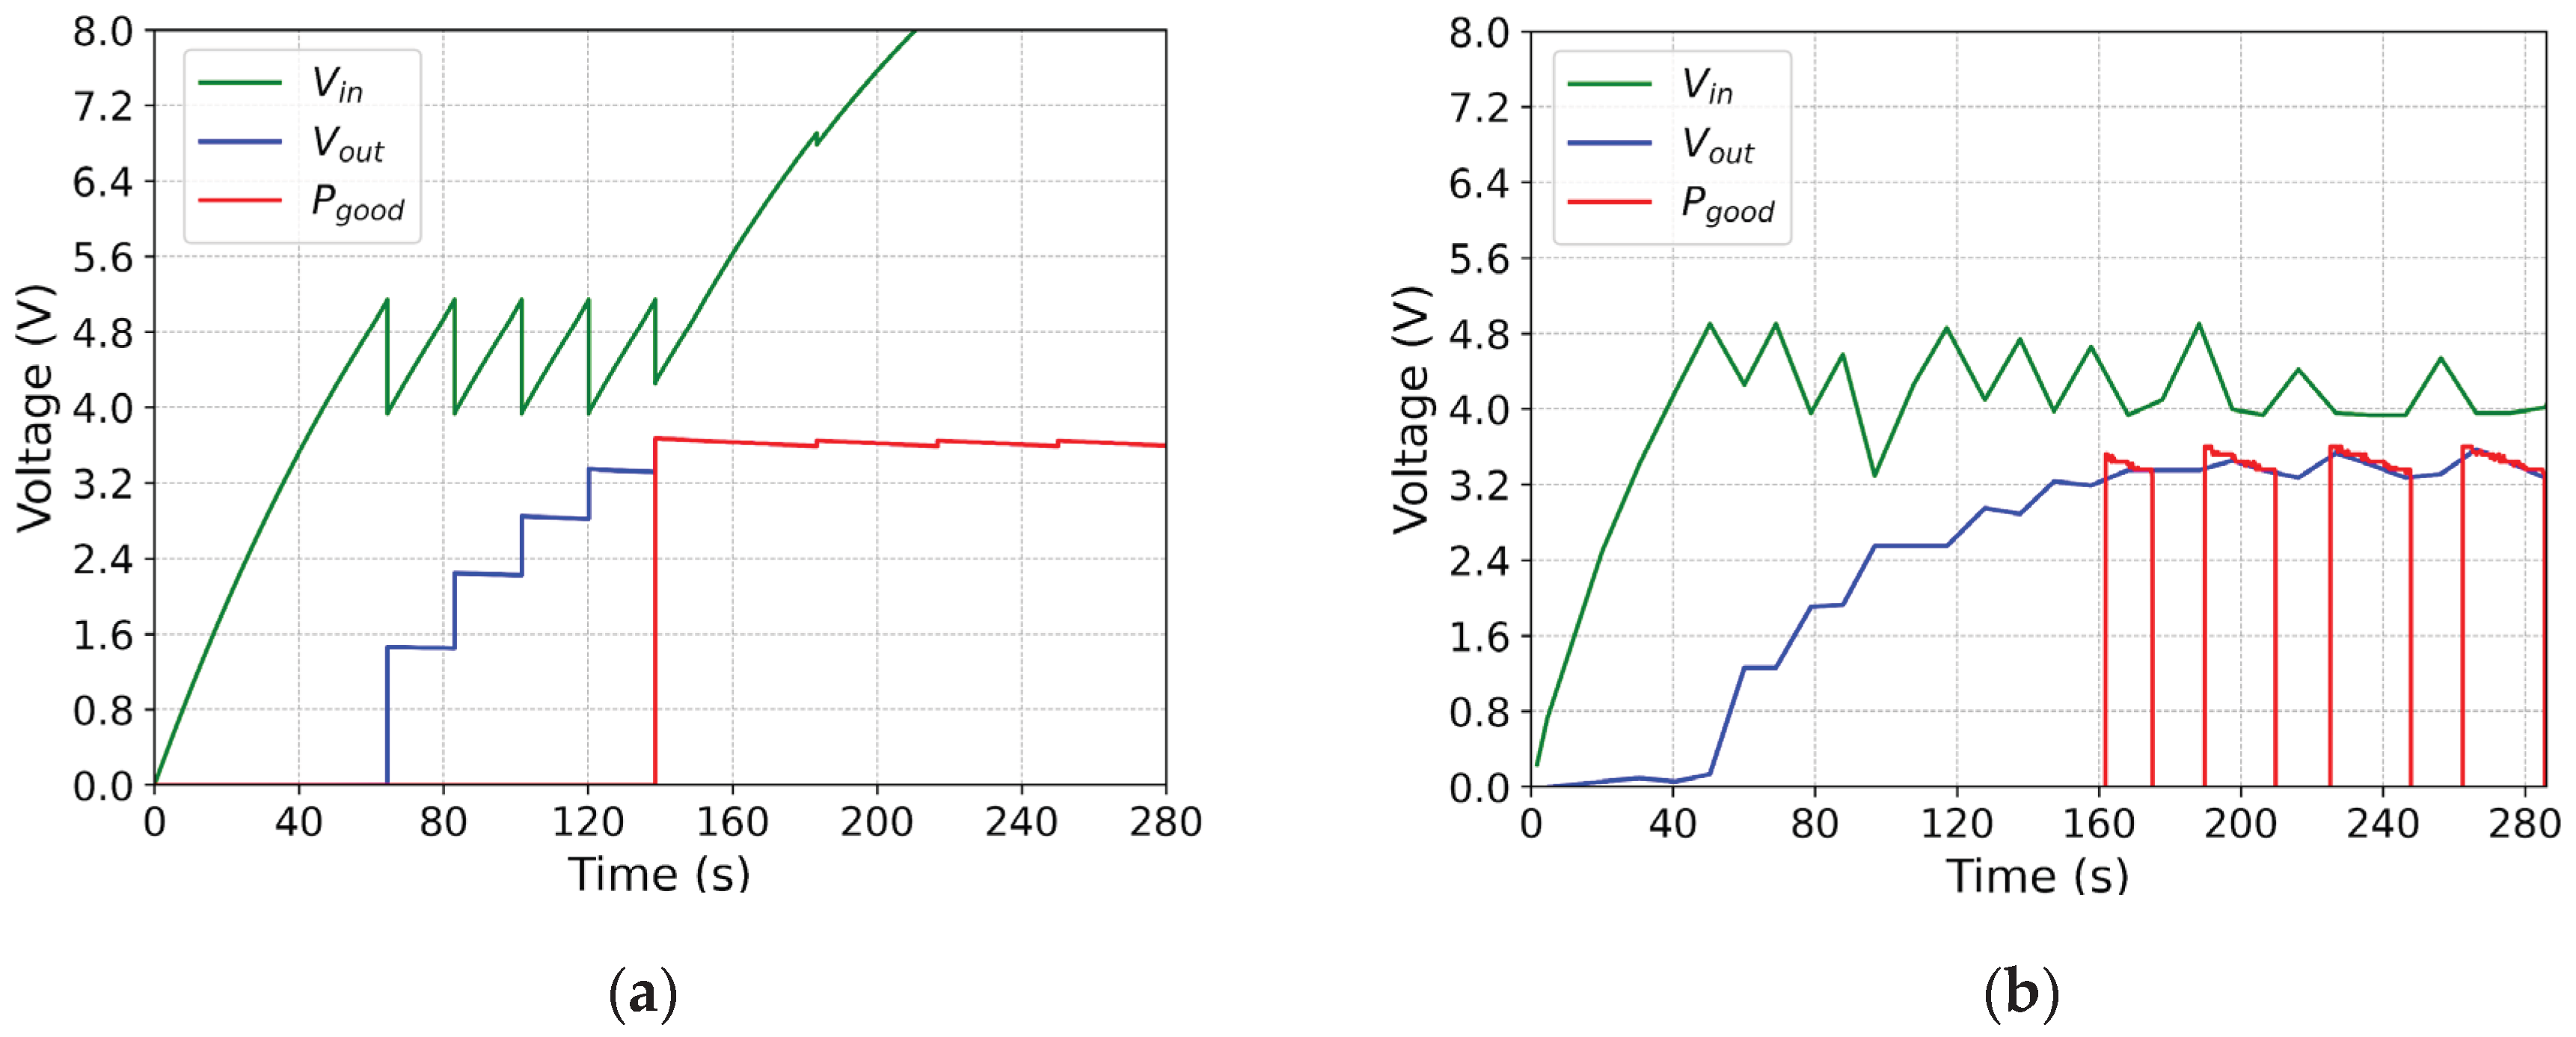

Table 1.
Summary comparing simulation and experimental validation of Cout and Pgood behavior across different output voltages.
Table 1.
Summary comparing simulation and experimental validation of Cout and Pgood behavior across different output voltages.
| Output voltages (V) | Cout | Pgood | ||
| cycles | time (s) | |||
| 1.5 | simulation | 2 | 47.7 | 64.1 |
| experimental | 2 | 54 | 71 | |
| 2.5 | simulation | 4 | 47.7 | 97 |
| experimental | 4 | 45 | 105 | |
| 3.3 | simulation | 5 | 60 | 133 |
| experimental | 5 | 60 | 165 | |
| 3.6 | simulation | 5 | 64.5 | 138.6 |
| experimental | 6 | 60 | 162 | |
Disclaimer/Publisher’s Note: The statements, opinions and data contained in all publications are solely those of the individual author(s) and contributor(s) and not of MDPI and/or the editor(s). MDPI and/or the editor(s) disclaim responsibility for any injury to people or property resulting from any ideas, methods, instructions or products referred to in the content. |
© 2025 by the authors. Licensee MDPI, Basel, Switzerland. This article is an open access article distributed under the terms and conditions of the Creative Commons Attribution (CC BY) license (http://creativecommons.org/licenses/by/4.0/).
Copyright: This open access article is published under a Creative Commons CC BY 4.0 license, which permit the free download, distribution, and reuse, provided that the author and preprint are cited in any reuse.


