Submitted:
20 July 2025
Posted:
21 July 2025
You are already at the latest version
Abstract
Bridges are essential for national mobility and economy, making reliable structural health monitoring (SHM) systems vital for ensuring safety and longevity. However, the SHM data quality is often affected by sensor faults, transmission noise, and environmental interference. To address these issues, anomaly detection methods are widely adopted. Despite their wide use and variety, there is a lack of systematic evaluation that comprehensively compares these techniques. Existing reviews are often constrained by limited scope, minimal comparative synthesis, and insufficient focus on real-time performance and multivariate analysis. Consequently, this systematic literature review (SLR) analyzes 36 peer-reviewed studies published between 2020 and 2025, sourced from eight reputable databases. Unlike prior reviews, this work presents a novel four-dimensional framework covering real-time capability, multivariate support, analysis domain, and detections methods. Moreover, detection techniques are further classified into three categories: distance-based, predictive, and image-processing. Findings reveal that image-processing methods are the most frequently applied (22 studies), providing high detection accuracy but facing scalability challenges due to computational intensity. Predictive models offer a trade-off between interpretability and performance, whereas distance-based methods remain less common due to their sensitivity to dimensionality and environmental factors. Notably, only 11 studies support real-time anomaly detection, and multivariate analysis is often overlooked. Moreover, time-domain signal processing dominates the field, while frequency and time-frequency domain methods remain rare despite their potential. Finally, this review highlights key challenges such as scalability, interpretability, robustness, and practicality of current models. Further research should focus on developing adaptive and interpretable anomaly detection frameworks that are efficient enough for real-world SHM deployment. These models should combine hybrid strategies, handle uncertainty, and follow standardized evaluation protocols across varied monitoring environments.
Keywords:
data anomaly
; detection
; real-time
; domain analysis
; multivariate
1. Introduction
Bridges form the backbone of transportation networks by providing connectivity across natural and man-made obstacles such as rivers, valleys, and roads. Therefore, they play an important role in economic progress through enhanced mobility [1]. However, they experience wear and tear over time due to environmental factors and aging materials, which gradually weaken their structure [2]. To mitigate these wear and tear risks, a structural health monitoring (SHM) process is implemented to detect early signs of damage. This proactive approach through SHM process enhances safety, reduces risks, and extends the lifespan of bridges [3].
A typical SHM process is illustrated in Figure 1. The process begins with the excitation phase, where external forces are applied to the bridge structure [4]. Following excitation, sensors record critical performance parameters (such as strain, displacement, and environmental conditions) during the data acquisition stage [5]. The acquired data is then normalized to eliminate distortions and ensure consistency [6]. In the anomaly detection phase, the data is examined for irregularities that may indicate faults. Such anomalies can result from sensor malfunctions, environmental noise, transmission errors, or human mistakes [7]. If anomalies are detected, a data correction step is applied to remove or mitigate errors. Once the data is refined, it undergoes processing to extract meaningful insights [8,9]. These insights support informed decision-making regarding the bridge’s condition. Finally, maintenance actions are implemented based on the analysis to enhance structural safety and ensure timely intervention.
As illustrated in Figure 1, timely data correction in the SHM process is essential for accurate assessment. If errors are not rectified before the data processing phase, evaluations may become unreliable. Therefore, detecting abnormal data helps in preventing unnecessary maintenance actions. By identifying such anomalies, engineers can distinguish genuine structural issues from faulty sensor readings [10,11]. Consequently, robust techniques/methods for detecting abnormal data are used to improve the reliability of the SHM process. These techniques can be broadly categorized into three main types: distance-based methods, predictive models, and image processing approaches. It is important to note that statistical methods are not considered as a separate category, since many techniques (such as regression and Bayesian analysis) are integrated within predictive modeling frameworks. Moreover, statistical features often serve as inputs for image processing or hybrid models rather than being standalone tools [7].
The basic concept of distance-based abnormal methods is that if a data object is an anomaly, it should be distant from most other data objects. If the distance between data points exceeds a set threshold, the point is considered as an be the abnormal data point [12]. Predictive models predict expected data values. The predictions are based on historical trends. The objective is to identify abnormalities based on deviations from predicted results [13,14,15]. Image processing methods [16] such as deep learning models can be trained to recognize abnormal patterns by transforming SHM time-series data into visual representations. Although effective, this approach risks losing information and introduces complexity into anomaly detection frameworks.
The performance of aforementioned abnormal data detection methods depends on several key factors such as real-time capability [13], analysis domain [12], and multivariate analysis [17]. Real-time capability enables the detection of anomalies as they occur, allowing for prompt corrective actions and preventing major failures. Similarly, analysis domain approaches (time, frequency, or time-frequency techniques) help uncover meaningful patterns in monitoring data. Multivariate analysis further enhances detection performance by integrating data from multiple sensors, revealing complex correlations that single-variable methods may overlook. Together, these factors significantly improve monitoring reliability and contribute to long-term bridge safety.
1.1. Motivation for a Systematic Literature Review
A systematic review of anomaly detection methods is essential to consolidate growing research. It helps to assess existing methods by highlighting their strengths, limitations, and suitability across different contexts [18]. Moreover, an SLR may examine how factors such as real-time capability, analysis domain investigations, and multivariate analysis influence reliability and efficiency. Ultimately, conducting an SLR helps in the improvement of anomaly detection accuracy. It will enhance long-term bridge safety through well-informed, data-driven decisions.
1.2. Existing Literature Reviews on the Abnormal Data Detection in SHM of Bridges
Table 1 provides a summary of existing reviews on abnormal data detection in the SHM process for bridges, highlighting their key contributions and limitations. Early studies [19] focus on outlier detection but lack integration with AI techniques and validation frameworks. On the other hand, deep learning-based reviews [11] examine training strategies but overlook hybrid models and real-time deployment challenges. Similarly, data quality-oriented works [20] propose structured frameworks but do not incorporate AI-based enhancements or uncertainty modeling. Taxonomy-driven reviews [7] fail to address hybrid approaches and AI-enabled methodologies. More recent contributions [18,21] investigate AI-based bridge monitoring and maintenance but fall short in addressing multi-sensor data fusion, scalability, and real-time implementation aspects. In summary, while existing review articles offer fragmented insights across various domains, there is a distinct absence of a unified, comparative evaluation of anomaly detection methods specifically tailored for SHM in bridges.
1.3. Contributions
The limitations of state-of-the-art review articles, highlighted in Table 1, have been rectified by performing this SLR. The main contributions are:
- Multi-Dimensional Evaluation Framework: Proposes a four-dimensional classification system addressing real-time capability, multivariate support, analysis domains, and detection approaches
- Taxonomy for Anomaly Detection: Proposes a clear three-category classification (distance based, predictive, and image processing) to enhance comparison of anomaly detection methods.
- Identification of Underexplored Areas: Highlights that real-time capability and multivariate analysis are supported by only a small subset of studies, while frequency and time-frequency domains remain largely overlooked.
- Challenges and Future Directions: Highlights challenges (such as scalability and weak multi-modal sensor use) and suggests future directions (such as adaptive hybrids lightweight models, domain adaptation, and standardized evaluations).
The following research questions (RQs) have been formulated to guide a structured investigation into existing methodologies.
- RQ1: How frequently are different abnormal data detection techniques used in SHM studies, and which method dominates current research?
- RQ2: How do various abnormal data detection methods perform in terms of real-time capability, analysis domain, and multivariate analysis?
- RQ3: How do different abnormal data detection methods perform in terms of accuracy, computational efficiency and fault types across different bridge structures?
- RQ4: What are the key challenges in abnormal data detection, and how can emerging advancements improve detection accuracy in future research?
1.4. Overview of the Systematic Literature Review Approach
To address the constructed research questions (Q1–Q4), the overall layout of this SLR is illustrated in Figure 2. A total of 36 relevant studies were systematically selected. These came from eight reputable scientific databases: IEEE, Springer, Elsevier, SAGE, MDPI, Wiley, Tech Science Press, and Techno-Press. The selection was guided by well-defined inclusion and exclusion criteria. The detailed selection protocol is described in Section 2. The selected studies are categorized using four key dimensions. These include real-time capability, analysis domain, multivariate support, and anomaly detection methods, as detailed in Section 3. Section 4 presents a detailed performance evaluation of detection techniques. Section 5 highlights key challenges and directions for future research. Research question responses, along with noted limitations, are summarized in Section 6. The article is concluded in Section 7.
2. Research Methodology
To address the research questions outlined in the introduction, the SLR was conducted in accordance with the guidelines provided by [22]. The review process involved defining key categories and developing a structured protocol for selecting relevant research articles. Section 2.1 presents the foundational background for these categories, while Section 2.2 outlines the detailed steps of the review protocol.
2.1. Categories Definition
Various anomaly detection methods are employed in SHM systems. Figure 3 presents a hierarchical taxonomy of these methods, categorized into distance-based, predictive, and image processing approaches, along with their subtypes [23]. Each category offers unique strengths in identifying abnormal data. While selecting an appropriate detection method is important, other factors also influence performance in SHM applications. These include real-time processing capability, the analysis domain (time, frequency, or time-frequency), and the ability to handle multivariate sensor data. The following sections explore each category in detail.
2.1.1. Abnormal Data Detection Methods
This section provides a brief overview of abnormal data detection methods, highlighting their core principles, strengths, and limitations within the SHM context.
Distance-Based Method
Distance-based methods identify anomalies by measuring the proximity between data points in a feature space [24]. Outliers are those that deviate significantly from the majority. The main idea is that normal data points are close together, while anomalies are farther away from them. A sample is flagged as abnormal if its distance to nearby points exceeds a predefined threshold. These methods are simple and interpretable but vary in scalability, sensitivity, and effectiveness across datasets. They are typically categorized into k-nearest neighbors (KNN)-based approaches [25], which rely on neighborhood density, and threshold-based methods [26], which compare data against fixed limits.
Predictive Methods
Predictive methods are data-driven approaches that use historical and real-time measurements to estimate expected structural behavior [15]. They work by learning temporal patterns or statistical relationships within the data to generate forecasts, which are then compared to actual sensor readings. Significant discrepancies between predicted and observed values indicate potential anomalies [27]. Common predictive techniques in SHM include multivariate linear regression [28], Bayesian networks [13,17], and Long Short-Term Memory (LSTM) neural networks [29]. Regression models capture trends, Bayesian inference provides a probabilistic framework for managing uncertainty, and neural networks uncover complex relationships. Predictive methods often require large volumes of high-quality training data, are sensitive to noise, and may perform poorly under non-stationary conditions or sudden structural changes. Additionally, setting appropriate thresholds for anomaly detection can be difficult.
Image Processing Methods
These methods detect anomalies by transforming sensor data into visual formats [30]. Typically, time-series or multivariate signals are converted into image-based representations [31,32,33], which are then analyzed using deep learning models, particularly Convolutional Neural Networks (CNNs). Image-based approaches are generally categorized into two types: two-dimensional (2D) inputs, such as signal plots or spectrograms, and other formats like structured feature maps or encoded attributes. These methods offer key advantages, including the ability to capture complex spatial-temporal patterns, enhance recognition accuracy, and using established computer vision models. This makes them effective for detecting subtle or evolving structural changes. However, challenges include potential loss of signal fidelity during transformation, sensitivity to visual noise, and high computational demands during both preprocessing and inference.
2.1.2. Real-Time Capability
Real-time capability refers to a system’s ability to process and analyze sensor data instantly or with minimal delay, enabling immediate detection of anomalies. This is typically achieved through high-frequency data acquisition combined with fast processing algorithms, often deployed on edge devices or lightweight embedded systems. The main advantage of real-time processing is its support for timely decision-making, which is critical in scenarios such as earthquakes, overloads, or material fatigue. However, these systems face challenges, including limited computational resources, especially when using complex models like deep neural networks or image-based methods.
2.1.3. Domain Analysis
Domain analysis involves examining signal characteristics across different transform domains to uncover structural behaviors or anomalies. The three primary domains are time, frequency, and time-frequency. Each domain offers unique insights: for instance, time-domain analysis captures raw signal trends, while frequency-domain techniques can reveal hidden patterns such as resonance shifts or periodic disturbances. Time-frequency methods provide a localized view of how signal characteristics evolve over time and frequency simultaneously. Damage-related features may be more prominent in specific domains depending on the nature of the anomaly. Therefore, selecting the appropriate domain is critical for enhancing detection accuracy and interpretability in SHM applications.
2.1.4. Multivariate Analysis
It involves examining multiple sensor measurements simultaneously to detect complex inter-dependencies and uncover patterns that may indicate structural anomalies. It works on the principle that damage or deterioration often affects several parameters concurrently (such as strain, acceleration, and temperature) and analyzing them collectively can reveal insights not visible in individual signals. The key advantages of multivariate analysis include improved anomaly detection accuracy, enhanced noise resilience, and the ability to model interactions between variables over time. However, this approach can face limitations such as increased computational complexity, sensitivity to correlated noise, and challenges in interpreting high-dimensional results. It also requires well-calibrated sensor networks and synchronized data collection to ensure reliability.
2.2. Review Protocol Development
Based on predefined SLR guidelines [22], we developed a review protocol outlining the inclusion/exclusion criteria, search strategy, quality assessment, and data synthesis. Details are provided in the following sections.
2.2.1. Selection and Rejection Criterion
A concrete set of criteria was established to guide the selection and exclusion of studies. Only those works that met these standards were included in the review
- Subject Relevance: Research must be directly relevant to the context of this study and contribute to answering the formulated research questions.
- Publication Date (2020–2025): Only research published between 2020 and 2025 is included. Studies published before 2020 are excluded.
- Publisher: Selected research work must be published in one of the eight renowned scientific databases, i.e., IEEE, Springer, Elsevier, SAGE, MDPI, Wiley, Tech Science Press and Techno-Press
- Impactful Contributions: Selected research work must have crucial positive effects regarding the deployment of abnormal data detection process of SHM for bridges.
- Results-Oriented: Research must present well-supported outcomes backed by solid experimentation. Studies with weak or insufficient validation were excluded.
- Avoid Repetition: All the research in a particular research context cannot be included. Consequently, reject searches that are identical in the given research context, and only one of them is selected.
2.2.2. Search Process
The target databases used in our search are listed in Table 2. We applied different keyword combinations across each database. A time filter of “2020–2025” was used to ensure recency. The AND operator returned fewer, less relevant results. In contrast, the OR operator produced broader and more meaningful outcomes. However, it also generated a large volume of data. To manage this, we applied two additional filters: “content type = article” and “subject area = Engineering.”
Figure 4 illustrates the steps of the search process. We used various search terms across the target databases and retrieved approximately 6812 results. First, 4321 studies were excluded based on their titles. Then, 1469 were removed after reviewing their abstracts. A general review of the remaining 1022 articles was conducted to assess coherence and alignment with research questions RQ1–RQ7. This led to the exclusion of 442 articles. The remaining 580 were evaluated in detail. Based on this comprehensive review, 554 were filtered out. Finally, 36 articles were selected for inclusion.
2.2.3. Quality Assessment
To ensure the inclusion of high-quality and relevant studies, a set of rigorous criteria was applied during the selection process. First, only research articles that demonstrated thorough validation of their proposed methods (either through experimental evaluation, benchmarking, or real-world deployment) were considered. Additionally, each study was required to provide sufficient implementation details to allow for reproducibility and technical scrutiny. To preserve the originality and breadth of the review, the literature search was conducted across eight reputable scientific databases. These sources were chosen for their strong track record in publishing peer-reviewed research in SHM, anomaly detection, and applied artificial intelligence. Furthermore, to capture the most recent developments in abnormal data detection techniques, the review was limited to articles published between 2020 and 2025. This time frame ensures that the findings reflect current trends, emerging technologies, and evolving challenges in SHM. The distribution of selected studies by publication year is illustrated in Figure 5.
3. Classification Results
This section begins by classifying the selected studies according to the abnormal data detection methods, discussed in Section 3.1. It then explores three additional design parameters: real-time capability (Section 3.2), analysis domain (Section 3.3), and multivariate analysis capability (Section 3.4).
3.1. Abnormal Data Detection Methods
The introductory part of this article states that this SLR focuses on three primary categories of abnormal data detection methods: distance-based methods, predictive approaches (including Bayesian inference, regression analysis, and neural networks), and image processing techniques, as outlined in Section 2.1.1. Consequently, Table 3 displays the distribution of the selected studies across the predefined categories.
It can be observed from Table 3 that image processing methods are the most frequently adopted approach. These techniques have gained popularity due to their ability to extract complex features and support deep learning architectures. In contrast, distance-based methods are rarely used. Their limited application is likely due to scalability issues and reduced effectiveness in high-dimensional SHM data. Predictive approaches, however, represent a strong area of ongoing research. They combine statistical models such as regression and Bayesian inference with advanced machine learning techniques. This fusion enhances their adaptability and interpretability. As a result, predictive models offer a practical balance between detection performance and computational efficiency. A detailed comparative analysis of abnormal data detection techniques within each category is provided in Section 4. Nevertheless, the categorization in Table 3 sets the stage for the analytical comparisons that follow, enabling targeted insights into the strengths, limitations, and application contexts of each methodological class.
3.2. Integration of Real-Time Processing in Structural Health Monitoring Frameworks
As shown in Table 4, real-time processing remains underutilized in SHM systems for bridges, with only 11 out of the 36 reviewed studies incorporating this capability. For instance, Zhang et al. [13] proposed a Bayesian Dynamic Linear Model (BDLM) integrated with subspace detection techniques. Their approach supports adaptive dynamic thresholding and processes 600 data points in just 0.69 seconds, with each measurement validated in an average of 0.024 seconds. This demonstrates the feasibility of achieving both speed and accuracy in real-time anomaly detection. Similarly, Zhu et al. [40] developed an online performance assessment framework using Gaussian Process models. In two full-scale bridge case studies, their model achieved training times as low as 0.10 seconds, highlighting its suitability for continuous monitoring applications.
The limited adoption of real-time methods stems from both technical and operational challenges. Deep learning and image-based models often exceed the computational capacity of embedded or edge devices. Integrating real-time analytics into SHM systems also demands robust data pipelines, low-latency communication, and efficient resource management. Additionally, there is a trade-off between speed and accuracy as lightweight models offer faster inference but may miss subtle anomalies, while complex models improve accuracy at the cost of increased latency. Balancing these factors is essential for effective deployment.
In summary, while real-time processing holds significant potential for enhancing the responsiveness and reliability of SHM systems, its practical implementation is still in its early stages. Future research should focus on developing computationally efficient, scalable, and adaptive algorithms that can operate reliably under real-world constraints.
3.3. Analysis Domain Investigations
Table 5 summarizes the distribution of studies across different signal analysis domains employed in SHM systems. Fourier Transform (FT) is the most widely used in the frequency domain. FT decomposes time-varying signals into harmonic components, offering insights into amplitude, phase, and frequency content. In contrast, time-frequency approaches capture transient behaviors that occur across overlapping frequency bands [57]. Common techniques include Wavelet Transforms (WT), Wigner-Ville Distribution (WVD), Short-Time Fourier Transform (STFT), Pseudo-WVD (PWVD), Empirical Mode Decomposition (EMD), Ensemble EMD (EEMD), and the Hilbert-Huang Transform (HHT) [58,59].
As shown in Table 5, time domain analysis is the most frequently employed technique in SHM for bridges. It appears in 25 out of the 36 reviewed studies. For example, Zhang et al. [27] proposed an anomaly detection method that combines a convolutional neural network with statistical features. Their model uses time-domain indicators such as root mean square and kurtosis, alongside frequency-domain metrics like distance unit number and deviation mean difference, to detect abnormal data. Similarly, Deng et al. [42] investigated time-frequency characteristics using the Continuous Wavelet Transform (CWT). This approach converts SHM signals into two-dimensional images. Their method achieved high accuracy in identifying pseudo-normal data and showed strong generalization across different structural systems.
In summary, the categorization presented in Table 5 reveals a strong preference for time-domain analysis, reflecting its simplicity and effectiveness in detecting anomalies. While frequency-and time-frequency-based methods offer enhanced sensitivity to transient and spectral characteristics, their application remains comparatively limited. This suggests an opportunity for future studies to explore and integrate advanced domain analysis techniques, particularly time-frequency representations, to improve the detection accuracy and robustness of SHM systems across varied bridge conditions.
3.4. Multivariate Analysis Capability Investigations
As indicated in Table 6, the majority of the selected studies did not adopt multivariate analysis techniques, with only 8 out of 36 employing such methods. For instance, Xiang et al. [17] present an abnormal data detection framework that utilizes measurements from four sensors (comprising three cable forces and one deflection) based on their strong pairwise correlations. Bayesian estimation is employed to derive the probability density functions (PDFs) of specific trigger events. From these, a probabilistic metric known as the certainty degree is calculated to quantify uncertainty levels and assess the reliability of the detection process.
As summarized in Table 6, multivariate analysis approaches generally fall into three categories.
- Multivariate Time Series Models: Studies such as [17,25,34] employ multivariate time series models to analyze structural response data captured from multiple sensors over time. These methods are particularly effective in capturing temporal dependencies and cross-sensor correlations, which are critical for detecting subtle anomalies under dynamic structural conditions.
- Multivariate Feature-Based Learning via CNN: Studies including [35,37,50,53] utilize CNNs to process structured multivariate input features. These features typically consist of time-domain and frequency-domain indicators extracted from raw monitoring signals. The CNN architecture allows for joint learning across these input dimensions, enabling the model to detect a variety of abnormal patterns.
- Multivariate Machine Learning Approaches: The study by [56] presents a comprehensive machine learning-based framework that integrates multivariate analysis for anomaly detection. It processes diverse signal descriptors (such as strain, displacement, vibration, and environmental parameters ) from multiple sensor types. By applying classification models that capture inter-dependencies among these signals, the framework enhances detection accuracy and robustness. This approach is particularly effective under varying environmental and loading conditions, offering improved generalization while maintaining computational efficiency suitable for real-time SHM applications.
To summarize, the diversity of techniques, ranging from multivariate time series modeling and CNN-based feature learning to broader machine learning integration, reflects an evolving landscape. While only a minority of studies explicitly employ such strategies, the effectiveness of multivariate frameworks in capturing temporal patterns, cross-sensor dependencies, and contextual anomalies underscores their value. Future work should prioritize multivariate methodologies to unlock deeper insights from SHM data and support more adaptive, scalable, and intelligent monitoring systems.
4. Comparative Analysis of Abnormal Data Detection Methods
Section 3 presents a classification of the selected research studies based on abnormal data detection methods, real-time capabilities, analysis domains, and multivariate analysis support. However, a detailed comparative evaluation of abnormal data detection approaches is one of the core objectives of this SLR. Accordingly, this section provides a comprehensive analytical comparison of these methods across several performance dimensions. Comparative insights are presented for all detection categories defined in Section 2.1.1. Specifically, Section 4.1 examines studies utilizing distance-based techniques, while Section 4.2 evaluates predictive approaches, including Bayesian, regression, and neural network-based models. Lastly, Section 4.3 focuses on image-processing methods. It is also important to note that three studies incorporate statistical techniques in conjunction with either image-processing or predictive frameworks. These studies are analyzed within their corresponding categories.
The evaluation metrics used to assess the performance of abnormal data detection methods include Accuracy, Precision, Recall, and the F1-score, as defined in Equations (1) to (4), respectively. In binary classification tasks, model effectiveness is characterized by four key outcomes: true positives (TP), true negatives (TN), false positives (FP), and false negatives (FN). These quantities serve as the foundation for several widely used performance metrics. Accuracy, defined in Equation (1), measures the overall proportion of correctly predicted instances. Precision, shown in Equation (2), quantifies the ratio of correctly predicted positive observations to the total predicted positives. Recall, presented in Equation (3), captures the ability of the model to correctly identify actual positive cases. Lastly, the F1-score, defined in Equation (4), represents the harmonic mean of Precision and Recall. It is particularly valuable in scenarios involving class imbalance, offering a balanced evaluation of both false positives and false negatives.
4.1. Distance-Based Methods
Table 7 presents a summary of selected research studies that employed distance-based methods. One study focused on a cable-stayed bridge using acceleration data, while another used diverse sensor inputs (such as temperature, deflection, and strain) on a general bridge. The targeted anomalies included low-quality data and statistical outliers. Detection techniques varied: one applied the Minimum Covariance Determinant (a threshold technique) for robust multivariate outlier detection, while the other used KNN to identify dissimilar temporal patterns.
In summary, distance-based methods provide a simple and intuitive approach to abnormal data detection in SHM by leveraging spatial relationships among data points. They are effective when anomalies are clearly separated from normal patterns but can be limited by high dimensionality, computational cost, and sensitivity to parameter selection, such as distance metrics and thresholds. Despite these challenges, they remain valuable for initial anomaly screening or as part of hybrid systems, especially when interpretability and low training requirements are important. The reviewed studies demonstrate their practical use in bridge monitoring while emphasizing the need for more adaptive and scalable solutions for complex SHM datasets.
4.2. Predictive Methods
Within this category, 12 studies were selected and classified into three subgroups: Bayesian methods (2 studies), regression-based methods (2 studies), and neural network-based methods (8 studies). These classifications reflect the range of modeling strategies adopted for predictive anomaly detection in SHM applications.
4.2.1. Bayesian Methods
Bayesian estimation models incorporate prior knowledge or assumptions, expressed as probability distributions, to estimate parameters. As new observations are collected, these distributions are updated accordingly. Bayesian approaches consider parameters as random variables that evolve with incoming data [60,61]. This allows the model to learn and adapt continuously over time. Table 8 provides an overview of selected research studies that have employed Bayesian methods. It includes the bridge type, sensor modalities used, and the targeted anomaly types. Reported accuracy, where available, reflects detection performance. The final column outlines the specific Bayesian techniques employed, such as BDLM and PDF.
As shown in Table 8, Bayesian predictive methods can detect various anomalies, including spikes, baseline shifts, and sensor faults. Xiang et al. [17] have proposed a framework that defines an energy index over a time window to represent system behavior. They have used the Generalized Pareto Distribution to model detection probabilities. Bayesian estimation was then applied to derive probability density functions. A certainty degree index was introduced to quantify uncertainty and assess reliability. Similarly, Kim et al. [13] have used BDLM with subspace detection techniques. Their method has analyzed acceleration and strain data from a long-span cable-stayed bridge. It has successfully identified spikes and baseline shifts, achieving 98.96% accuracy. This highlights its potential for early fault detection and high-precision SHM.
In conclusion, Bayesian methods are effective in identifying various types of abnormal data in SHM. They are capable of detecting spikes, baseline shifts, and sensor faults. These methods use probabilistic reasoning to handle uncertainty. Unlike fixed-parameter models, they update their beliefs as new data arrives. This adaptability enhances robustness in dynamic environments. However, their performance depends on accurate prior distributions and sufficient data. Despite this, Bayesian approaches offer powerful tools for modeling and interpreting uncertainty in bridge monitoring systems.
4.2.2. Regression Methods
These models are used to quantify the relationship between one or more input variables and an output variable, and are commonly applied in prediction or inference tasks. Regression models can be broadly categorized into two types. The first includes general-purpose models, such as linear regression, Gaussian process regression, and support vector regression, which are primarily used to model static relationships between variables [62]. The second category comprises time series-based models, including Moving Average (MA), Auto regressive (AR), and Auto regressive Integrated Moving Average (ARIMA). These methods are designed to handle time-dependent data, capturing evolving patterns and accounting for random variation. Time series models are particularly useful for sequential datasets but are more complex, as they must accommodate changing conditions and dynamic system behavior [28].
Table 9 summarizes studies that employ regression-based methods for anomaly detection in bridge SHM systems. The "Bridge Configuration" column highlights the structural context, including an oblique arch bridge and a long-span cable-stayed bridge, demonstrating the adaptability of regression models across different bridge types. The "Sensor Data Type" column indicates the nature of the input data, such as strain and stress measurements, which are commonly used to monitor structural integrity. The "Anomaly Type" column identifies the specific irregularities targeted in each study (outliers in one case and noise in another) reflecting the models’ ability to handle different forms of abnormal data. The final column outlines the regression techniques used. For example, Zhu et al. [40] proposed a representative data selection strategy for online performance assessment. Their approach uses Gaussian Process models to enhance prediction accuracy and reduce computational load. It is designed for streaming bridge monitoring data, supporting real-time applications. The study also introduces a performance warning index to evaluate bridge conditions and detect anomalies. The method operates within a probabilistic framework, capturing uncertainty in the monitoring data.
Compared to other predictive approaches, regression models offer better interpretability than neural networks and more flexibility than Bayesian methods when ample data is available. While Bayesian models excel at uncertainty quantification and neural networks handle complex patterns, regression strikes a balance between simplicity, scalability, and performance. This makes it especially valuable when transparency and computational efficiency are critical in SHM systems.
4.2.3. Neural Network Methods
Neural networks have shown strong performance in tasks like object detection, classification, and segmentation. This success has led to their growing use in data analysis, forecasting, and anomaly detection. In SHM, they are effective at predicting structural responses and improving accuracy [63]. These models learn patterns directly from data without needing explicit equations. They capture complex nonlinear relationships that traditional models often miss. However, they lack interpretability, making it hard to trace how inputs affect outputs. Their architectures can also be complex. As layers increase, so do parameters and computational costs. Training becomes more time-consuming and resource-intensive.
Table 10 provides a comprehensive summary of studies that apply neural network-based methods for anomaly detection in bridge SHM systems. The "Ref." column lists the cited studies, each representing a unique application of neural networks in real-world monitoring scenarios. The "Bridge Type" column shows the diversity of structural configurations, including long-span cable-stayed bridges, suspension bridges, and twin-box girder bridges, indicating the broad applicability of these methods. The "Input Data" column highlights the sensor modalities used, such as acceleration, GPS, and cable tension data, which are essential for capturing structural behavior. The "Fault Type" column outlines the range of anomalies detected, including missing data, outliers, drift, trend shifts, and abnormal patterns. This demonstrates the versatility of neural networks in identifying both subtle and severe deviations. The next four columns ("Precision," "Recall," "F1 Score," and "Accuracy") report performance metrics used to evaluate detection effectiveness. Most studies have achieved high precision and recall, often exceeding 90%, with F1 scores and accuracy values indicating strong overall performance. Some entries use threshold indicators (e.g., “>95”) to reflect consistently high results across multiple test cases.
In summary, the reviewed studies demonstrate that neural networks can detect a wide range of fault types with high precision and accuracy. This includes minor errors, missing signals, trends, and drift patterns. Although the models differ in input sources and bridge types, most achieve high recall and F1 scores, indicating reliable and balanced performance. Despite challenges such as limited interpretability and high computational demand, neural networks remain effective and versatile tools for detecting abnormal patterns in SHM applications.
Summary of Predictive Models: Each predictive method has strengths and limitations. Bayesian models adapt over time and handle uncertainty well but depend on accurate priors. Regression models are interpretable and efficient, making them suitable for transparent applications. Neural networks offer high accuracy and handle complex patterns but are harder to interpret and require more computation. Together, they provide a diverse set of tools for building reliable and intelligent SHM systems.
4.3. Image Processing Methods
Image processing is a key part of artificial intelligence. It simulates human vision to perform tasks like segmentation, classification, recognition, tracking, and decision-making. In civil engineering, it is used to measure crack widths, locate structural elements, and assess earthquake damage. Recently, it has been applied in SHM. Instead of using raw sensor data, the data is converted into images. These images are then used to train models to detect anomalies [64,65]. This approach mimics how humans visually detect changes in their environment. In this category of image processing methods, 22 research studies were reviewed. Of these, 13 utilized 2D image inputs, while the remaining 9 employed alternative visual representations.
In the following, we present two major categories of image-processing-based anomaly detection methods in SHM: those that rely on two-dimensional (2D) image inputs and those that utilize alternative input formats. Each category is evaluated in terms of data transformation techniques, model performance, and practical applicability across different bridge types and fault scenarios.
4.3.1. Two-dimensional Image Input Classes
This category of methods converts one-dimensional (1D) time series monitoring data into 2D image representations. These images are then analyzed using deep learning techniques to detect anomalies. Transforming the data into 2D form enhances the ability to capture both spatial features and temporal patterns. Deep learning models (particularly CNNs) have demonstrated strong performance in image classification tasks. When monitoring data is visualized, these models can effectively employ their pattern recognition capabilities to identify abnormal behavior. Moreover, image-based data augmentation techniques, such as rotation, scaling, and translation, can be applied to the generated images. These augmentations increase the diversity and volume of training samples, and therefore, improving the robustness and accuracy of the models in detecting anomalies [66,67].
Table 11 provides a summary of recent studies that utilize 2D image-based methods for anomaly detection in structural health monitoring. Each entry includes the type of bridge, the type of sensor data used, the category of detected anomalies, and the key performance evaluation metrics. The “Bridge” column identifies the structural form (e.g., cable-stayed, railway, general), while the “Sensor” column refers to the source of input data, such as acceleration or multi-sensor combinations. The “Anomaly Type” column lists the specific forms of data irregularity, such as missing values, outliers, trends, drift, frequency-domain confusion (FDC), and time-frequency confusion (TFC).
The performance metrics are abbreviated as follows: Precision (Prec.) measures the ratio of correct anomaly predictions to total predicted anomalies; Recall (Rec.) indicates the proportion of actual anomalies correctly identified; F1 is the harmonic mean of precision and recall; and Accuracy (Acc.) reflects the overall correctness of the model. As the table shows, most models achieved high accuracy (often exceeding 95%), and several studies reported strong recall and F1 scores, indicating reliable detection capabilities across a wide range of fault categories and bridge types.
As shown in Table 11, 2D image processing methods can be used to detect various types of faulty data. These include missing values, minor deviations, outliers, square waveforms, trends, drifts, spikes, time-frequency TFC, and FDC. The performance evaluation of the selected studies confirms the reliability of 2D image input methods for detecting abnormal data. These methods achieve precision, recall, F1 score, and accuracy of more than 78%, 73%, 0.76, and 93%, respectively.
Different mechanisms have been implemented in these studies to convert monitoring data into 2D images. These include the Fast Fourier Transform (FFT), Continuous Wavelet Transform (CWT), Gramian Angular Field (GAF), and grayscale image conversion. For instance, Wang et al. [55] proposed a novel anomaly detection method based on cross-bridge knowledge transfer. Unlike traditional approaches that require access to both source and target datasets for model adaptation, this technique employs source-free domain adaptation. It reduces the need for local data storage on edge devices. This not only saves storage resources but also addresses the challenge of limited labeled data, which is common in supervised learning. Additionally, the method eliminates the dependency on pre-stored source data, making it well-suited for edge computing environments.
To summarize, 2D image input methods offer a reliable approach for anomaly detection in SHM. They convert time series data into images, allowing deep learning models to capture spatial and temporal features. This improves detection accuracy over traditional techniques. Studies show strong performance across bridge types and fault categories. Domain adaptation and data augmentation further enhance model robustness. These methods are also scalable and suitable for real-time, edge-based SHM systems.
While 2D image-based input techniques are effective for anomaly detection, they come with notable limitations. Converting 1D time-series data into 2D images can lead to information loss, especially for continuous signals where subtle patterns may be obscured. The transformation process may also introduce noise due to quantization errors. Additionally, image representations increase computational complexity, requiring more advanced models and longer training times. Finally, the nonlinear conversion reduces interpretability, making it harder to trace how original signals relate to detected anomalies.
4.3.2. Other Forms of Input Classes
To address the limitations of 2D image input classes, alternative input formats have been employed. Table 12 provides an overview of these studies. The second column lists the type of bridge used to evaluate the proposed methods. The third column details the type of input data analyzed. The fourth column identifies the types of anomalies targeted by each model. The final column summarizes the performance of each method in detecting abnormal data.
As shown in Table 12, image processing methods based on other forms of input classes can effectively detect various types of faulty data. These include missing values, minor deviations, outliers, square waveforms, trends, drifts, and spikes. The performance evaluations from the selected studies demonstrate the reliability of these methods for anomaly detection. Reported results indicate that precision, recall, F1 score, and accuracy exceed 88%, 81%, 0.84, and 94%, respectively. For example, Zhang et al. [45] proposed an anomaly detection approach that combines image processing techniques with nonparametric statistical methods. Histogram-based binned values were used to construct feature vectors representing the acceleration monitoring data. A trained random forest classifier was then applied to identify abnormal instances. This integrated approach enhances detection accuracy by leveraging histogram-derived features. Additionally, extracting relevant statistical features directly from time-series data also supports the identification of abnormal patterns.
In conclusion, methods based on alternative input classes offer an effective solution for anomaly detection in SHM. They overcome key limitations of 2D image-based approaches by preserving signal features and maintaining a direct link to the original time-series data. The reviewed studies show strong performance across different bridge types and sensor inputs. Most models achieve high accuracy, with consistent precision, recall, and F1 scores. Combining statistical feature extraction with classification improves interpretability. These methods are also computationally efficient and suitable for real-time monitoring. Overall, input-class-based techniques provide a reliable and scalable approach for fault detection in civil infrastructure.
5. Challenges and Future Research Directions
Despite notable progress in abnormal data detection methods within SHM of bridges, there are several important issues that are required to be resolved. Examples of these issues include several domains. These include but not limited to computational, methodological, and application-driven domains. Consequently, this opens up many opportunities for future research.
5.1. Challenges
The challenges in abnormal data detection in the bridge SHM process are related to the scalability, interpretability, robustness, and practicality of current models when deployed in dynamic environments with uncertain and noisy data.
- Computational Complexity and Real-Time Limitations: Deep learning-based image processing techniques have shown excellent accuracy in detecting difficult and complex anomalies in SHM systems [27,33,53,55,56]. These methods often use large neural networks such as CNNs, which require a lot of computing power. As a result, running these models on low-power devices like edge systems or embedded hardware becomes very challenging. This limits their use in real-time applications, where fast responses are necessary to prevent serious damage or failure. Studies like [13,40] have tried to reduce this delay by using faster algorithms, but the trade-off between speed and detection accuracy remains a major issue. Therefore, designing lightweight models that can work efficiently on limited hardware without sacrificing performance is still a big challenge.
- Lack of Interpretability: Neural networks are used to detect complex patterns in SHM data [14,27]. However, they usually work like “black boxes," meaning it is difficult to understand how the model reaches its decisions. For example, when a neural network detects an anomaly, engineers may not know which features in the input data caused this result or why. This lack of transparency makes it hard to trust the model in critical scenarios such as bridge safety, where understanding the reason behind an alert is very important. In SHM applications, engineers often need explanations to make informed decisions, especially during emergency assessments or maintenance planning. Therefore, the limited interpretability of neural networks remains a key drawback despite their high accuracy.
- Under-utilization of Multivariate and Domain Analysis: Many SHM studies rely on data from a single type of sensor, such as acceleration or strain. However, combining data from different types of sensors like temperature, displacement, and humidity can provide a more complete picture of a bridge’s condition. This approach is called multivariate sensor fusion. It helps in detecting complex patterns that may not be visible using just one type of data. Still, only a small number of studies have used this approach in their detection systems [17,53,56]. In addition, most studies analyze data only in the time domain. Time-domain methods are simple and fast, but they can miss important features that show up only when data is transformed into other forms. Frequency-domain and time-frequency-domain techniques, such as Fourier Transform or Wavelet Transform, can uncover hidden or subtle faults that are not obvious in raw signals. These methods are very useful, especially for detecting early or small-scale changes in structures. However, they are not widely applied in current research [42,54]. As a result, valuable insights may be lost, and some types of damage may go undetected.
- Class Imbalance and Fault Diversity: In many SHM studies, the datasets used for training and evaluation contain many examples of common faults, but very few examples of rare yet critical ones. This results in class imbalance, which makes it difficult for the model to learn how to detect rare faults accurately [27,43,45]. When the model is trained mostly on common faults, it tends to ignore or misclassify the rare types. This can reduce the reliability of SHM systems, particularly in emergency situations when early detection of rare issues is crucial. Furthermore, many models are only trained to detect specific fault types. They are not designed to handle other forms like sensor bias, drift, gain errors, or complex environmental interferences. This narrow focus limits their generalization ability when applied to different bridges or new conditions [15,26].
- Data Quality and Labeling Constraints: Training supervised learning models requires large amounts of labeled data. However, in SHM systems, especially for rare or unusual anomalies, labeled data is often very limited [32,44]. This makes it hard for the models to learn effectively and detect these uncommon but important faults. Another challenge is that labeling data by hand is time-consuming, costly, and can sometimes introduce errors. It also requires expert knowledge, which is not always available. As a result, many datasets remain partially labeled or entirely unlabeled. To solve this issue, more research is focusing on unsupervised and semi-supervised learning approaches. These methods can learn patterns from unlabeled data or from just a small number of labeled samples. This makes them more practical for SHM where getting labeled data is difficult or expensive [32,44].
In summary, SHM systems are evolving rapidly, supported by advancements in deep learning and signal processing. However, current techniques still face major technical and practical limitations. High computational requirements, lack of model interpretability, under-exploration of multivariate and domain-driven analysis, sensitivity to fault imbalance, and data labeling limitations all pose serious barriers to robust deployment. Addressing these challenges through more efficient, transparent, and adaptive approaches will be key to building future-ready, trustworthy SHM systems capable of supporting critical infrastructure safety.
5.2. Future Research Directions
The growing complexity of SHM systems and the increasing demand for real-time, accurate anomaly detection call for more advanced and flexible research strategies. The following future research directions highlight key opportunities to enhance the performance, scalability, and trustworthiness of SHM solutions across diverse bridge monitoring applications.
- Hybrid and Adaptive Frameworks: Current research shows that no single method is perfect for all types of data anomalies. Each technique—whether it is statistical, distance-based, predictive, or image-based—has its own strengths and limitations. For example, distance-based methods are simple and interpretable, but they struggle with large datasets. Image-based deep learning methods can detect complex patterns, but they need a lot of computing power and labeled data. A hybrid approach that combines these methods can help overcome their individual weaknesses. For instance, combining convolutional neural networks (CNNs) with statistical features can improve anomaly detection accuracy while keeping the model lightweight and interpretable [27,45]. Similarly, using domain adaptation techniques in image-based methods allows models to work well on new bridges or conditions without retraining from scratch [55]. Future SHM frameworks should be more adaptive and flexible. They should automatically choose or combine detection methods based on the type of data, available resources, and real-time requirements. This kind of adaptability will make anomaly detection more robust and more suitable for real-world bridge monitoring systems.
- Lightweight and Explainable Models: Many deep learning models used in SHM systems—like CNNs and LSTMs—require a lot of computing power. This makes them hard to use on embedded or low-power devices, which are often used in real-world bridge monitoring systems. To solve this, researchers are working on ways to make these models smaller and faster. Techniques like model pruning (removing unnecessary parts of the network) or quantization (reducing the number of bits used in the model) can help reduce the size and complexity [48,50]. Another important issue is that these models are not easy to interpret. Often, it is unclear why a neural network detects an anomaly or what part of the input triggered its decision. For safety-critical systems like bridges, engineers need to understand and trust the outputs. That’s why more research is needed to make neural networks explainable—so users can see how decisions are made and have more confidence in the system [48,50].
- Multimodal and Multivariate Fusion: In many SHM systems, only one type of sensor data—such as acceleration or strain—is used to detect anomalies. However, using multiple types of sensors at the same time (called multimodal fusion) can give a better understanding of the bridge’s condition. For example, combining acceleration, strain, temperature, and displacement data can help detect more complex or hidden issues that may not be visible with just one type of signal. Multivariate analysis techniques, like Principal Component Analysis (PCA) or Independent Component Analysis (ICA), can help process this large amount of sensor data. These methods reduce the size of the data and highlight the most important features, making it easier to find faults. Studies have shown that combining multivariate analysis with sensor fusion can improve the accuracy and reliability of anomaly detection [17,25]. Even though this approach has strong potential, it is still not widely used in current research. More work is needed to develop efficient algorithms and easy-to-use frameworks that support multimodal and multivariate data analysis in real-time SHM applications.
- Domain Adaptation and Transfer Learning: In many SHM projects, models are trained using data from a specific bridge or structure. However, when these models are applied to a different bridge or monitoring environment, their performance often drops. This is mainly because the new data may have different features, patterns, or noise levels, and the model has never seen this type of data before. Transfer learning helps solve this problem. It allows a model trained on one bridge (source domain) to be reused or adapted to another bridge (target domain) with little or no extra training. This saves time and reduces the need for large labeled datasets in every new deployment. Some recent studies have used this approach successfully [53,54,55]. Domain adaptation is another important method. It focuses on aligning the data distributions between the source and target domains. This way, the model can understand and work well on both types of data. Together, transfer learning and domain adaptation help make SHM systems more flexible and practical. They allow models to generalize better across different environments, making it easier to deploy AI solutions on new bridge monitoring systems without collecting and labeling huge amounts of new data.
- Robust Detection under Noise and Uncertainty: In real-world SHM systems, sensor data often contains noise or missing information due to weather, communication problems, or sensor faults. This makes it hard for models to correctly detect true anomalies. If a model is too sensitive, it may raise false alarms. If it is not sensitive enough, it may miss important faults. To handle this, future SHM systems should use probabilistic models that can deal with uncertainty in the data. For example, Bayesian models can estimate how confident the system is when it labels a data point as an anomaly [17]. They can also update their decisions as new data arrives, making them more flexible. Other approaches, like Gaussian process models, can provide not just predictions but also a measure of uncertainty in those predictions [40]. This helps engineers better understand whether a warning is strong evidence of failure or just a weak signal. Similarly, newer methods try to combine uncertainty estimation with deep learning models to improve reliability under noisy conditions [48]. Using these ideas, future frameworks can become more robust and trustworthy, even when the input data is incomplete or unreliable.
- Benchmark Datasets and Standardized Evaluation: One of the key challenges in SHM research is the lack of open and well-annotated datasets. Most studies rely on private datasets collected from specific bridges, which are not shared with the research community. This makes it hard to compare different methods fairly and slows down progress in the field. Publicly available datasets that cover various bridge types, fault categories, and environmental conditions would allow researchers to develop, test, and improve their methods on common ground [45]. In addition to datasets, there is also a need for standardized evaluation metrics. Right now, different studies use different ways to measure accuracy, precision, recall, and other performance indicators. This makes it difficult to judge which method is actually better or more reliable. For example, some works report only accuracy, while others use more detailed metrics like F1-score or processing time [34]. Having a common set of benchmarks and evaluation criteria would help the community perform consistent comparisons and drive progress toward more dependable SHM systems.
In conclusion, advancing SHM research requires a multi-faceted approach that combines the strengths of various detection strategies. Future systems should not only be accurate but also adaptable, explainable, and lightweight enough for real-world deployment. Emphasizing hybrid frameworks, improved uncertainty handling, transferable models, and standardized evaluation protocols will be essential to meet these goals. Together, these research directions will pave the way for smarter, safer, and more resilient bridge health monitoring systems.
6. Answers to Formulated Research Questions and Limitations of the Research
This section presents the findings of the SLR by addressing the four research questions that guided the study. Each question explores a critical dimension of abnormal data detection in SHM, including method prevalence, real-time capability, performance across bridge types, and key challenges. The answers are supported by evidence from the 36 selected studies and corresponding summary tables. Following this, the section outlines the methodological limitations of the review process, offering transparency and identifying areas for future refinement.
6.1. Answers to Formulated Research Questions
Research question 1: How frequently are different abnormal data detection techniques used in SHM studies, and which method dominates current research?
Answer: Among the 36 reviewed studies, image processing methods are the most prevalent in abnormal data detection for SHM systems in bridges. As shown in Table 3, 22 studies utilized image-based approaches, particularly those involving deep learning and two-dimensional visual transformations. Predictive methods were applied in 12 studies, while distance-based methods were used in only 2 studies.
Research question 2: How do various abnormal data detection methods perform in terms of real-time capability, analysis domain, and multivariate analysis?
Answer: As shown in Table 4, only 11 out of 36 studies implemented real-time anomaly detection. Although image processing methods generally achieve higher accuracy, their computational complexity often limits their suitability for real-time applications. > > Similarly, Table 5 indicates that the time domain was the most commonly used (25 studies), followed by the frequency domain (14 studies) and the time-frequency domain (5 studies). Time-frequency transforms, such as wavelets, improved signal interpretability but introduced additional computational overhead. Finally, as shown in Table 6, only 8 of the reviewed studies employed multivariate sensor fusion techniques. This under-utilization highlights a significant limitation, given the complex inter-dependencies present in real-world SHM scenarios.
Research question 3: How do different abnormal data detection methods perform in terms of accuracy, computational efficiency and fault types across different bridge structures?
Answer: Image processing methods, as detailed in Table 11 and Table 12, demonstrated high accuracy (often exceeding 95%) and effectively detected a wide range of fault types, including drift, missing values, trends, and noise. However, these methods face practical limitations due to their computational demands and potential information loss during transformation. Predictive models, summarized in Table 8, Table 9 and Table 10, offered a balanced trade-off between interpretability and performance. For example, Bayesian models achieved an accuracy of 98.96% (Table 8), while LSTM-based neural networks showed strong precision and recall, particularly in detecting drift and outliers (Table 10). In contrast, distance-based methods (Table 7) were computationally simple but exhibited limited generalization. They were primarily effective for detecting clear outliers and less suitable for complex or subtle anomalies.
Research question 4: What are the key challenges in abnormal data detection, and how can emerging advancements improve detection accuracy in future research?
Answer: The key challenges identified in Section 5 of the article include computational complexity, the need for high-performance models, lack of interpretability, under-utilization of sensor fusion and frequency-domain analysis, and issues related to imbalanced or poorly labeled data. To address these limitations, the article recommends the development of hybrid frameworks that combine multiple detection paradigms, the adoption of lightweight and explainable models suitable for embedded deployment, and the expansion of transfer learning and domain adaptation techniques to improve cross-bridge generalization. Additionally, it emphasizes the need to create public benchmark datasets that include diverse fault types and standardized evaluation protocols.
6.2. Limitations of Research
While this systematic review was conducted using a rigorous and well-defined methodology, several limitations inherent to the research process warrant consideration.
- Search Process: We utilized defined search terms across selected databases and applied systematic filtering. Nevertheless, thousands of results made exhaustive screening infeasible. Additionally, article exclusion based solely on titles may have omitted relevant studies with non-explicit titles.
-
Databases Selection: While our study considered eight highly regarded databases (IEEE, Springer, Elsevier, SAGE, MDPI, Wiley, Tech Science Press, Techno-Press), we acknowledge the possibility of overlooking pertinent work indexed elsewhere. Nonetheless, due to the breadth and prestige of the selected repositories, we believe the findings of this SLR remain representative and impactful.Despite these limitations, the selected corpus of studies offers a comprehensive and credible foundation for evaluating abnormal data detection in SHM systems. Acknowledging these constraints also highlights valuable opportunities for further meta-analytical exploration and deeper cross-database synthesis in future research
7. Conclusions
Ensuring the safety and longevity of bridge infrastructures hinges critically on the reliability of Structural Health Monitoring (SHM) systems. This systematic literature review (SLR) consolidates current advancements and research trends in abnormal data detection—a vital phase within SHM frameworks—by analyzing 36 peer-reviewed articles published between 2020 and 2025 across eight major scientific databases. The study categorizes existing detection methods into three primary types: distance-based techniques, predictive models, and image processing approaches. Among them, image processing methods, particularly those leveraging deep learning, have emerged as the dominant trend due to their exceptional accuracy in capturing complex data anomalies. Predictive models offer a balance between interpretability and performance, while distance-based methods, though simple, suffer from limited scalability. Despite these advancements, the review identifies critical research gaps. Notably, real-time detection capabilities and multivariate analysis remain significantly underutilized—only 11 and 8 studies respectively addressed these dimensions. Furthermore, domain-specific analysis (frequency or time-frequency), though beneficial for nuanced fault detection, is rarely applied beyond the time domain. This review highlights pressing challenges such as limited interpretability of deep models, computational burdens restricting real-time applications, class imbalance in fault types, and the scarcity of well-labeled data. To address these, future research must focus on developing hybrid and adaptive detection frameworks, promoting lightweight and explainable AI models, leveraging sensor fusion with advanced domain analysis, and advancing transfer learning techniques for cross-bridge adaptability. Additionally, establishing benchmark datasets and standardized evaluation protocols will enable more consistent and comparable assessments across studies. By offering a detailed synthesis of current methodologies, performance trade-offs, and future research directions, this SLR equips researchers and practitioners with actionable insights to enhance the accuracy, reliability, and practicality of abnormal data detection systems in bridge monitoring applications.
Author Contributions
Conceptualization, O.S.S. and M.R.; investigation, O.S.S.; writing—original draft preparation, O.S.S. and M.R.; writing—review and editing, M.R.; supervision, M.R. All authors have read and agreed to the published version of the manuscript.
Institutional Review Board Statement
Not applicable.
Informed Consent Statement
Not applicable.
Data Availability Statement
Not applicable.
Conflicts of Interest
The authors declare that they have no conflict of interest.
References
- Varghese, A.M.; Pradhan, R.P. Transportation infrastructure and economic growth: Does there exist causality and spillover? A Systematic Review and Research Agenda. Transportation Research Procedia 2025, 82, 2618–2632. [Google Scholar] [CrossRef]
- Faris, N.; Zayed, T.; Fares, A. Review of Condition Rating and Deterioration Modeling Approaches for Concrete Bridges. Buildings 2025. [Google Scholar] [CrossRef]
- Azhar, A.S.; Kudus, S.A.; Jamadin, A.; Mustaffa, N.K.; Sugiura, K. Recent vibration-based structural health monitoring on steel bridges: Systematic literature review. Ain Shams Engineering Journal 2024, 15, 102501. [Google Scholar] [CrossRef]
- Gharehbaghi, V.R.; Noroozinejad Farsangi, E.; Noori, M.; Yang, T.; Li, S.; Nguyen, A.; Málaga-Chuquitaype, C.; Gardoni, P.; Mirjalili, S. A critical review on structural health monitoring: Definitions, methods, and perspectives. Archives of computational methods in engineering 2022, 29, 2209–2235. [Google Scholar] [CrossRef]
- He, Z.; Li, W.; Salehi, H.; Zhang, H.; Zhou, H.; Jiao, P. Integrated structural health monitoring in bridge engineering. Automation in construction 2022, 136, 104168. [Google Scholar] [CrossRef]
- Brighenti, F.; Caspani, V.F.; Costa, G.; Giordano, P.F.; Limongelli, M.P.; Zonta, D. Bridge management systems: A review on current practice in a digitizing world. Engineering Structures 2024, 321, 118971. [Google Scholar] [CrossRef]
- Deng, Y.; Zhao, Y.; Ju, H.; Yi, T.H.; Li, A. Abnormal data detection for structural health monitoring: State-of-the-art review. Developments in the Built Environment 2024, 17. [Google Scholar] [CrossRef]
- Sonbul, O.S.; Rashid, M. Algorithms and Techniques for the Structural Health Monitoring of Bridges: Systematic Literature Review. Sensors 2023, 23, 4230. [Google Scholar] [CrossRef]
- Rashid, M.; Sonbul, O.S. Towards the Structural Health Monitoring of Bridges Using Wireless Sensor Networks: A Systematic Study. Sensors 2023, 23, 8593. [Google Scholar] [CrossRef]
- Qu, C.; Zhang, H.; Zhang, R.; Zou, S.; Huang, L.; Li, H. Multiclass Anomaly Detection of Bridge Monitoring Data with Data Migration between Different Bridges for Balancing Data. Applied Sciences 2023, 13. [Google Scholar] [CrossRef]
- Choi, K.; Yi, J.; Park, C.; Yoon, S. Deep Learning for Anomaly Detection in Time-Series Data: Review, Analysis, and Guidelines. IEEE Access 2021, 9. [Google Scholar] [CrossRef]
- Mejri, N.; Lopez-Fuentes, L.; Roy, K.; Chernakov, P.; Ghorbel, E.; Aouada, D. Unsupervised anomaly detection in time-series: An extensive evaluation and analysis of state-of-the-art methods. Expert Systems with Applications, 1249. [Google Scholar]
- Zhang, Y.M.; Wang, H.; Wan, H.P.; Mao, J.X.; Xu, Y.C. Anomaly detection of structural health monitoring data using the maximum likelihood estimation-based Bayesian dynamic linear model. Structural Health Monitoring 2021, 20. [Google Scholar] [CrossRef]
- Zhang, Y.; Lei, Y. Data Anomaly Detection of Bridge Structures Using Convolutional Neural Network Based on Structural Vibration Signals. Symmetry 2021, 13. [Google Scholar] [CrossRef]
- Zhang, J.; Zhang, J.; Wu, Z. Long-Short Term Memory Network-Based Monitoring Data Anomaly Detection of a Long-Span Suspension Bridge. Sensors 2022, 22. [Google Scholar] [CrossRef]
- Gao, K.; Chen, Z.D.; Weng, S.; Zhu, H.p.; Wu, L.Y. Detection of multi-type data anomaly for structural health monitoring using pattern recognition neural network. Smart Structures and Systems 2022, 29. [Google Scholar] [CrossRef]
- Xu, X.; Forde, M.C.; Ren, Y.; Huang, Q.; Liu, B. Multi-index probabilistic anomaly detection for large span bridges using Bayesian estimation and evidential reasoning. Structural Health Monitoring 2023, 22. [Google Scholar] [CrossRef]
- Fan, Z.; Tang, X.; Chen, Y.; Ren, Y.; Deng, C.; Wang, Z.; Peng, Y.; Shi, C.; Huang, Q. Review of anomaly detection in large span bridges: available methods, recent advancements and future trends. Advances in Bridge Engineering 2024, 5, 2. [Google Scholar] [CrossRef]
- Ayadi, A.; Ghorbel, O.; Obeid, A.M.; Abid, M. Outlier detection approaches for wireless sensor networks: A survey. Computer Networks 2017, 129. [Google Scholar] [CrossRef]
- Makhoul, N. Review of data quality indicators and metrics, and suggestions for indicators and metrics for structural health monitoring. Advances in Bridge Engineering 2022, 3. [Google Scholar] [CrossRef]
- Shahrivar, F.; Sidiq, A.; Mahmoodian, M.; Jayasinghe, S.; Sun, Z.; Setunge, S. AI-based bridge maintenance management: a comprehensive review. Artificial Intelligence Review 2025, 58, 135. [Google Scholar] [CrossRef]
- Kitchenham, B. Procedures for Performing Systematic Reviews. Keele, UK, Keele University 2004, 33. [Google Scholar]
- Chandola, V.; Banerjee, A.; Kumar, V. Anomaly Detection: A Survey. ACM Computing Surveys (CSUR) 2009, 41, 1–58. [Google Scholar] [CrossRef]
- Knorr, E.M.; Ng, R.T.; Tucakov, V. Distance-based outliers: algorithms and applications. The VLDB Journal 2000, 8, 273–253. [Google Scholar] [CrossRef]
- Lei, Z.; Zhu, L.; Fang, Y.; Li, X.; Liu, B. Anomaly detection of bridge health monitoring data based on KNN algorithm. Journal of Intelligent & Fuzzy Systems 2020, 39. [Google Scholar] [CrossRef]
- Jeong, S.; Jin, S.S.; Sim, S.H. Modal Property-Based Data Anomaly Detection Method for Autonomous Stay-Cable Monitoring System in Cable-Stayed Bridges. Structural Control and Health Monitoring 2024, 2024. [Google Scholar] [CrossRef]
- Zhang, H.; Lin, J.; Hua, J.; Gao, F.; Tong, T. Data Anomaly Detection for Bridge SHM Based on CNN Combined with Statistic Features. Journal of Nondestructive Evaluation 2022, 41. [Google Scholar] [CrossRef]
- Yuen, K.V.; Ortiz, G.A. Outlier detection and robust regression for correlated data. Computer Methods in Applied Mechanics and Engineering 2017, 313, 632–646. [Google Scholar] [CrossRef]
- Zhang, X.; Zhou, W. Structural Vibration Data Anomaly Detection Based on Multiple Feature Information Using CNN-LSTM Model. Structural Control and Health Monitoring 2023, 2023, 3906180. [Google Scholar] [CrossRef]
- Shajihan, A.; Wang, S.; Zhai, G.; Spencer, B. CNN based data anomaly detection using multi-channel imagery for structural health monitoring. Smart Structures and Systems 2022, 29. [Google Scholar] [CrossRef]
- Chou, J.Y.; Fu, Y.; Huang, S.K.; Chang, C.M. SHM data anomaly classification using machine learning strategies: a comparative study. Smart Structures and Systems 2022, 29. [Google Scholar] [CrossRef]
- Du, Y.; Li, L.; Hou, R.; Wang, X.; Tian, W.; Xia, Y. Convolutional Neural Network-based Data Anomaly Detection Considering Class Imbalance with Limited Data. Smart Structures and Systems 2022, 29. [Google Scholar] [CrossRef]
- Liu, G.; Niu, Y.; Zhao, W.; Duan, Y.; Shu, J. Data anomaly detection for structural health monitoring using a combination network of GANomaly and CNN. Smart Structures and Systems 2022, 29. [Google Scholar] [CrossRef]
- Yang, K.; Ding, Y.; Jiang, H.; Zhao, H.; Luo, G. A two-stage data cleansing method for bridge global positioning system monitoring data based on bi-direction long and short term memory anomaly identification and conditional generative adversarial networks data repair. Structural Control and Health Monitoring 2022, 29. [Google Scholar] [CrossRef]
- Son, H.; Jang, Y.; Kim, S.E.; Kim, D.; Park, J.W. Deep Learning-Based Anomaly Detection to Classify Inaccurate Data and Damaged Condition of a Cable-Stayed Bridge. IEEE Access 2021, 9. [Google Scholar] [CrossRef]
- Bing Qu, Ping Liao, Y. H. Outlier Detection and Forecasting for Bridge Health Monitoring Based on Time Series Intervention Analysis. Structural Durability & Health Monitoring 2022, 16. [Google Scholar] [CrossRef]
- Kim, S.Y.; Mukhiddinov, M. Data Anomaly Detection for Structural Health Monitoring Based on a Convolutional Neural Network. Sensors 2023, 23. [Google Scholar] [CrossRef]
- Ni, F.; Zhang, J.; Noori, M.N. Deep learning for data anomaly detection and data compression of a long-span suspension bridge. Computer-Aided Civil and Infrastructure Engineering 2020, 35. [Google Scholar] [CrossRef]
- Yang, J.; Liu, D.; Zhao, L.; Yang, X.; Li, R.; Jiang, S.; Li, J. Improved stochastic configuration network for bridge damage and anomaly detection using long-term monitoring data. Information Sciences 2025, 700, 121831. [Google Scholar] [CrossRef]
- Zhu, Y.C.; Zheng, Y.W.; Xiong, W.; Li, J.X.; Cai, C.S.; Jiang, C. Online Bridge Structural Condition Assessment Based on the Gaussian Process: A Representative Data Selection and Performance Warning Strategy. Structural Control and Health Monitoring 2024, 2024. [Google Scholar] [CrossRef]
- Deng, Y.; Ju, H.; Zhong, G.; Li, A. Data quality evaluation for bridge structural health monitoring based on deep learning and frequency-domain information. Structural Health Monitoring 2023, 22. [Google Scholar] [CrossRef]
- Deng, Y.; Ju, H.; Zhong, G.; Li, A.; Ding, Y. A general data quality evaluation framework for dynamic response monitoring of long-span bridges. Mechanical Systems and Signal Processing 2023, 200. [Google Scholar] [CrossRef]
- Zhao, M.; Sadhu, A.; Capretz, M. Multiclass anomaly detection in imbalanced structural health monitoring data using convolutional neural network. Journal of Infrastructure Preservation and Resilience 2022, 3. [Google Scholar] [CrossRef]
- Mao, J.; Wang, H.; SpencerJr, B.F. Toward data anomaly detection for automated structural health monitoring: Exploiting generative adversarial nets and autoencoders. Structural Health Monitoring 2021, 20. [Google Scholar] [CrossRef]
- Zhang, Y.; Tang, Z.; Yang, R. Data anomaly detection for structural health monitoring by multi-view representation based on local binary patterns. Measurement 2022, 202. [Google Scholar] [CrossRef]
- Jian, X.; Zhong, H.; Xia, Y.; Sun, L. Faulty data detection and classification for bridge structural health monitoring via statistical and deep-learning approach. Structural Control and Health Monitoring 2021, 28. [Google Scholar] [CrossRef]
- Lei, X.; Xia, Y.; Wang, A.; Jian, X.; Zhong, H.; Sun, L. Mutual information based anomaly detection of monitoring data with attention mechanism and residual learning. Mechanical Systems and Signal Processing 2023, 182. [Google Scholar] [CrossRef]
- Xu, J.; Dang, D.; Qian, M.; Liu, X.; Han, Q. A novel and robust data anomaly detection framework using LAL-AdaBoost for structural health monitoring. Journal of Civil Structural Health Monitoring 2022, 12. [Google Scholar] [CrossRef]
- Hao, C.; Gong, Y.; Liu, B.; Pan, Z.; Sun, W.; Li, Y.; Zhuo, Y.; Ma, Y.; Zhang, L. Data anomaly detection for structural health monitoring using the Mixture of Bridge Experts. Structures 2025, 71. [Google Scholar] [CrossRef]
- Wang, L.; Kang, J.; Zhang, W.; Hu, J.; Wang, K.; Wang, D.; Yu, Z. Online diagnosis for bridge monitoring data via a machine learning-based anomaly detection method. Measurement 2025, 245. [Google Scholar] [CrossRef]
- Qu, C.X.; Yang, Y.T.; Zhang, H.M.; Yi, T.H.; Li, H.N. Two-stage anomaly detection for imbalanced bridge data by attention mechanism optimisation and small sample augmentation. Engineering Structures 2025, 327. [Google Scholar] [CrossRef]
- Zhang, Y.; Wang, X.; Wu, W.; Xia, Y. Anomaly detection of sensor faults and extreme events by anomaly locating strategies and convolutional autoencoders. Structural Health Monitoring 2025, 0. [Google Scholar] [CrossRef]
- Pan, Q.; Bao, Y.; Li, H. Transfer learning-based data anomaly detection for structural health monitoring. Structural Health Monitoring 2023, 22. [Google Scholar] [CrossRef]
- Qu, C.X.; Zhang, H.M.; Yi, T.H.; Pang, Z.Y.; Li, H.N. Anomaly detection of massive bridge monitoring data through multiple transfer learning with adaptively setting hyperparameters. Engineering Structures 2024, 314. [Google Scholar] [CrossRef]
- Wang, X.; Wu, W.; Du, Y.; Cao, J.; Chen, Q.; Xia, Y. Wireless IoT Monitoring System in Hong Kong–Zhuhai–Macao Bridge and Edge Computing for Anomaly Detection. IEEE Internet of Things Journal 2024, 11. [Google Scholar] [CrossRef]
- Kang, J.; Wang, L.; Zhang, W.; Hu, J.; Chen, X.; Wang, D.; Yu, Z. Effective alerting for bridge monitoring via a machine learning-based anomaly detection method. Structural Health Monitoring 2024, 0. [Google Scholar] [CrossRef]
- Beale, C.; Niezrecki, C.; Inalpolat, M. An adaptive wavelet packet denoising algorithm for enhanced active acoustic damage detection from wind turbine blades. Mechanical Systems and Signal Processing 2020, 142, 106754. [Google Scholar] [CrossRef]
- Nikkhoo, A.; Karegar, H.; Mohammadi, R.K.; Hajirasouliha, I. An acceleration-based approach for crack localisation in beams subjected to moving oscillators. Journal of Vibration and Control 2021, 27, 489–501. [Google Scholar] [CrossRef]
- Hou, Z.; Hera, A.; Noori, M. Wavelet-based techniques for structural health monitoring. Health Assessment of Engineered Structures: Bridges, Buildings and Other Infrastructures. World Scientific.
- Moghaddass, R.; Sheng, S. An anomaly detection framework for dynamic systems using a Bayesian hierarchical framework. Applied Energy 2019, 240, 561–582. [Google Scholar] [CrossRef]
- Wan, H.P.; Ni, Y.Q. Bayesian Modeling Approach for Forecast of Structural Stress Response Using Structural Health Monitoring Data. Journal of Structural Engineering 2018, 144, 04018130. [Google Scholar] [CrossRef]
- Pang, J.; Liu, D.; Peng, Y.; Peng, X. Anomaly detection based on uncertainty fusion for univariate monitoring series. Measurement 2017, 95, 280–292. [Google Scholar] [CrossRef]
- Kim, C.; Lee, J.; Kim, R.; Park, Y.; Kang, J. DeepNAP: Deep neural anomaly pre-detection in a semiconductor fab. Information Sciences 2018, 457-458, 1–11. [Google Scholar] [CrossRef]
- German, S.; Brilakis, I.; DesRoches, R. Rapid entropy-based detection and properties measurement of concrete spalling with machine vision for post-earthquake safety assessments. Advanced Engineering Informatics 2012, 26, 846–858. [Google Scholar] [CrossRef]
- Kabir, S. Imaging-based detection of AAR induced map-crack damage in concrete structure. NDT and E International 2010, 43, 461–469. [Google Scholar] [CrossRef]
- Mumuni, A.; Mumuni, F. Data augmentation: A comprehensive survey of modern approaches. Array 2022, 16, 100258. [Google Scholar] [CrossRef]
- Shorten, C.; Khoshgoftaar, T.M. A survey on Image Data Augmentation for Deep Learning. Journal of Big Data 2019, 6. [Google Scholar] [CrossRef]
Figure 1.
Structural Health Monitoring Process with Anomaly Detection
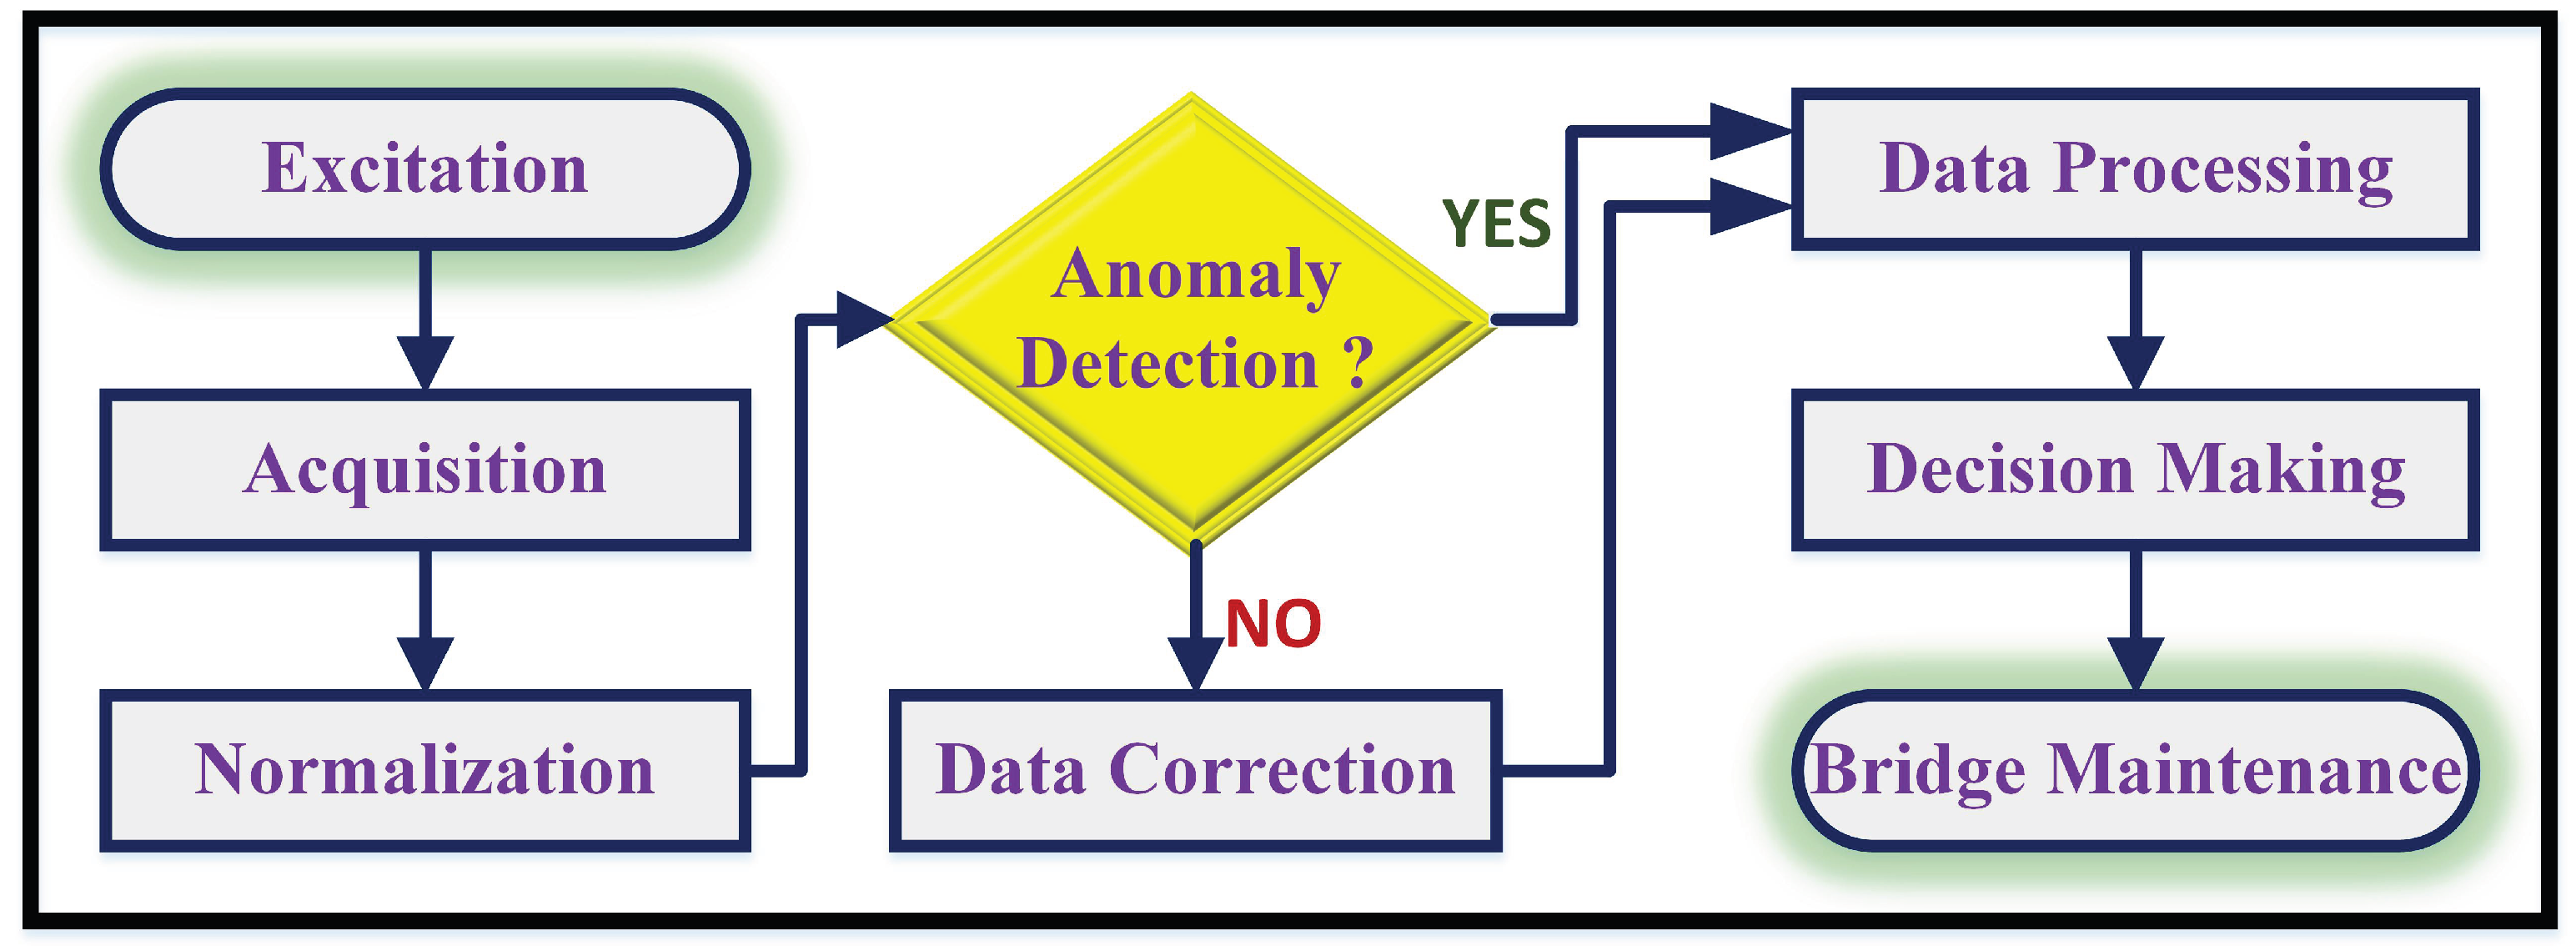
Figure 2.
Research Framework Illustrating Database Sources and Classification of Selected Studies
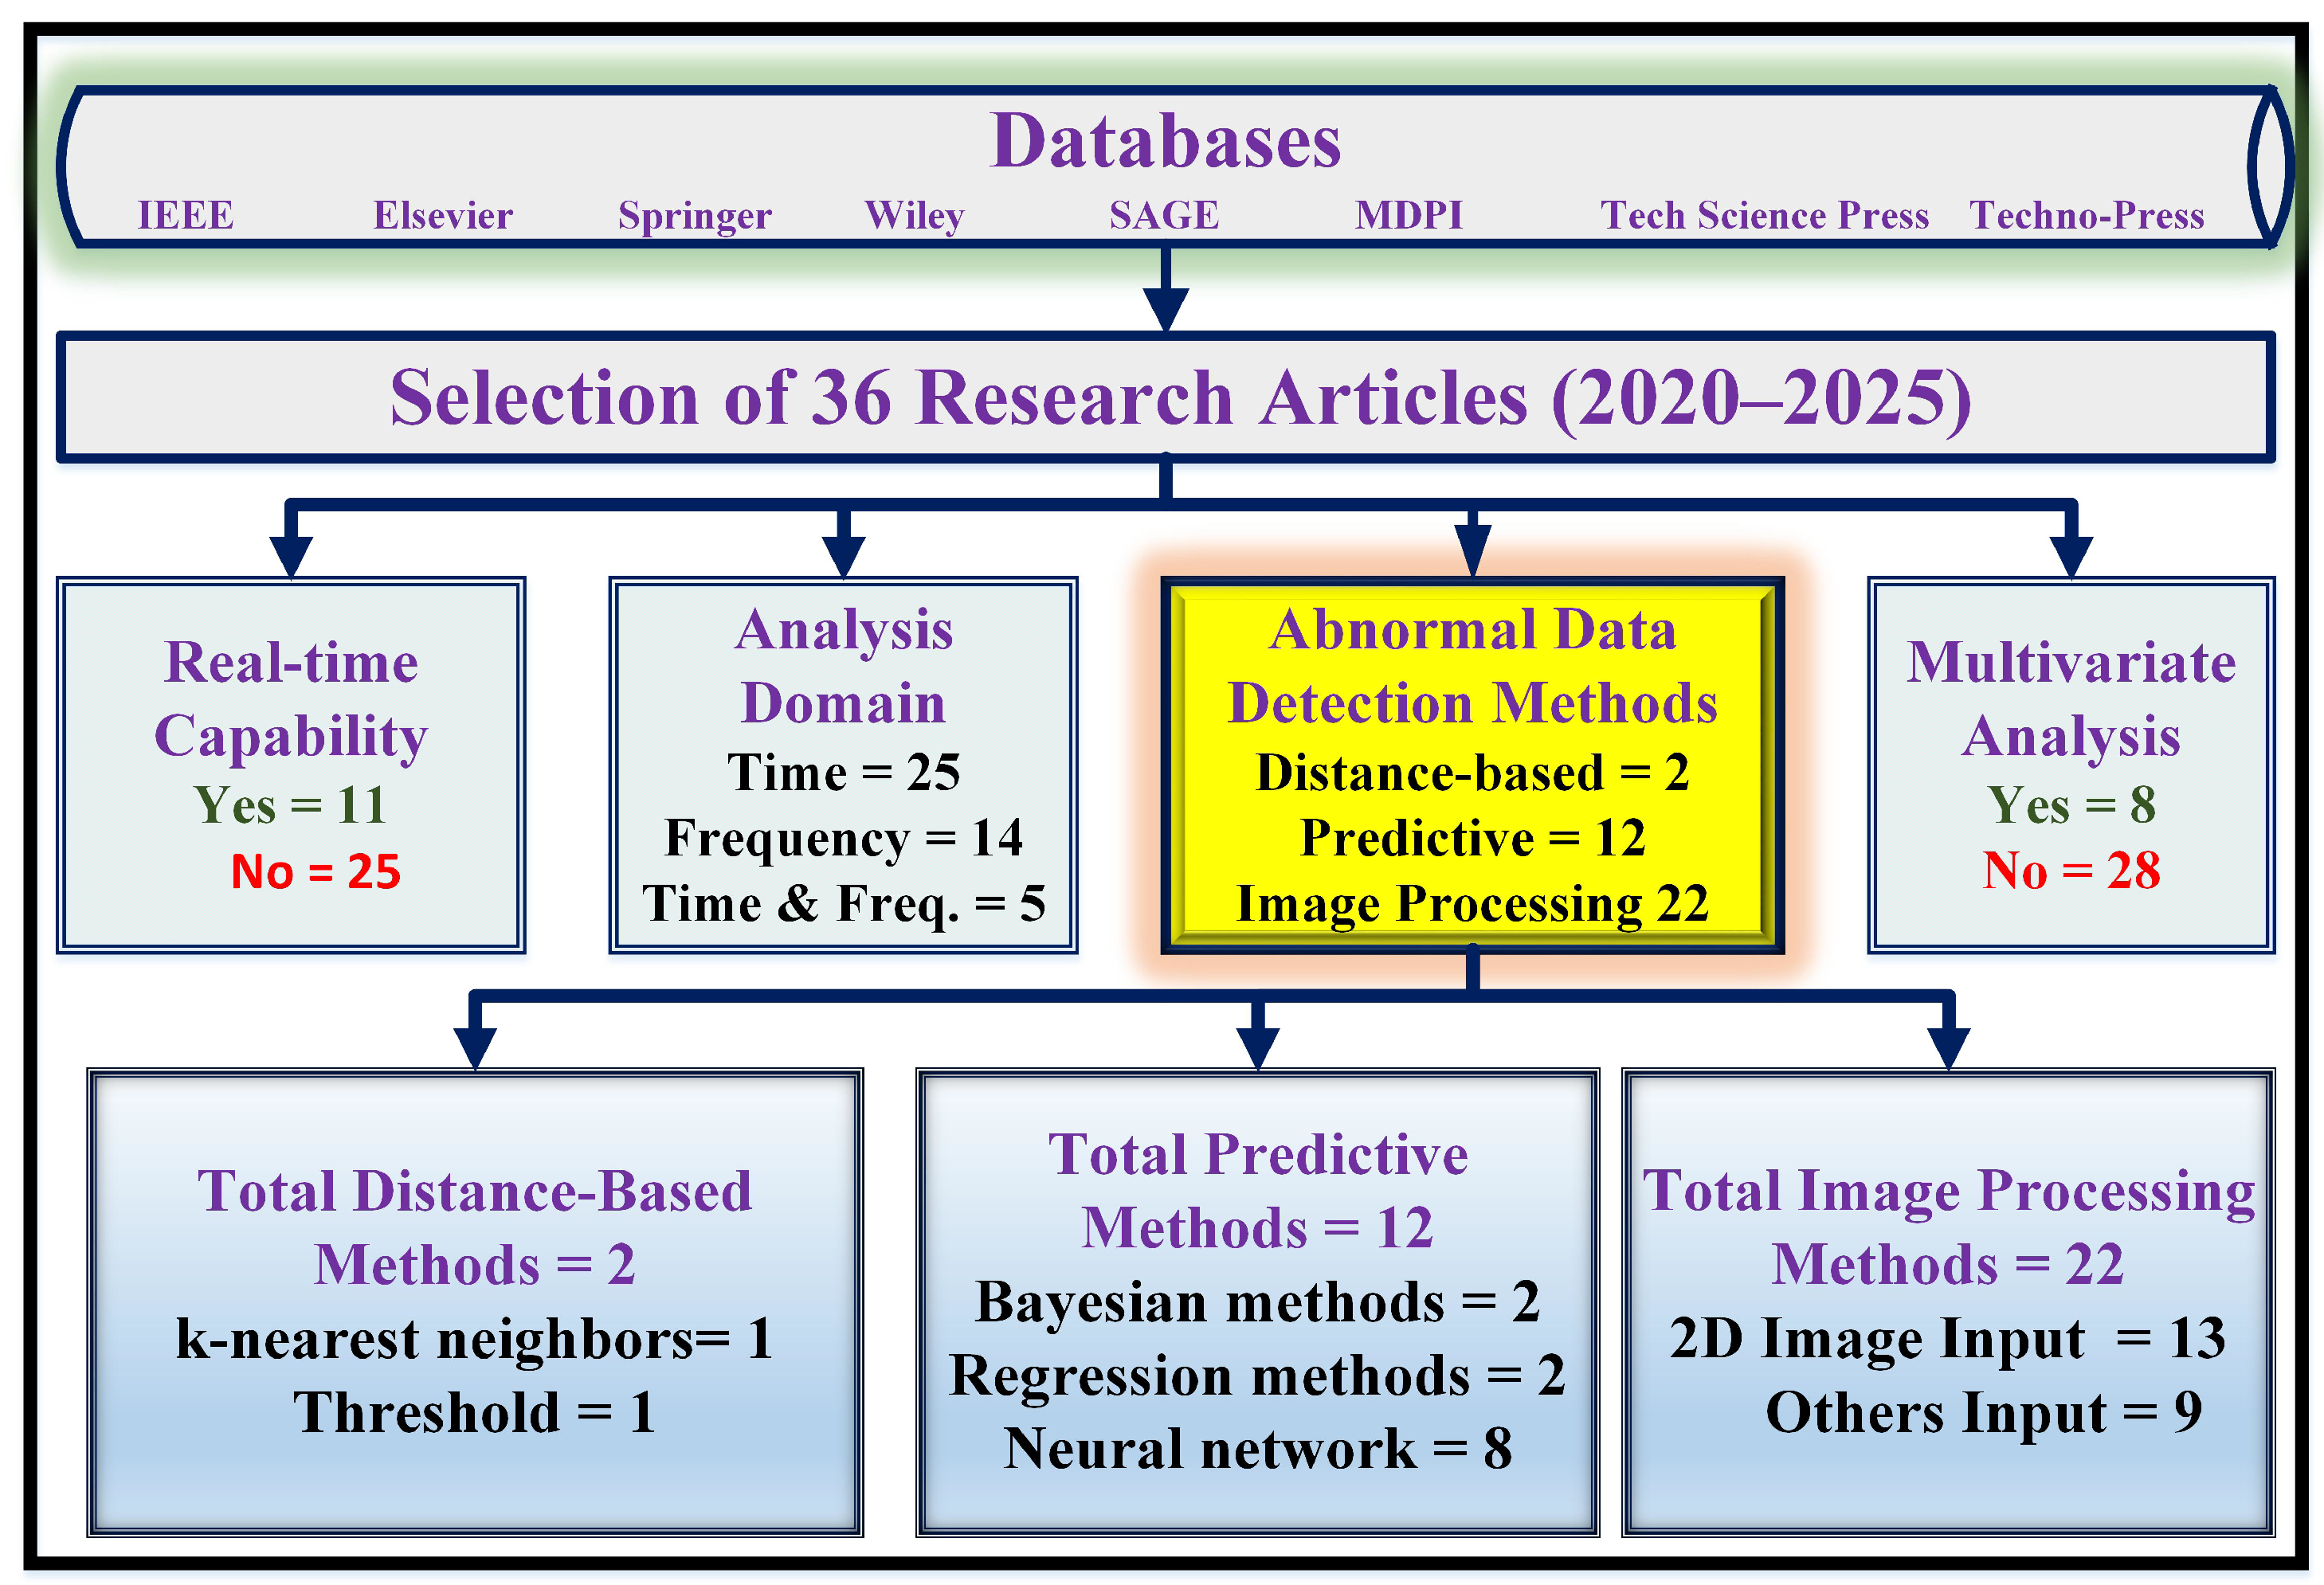
Figure 3.
Taxonomy of Anomaly Detection Methods in Structural Health Monitoring of Bridges
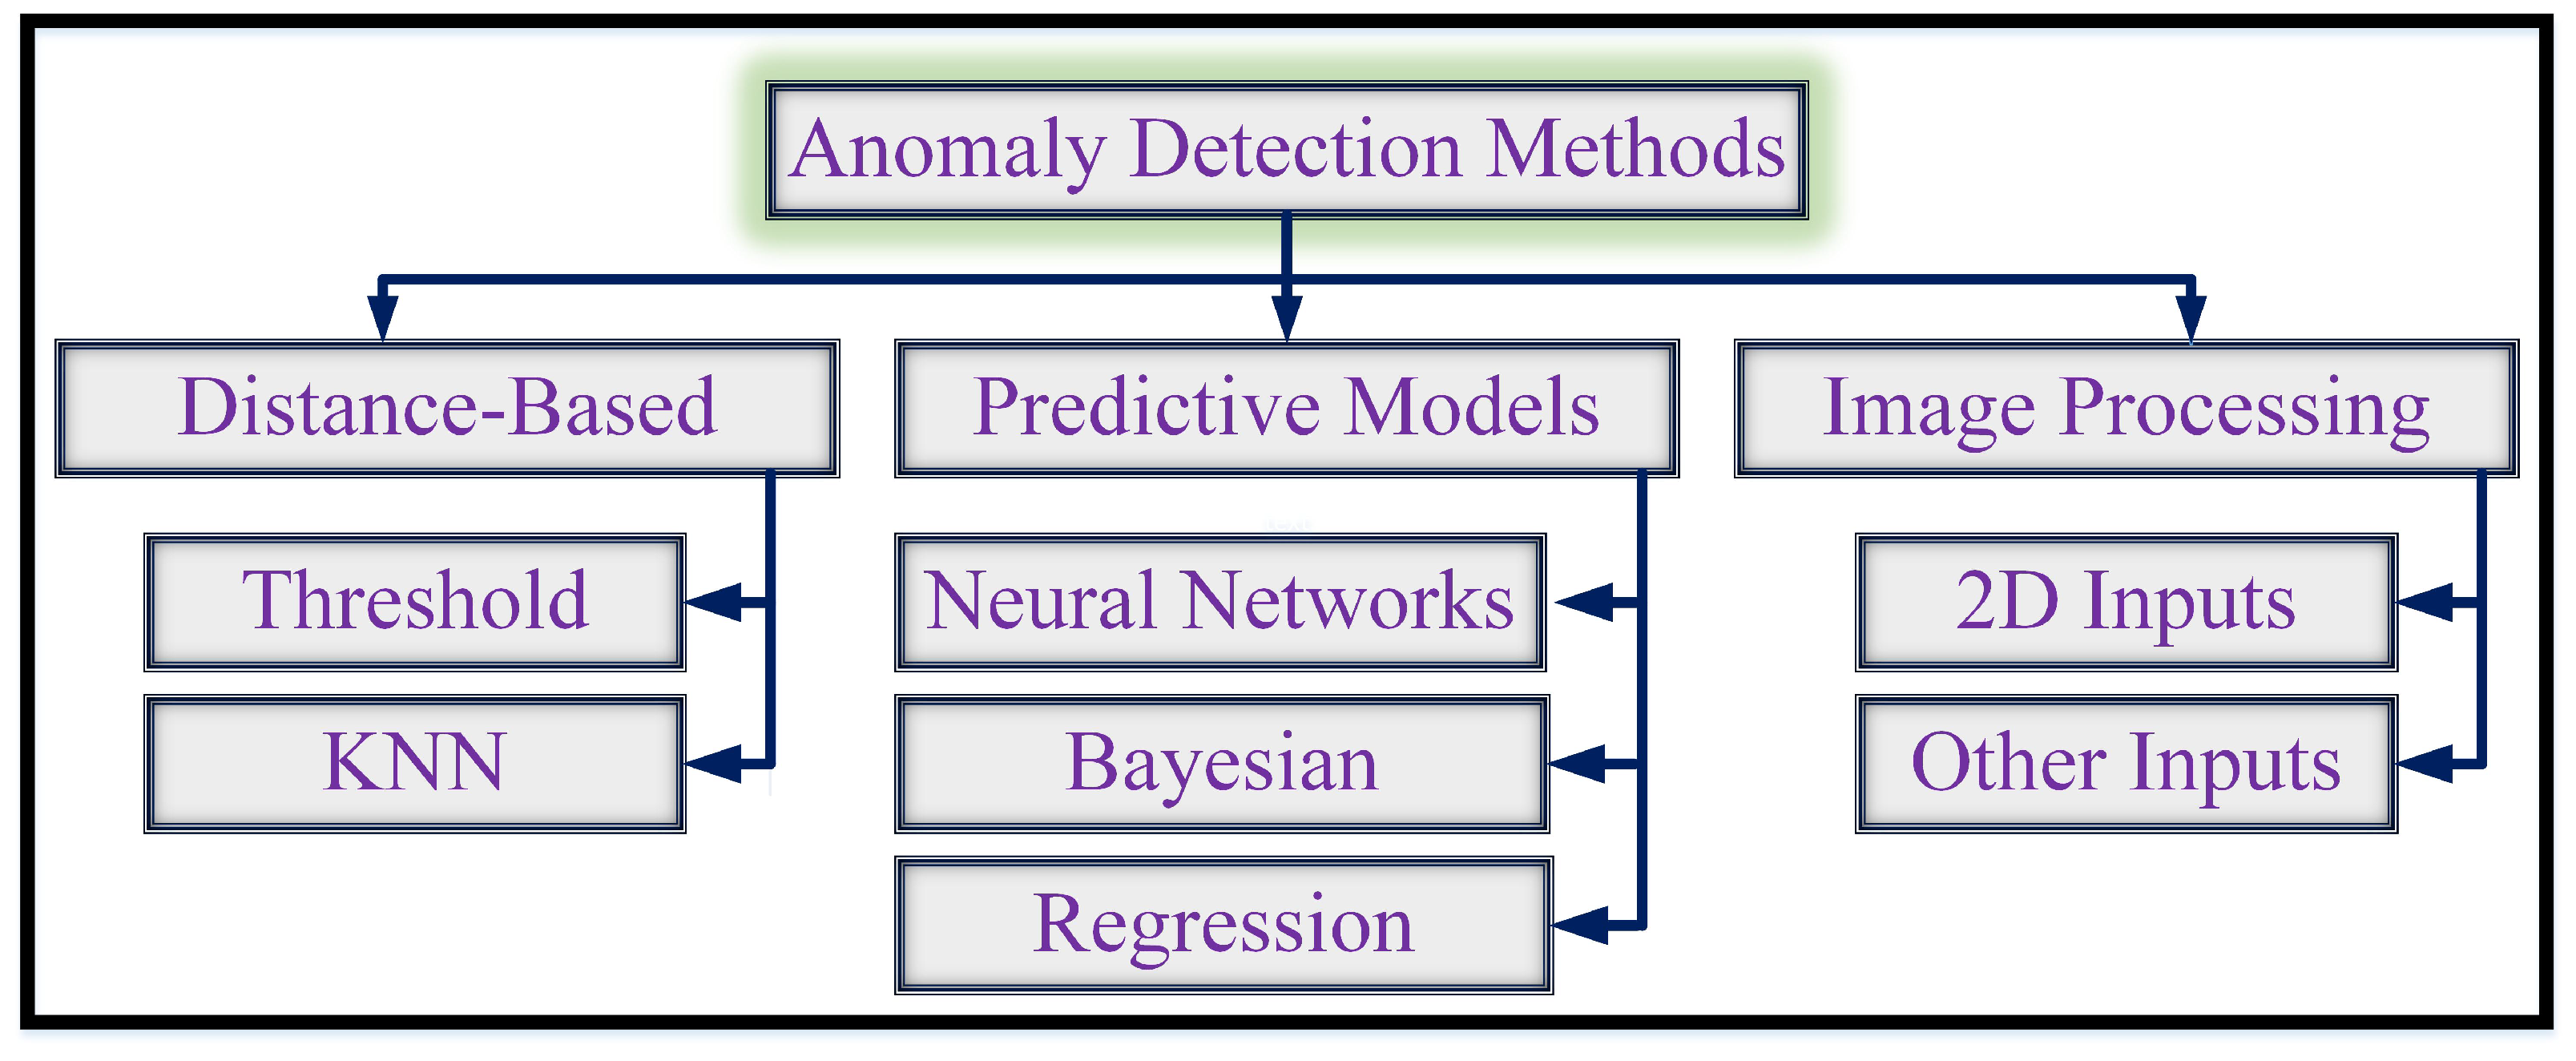
Figure 4.
Search Process of the Systematic Literature Review Highlighting the Sequential Filtering Stages from Initial Results to Final Study Selection
Figure 4.
Search Process of the Systematic Literature Review Highlighting the Sequential Filtering Stages from Initial Results to Final Study Selection
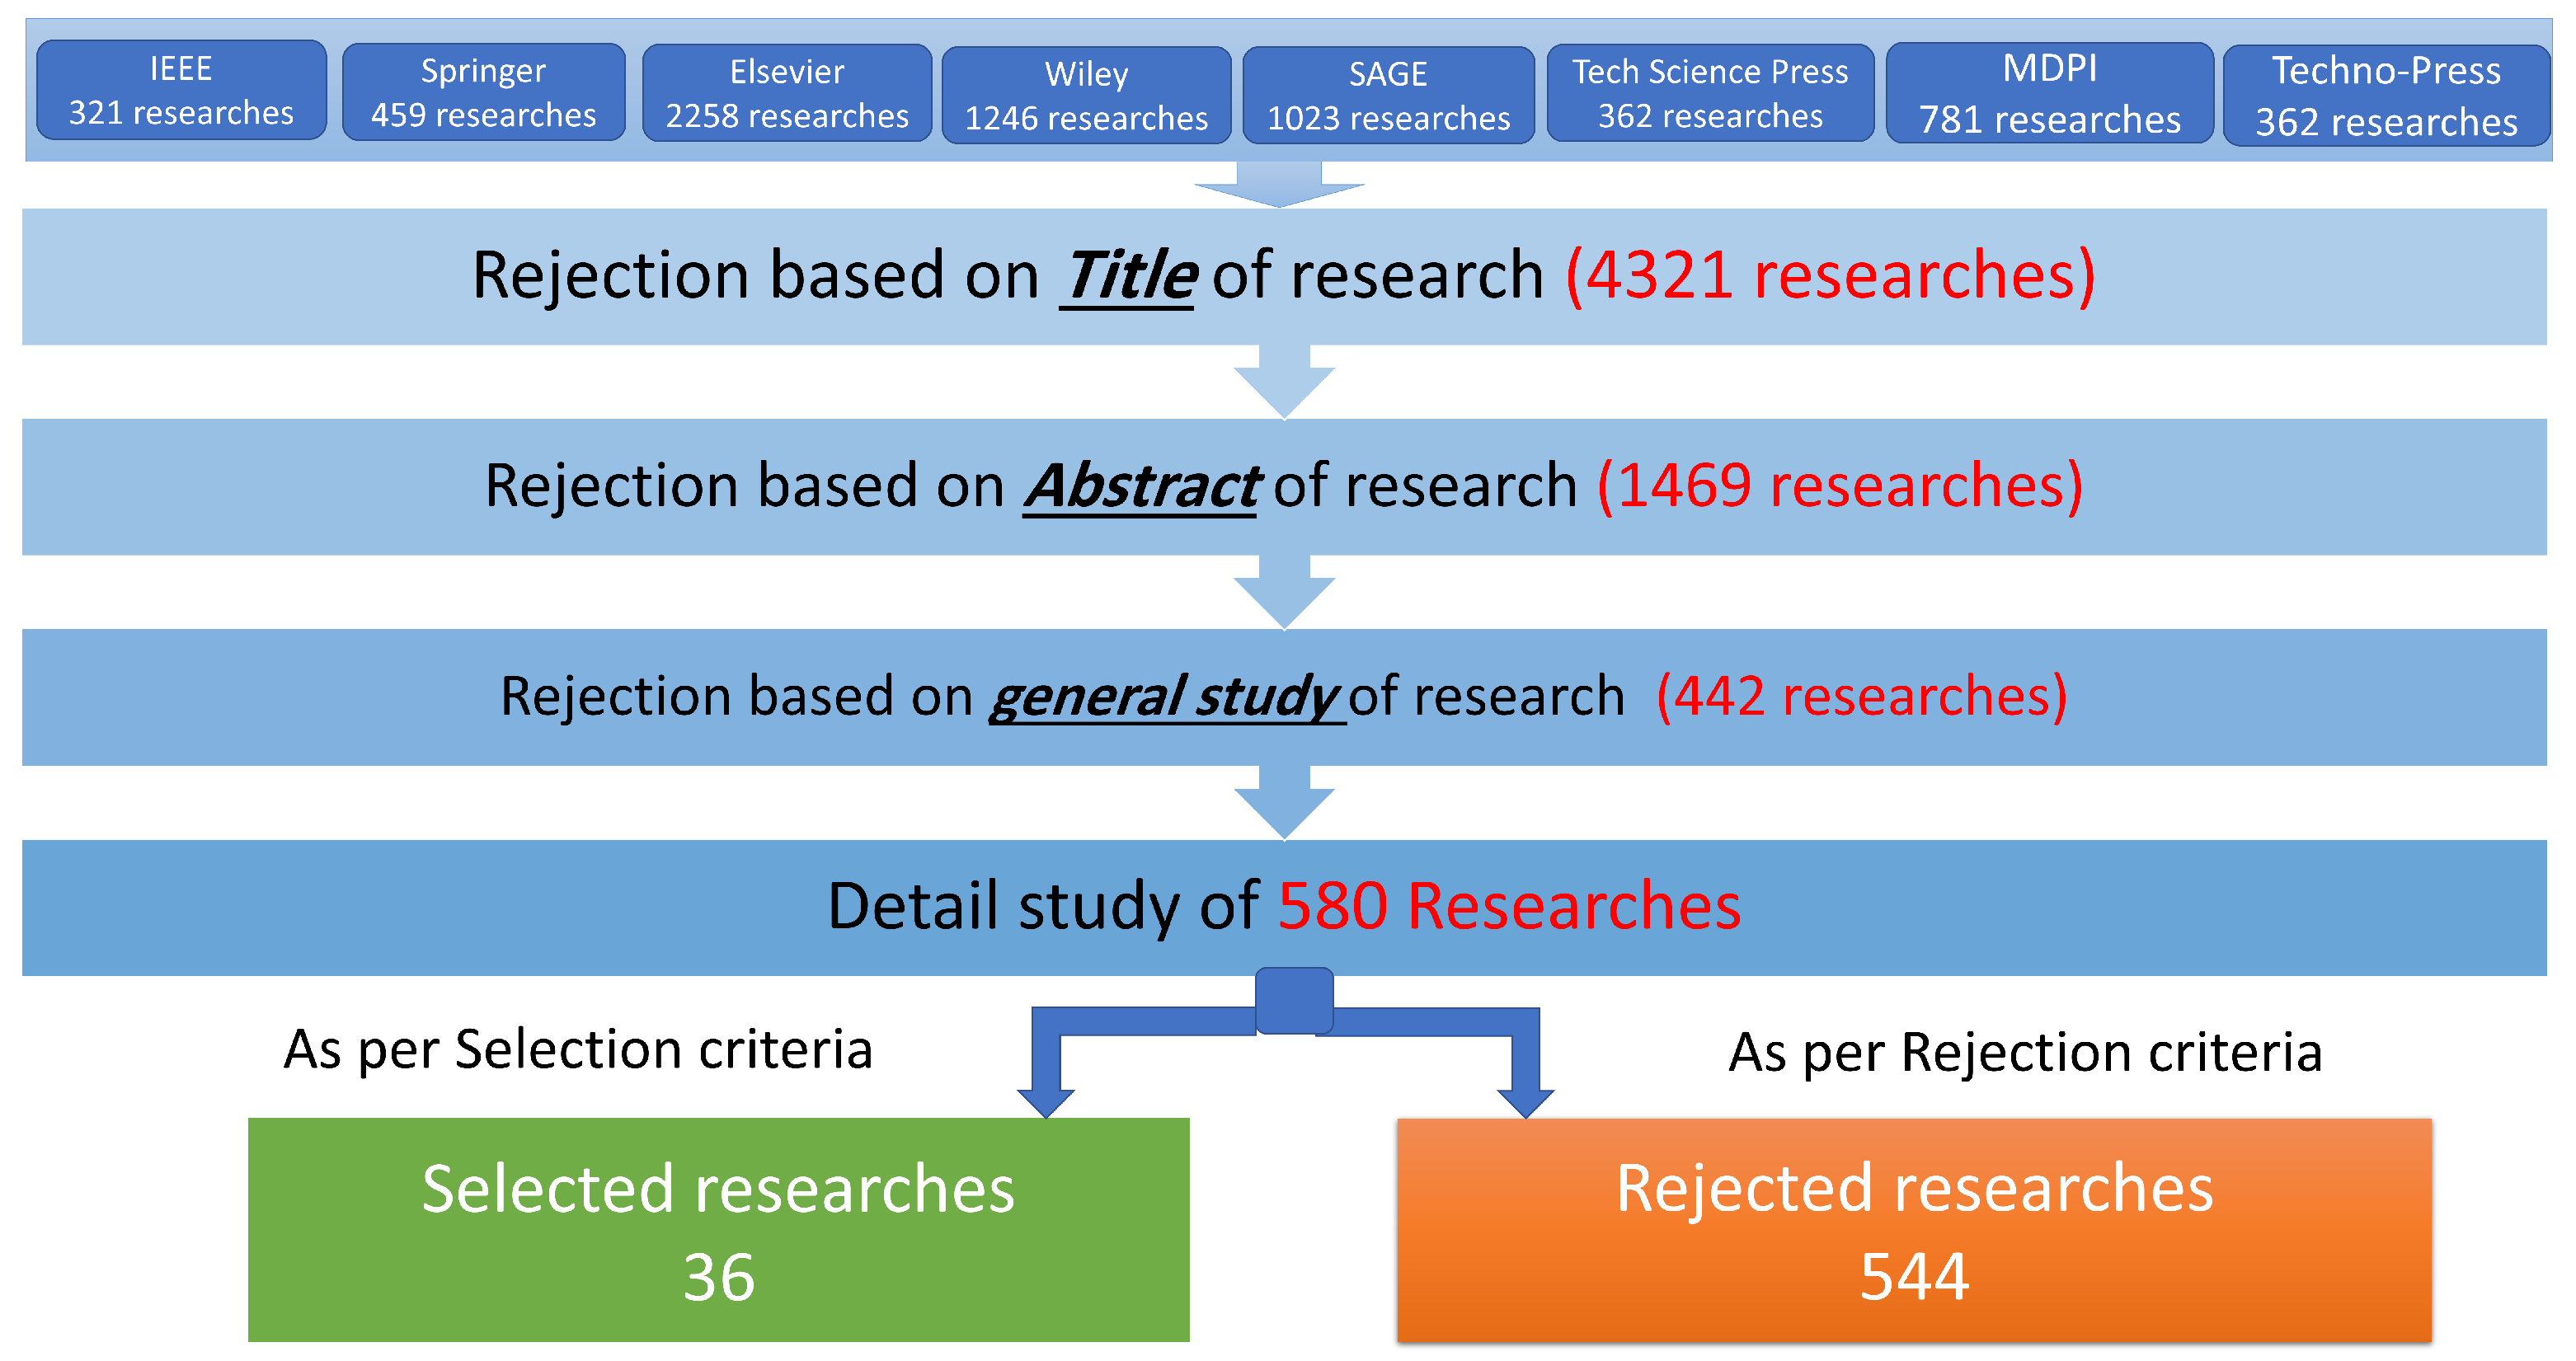
Figure 5.
Year-Wise Distribution of Selected Research Articles from WoS-Indexed Journals (2020–2025), Illustrating Publication Trends and the Evolving Focus on Abnormal Data Detection Methods in SHM for Bridges
Figure 5.
Year-Wise Distribution of Selected Research Articles from WoS-Indexed Journals (2020–2025), Illustrating Publication Trends and the Evolving Focus on Abnormal Data Detection Methods in SHM for Bridges
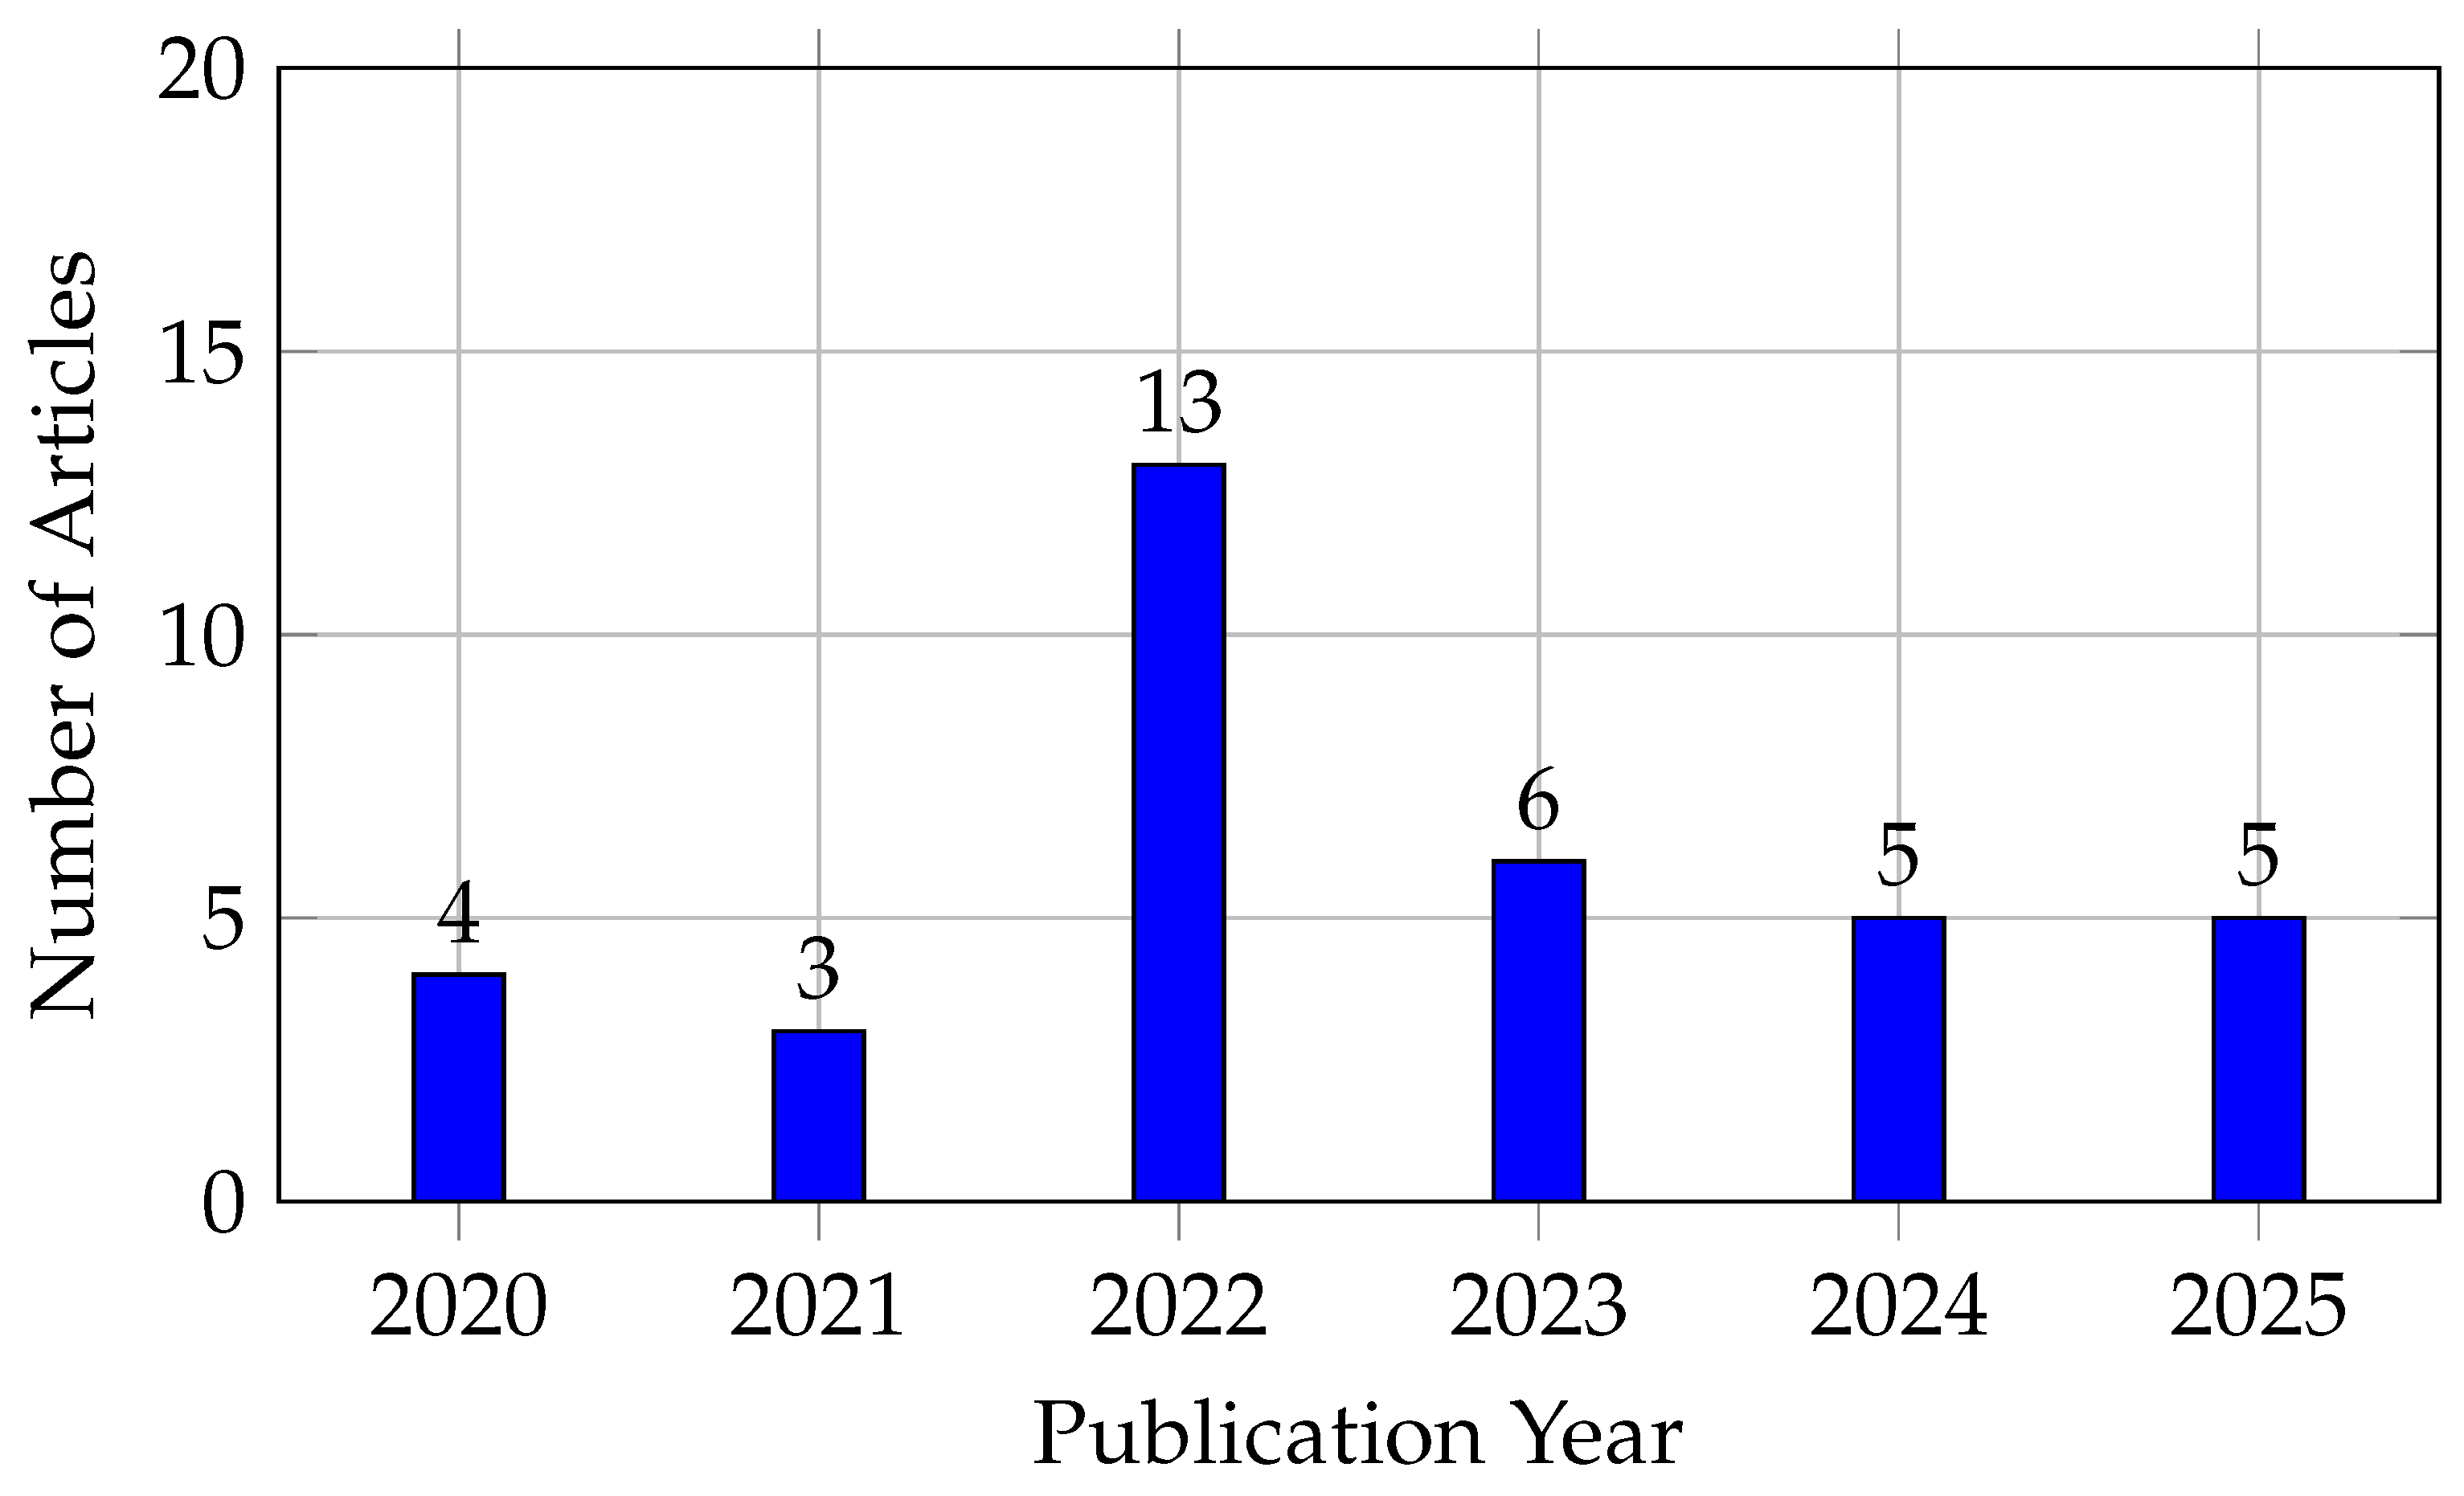

Table 1.
Summary of Existing Reviews: Focus Areas and Key Limitations
| Ref. | Year | Focus | Limitations |
|---|---|---|---|
| [19] | 2017 | Outlier detection in wireless sensor networks using statistical methods | Lacks AI, real-time analysis, multivariate support, and domain-level assessment |
| [11] | 2021 | DL-based anomaly detection in time-series with benchmark and training analysis | No statistical-DL integration; overlooks computational efficiency and real-time deployment |
| [20] | 2022 | Focuses on SHM data quality indicators and a generic evaluation framework | Lacks AI-driven enhancements and detailed performance analysis across different methods |
| [7] | 2024 | Focuses on taxonomy and evaluation of anomaly detection methods for SHM | Lacks emphasis on hybrid models and AI-driven approaches for enhanced accuracy |
| [18] | 2024 | Focuses on anomaly detection in large-span bridges through structural metrics | Lacks AI integration, detailed performance analysis, and uncertainty management strategies |
| [21] | 2025 | Explores AI applications in bridge maintenance, highlighting efficiency and sustainability | Lacks coverage of multi-sensor fusion and real-time AI deployment in large-scale monitoring |
Table 2.
Search Terms and Results under AND/OR Operators. Abbreviations: Spr. = Springer, Els. = Elsevier, TSP = Tech Science Press, TP = Techno-Press
Table 2.
Search Terms and Results under AND/OR Operators. Abbreviations: Spr. = Springer, Els. = Elsevier, TSP = Tech Science Press, TP = Techno-Press
| Search Terms | Op. | IEEE | Spr. | Els. | SAGE | Wiley | MDPI | TSP | TP |
|---|---|---|---|---|---|---|---|---|---|
| ’Bridges’ ’SHM’ ’Anomaly detection’ | AND | 12 | 16 | 115 | 94 | 63 | 23 | 8 | 55 |
| OR | 113 | 129 | 498 | 523 | 289 | 135 | 92 | 256 | |
| ’Bridges’ ’SHM’ ’Data cleansing’ | AND | 19 | 33 | 132 | 124 | 74 | 38 | 11 | 69 |
| OR | 73 | 94 | 387 | 412 | 245 | 112 | 45 | 254 | |
| ’Bridges’ ’SHM’ ’Abnormal Data detection’ | AND | 48 | 52 | 195 | 210 | 149 | 72 | 23 | 126 |
| OR | 152 | 164 | 487 | 475 | 321 | 174 | 111 | 295 | |
| ’Bridges’ ’SHM’ ’Abnormal Data detection’ | AND | 69 | 83 | 314 | 264 | 212 | 93 | 22 | 164 |
| OR | 312 | 364 | 952 | 865 | 658 | 352 | 163 | 648 | |
| ’Bridges’ ’SHM’ ’Outlier detection’ | AND | 18 | 26 | 216 | 169 | 87 | 36 | 8 | 54 |
| OR | 132 | 185 | 543 | 532 | 404 | 198 | 59 | 354 | |
| ’Bridges’ ’SHM’ ’Data quality management’ | AND | 54 | 74 | 227 | 214 | 162 | 72 | 34 | 147 |
| OR | 127 | 236 | 678 | 632 | 545 | 258 | 67 | 497 | |
| ’Bridges’ ’SHM’ ’Anomalous data detection’ | AND | 28 | 52 | 207 | 182 | 132 | 65 | 14 | 106 |
| OR | 263 | 325 | 529 | 654 | 552 | 365 | 125 | 516 |
Table 3.
Classification and Statistical Overview of Abnormal Data Detection Methods
| Detection Category | Number of Studies | Cited References |
|---|---|---|
| Distance-Based Methods | 2 | [25,26] |
| Predictive Models | 12 | [13,14,15,17,27,34,35,36,37,38,39,40] |
| Image Processing Methods | 22 | [16,29,30,31,32,33,41,42,43,44,45,46,47,48,49,50,51,52,53,54,55,56] |
Table 4.
Prevalence of Real-Time Capability in SHM Systems
| Real-Time Capability | Number of Studies | Associated References |
|---|---|---|
| Yes | 11 | [13,15,16,34,36,37,40,49,50,55,56] |
| No | 25 | [14,17,25,26,27,29,30,31,32,33,35,38,39,41,42,43,44,45,46,47,48,51,52,53,54] |
Table 5.
Distribution of Analysis Domain Methods: Time, Frequency, and Time-Frequency Approaches
| Analysis Domain | Number of Studies | Associated References |
|---|---|---|
| Time | 25 | [13,14,15,16,17,25,27,29,30,31,33,34,35,36,37,38,43,44,45,47,51,52,53,54,56] |
| Frequency | 14 | [26,27,29,30,33,38,39,40,41,46,50,53,54,55] |
| Time-Frequency | 5 | [31,32,42,48,49] |
Table 6.
Distribution of Multivariate Analysis Usage Among Selected Studies
| Multivariate Analysis Usage | Number of Studies | Associated References |
|---|---|---|
| Yes | 8 | [17,25,34,35,37,50,53,56] |
| No | 28 | [13,14,15,16,26,27,29,30,31,32,33,36,38,39,40,41,42,43,44,45,46,47,48,49,51,52,54,55] |
Table 7.
Review of Distance-Based Methods in SHM for Bridges
| Ref. | Bridge Type | Sensor Data Type | Anomaly Type | Detection Methodology |
|---|---|---|---|---|
| [26] | Cable-stayed | Acceleration | Low-quality data | Uses Minimum Covariance Determinant (MCD) for distance-based anomaly detection |
| [25] | General bridge | Diversed | Outlier | Computes distances between sequence patterns and applies KNN to detect anomalies |
Table 8.
Summary of Bayesian-Based Anomaly Detection Techniques
| Ref. | Bridge Type | Sensors | Anomaly | Accuracy | Method |
|---|---|---|---|---|---|
| [13] | Cable-stayed | Acceleration, strain | Spikes, shift | 98.96% | BDLM with subspace detection |
| [17] | Composite | Wind, temp, load, pressure | Sensor fault | – | PDFs with certainty index |
Table 9.
Regression-Based Anomaly Detection Methods
| Ref. | Bridge Configuration | Sensor Data Type | Anomaly Type | Regression-Based Methodology |
|---|---|---|---|---|
| [36] | Oblique arch | Strain | Outlier | SARIMA model for time series prediction and anomaly detection |
| [40] | Cable-stayed | Stress | Noise | Gaussian process regression with data selection for noise filtering and fault detection |
Table 10.
Neural Network-Based Anomaly Detection in SHM: Summary of Bridge Types, Input Data, Fault Types, and Detection Performance Metrics
Table 10.
Neural Network-Based Anomaly Detection in SHM: Summary of Bridge Types, Input Data, Fault Types, and Detection Performance Metrics
| Ref. | Bridge Type | Input Data | Fault Type | Precision (%) | Recall (%) | F1 Score | Accuracy (%) |
|---|---|---|---|---|---|---|---|
| [14] | Long-span cable-stayed | Acceleration | Miss, minor, outlier, square, trend, drift | 86.65 | 92.96 | 0.89 | 95.00 |
| [15] | Long-span cable-stayed | Acceleration | Outlier, minor, missing, trend, drift, break | >90 | >92 | – | >93 |
| [34] | Suspension | GPS | Miss, outlier, drift, trend | 88.91 | 95.40 | 0.92 | 98.26 |
| [35] | Long-span cable-stayed | Cable tension | Outlier | 95.68 | 92.01 | 0.9381 | 99.98 |
| [37] | Cable-stayed | Acceleration | Missing, minor, outlier, square, trend, drift | >70 | >85 | >0.77 | 97.60 |
| [38] | Long-span cable-stayed | Acceleration | Abnormal data | 97.93 | 97.13 | 0.9753 | 99.15 |
| [39] | Twin-box girder | Acceleration | Outlier | >95 | >96 | >0.96 | >99 |
| [27] | General bridge | Acceleration | Missing, minor, outlier, square, trend, drift | >72 | >85 | – | 94.26 |
Table 11.
2D Image-Based SHM Anomaly Detection
| Ref. | Bridge | Sensor | Anomaly Type | Prec. (%) | Rec. (%) | F1 | Acc. (%) |
|---|---|---|---|---|---|---|---|
| [41] | General bridge | Acceleration | FDC, drift, trend, square, missing | >84 | >92 | 0.94 | >96 |
| [42] | Cable-stayed | Acceleration | TFC, drift, trend, square, minor, missing | >84 | >94 | 0.97 | 97.1 |
| [30] | Cable-stayed | Acceleration | Missing, minor, outlier, square, trend, drift | >92 | >92 | – | >96 |
| [31] | Cable-stayed | Acceleration | Missing, minor, outlier, square, trend, drift | – | – | – | 97.0 |
| [32] | Cable-stayed | Acceleration | Missing, minor, outlier, square, trend, drift | 95 | 95 | – | 98.3 |
| [33] | Cable-stayed | Acceleration | Missing, minor, outlier, square, trend, drift | – | – | 0.94 | 98.2 |
| [43] | Cable-stayed | Acceleration | Missing, minor, outlier, square, trend, drift | >85 | >73 | >0.82 | 97.74 |
| [44] | Cable-stayed | Acceleration | Spikes, trend, shift, linear drift, constant | – | – | – | >94 |
| [49] | Railway bridge | Acceleration | Missing, baseline drift, constant, amplitude | >85.48 | >68.18 | 0.76 | 98.94 |
| [51] | Cable-stayed | Acceleration | Local gain, missing, outlier, drift | – | >95 | – | 99.1 |
| [53] | Long-span | Multi-sensor | Missing, outlier, minor, trend, square, drift | 93.76 | >89.9 | 0.94 | 93.28 |
| [54] | Cable-stayed | Acceleration | Drift, local gain, missing, noise, outlier | 95 | 95 | 0.95 | 96.8 |
| [55] | Long-span | Acceleration | Missing, minor, outlier, square, trend, drift | 78.66 | 85.5 | – | 95.0 |
Table 12.
Other Input-Class-Based SHM Methods: Bridge Types, Sensor Modalities, Fault Categories, and Detection Performance. Abbreviations: Prec. = Precision, Rec. = Recall, F1 = F1-score, Acc. = Accuracy
Table 12.
Other Input-Class-Based SHM Methods: Bridge Types, Sensor Modalities, Fault Categories, and Detection Performance. Abbreviations: Prec. = Precision, Rec. = Recall, F1 = F1-score, Acc. = Accuracy
| Ref. | Bridge Type | Sensor Data | Anomaly Type | Prec. (%) | Rec. (%) | F1 | Acc. (%) |
|---|---|---|---|---|---|---|---|
| [45] | Cable-stayed (long-span) | Acceleration | Missing, minor, outlier, square, trend, drift | – | – | – | 97.5 |
| [46] | Arch, Cable-stayed | Acceleration | Missing, minor, biased, outlier, noise | 88.29 | 81.54 | 0.84 | 99.39 |
| [16] | Cable-stayed (long-span) | Acceleration | Missing, minor, outlier, square, trend, drift | 90.5 | 88.07 | – | 97.0 |
| [47] | Cable-stayed (long-span) | Acceleration | Normal, missing, minor, biased, outlier, noise | >97 | >97 | >0.97 | 99.45 |
| [48] | Cable-stayed (long-span) | Acceleration | Missing, minor, outlier, square, drift, trend | 90.67 | 94.24 | 0.92 | 97.95 |
| [29] | Suspension (long-span) | Acceleration | Outlier, square, missing, minor | >96 | >96 | >0.96 | 97.87 |
| [50] | Box girder | Strain, displacement, vibration | Noise | 90.62 | 97.55 | 0.93 | 99.36 |
| [52] | Long-span, Footbridge | Acceleration | Missing, square, outlier, trend, jumping, spikes, minor | >99 | >99 | >0.99 | >99 |
| [56] | Box girder | Strain, displacement, vibration, temp., humidity | Outlier | 92.1 | 92.4 | 0.92 | 94.9 |
Disclaimer/Publisher’s Note: The statements, opinions and data contained in all publications are solely those of the individual author(s) and contributor(s) and not of MDPI and/or the editor(s). MDPI and/or the editor(s) disclaim responsibility for any injury to people or property resulting from any ideas, methods, instructions or products referred to in the content. |
© 2025 by the authors. Licensee MDPI, Basel, Switzerland. This article is an open access article distributed under the terms and conditions of the Creative Commons Attribution (CC BY) license (http://creativecommons.org/licenses/by/4.0/).
Copyright: This open access article is published under a Creative Commons CC BY 4.0 license, which permit the free download, distribution, and reuse, provided that the author and preprint are cited in any reuse.


