
Submitted:
18 July 2025
Posted:
21 July 2025
You are already at the latest version
Abstract
Salmonella serovar identification typically requires multiple enrichment steps using selective media, consuming considerable time and resources. This study presents a rapid, culture-independent method leveraging artificial intelligence (AI) to directly classify Salmonella serovars from high-dimensional hyperspectral microscopy data. Five serovars (Enteritidis, Infantis, Kentucky, Johannesburg, 4,[5],12:i:-) were analyzed from overnight cultures prepared on glass slides using only sterilized deionized water. Per serovar, 100 hyperspectral data cubes were collected across six biological replicates (n=500 total), yielding single-cell spectra from segmented cells and RGB composite images representing the full microscopy field. Data analysis involved two parallel branches followed by multimodal fusion. The spectral branch compared two data preprocessing approaches: manual feature selection and data-driven feature extraction via principal component analysis (PCA). Single-cell spectra were classified using k-nearest neighbors, support vector machine, random forest, and multilayer perceptron (MLP), evaluated by accuracy, precision, and recall. The image branch employed a convolutional neural network (CNN) to extract spatial features directly from microscopy images without relying on explicit morphological descriptors. PCA-derived spectral features outperformed manual selection, with MLP achieving 81.1% accuracy. Multimodal MLP-CNN fusion further improved accuracy (82.4%) while reducing overfitting. This study demonstrates that AI-enabled hyperspectral microscopy with multimodal fusion can streamline Salmonella serovar identification workflows.
Keywords:
Salmonella serovar
; hyperspectral microscopy
; artificial intelligence
; data preprocessing
; multimodal fusion
1. Introduction
Salmonella is one of the most significant foodborne pathogens, with serovars that exhibit distinct host reservoirs, pathogenicity, and epidemiological profiles, making accurate serovar-level discrimination essential [1,2]. The current standard for detection and identification of Salmonella serovars in food relies on a multi-step culture-based method outlined in regulatory guidelines such as the Food and Drug Administration (FDA) Bacteriological Analytical Manual (BAM). This method involves an initial 24-h non-selective pre-enrichment, followed by a 24-h selective enrichment, and subsequent isolation on selective agar media for an additional 24–48 h. Confirmatory serotyping via slide agglutination using O and H antigen-specific antisera (the Kauffmann-White scheme) further extends the identification process by 2–3 days to the result [3,4,5]. Efforts to reduce the overall processing times have led to the development of rapid molecular detection methods, which partially minimize the need for selective enrichment [6,7,8]. However, these methods still require initial enrichment step, may detect non-viable cells, and continue to necessitate pure isolates for definitive serovar identification [5]. Additionally, robust data analysis often involves specialized domain expertise and skilled personnel. Therefore, there remains an unmet need for a rapid one-step method capable of simultaneously detecting and identifying viable Salmonella serovars without extensive enrichment, thereby complementing and enhancing rapid screening approaches.
To address these unmet needs, recent advancements in optical imaging and artificial intelligence (AI) present promising solutions. Optical imaging techniques that leverage intrinsic bacterial characteristics, such as scattering patterns, autofluorescence, and refractive index, allow for label-free analysis, minimizing extensive sample preparation and reducing dependence on selective enrichment process [9,10,11]. Similarly, classical microscopy-based approaches have been enhanced by image processing algorithms that differentiate bacterial species based on observable parameters such as shape, size, and refractive index [12]. More recently, incorporating deep convolutional neural networks (CNNs) further accelerated the analysis of high-resolution image data by leveraging convolutional filters to extract fine-grained image-based features and hierarchical relationships, thus enabling simultaneous detection and identification of viable bacteria [13,14]. The integration of AI models underscores the value of spatial relationships within image data, highlighting hidden yet informative patterns that can enhance rapid classification of pathogens.
Hyperspectral microscopy provides an advanced optical imaging by capturing high-dimensional data across a broader electromagnetic spectrum, significantly enhancing pathogen classification capabilities. This non-invasive technique utilizes intrinsic bacterial light-scattering fingerprints, offering detailed insights into biochemical, metabolic, and structural properties beyond basic cellular morphology [15]. Historically, hyperspectral microscopy applications primarily focused on spectral data for pathogen classification, using image-based data mainly for identifying cellular regions of interest (ROIs) [15,16,17]. These studies employed various data preprocessing methods, followed by comparative evaluations of traditional machine learning classifiers, such as random forest (RF), support vector machine (SVM), and k-nearest neighbors (k-NN), to determine optimal algorithm. Early studies demonstrated successful differentiation of closely related Salmonella serovars [18,19], yet their emphasis on model optimization, rather than end-to-end automation, necessitated manual preprocessing steps for data quality and interpretation. More recent advancements in AI-enabled hyperspectral microscopy have effectively integrated spatial features through CNNs, enabling automated feature extraction and hierarchical modeling. These improvements have enhanced classification accuracy at the species level [20] and facilitated discrimination of physiological states such as viability [21] or stress responses [22]. Furthermore, some of these studies have shown that multimodal fusion of spectral and spatial data (e.g., morphology descriptors) improves classification performance. Given these promising advancements in other pathogens, applying multimodal fusion specifically to Salmonella serovar classification represents a critical next step toward achieving rapid, accurate, and generalizable serovar-level identification.
Thus, this study introduces a rapid AI-enabled hyperspectral microscopy method for the simultaneous detection and identification of Salmonella serovars with enhanced generalizability. The objectives of this study are to i) develop a rapid serovar classification approach requiring minimal sample preparation without enrichment, ii) compare manual feature selection and data-driven feature extraction approaches to optimize spectral data preprocessing, and iii) evaluate multimodal fusion of spectral and image-based features to enhance classification accuracy and reduce overfitting. As illustrated in Figure 1, our AI-enabled hyperspectral microscopy method addresses these objectives by directly analyzing fresh overnight cultures of five Salmonella serovars (Kentucky, Infantis, Enteritidis, 4,[5],12:i:-, and Johannesburg), without prolonged enrichment and extensive reagents. To leverage the rich information present in hyperspectral data cubes, the analysis employed two parallel branches: a spectral branch and an image-based branch. Within the spectral branch, single-cell spectra derived from segmented cells were preprocessed using manual feature selection or data-driven feature extraction approaches, followed by traditional machine learning algorithms to determine the optimal combination of preprocessing method and classification algorithm. In the image branch, microscopy images (i.e., RGB composites representing the full microscopy field) were analyzed using a CNN architecture. Outputs from both branches were then integrated using prediction-level multimodal fusion. Overall, this study not only accelerates serovar-level detection and identification but also establishes the groundwork for automated end-to-end pathogen classification, significantly enhancing food safety monitoring and enabling timely interventions.
2. Materials and Methods
The Materials and Methods should be described with sufficient details to allow others to replicate and build on the published results. Please note that the publication of your manuscript implicates that you must make all materials, data, computer code, and protocols associated with the publication available to readers. Please disclose at the submission stage any
2.1. Data Acquisition
2.1.1. Bacterial Strains and Sample Preparation
In this study, a total of five Salmonella serovars (Enteritidis, Infantis, Kentucky, Johannesburg, and 4,[5],12:i:-) were selected due to their critical roles in food safety and public health and obtained from the Food Safety Laboratory at Cornell University. The Salmonella stock cultures were maintained at 4°C on LB Lennox agar plates (Thermo Fisher, Waltham, MA, USA). Fresh cultures for data collection were inoculated into 9 mL of tryptic soy broth (Difco, BD, Sparks, MD, USA) supplemented with 0.6% (w/v) yeast extract (Difco, BD) and incubated at 37°C for 16 h. Cells in the logarithmic phase were harvested by centrifugation at 4,450 rpm for 15 min at 4°C (SYTO 9, SLA-1500, Hampton, NH, USA). The final pellet was suspended in sterile de-ionized (DI) water for a final concentration of 105 CFU/mL for hyperspectral microscopy image acquisition. Microscope slides of bacterial cells were prepared following a modified version of a previously published method [22]. For each serovar, 2 µL of bacterial suspension was deposited onto a sterile glass microscope slide and air dried for 15 min at 23°C with an average relative humidity of 43% in a fume hood. After 15 min, 1 µL of sterile DI water was added to affix a plastic coverslip, securing the cells in place, as depicted in Figure 2.
2.1.2. Hyperspectral Microscopy and Data Consistency Check
Hyperspectral microscopy data collection was conducted for all five serovars following our previously published method [22]. A total of 500 hyperspectral data cubes (100 for each serovar) were acquired using an Olympus BX43 upright optical microscope (Evident Scientific, Waltham, MA, USA) equipped with CytoViva patented enhanced darkfield illumination optics, a tungsten halogen lamp (CytoViva, Auburn, AL, USA), and a HinaLea 4250 hyperspectral camera (HinaLea, Emeryville, CA, USA). The spatial resolution of the imaging system was 1936 × 1216 pixels, covering a spectral range of 399–1,000 nm with 303 spectral wavebands with 2-nm bandwidth. Data collection was performed using a 100× oil immersion objective lens (Olympus UPLFLN 100×), with an exposure time of 200 ms and a gain setting of 16 dB that were obtained by preliminary experiments for optimizing high quality of hyperspectral data cubes.
For each data collection session, three subcultures per serovar were incubated across two independent sessions to yield a total of six biological replicates. Each subculture was allocated 3 microscope slides for data collection, serving as technical replicates. For each technical replicate, 6 distinct fields of view (FOV) were imaged per microscope slide, with careful selection to prevent overlapping cells. This approach yielded a total of 500 hyperspectral data cubes (100 per serovar) for further analysis. Raw hyperspectral data were analyzed with the ENVI software (version 6.0, NV5 Geospatial) to ensure consistency between the dataset within each serovar.
2.2. Data Preprocessing and Spectral Feature Engineering
After confirming data consistency, raw hyperspectral data were processed following the workflow illustrated in Figure 1. The dataset was initially partitioned into training (70%) and testing sets (30%) (fixed random state = 42 for replication) to prevent data leakage during preprocessing and ensure reproducibility. Spectral information from bacterial cells were obtained following previously published methods. Briefly, automated segmentation of single-cell regions of interest (ROIs) was performed using attention-gated residual U-Net (ARG2U-Net) [23] to derive mean single-cell spectra. The resulting spectra were then transformed using standard normal variate (SNV) to remove baseline effects caused by imaging conditions [24].
These mean spectra served as inputs in the spectral branch for subsequent comparisons between two feature engineering approaches: i) manual feature selection and ii) data-driven feature extraction. For manual feature selection, three characteristic wavebands corresponding to the most intense regions near the red, green, and blue ranges across all serovars were manually selected, following the methods in our previous study [22]. For data-driven feature extraction, principal component analysis (PCA) was applied to the training set to reduce dimensionality by capturing the most informative linear combinations across all wavebands, as opposed to manually selecting only three wavebands. PCA was implemented using the singular value decomposition function from the Python library NumPy. Before PCA, the training data were mean-centered, and the same mean value was used for test data transformation. The number of principal components (PCs) was chosen to retain 99% of the original variance, ensuring minimal information loss and data redundancy. The PCA transformation was fitted exclusively on the training set and subsequently applied to the test set.
2.3. Machine Learning Models for Spectral Branch
2.3.1. Model Architectures
Four supervised machine learning algorithms were implemented in the spectral branch using Python scikit-learn library to determine the best performing model for Salmonella serovar classification. These included three traditional machine learning models widely used in food safety research, k-NN, RF, and SVM [16,25,26,27,28,29,30,31], as well as a shallow multilayer perceptron (MLP) model. k-NN uses a distance-based metric to classify data points based on their nearest neighbors. RF employs an ensemble approach, combining multiple decision trees to improve classification accuracy and reduce overfitting. SVM classifies samples by identifying an optimal hyperplane to maximize the margin between different classes in feature space. The shallow MLP model was designed to include one hidden layer containing 100 neurons with a rectified linear unit (ReLU) activation function to introduce non-linearity, followed by a linear output layer.
2.3.2. Model Training
All machine learning models were trained using the PyTorch library for Python [32]. Hyperparameter tuning for each model was performed via grid search and 10-fold cross-validation. For k-NN, hyperparameter tuning optimized the number of neighbors (k), leaf size, and distance metric (p), with a search space including k values from 1 to 4, leaf sizes from 1 to 50, and distance metrics of 1 and 2. For RF, hyperparameters optimized included tree depth, minimum samples per split, minimum samples per leaf, and the number of features considered for splitting. The search space included maximum depths of 10, 25, or unlimited, minimum samples per split (5, 7), and leaf sizes (3, 5), with the number of estimators fixed at 100. SVM was optimized with a search space that included a fixed regularization parameter (C = 1), a radial basis function kernel, and polynomial kernel degrees of 3 and 4. Model selection was based on classification accuracy. MLP was trained for 200 epochs using the Adam optimizer (initial learning rate = 0.001) and cross-entropy loss.
2.4. Multimodal Spectral-Spatial Fusion
2.4.1. CNN for Image Branch
In the image branch, microscopy images (i.e., RGB composites representing the full microscopy field) were analyzed using a CNN to capture spatial context without relying on predefined morphological descriptors. The microscopy images were created by combining data points at wavelengths of 620 nm (red), 550 nm (green), and 450 nm (blue). Building on our previously published method [22], a modified EfficientNetV2 architecture was trained using the PyTorch Lightning deep learning framework [33]. Various combinations of standard augmentation strategies from the Albumentations library [34] were applied to enhance model robustness. The pretrained EfficientNetV2 variant (`efficientnetv2_rw_s`) was fine-tuned on the training dataset with a total batch size of 16, using a cross-entropy loss function. Optimization was performed using the AdamW optimizer with an initial learning rate of 0.0001 and a weight decay of 0.001, while a step-based learning rate scheduler reduced the learning rate by a factor of 0.3 every 10 epochs. To mitigate overfitting, early stopping was implemented based on validation loss monitored throughout each epoch.
2.4.2. Fusion of Spectral and Image-Based Prediction Outputs
The multimodal fusion model concatenated prediction-level outputs from the best-performing spectral machine learning model and the CNN image classification model, as shown in Figure 1. Note that the output dimensions from the spectral and image branches differ, as EfficientNetV2 typically outputs a prediction vector matching the number of classes (5 serovars in this case), whereas the spectral branch outputs a vector of length 32. Thus, we modified the EfficientNetV2 model to output a length-32 feature vector that can be concatenated with the output of the spectral branch. The resulting spectral-spatial fused vector had a length of 64. This vector was then fed into the final classifier head, a feed-forward neural network consisting of one hidden layer with 64 neurons, followed by an output layer with 5 neurons corresponding to the number of Salmonella serovar classes. The fusion model was trained for 50 epochs using an AdamW optimizer, with different learning rates for the image (0.0001) and spectral (0.0001) branches and the fusion classifier head (0.001) to balance learning. The batch size, weight decay, and the remaining training procedures and hyperparameters were the same as in Section 2.4.1
2.5. Model Evaluation and Performance Metrics
Each model’s performance was assessed using classification accuracy, precision, and recall, ensuring a comprehensive evaluation. The formulas used for evaluation were as follows:
where TP, TN, FP, FN are true positive, true negative, false positive, and false negative, respectively.
3. Results
This section may be divided by subheadings. It should provide a concise and precise description of the experimental results, their interpretation, as well as the experimental conclusions that can be drawn.
3.1. Comparision of Hyperspectral Data of Salmonella serovars
The results in Figure 3 illustrate image-based and spectral data derived from the raw hyperspectral data cubes. Figure 3A shows example microscopy images of individual Salmonella cells, cropped from the full microscopy field to illustrate the representative morphology for each serovar. Spatially, bacterial cells from all serovars appear visually similar to the human eye. However, Figure 3B reveals clear spectral distinction by the mean single-cell spectra obtained from segmented bacterial cells. Each serovar shows characteristic variations in spectral intensity and peak wavelengths. Salmonella Kentucky exhibited a maximum intensity of 848 at 570 nm, Salmonella Johannesburg had a maximum intensity of 1,095 at 564 nm, Salmonella Enteritidis had a maximum intensity of 812 at 562 nm, Salmonella Infantis had a maximum intensity of 1191 at 555 nm, and Salmonella 4,[5],12:i:- had a maximum intensity of 1159 at 553 nm.
3.2. Selection of the Optimal Classification Model within the Spectral Branch
3.2.1. Influences of Manual Feature Selection and Data-Driven Feature Extraction
Global manual feature selection was performed on the mean single-cell spectra to identify characteristic wavebands useful for Salmonella serovar classification. By analyzing these spectra, three characteristic spectral wavebands at 499, 555, and 628 nm were identified. These wavebands exhibited significantly higher intensity levels compared to those typically captured by wavebands represented by standard red, green, blue channels. This observation highlights the potential importance of these specific wavebands for differentiating among Salmonella serovars. Additionally, data-driven feature extraction using PCA was performed on the single-cell spectral dataset. It was found that retaining 18 principal components (PCs) was sufficient to explain 99% of the total data variance. By selecting these 18 PCs, dimensionality was effectively reduced without loss of critical information needed for accurate classification.
3.2.2. Performance Comparison of Machine Learning Models Using Spectral Features
To identify the best-preforming model within the spectral branch, the classification performance of machine learning algorithms was compared using both manually selected spectral wavebands and PCA-derived spectral features. Table 1 summarizes the classification accuracies obtained from each approach. When employing the three manually selected wavebands, classification accuracies on the test sets (n=150) for k-NN, SVM, RF, and MLP were 60.1%, 54.1%, 59.5%, and 62.2%, respectively, with corresponding precision values of 60.1%, 56.0%, 58.8%, and 62.1%, and recall values of 60.1%, 54.1%, 59.5%, and 62.2%. In contrast, the use of 18 PCA-derived spectral features, which captured 99% of the total data variance, substantially improved the performance of all models. Specifically, test-set classification accuracies increased to 73.7%, 75.0%, 77.7%, and 81.1%, for k-NN, SVM, RF, and MLP, respectively, along with improved precision values of 74.2%, 76.3%, 78.6%, and 81.1%, and recall values of 73.7%, 75.0%, 77.7%, and 81.1%, respectively.
3.3. Multimodal Classification by Fusion of Spectral and Image-Based Features
The multimodal fusion model demonstrated superior classification performance compared to the standalone spectral and image-based models (Table 2). Specifically, the multimodal approach achieved a test-set classification accuracy of 82.4%, precision of 82.4%, and recall of 82.4%, surpassing the standalone image classification model (i.e., EfficientNetV2) accuracy, precision, and recall of 66.4% obtained from microscopy images, as well as the best-performing standalone spectral model (i.e., PCA-MLP) accuracy of 81.1%. By integrating spectral and image-based features, the multimodal fusion reduced classification ambiguity, especially among serovars with overlapping spatial characteristics or subtle biochemical differences. Additionally, multimodal fusion substantially reduced overfitting observed in standalone models, narrowing the performance gap between training and test datasets (e.g., accuracy gap reduced from spectral-only model: 99.4% train vs. 81.1% test, to multimodal model: 93.6% train vs. 82.4% test). This demonstrates improved generalization and highlights the advantage of combining complementary spectral and image-based features.
Serovar-specific classification performance is further illustrated in Figure 4. The multimodal model performed particularly well for the serovar 4,[5],12:i:-, achieving the highest classification accuracy of 97%. The lowest accuracy was observed for Infantis (73%), which was commonly misclassified as Johannesburg. Enteritidis (81%) and Johannesburg (82%) showed strong classification results with minimal confusion. Kentucky achieved moderate accuracy (79%) but showed occasional misclassification with Enteritidis. These serovar-specific patterns emphasize the model's strength as well as highlight areas requiring further refinement.
4. Discussion
4.1. Hyperspectral Microscopy Captures Intrinsic Differences Among Salmonella serovars
Hyperspectral microscopy in this study enabled a comprehensive spectral and image-based characterization of Salmonella serovars by simultaneously capturing spectral signatures and pixel-level spatial information at the single-cell level. The mean single-cell spectral profiles exhibited distinct intensity patterns for each serovar (Figure 3), despite relatively small variability compared to the spectral differences reported across bacterial species or viability states in previous studies [21,22]. This limited inter-serovar variation reflects phenotypic similarities yet reveals subtle biochemical differences that can support classification. These observations align with previous studies using hyperspectral microscopy with different light sources, confirming that the captured features reflect intrinsic characteristics of Salmonella [19,35]. Eady and Park (2016b) reported three critical spectral peaks between 400–800 nm using a tungsten halogen lamp [35], which is consistent with our data (Figure 3), alongside three additional peaks at 446 nm, 555 nm, and 628 nm. These spectral differences can be attributed primarily to variations in surface components among serovars, including lipopolysaccharides, outer membrane proteins, and other envelope-associated structures [2,36]. Such molecular differences influence the way each serovar interacts with incident light, leading to distinct spectral signatures [37,38]. Additionally, the source of each serovar isolate, whether environmental, clinical, or food-related, may contribute to variations in surface chemistry and structure, thereby affecting spectral properties [39,40,41]. Follow-on studies using higher-resolution or molecularly specific techniques, such as transmission electron microscopy or Raman spectroscopy, could help validate and localize the structural differences underlying the observed spectral variations. Furthermore, expanding the spectral range to include shortwave infrared (SWIR) could potentially improve serovar discrimination by capturing biochemical constituents.
4.2. Data-Driven Feature Extraction Improves Spectral Data Representation
Our results demonstrate that data preprocessing plays a crucial role in optimizing hyperspectral microscopy data for accurate Salmonella serovar classification (Table 1). The high dimensionality of hyperspectral data introduces challenges such as noise, redundancy, and irrelevant variability, all of which can negatively impact AI model performance [30,42,43]. In our previous study, manual feature selection based on domain knowledge achieved high classification accuracy for E. coli under different physiological states [22]. However, applying this approach to serovar-level classification of Salmonella resulted in reduced performance (Table 1). This decline may be attributed to the heuristic selection of only three wavebands, which may have excluded subtle yet informative spectral cues critical for distinguishing among serovars. While manual feature selection offers advantages in computational efficiency and data storage, it introduces subjective bias and risks omitting spectral regions that, though individually weak, contribute collectively to classification performance. This can result in the loss of spectral richness necessary for fine-scale discrimination.
In contrast, data-driven feature extraction using PCA substantially improved model performance (Table 1). PCA transforms hyperspectral data by projecting them onto orthogonal components, yielding a reduced set of uncorrelated features that retain the most informative variance. This transformation not only reduces dimensionality but also enables downstream models to focus on latent spectral patterns that may not be apparent through manual selection based on individual wavebands [44]. The superior performance of PCA-preprocessed data highlights the effectiveness of data-driven feature extraction in preserving subtle and distributed spectral information critical for serovar-level discrimination. Supporting this observation, a previous study using multivariate data analysis of Salmonella serovars reported classification accuracies above 90% when PCA was applied to mean single-cell spectra [18]. While that study relied on traditional statistical modeling, our results extend these findings by demonstrating the value of PCA as a preprocessing step within AI-enabled classification frameworks. These results underscore the effectiveness of unsupervised data-driven approaches in capturing the spectral complexity required for high-resolution microbial classification.
These findings are consistent with other strategies designed to manage high dimensionality of both micro- and macroscale hyperspectral data. For instance, one study reported improved classification performance and reduced computation time when using PCA-guided waveband selection [45]. Moreover, Tanskin et al. (2017) proposed a data processing approach that combined dimensionality reduction with hierarchical function decomposition, which outperformed conventional feature selection methods [46]. These examples reinforce a broader conclusion observed across the literature that analytical decisions during preprocessing directly impact model outcomes. Improper preprocessing can introduce artifacts or remove biologically meaningful information [47], and variations in steps like normalization, noise reduction, and baseline correction significantly influence downstream classification performance [48]. Therefore, selecting appropriate preprocessing methods is essential to ensure that results reflect true biological variation rather than artifacts of data handling.
4.3. Multimodal Fusion of Spectral and Image-Based Features Enhances Classification and Mitigates Overfitting
The enhanced performance of the multimodal fusion model highlights the value of integrating multiple feature types derived from hyperspectral microscopy (Table 2). Combining spectral and image-based modalities is particularly advantageous for classifying microorganisms with low interclass variability [49]. Spectral data, which capture how samples scatter light across a wide range of wavebands, encode information related to biochemical compositions [18,19]. These signatures are especially useful for differentiating Salmonella serovars that may exhibit similar morphology but differ in molecular characteristics. As such, spectral features alone can provide strong biochemical fingerprints for classification tasks [50,51]. However, image-based features add complementary value to spectral signatures. As a type of spatial information, these features capture structural patterns directly observable within hyperspectral data cubes at the single-cell level. In our study, spectral and image-based feature vectors were combined at the prediction level, enabling a more comprehensive representation of each Salmonella serovar. This multimodal integration improved classification accuracy from 57.3% (image-based only) and 81.1% (spectral only) to 82.4%, while also mitigating overfitting, as indicated by the reduced gap between training and test performance metrics (Table 2). However, classification performance varied by serovar (Figure 4), with Infantis exhibiting the lowest accuracy. This may reflect underlying biological variability, as Salmonella Infantis is known to be more adaptive to environmental stressors, potentially contributing to its phenotypic heterogeneity [52]. Such variability highlights the importance of integrating complementary data modalities to improve classification robustness.
This finding aligns with a broader body of work demonstrating that integrating spectral and spatial information can improve classification performance in hyperspectral imaging applications. A conceptually related approach combined spatial features derived from segmented cells with spectral features to classify Bacillus megaterium and Bacillus cereus, achieving classification accuracies above 95% using traditional machine learning algorithms [53]. Although this method did not employ prediction-level fusion, it demonstrates that integrating spatial and spectral features can significantly enhance classification performance. Additionally, several studies have explored CNN architectures to better exploit the rich spectral and spatial information embedded in hyperspectral imaging data [20,24,54]. One study employed feature fusion strategies to combine spectral and spatial representations extracted from hyperspectral data cubes, while another implemented prediction-level fusion by integrating morphological descriptors, single-channel images, and spectral features within a unified classification framework [20,24]. In macroscale applications, 3D CNNs have also been developed to jointly learn spatial–spectral patterns by treating hyperspectral data cubes as volumetric inputs [54]. These findings underscore the effectiveness of multimodal fusion for robust pathogen classification and support future studies aimed at enhancing generalization across diverse microbial strains and environmental contexts.
5. Conclusions
This study demonstrates a rapid Salmonella serovar classification approach that reduces the need for selective enrichment by integrating hyperspectral microscopy with AI-enabled analysis. Hyperspectral data cubes were processed to extract two complementary data types: single-cell spectral profiles obtained from segmented cells and microscopy images constructed as RGB composites of the full microscopy field. By capturing both spectral and image-based spatial features, this approach enables comprehensive characterization of serovar-level bacterial differences, leveraging both biochemical signatures and pixel-level spatial patterns. The results illustrate the critical role of data preprocessing, showing that data-driven feature extraction via PCA outperforms manual feature selection by effectively preserving informative spectral variance while reducing data dimensionality. Furthermore, the image branch employed a CNN to learn spatial features directly from images, without relying on explicit morphological descriptors. The multimodal fusion of spectral and image-based features not only enhanced classification performance but also mitigated overfitting, ensuring robust and generalizable serovar classification. Overall, these results highlight the potential of AI-enabled hyperspectral microscopy as a rapid, culture-independent solution for pathogen identification and food safety monitoring.
Author Contributions
Conceptualization, J.Y.; Methodology, M.P., B.P., and J.Y.; Software, M.P., S.B., B.P., and J.Y.; Formal analysis, M.P.; Investigation, M.P.; Resources, B.P. and J.Y.; Data curation, M.P.; Writing – original draft, M.P.; Writing – review and editing, M.P., S.B., B.P., and J.Y.; Visualization, M.P. and S.B.; Supervision, J.Y.; Project administration, J.Y.; Funding acquisition, J.Y. All authors have read and agreed to the published version of the manuscript.
Funding
This work was supported by MSU Startup Funds and USDA ARS Research Support Agreement (No. 58-6040-3-017 and 58-6040-4-041). Any opinion, findings, conclusion, or recommendations expressed in this paper are those of the author(s) and do not necessarily reflect the view of USDA.
Data Availability Statement
The code and data will be made available in a public repository at https://github.com/food-ai-engineering-lab upon publication. Future updates will be integrated into this repository.
Acknowledgments
The authors thank Dr. Teresa M. Bergholz for providing the Salmonella strains used in this study.
Conflicts of Interest
The authors declare no conflicts of interest.
Abbreviations
The following abbreviations are used in this manuscript:
| AI | Artificial Intelligence |
| PCA | Principle Component Analysis |
| MLP | Multilayer Perceptron |
| CNN | Convolutional Neural Network |
| FDA | Food and Drug Administration |
| BAM | Bacteriological Analytical Manual |
| ROI | Regions of Interest |
| RF | Random Forest |
| SVM | Support Vector Machine |
| k-NN | k-Nearest Neighbors |
| DI | De-Ionized |
| FOV | Field of View |
| SNV | Standard Normal Variate |
| PC | Principal Component |
| ReLU | Rectified Linear Unit |
| TP | True Positive |
| TN | True Negative |
| FP | False Positive |
| FN | False Negative |
| STD | Standard Deviation |
References
- Bell, R. L.; Jarvis, K. G.; Ottesen, A. R.; McFarland, M. A.; Brown, E. W. Recent and emerging innovations in Salmonella detection: a food and environmental perspective. Microb. Biotechnol. 2016, 9, 279–292. [Google Scholar] [CrossRef] [PubMed]
- Centers for Disease Control and Prevention (CDC). About Salmonella Infection. Available online: https://www.cdc.gov/salmonella/about/index.html (accessed on 25 Jun 2025).
- Daquigan, N.; Grim, C. J.; White, J. R.; Hanes, D. E.; Jarvis, K. G. Early Recovery of Salmonella from Food Using a 6-Hour Non-selective Pre-enrichment and Reformulation of Tetrathionate Broth. Front. Microbiol. 2016, 7, 2103. [Google Scholar] [CrossRef] [PubMed]
- Andrews, W. H.; H. Wang, A. Jacobson, T. Hammack. Bacteriological Analytical Manual (BAM) Chapter 5: Salmonella. Available online: https://www.fda.gov/food/laboratory-methods-food/bam-chapter-5-salmonella (accessed on 25 Jun 2025).
- Patel, A.; Wolfram, A.; Desin, T. S. Advancements in Detection Methods for Salmonella in Food: A Comprehensive Review. Pathogens 2024, 13. [Google Scholar] [CrossRef] [PubMed]
- Ranieri, M. L.; Shi, C.; Moreno Switt, A. I.; den Bakker, H. C.; Wiedmann, M. Comparison of Typing Methods with a New Procedure Based on Sequence Characterization for Salmonella Serovar Prediction. J. Clin. Microbiol. 2013, 51, 1786–1797. [Google Scholar] [CrossRef]
- Herrera-León, S.; Ramiro, R.; Arroyo, M.; Díez, R.; Usera, M. A.; Echeita, M. A. Blind comparison of traditional serotyping with three multiplex PCRs for the identification of Salmonella serotypes. Res. Microbiol. 2007, 158, 122–127. [Google Scholar] [CrossRef] [PubMed]
- Grinevich, D.; Harden, L.; Thakur, S.; Callahan, B. Serovar-level identification of bacterial foodborne pathogens from full-length 16S rRNA gene sequencing. mSystems 2024, 9. [Google Scholar] [CrossRef] [PubMed]
- Bhunia, A. K.; Singh, A. K.; Parker, K.; Applegate, B. M. Petri-plate, bacteria, and laser optical scattering sensor. Front. Cell. Infect. Microbiol. 2022, 12, 1087074. [Google Scholar] [CrossRef]
- Wang, P.; Sun, H.; Yang, W.; Fang, Y. Optical Methods for Label-Free Detection of Bacteria. Biosensors 2022, 12. [Google Scholar] [CrossRef]
- McGoverin, C.; Steed, C.; Esan, A.; Robertson, J.; Swift, S.; Vanholsbeeck, F. Optical methods for bacterial detection and characterization. APL Photonics 2021, 6. [Google Scholar] [CrossRef]
- Franco-Duarte, R.; Černáková, L.; Kadam, S.; S. Kaushik, K.; Salehi, B.; Bevilacqua, A.; Corbo, M. R.; Antolak, H.; Dybka-Stępień, K.; Leszczewicz, M.; Relison Tintino, S.; Alexandrino de Souza, V. C.; Sharifi-Rad, J.; Melo Coutinho, H. D.; Martins, N.; Rodrigues, C. F. Advances in Chemical and Biological Methods to Identify Microorganisms—From Past to Present. Microorganisms 2019, 7. [Google Scholar] [CrossRef]
- Ma, L.; Yi, J.; Wisuthiphaet, N.; Earles, M.; Nitin, N. Accelerating the Detection of Bacteria in Food Using Artificial Intelligence and Optical Imaging. Appl. Environ. Microbiol. 2022, 89, e01828–22. [Google Scholar] [CrossRef]
- Yi, J.; Wisuthiphaet, N.; Raja, P.; Nitin, N.; Earles, J. M. AI-enabled biosensing for rapid pathogen detection: From liquid food to agricultural water. Water Res. 2023, 242, 120258. [Google Scholar] [CrossRef]
- Kang, R.; Park, B.; Chen, K. Identifying non-O157 Shiga toxin-producing Escherichia coli (STEC) using deep learning methods with hyperspectral microscope images. Spectrochimica Acta Part A: Mol. Biomol. Spectrosc. 7386. [Google Scholar] [CrossRef]
- Wu, C.; Xie, Y.; Xi, Q.; Han, X.; Li, Z.; Li, G.; Zhao, J.; Liu, M. Rapid and high accurate identification of Escherichia coli active and inactivated state by hyperspectral microscope imaging combing with machine learning algorithm. Vib. Spectrosc. 2024, 130, 103645. [Google Scholar] [CrossRef]
- Zhu, H.; Luo, J.; Liao, J.; He, S. High-accuracy Rapid Identification and Classification of Mixed Bacteria Using Hyperspectral Transmission Microscopic Imaging and Machine Learning. Prog. Electromagn. Res. 2023, 178, 49–62. [Google Scholar] [CrossRef]
- Eady, M.; Park, B.; Choi, S. Rapid and Early Detection of Salmonella Serotypes with Hyperspectral Microscopy and Multivariate Data Analysis. J. Food Prot. 2015, 78, 668–674. [Google Scholar] [CrossRef]
- Eady, M.; Park, B. Classification of Salmonella enterica serotypes with selective bands using visible/NIR hyperspectral microscope images. J. Microsc. 263, 10–19. [CrossRef]
- Tao, C.; Du, J.; Wang, J.; Hu, B.; Zhang, Z. Rapid Identification of Infectious Pathogens at the Single-Cell Level via Combining Hyperspectral Microscopic Images and Deep Learning. Cells 2023, 12. [Google Scholar] [CrossRef] [PubMed]
- Park, B.; Shin, T.; Wang, B.; McDonogh, B.; Fong, A. Classification between live and dead foodborne bacteria with hyperspectral microscope imagery and machine learning. J. Microbiol. Methods 209, 106739. [CrossRef]
- Papa, M.; Wasit, A.; Pecora, J.; Bergholz, T. M.; Yi, J. Detection of Viable but Nonculturable E. coli Induced by Low-Level Antimicrobials Using AI-Enabled Hyperspectral Microscopy. J. Food Prot. 2025, 88. [Google Scholar] [CrossRef]
- Park, B.; Shin, T.; Kang, R.; Fong, A.; McDonogh, B.; Yoon, S.-C. Automated segmentation of foodborne bacteria from chicken rinse with hyperspectral microscope imaging and deep learning methods. Comput. Electron. Agric. 208, 107802. [CrossRef]
- Kang, R.; Park, B.; Eady, M.; Ouyang, Q.; Chen, K. Single-cell classification of foodborne pathogens using hyperspectral microscope imaging coupled with deep learning frameworks. Sens. Actuators B: Chem. 1277. [Google Scholar] [CrossRef]
- Fong, A.; Shu, G.; McDonogh, B.; Park, B. Detecting foodborne pathogens with darkfield hyperspectral microscopy. Proceedings of Hyperspectral Imaging and Applications; 2020; pp. 9–16. [Google Scholar] [CrossRef]
- He, Y.; Xu, W.; Zhi, Y.; Tyagi, R.; Hu, Z.; Cao, G. Rapid bacteria identification using structured illumination microscopy and machine learning. J. Innov. Opt Health Sci. 2018, 11. [Google Scholar] [CrossRef]
- Turra, G.; Arrigoni, S.; Signoroni, A. CNN-Based Identification of Hyperspectral Bacterial Signatures for Digital Microbiology. In Proceedings of the Image Analysis and Processing-ICIAP 2017, Catania, Italy, 11–15 Sep 2017; pp. 500–510. [Google Scholar] [CrossRef]
- Seo, Y. W.; Yoon, S. C.; Park, B.; Hinton Jr, A.; Windham, W. R.; Lawrence, K. C. Development of classification models to detect Salmonella Enteritidis and Salmonella Typhimurium found in poultry carcass rinses by visible-near infrared hyperspectral imaging. In Proceedings of the Sensing for Agriculture and Food Quality and Safety V, Baltimore, MD, USA, 29 Apr–1 May 2013; pp. 70–78. [Google Scholar] [CrossRef]
- Maeda, Y.; Sugiyama, Y.; Kogiso, A.; Lim, T.-K.; Harada, M.; Yoshino, T.; Matsunaga, T.; Tanaka, T. Colony Fingerprint-Based Discrimination of Staphylococcus species with Machine Learning Approaches. Sensors 2018, 18. [Google Scholar] [CrossRef]
- Signoroni, A.; Savardi, M.; Baronio, A.; Benini, S. Deep Learning Meets Hyperspectral Image Analysis: A Multidisciplinary Review. J. Imaging 2019, 5. [Google Scholar] [CrossRef] [PubMed]
- Kang, R.; Park, B.; Ouyang, Q.; Ren, N. Rapid identification of foodborne bacteria with hyperspectral microscopic imaging and artificial intelligence classification algorithms. Food Control 2021, 130, 108379. [Google Scholar] [CrossRef]
- Paszke, A. Pytorch: An imperative style, high-performance deep learning library. arXiv preprint arXiv:1912.01703, 2019.
- Tan, M.; Le, Q. V. EfficientNetV2: Smaller Models and Faster Training. In Proceedings of the 38th International Conference on Machine Learning (ICML 2021), 18–24 Jul 2021; pp. 10096–10106. [Google Scholar]
- Buslaev, A.; Iglovikov, V. I.; Khvedchenya, E.; Parinov, A.; Druzhinin, M.; Kalinin, A. A. Albumentations: fast and flexible image augmentations. Information 2020, 11. [Google Scholar] [CrossRef]
- Eady, M. Park, B. Rapid identification of Salmonella serotypes through hyperspectral microscopy with different lighting sources. J. Spectr. Imaging 5(1), a4.
- Andino, A.; Hanning, I. Salmonella enterica: Survival, Colonization, and Virulence Differences among Serovars. Sci. World J. 2015, 2015. [Google Scholar] [CrossRef]
- Park, B.; Sundaram, J.; Hinton, A.; Yoon, S.-C.; Lawrence, K. C. Detection and Characterization of Salmonella with Hyperspectral Microscope Imaging. J. Spec. Imaging 2016, 5, 1–6. [Google Scholar]
- Zheng, S.; Bawazir, M.; Dhall, A.; Kim, H.-E.; He, L.; Heo, J.; Hwang, G. Implication of Surface Properties, Bacterial Motility, and Hydrodynamic Conditions on Bacterial Surface Sensing and Their Initial Adhesion. Front. Bioeng. Biotechnol. 2021, 9, 643722. [Google Scholar] [CrossRef]
- Buncic, S.; Avery, S. M.; Rocourt, J.; Dimitrijevic, M. Can food-related environmental factors induce different behaviour in two key serovars, 4b and 1/2a, of Listeria monocytogenes? Int. J. Food Microbiol. 2001, 65, 201–212. [Google Scholar] [CrossRef]
- Ferrari, R. G.; Rosario, D. K. A.; Cunha-Neto, A.; Mano, S. B.; Figueiredo, E. E. S.; Conte-Junior, C. A. Worldwide Epidemiology of Salmonella Serovars in Animal-Based Foods: A Meta-analysis. Appl. Environ. Microbiol. 2019, 85, e00591–19. [Google Scholar] [CrossRef]
- Khan, H. A.; Neyaz, L. A.; Malak, H. A.; Alshehri, W. A.; Elbanna, K.; Organji, S. R.; Asiri, F. H.; Aldosari, M. S.; Abulreesh, H. H. Diversity and antimicrobial susceptibility patterns of clinical and environmental Salmonella enterica serovars in Western Saudi Arabia. Folia Microbiol. 2024, 69, 1305–1317. [Google Scholar] [CrossRef]
- Jia, J.; Zheng, X.; Wang, Y.; Chen, Y.; Karjalainen, M.; Dong, S.; Lu, R.; Wang, J.; Hyyppä, J. The effect of artificial intelligence evolving on hyperspectral imagery with different signal-to-noise ratio, spectral and spatial resolutions. Remote Sens. Environ. 2024, 311, 114291. [Google Scholar] [CrossRef]
- Wang, Z.; Liang, S.; Xu, L.; Song, W.; Wang, D.; Huang, D. Dimensionality reduction method for hyperspectral image analysis based on rough set theory. Eur. J. Remote Sens. 2020, 53, 192–200. [Google Scholar] [CrossRef]
- Han, Y.; Joe, I. Enhancing Machine Learning Models Through PCA, SMOTE-ENN, and Stochastic Weighted Averaging. Appl. Sci. 2024, 14. [Google Scholar] [CrossRef]
- Rodarmel, C.; Shan, J. Principal Component Analysis for Hyperspectral Image Classification. Surv. Land. Inf. Sci. 62, 115–122.
- Taşkın, G.; Kaya, H.; Bruzzone, L. Feature Selection Based on High Dimensional Model Representation for Hyperspectral Images. IEEE Trans. Image Process. 2017, 26, 2918–2928. [Google Scholar] [CrossRef]
- Cozzolino, D.; Williams, P. J.; Hoffman, L. C. An overview of pre-processing methods available for hyperspectral imaging applications. Microchem. J. 2023, 193, 109129. [Google Scholar] [CrossRef]
- Gould, E.; Fraser, H. S.; Parker, T. H.; Nakagawa, S.; Griffith, S. C.; Vesk, P. A.; Fidler, F.; Hamilton, D. G.; Abbey-Lee, R. N.; Abbott, J. K.; Aguirre, L. A.; Alcaraz, C.; Aloni, I.; Altschul, D.; Arekar, K.; Atkins, J. W.; Atkinson, J.; Baker, C. M.; Barrett, M.; … Whelan, S. Same data, different analysts: Variation in effect sizes due to analytical decisions in ecology and evolutionary biology. BMC Biol. 2025, 23. [Google Scholar] [CrossRef]
- Matenda, R. T.; Rip, D.; Marais, J.; Williams, P. J. Exploring the potential of hyperspectral imaging for microbial assessment of meat: A review. Spectrochimica Acta Part A: Mol. Biomol. Spectrosc. 2024, 315, 124261. [Google Scholar] [CrossRef]
- Imani, M.; Ghassemian, H. An overview on spectral and spatial information fusion for hyperspectral image classification: Current trends and challenges. Inf. Fusion 2020, 59, 59–83. [Google Scholar] [CrossRef]
- Li, N.; Wang, Z.; Cheikh, F. A. Discriminating Spectral–Spatial Feature Extraction for Hyperspectral Image Classification: A Review. Sensors 2024, 24. [Google Scholar] [CrossRef] [PubMed]
- Krüger, G. I.; Pardo-Esté, C.; Álvarez, J.; Pacheco, N.; Castro-Severyn, J.; Alvarez-Thon, L.; Saavedra, C. P. Adaptive signatures of emerging Salmonella serotypes in response to stressful conditions in the poultry industry. LWT 2025, 215, 117188. [Google Scholar] [CrossRef]
- Liu, K.; Ke, Z.; Chen, P.; Zhu, S.; Yin, H.; Li, Z.; Chen, Z. Classification of two species of Gram-positive bacteria through hyperspectral microscopy coupled with machine learning. Biomed. Opt. Express 2021, 12, 7906–7916. [Google Scholar] [CrossRef]
- Praveen, B.; Menon, V. Study of Spatial–Spectral Feature Extraction Frameworks With 3-D Convolutional Neural Network for Robust Hyperspectral Imagery Classification. IEEE J. Sel. Top. Appl. Earth Obs. Remote Sens. 2021, 14, 1717–1727. [Google Scholar] [CrossRef]
Figure 1.
Overall workflow of hyperspectral data collection, preprocessing, and classification. k-NN: k-nearest neighbors. RF: Random Forest. SVM: Support vector machine. MLP: Multilayer perceptron. CNN: Convolutional neural network.
Figure 1.
Overall workflow of hyperspectral data collection, preprocessing, and classification. k-NN: k-nearest neighbors. RF: Random Forest. SVM: Support vector machine. MLP: Multilayer perceptron. CNN: Convolutional neural network.
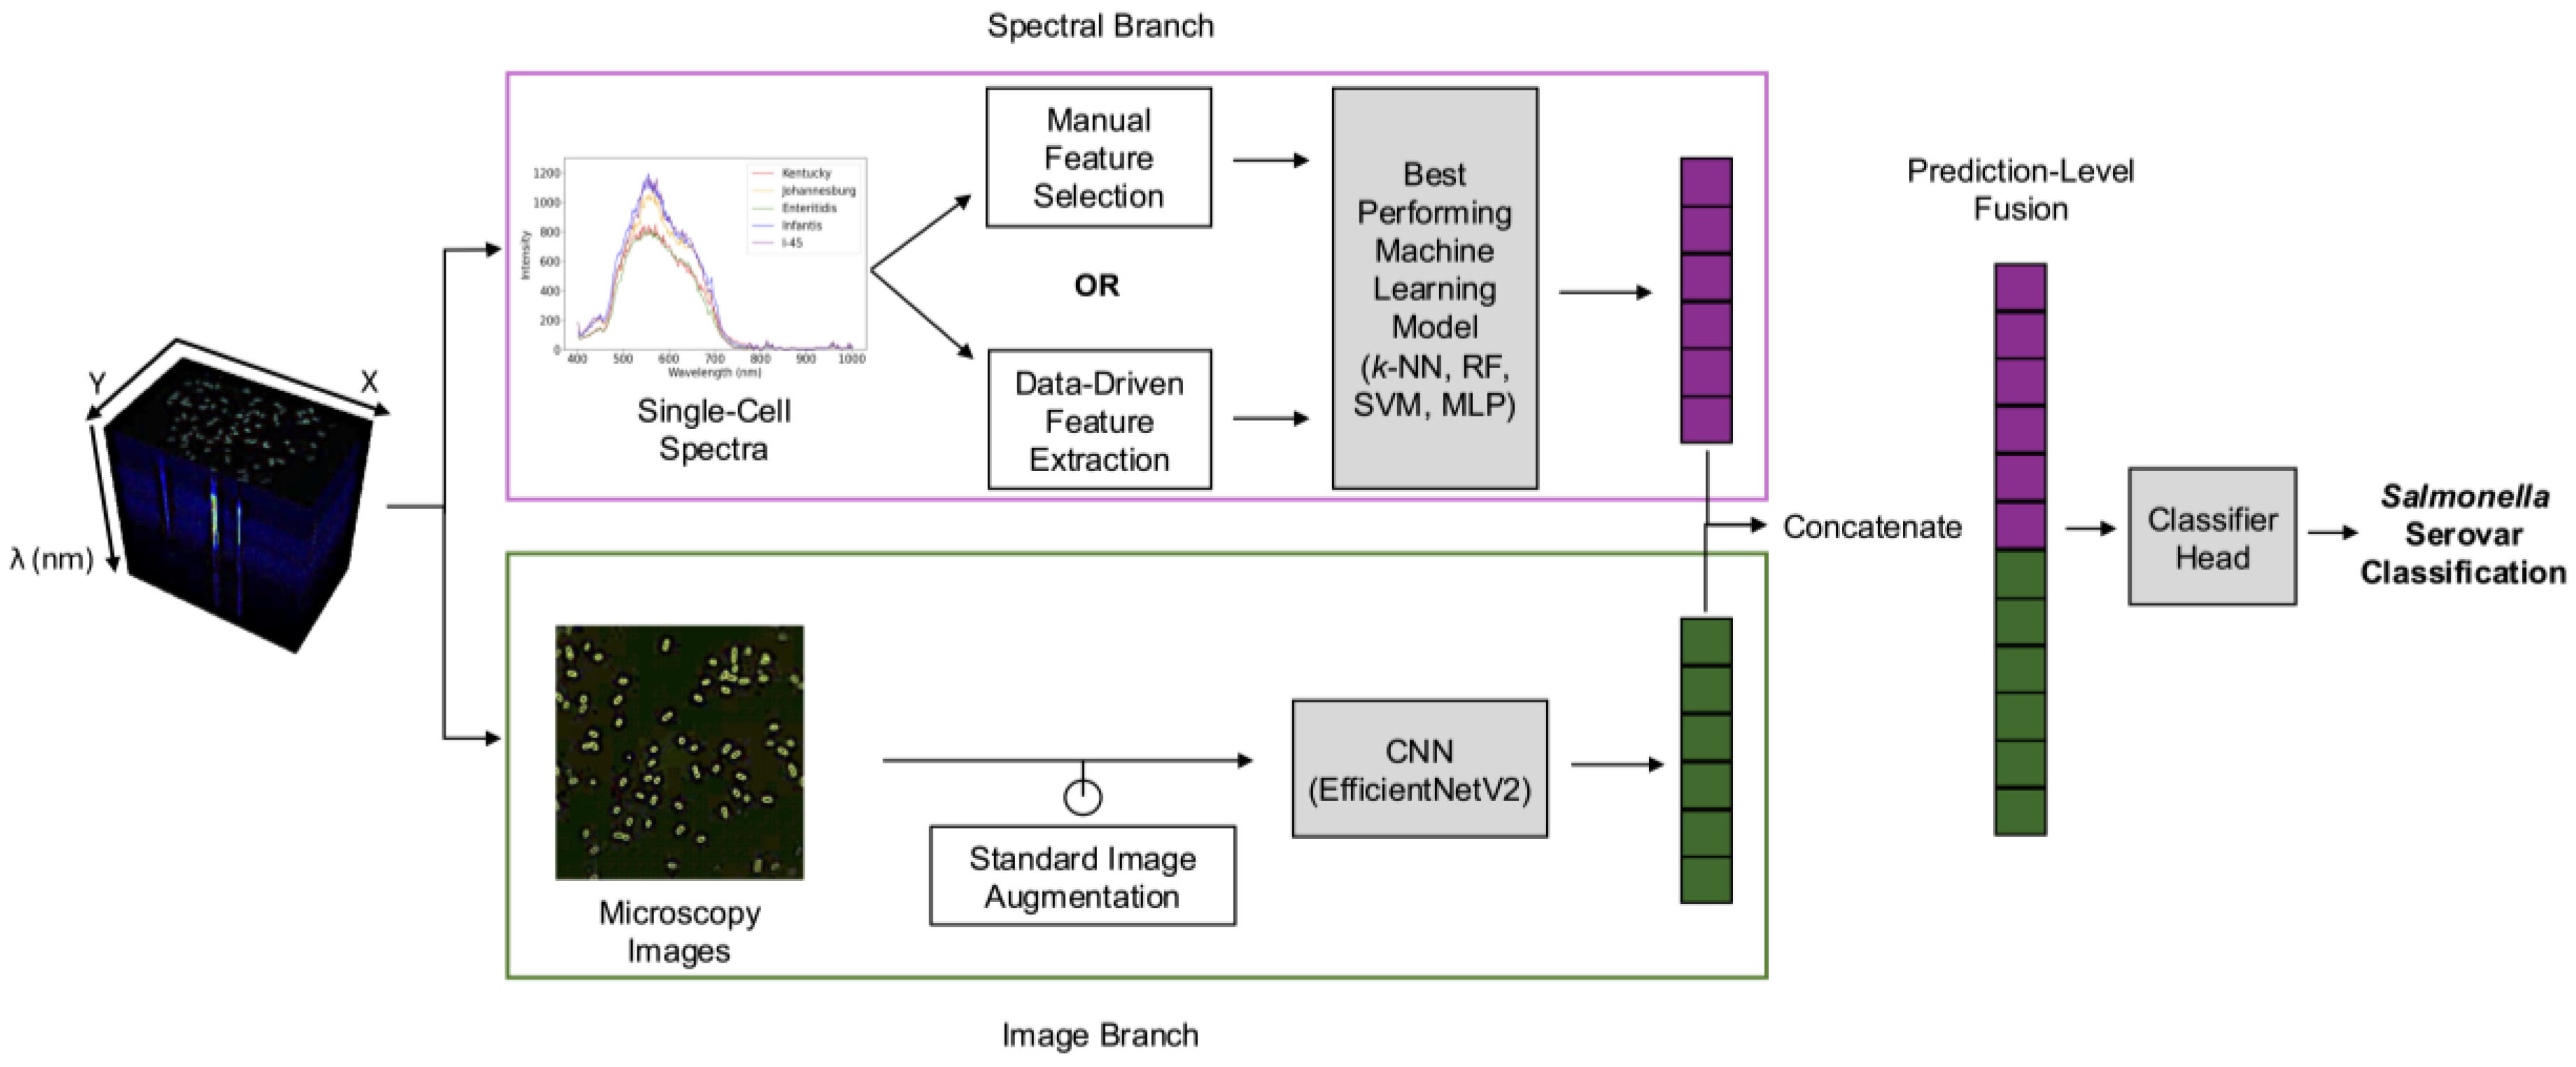
Figure 2.
Bacterial sample preparation procedure for hyperspectral microscopy data acquisition.
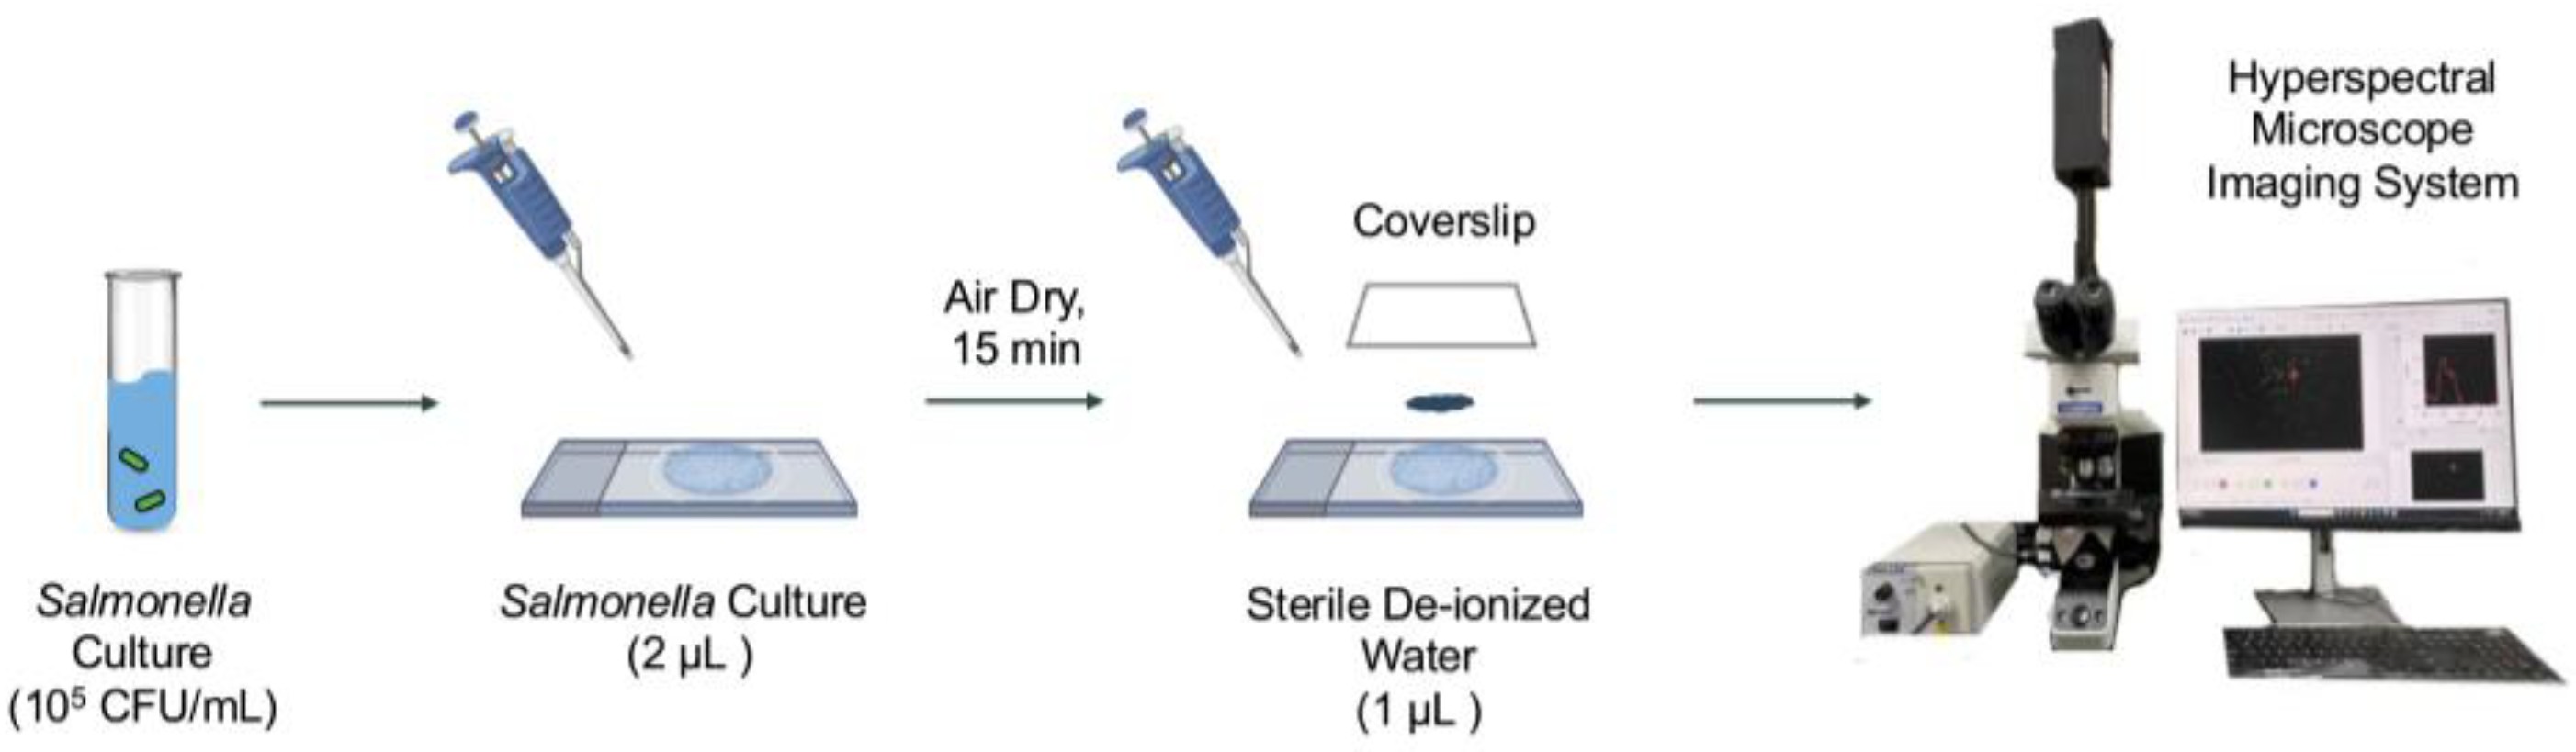
Figure 3.
Hyperspectral data collected for Salmonella serovars: (A) Example microscopy images (i.e., RGB composites generated from selected hyperspectral wavebands) showing one representative cell per serovar, and (B) mean single-cell spectral profiles with standard deviation (STD), derived from segmented cells within hyperspectral data cubes (n=100 per serovar).
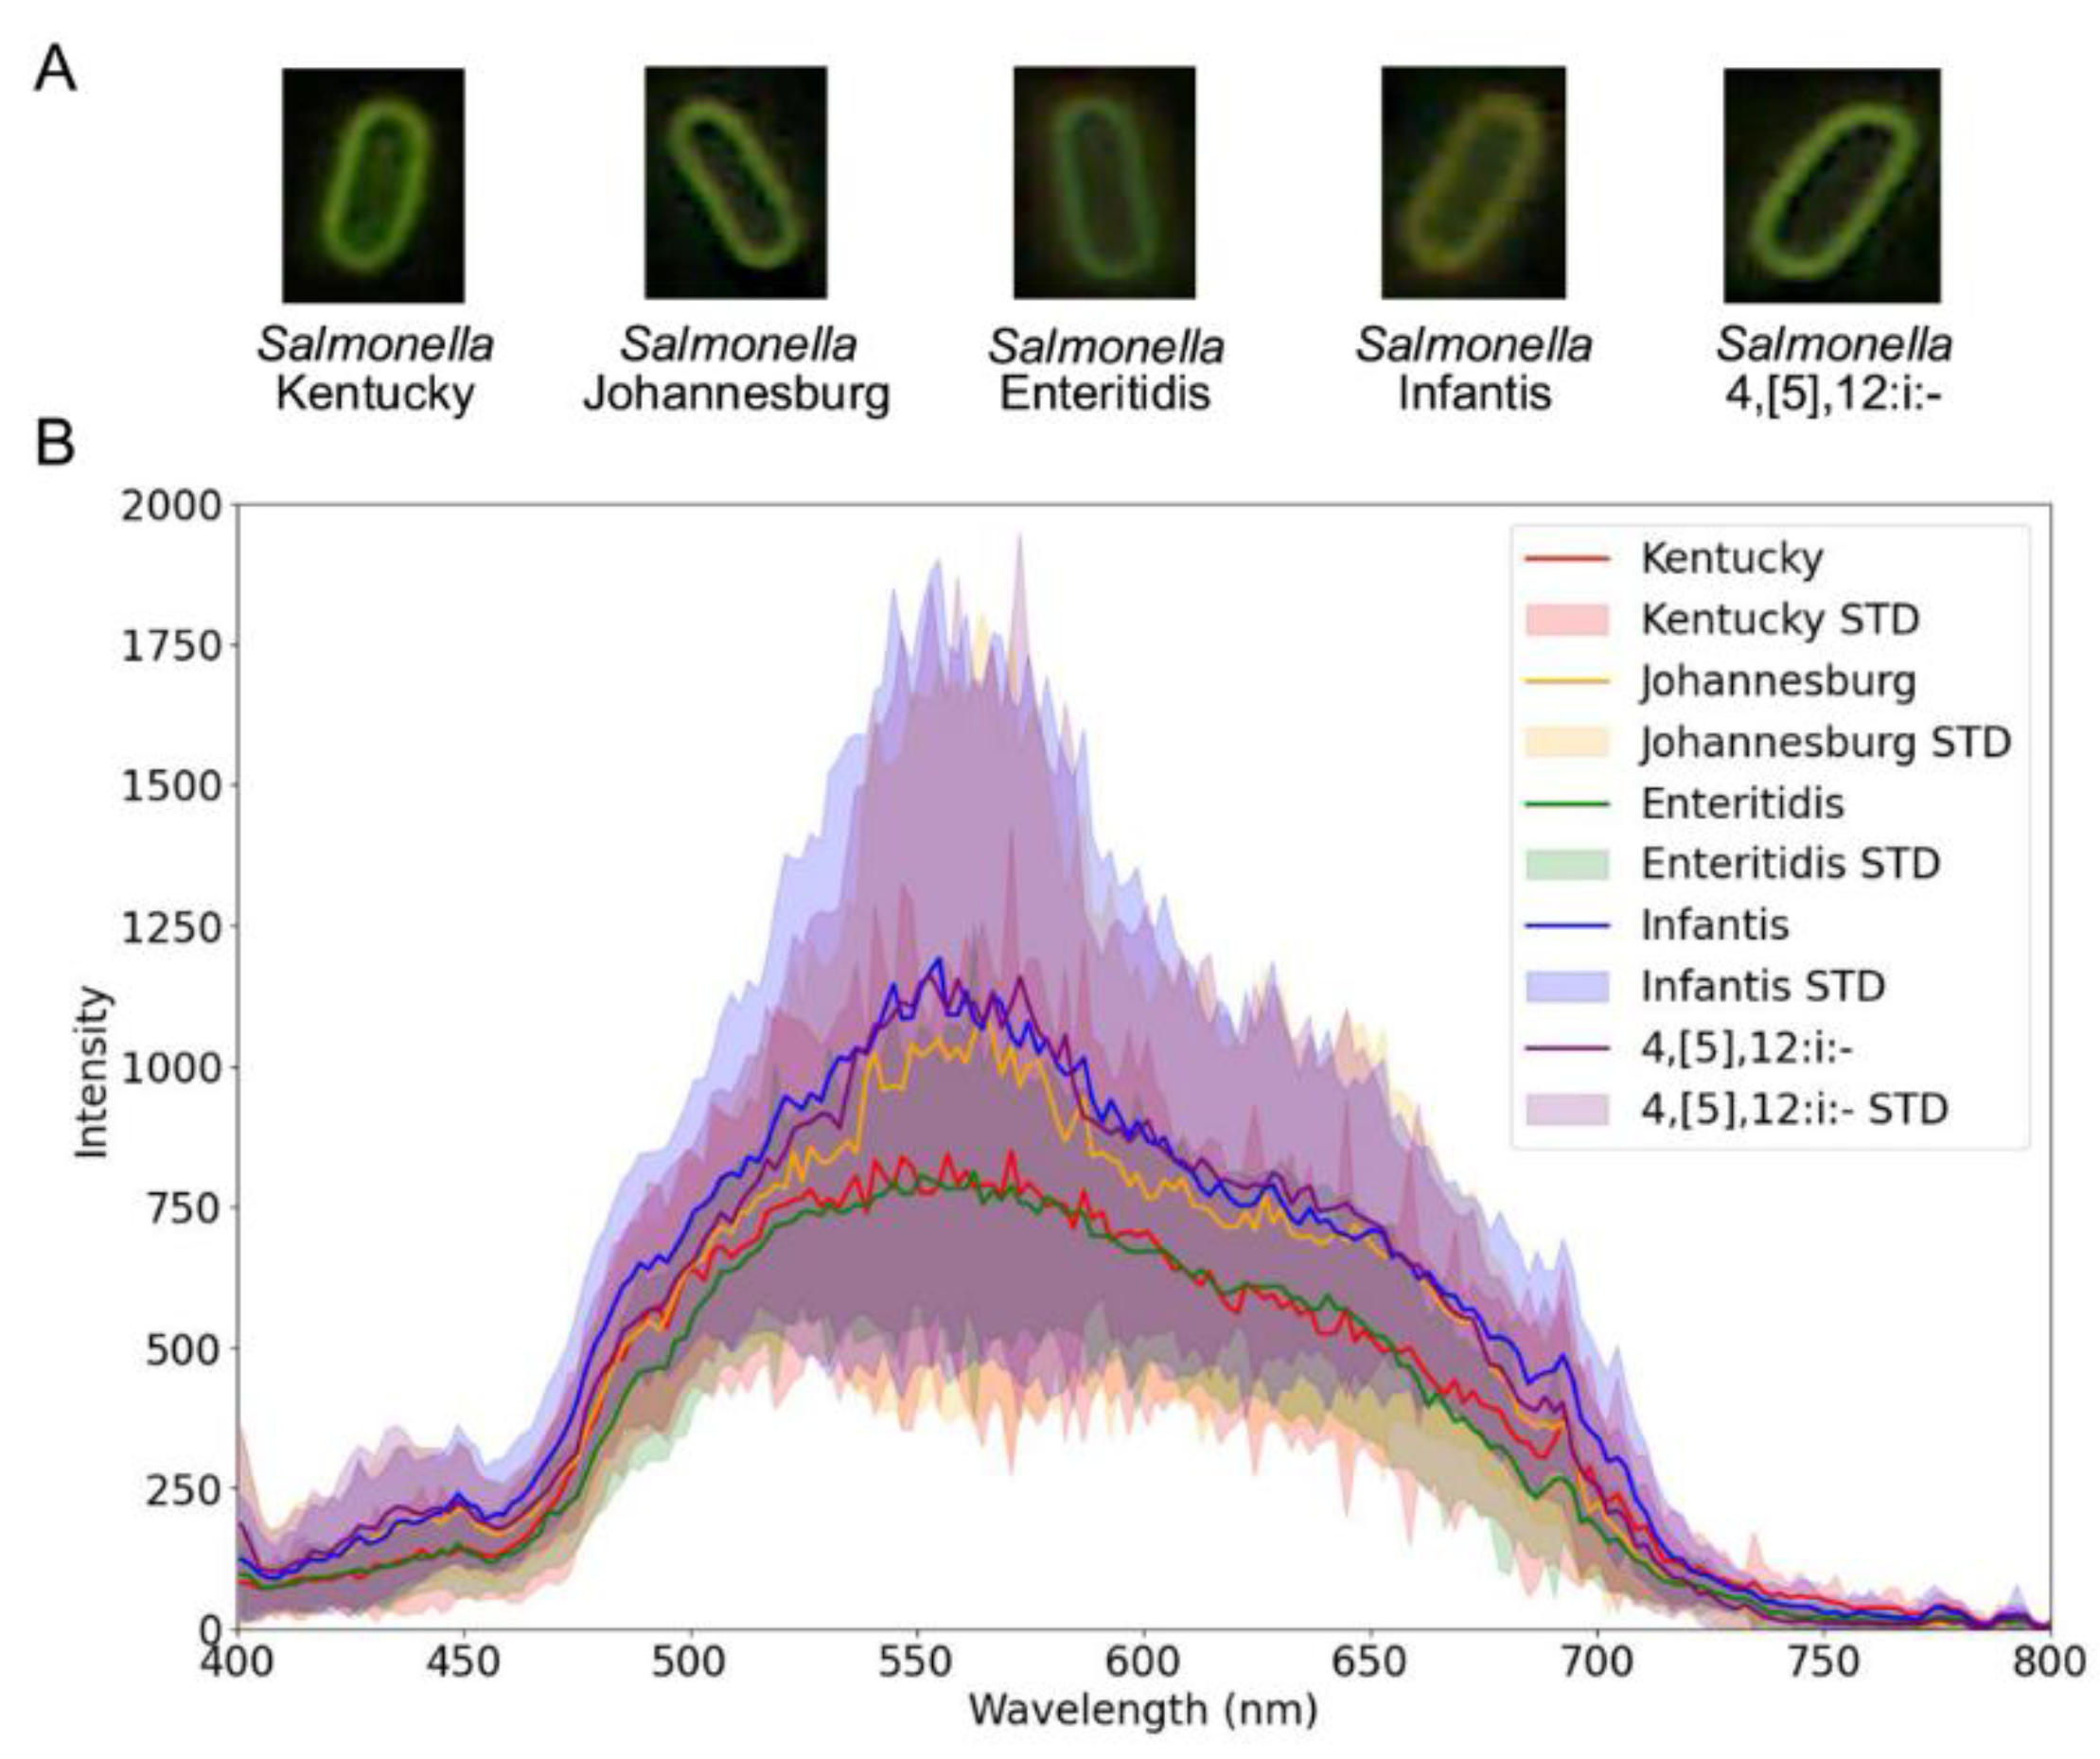
Figure 4.
Confusion matrix results for the classification of Salmonella serovars using the multimodal fusion model.
Figure 4.
Confusion matrix results for the classification of Salmonella serovars using the multimodal fusion model.
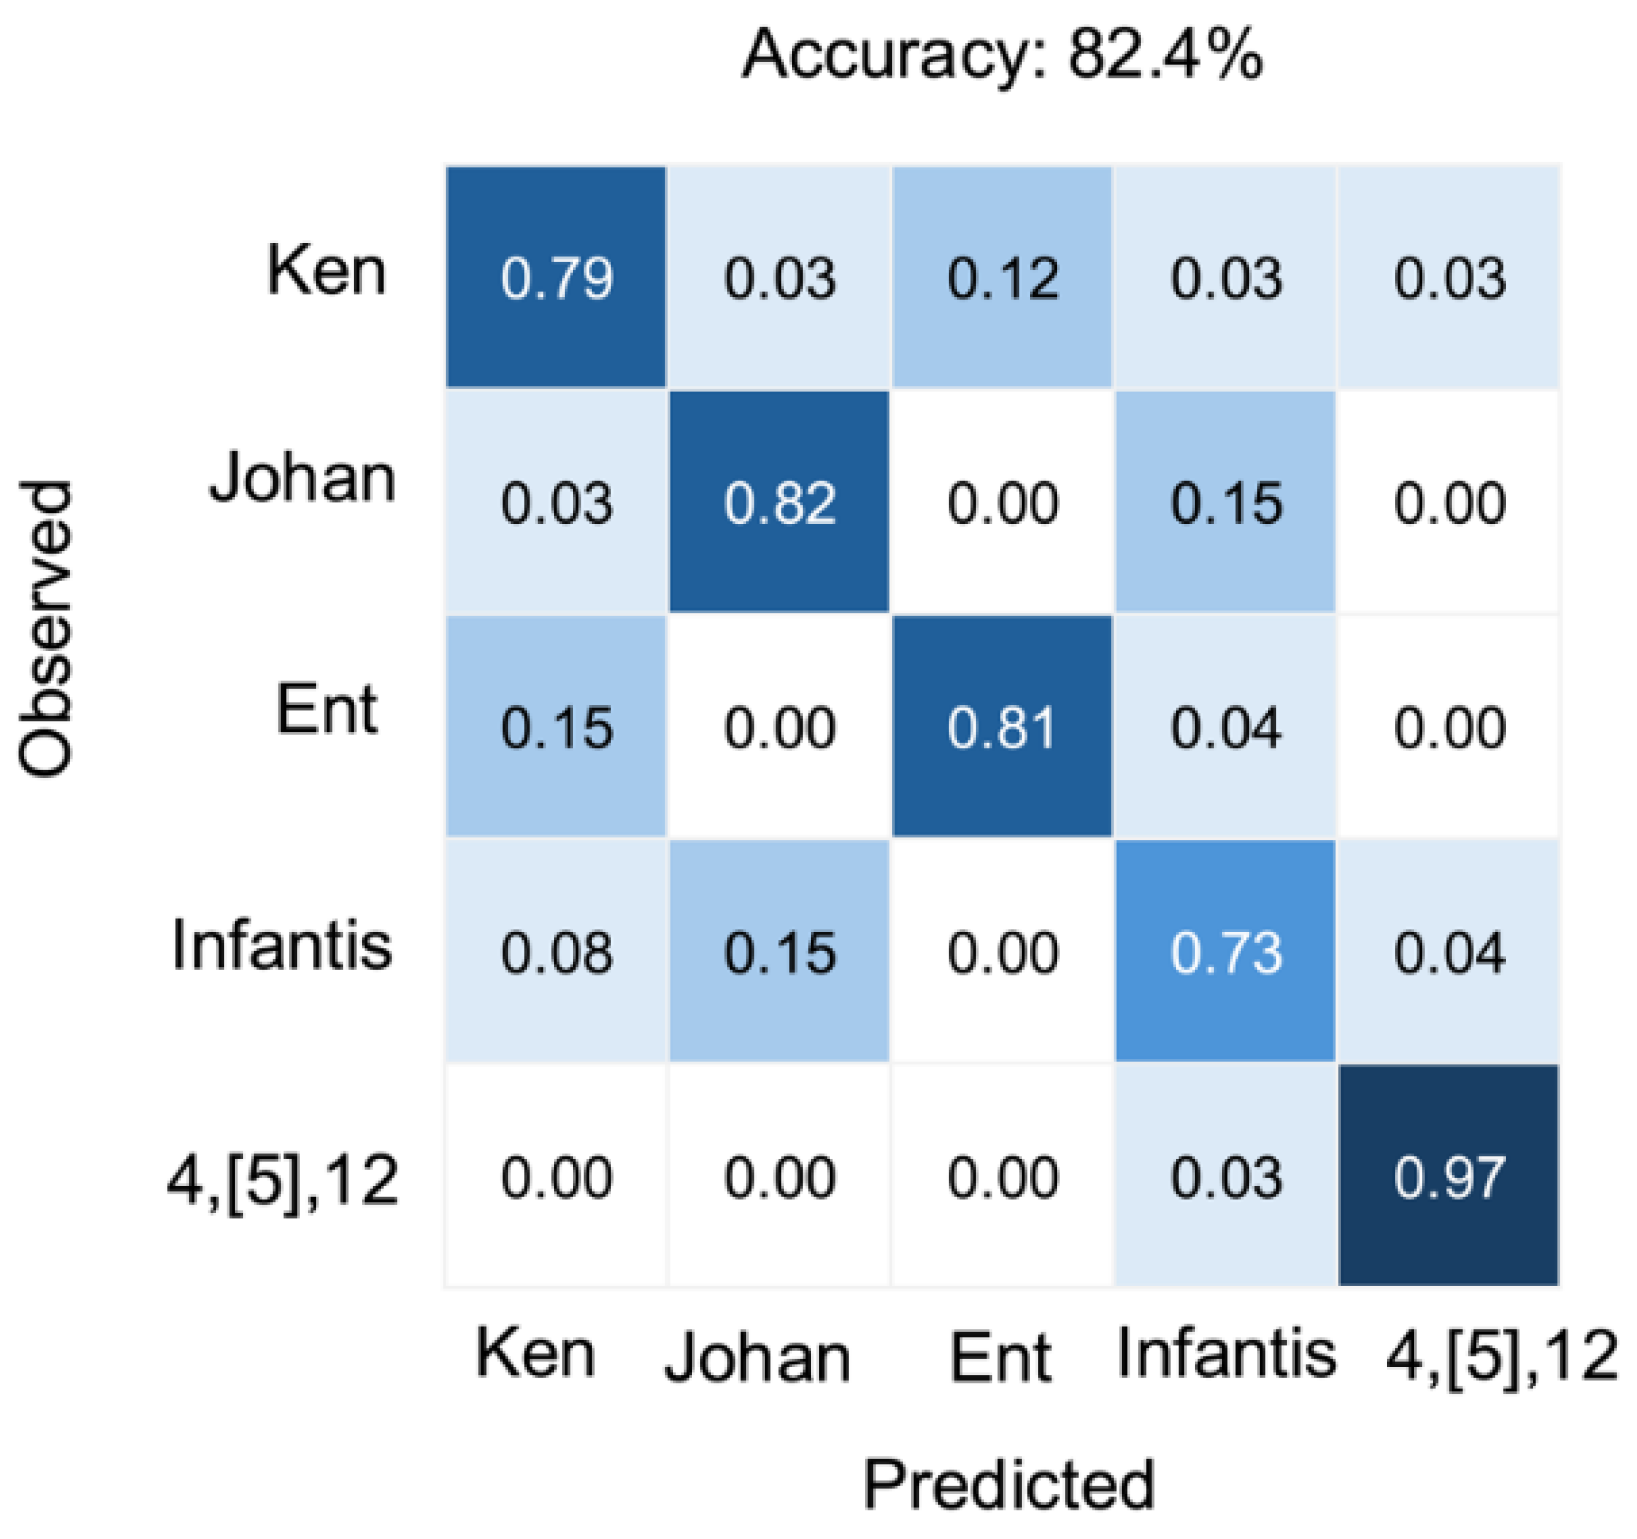

Table 1.
Impact of feature engineering on spectral data with machine learning models using manual feature selection and data-driven feature extraction.
Table 1.
Impact of feature engineering on spectral data with machine learning models using manual feature selection and data-driven feature extraction.
| Spectral features | Accuracy | Precision | Recall | ||||
|---|---|---|---|---|---|---|---|
| Model | Train | Test | Train | Test | Train | Test | |
| Manual selection1 | k-NN | 67.2% | 60.1% | 67.7% | 60.1% | 67.2% | 60.1% |
| SVM | 55.9% | 54.1% | 58.1% | 56.0% | 55.9% | 54.1% | |
| RF | 100.0% | 59.5% | 100.0% | 58.8% | 100.0% | 59.5% | |
| MLP | 64.6% | 62.2% | 65.0% | 62.1% | 64.6% | 62.2% | |
| Data-driven $$$$$ extraction2 | k-NN | 81.7% | 73.7% | 81.9% | 74.2% | 81.7% | 73.7% |
| SVM | 81.7% | 75.0% | 82.1% | 76.3% | 81.7% | 75.0% | |
| RF | 100.0% | 77.7% | 100.0% | 78.6% | 100.0% | 77.7% | |
| MLP | 99.4% | 81.1% | 99.4% | 81.1% | 99.4% | 81.1% |
1The three characteristic spectral wavebands were manually selected based on domain knowledge, retaining physical interpretability. 2The top 18 principal components (PCs) were extracted through principal component analysis, representing 99% of data variance. These PCs are linear combinations of all original spectral wavebands, creating abstract feature representations optimized for variance and reducing correlation or collinearity, but lack direct physical interpretability.
Table 2.
Enhanced classification through multimodal fusion of microscopy images with the best-performing model on single-cell spectra.
Table 2.
Enhanced classification through multimodal fusion of microscopy images with the best-performing model on single-cell spectra.
| Accuracy | Precision | Recall | ||||
|---|---|---|---|---|---|---|
| Model | Train | Test | Train | Test | Train | Test |
| Spectral only1 | 99.4% | 81.1% | 99.4% | 81.1% | 99.4% | 81.1% |
| Image only2 | 68.2% | 57.3% | 77.8% | 57.3% | 77.8% | 57.3% |
| Multimodal fusion | 93.6% | 82.4% | 86.4% | 82.4% | 86.4% | 82.4% |
1PCA-MLP was selected as the best model in Table 1. 2EfficientNetV2 variant was used as the CNN model architecture.
Disclaimer/Publisher’s Note: The statements, opinions and data contained in all publications are solely those of the individual author(s) and contributor(s) and not of MDPI and/or the editor(s). MDPI and/or the editor(s) disclaim responsibility for any injury to people or property resulting from any ideas, methods, instructions or products referred to in the content. |
© 2025 by the authors. Licensee MDPI, Basel, Switzerland. This article is an open access article distributed under the terms and conditions of the Creative Commons Attribution (CC BY) license (http://creativecommons.org/licenses/by/4.0/).
Copyright: This open access article is published under a Creative Commons CC BY 4.0 license, which permit the free download, distribution, and reuse, provided that the author and preprint are cited in any reuse.


