Submitted:
03 July 2025
Posted:
21 July 2025
You are already at the latest version
Abstract
Microfluidic methods are an important tool for studying the microrheology of blood and the mechanical properties of blood cells - erythrocytes, leukocytes and platelets. In patients with diabetes, hypertension, obesity, sickle cell anemia, and cerebrovascular or peripheral vascular diseases, hemorheological alterations are commonly observed. These include increased blood viscosity and red blood cell (RBC) aggregation, along with reduced RBC deformability. Such disturbances significantly contribute to impaired microcirculation and microvascular perfusion. In blood vessels, abnormal hemorheological parameters can elevate resistance to blood flow, exert greater mechanical stress on the endothelial wall, and lead to microvascular complications. Among these parameters, erythrocyte deformability is a potential biomarker for diseases including diabetes, malaria, and cancer. This review highlights recent advances in microfluidic technologies for in vitro assays of RBC deformability and aggregation, as well as leukocyte aggregation and adhesion. It summarises the core principles of microfluidic platforms and the experimental findings related to hemodynamic parameters. The advantages and limitations of each technique are discussed, and future directions for improving these devices are explored. Additionally, some aspects of modeling the microrheological properties of blood cells are considered. Overall, the described microfluidic systems represent promising tools for investigating erythrocyte mechanics and leukocyte behaviour.
Keywords:
microfluidics
; microrheology
; modeling
1. Introduction
Hemorheology studies the deformation and blood flow, with RBC deformability and RBC aggregation being a critical biomarkers for many diseases. Red blood cell (RBC) deformability has important role for tissue perfusion and is a key determinant of blood rheology in normal physiological and pathophysiological conditions. S. Chien [1] focuses on the role of RBC deformability in circulatory regulation in physiological and pathophysiological conditions. Diseases such as diabetes [2,3], atherosclerosis, cerebrovascular and cardiovascular diseases, sickle cell anemia, and malaria [4], as well as prolonged storage [5], may affect the mechanical properties of RBCs altering their hemodynamic behavior and leading to microvascular complications.
Hemorheological alterations—such as increased blood (BV) and plasma viscosity (PV), enhanced cell aggregation (RBCA), and reduced RBC deformability (RBCD)—are consistently observed in metabolic diseases [2,3]. In type 2 diabetes mellitus (T2DM), these changes are linked to impaired microcirculation, particularly in the skin [2]. Studies by Zamyshliaev [6] and Volkova [7] focus on peripheral occlusive arterial disease (POAD), showing that disrupted RBC microrheological properties contribute to reduced blood fluidity. The research confirms a strong link between vascular disease and blood rheological dysfunction, while also identifying possible intervention strategies.
Reduced number of erythrocytes (the main carriers of oxygen) decreased deformability of red blood cells and increased extent of aggregation which impaired the oxygen supply to tissue were observed in patients with cancer [8].
All blood cells interact among themselves and with epithelial cells by mechanisms that depend on adhesion molecules as well as by several forces involved in the interaction, such as Van der Waals attraction forces and repulsive electrostatic forces [9,10]. Using microchannel flow devices, the in vitro adhesion of flowing leukocytes and erythrocytes, aggregation and deformability can be studied by mimicking laminar flow in vivo into blood vessels. The flow microchamber studies aim to find a relationship between the microrheological parameters of the blood and the leukocyte adhesion under flow conditions.
Microfluidic approaches are becoming increasingly popular for the study of blood microrheology – RBC deformability, RBC aggregation, leukocyte aggregation and adhesion [4,10,11,12,13,14,15,16,17,18]. The analysis of the mechanical properties of blood cells has significantly advanced with progress of microfluidic technology. Microfluidics and blood cell deformability intersect in a powerful area of research and diagnostics, where micro-scale fluid dynamics are used to study and measure how red blood cells (RBCs) and other blood components deform under flow. Microfluidic devices are small-scale systems (often chip-based) that manipulate tiny amounts of fluids in channels with dimensions similar to human capillaries (5–10 µm). These devices can mimic capillary-like flow conditions, enable high-throughput analysis of individual cells, offer precise control over flow rate, shear stress, and geometry.The advantage of this technique is that it allows small sample sizes, effective cost, relatively fast data evaluation, etc. Fluid flow behaviour in microfluidic systems can differ from macroscale systems. Dimensionally, microfluidics is within the scale of 1-1000 µm. This small scale results in a low Reynolds number. The low number of Reynolds permits laminar flow, which exhibits viscous forces more important than inertial ones. Intramolecular surface forces and boundary layers may also play a larger role in a microfluidic system compared to that of a macro system. All these factors need to be taken into consideration when designing a microfluidic system.
The study aims to summarise the working principles and experimental results of key microfluidic platforms for RBC deformability, RBC aggregation, leukocyte aggregation and adhesion, as well as to discuss some aspects of modeling the microrheological properties of blood cells.
2. Methods for Evaluation of Erythrocyte Deformability
Various techniques have been developed to measure red blood cell (RBC) deformability, which can be broadly categorized into two types:
Single-cell techniques, such as micropipette aspiration [5,18,19,20], which measures the mechanical response of individual RBCs.
Bulk or ensemble measurement techniques, applied to whole blood or diluted RBC suspensions, including: filtration methods [20,21]; ektacytometry, which assesses the deformability of a population of RBCs under shear stress [20,21] and viscometric methods []
These methods help evaluate the rheological properties at both the individual cell level and the population level, providing comprehensive insights into RBC mechanics.
2.1. Viscometric Methods for Evaluation of RBC Deformability
Blood viscosity is a key factor influencing blood flow in both large and small vessels, but its role differs depending on vessel size [5]: In large arteries (macrovessels), where vessel diameter far exceeds RBC size, blood viscosity directly affects flow resistance, assuming a constant diameter. In capillaries (microvessels), where RBCs are nearly the same size as the lumen, blood does not behave as a uniform fluid, and the concept of viscosity—especially as measured by standard viscometers—becomes less straightforward.
Instead, in microcirculation, other factors such as: Hematocrit (Ht), RBC aggregation, RBC deformability, and Plasma protein levels must be directly considered, especially since microvascular hematocrit is typically lower than that measured in venous blood samples used for in vitro viscosity testing.
Additionally, elevated whole blood viscosity (WBV) can increase mechanical stress on vessel walls, potentially damaging endothelial cells and promoting inflammation, thus contributing to vascular dysfunction.
D. Pinho et al. [22] present a comprehensive review of the visualization and measurement of blood cells flowing in microfluidic systems, focusing on blood rheology and its implications for personalized medicine. It highlights the importance of hemorheological properties, such as blood viscosity, red blood cell (RBC) deformability, and aggregation, in diagnosing and managing metabolic and blood-related diseases like diabetes, hypertension, and malaria.
A review by S. Trejo-Soto et al. [23] explores the mechanical properties of red blood cell (RBC) membranes and their impact on blood flow and rheology from both numerical and experimental perspectives. The authors note the following key points in their study, which include: The unique structure of RBC membranes—notably their lack of a nucleus and simple composition—makes them ideal for modeling and analysis. The review emphasizes the advances in microfluidic technologies that enable precise in vitro assessments of RBC membrane elasticity, hemodynamics, and hemorheology. Experimentally, the authors used microfluidic methods to measure blood viscosity, and to analyze how RBC aggregation and erythrocyte concentration influence whole-blood rheological properties. Overall, the study showcases how microfluidics offers powerful tools for investigating the biomechanics of RBCs and their role in blood flow regulation.
RBC deformability and aggregation can be quantified using experimental blood viscosity data. Based on the blood viscosity experimental data the RBC deformability (Tk) index, characterizing erythrocyte deformability [24] and the erythrocyte aggregation (IAE) index, characterizing the erythrocyte aggregation can be calculated:
The Tk index is used to characterize erythrocyte deformability and is calculated using the following formula (1) [24].
where ηr is the relative viscosity; (), ηbl is the apparent dynamic blood viscosity at shear rate 94.5 s-1 and ηpl is plasma viscosity at the same shear rate, Ht, % is the hematocrit [2]. This suggests that the Tk index is a useful metric for assessing how changes in RBC deformability influence blood viscosity, especially under low shear flow conditions.
The IAE index (not further detailed here) represents erythrocyte aggregation.
2.2. Micropipette Aspiration
The micropipette aspiration is the earliest experimental technique used to measure RBC deformability. In this method a single red blood cell is aspirated into a micropipette with a diameter smaller than the cell itself, applying mechanical stress [5,19,20]. The technique evaluates the cell’s ability to deform and move through the narrow pipette, simulating microvascular conditions. Early studies used this method to compare normal vs. stored (or damaged) RBCs, showing that stored RBCs were less deformable than fresh ones [20]. Although accurate, micropipette aspiration is low throughput and labor-intensive, making it less practical for large-scale analyses. Nonetheless, it laid the groundwork for later single-cell microfluidic methods [5].
Subsequent variations of these micropipette studies further examined the localized elasticity of the membrane in both intact cells and RBC ghosts using ever smaller micropipettes to deform a small segment of the membrane to characterize static deformability via membrane extensional rigidity and bending rigidity. To further characterize dynamic deformability of the cells, the time constants for rapid elastic recovery from extensional and bending deformations were also quantitated.
While micropipette aspiration is valuable for studying single-cell mechanics, it has important limitations:
- It does not effectively capture the biomechanical heterogeneity of even relatively uniform populations like normal RBCs and is even less suited for the diverse white blood cell (WBC) population [5].
- The technique is useful for analysing static and dynamic properties of individual cells and for determining cytomechanical parameters with high precision.
- However, it is low-throughput, only suitable for small sample sizes, and suffers from variability in micropipette fabrication, which reduces consistency.
Due to these drawbacks, particularly in large-scale or population-wide studies, newer, more scalable techniques were developed, especially those that allow analysis under flow-like, physiologically relevant conditions using microfluidics. These modern methods enable the study of many cells simultaneously, providing a better representation of the overall microrheological properties of blood.
S. Kumari et al. [19] developed a high-throughput microfluidic device designed to measure the Young’s modulus (a measure of stiffness) of individual red blood cells (RBCs). The device features a single microchannel that opens into a funnel-shaped region, with a semicircular obstacle positioned at the entrance of the funnel. As RBCs flow through the device and interact with the obstacle, their deformation under flow is analysed to determine their mechanical stiffness.
This method enables the measurement of many single cells, making it possible to quantify heterogeneity in stiffness across the RBC population—something that low-throughput techniques, such as micropipette aspiration, cannot achieve efficiently. It represents a significant advancement in the precision and scalability of RBC mechanical property assessment.
2.3. Ektacytometry
Rheoscopes are specialised instruments used in rheological studies to observe and measure the deformation and behaviour of red blood cells (RBCs) under controlled flow conditions. They are typically constructed using an inverted light microscope as the base, with a rheological chamber integrated into the microscope stage.
Key features of the rheoscopes include a custom-designed chamber that holds a suspension of RBCs in a viscous medium and the ability to apply controlled shear stress or flow, allowing real-time visualisation of cell deformation, orientation, and aggregation.
Rheoscopes enable direct observation of RBC mechanical responses under simulated physiological conditions, making them valuable tools in blood rheology research [20].
The conventional ektacytometry test describes RBCs’ elongation index as a function of shear stress, while the osmoscan tests are performed as a function of osmolality at a constant shear stress. A. Varga et al. [21] present results of the evaluation of the well-defined elongation index (EI) – osmolality (O) (EI-O) curve, characterised by several calculated parameters, which are varying in different pathophysiological processes. The magnitude of changes in conventional and osmoscan deformability values can differ depending on the determinant noxa (e.g., damage by free radicals, cell-structure/morphology alterations, mechanical, thermal or metabolic effects, etc.). Red blood cell osmotic gradient deformability measurement provides much more detailed information about the deformability of the erythrocytes, being useful in various research (both clinical and experimental), focusing on micro-rheological alterations. The standard settings of the measurement conditions are highly important to have comparable results. The presented experiences may call attention to the usefulness of parallel investigation of conventional and osmotic gradient deformability.
2.4. Optical Laser Tweezers (LT)
The optical laser tweezers (LT) are a scientific tool for manipulating microobjects without direct mechanical contact with them [25,26,27]. Their working principle is based on sharply focused laser beam interaction with dielectric particles. LT allow for trapping live cells, measuring forces of about pN and effectively manipulating cells at distances of about micrometres [25,26,27]. LT enables us to evaluate the RBC aggregates in the blood of patients with arterial hypertension, which are stronger and form faster than those in the blood of healthy people [26]. Investigation of the processes of spontaneous RBC aggregation and deformability is important both for understanding the fundamental mechanisms of aggregation and for assessing the differences between the parameters of aggregation and deformability of RBCs in patients and controls. An evaluation of the differences in RBC microrheological properties between groups of patients with arterial hypertension and a group of healthy subjects is done. Methods of laser trapping, light diffractometry and diffuse scattering were used to measure in vitro microrheological properties of the single cells and ensembles of cells. Based on the results obtained, it was concluded that RBC aggregates in the blood of patients suffering from arterial hypertension are stronger and form faster than those in healthy subjects.
2.5. Atomic Force Microscopy (AFM)
Atomic force microscopy (AFM) allows the study of topographies of blood cells and evaluation the elastic and adhesive properties of biomembranes, potential of the surface of RBCs and granulocytes [28,29,30], Young’s modulus of red and white blood cells’ membranes [28,29] and blood clots at the molecular level with high resolution [30]. Single-cell techniques, while accurate, make it difficult to obtain statistically significant data, while RBC suspension techniques impose flow geometries that are far from those that test red blood cells in human capillaries.
3. Microfluidics Methods and Devices for Evaluation of RBC Deformability
Microfluidic devices, which manipulate tiny fluid volumes in capillary-sized channels, allow precise control over flow conditions and enable detailed analysis of individual red blood cells (RBCs). RBC deformability is crucial for passing through narrow capillaries and is influenced by factors like membrane stiffness, cytoskeletal structure, cytoplasmic viscosity, and diseases such as sickle cell disease, malaria, diabetes, and sepsis. Studying RBC perfusion through microcapillaries offers a direct way to assess their deformability. As RBCs deform significantly while passing through these narrow vessels, their deformability is influenced by factors such as the membrane-cytoskeleton structure, surface-to-volume ratio, and haemoglobin content [31}. Some of the developed devices and methods for microfluidic analyzes for red blood cell deformability are shown in Table 1.
N. Sutton et al. [32] developed a precise fluidic control system combined with micromachined flow channels and real-time imaging to measure how individual red blood cells (erythrocytes) move through microvascular-scale environments under physiological conditions. The system provides volume and velocity data for around 1000 cells across various channel sizes, offering detailed insights into erythrocyte flow and deformation. This instrument serves as a powerful tool for studying red blood cell behavior at the single-cell level in microvascular conditions.
J. C. Cluitmans et al. (2014) [16] developed a microfluidic system that mimics microcirculation to study red blood cell (RBC) behavior, focusing on deformation and relaxation in capillary-like channels. Using high-resolution time-lapse imaging and automated analysis, they assessed how RBCs deform and return to their original shape. Their findings show that, despite changes in morphology during blood bank storage, RBCs maintain their deformability and relaxation ability in microcapillary conditions. This suggests that altered cell shape alone does not impair microvascular flow. However, increased membrane stiffness and internal viscosity may still reduce the ability of RBCs to pass through the spleen.
A. Muravyov et al. [14,15] investigated how the microrheological properties of red blood cells (RBCs) contribute to the non-Newtonian behavior of whole blood. Using a microfluidic device, they measured RBC deformability and aggregation (Figure 1). This method was used to assess the effects of various drugs and pathological conditions on these RBC properties [6,7].
deformation rate (Figure 1).
The Elongation Index (I.E.) is calculated using the formula (2):
where:
I.Е. = (L-W) / (L + W),
L = Length of the deformed RBC along the direction of flow,
W = Width of the deformed RBC perpendicular to the flow.
This index is determined for each shear rate, providing a quantitative measure of RBC deformability under varying flow conditions. A higher I.E. indicates greater cell elongation and better deformability, which is crucial for efficient microcirculatory blood flow.
A regression analysis of erythrocyte elongation indices in a flow microchamber at a shear stress of 0.54 N/m2, using Artmann’s method [11], revealed a very strong correlation (r = 0.997) between two groups of deformability indicators (I.E.1 and I.E.2). This high correlation confirms the consistency and reliability of the elongation index as a measure of RBC deformability.
1) I.Е.1 = L / W; the elongation index (IЕ = L/W, where L and W are the length and width (the major and minor axes) of the deformed cell respectively and the method, described above:
2) I.Е.2 = (L-W) / (L + W), n = 100 (the length and width of 100 deformed erythrocytes were measured. Photoshop was used), obtaining a deformability index (I.Е.2) which is a relation between the long and short axes of the stretched cell, where L and W are the major and minor axes of the deformed cell.

Table 2.
Comparison of RBC Deformability Measurement Techniques.
| Technique | Main Features | Performance / Limitations | Disease Focus / Applications |
|---|---|---|---|
| Micropipette Aspiration | Aspirates individual RBCs through a small pipette to measure mechanical deformation. | Highly accurate for static/dynamic deformability, but low-throughput and labor-intensive. | Evaluates deformability changes in stored vs. fresh RBCs. |
| Microfluidic High-Throughput Device | Uses flow around a micro-obstacle to assess Young’s modulus of RBCs. | High-throughput; allows population heterogeneity analysis. | Scalable tool for personalized RBC stiffness screening. |
| Ektacytometry | Measures elongation index vs. shear stress or osmolality (osmoscan). | Quantifies RBC deformability across various physiological conditions; sensitive to setup. | Useful in diagnosing disorders affecting cell morphology/deformability (e.g., hereditary diseases, oxidative stress). |
| Rheoscope | Directly visualizes RBC deformation in flow using microscope-based system. | Enables real-time observation under physiological conditions; depends on setup precision. | Research on RBC behavior under controlled flow conditions. |
| Viscometric Methods | Assesses blood viscosity to infer deformability and aggregation (Tk & IAE indices). | Integrates whole-blood rheology; affected by plasma viscosity, hematocrit, shear rate. | Applied in diabetes, hypertension, malaria; indicates inflammation risk. |
| Optical Laser Tweezers (LT) | Uses focused laser beams to trap/manipulate RBCs; measures aggregation forces. | Precise force measurements at cellular scale; technically complex. | Differentiates hypertensive vs. healthy blood microrheology. |
| Atomic Force Microscopy (AFM) | Evaluates topography, elasticity, adhesion at nanoscale. | Very high resolution; limited throughput and physiological relevance. | Studies membrane mechanics in RBCs, granulocytes, blood clots. |
A microfluidic device and method were developed [3,17] to assess red blood cell (RBC) deformability, RBC aggregation, and white blood cell (WBC) aggregation. The system integrates a microscope with a digital camera, a pump with a manometer, and a computer with custom software. Using highly diluted blood suspensions between two parallel slides (100 μm apart), the motion of blood cells in the microchamber is observed and recorded. This setup enables the measurement of microrheological parameters—such as RBC deformability, RBC aggregation, and leukocyte adhesion—and allows for simultaneous analysis of the interactions between RBC aggregation and leukocyte adhesion in both healthy individuals and patients with type 2 diabetes mellitus (T2DM).
K. Seki et al. [33] studied the relationship between blood rheology—assessed using the Micro Channel Array Flow Analyzer—and various hemorheological factors in healthy individuals. They measured blood passage time as an indicator of rheology and found that factors such as increased age, body mass index, RBC and WBC counts, total and LDL cholesterol, and triglycerides, along with decreased HDL cholesterol, were associated with impaired blood flow. These findings suggest that aging, obesity, erythrocytosis, leukocytosis, and dyslipidemia may contribute to hemorheological disorders even in healthy subjects.
C. Londrero et al. [34] simultaneously measured erythrocyte adhesion and deformability using a microfluidic device equipped with an inverted optical microscope and advanced image analysis technologies. Red blood cells suspended in saline with varying concentrations of human serum albumin were studied under low shear stress (0.04–0.25 Pa), causing them to deform and detach from a glass surface. The maximum deformability index observed was 0.3, and the adhesion energy per unit area was 1.1 × 10⁻⁶ Pa·m, aligning with prior studies. Imaging showed that adhesion tends to localize at a single point—forming a “spike-like tip”—suggesting receptor migration on the cell membrane. Additionally, stronger adhesion in lower albumin concentrations implies that membrane receptor mobility influences both deformability and adhesion behavior.
The measurements and visualisations of blood cells deformability flowing in microfluidic devices (point-of-care devices) can provide vital information to diagnose early symptoms of blood diseases and consequently to be used as a fast clinical tool for early detection of biomarkers [22]. For example, erythrocyte (RBCs) stiffness has been linked to myocardial infarction, diabetes mellitus, and hypertension, among other blood diseases. Analyzing blood rheology—strongly influenced by cell mechanics and interactions—has become a key focus in biomedical research. Additionally, creating blood analogs that replicate blood’s rheological properties is essential for the effective design and optimization of microfluidic systems used in personalized medicine. Integrating hemorheology with microfluidic technology enables single-cell analysis, supporting the development of new diagnostic tools and personalized treatment strategies.
D. Scott et al. [5] demonstrated the use of microfluidic devices to assess the vascular deformability of erythrocytes and agranular leukocytes. Their study showed that, compared to older methods such as micropipette aspiration, ektacytometry, and micropore cell transit assays, microfluidic techniques provide a low-cost, high-throughput alternative. This highlights the efficiency and practicality of modern microfluidics for studying blood cell mechanics.
B.J. Kim et al. [35] developed a microfluidic physiometer that measures blood viscosity, hematocrit, and RBC deformability on a chip. It combines a hydrodynamic unit (for viscosity using reference fluid and microchannel arrays) and an electronic unit (for electrical properties like plasma resistance and membrane capacitance). It is an advanced microfluidic-electronic system used to analyse whole blood rheology and electrical properties under flow.
H. Kim et al. [36] reviewed measurable physical quantities in microfluidics, distinguishing direct and indirect viscosity measurements, and outlined future challenges and research directions for clinical applications.
Y. Zheng et al. [37] created a microfluidic system that uses electrical signals to assess RBC deformability by analyzing changes in current as cells pass through microchannels. The system can differentiate RBCs with varying stiffness at a rate of ~10 cells per second.
Table 3.
Comparison of Image-Based Methods vs Electrical Impedance and Optical Trapping.
| Aspect | Image-Based Methods | Electrical Impedance Methods | Optical Trapping / Optical Capture Methods |
|---|---|---|---|
| Throughput | - Generally lower throughput due to labor-intensive image acquisition and processing steps. | - Typically higher throughput, as electrical signals can be rapidly recorded and processed. | - Usually low to moderate throughput, as manipulation of individual cells is time-consuming. |
| - Requires microscopy and image analysis, sometimes in microfluidic setups, which can be slower per sample. | - Suitable for bulk measurements or high-frequency sampling in flow. | - Focus on single-cell analysis limits the number of cells analyzed in a given time. | |
| Diagnostic Accuracy | - Provides rich morphological and dynamic information on RBC aggregation and deformability. | - Good at detecting bulk changes in electrical properties reflecting cell membrane integrity and aggregation. | - High accuracy in measuring biomechanical properties like aggregation forces at single-cell level. |
| - Captures real-time aggregation dynamics, microstructural behavior, and can identify subtle morphological changes. | - Limited in providing detailed morphological data; more indirect measurement. | - Detailed biomechanical and optical properties assessment, but may miss population-wide variability. | |
| Complexity & Practicality | - Equipment like microfluidic flow chambers plus advanced imaging required; labor-intensive post-processing. | - Relatively simpler instrumentation, more amenable to clinical settings. | - Requires specialized laser tweezers and optics; high expertise needed. |
| In VivoRelevance | - Microfluidic models closely mimic microcirculatory flow, improving physiological relevance. | - Less directly related to physiological flow but sensitive to bulk blood properties. | - Usually in vitro, focusing on isolated cells, less representative of whole blood dynamics. |
Analyzing the data, we can make the following summary about the possibilities for standardizing the measurement of the EI index. There are several challenges in standardizing elongation index (EI) measurements across different platforms. One of them is due to different measurement Techniques, as various platforms use distinct methods to assess cell deformability, such as optical tweezers, laser diffractometry, microfluidic stretching, or electrical impedance. These differing physical principles can lead to variations in EI values, even for the same sample.
Other reasons could arise from the variability in shear stress or strain application. The magnitude and type of mechanical forces applied to cells vary across devices (e.g., controlled shear flow vs. stretching by optical traps). Since EI depends on how cells deform under specific forces, inconsistencies in applied stress make direct comparison difficult.
Differences in sample preparation and conditions and factors such as temperature, medium viscosity, cell concentration, and incubation time, can influence cell deformability measurements. Lack of standardised sample handling protocols leads to variability in EI results.
Data analysis and calculation methods are another factor. EI is often derived from image analysis or light scattering patterns, but algorithms and parameters used for shape quantification differ between platforms. This can cause discrepancies in how elongation is quantified.
Cell populations can be heterogeneous in size, shape, and mechanical properties, causing platform-dependent sensitivity differences. Some methods may be biased towards specific subpopulations, skewing EI outcomes.
As a whole there is a lack of universally accepted calibration standards or reference materials for EI measurements. Without standard references, aligning data across platforms remains challenging.
Table 4.
Comparison of Traditional vs. Microfluidic Methods for RBC Deformability.
| Metric | Traditional Methods (e.g., Micropipette, Ektacytometry, Viscometry) | Microfluidic Methods (e.g., High-throughput Microchannel Devices) |
|---|---|---|
| Sample Volume | Moderate to large (typically 0.5–5 mL) | Low (often < 100 µL) |
| Required Equipment | Bulky, specialized lab equipment (micropipette manipulators, rheoscopes, viscometers) | Compact microfluidic chips, pumps, microscope/camera setup |
| Throughput | Low to moderate (single-cell or small sample batch analysis) | High (hundreds to thousands of cells per run) |
| Analysis Type | Single-cell (micropipette) or population average (viscometry, ektacytometry) | Single-cell, with population-scale statistical power |
| Automation Potential | Low to moderate | High (compatible with automated image analysis and fluid handling) |
| Operator Skill Required | High (manual control, calibration, pipette fabrication) | Moderate (once setup is established) |
| Diagnostic Readiness | Moderate (established but less scalable for clinical use) | High (more adaptable to point-of-care and personalized diagnostics) |
| Physiological Relevance | Moderate to high (especially ektacytometry, viscometry) | High (mimics capillary-scale flow conditions) |
| Cost per Test | High (due to complex setup and manual labor) | Potentially low (mass-producible chips, scalable testing) |
4. Methods and Devices for Assessing Erythrocyte (RBC) Aggregation
Aggregation of red blood cells (RBCs) is a physiological reversible phenomenon where the cells stack into denser structures by clumping their wide surface with each other forming so-called “rouleaux”. It usually occurs at low shear rates and can influence blood viscosity and flow.
RBC aggregation is mostly associated by plasma proteins, especially fibrinogen, which promotes aggregation when present in high concentrations. In vitro, aggregation is often induced using high molecular weight Dextrans [38,39,40,41,42]. Two main models explain the aggregation mechanism:
Bridging model – macromolecules bind to RBC surfaces, linking them together.
Depletion model – low macromolecule concentrations near RBCs create an osmotic pressure gradient, pulling cells together.
Though conceptually different, Bronkhorst et al. (1997) [25] proposed that both mechanisms may operate together, where depletion brings cells close enough for bridging to occur. A synergistic interaction among fibrinogen, albumin, and immunoglobulin (Ig) may also contribute to aggregation.
Normally, RBCs form linear or branched rouleaux, which can develop into 3D networks, significantly increasing blood viscosity, especially at low flow rates. RBC aggregation is crucial in microcirculation and is elevated in several pathological conditions (e.g., diabetes, thrombosis, myocardial infarction, and cerebrovascular diseases). Therefore, RBC aggregation is a key factor in determining hemorheological properties of blood.
Various techniques for measuring RBC aggregation have been developed and are described elsewhere [17,26,27].
4.1. Erythrocyte Sedimentation Rate (ESR)
A measurement of the erythrocyte sedimentation rate (ESR) has been commonly used even though it was an indirect measurement of RBC aggregation [16]. In addition, there have been other methods for measuring RBC aggregation such as the image analysis method in a flow chamber [14,15,17], an ultrasound back-scattering technique and an optical technique [25,26,27].
4.2. Optical Technique
Optical microscopy monitor aggregation visually. Due to its simplicity, the optical method, which records light intensity from transmitted or reflected [40] light under defined shearing conditions, has been widely employed to quantify aggregation characteristics. The optical techniques for measuring RBC aggregation, which have been incorporated into several developed aggregometers, such as LORCA (Mechatronics, Netherlands), Erythro-aggregometer (Regulest, France) and Myrenne-aggregometer (Myrenne GmbH, Germany). These devices effectively measure RBC aggregation and are commonly used in research settings. However, they have practical limitations: require labour-intensive cleaning after each test, reducing efficiency. use high-speed rotational shearing systems to disperse aggregates, which adds to their complexity and cost. They are not ideal for routine clinical use due to these operational burdens.
Although RBC aggregation is important in blood rheology, its underlying mechanisms remain not fully understood, indicating a need for further research into spontaneous aggregation processes.
4.3. Laser Optical Technique
Parameters characterizing RBC aggregation and deformability can be measured by various optical techniques. These include diffractometry, optical trapping and manipulation (e.g., stretching), diffuse light scattering and various types of microscopies, including vital microscopy and capillaroscopy. While the former ones are implemented in vitro, the two latter ones are implemented in vivo. A. Priezzhev and co-authors [26,27] use RBC aggregometry method based on diffuse light scattering from whole blood samples in microfluidic flow chambers, laser diffractometry technique from dilute suspensions of RBC in controlled shear flow, laser trapping and manipulation of single RBC (all in vitro), and digital capillaroscopy of blood flows in nail bed capillaries in vivo. A. Semenov et al. [27] used laser optical techniques and flow cytometry to investigate how macromolecule adsorption (specifically human serum albumin (HSA) and fibrinogen) onto the RBC membrane affects cell biomechanics and aggregation.
RBC aggregation force (Fagg) was measured using laser tweezers in autologous plasma. The results obtained show that Fagg increased linearly with fibrinogen concentration, showing fibrinogen’s strong role in promoting RBC aggregation. Fagg was almost unaffected by HSA, indicating HSA does not significantly influence RBC aggregation. Fibrinogen strongly promotes RBC aggregation, while HSA has minimal effect, and laser-based methods combined with flow cytometry offer powerful tools for assessing RBC mechanical and aggregation properties.Results showed that SSC values significantly increased for RBC incubated in glutaraldehyde solution and Fagg of such cells was nearly absent. The authors hypothesized that serum albumin may influence the biomechanical properties of RBC due to non-specific adsorption leading to the alterations of membrane-bounded hemoglobin resulting in controversial effects on RBC aggregation [27].
4.4. Viscometric Methods and Techniques
The erythrocyte aggregation (IAE) index, characterizing the erythrocyte aggregation was determined as the ratio of whole blood viscosity at low shear rate of 11,02 s–1 to whole blood viscosity at high shear rate of 94,5 s–1 [44]:
IAE = η11.02/η94.5
A positive linear correlation between the IAE parameter (which quantifies RBC aggregation) and whole blood dynamic viscosity (WBV) at low shear rates, specifically from 0.51 s−1 to 0.06 s−1 in T2DM patients’ was found in [2]. This supports the idea that RBC aggregation plays a significant role in microvascular resistance and flow impairment, especially in disease states.
4.5. Image Analysis Method in a Flow Chamber
Microfluidic devices allow precise control over flow rate, shear stress, and chemical environment. They mimic capillary-size vessels, making it ideal for studying RBC behavior in conditions similar to those in vivo. They enable real-time imaging and measurement of aggregation dynamics, including formation and disaggregation.
Table 5.
RBC Aggregation Measurement Techniques.
| Method / Device | Principle / Technique | Measured Parameters | Key Features / Limitations | Applications / Disease Focus |
|---|---|---|---|---|
| Erythrocyte Sedimentation Rate (ESR) [16] | Rate of RBC sedimentation in a vertical tube | Indirect RBC aggregation | Simple, low-cost; non-specific, affected by many factors | General inflammatory states |
| Optical Aggregometers (e.g., LORCA, Myrenne[25,26,27,40]) | Light transmission/reflection under shear conditions | Aggregation index, light intensity curves | Widely used; complex, high maintenance, not suitable for routine clinical use | Research, diabetes, thrombosis, CVD |
|
Laser Optical Techniques Priezzhev et al., Semenov et al. [26,27] |
Laser diffractometry, optical trapping, diffuse scattering, capillaroscopy | Aggregation force (Fagg), FSC, SSC | Combines in vitro and in vivo; quantifies biomechanics and aggregation force with high sensitivity | Fibrinogen/HSA effects, diabetes, RBC biomechanics |
| Viscometric Index (IAE) [2,44] | Ratio of blood viscosity at low vs. high shear rates | IAE = η11.02 / η94.5 | Strong correlation with low-shear blood viscosity; shear-dependent | T2DM, microcirculation impairment |
| Image Analysis in Flow Chambers Muravyov et al. [14,15], Antonova et al. [17], Kaliviotis et al. [29,45,46] | Microscopy in static/dynamic flow chambers | RBC Aggregation Index (RBCA), Cell-Depleted Layer (CDL) | Real-time visualization of aggregation, shear control; high imaging detail | Diabetes, PVD, cancer, CVD, drug effects |
| Vibration-Based Microfluidic Aggregometer S. Shin et al., 2006 [43] | Vibration disrupts RBC aggregates; light backscatter measured | I(t), p(t), aggregation dynamics | Disposable, low-cost, correlates with blood viscosity, shear-dependent; innovative clinical potential | Clinical monitoring, heated RBCs |
| Bifurcating Microchannel Analysis | Microfluidic channels with bifurcations and flow splitting | CDL width, aggregation intensity | Reveals impact of bifurcations on aggregate size and partitioning; shows plasma skimming effects | Microvascular flow dynamics, viscosity reduction |
| Flow Cytometry + Laser Tweezers Priezzhev et al.[26] | Measures light scattering & aggregation force after incubation with macromolecules | FSC, SSC, Fagg | HSA increases FSC/SSC slightly; fibrinogen raises Fagg significantly; glutaraldehyde reduces aggregation | Biochemical effects on aggregation and membrane mechanics |
| Pharmacological Modulation Studies | Assesses drug effects (e.g., PDE inhibitors) on RBC rheology in vitro and in vivo | RBC deformability, aggregation reduction (%) | Vinpocetine and pentoxifylline reduce aggregation; relates to improved microvascular flow | C |
Some of the developed devices and methods for microfluidic analyzes for red blood cell aggregation are summarized in Table 2. S. Shin et al. (2006) [43] developed a low-cost, disposable aggregometer for clinically measuring dynamic RBC aggregation using minimal blood volume. The device combines a vibration-based disaggregation mechanism, a microfluidic channel, and a laser–photodiode system to assess aggregation behavior. The aggregometer uniquely measures RBC aggregation and its influence on blood viscosity across a range of shear rates, which previous methods lacked. By monitoring backscattered light intensity I(t) and pressure p(t) over time, the device captures both aggregation dynamics and stress–shear rate data. Results showed that RBC aggregability is shear-dependent and correlates with shear-thinning blood viscosity. The method successfully links dynamic aggregation characteristics to viscosity changes, supporting its clinical relevance.
E. Kaliviotis et al. [45] investigated the relationship between local red blood cell (RBC) aggregation, velocity, and hematocrit in a microfluidic channel—an area often overlooked in previous studies.
Advanced image processing techniques were used to quantify local and bulk aggregation. The study found that aggregation intensity strongly correlates with local velocity variations, both in the center and near the walls of the microchannel. Results highlight the combined influence of hematocrit and flow velocity on aggregation behavior and demonstrate that using multiple quantification methods enhances the characterization of blood’s microstructural properties.
E. Kaliviotis et al. [46] used microscope imaging techniques to simultaneously observe RBC aggregation and velocity fields in microchannel flows. Their analysis of aggregate transport at bifurcations revealed unexpected behavior: smaller aggregates appeared in low-shear daughter branches, contradicting traditional views on the aggregation–shear relationship. This was explained by non-uniform aggregate distributions in the parent vessel and the presence of a near-wall region lacking aggregates of certain sizes, which influence aggregate partitioning during flow splitting. Findings highlight how aggregate size and distribution affect local blood viscosity and deepen understanding of microvascular flow dynamics. Additionally, RBC aggregation was found to:
Independently increase the width and roughness of the cell-depleted layer (CDL).
Further widen the CDL when combined with flow partitioning at bifurcations.
These insights contribute to understanding phenomena such as plasma skimming, hematocrit reduction (Fåhræus effect), and viscosity reduction (Fåhræus–Lindqvist effect) in microscale blood flow.
A. Muravyov et al. [47] studied the effects of pentoxifylline therapy on hemorheological parameters in patients with cerebrovascular disease (CVD) and peripheral arterial disease (PAD). After 4 weeks of daily pentoxifylline (1200 mg), improvements were observed in RBC deformability and a reduction in RBC aggregation, indicating enhanced blood flow properties.
In vitro experiments showed that pentoxifylline and other phosphodiesterase (PDE) inhibitors increased RBC deformability and decreased aggregation—suggesting these effects are linked to PDE inhibition. Among tested drugs, Vinpocetine showed the most significant aggregation reduction (by 50%; p < 0.05). Overall, the findings support that modulating PDE activity in RBCs can improve microrheological properties and potentially enhance blood transport capacity in vascular disease patients.
5. Leukocyte Adhesion
The structure of leukocytes is the reason why they are much more resistant to deformation than red blood cells. Consequently, leukocytes flow relatively slowly through capillaries and can stop and affect the distribution of red blood cell flow. Furthermore, the migration of leukocytes into tissue means that they can actively change their structure and therefore their mechanical properties. When leukocytes pass through capillaries narrower or similar in size to themselves (6–9 µm), they move slower than red blood cells (RBCs) due to their larger size and spherical shape compared to the biconcave shape of RBCs [48]. Upon entering larger postcapillary vessels (8–30 µm), faster-moving RBCs overtake leukocytes, pushing them toward the vessel wall—a process called force margination. This positioning promotes leukocyte–endothelium interaction, leading to adhesion and subsequent rolling of leukocytes along the endothelium [49].
RBC aggregation enhances white blood cell (WBC) marginalization and adhesion to vessel walls [48,49,50,51]. WBC marginalization is influenced by flow hydrodynamics, hematocrit, cell elasticity, and cell interactions. While RBC aggregation promotes WBC margination, WBC deformability reduces it. High molecular weight agents and low shear rates in post-capillary venules increase RBC aggregation, leading to more leukocytes being pushed toward the vessel wall and improving their attachment efficiency to the endothelium. Thus, lower shear rates and greater RBC aggregation both enhance WBC margination and adhesion, showing a direct relationship between erythrocyte aggregation and leukocyte-endothelium interactions [52,53].
The impact of blood rheological properties on leukocyte adhesion in diabetic patients remains poorly studied, especially compared to leukocyte marginalization. Studies have shown that the presence of red blood cells (RBCs) enhances the adhesion of isolated lymphocytes to endothelial cells. In diabetes, increased RBC aggregation correlates with a higher number of rolling leukocytes at low shear rates, due to greater leukocyte marginalization. However, in diabetic patients, the separate contributions of free-flowing, marginalized, and rolling leukocytes have not yet been individually quantified [53,54].
Leukocyte adhesion is a dynamic process influenced by blood flow conditions. To study it under near-physiological conditions, researchers use a flow microfluidic chamber system, which includes a microcamera, microscope, microfluid pump, and image analysis software [3,17,53]. This setup enables cell tracking, morphological analysis, rheological measurements, and leukocyte adhesion studies [3,17].
In both healthy individuals and type 2 diabetes mellitus (T2DM) patients, increased cell deformability leads leukocytes to maintain a round shape. The relative leukocyte adhesion index (α)—which quantifies how many leukocytes remain adhered at specific shear rates—decreases with increasing shear rate in both groups. However, α values are significantly higher in T2DM patients at all tested shear rates, indicating increased leukocyte adhesion compared to healthy individuals, and suggesting altered adhesion dynamics in diabetes.
Leukocyte adhesion and movement in blood flow are critical for understanding the development of vascular complications in type 2 diabetes. Studying these processes can help clarify the role of leukocytes in vascular dysfunction in diabetic patients. The findings from such studies have practical applications in medicine, including drug development and applied cell biology, by contributing to more targeted approaches for the treatment and management of diabetic vascular complications.
A detailed examination of the data show (Table 6) that the reliability and reproducibility of microfluidic platforms for RBC or blood analysis are critically influenced by several factors.
5. Modeling the Microrheological Deformation Behavior of Blood Cells
S. Trejo-Soto et al. [23] explored various methods to model red blood cell (RBC) membrane elasticity, focusing on the Helfrich free energy model combined with a phase field approach. This model, integrated with Navier–Stokes equations, successfully simulates the deformation of isolated RBCs in Poiseuille flow and shear conditions. The study connects single-cell mechanics to the collective behavior of blood, illustrating how RBC elasticity influences hemodynamics and hemorheology. Both numerical and experimental perspectives are discussed, emphasizing advances in microfluidics that allow for enhanced in vitro observations of blood flow dynamics.
H. Kim et al. [35] highlight that accurately determining the physical or biophysical properties of biological materials requires both a data acquisition system and a relevant physical theory for interpretation. In microfluidic systems, biological samples can be influenced by hydrodynamic, electromagnetic, acoustic, optical, and mechanical forces—individually or in combination.
The authors review the measurable physical quantities and derived parameters in microfluidic devices and explain how different fields and forces within microchannels affect biological samples. Integrating multiple methods—such as hydrodynamic, optical, electromagnetic, and acoustic techniques—enables precise analysis of the physical properties of blood and blood cells.
Circulating leukocytes and platelets must adhere to the blood vessel wall to carry out the protective function of immunity for leukocytes and hemostasis for platelets. Given the importance of these adhesive processes, they have been widely analysed both in vivo, using intravital microscope and in vitro using flow-based models. Flow-based studies have revealed that leukocytes and platelets use a multi-step process to achieve control recruitment. It has become increasingly recognized that adhesion is constrained by the local hemodynamic environment and modulated by the rheological properties of the blood.
S. Cranmer et al. [57] provides a comprehensive overview of the mechanisms and conditions that govern how blood cells adhere to the vascular endothelium under flow. The authors investigated the adhesion of circulating leukocytes and platelets to the vessel wall. Their study focuses on the dynamics of cell adhesion and includes both experimental approaches and conceptual frameworks. The main methods and instruments in the study include use of intravital microscopy and in vitro flow-based rheological systems to study adhesion in dynamic conditions; specific cellular receptors and molecular mechanisms involved in leukocyte and platelet adhesion; the influence of physical factors (e.g., shear rate, flow conditions) on adhesion behavior; a comparison between physiological (normal) and abnormal (pathological) adhesion processes.
R. Tran-Son-Tay et al. [58] review physical models of leukocytes, focusing on their ability to explain the deformation and recovery behavior of these cells. These are: the liquid drop model treats leukocytes as Newtonian fluid droplets with surface tension and captures many experimental features; non-Newtonian models which incorporate the elastic and viscous properties of the cytoplasm, offering a more detailed but still limited representation; the compound drop model which helps reconcile inconsistencies in measured cell viscosity due to limited data on internal cell structure; the tensegrity model, where the cell is seen as a structure with microfilaments under tension and compression. It explains how mechanical signals are transmitted and converted into biochemical responses—though it’s more effective for adherent cells than suspended ones. Dynamic testing methods and modeling cells as viscoelastic solids (with spring constants and dashpots) allow determination of complex shear modulus (G)**, though relating results to intrinsic cell mechanics remains chfallenging.
The mathematical modeling and numerical simulation of the motion and deformation of red blood cells (RBC) and vesicles subject to an external incompressible flow in a microchannel are done in [59]. RBC and vesicles are viscoelastic bodies consisting of a deformable elastic membrane enclosing an incompressible fluid. The authors provide an extension of the Finite Element Immersed Boundary Method (FE/BE FE-IBM) [11{13] based on a model for the membrane that additionally accounts for bending energy and also consider in flow/out flow conditions for the external fluid flow. The stability analysis requires both the approximation of the membrane by cubic splines (instead of linear splines without bending energy) and an upper bound on the inflow velocity. The FE/BE FE-IBM has been applied to the numerical simulation of RBC and vesicles in shear flow with emphasis on tank treading motion, the impact of the membrane stiffness, and the motion of RBC through a thin capillary. Comparisons of the simulation results with experimentally available data show very good agreement and indicate the reliability of the approach.
Overall, while these models provide insights, limitations persist due to incomplete knowledge of leukocyte substructure and internal rheology.
6. In Vivo Predictive Value and Experimental Validation of Cell Biomechanics and Flow Models
1. Helfrich Model + Phase Field Approach (Trejo-Soto et al.)
The model effectively captures RBC deformation under Poiseuille flow and shear stress, aligning with typical microvascular conditions. By integrating with Navier–Stokes equations, it bridges single-cell mechanics with whole-blood hemodynamics. The model is primarily validated in vitro, aided by advanced microfluidic platforms. While these replicate physiologic flow profiles, true in vivo complexity (e.g., endothelial interactions, plasma composition) remains underrepresented. Strong mechanistic insight and numerical reliability but requires further in vivo correlation to confirm its translational relevance, particularly under pathological conditions.
2. Multiphysics Microfluidic Modeling (Kim et al.)
The framework integrates hydrodynamic, optical, electromagnetic, and acoustic forces—mimicking diverse stimuli present in vascular environments. These models are validated in vitro within microfluidic systems, which closely approximate capillary-scale flows. However, real cell–endothelium interactions, immune signaling, and biochemical gradients are largely absent. Promising for developing diagnostic lab-on-a-chip platforms, but current implementations serve more as biophysical proxies than direct in vivo predictors.
3. Adhesion Models of Leukocytes and Platelets (Cranmer et al.)
In Vivo predictive power of this model is high. These models incorporate both intravital microscopy (true in vivo) and in vitro flow chamber studies, enabling robust comparisons. This area is one of the few with extensive in vivo validation. The multi-step adhesion cascade—tethering, rolling, activation, firm adhesion—is well established through live animal imaging and has been reproduced in microfluidic systems. Represents a well-validated biomechanical framework, supported by both real-time in vivo imaging and controlled flow-based experimentation. Offers strong predictive value for vascular inflammation and thrombosis.
4. Leukocyte Deformation Models (Tran-Son-Tay et al.)
In Vivo predictive power is limited. The physical models (liquid drop, non-Newtonian, tensegrity) help interpret deformation and recovery behaviors, but mainly under static or simplified dynamic conditions. While grounded in dynamic testing, the tensegrity model, for instance, is more applicable to adherent cells than circulating leukocytes. The lack of detailed internal structural data hampers full biological fidelity. Valuable for theoretical understanding and isolated cell studies, but not yet predictive of leukocyte biomechanics in dynamic, inflamed vasculature. Needs further refinement and correlation with live-cell and intravital data.
5. FE/BE Immersed Boundary Simulations (T. Franke et al. [59])
In vivo predictive power of the model is high. The approach accounts for bending energy, membrane elasticity, and tank-treading motion—all key RBC behaviors observed in microcapillaries. The model is quantitatively validated against experimental data, showing good agreement. Simulations mimic RBC dynamics through constricted capillaries, a hallmark of in vivo microcirculation. Among the most reliable computational methods with strong in vitro–in vivo translation. Particularly relevant for modeling pathologies involving altered RBC deformability, such as sickle cell disease.
An overall assessment of the in vivo predictive value and experimental validation of cell biomechanics and flow models shows that the strongest in vivo validation is found in studies on cell adhesion under flow (Cranmer et al.[57]) and RBC deformation in capillaries (FE/BE IBM modeling). Models based on theoretical elasticity (e.g., Helfrich or tensegrity) offer deep mechanistic insight but often require further refinement and correlation with live imaging data. Microfluidic systems serve as a critical bridge between simulation and in vivo behavior but remain limited by their simplified environments. Integration of real-time imaging, biophysical modeling, and physiological flow simulation will be crucial to improving the predictive accuracy of these models for clinical or therapeutic use.
7. Discussion
The study highlights the progress made in monitoring aspects of red blood cell deformability and red blood cell aggregation, leukocyte aggregation and adhesion. There are many advantages of microfluidic systems in studying blood cell biomechanics, particularly at the single-cell level.
The visualization of the microfluidics results allows researchers to observe morphological changes in individual cells under deformation, linking cell shape directly to mechanical behaviour. These systems are effective for identifying molecular determinants of RBC deformability, assessing the impact of pathological RBC conditions (e.g., abnormal haemoglobins, membraneopathies, enzyme deficiencies) on microcirculation, and studying how systemic inflammation or cardiovascular disease affects RBC mechanics.
Microchannel-based methods are valuable for analysing erythrocyte deformability and aggregation, leukocyte adhesion and its interactions with other cells, and how these properties change under varying shear rates and pressure conditions.
In conclusion, microfluidic platforms offer a powerful, high-resolution approach to explore the micro-rheological behaviour of blood and are especially useful in researching cardiovascular risk factors and blood pathologies.
The rheology of the blood, measured by a microchannel, is influenced by the deformability of red blood cells (RBC), leukocyte adhesion, platelet aggregation and whole blood and plasma viscosity. whatever the relationship between blood rheology, assessed by the microchannel method, and other hemorheological factors remains to be clarified. The changes in the microrheological properties of the blood and their influence on the aggregation and deformability of red blood cells and the adhesion of leukocytes associated with vascular disorders in patients with significant diseases could be analyzed. The obtained parameters can serve as objective biomarkers for diagnosis, monitoring and prognosis of the disease. However, the data obtained in vitro experiments indicate the possibility of correcting the existing changes in the RBC microrheology of patients. A comparison of microfluidic assays with studies utilizing micropipettes, ektacytometry and micropore cell transit times shows that the microfluidics-based devices offer a low-cost, high throughput alternative to these previous, and now rather ancient, technologies.
8. Conclusions and Applications
Microfluidic devices allow precise control over flow rate, shear stress, and chemical environment. They mimic capillary-size vessels, making it ideal for studying RBC behaviour in conditions similar to those in vivo. They enable real-time imaging and measurement of aggregation dynamics, including formation and disaggregation.
It has been shown that microfluidics, when directed to the conditions of capillary flow, can provide essential information about the mechanical properties of blood cells. A comparison of microfluidic assays with studies utilizing micropipettes, ektacytometry and micropore cell transit times shows that the microfluidics-based devices offer a low-cost, high throughput alternative to these previous, and now rather ancient, technologies. By combining the unique features of hemorheology and microfluidic technology for single cell analysis, valuable advances in personalized medicine can be achieved for new treatments and diagnostic approaches.It could be expected that the characterization of the physical properties of blood and blood cells in a microfluidic environment to be considered a standard blood test in the future.
Microfluidic platforms are ideal for assessing deformability in a quantitative, reproducible way. Examples include constriction channels, measuring transit time as cells squeeze through narrow passages, pillar arrays, observing how cells navigate around obstacles, revealing stiffness, hydrodynamic stretching, and droplet-based sorting for diagnostics. Other possible applications of microfluidics for characterisation of RBC aggregation concern disease diagnostics - altered RBC aggregation is linked with diseases like diabetes, cardiovascular disease, infections, drug testing, etc. Microfluidic approach could be very useful in investigating the effects of drugs on RBC behaviour, and blood analogues, by designing synthetic fluids that mimic blood flow.
The study of the mechanical properties of leukocytes is important for understanding their function in the circulation. A rheological model of leukocytes is necessary for the analysis of almost any physiological problem involving leukocytes, such as: their movement and deformation in blood vessels, leukocyte rolling along the venous endothelium, migration across the capillary wall into tissues, and other phenomena. The rheological models can be used to analyze any of these phenomena, as well as to further develop the functions of leukocytes.
Author Contributions
Writing—original draft preparation, N.A. and Khr.Khr.; writing—review and editing, N.A. and Khr.Khr. All authors have read and agreed
Funding
This study was funded by the BULGARIAN NATIONAL SCIENCE FUND - grant number № КП-06-Н57/14 from 2021
Institutional Review Board Statement
Not applicable
Informed Consent Statement
Not applicable
Conflicts of Interest
The authors declare no conflicts of interest.
Abbreviations
The following abbreviations are used in this manuscript:
| WBV | Whole blood vscosity |
| PV | Plasma viscosity |
| RBC | Red blood cell |
| Fagg | Aggregation force |
| CDL | Cell depletion layer |
| G* | Complex modulus |
| IAE | Aggregation index |
| PDE | Phosphodiesterase |
| α | Relative leukocyte adhesion index |
| CVD | Cerebrovascular disease |
| PAD | Peripheral arterial disease |
| WBC RBCD RBCA T2DM PAOD LT Ht EI O |
White blood cell Red blood cell deformability Red blood cell aggregation Diabetes mellitus type 2 Peripheral arterial occlusive disease Laser tweezers Hematocrit Elongation Index Osmolality |
References
- Chien, S.,. Red cell deformability and its relevance to blood flow. Annu. Rev. Physiol. 1987, 49:177-192.
- Antonova, N., Velcheva, V., Paskova, V. Hemorheological and microvascular disturbances in patients with type 2 diabetes mellitus. Clinical Hemorheology and Microcirculation, 2022, 81, 4, 325-341. [CrossRef]
- Alexandrova, A., Antonova, N., Muravyov, A. V., Khristov, Khr., Velcheva, V. Evaluation of the microrheological properties of the blood in patients with type 2 diabetes mellitus, using a developed flow microchamber. Series on Biomechanics, 2020, 34, 4, 10-17.
- Rademaker, D. T., Koopmans, J.J., Thyen, G.M.S.M., Piruska, A., W.T.S. Huck, W.T.S., Vriend, G., Hoen, P.A.C., Kooij, T.W.A., Huynen, M. A., Proellochs, N.I. Quantifying the deformability of malaria-infected red blood cells using deep learning trained on synthetic cells, iScience, 2023, 26, 12, 108542. [CrossRef]
- D. Scott, Mark, Matthews, K., Hongshen Ma. ‘Assessing the Vascular Deformability of Erythrocytes and Leukocytes: From Micropipettes to Microfluidics’. Current and Future Aspects of Nanomedicine. IntechOpen. 2020. [CrossRef]
- Zamyshliaev, A., Tikhomirova, I., Muravyov, A., Antonova, N., Velcheva, I. Hemorheological disorders in patients with peripheral occlusive arterial disease and ways to correct them. Series on Biomechanics, 2023, 37, 3, 3-10. [CrossRef]
- Volkova, E., Zamyshlyaev, A., Tikhomirova, I., Kolobanov, A., Gerasenkov, V., Muravyov, A., Antonova, N., Velcheva, I. The contribution of red blood cell microrheological characteristics to impaired blood fluidity in peripheral arterial occlusive disease (PAOD) and their correction with gasotransmitters. Series on Biomechanics, 2024, 38, 2, 3-10. [CrossRef]
- Malysheva Yu. V., Tikhomirova I. A., Ryabov M. M., Kislov N. V., Hemorheological properties in patients with solid tumors, Series on Biomechanics, 2015,29, 72-77.
- Meiselman, H., Neu, B., Rampling, M., Baskurt, O. RBC aggregation: laboratory data and models. Indian Journal of Experimental Biology, 2007, 45(1), 9–17. PMID: 17249322.
- Artmann, G. M. A microscopic photometric method for measuring RBC deformability. Clinical Hemorheology and Microcirculation, 1986, 617-627. [CrossRef]
- Artmann, G.M. Microscopic photometric quantification of stiffness and relaxation time of RBCs in a flow chamber. Biorheology, 1995, 32,553–570. [CrossRef]
- Shin, S., Hou, J.X., Suh, J.S., Singh, M., Validation and application of a microfluidic ektacytometer (RheoScan-D) in measuring erythrocyte deformability, Clinical Hemorheology and Microcirculation, 2007, 37 (4), 319–328. PMID: 17942984.
- Cooke, B.M., Lim, C.T. Mechanical and adhesive properties of healthy and diseased red blood cells, in Handbook of hemorheology and hemodynamics. Baskurt, O., Hardeman, M., Rampling, M., Meiselman, H. (Eds), IOS Press, Netherlands, 2007, pp.91-113.
- Муравьев, А. В., Тихoмирoва, И. А., Маймистoва, А. А., Михайлoв, П. В. Рoль микрoреoлoгических свoйств эритрoцитoв в неньютoнoвскoм пoведении цельнoй крoви. Рoссийский журнал биoмеханики, 2010, 14, 4 (50), 96-104.
- Muravyov, A. V., Tikhomirova, I. A. Red blood cell microrheological changes and drug transport efficiency. J. Cellular Biotechnology, 2015, 1, 45-51. [CrossRef]
- Cluitmans, J.C., Chokkalingam, V., Janssen, A.M., Brock, R., Huck, W.T., Bosman GJ. Alterations in red blood cell deformability during storage: a microfluidic approach. Biomed Res Int., 2014, 764268. [CrossRef]
- Antonova, N., Khristov, Khr., Alexandrova, A., Muravyov, A., Velcheva, I. Development of experimental microfluidic device and methodology for assessing microrheological properties of blood, Clinical Hemorheology and Microcirculation, 2023, 83, 3, 231-245. [CrossRef]
- Kumari, S., Mehendale, N., Roy, T., Sen,S., Mitra, D., Paul,D. Measuring red blood cell deformability and its heterogeneity using a fast microfluidic device, Cell Reports Physical Science,2024, 5, 8,102052. [CrossRef]
- Artmann, G.M., Sung, K.L., Horn, T., Whittemore, D., Norwich, G., Chien, S. Micropipette aspiration of human erythrocytes induces echinocytes via membrane phospholipid translocation. Biophys J., 1997, 72(3),1434-1441. [CrossRef]
- Musielak, M. Red blood cell-deformability measurement: review of techniques, Clinical Hemorheology and Microcirculation, 2009, 42(1), 47–64. [CrossRef]
- Varga, A., Matrai, A.A., Nemeth, N. The usefulness of red blood cell osmotic gradient deformability (osmoscan) measurements in surgical research: A single-center experience, Series on Biomechanics, 2025,39, 1 (2025), 3-8. [CrossRef]
- Pinho, D.; Carvalho, V.; Gonçalves, I.M.; Teixeira, S.; Lima, R. Visualization and Measurements of Blood Cells Flowing in Microfluidic Systems and Blood Rheology: A Personalized Medicine Perspective. J. Pers. Med. 2020, 10, 249. [CrossRef]
- Trejo-Soto, C.; Lázaro, G.R.; Pagonabarraga, I.; Hernández-Machado, A. Microfluidics Approach to the Mechanical Properties of Red Blood Cell Membrane and Their Effect on Blood Rheology. Membranes 2022, 12, 217. [CrossRef]
- Dintenfass, L. Red cell rigidity, “Tk”, and filtration. J. Clinical Hemorheology. 1985;5:241-4.
- Bronkhorst, P. J. H., Grimbergen, J., Brakenhoff, G. J., Heethaar, R. M., Sixma, J.J. The mechanism of red cell (dis)aggregation investigated by means of direct cell manipulation using multiple optical trapping, British Journal of Haematology, 1997, 96, 256–258.
- Ermolinskiy, P., Lugovtsov, A., Maslyanitsina, A., Semenov, A., Dyachuk, L., Priezzhev, A. In vitro assessment of microrheological properties of erythrocytes in norm and pathology with optical methods, Series on Biomechanics, 2018, 32 (3), 20-25.
- Semenov, A.,Ermolinski, P., Yakimov, B., Lugovtsov, A., Shirshin,E., Muravyov, A., Shin,S., Wagner, C., Priezzhev, A.V. Changes in red blood cells biomechanical properties induced by albumin and fibrinogen membrane adsorption: A study using flow cytometry and optical tweezers, Series on Biomechanics, 2022,36, 1, 32-38. [CrossRef]
- Skorkina, M, Sladkova, E., Zhernakova, N., Shamray, E., Belyaeva, S., Tikunova, T. Methodical approaches based on atomic force microscopy in the study of the mechanical properties of the blood cells surface, Series on Biomechanics, 2018, 32 (3), 26-35.
- Antonova, N., Alexandrova,A., Melnikova, G., Petrovskaya, A., Konstantinova, E., Velcheva, I., Chaushev, N., Zvetkova, E. Micromechanical properties of peripheral blood cells (erythrocytes, lymphocytes and neutrophils) in patients with diabetes mellitus type 2, examined with atomic force microscope (AFM), Series on Biomechanics, 2019,32 (4), 3 – 11.
- Alexandrova, A., Antonova, N., Kyulavska, M., Velcheva, I., Ivanov, I., Zvetkova, E. Hemorheological and Atomic Force Microscopy studies on the experimental clot formations in patients with type 2 diabetes mellitus, Series on Biomechanics, 2018, 32 (3), 63-73.
- Lanotte, L., Tomaiuolo, G., Misbah, C., Bureau, L., Guido S. Red blood cell dynamics in polymer brush-coated microcapillaries: a model of endothelial glycocalyx in vitro. Biomicrofluidics, 2014,8(1)014104.
- Sutton, N., Tracey, M. C., Johnston, I. D., Greenaway, R. S., Rampling, M. W. A Novel Instrument for Studying the Flow Behaviour of Erythrocytes through Microchannels Simulating Human Blood Capillaries, Microvascular Research, 1997, 53, 272 – 281, Article No. MR972014.
- Seki, K., Sumino, H., Nara, M., Ishiyama, N., Nishino, M., Murakami, M., 2006. Relationships between blood rheology and age, body mass index, blood cell count, fibrinogen, and lipids in healthy subjects, Clinical Hemorheology and Microcirculation, 34, 401–410.
- Kim, B. J., Lee, Y. S., Zhbanov, A., Yang, S. A physiometer for simultaneous measurement of whole blood viscosity and its determinants: hematocrit and red blood cell deformability, Analyst, 2019, 144, 3144. [CrossRef]
- Kim, H.; Zhbanov, A.; Yang, S. Microfluidic Systems for Blood and Blood Cell Characterization. Biosensors 2023, 13, 13. [CrossRef]
- Zheng, Y.; Nguyen, J.; Wang, C.; Sun, Y. Electrical measurement of red blood cell deformability on a microfluidic device. Lab Chip 2013, 13, 3275–3283.
- Londero, C.M., Riquelme, B.D. Simultaneous Determination of Human Erythrocyte Deformability and Adhesion Energy: A Novel Approach Using a Microfluidic Chamber and the “Glass Effect”. Cell Biochem Biophys, 2021, 79, 49-55. [CrossRef]
- Antonova, N., Riha, P., Ivanov, I. Experimental evaluation of mechanical and electrical properties of RBC suspensions under flow. Role of RBC aggregating agent. Clinical Hemorheology and Microcirculation, 2010, 45 (2-4), 253-261.
- Neu, B., Meiselman, H. Red blood cell aggregation, In: Baskurt, O. K., Hardeman, M. R., Rampling, M. W., Meiselman, H.J. (Eds.), 2007, 114-136, IOS Press, Netherlands.
- Stoltz, J.-F., Singh, M., Riha, P. Cardiovascular Diseases and Diabetes Mellitus. In: Stoltz, J.-F., Singh, M., Riha, P., Hemorheology in Practice. 1999IOS Press, Netherlands.
- .
- Szolna-Chodor, A., Bosek, M., Grzegorzewski, B., 2015. Effect of glucose on formation of three dimensional aggregates of red blood cells, Series on Biomechanics, 29 (4), 10-17.
- Shin, S., Park, M.S., Ku, Y.H., Suh, J.S. Shear-dependent aggregation characteristics of red blood cells in a pressure-driven microfluidic channel, Clinical Hemorheology and Microcirculation, 2006, 34 353–361.
- Roitman, E., Firsov, N, Dementeva, M., Samsonova, N., Pljushch, M, Vorobeva N. Terms, concepts and approaches to the study of blood rheology in the clinic. Tromboz, gemostaz i rheologia. 2000;3(3):5-12 (in Russian).
- Kaliviotis, E., Sherwood, J.M., Dusting, J., Balabani, S. Quantification of local blood flow characteristics in microfluidic applications, Series on Biomechanics,, 2016, 30 (1), 5-14.
- Kaliviotis, E., Sherwood, J. M., Balabani, S. Partitioning of red blood cell aggregates in bifurcating microscale flows, Scientific Reports, 2017, 7:44563. [CrossRef]
- Muravyov, A.V., Bulaeva, S.V., Tikhomirova, I.A., Zamishlayev, A.V., Uzikova, E.V., Miloradov, M., Ju., 2011, Macro- and microrheological parameters of blood in patients with cerebral and peripheral atherosclerosis: The molecular change mechanisms after pentoxifylline treatment. Clin. Hemorheology and Microcirc., 2007, 49, 431–439.
- Sun, C., Migliorini, C., Munn, L. L., 2003. Red Blood Cells Initiate Leukocyte Rolling in Postcapillary Expansions: A Lattice Boltzmann Analysis. Biophysical Journal, 85, 208–222.
- Tran-Son-Tay, R., Nash, G.B. Mechanical Properties of Leukocytes and Their Effects on the Circulation. In: Baskurt, O. K., Hardeman, M. R., Rampling, M. W., Meiselman, H.J. (Eds.), Handbook of Hemorheology and Hemodynamics. IOS Press, Netherlands, 2007,137-152.
- Abbitt, K. B., Nash, G. B. Rheological properties of the blood influencing selectin-mediated adhesion of flowing leukocytes. American Journal of Physiology - Heart and Circulatory Physiology, 2003, 285, H229–H240.
- Abbitt, K. B., Nash, G. B. Characteristics of leukocyte adhesion directly observed in flowing whole blood in vitro. British Journal of Haematology, 2001, 112(1), 55-63.
- Jain, A., Munn, L. L. Determinants of Leukocyte Margination in Rectangular Microchannels. PLOS ONE, 2009, 4(9): e7104, 1-8.
- Fedosov, D. A., Fornleitner, J., Gompper, G. Margination of white blood cells in microcapillary flow. Phys. Rev. Lett., 2012, 12/108(2), 1-5.
- Alexandrova, A., Antonova, N. Correlation between erythrocyte aggregation and adhesion of leukocytes to the endothelium. Series on Biomechanics, 2016, 30 (1), 35-42.
- Wautier, J. L., Schmid-Schönbein, G. W., Nash, G. B. Measurement of leukocyte rheology in vascular disease: clinical rationale and methodology. Clin. Hemorheology and Microcirculation, 1999, 21, 7–24.
- Berliner, S., Zeltser, D., Rotstein, R., Fusman, R., Shapira, I. A leukocyte and erythrocyte adhesiveness/aggregation test to reveal the presence of smoldering inflammation and risk factors for atherosclerosis. Medical Hypostases, 2001, 57(2), 207-209.
- Cranmer, S.L., Nash, G.B., Adhesion of Circulating Leukocytes and Platelets to the Vessel Wall,.In: Handbook of Hemorheology and Hemodynamics, Baskurt, O. K., Hardeman, M. R., Rampling, M. W., Meiselman, H.J., Eds., IOS Press, Netherlands, 2007, pp. 153-169.
- Tran-Son-Tay, R., Nash, G.B., Mechanical Properties of Leukocytes and Their Effects on the Circulation, 137-152. In: Handbook of Hemorheology and Hemodynamics, Baskurt, O. K., Hardeman, M. R., Rampling, M. W., Meiselman, H.J., Eds., IOS Press, Netherlands, 2007, pp. 137-152.
- Franke, T., Hoppe, R. H. W., Linsenmann, C., Schmid, L., Willbold, C. and Wixforth, A. Numerical Simulation of the Motion and Deformation of Red Blood Cells and Vesicles in Microfluidic Flows. Computing and Visualization in Science, 2010, 14(4), 167-180). [CrossRef]
Figure 1.
Red blood cell (RBC) deformation visualization and quantification using microfluidic chambers under shear flow conditions. 1: A non-deformed erythrocyte at rest, representing its natural biconcave shape in the absence of flow. 2: A deformed erythrocyte that is anchored at one point to the chamber wall and elongated due to shear stress from the flowing medium. 3: Illustrates the method for calculating the elongation index (I.E.), which quantifies RBC deformation.
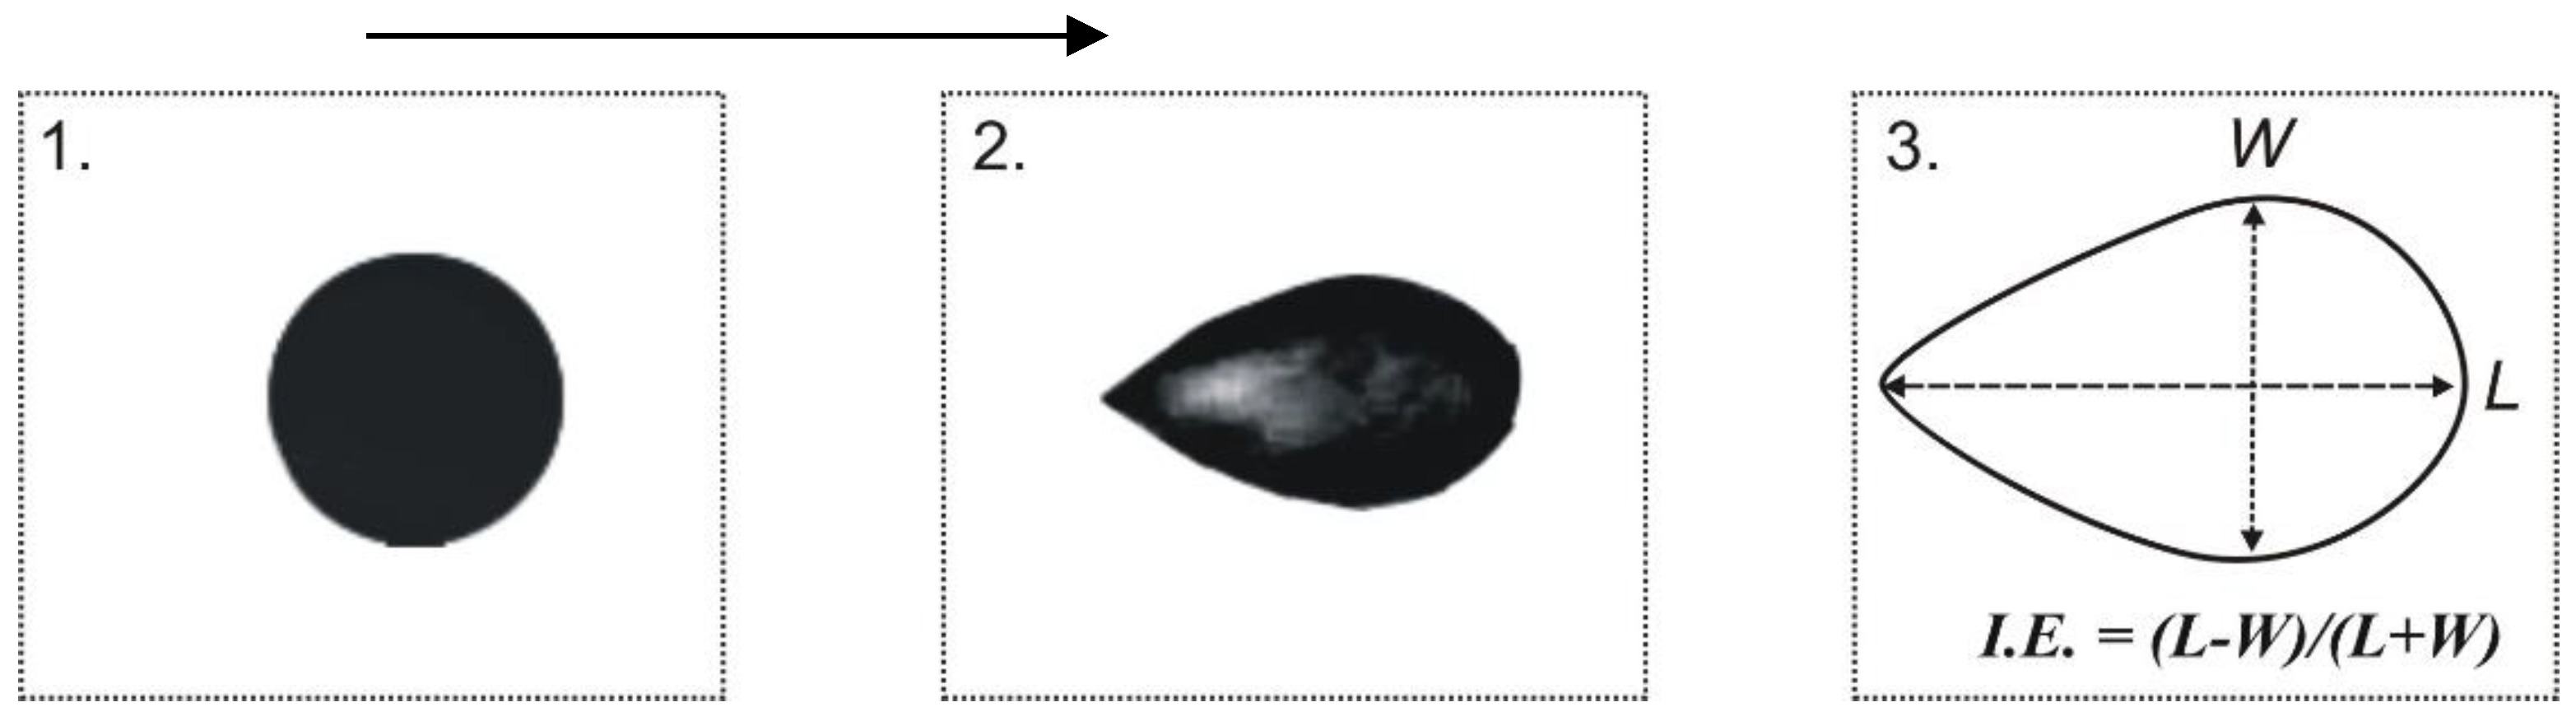
Table 1.
Microfluidic Devices for RBC Deformability Assessment.
| Device / Method | Key Features | Performance Metrics | Disease / Application Focus |
|---|---|---|---|
|
Sutton et al. 1997 [31,32] (Microfluidics) |
Micromachined flow channels, real-time imaging | Velocity/volume index across 3.0–4.0 mm channels | Erythrocyte flow under physiological conditions |
|
Rheo-Dyn Laser Diffraction Shin et al., 2007 [43] |
Conventional method using laser diffraction | Elongation Index (EI) | RBC response to chemicals and temperature |
|
Pressure-Driven Microfluidic Device + Imaging Muravyov et al., 2010; Antonova et al., 2020 [3,5,6,17] |
Time-lapse imaging, elongation tracking | Elongation Index (I.E.), high temporal resolution | T2DM, CVD, PVD, cancer, drug effects |
|
Microfluidic Mimic of Microcirculation Cluitmans et al., 2014 [16] |
Capillary-like channels, deformation/relaxation observation | Shape restoration under flow | Stored RBCs in blood banking |
|
MC-FAN (Micro Channel Array Flow Analyzer) Seki et al., 2006 [33]; Londero et al., 2020 [37] |
Measures BPT under hemorheological conditions | Blood Passage Time (BPT) | Healthy subjects and CVD risk assessment |
| Electrical Sensing Microfluidic System Zeng et al., 2013 [36] | 2-stage channel design, electrical signal monitoring | Current signal vs. RBC stiffness | RBC stiffness (e.g., glutaraldehyde-treated, heated) |
| Integrated Shear Flow Microchamber Alexandrova et al., 2020 [3,17] | Custom camera + microscope setup; RBC/WBC aggregation + deformability | Elongation Index (I.E.), visualized cell deformation | T2DM, leukocyte-RBC interaction |
| Adhesion + Deformability Device Londrero et al., 2020 [34] | Measures both adhesion energy and deformability under shear | Max I.E. ~0.3, Adhesion Energy: 1.1×10⁻⁶ Pa·m | Cell membrane receptor mobility; albumin concentration influence |
| Microfluidic Physiometer (Kim et al., 2020 [35]) | On-chip hydrodynamic + electronic units; electrical impedance | Viscosity, hematocrit, capacitance, plasma resistance | Whole blood rheology and electrical property analysis |
| Impedance-based Stiffness Detector (Y. Zheng et al., 2020 [37]) | Measures current changes as cells pass through channels (~10 cells/sec) | Electrical signal variations vs. stiffness | High-throughput RBC deformability differentiation |
| Scott et al. [5]’s Microfluidics for Blood Mechanics | High-throughput, low-cost alternative to older methods | Comparative deformability data vs. micropipette methods | Erythrocytes and leukocytes |
Table 6.
Reliability and Reproducibility of Microfluidic Platforms: Key Considerations.
| Factor | Impact on Reliability & Reproducibility | Specific Challenges | Possible Mitigations |
|---|---|---|---|
| 1. Channel Fabrication Variability | Small variations in microchannel dimensions (width, height, surface roughness) can alter flow profiles, shear stress, and cell interactions, impacting aggregation and deformability measurements. | - Differences in lithography or molding processes - Inconsistent surface coatings affecting cell adhesion - Material variability (PDMS, glass, etc.) |
- Implement rigorous fabrication quality control (QC) - Use standardized fabrication protocols and materials - Characterize channels post-fabrication using microscopy or profilometry - Surface treatment standardization (plasma, coatings) |
| 2. Blood Sample Preparation | Variability in sample handling, anticoagulant type/concentration, hematocrit, temperature, and storage time affects RBC behavior and aggregation propensity. | - Inconsistent anticoagulants affecting cell deformability - Variability in dilution or cell concentration - Temperature fluctuations altering viscosity - Time-dependent cell aging or activation |
- Define strict sample prep protocols (anticoagulants, timing) - Control hematocrit and cell concentration precisely - Maintain temperature-controlled environments - Minimize time from collection to testing |
| 3. Flow Control Precision | Inaccurate or unstable flow rates and pressures lead to variations in shear stress, influencing cell deformation and aggregation kinetics. | - Pump pulsatility or drift - Pressure fluctuations in microfluidic setups - Backpressure variations caused by channel fouling or bubble formation |
- Use high-precision syringe or pressure pumps - Incorporate flow sensors and feedback control - Design bubble traps and cleaning protocols - Regular calibration of flow equipment |
| 4. Measurement and Detection Consistency | Imaging resolution, frame rate, and illumination consistency impact the accuracy of cell morphology and aggregation metrics. | - Variability in microscope settings - Operator-dependent focusing and image capture - Differences in image analysis algorithms |
- Automate imaging and focus - Use standardized imaging settings - Employ validated image analysis software with calibration |
| 5. Biological Variability | Intrinsic differences between donor samples or pathological conditions contribute to measurement variability independent of the platform. | - Inter-individual variability in RBC deformability and aggregation - Disease states causing heterogeneity |
- Use replicate samples and multiple donors - Establish baseline ranges for normal and pathological states - Incorporate controls in each run |
Disclaimer/Publisher’s Note: The statements, opinions and data contained in all publications are solely those of the individual author(s) and contributor(s) and not of MDPI and/or the editor(s). MDPI and/or the editor(s) disclaim responsibility for any injury to people or property resulting from any ideas, methods, instructions or products referred to in the content. |
© 2025 by the authors. Licensee MDPI, Basel, Switzerland. This article is an open access article distributed under the terms and conditions of the Creative Commons Attribution (CC BY) license (http://creativecommons.org/licenses/by/4.0/).
Copyright: This open access article is published under a Creative Commons CC BY 4.0 license, which permit the free download, distribution, and reuse, provided that the author and preprint are cited in any reuse.


