
Submitted:
19 July 2025
Posted:
21 July 2025
You are already at the latest version
Abstract
Rolling linear guide pairs are extensively utilized in CNC machine tool industry and other industries. To efficiently and accurately assess the performance indicators of guide pairs, a multi-parameter test bench has been developed. Parameters measured on the test bench include motion accuracy, preload drag force, vibration, and temperature rise, and fatigue life of rolling linear guides. The mechanical structure and measurement control system of the test bench were designed according to measurement principles and methods. ANSYS software was utilized to investigate statics analysis of the gantry, modal analysis of the upper bed, and simulation analysis of the impact of loading block thickness on load distribution uniformity for the tested guide pairs. The analysis results validated the rationality of the structural design. In order to validate the accuracy of the multi-parameter test bench, comparative experiments were conducted using Hilectro LGD35 model guide pairs as the research object. The experiments focused on assessing the motion accuracy, preload drag force, and fatigue life of the targeted guide pairs. The experimental results demonstrated that the test bench achieves a high level of accuracy, and verified the correctness of the derivation equations for motion accuracy measurement.
Keywords:
rolling linear guide pair
; test bench
; motion accuracy
; preload drag force
; fatigue life
; verification by comparative experiment
1. Introduction
The rolling linear guide pair is a specialized type of rolling bearing guide mechanism that developed in the late 1970s and has improved progressively based on the fundamental principles of rolling bearings. The composition of this system includes a linear guide rail, rolling elements (balls or rollers), sliding blocks, and other mechanical components, which serve two purposes of bearing loads and providing motion guidance for moving parts in mechanical transmissions [1,2]. A straightforward structure, low dynamic and statics friction coefficients, high precision in positioning, and excellent accuracy retention are advantages of rolling linear guide pair. This emerging technology widely applied in various high-precision mechanical equipment such as machine tools, industrial robots, food machinery, medical devices, and IC packaging systems, and significantly influences the stability, precision, and reliability of the overall system [3].
CNC machine tools represent advanced equipment in which the rolling linear guide pair serves as a critical part due to the integration of various functional components. Its load-bearing characteristics, precision retention, and reliability are key factors that determine the overall performance of the machine [4]. With the introduction of ‘Made in China 2025’, the Chinese government has begun to provide significant support for the research and development of CNC machine tools and related key components. Supported by national science and technology initiatives, leading Chinese industrial enterprises (e.g., Guangdong Kaite, Nanjing Craft, and Hanjiang Machine Tool) have made substantial advancements in the rigidity and comprehensive performance of their linear guide rail products, gradually entering the mid-to-high-end market for rolling functional components. However, the overall quality of Chinese linear rolling guide products remains relatively limited in terms of product diversity, especially in accuracy retention, compared to well-established foreign brands such as THK and NSK from Japan as well as INA and Rexroth from Germany. The accuracy retention time of Chinese rolling linear guide by-products is approximately two-thirds that of imported products, which makes it challenging for them to meet the high-accuracy and high-reliability requirements of advanced CNC machine tools. Therefore, the linear guide pairs used in Chinese high-end CNC machine tools still heavily rely on imported components. This is because the Chinese enterprises mainly focused on production and manufacturing in the fundamental research of guide rail products, which has resulted in a lack of foundational technological theories and experimental studies related to rolling linear guide pairs [5].
In recent years, numerous researchers have made significant contributions to the development of rolling linear guide test benches. Xu et al. [6] designed a comprehensive performance testing device for rolling linear guide pairs, optimizing the key components from perspective of weight reduction, mechanical performance enhancement, and vibration characteristics. This design improved the overall safety performance of the test bench. Additionally, they developed a dynamic measurement system software using Visual Basic to enable data acquisition, processing, storage, and reporting. However, this test bench lacked a loading mechanism which resulted in a limitation of its ability to measure the comprehensive performance parameters (e.g., operational accuracy and vibration) under realistic application conditions. Based on the principle of contact measurement, Wang et al. [7] designed a test bench for assessing the motion accuracy of rolling linear guide pairs. The system utilized five contact displacement sensors to comprehensively measure the top surface parallelism, side surface parallelism, roll angle, yaw angle, and pitch angle. However, experimental verification demonstrated that the angle changes in different directions during the operation of guide pair were minimal, leading to a waste of the sensors utilization. Additionally, the calculation formulas for parallelism of top and side surfaces were complex and inconvenient to use. Xu [8] developed a device for evaluating the lifespan of rolling linear guide pairs. This test bench incorporates various hardware systems, including power supply, loading, operation, lubrication, and testing, in alignment with the control and testing requirements. However, the lifespan testing bench does not contain a corresponding monitoring system to prevent real-time observation of experimental process and timely acquisition of fatigue failure data for the rolling linear guide pair. Furthermore, lifespan calibration for the rolling linear guide pair and a validation process for the functionality of the test bench are neglected in this study. Besides, Li et al. [9] introduced a dynamic friction measurement system for rolling linear guides, which encompasses system planning, hardware setup, software for data acquisition and processing, and experimental data analysis. Li et al. [10] designed a resistance device for linear guides and conducted operational resistance tests. However, the design of test bench is limited, as it unable to measure multiple parameters of the guide pair.
The purpose of this study is to present the design of a rolling linear guide pair multi-parameter test bench that aimed at measuring the comprehensive performance [11] and fatigue life [12] of the guide pair. The mechanical structure and measurement control system of test bench are developed based on the experimental principles, with design validity confirmed through statics and modal analyses. Finally, a comparative analysis of the measurement results against relevant industry standards and theoretical calculations confirmed the accuracy of multi-parameter measurements conducted by the test bench. This work addresses the challenge of efficiently measuring multiple parameters of rolling linear guide pairs on a single test bench, offering practical value for verifying guide pair performance and confirming their certification.
2. Measurement Principles
2.1. Measurement Principle of Motion Accuracy
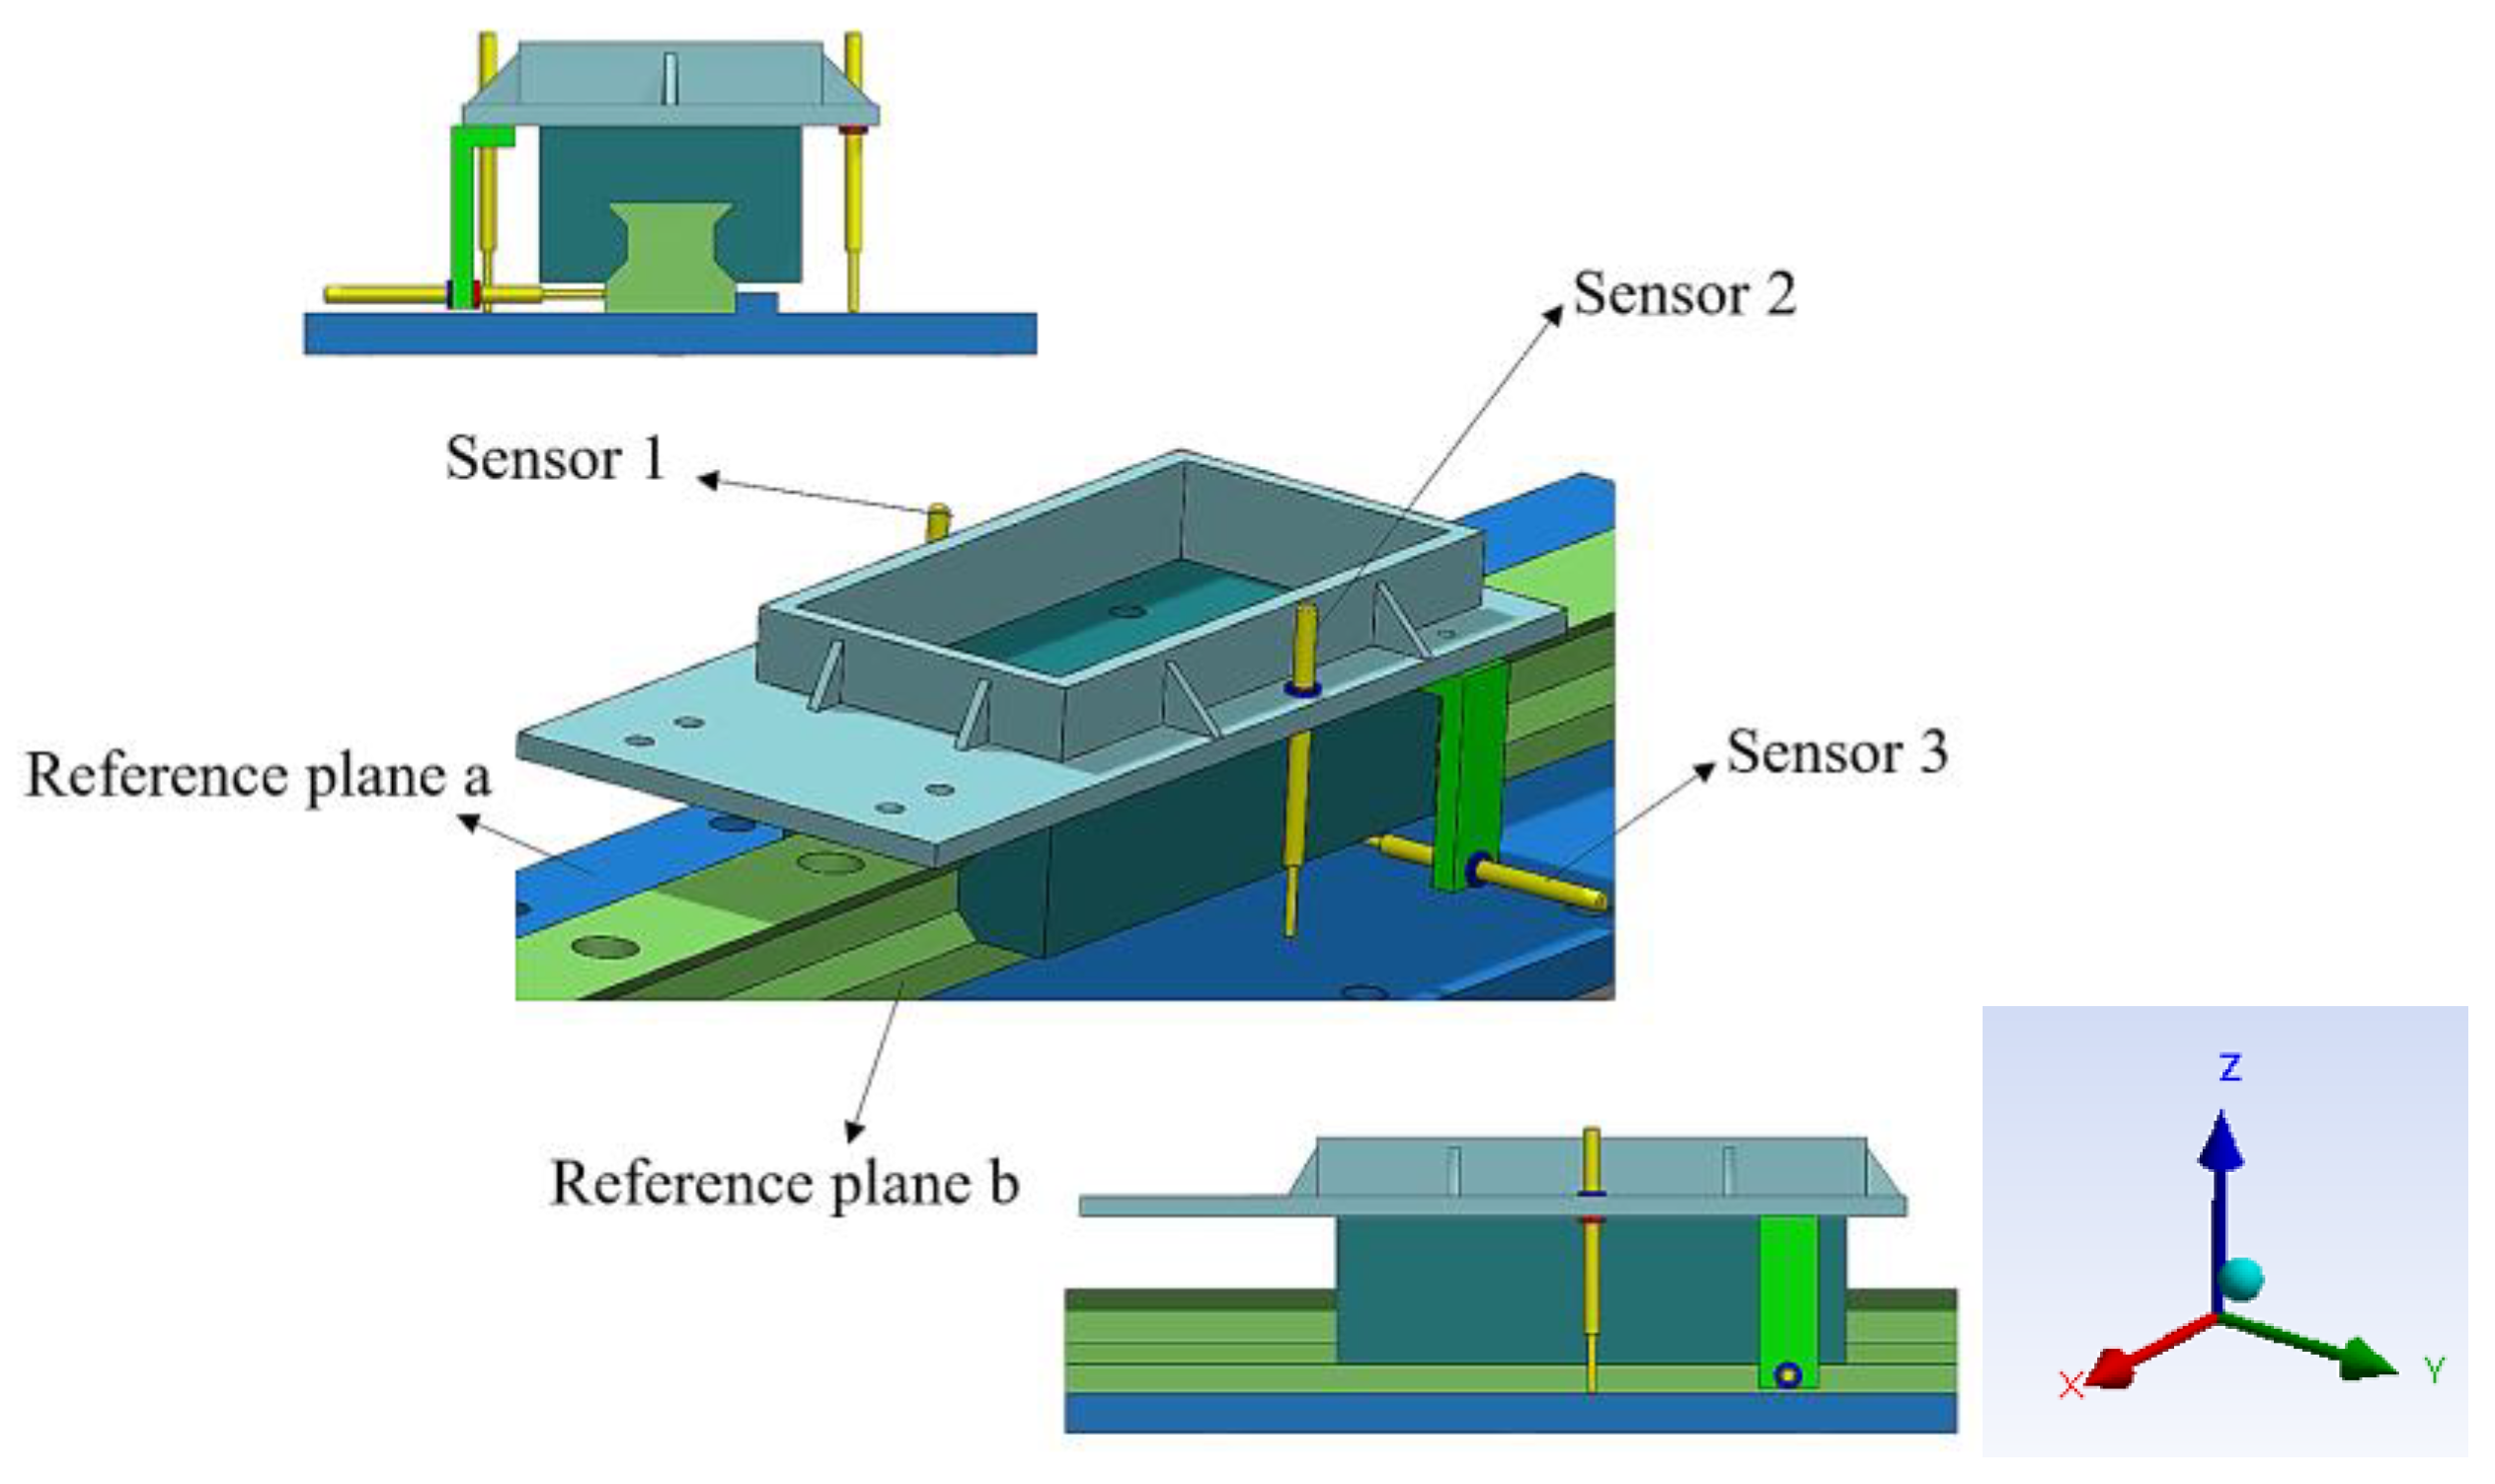
Figure 1 illustrates the installation position of three contact displacement sensors. Sensor 1 and Sensor 2 are positioned vertically against reference surface a, mounted symmetrically on either side of the center of the slider top surface. Sensor 3 contacts reference surface b at the rear end of the slider. The direction of the X-axis corresponds to the motion direction of the guide pair. The operational precision of the guide pair includes horizontal and vertical parallelism as well as deflection angles in the X, Y, and Z directions, specifically the tilt, pitch, and yaw angles [13]. Horizontal parallelism is defined as the maximum variation in the distance from side surface center of slider to reference surface b during motion. Vertical parallelism is defined as the maximum distance variation from the top surface center of slider to reference surface a during movement. Experimental validation results indicate the negligible changes in pitch and yaw angles hence only the tilt angle is considered in this study. The tilt angle is defined as the maximum deflection of the slider relative to the guide pair in the direction of the X-axis during operation.
Figure 1.
Schematic diagram of the installation of contact displacement sensors.
The geometric relationship diagram used for calculating motion accuracy is presented in Figure 2. The data obtained from Sensor 1, Sensor 2, and Sensor 3 are denoted as deviations S1, S2, and S3 from the initial zero point of the sensors, respectively. The distance between Sensor 1 and Sensor 2 is represented as L1. Point A is located at the center of the top surface of the slider, with a distance h1 from the reference surface a. The distance from mounting hole of Sensor 3 to the upper surface of slider is L2 and to the side surface of slider is L4. L3 denotes the thickness of the slider, and Point B is h2 from reference surface b. Additionally, the distances from the mounting holes of Sensor 1, Sensor 2, and Sensor 3 to their respective reference surfaces are denoted as H1, H2, and H3. The tilt angle is represented by θ, while vertical and horizontal parallelism are indicated by ∆1 and ∆2, respectively.
Figure 2.
Geometric relationship diagram.

Based on these geometric relationships, the equations for calculating motion accuracy are derived as follows:
Equations (1), (2), and (3) illustrate the actual distances from each measurement point to the reference surface. Equation (4) is used to calculate the tilt angle. Additionally, equation (5) indicates the actual distance from the center A of the slider's upper surface to reference surface a. Equation (6) defines the vertical parallelism to indicate the difference between the maximum and minimum values across all sampling points. Moreover, the actual distance from the center B of the slider's side surface to reference surface b is specified by Equation (7). Finally, equation (8) describes the horizontal parallelism to capture the difference between the maximum and minimum values across all sampling points.
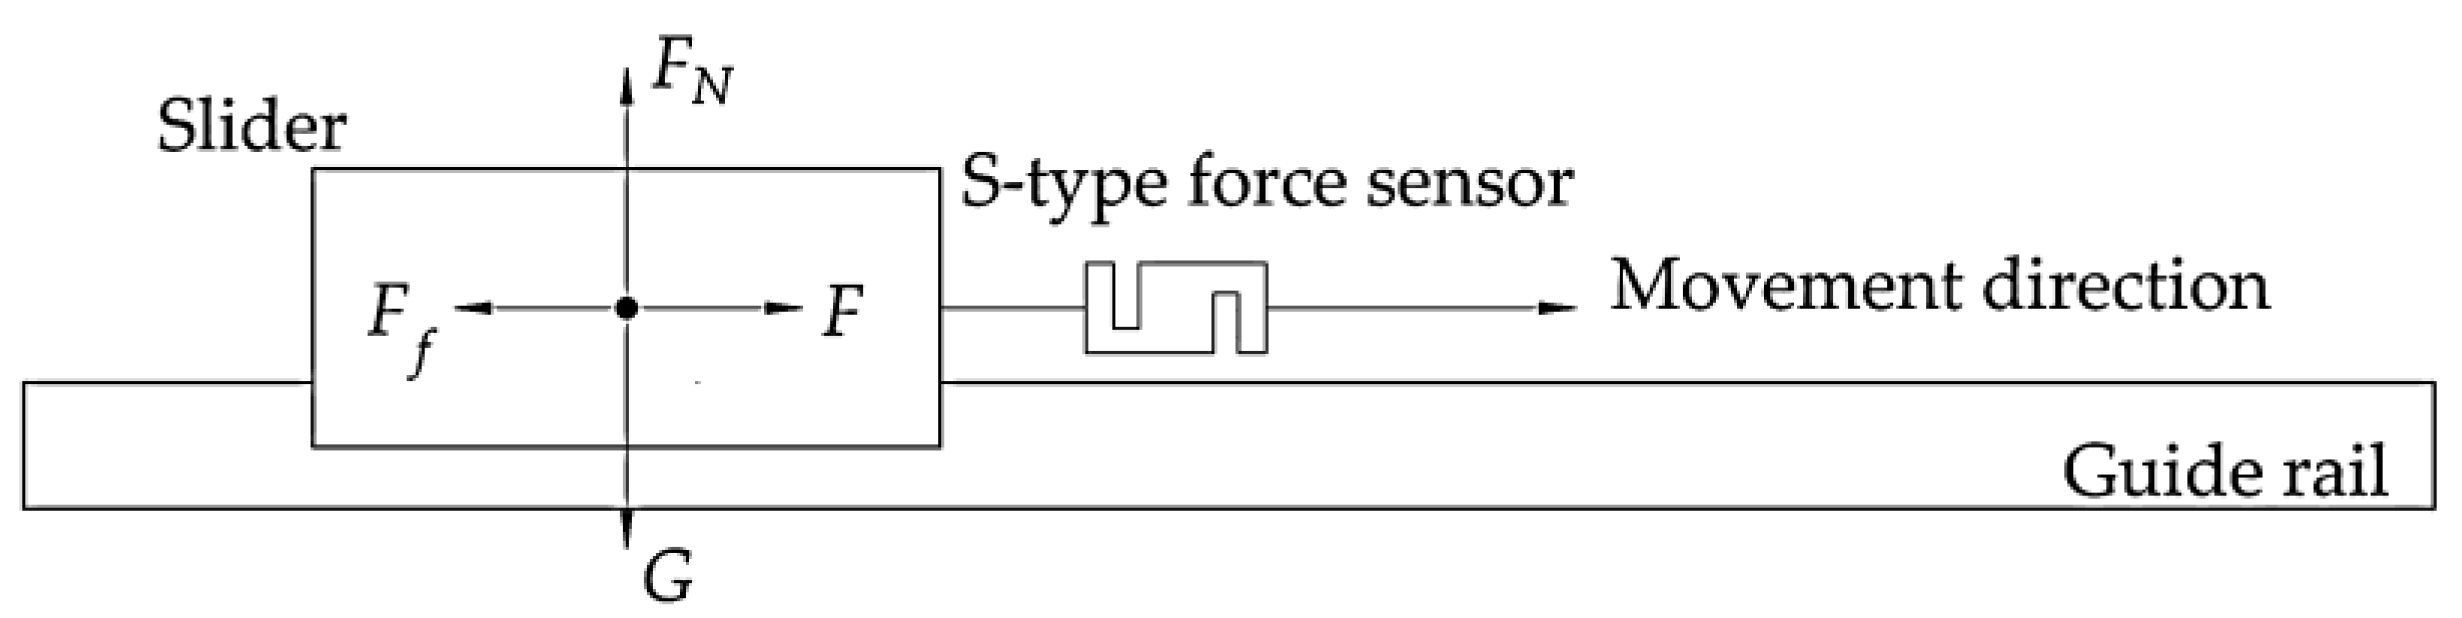
2.2. Measurement Principle of Preload Drag Force
To eliminate reverse backlash and enhance the dynamic rigidity and reliability of guide pairs, various degrees of preloading forces must be applied across most applications. The preload force is considered an internal force within the guide pair, primarily determined by the interference of the rolling elements. The preload drag force is the force that required to overcome the preload force, enabling the slider to maintain a constant speed relative to the guide rail [14].
The measurement of preload drag force is based on the fundamental principles of Newtonian mechanics. As demonstrated in Figure 3, an S-type force sensor is employed to measure it. When the driving force F pulls the slider from left to right, the S-type force sensor experiences a pulling force. In addition to its own weight G, the slider is subject to the supporting force FN from the guide rail, the external driving force F and the frictional force Ff acting opposite direction of motion along the guide rail raceway. The frictional force Ff represents the preload drag force. The weight and supporting force are equal in magnitude and opposite in direction. When the slider moves uniformly along the guide rail, the magnitude of the driving force matches that of the preload drag force. Therefore, measuring the driving force using the S-type force sensor allows for an indirect measurement of the preload drag force. The same principle applies when the driving force pushes the slider to the left.
Figure 3.
The force diagram of the slider during the uniform motion process.
2.3. Test Principle of Fatigue Life
The rated lifespan of a guide rail pair refers to the expected life of a single unit or batch of identical rolling linear guide pairs under consistent working conditions. It utilizes standard materials and adheres to manufacturing quality standards with a 90% reliability rate [15]. The criterion for determining the rated lifespan of the guide pair is based on fatigue failure, which is identified by pitting or spalling on the raceway or rolling elements commonly known as fatigue life. The basis for failure determination is that the spalling depth is≥0.05 mm, the spalling area is ≥0.5 mm2 for ball linear guide pairs, and ≥1.0 mm2 for roller linear guide rail pairs [16]. The equation for the fatigue life calculation of the guide pair is [17]:
where Lar is the rated life. Lf is the test life. Pf is the test dynamic equivalent load. P is the equivalent dynamic load under normal working conditions. n is the exponent, n = 3 for ball guide pairs, and n = 10/3 for roller guide pairs.
According to equation (9), calculating the rated lifespan of the guide rail pair requires applying the equivalent dynamic test load and monitoring the corresponding testing duration. Consequently, the test bench have to equipped with a loading mechanism as well as vibration and temperature sensors to detect potential failure. This study simulates typical operational conditions by applying vertical loading to the guide rail pair.
3. Composition of the Test Bench
3.1. Mechanical Structure Design
3.1.1. Composition of Overall Structure
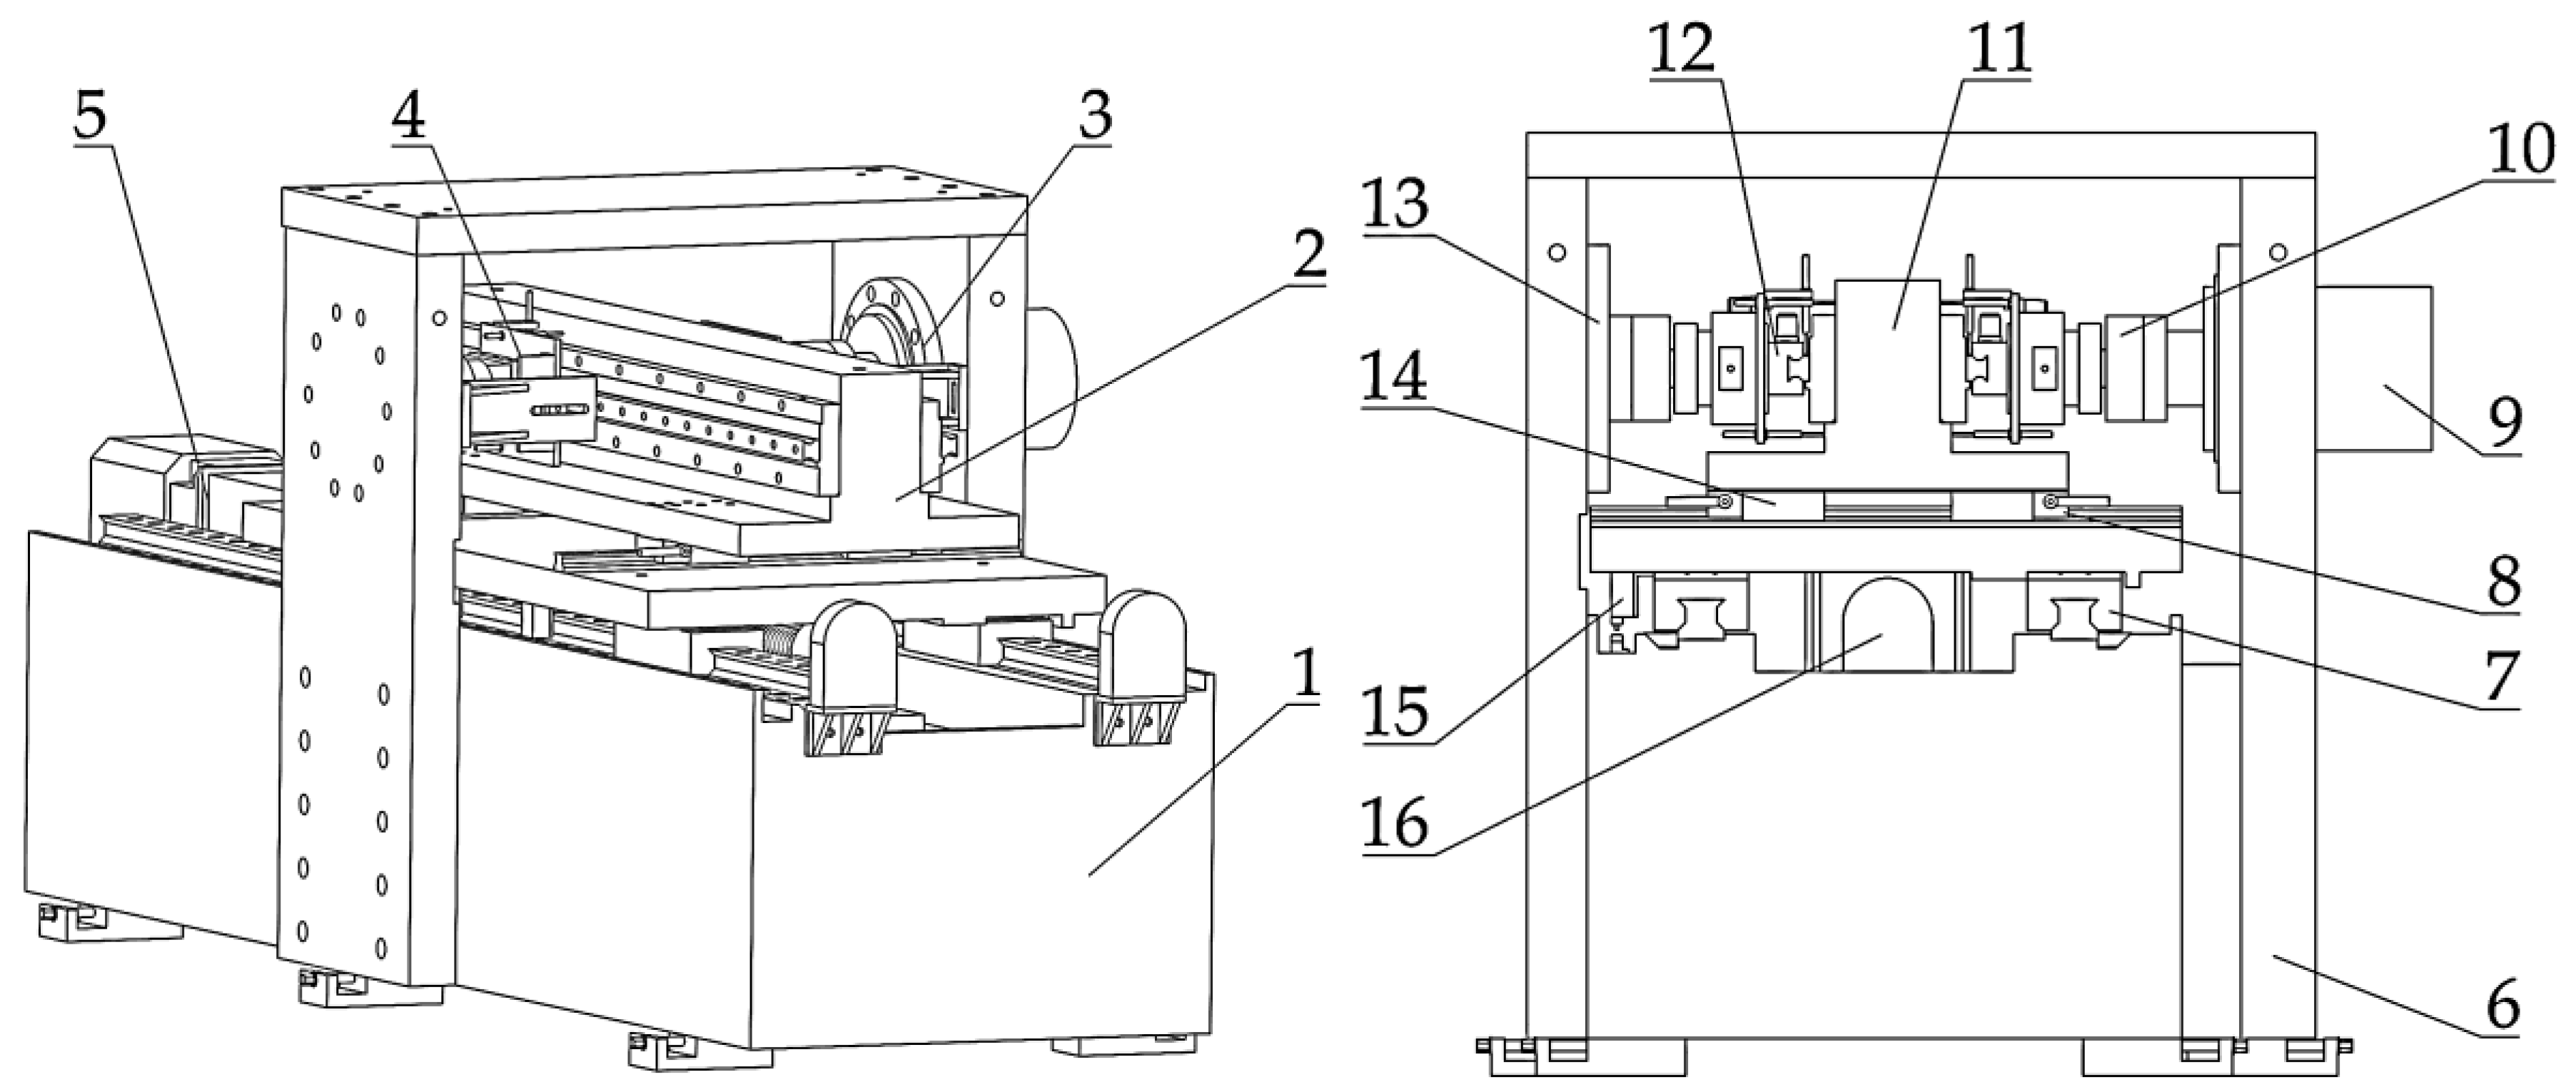
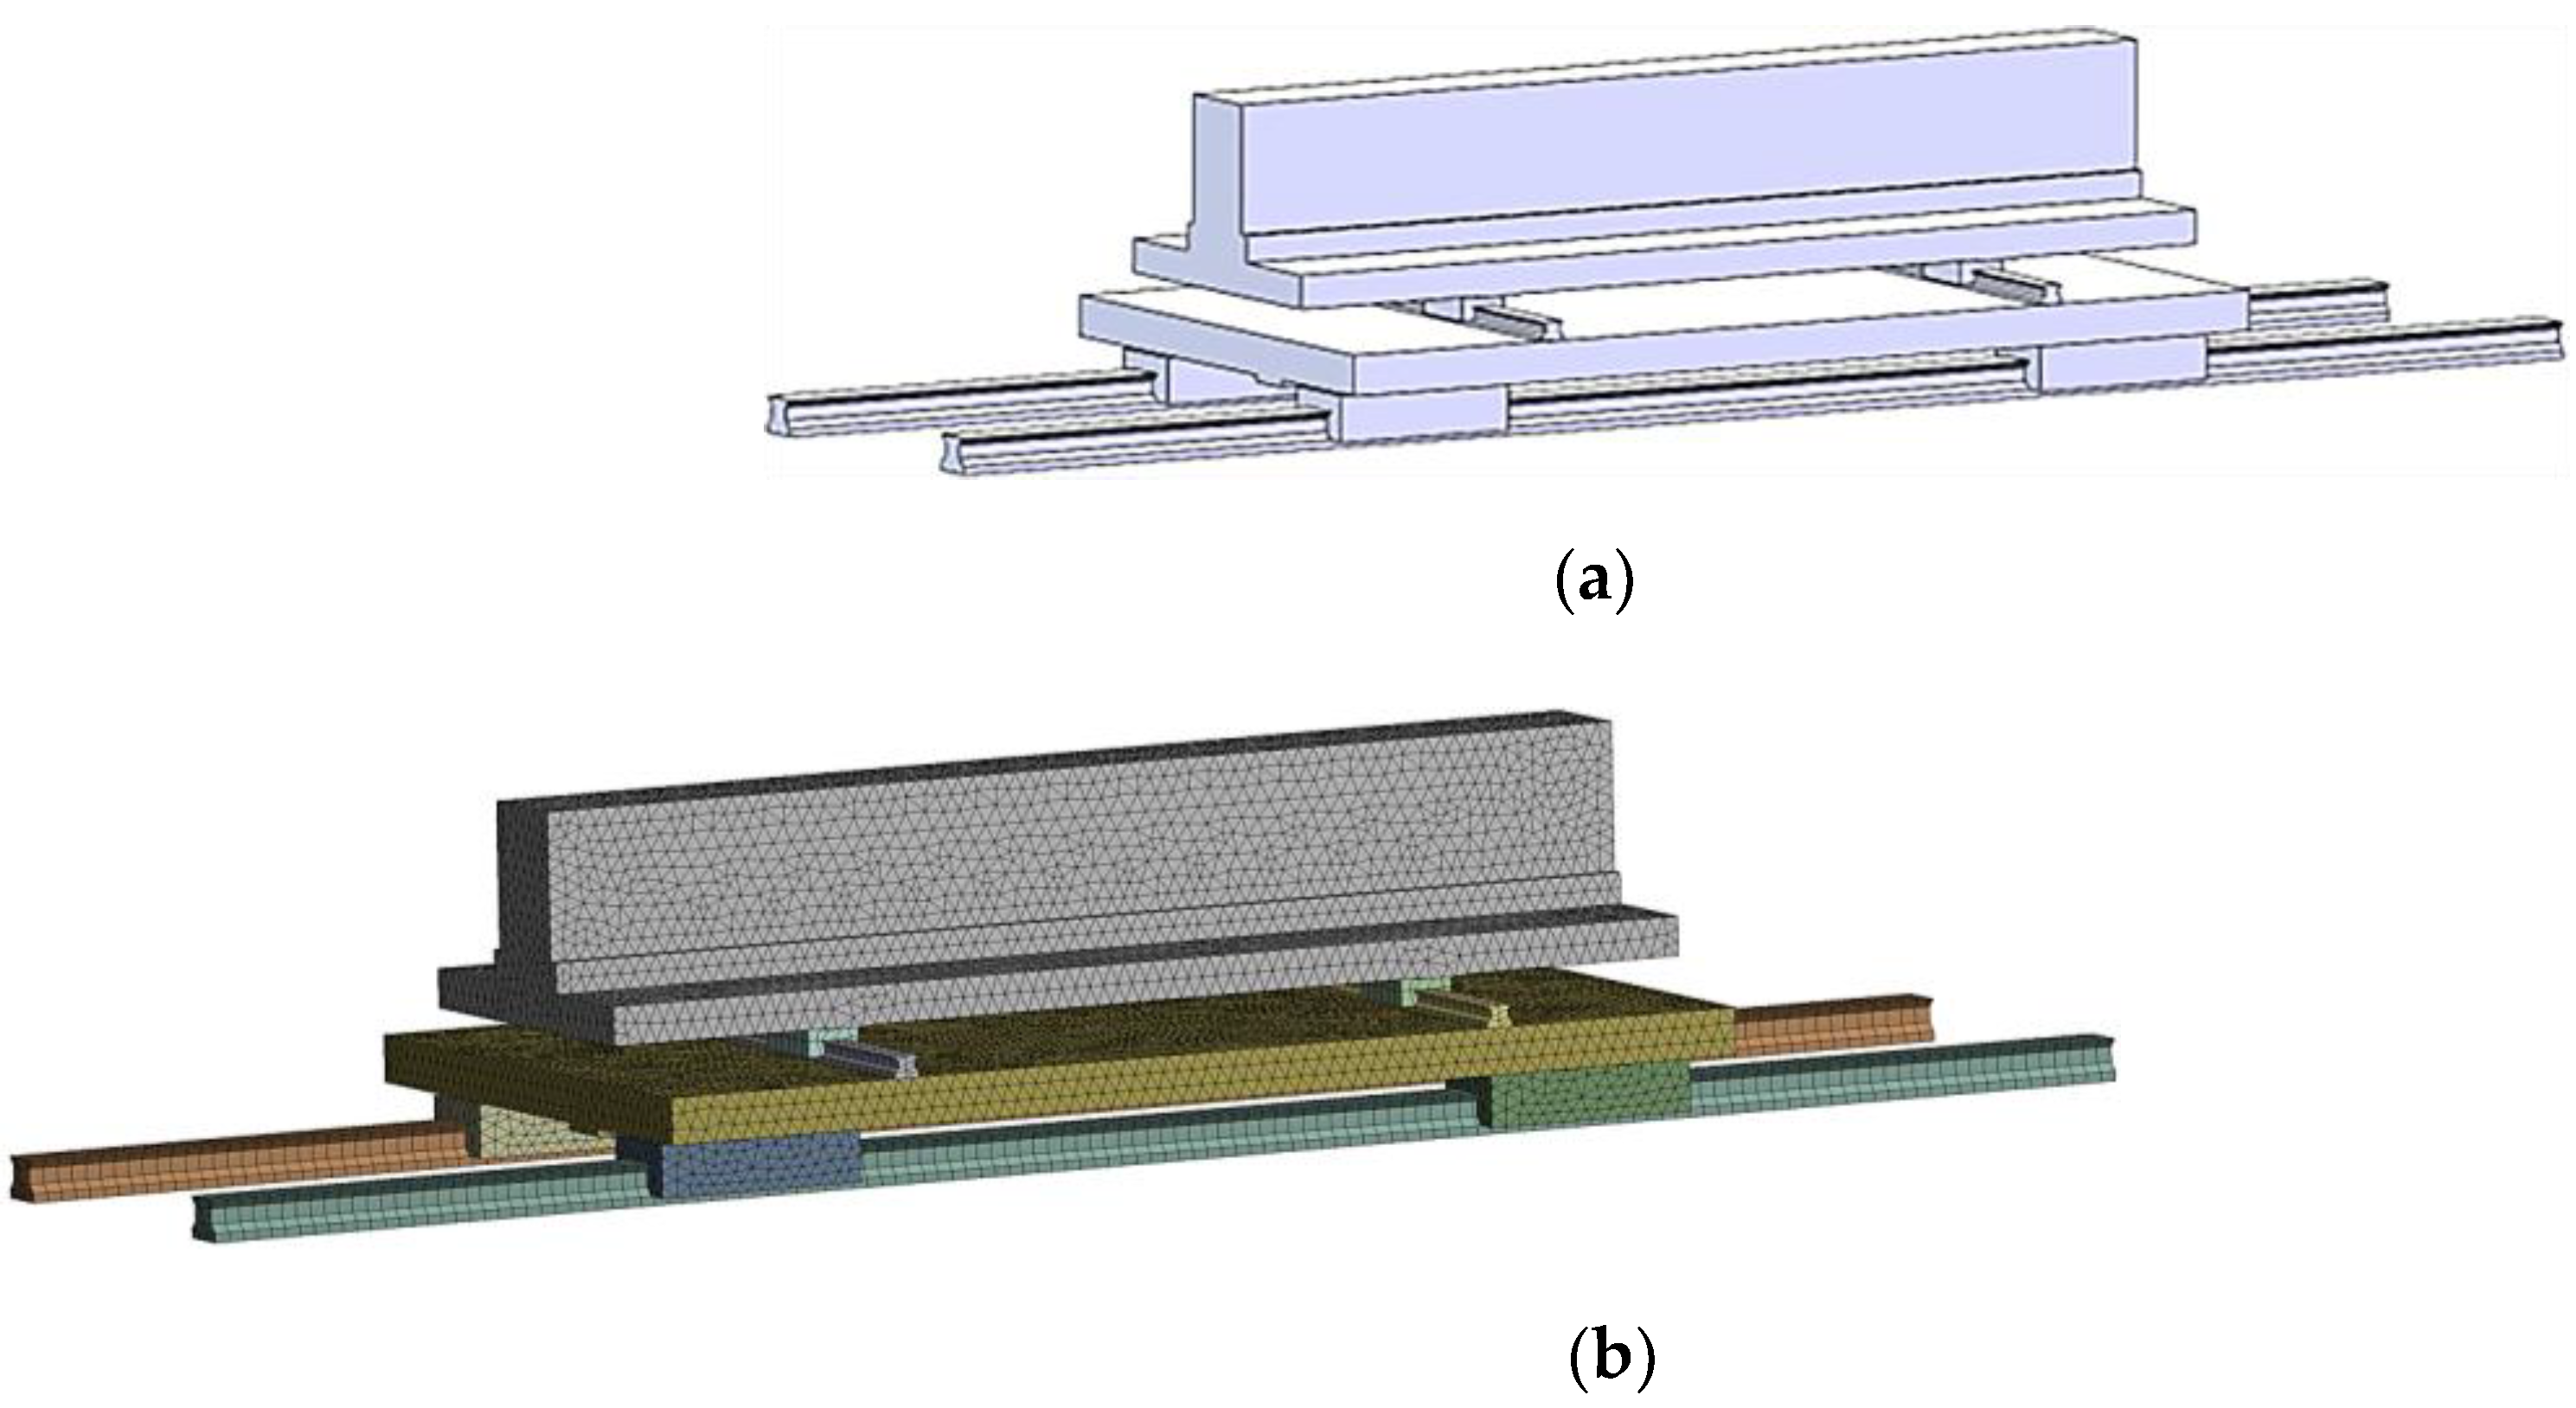
The overall structural composition of the test bench is shown in Figure 4. The lower bed (1) acts as the foundation, with the dragging component (5) mounted on its upper surface. The upper bed (2) is connected to both the lower bed and the dragging component via a guide rail pair and lead screw. Two sets of measuring components (4) are symmetrically installed on the sides of the upper bed. The loading assembly (3) spans across the lower bed and is securely connected to both sides, interfacing with the measurement components of test slider through an S-type force sensor.
The lower and upper bed support and install other components. The main guide rail pairs (7) are used to carry and guide the movement of the upper bed. The auxiliary guide rail (14) enhances the lateral freedom of the installation platform (11). When the tested guide pair is subjected to pressure, the slight movement of the auxiliary guide rail pairs prevents bending deformation of the installation platform, ensuring that the loads apply to both tested guide rails equally. During the comprehensive performance tests, loading is unnecessary. In this case, the four clamps (8) are locked to secure the lateral stability of the installation platform, thereby ensuring measurement accuracy.
The dragging and loading components facilitate the reciprocating motion of the tested guide rail pairs under load conditions. In this setup, the slider remains stationary while the guide rail moves, hence achieving relative reciprocation to the guide pair. The baffle plate (13) and hydraulic cylinder (9) function as the pressure loading mechanism, employing Newton's first law to subject the guide rails to action and reaction forces. The spoke-type force sensor (10) measures pressure, displaying values and providing feedback for the control system to regulate pressure on the guide rails. The ball screw (16) is selected as the dragging mechanism for guide pair due to its high transmission efficiency, smooth operation, and substantial load capacity. The servo motor is directly connected to the ball screw using coupling.
Figure 4.
Overall design framework of the multi-parameter test bench for guide rail pairs, including: (1) Lower bed body, (2) Upper bed body, (3) Loading component, (4) Measuring component, (5) Dragging component,(6) gantry; (7) Main guide rail pair, (8) Clamps, (9) Hydraulic cylinder, (10) Spoke-type force sensor,(11) Mounting platform, (12) Tested guide rail pairs, (13) Baffle plate, (14) Auxiliary guide rail, (15) Limit switch, and(16) Ball screw.
The test bench facilitates measurements of comprehensive performance parameters and fatigue life tests. As summarized in Table 1, comprehensive performance assessments only require no-load running-in procedure, allowing for the evaluation of running accuracy, preload drag force, vibration, and temperature rise of the guide rail pair. For fatigue life testing, a loaded running-in procedure is necessary with simultaneous monitoring of vibration and temperature rise. Abnormalities in these metrics prompt an examination of the guide rail pair's raceway morphology, with pitting and spalling size to determine the end of its service life. Table 2 presents the main parameters of the test bench, which are designed to meet the requirements for accelerated life test.

Table 1.
Test bench function table.
| Test type | Test parameters | Yes/No loading | Yes/No dragging |
|---|---|---|---|
| Comprehensive performance test |
Motion accuracy | No | Yes |
| Preload drag force | |||
| Vibration | |||
| Temperature rise | |||
| Fatigue life test | Pitting/spalling size | Yes | Yes |
| Vibration | |||
| Temperature rise |
Table 2.
Main parameters of the test bench.
| Parameters | Value |
|---|---|
| Overall dimension (mm) | 3143×1420×1215 |
| Weight (t) | 5.113 |
| Maximum test speed (m/min) | 50 |
| Maximum acceleration (m/s2) | 8 |
| Maximum itinerary (mm) | 600 |
| Maximum pressure (t) | 30 |
| Walking accuracy (mm/m) | 0.01/1000 |
| Speed/pressure accuracy (%) | 2% |
3.1.2. Measuring Component Structural Design
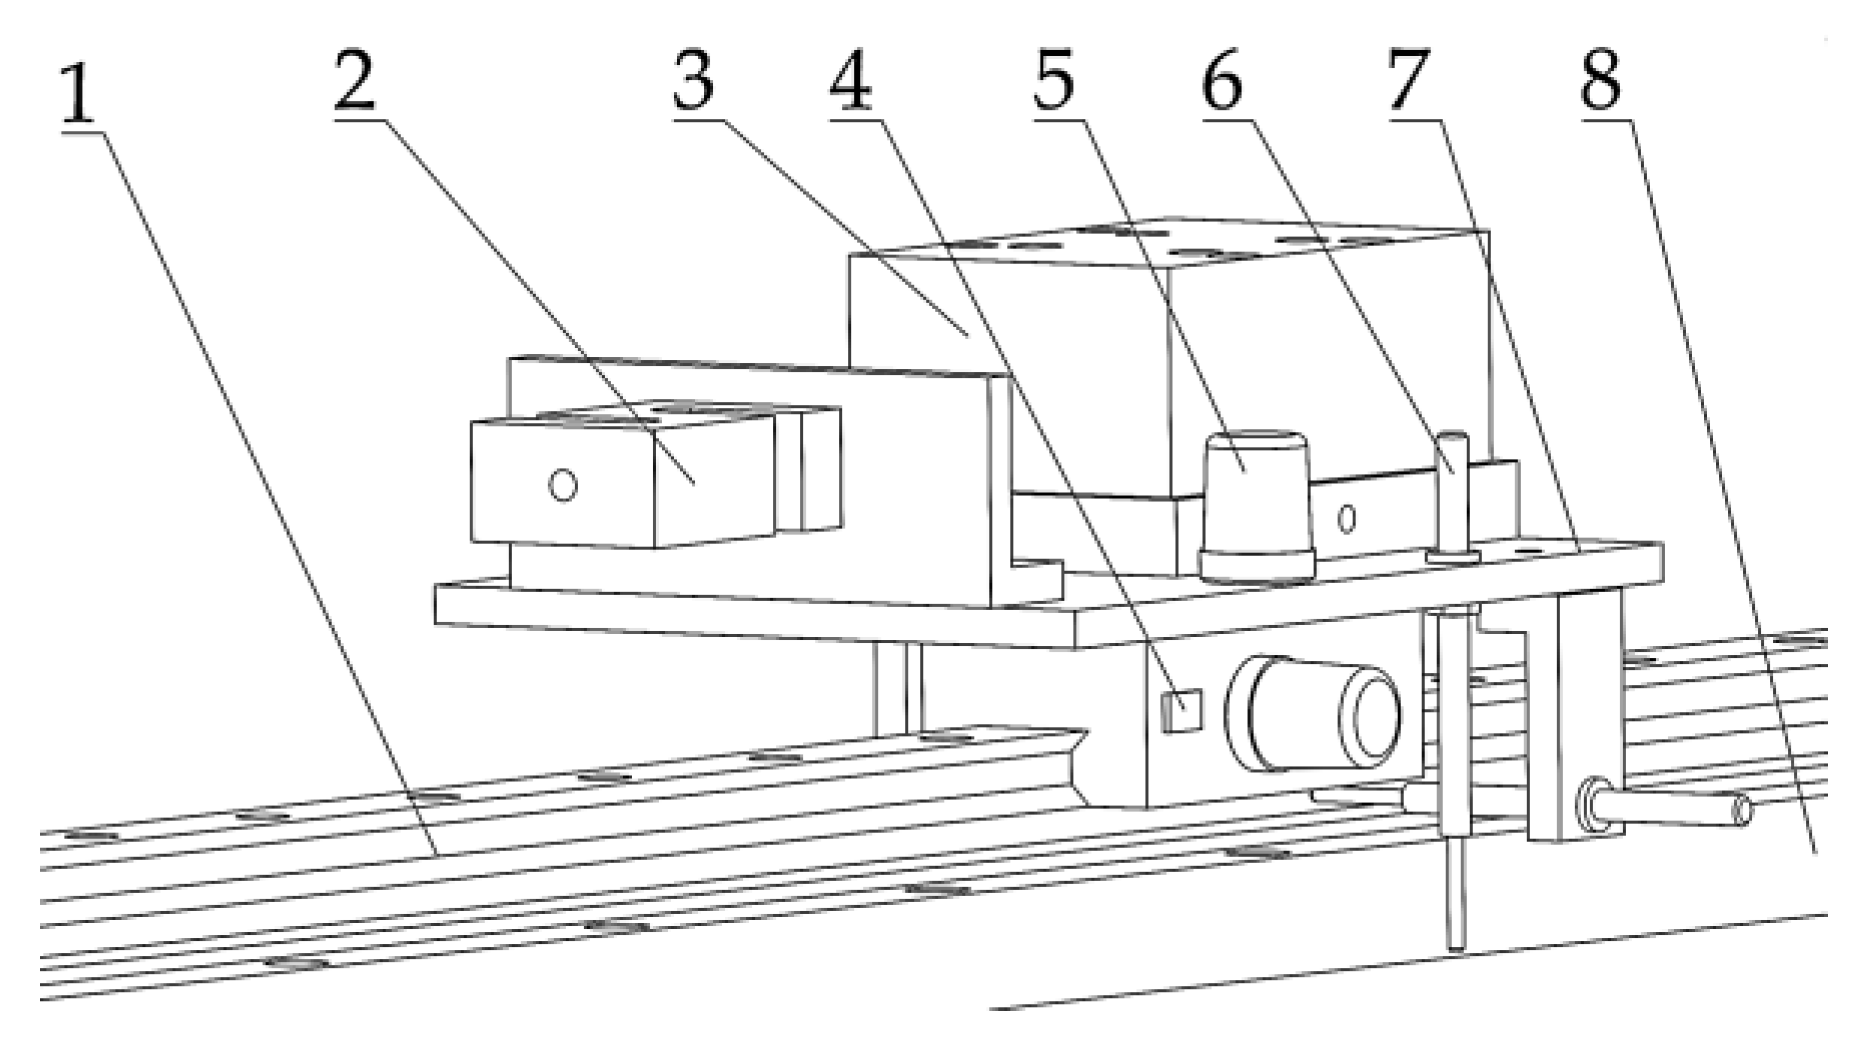
Figure 5 illustrates the measurement component. This component is installed on the installation platform via an adapter plate (8). The measuring frame (7) is fitted onto the loading block (3). An S-type force sensor (2) is used to measure the preload drag force, affixed to the connecting plate on the gantry side plate, ensuring the slider of tested guide rail (1) remains stationary as the linear guide rail moves with the upper bed. Two acceleration vibration sensors (5) are positioned vertically and horizontally through magnetic attachment to capture vibration signals in both directions. A patch-type thermocouple (4) is affixed to the front end of slider due to the direction change and collision of rolling elements with the diverter generate considerable heat. Additionally, three contact displacement sensors (6) are installed in accordance with the measurement principle of motion accuracy.
Figure 5.
Measuring component is constituted by: (1) Tested guide rail pair,(2) S-type force sensor, (3) Loading block, (4) Patch-type thermocouple, (5) Acceleration vibration sensor, (6) Contact displacement sensor, (7) Measuring frame, and (8) Adapter plate.
Figure 5.
Measuring component is constituted by: (1) Tested guide rail pair,(2) S-type force sensor, (3) Loading block, (4) Patch-type thermocouple, (5) Acceleration vibration sensor, (6) Contact displacement sensor, (7) Measuring frame, and (8) Adapter plate.
3.2. Measurement-Control System Design
The measurement-control system of test bench comprises an electronic control system and a measurement system. The electronic control system primarily manages the closed-loop control of the hydraulic cylinder's output force and the ball screw's rotational speed during fatigue life test. The measurement system handles the acquisition, display, and storage of output signals from the contact displacement sensors, S-type force sensors, acceleration vibration sensors, and thermocouples for comprehensive performance parameter measurement. Additionally, signals from the acceleration vibration sensors and thermocouples can detect the fatigue failure of the tested guide rail pair during the fatigue life test.
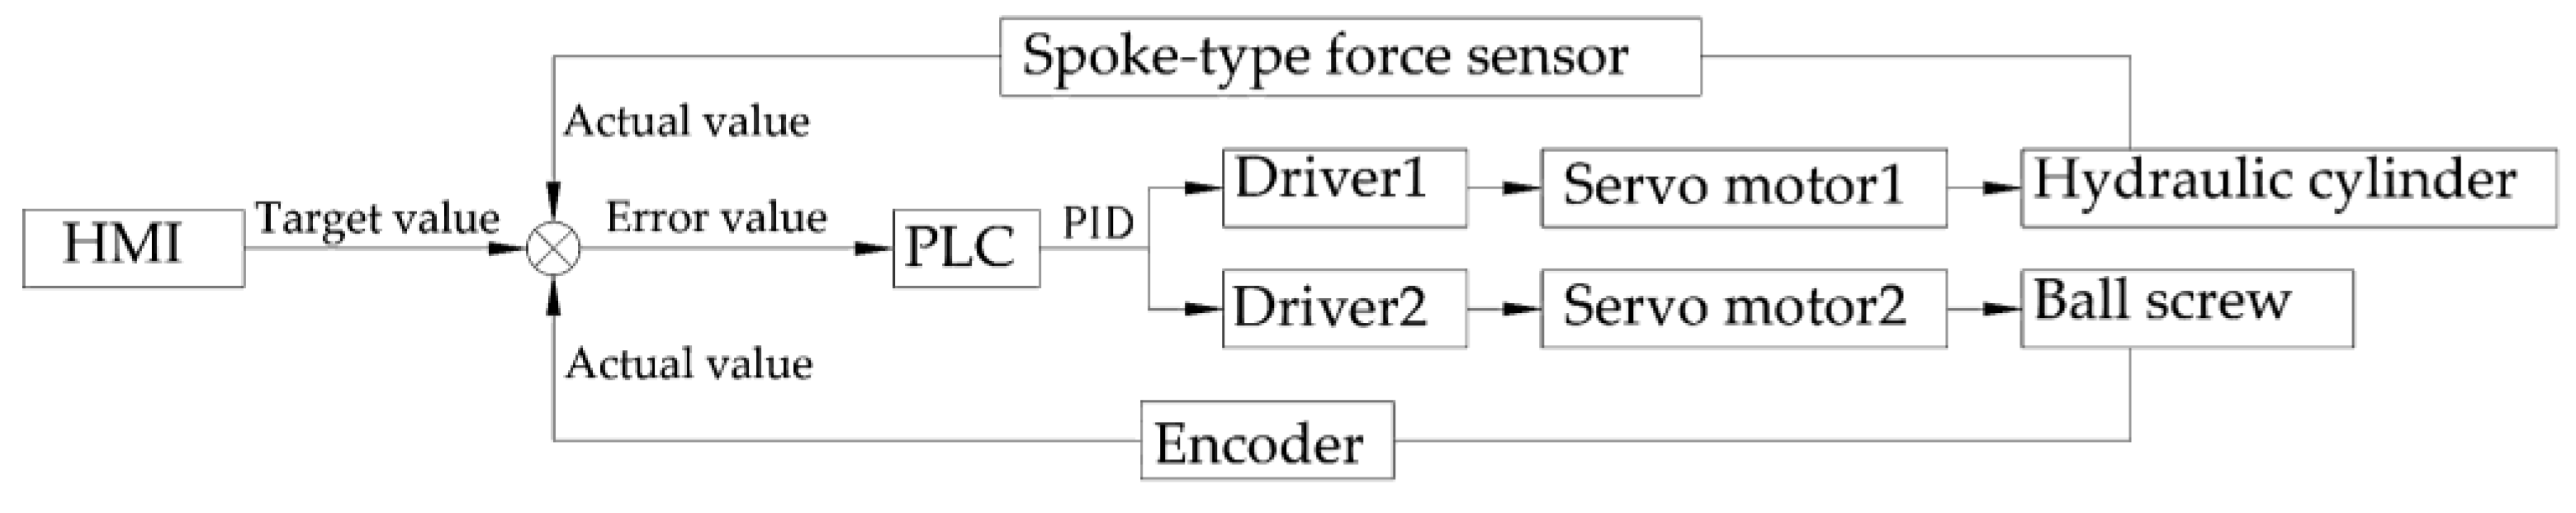
The electronic control system utilizes a PLC as the central controller. The touch screen (HMI) provides the target signals, while outputs from the spoke-type force sensors and encoder function as feedback signals. Using the PID function module of PIC, the trial-and-error method is applied to determine PID parameters. The PLC compares the target and feedback signals to generate error signals which are transmitted to the servo motor drivers. Moreover, the driver subsequently controls the servo motor to achieve precise regulation of the target value. The electronic control principle is demonstrated in Figure 6.
Figure 6.
The electronic control schematic diagram.
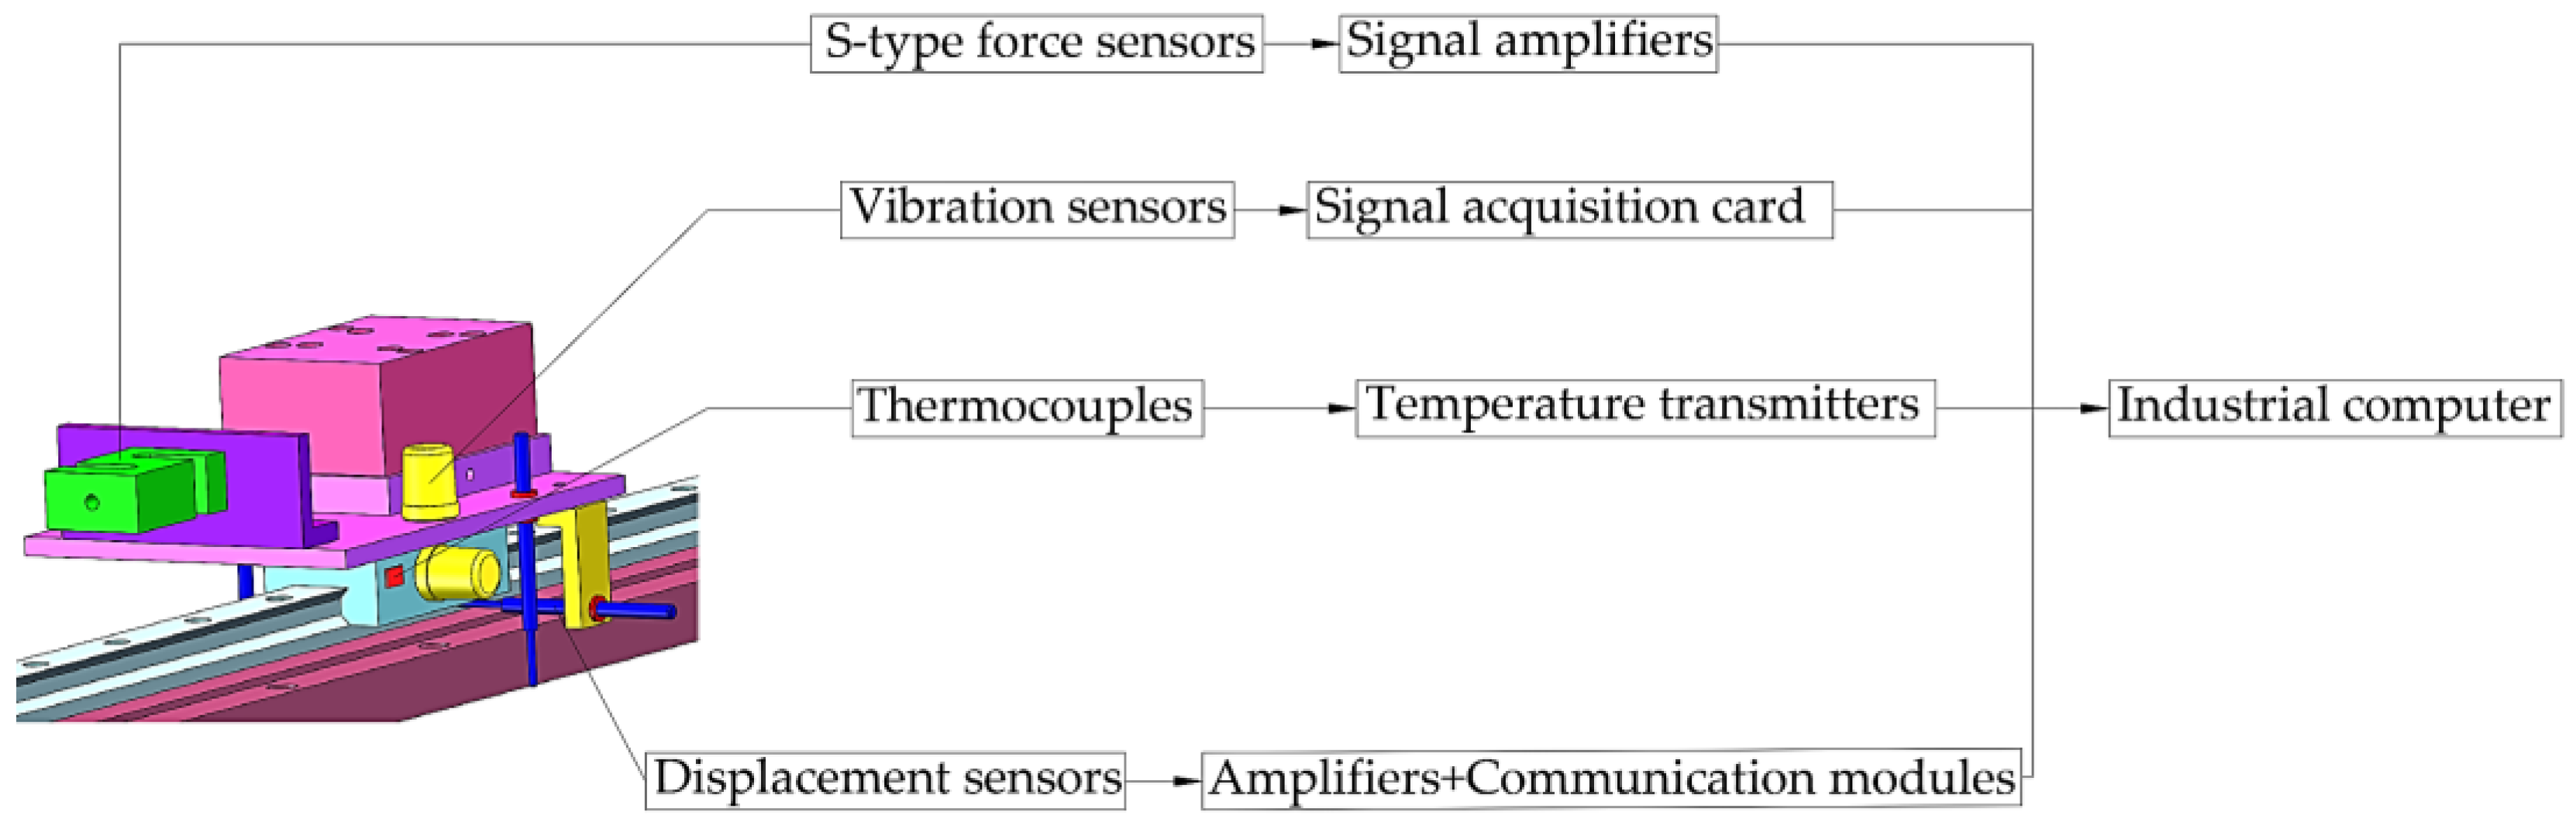
The measurement system is implemented using LabView associated with relevant hardware for data acquisition. Figure 7 illustrates the hardware communication structure of the bench measurement system. The contact-type displacement sensors convert internal changes in motion precision into electrical signals, which are transmitted to the industrial computer via RS232 serial communication through amplifiers and communication modules. The S-type force sensors detect changes in external force, generating resistance signals which are converted into digital signals by signal amplifiers and displayed on measurement software via RS232 serial communication. Vibration signals from the acceleration sensors are captured by the industrial computer through a signal acquisition card. Additionally, the thermocouples generate the millivolt voltage signals from frictional heat between rolling elements and raceways of the tested guide rail pair into standard analog signal via temperature transmitters before entering the industrial computer. Each signal is processed, displayed, and stored by the acquisition program after entering the industrial computer.
Figure 7.
Communication diagram of the hardware structure of the measurement system.
4. Mechanical Analysis in the Motion Process
4.1. Static Analysis of the Gantry
During the lifespan test, the hydraulic cylinder exerts vertical pressure on the test guide rail pair, while the gantry side plates absorbing the reaction force and providing support. Under high pressure conditions, the gantry side plates, upper plate, and fixing screws will experience certain stress and strain. Therefore, a statics analysis of the gantry is essential to verify rationality of the structural design and strength of the materials used.
For the convenience calculation, Figure 8(a) presents a simplified diagram of the structure, where the base is reduced to two fixed plates connected to the gantry side plates.
Figure 8.
Gantry mesh division:(a) Before division, and (b) After division.
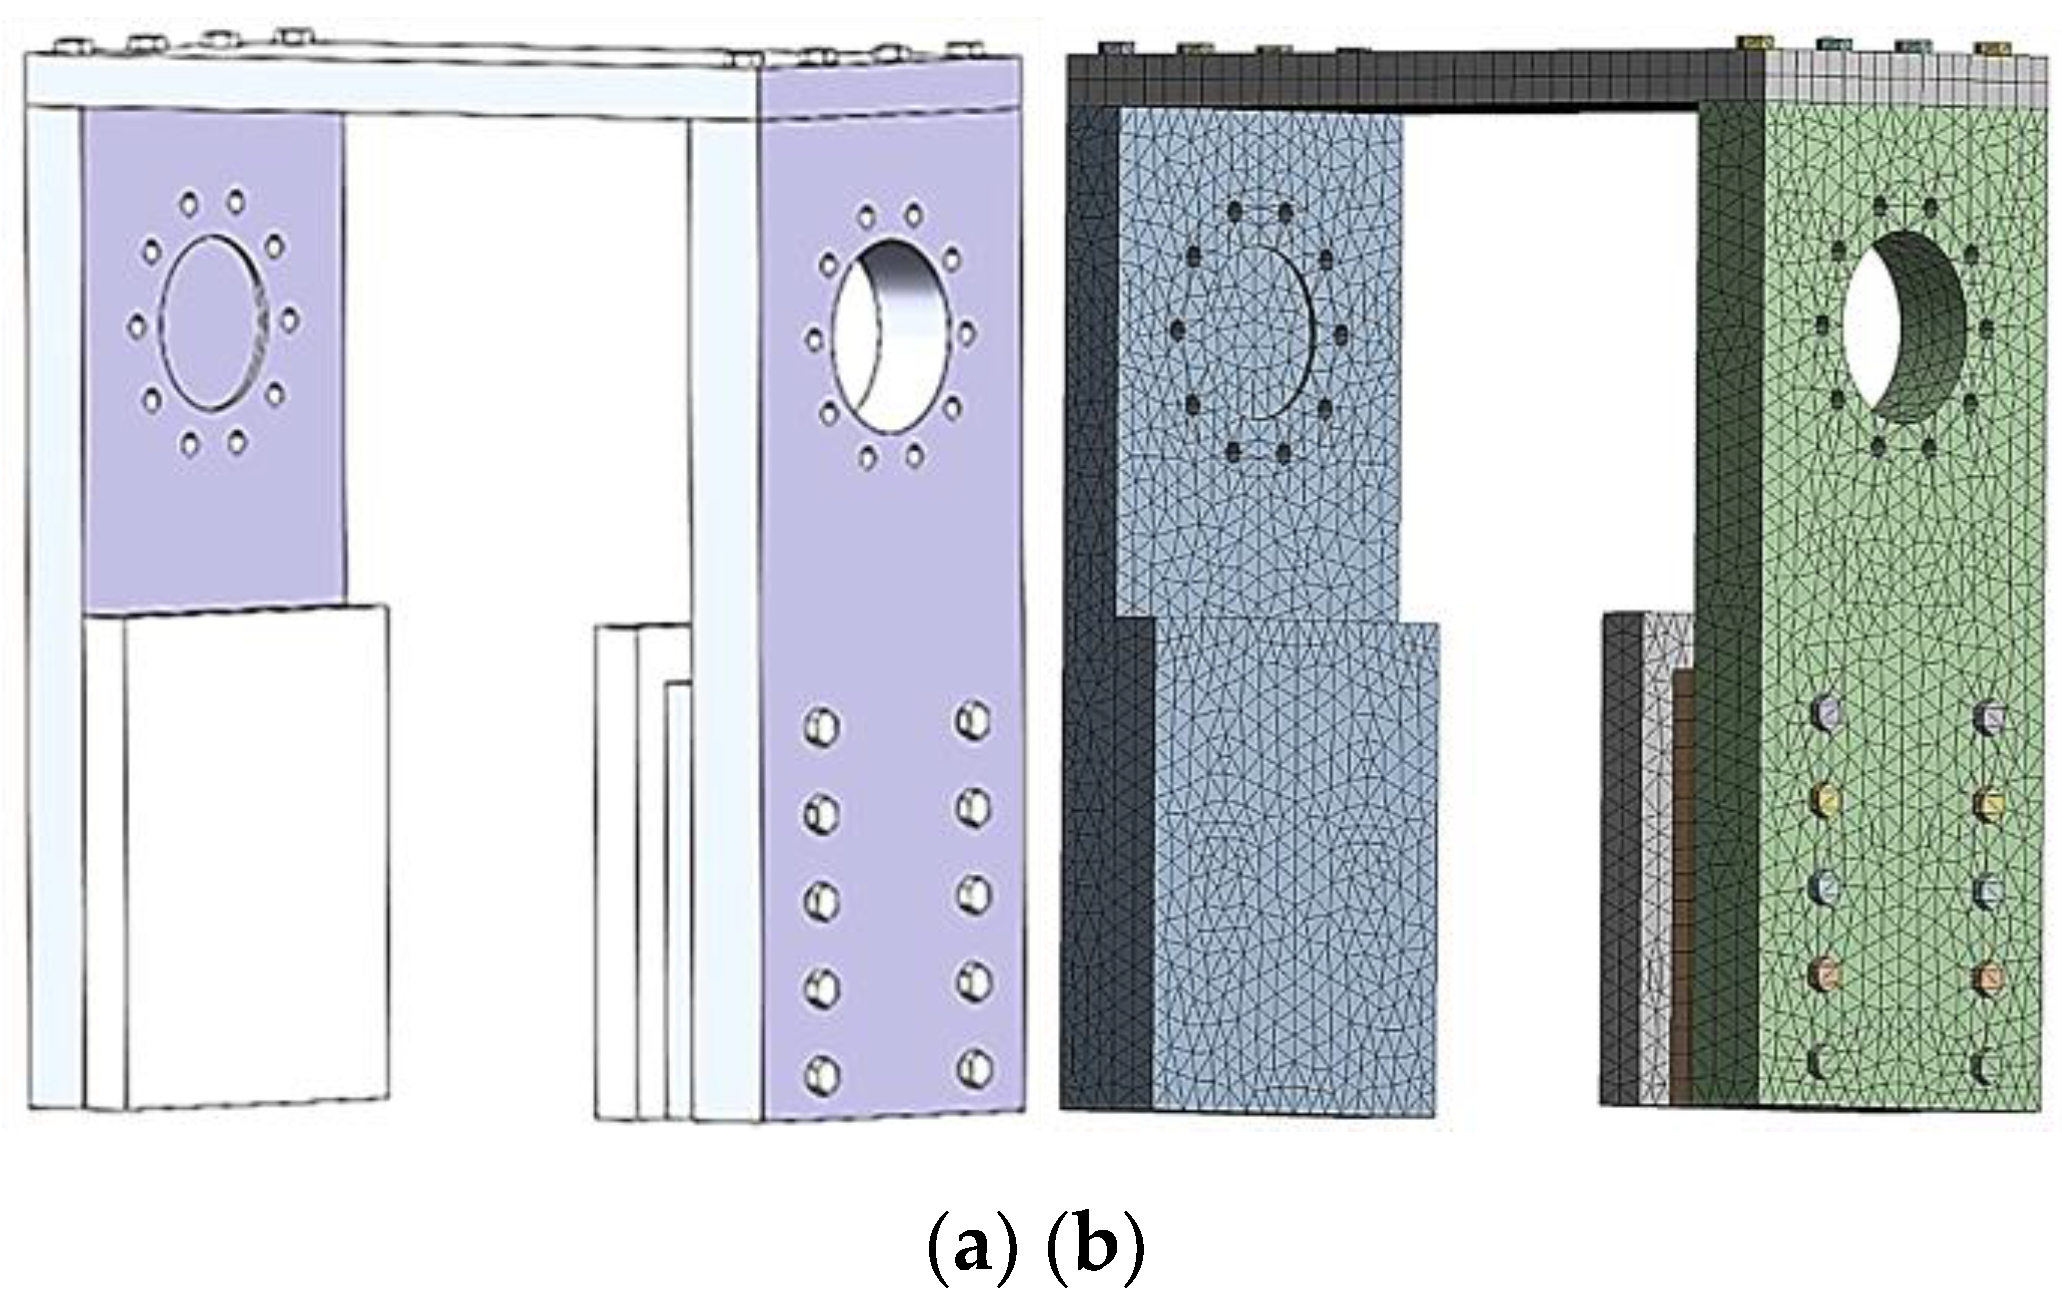
The 3D model of the gantry was imported into ANSYS Workbench 19.0. The material properties were assigned as follows: the gantry was set to No. 45 steel, the base was set to gray cast iron, and the bolts are grade 12.9, which are set as alloy steel materials. The mesh generation tool was utilized to create the mesh, with refinement achieved by adjusting the transition and center of the span angle [18]. The completed mesh consisted of 28,949 elements and 53,030 nodes, as depicted in Figure 8(b). A bolt pre-tightening force of 281,000 N was applied, and the maximum supporting force of the gantry was specified as 30 t, based on the maximum dynamic load is 30 t. Subsequently, a statics analysis was conducted and the results are presented in Figure 9.
Figure 9.
The results of the static analysis of the gantry:(a) Equivalent stress cloud map, and(b) Equivalent strain cloud map.
Figure 9.
The results of the static analysis of the gantry:(a) Equivalent stress cloud map, and(b) Equivalent strain cloud map.
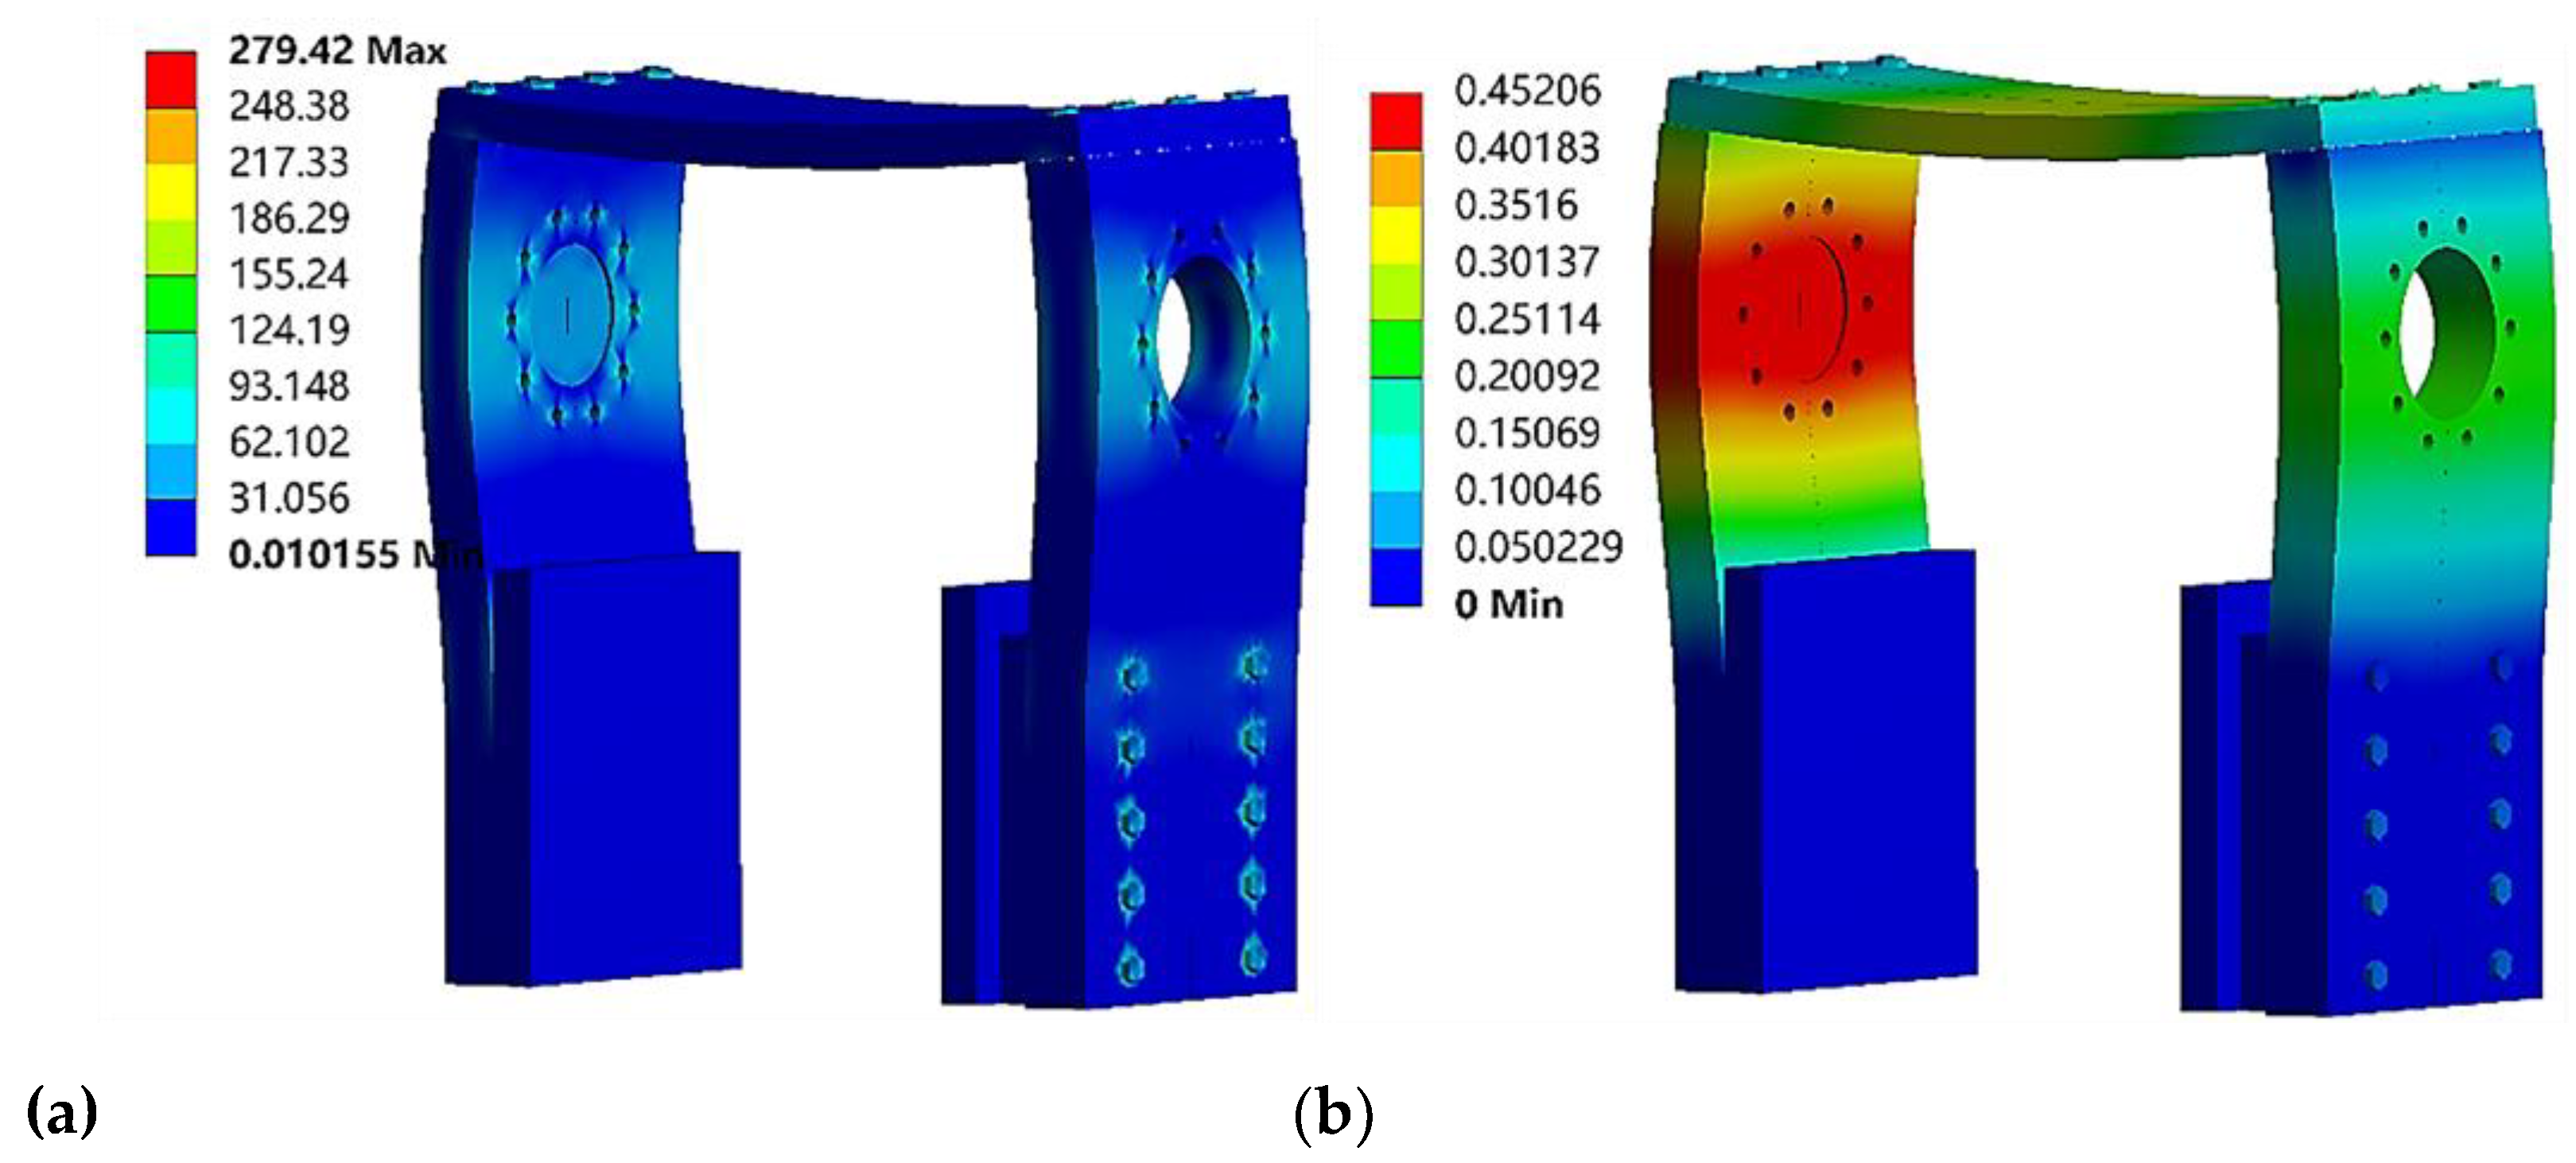
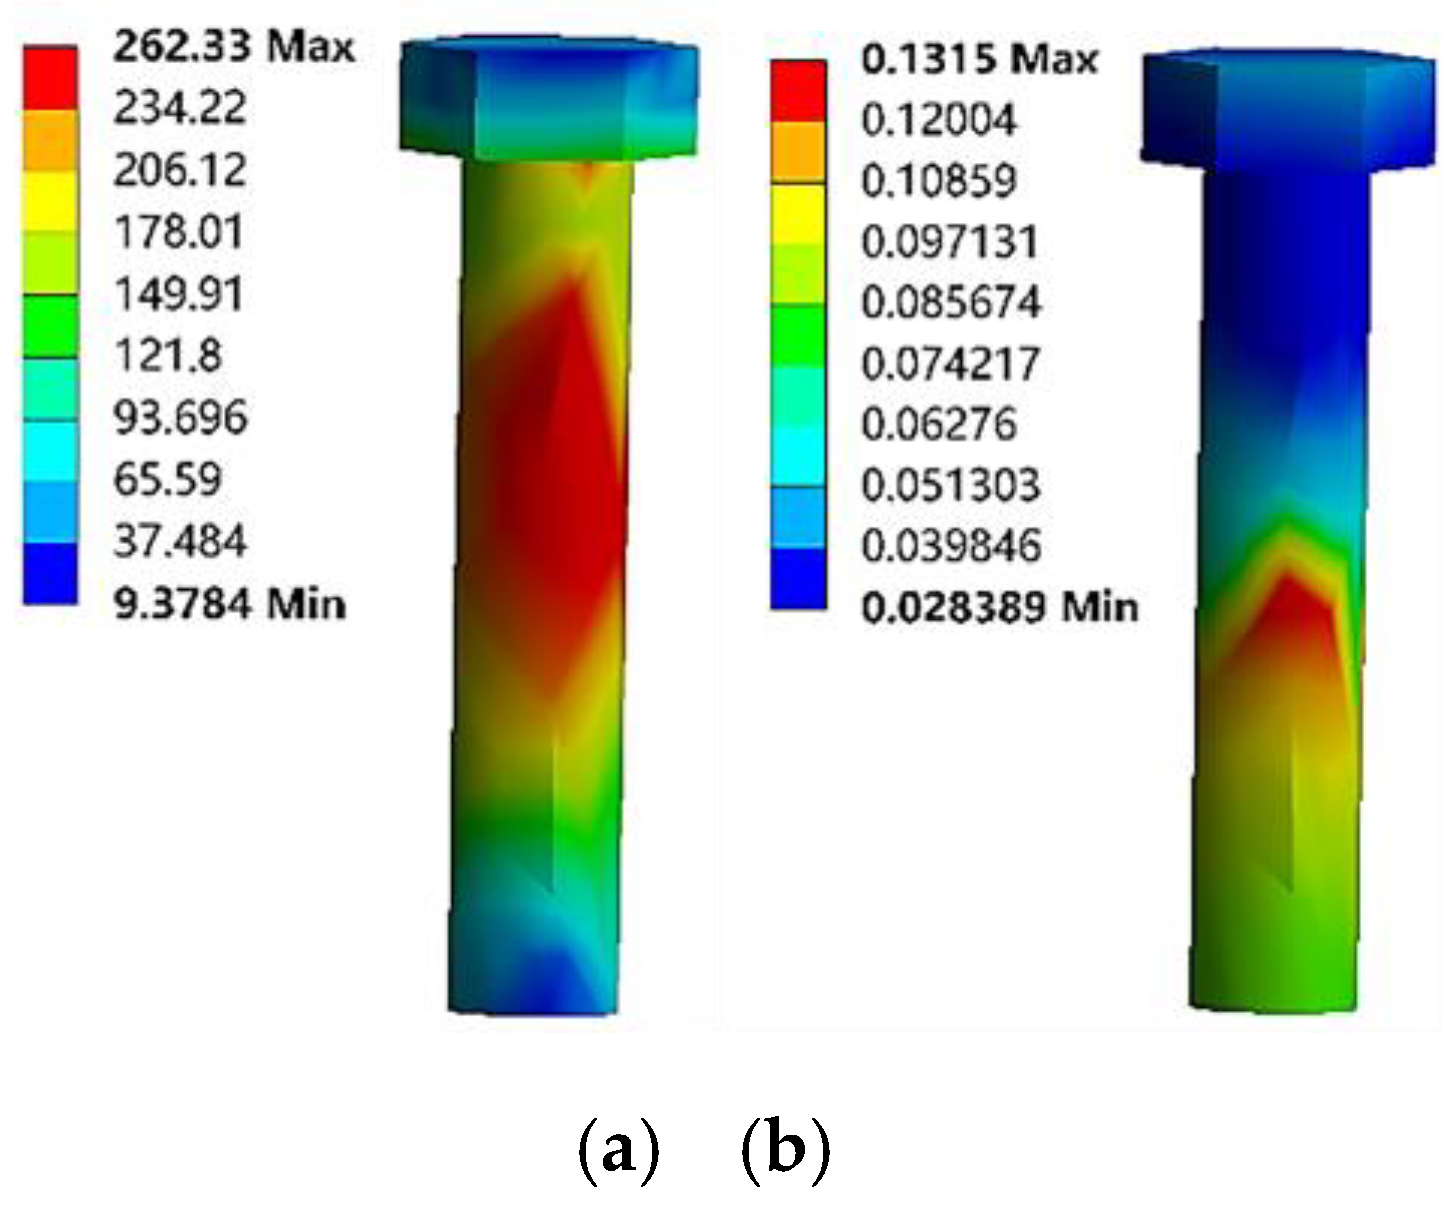
According to the analysis results shown in Figure 9, the maximum strain occurs at the contact surface between the left gantry side plate and the baffle plate. This position takes a relatively large supporting force, and the side plate has a relatively thin wall thickness. However, the maximum strain of 0.45 mm indicates a small deformation, which has a minimal impact on the loading of the measured guide rail pair and can be neglected. The maximum stress is found at the first row of bolts on the right side plate of the gantry. This is attributed to the bolts being the connection point between the right side plate of the gantry and the base as well as their proximity to the support force location, resulting in significant axial tensile forces. Figure 10 details the bolt analysis results, showing a maximum strain of 0.13 mm and a maximum stress of 262.33 MPa and both within the yield limit of bolt, thereby satisfying operational requirements.
Figure 10.
The results of the static analysis of the screw: (a) Equivalent stress cloud map, and (b) Equivalent strain cloud map.
Figure 10.
The results of the static analysis of the screw: (a) Equivalent stress cloud map, and (b) Equivalent strain cloud map.
4.2. Modal Analysis of the Upper Bed Body
During the operation of the upper bed, the interaction with the main and auxiliary guide rails reduces its overall stiffness. Additionally, design and manufacturing errors contribute to vibrations. Therefore, external excitations can lead to local deformations, compromising the reliability of test bench and test accuracy. Modal analysis can identify the fundamental vibration frequencies and deformation-prone areas of the upper bed to validate the design's rationality.
The simplified upper bed model is imported into ANSYS Workbench 19., where the material properties were specified. The installation platform was designated as ductile cast iron, while the guide pair and motion plate were defined as 45# steel. The connecting surfaces between the various components of the upper bed were primarily linked by bolts, hence they were defined as bonded contacts. A spring element is introduced at the guide rail pair's sliding joint to account for its impact on dynamic performance [19]. The normal stiffness is set to 305 N/μm for the mounting platform and auxiliary guide rail, and 410 N/μm for the moving plate and main guide rail. The model is meshed with 59,731 elements and 117,459 nodes, as depicted in Figure 11(b).
Figure 11.
Upper bed mesh division: (a) Before division, and (b) After division.
Constraints were imposed on the upper bed, and the first six vibration modes were calculated. The results, depicted in Figure 12, reveal natural frequencies of 267.98, 318.45, 369.93, 421.91, 433.5, and 460.68 Hz, respectively.
Figure 12.
The results of the first six-order modal analysis of the upper body: (a) First-order mode, (b) Second-order mode, (c) Third-order mode, (d) Fourth-order mode, (e) Fifth-order mode, and(f) Sixth-order mode.
Figure 12.
The results of the first six-order modal analysis of the upper body: (a) First-order mode, (b) Second-order mode, (c) Third-order mode, (d) Fourth-order mode, (e) Fifth-order mode, and(f) Sixth-order mode.
In modal analysis, it is commonly accepted that the highest vibration energy is most pronounced in the lower-order modes [20]. As observed in Figure 12, the upper bed experiences significant vibrational deformation at the first-order vibrational mode. The calculated operational excitation frequency of the upper bed at maximum rotational speed is as follows [21]:
he motor's rated speed n is 2000 r/ min and substitute it into equation (10) yields an excitation frequency of 33.3 Hz. he inherent frequency of the upper bed at the first-order vibrational mode is 267.98 Hz. Consequently, the operational vibrational frequency of the upper bed at maximum speed is approximately 13% of the first-order vibrational mode. Furthermore, since the inherent vibrational frequency and the operational excitation frequency do not fall within the same frequency range, the design of the upper bed meets the safety requirements.
f=n/60
4.3 Comparative analysis of the load uniformity of the tested guide rail pair
In practice, guide rail pairs typically experience relatively uniform forces [22]. To accurately simulate loading conditions, it is essential to consider the impact of loading block thickness on the uniformity of the forces applied. Empirical observations suggest that a thicker loading block results in a more uniform distribution of force across the upper surface of the tested guide. However, excessive thickness can increase the spatial requirements of the testing platform, and an overly heavy loading block may adversely affect both the operational precision and the accuracy of the preload drag force measurements. Therefore, selecting an appropriate loading block thickness is critical.
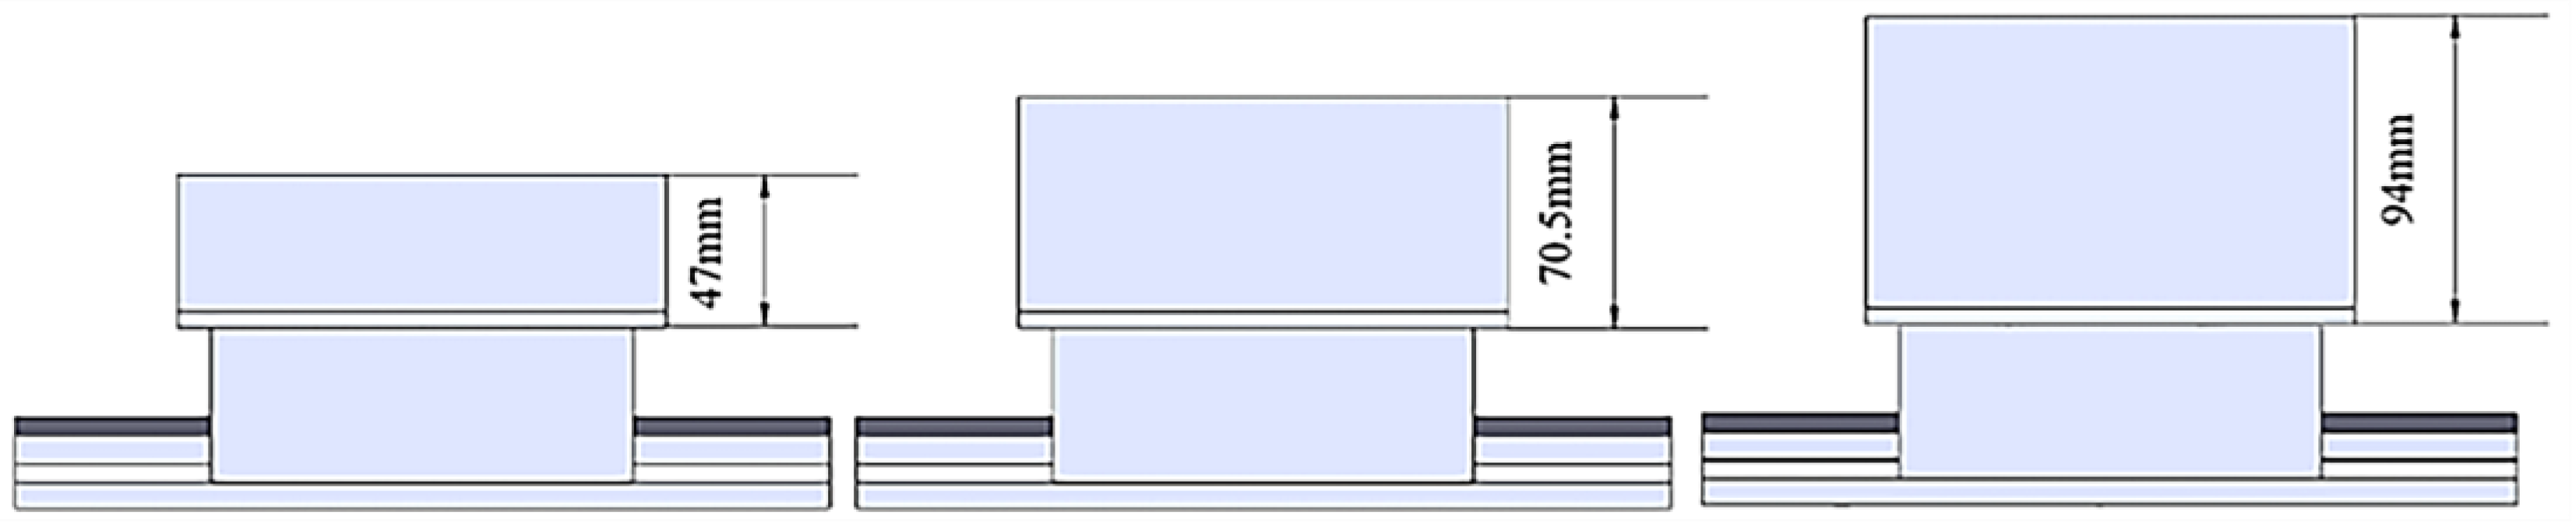
Three different loading block thicknesses were established for this study, corresponding to the thicknesses of the tested slider at 1, 1.5, and 2 times, specifically 47 mm, 70.5 mm, and 94 mm, respectively, as illustrated in Figure 13.
Figure 13.
Three loading blocks of different thicknesses.
Simulation analysis of the three models was conducted using ANSYS Workbench 19.0. The contact area between the loading front and the loading block was defined to establish the load application surface, with a loading force set at 5 tons, which corresponds to the maximum dynamic load of the 35 series guide pair.
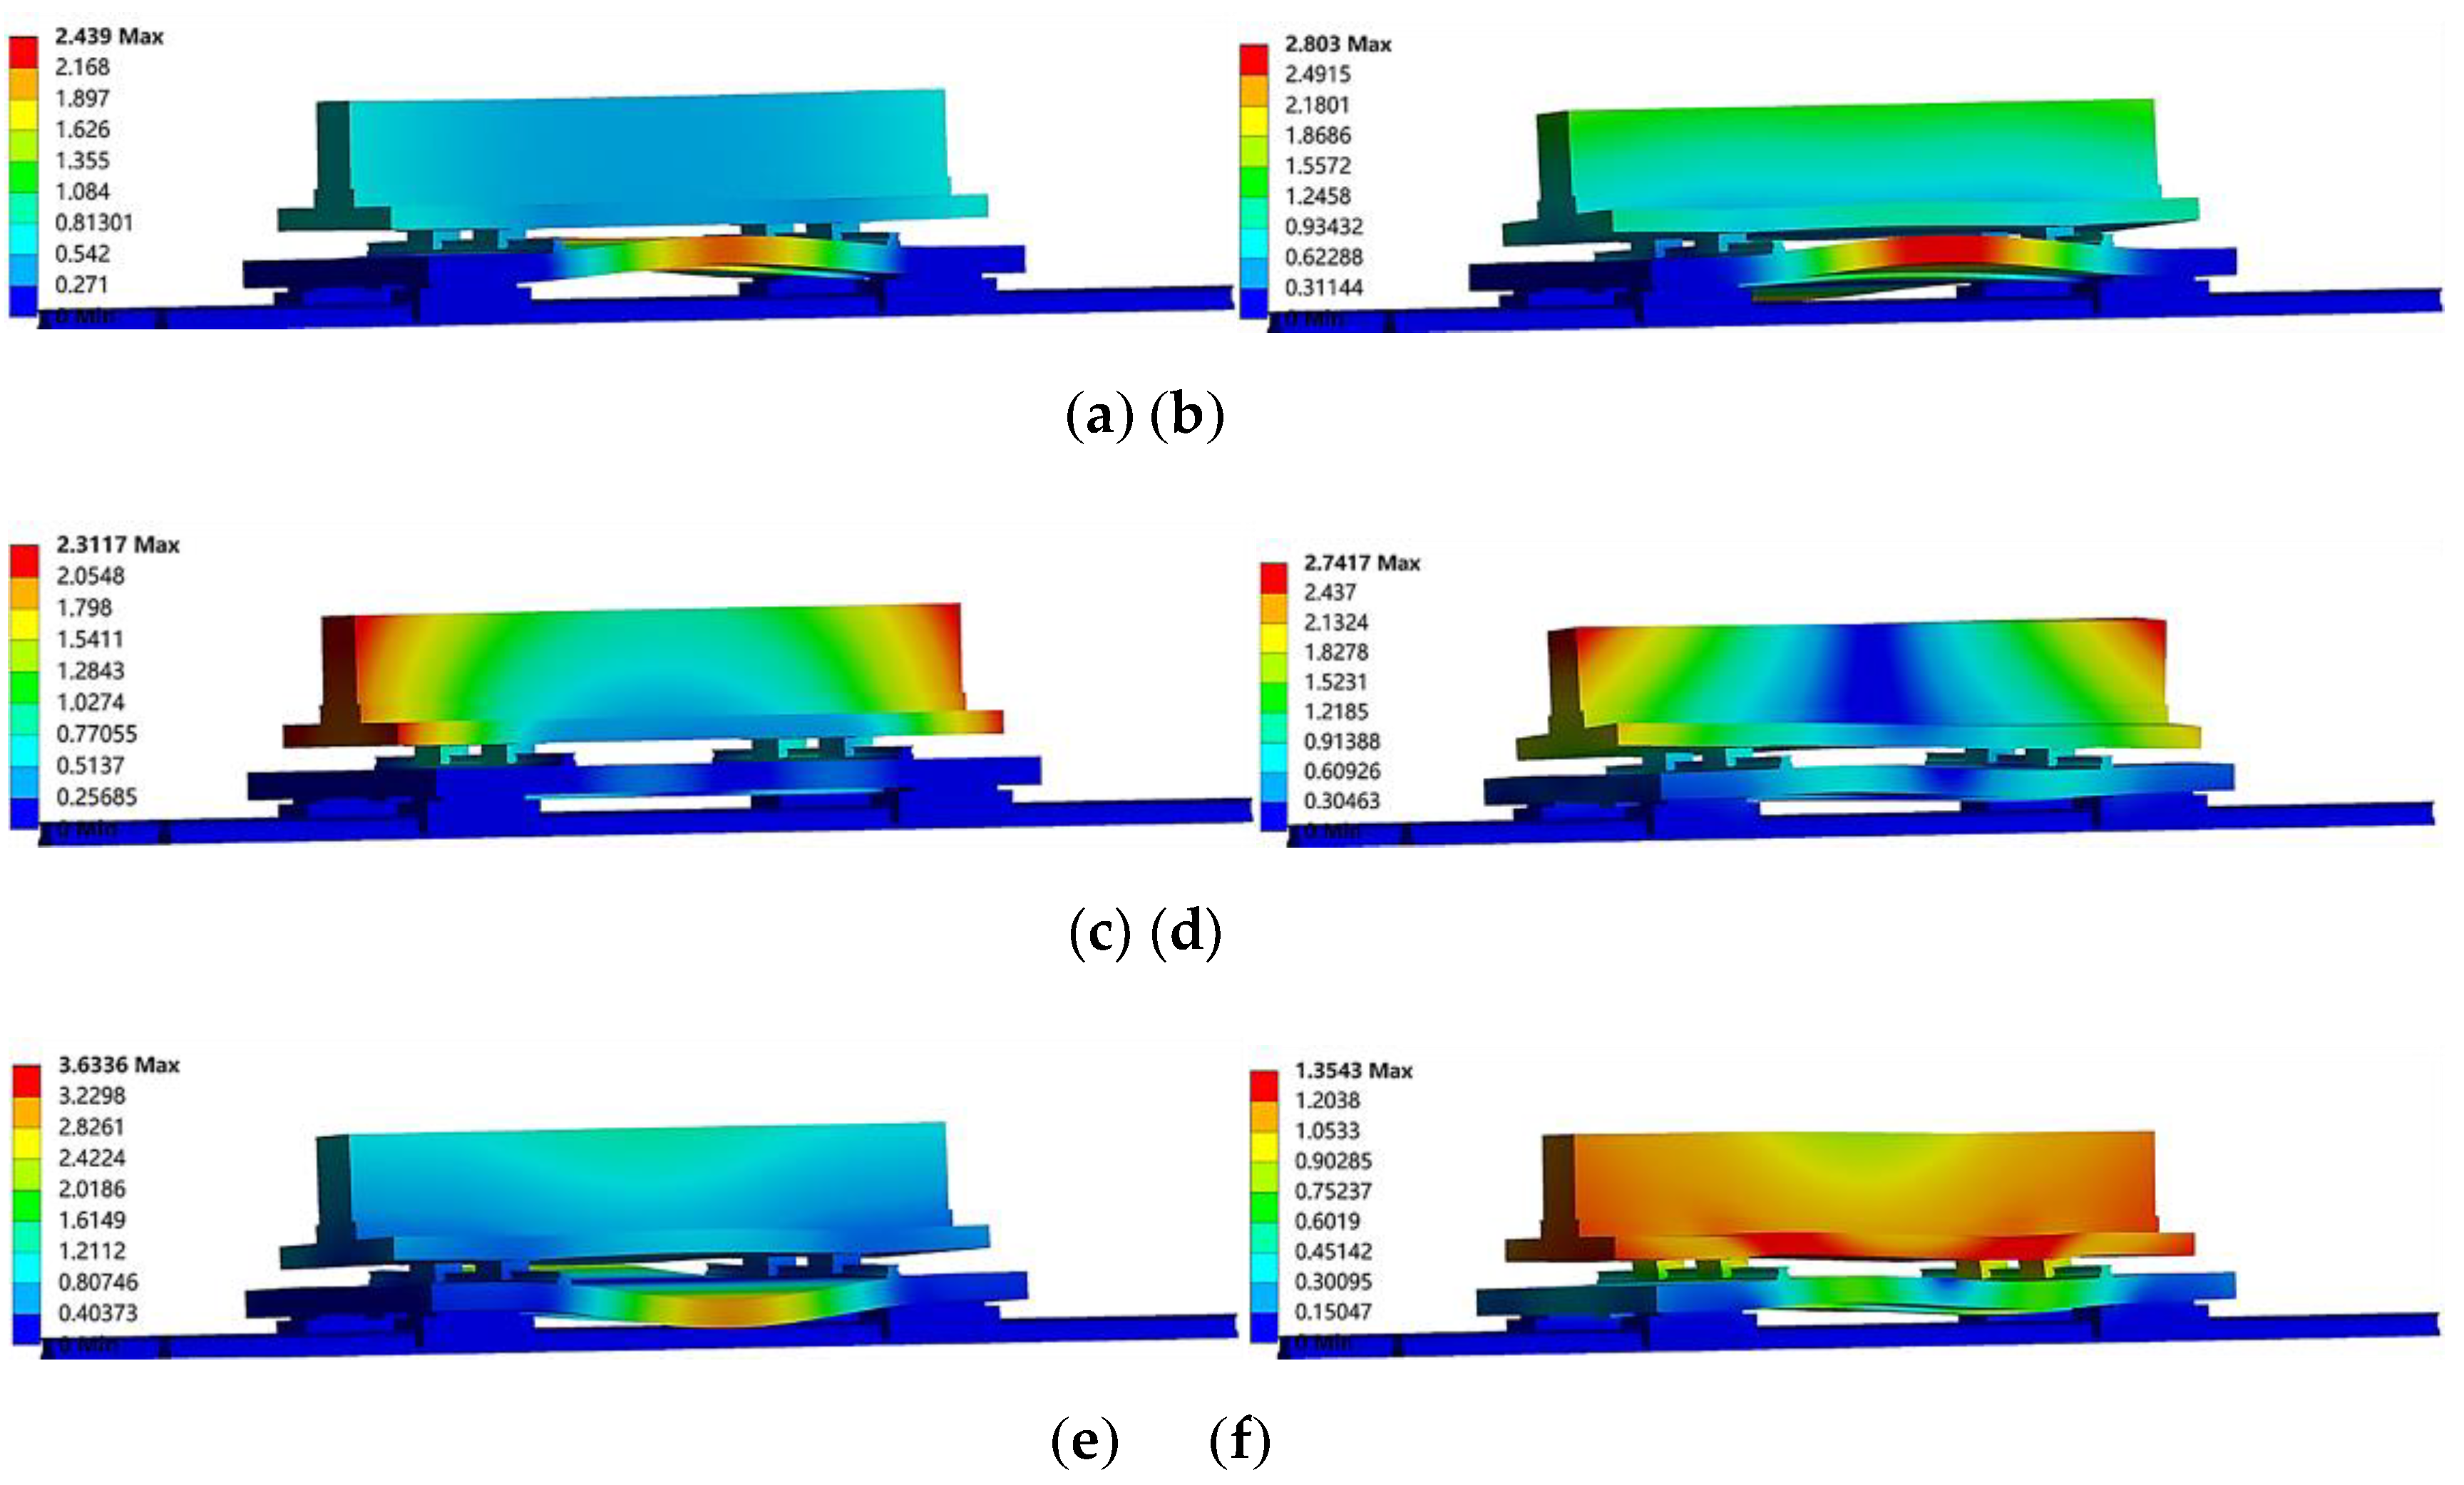
Figure 14.
The equivalent stress cloud diagrams of the measured slider when the loading block is of different thicknesses: (a) 47mm loading block thickness,(b) 70.5mm loading block thickness, and (c) 94mm loading block thickness.
Figure 14.
The equivalent stress cloud diagrams of the measured slider when the loading block is of different thicknesses: (a) 47mm loading block thickness,(b) 70.5mm loading block thickness, and (c) 94mm loading block thickness.
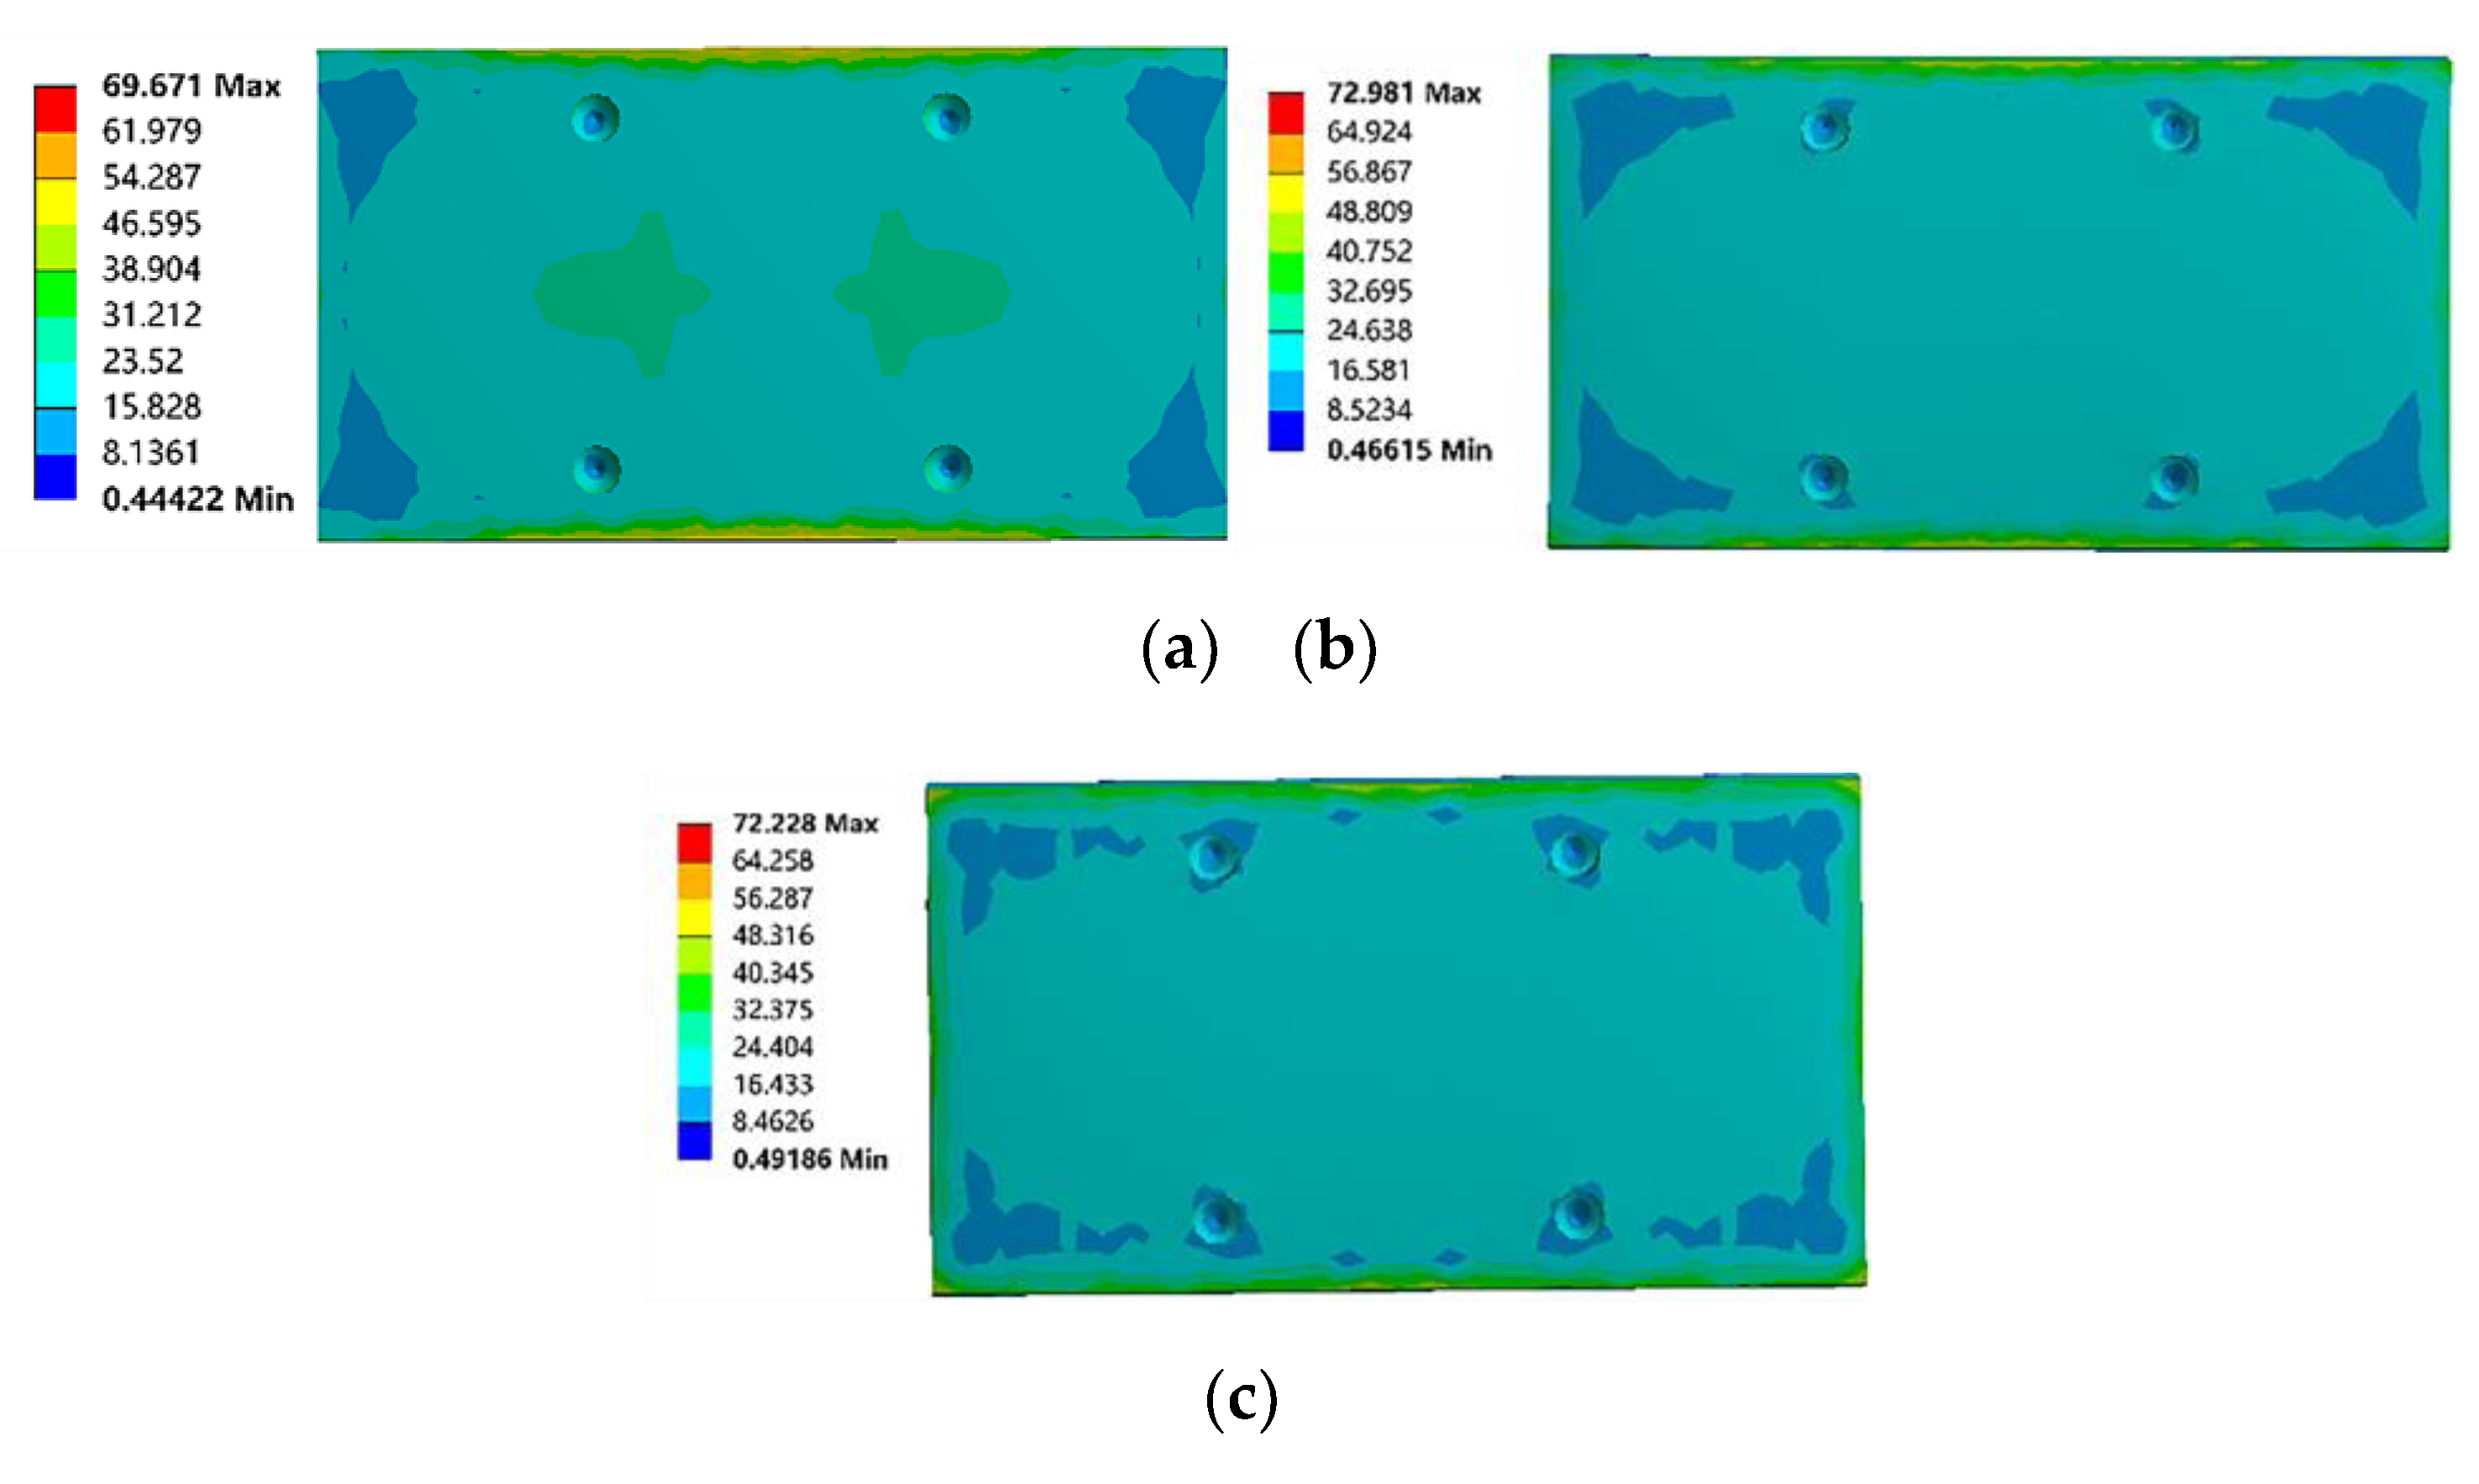
Figure 15.
The equivalent strain cloud diagrams of the measured slider when the loading block is of different thicknesses: (a) 47mm loading block thickness,(b) 70.5mm loading block thickness, and (c) 94mm loading block thickness.
Figure 15.
The equivalent strain cloud diagrams of the measured slider when the loading block is of different thicknesses: (a) 47mm loading block thickness,(b) 70.5mm loading block thickness, and (c) 94mm loading block thickness.
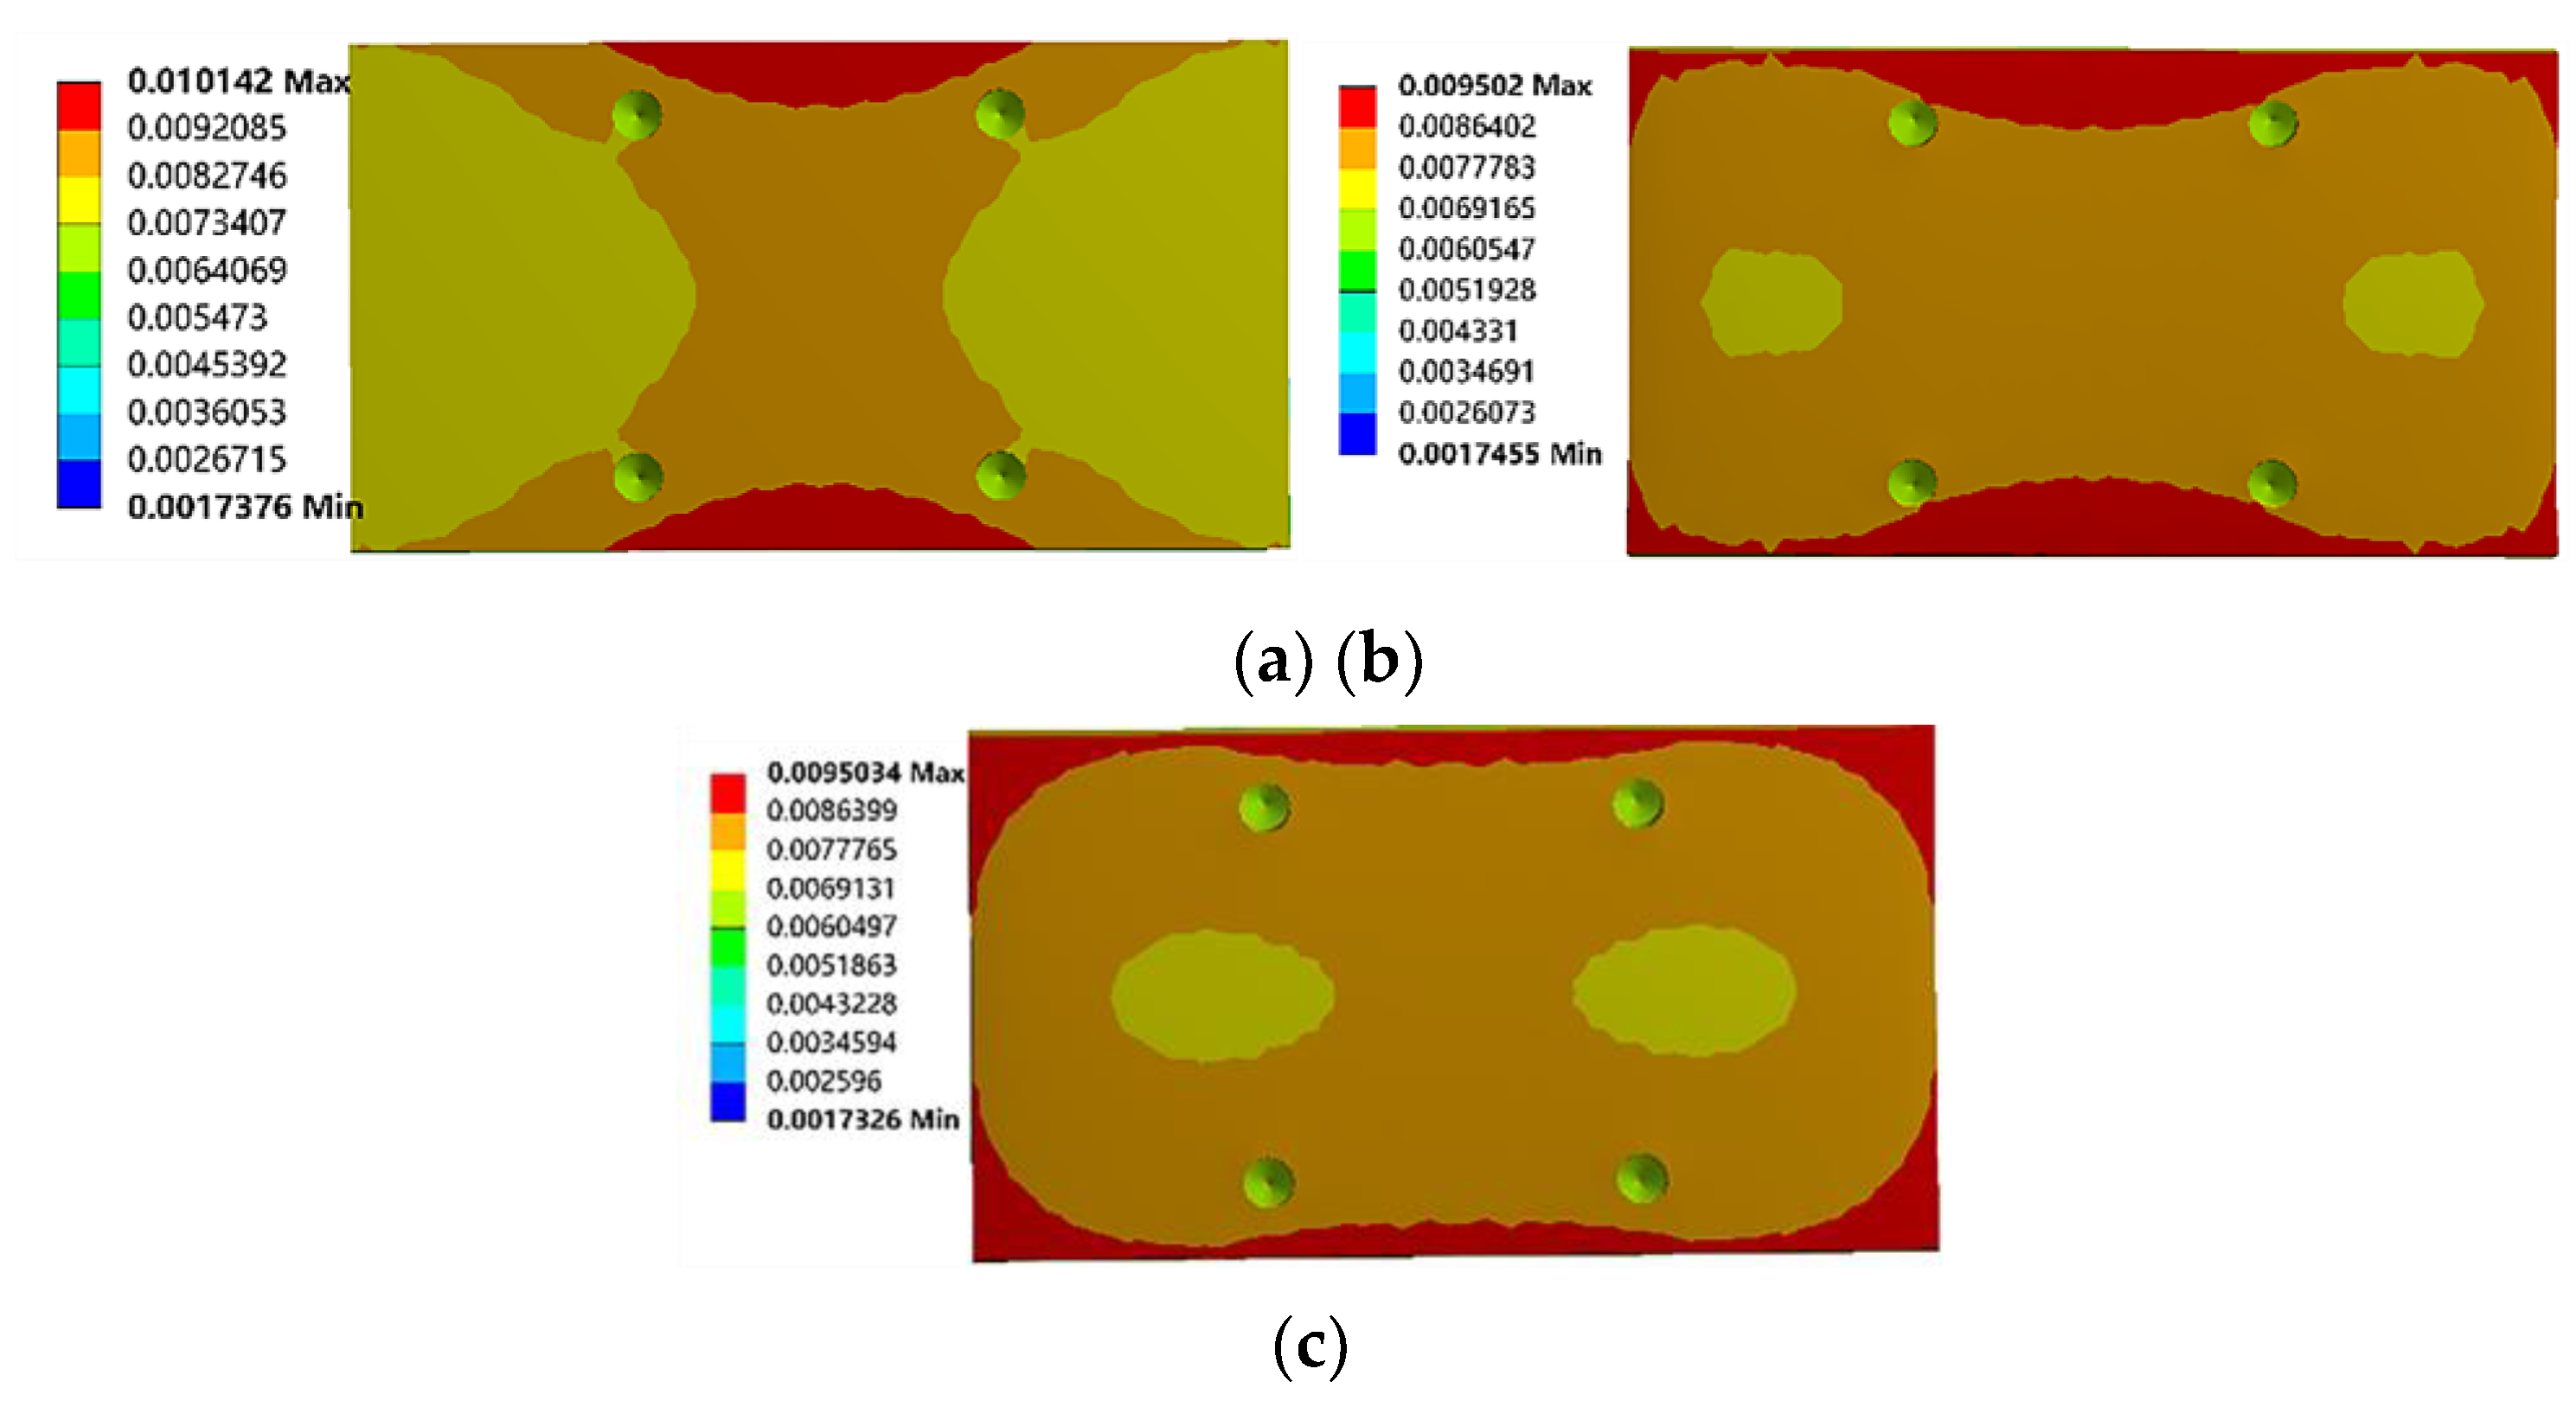
The analysis results are presented in Figure 14 and Figure 15. Figure 14 illustrates the comparison of equivalent stress on the upper surface of the tested slider under three different loading block thickness conditions. In Figure 14(a), when the loading block thickness is 47 mm, two regions of high stress are observed in the center of the slider's upper surface, while four regions of lower stress are located at the edges, and the remaining areas exhibit a relatively uniform stress distribution. Figure 14(b), with a loading block thickness of 70.5 mm, the high-stress regions on the slider's upper surface disappear, and except for the low-stress edge regions, the stress distribution in the other areas becomes more uniform. Figure 14(c) shows that when the loading block thickness is 94 mm, the stress distribution on the upper surface of the slider is similar to that in Figure 14(b), but the area of the low-stress edge regions is relatively smaller.
Comparative analysis reveals that the uniformity of stress on the slider's upper surface significantly improves when the loading block thickness is increased to 70.5 mm compared to 47 mm. Although the area of lower stress regions at the edges slightly decreases when the loading block thickness is further increased to 94 mm, the overall improvement in stress uniformity is minimal. A similar conclusion can be drawn from the strain distribution cloud diagrams shown in Figure 15 for the different loading block thicknesses. Considering the impact of loading block thickness on the uniformity of the stress on the slider surface, as well as the need to conserve space and material, a loading block thickness of 70.5 mm, which is 1.5 times the slider thickness, is selected.
5. Experimental Verification
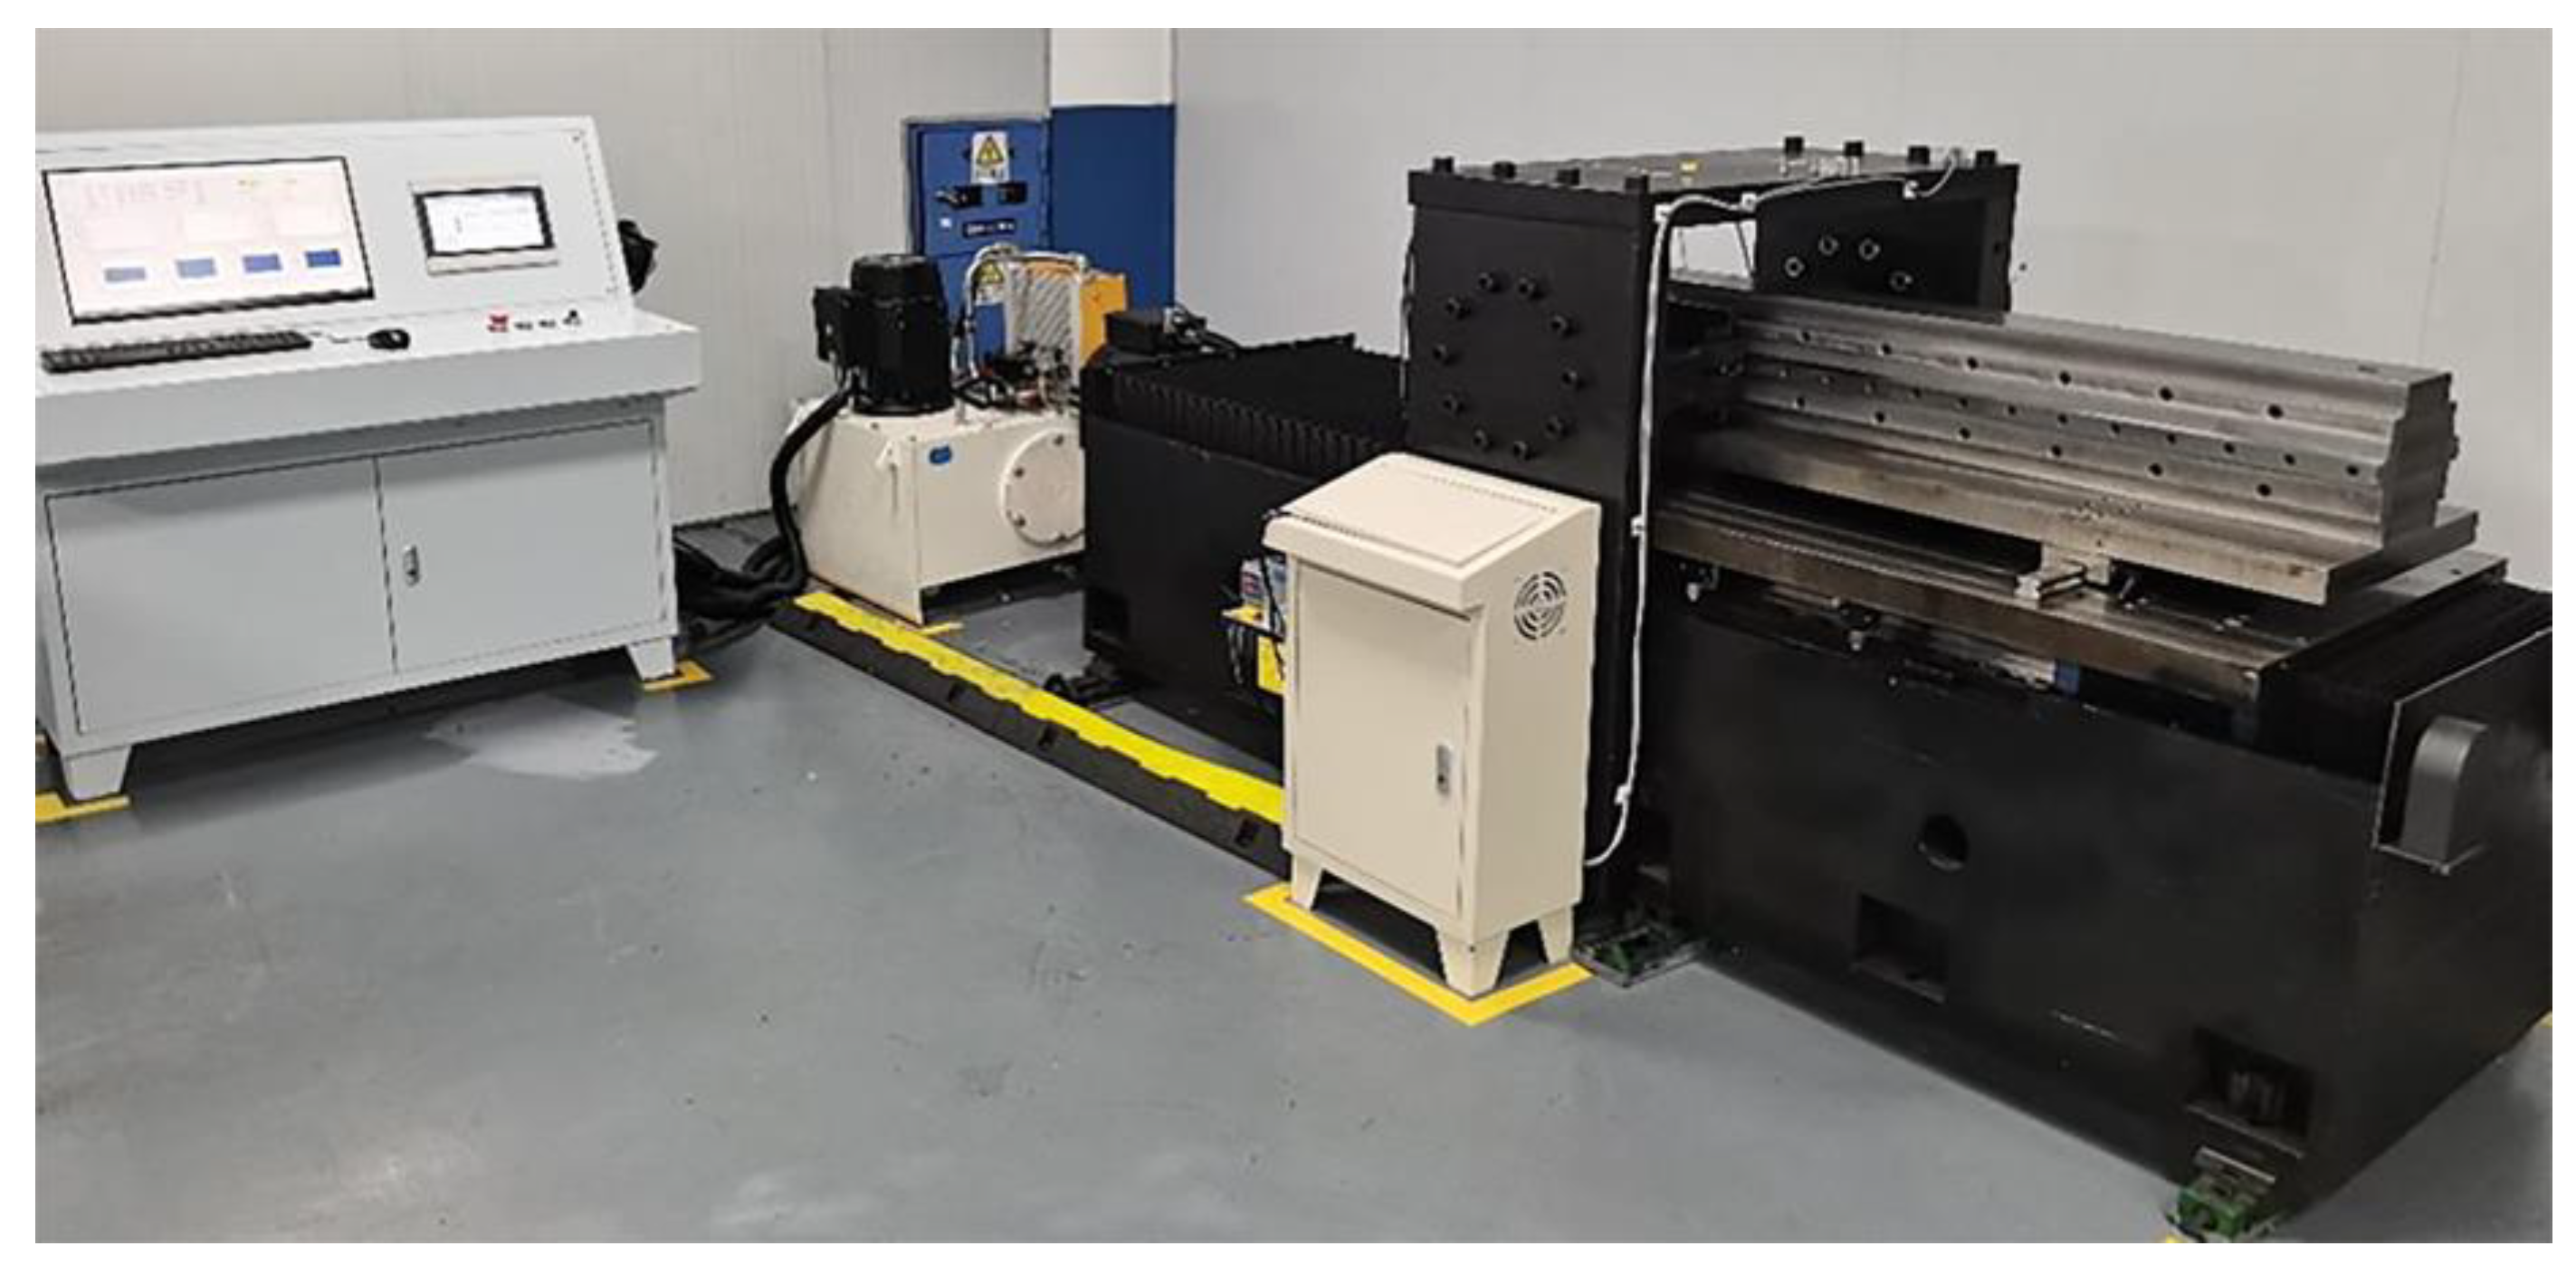
This experimental validation contains the assessment of the operational precision, preload drag force, and accuracy of the fatigue life testing of the multi-parameter guide pair. The bench consists of a main body, hydraulic system, and electric control cabinet, as illustrated in Figure 16. Prior to experimentation, both software and hardware are rigorously tested to ensure the proper functioning of keys, display screens, test software, and sensors. Additionally, the overall structure of the test bench underwent vibration and durability testing to verify its stability under various environmental and operational conditions. Repeatability tests were conducted under identical experimental conditions to validate the repeatability of the testing platform [23].
Figure 16.
Multi-parameter test bench for rolling linear guide pairs.
5.1. Verification of Motion Accuracy
This study evaluates manual measurements of the operational precision for guide pairs classified as precision levels 3P and 4P. Both guide pairs were of the same model, specifically the LGD35 type. The test length of the guide rail is 1500 mm, the operating speed is 20 m/min, and the experimental acceleration is set to 1 m/s2. Three contact displacement sensors were installed appropriately for these measurements. Figure 17 presents the measurement data from the three sensors for both accuracy grades. Due to the arbitrary initial positions of the displacement sensors being set to random values, the measured data exhibited notable discrepancies in displacement value.
Figure 17.
Measurement data of the motion accuracy of guide rail pairs of different accuracy grades: (a) Measurement data of the motion accuracy of 3P-level guide rail pairs, and(b) Measurement data of the motion accuracy of 4P-level guide rail pairs.
Figure 17.
Measurement data of the motion accuracy of guide rail pairs of different accuracy grades: (a) Measurement data of the motion accuracy of 3P-level guide rail pairs, and(b) Measurement data of the motion accuracy of 4P-level guide rail pairs.
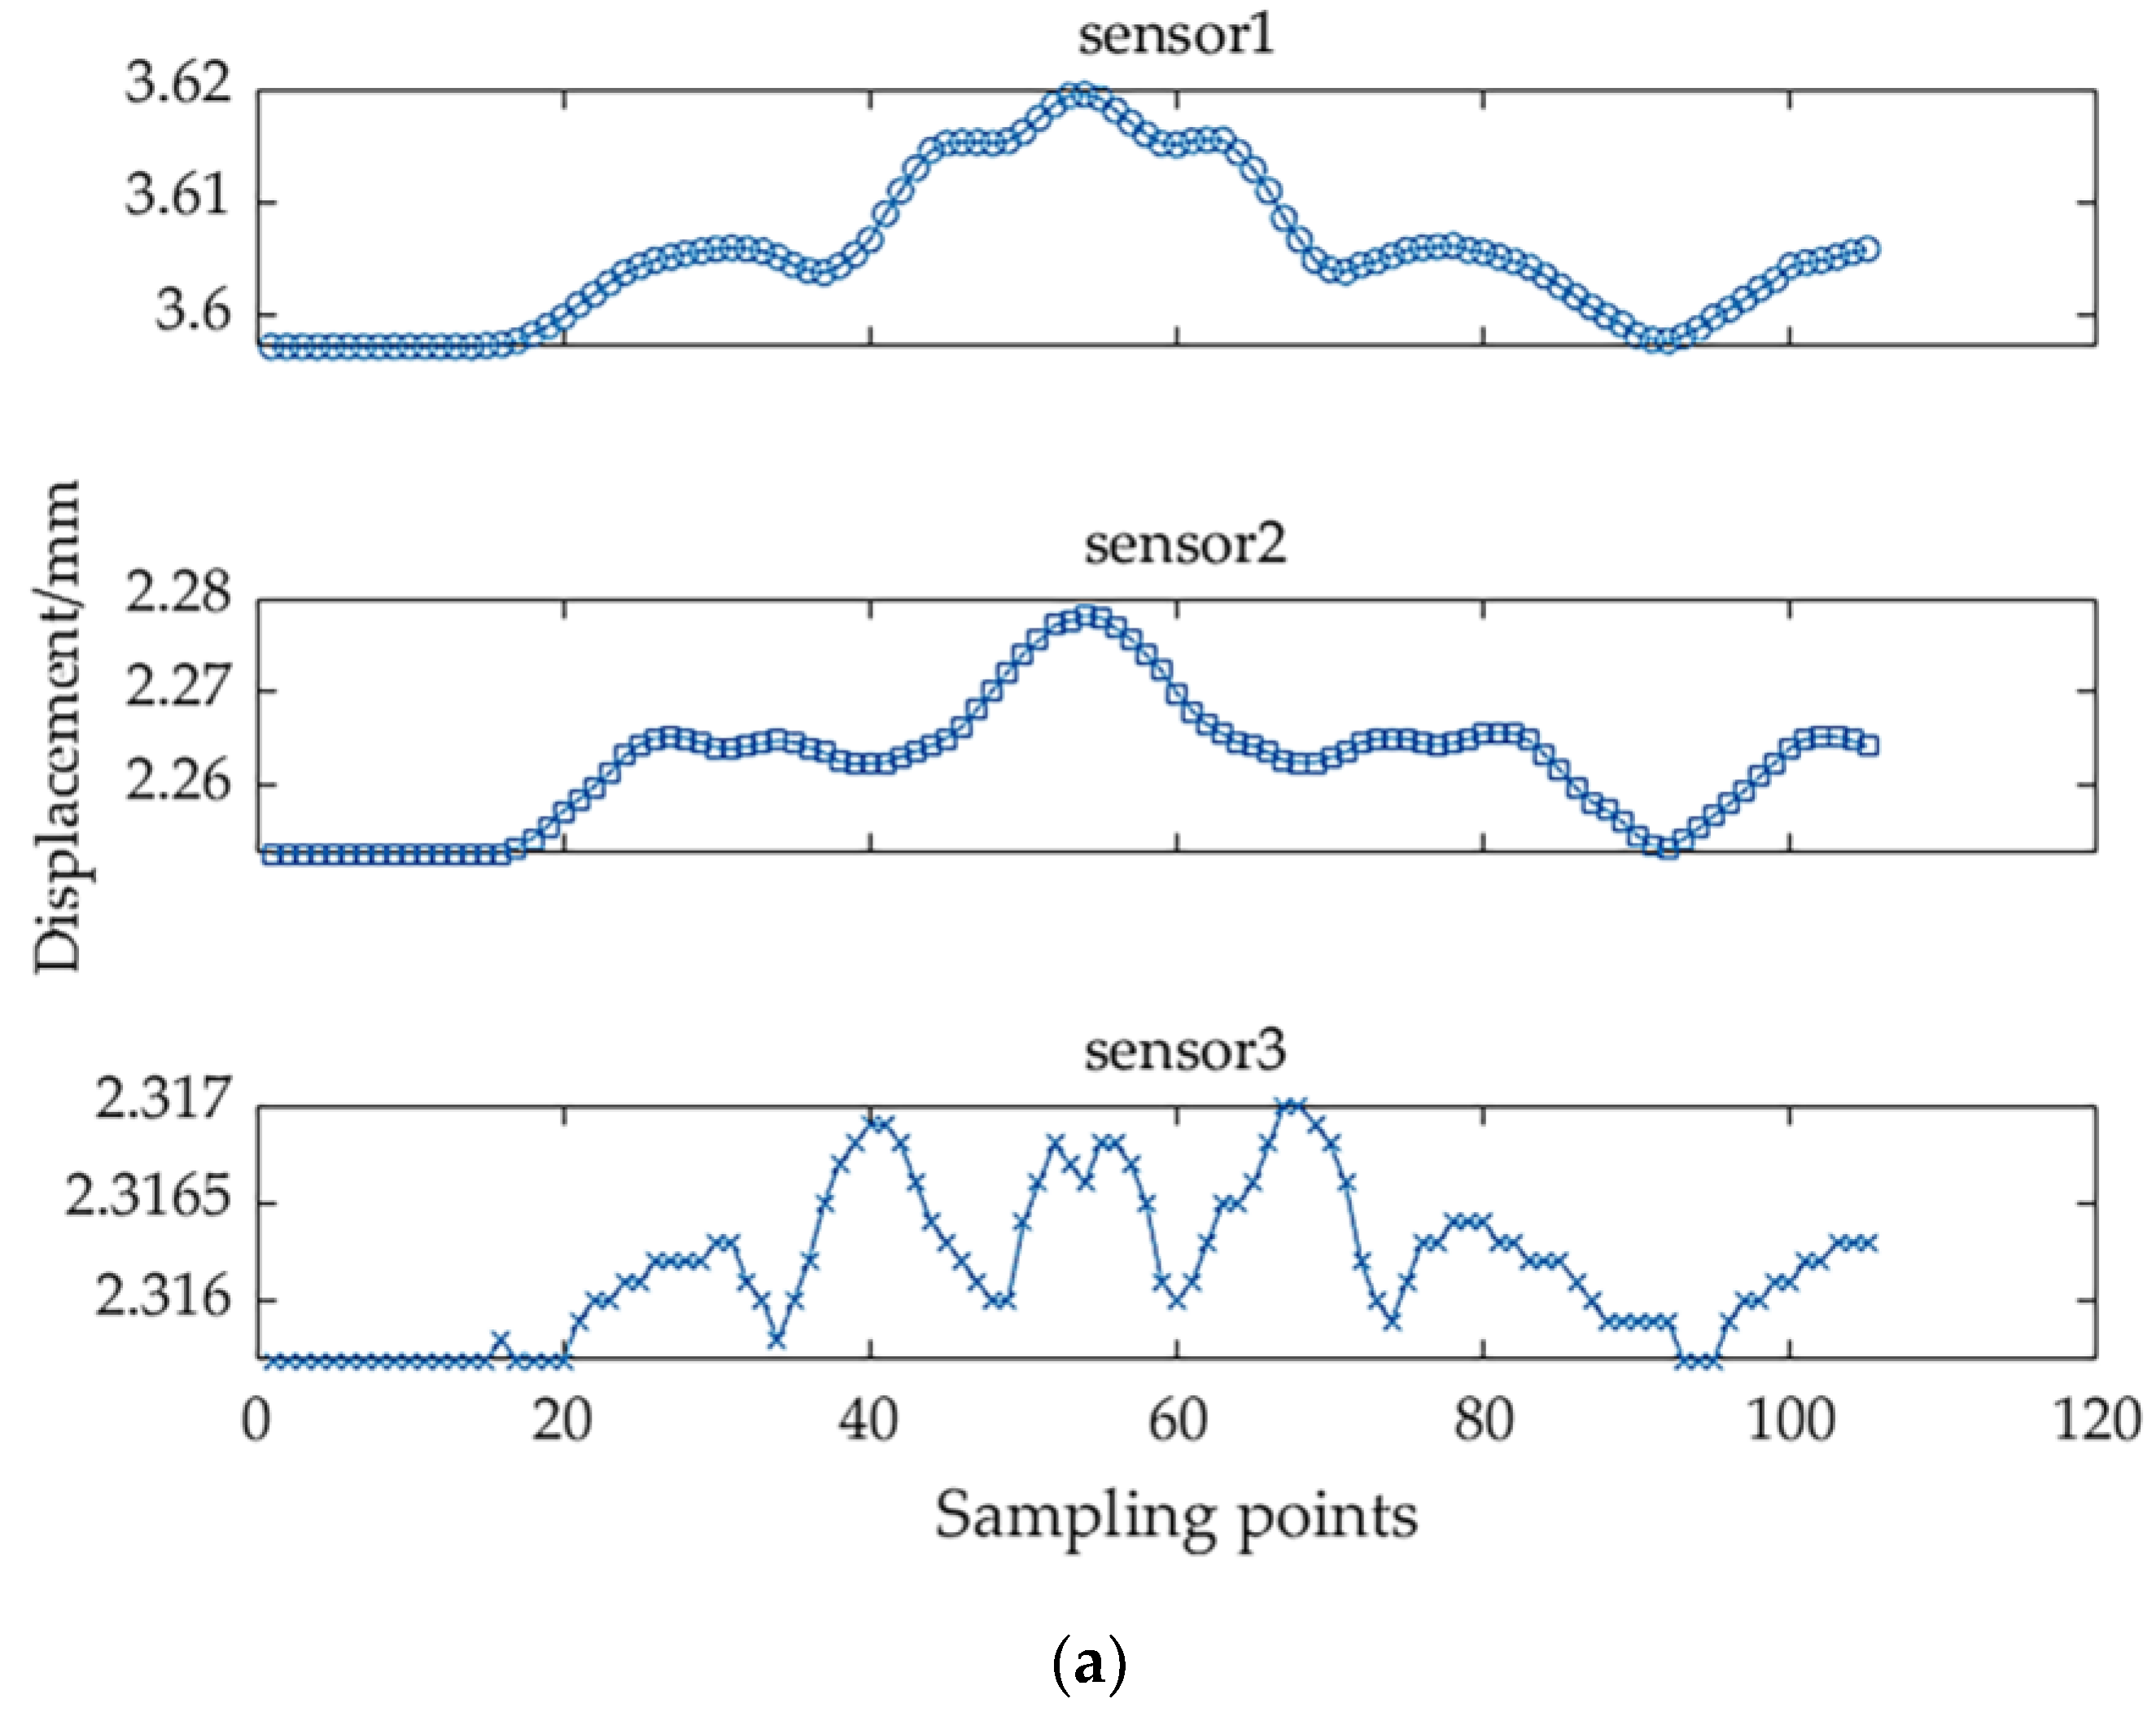
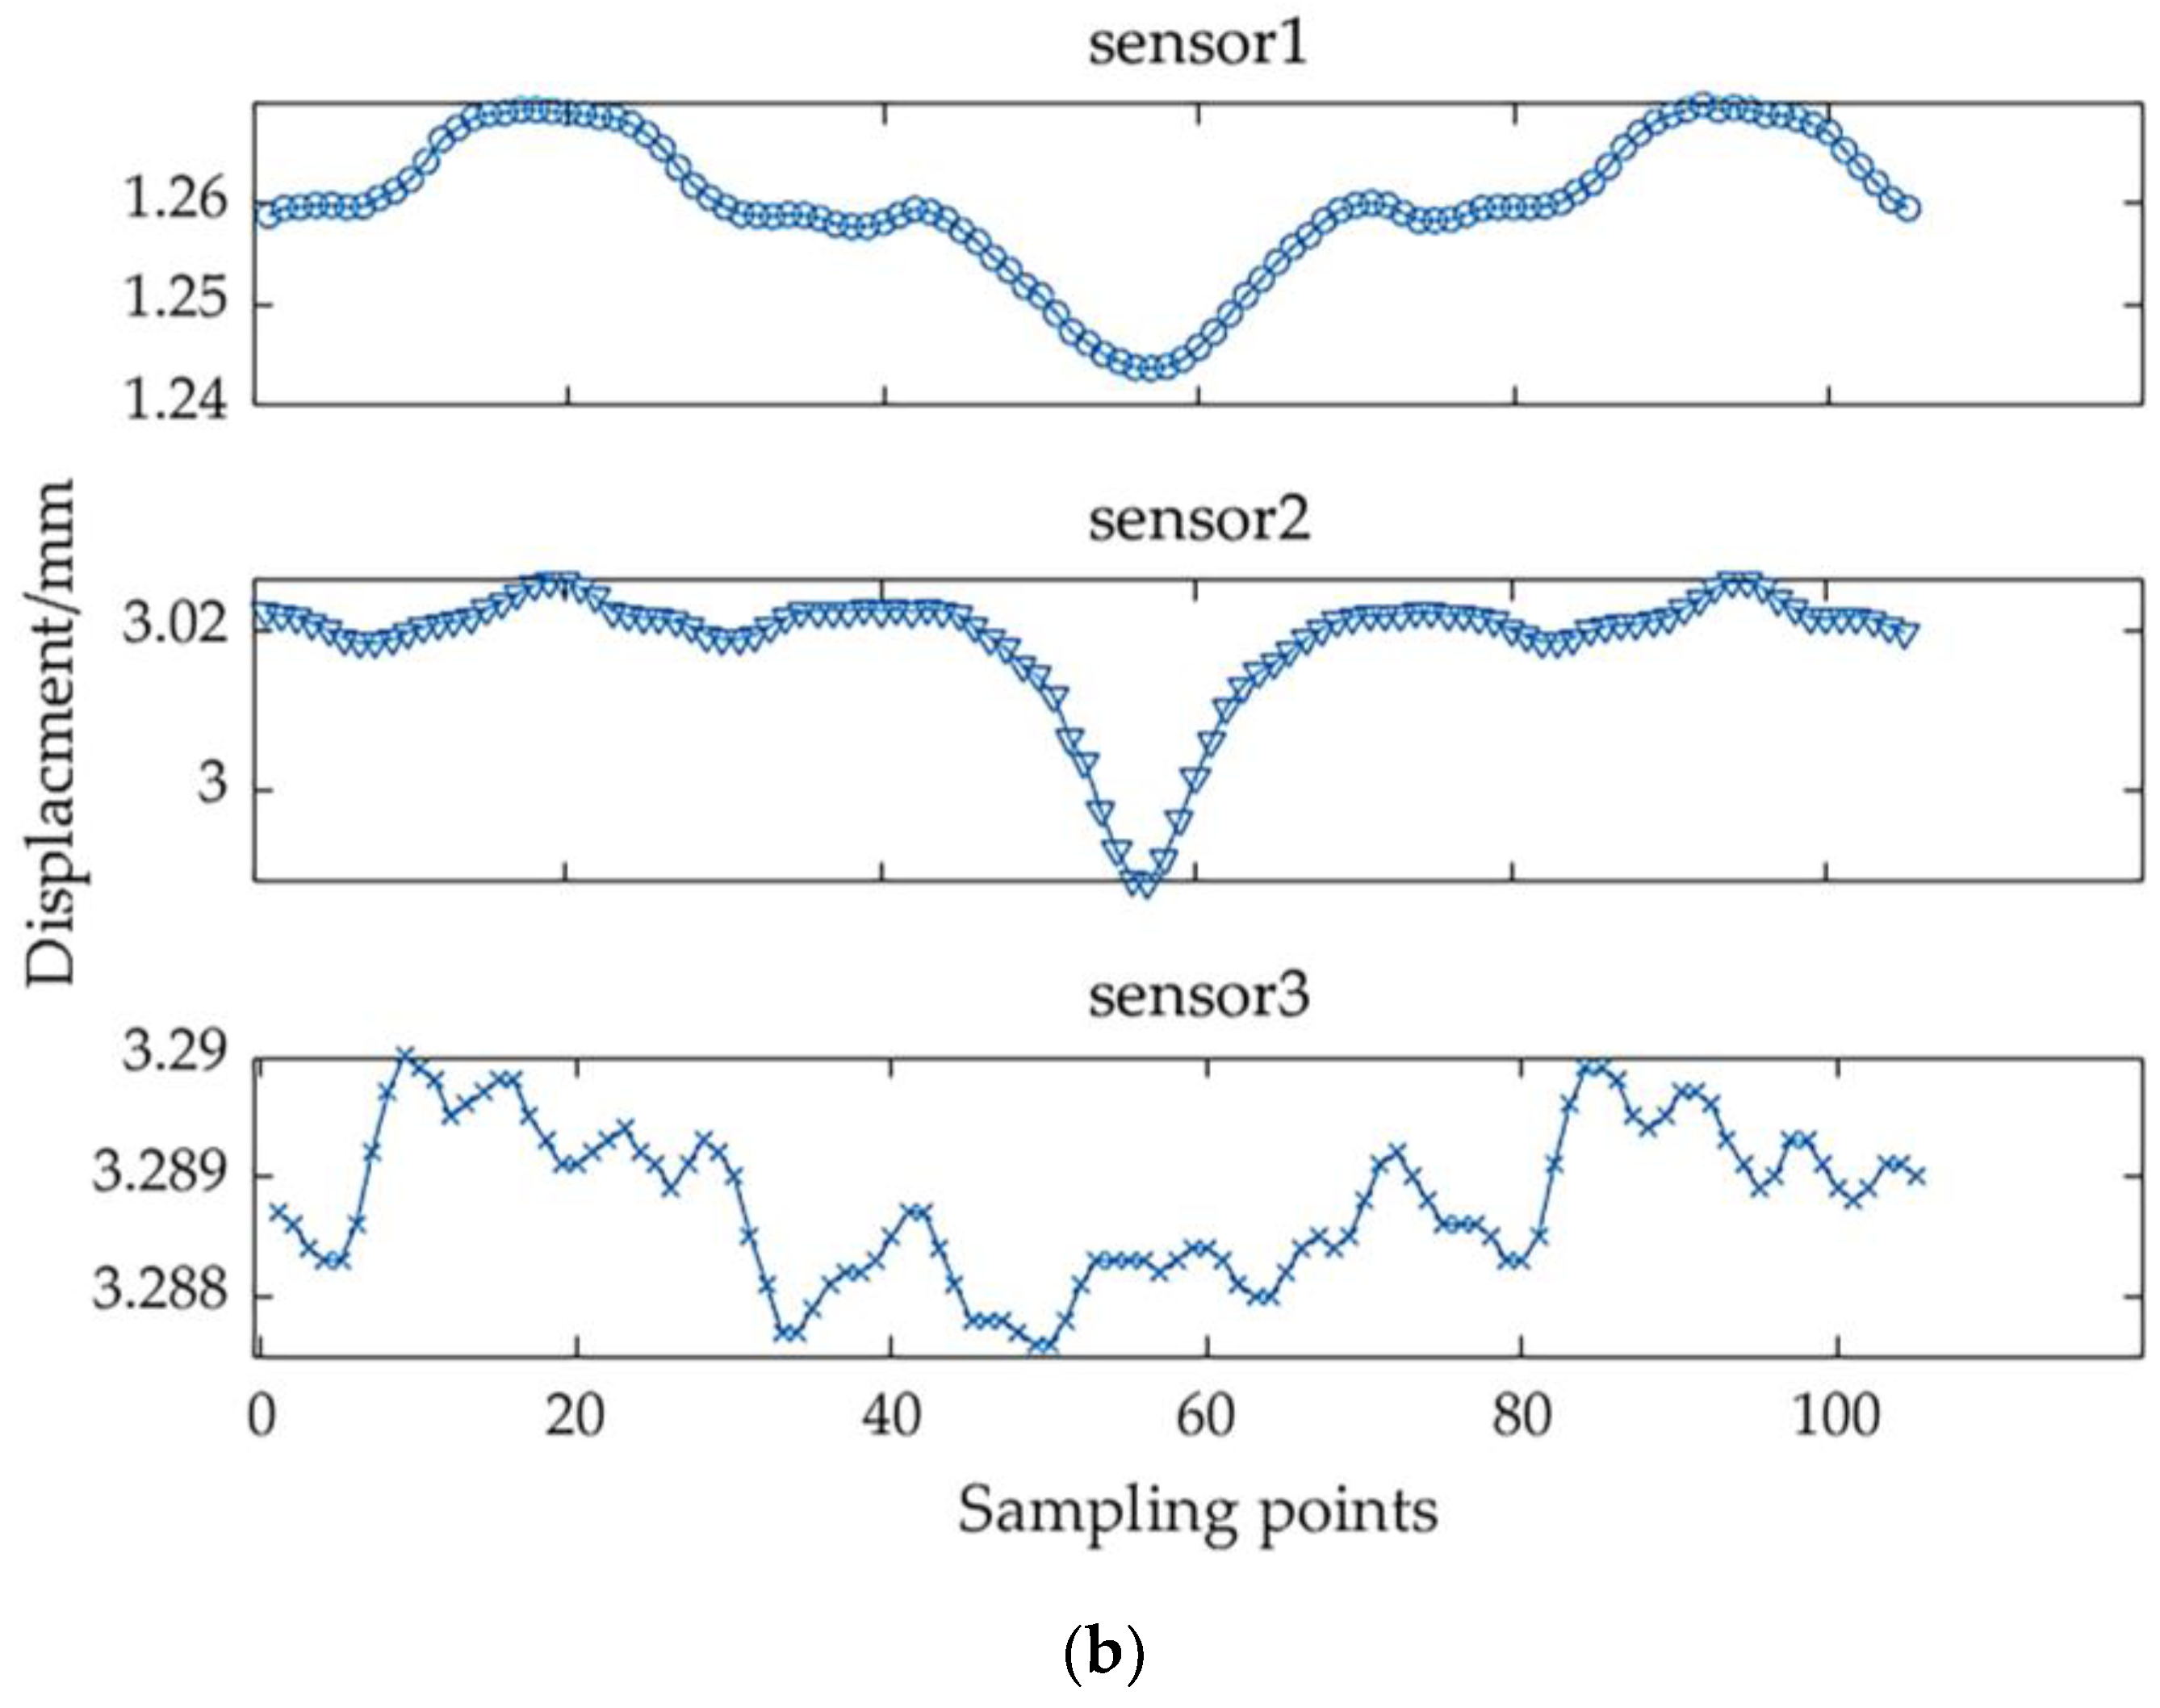
Figure 17(a) illustrates the displacement data for the 3P accuracy guide rail pair. Sensors 1 and 2 are used to measure vertical parallelism, while Sensor 3 measures horizontal parallelism. The data from Sensors 1 and 2 exhibit a similar trend, with minor variations in parallelism at both ends and greater variations in the middle section. This indicates that the vertical parallelism of the middle section of the guide pair is inferior to that of the ends. The data from Sensor 3 show considerable overall volatility, suggesting a relatively uniform trend of horizontal parallelism across the entire guide. Figure 17(b) displays the operational data for the 4P precision guide pair. Similar to the previous data, Sensors 1 and 2 display comparable trends with small variations in parallelism at both ends and larger variations in the middle. This also indicates that the vertical parallelism in the middle section of this guide pair is poorer compared to that at the end. The data from Sensor 3 once again display significant variability, reflecting a relatively uniform trend of horizontal parallelism throughout the entire guide.
By substituting the sensor data into Equations (1)–(8), the vertical parallelism, horizontal parallelism, and twist angle for both the 3P and 4P precision guide pairs can be calculated. These calculated values were then compared with the manually measured vertical and horizontal parallelism values, as shown in Table 3. The measurement accuracy for the vertical and horizontal parallelism of the 3P-grade guide pair was found to be 85.8% and 87.9%, respectively, while the 4P-grade guide pair exhibited measurement accuracy of 85.7% for vertical parallelism and 85.8% for horizontal parallelism. These accuracies are notably high, and all measurement results conform to the acceptance criteria specified by industry standards, thereby validating both the motion precision measurement methods and the derived equations.
Table 3.
Comparison table of motion accuracy measurement results.
| Accuracy level | Manualmeasurement(μm) | Test benchmeasurement(μm) | Accuracy rate | Yes/No conform to the standard | ||
|---|---|---|---|---|---|---|
| 3P | Vertical parallelism |
12 | Vertical parallelism | 13.62 | 86.5% | Yes |
| Horizontal parallelism | 10 | Horizontal parallelism | 11.65 | 83.8% | Yes | |
| Tilt angle | — | Tilt angle | 0.0013° | — | Yes | |
| 4P | Vertical parallelism | 21 | Vertical parallelism | 18.34 | 87.3% | Yes |
| Horizontal parallelism | 18 | Horizontal parallelism | 15.88 | 88.2% | Yes | |
| Tilt angle | — | Tilt angle | 0.0034° | — | Yes | |
5.2. Verification of Preload Drag Force
This study measures the manual preload drag forces of three LGD35BH guide rail pairs at light, medium, and heavy pre-tightening levels. The test bench is utilized to analyze preload drag forces under non-lubricated conditions. The testing length of the guide was set at 1500 mm, with an operational speed of 20 m/min. To enhance the length of the uniform speed measurement phase, the experimental acceleration was set to 6 m/s². An S-type force sensor is accurately installed. To verify the repeatability of the test bench in measuring the preload drag force, sensor data from several running-in processes were collected. Figure 18 presents the drag force data for the three pre-tightening levels.
As shown in Figure 18, during the tensile phase of the sensor, the data present negative values, while during the compression phase, the data show positive values. Notably, the values recorded during the tensile phase are generally slightly lower than those during the compression phase. This phenomenon is attributed to the grinding marks created during the machining process of the guide pair, resulting in a minor difference in the coefficient of friction between the two directions, which ultimately affects the magnitude of the preload drag force in each direction. The minor fluctuations in the tensile and compressive measurement data depicted in the figure are due to the precision of the sensor. However, these variations are minimal and can be considered negligible.
Figure 18.
Measurement data of preload drag force under different pre-tightening levels: (a) Measurement data of preload drag force for light pre-tightening level,(b) Measurement data of preload drag force for medium pre-tightening level, and (c) Measurement data of preload drag force for heavy pre-tightening level.
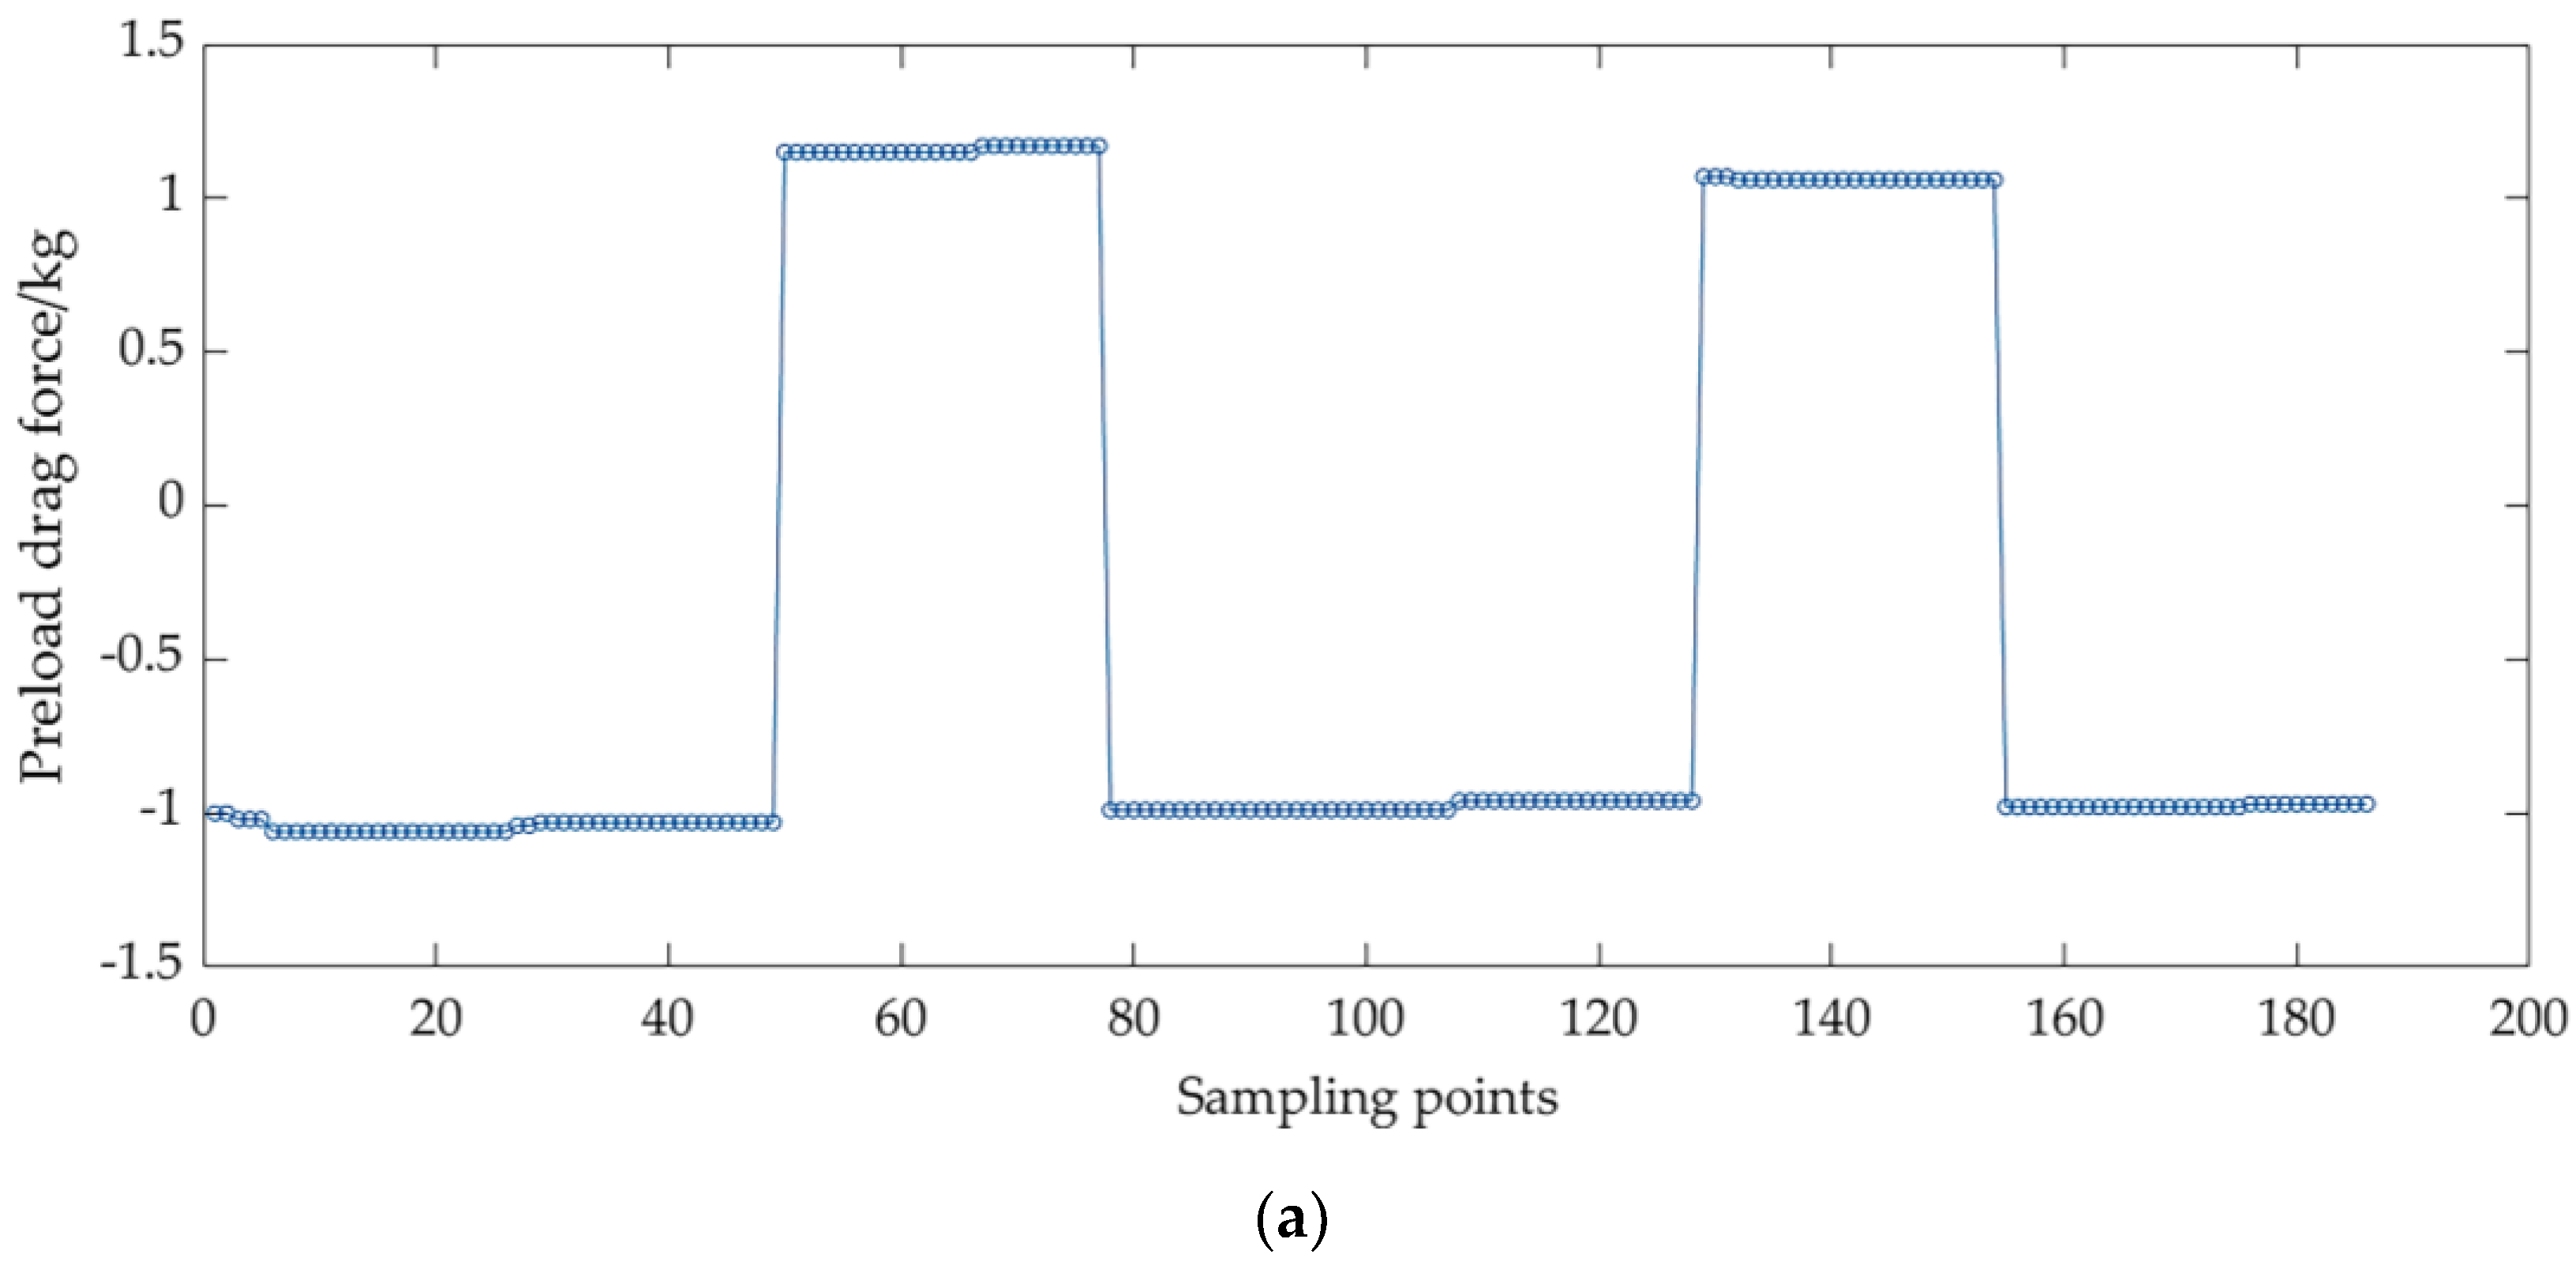
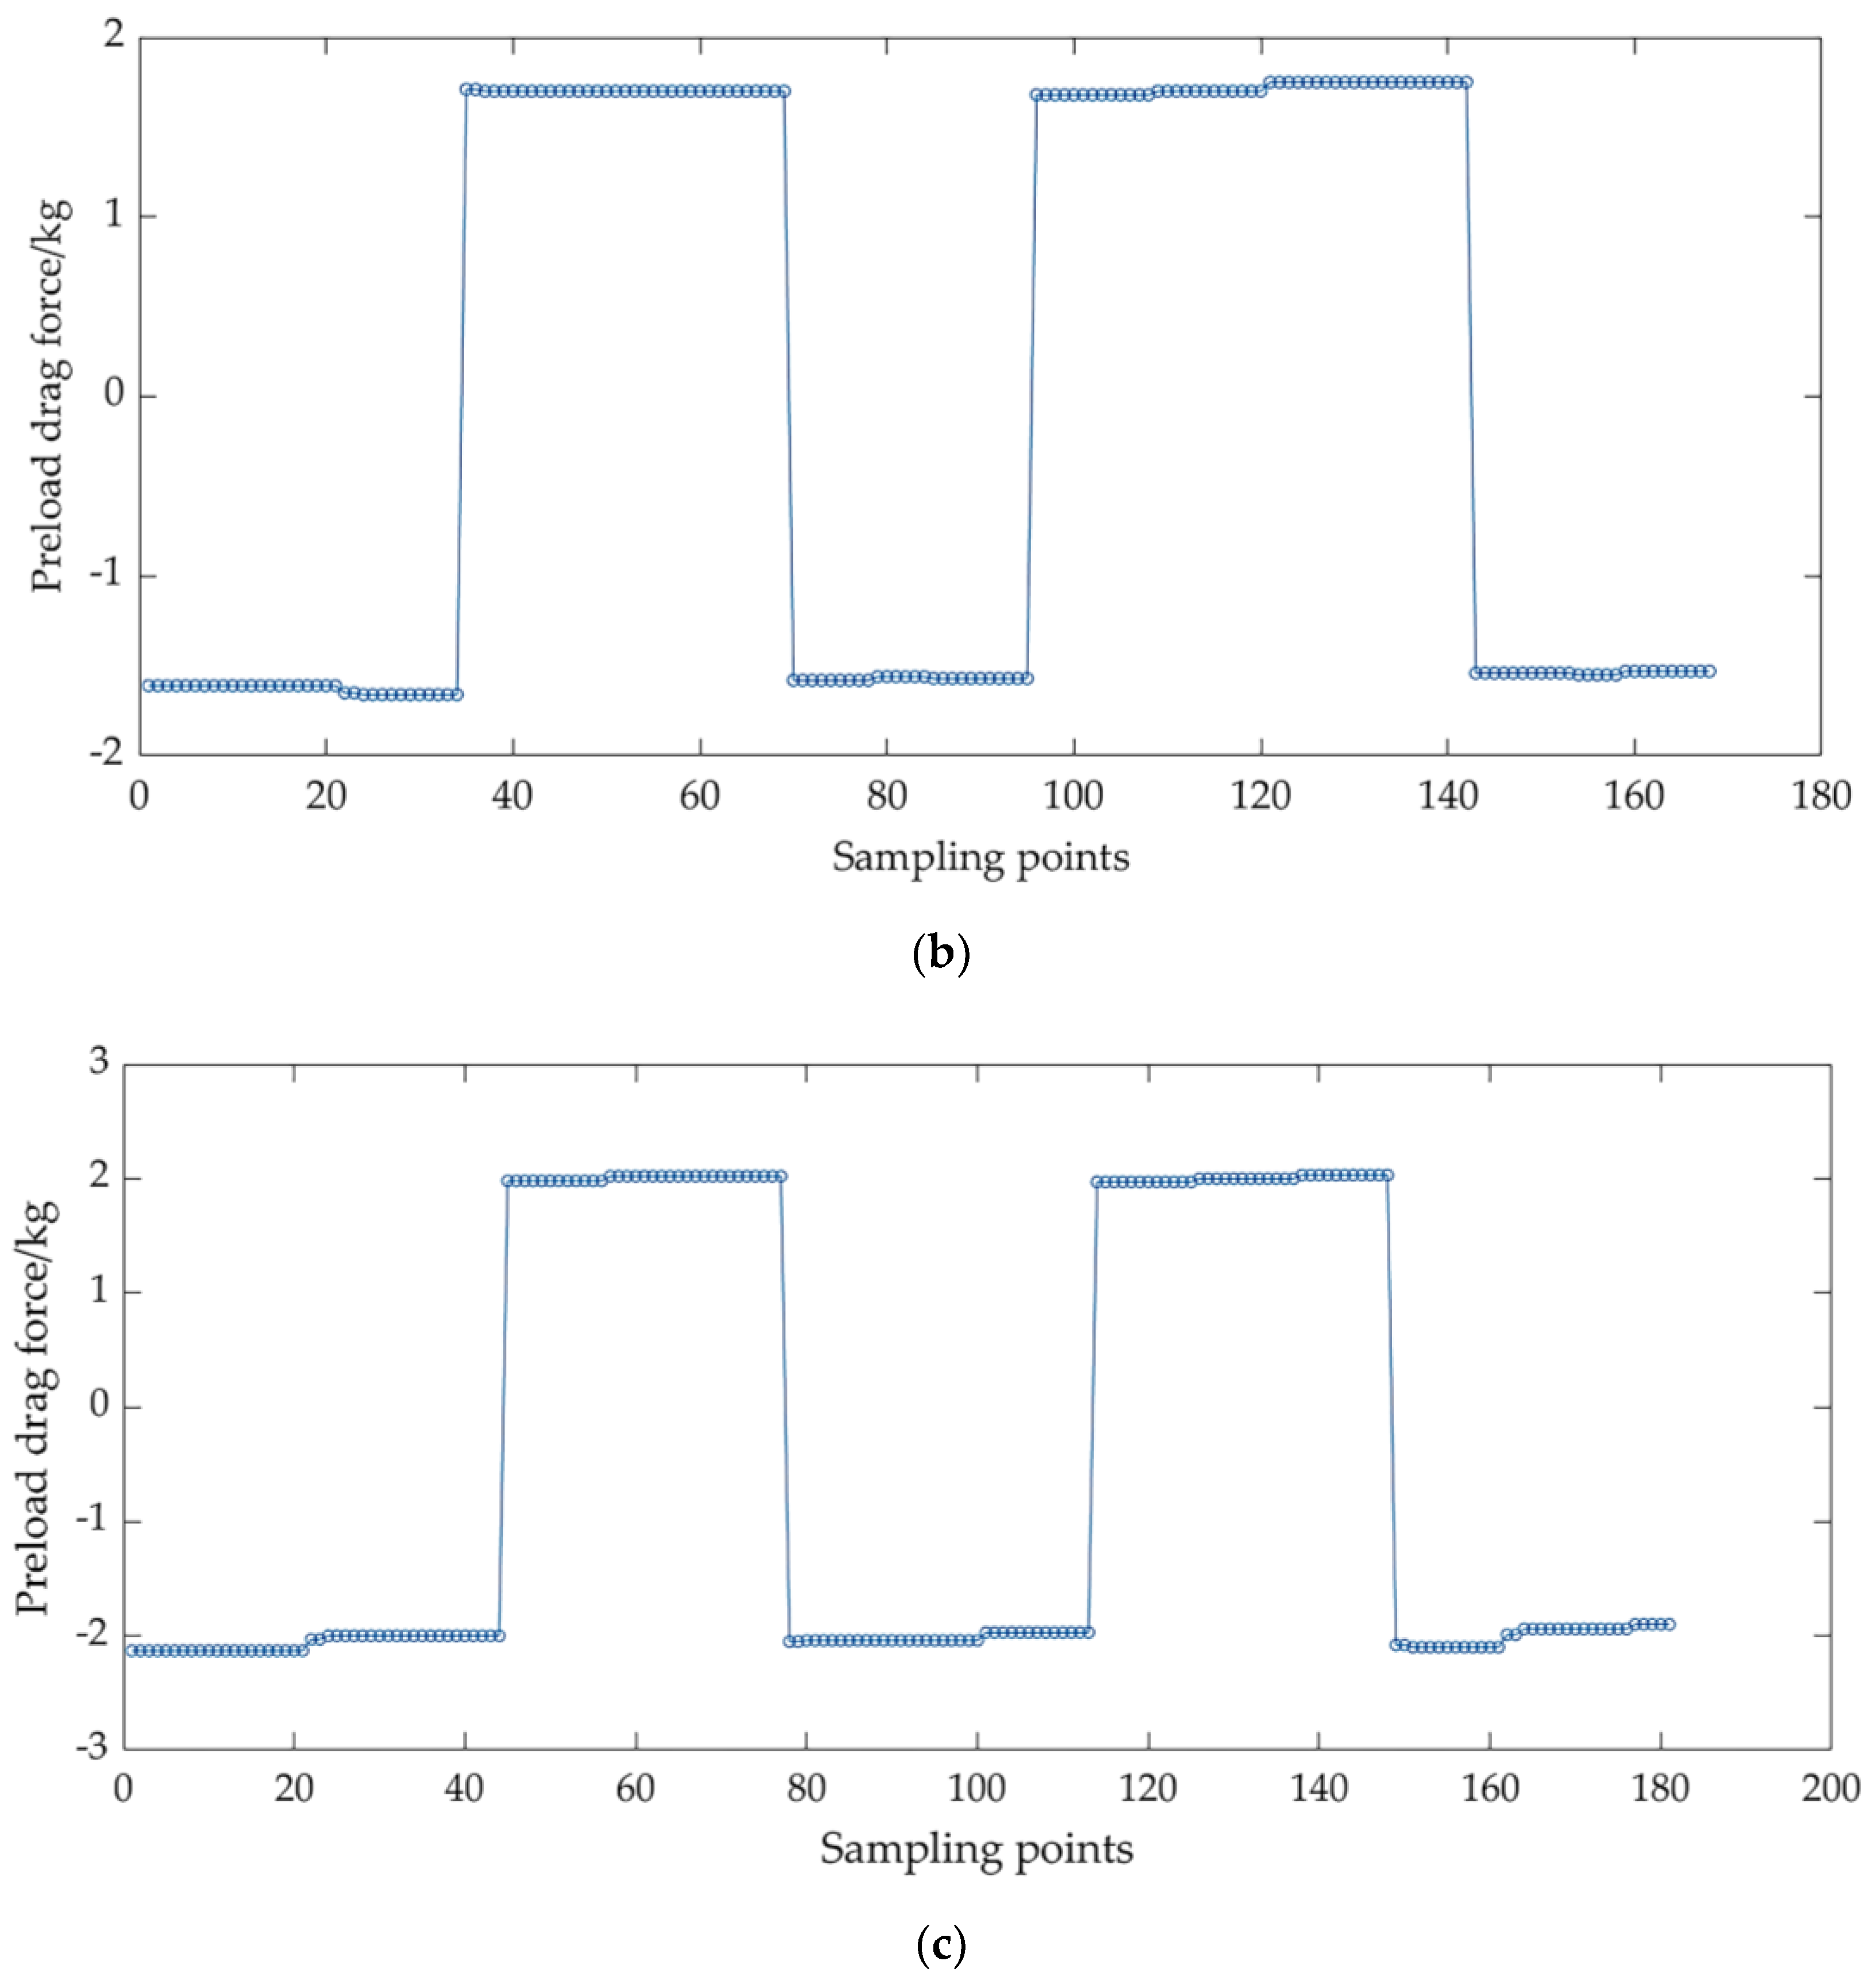
The data from the sensors were taken exclusively from the tensile phase, and the average values were calculated to represent the preload drag force of the guide pair. Table 4 presents the measured preload drag force values obtained from the test bench for the three preload levels conform to the standard requirements. Furthermore, when compared to manual measurements, the accuracy rates for light, medium, and heavy preload were found to be 98%, 99.3%, and 98%, respectively. This confirms that the test bench can accurately measure the preload drag force values of guide pairs under different preload levels.
Table 4.
Comparison table of motion accuracy measurement results.
| Model | Standardrequirements(N) | Manual measurement(N) | Test bench measurement(N) | Accuracy rate | ||
|---|---|---|---|---|---|---|
| LGD35 | 9.4±1.5 | Light pre-tightening level |
10 | Light pre-tightening level |
9.8 | 98% |
| 13.9±1.8 | Medium pre-tightening level |
15 | Medium pre-tightening level |
14.9 | 99.3% | |
| 21.3±1.9 | Heavy pre-tightening level |
20 | Heavy pre-tightening level |
19.6 | 98% | |
5.3. Verification of Fatigue life
To verify the accuracy of the multi-parameter test bench in simulating the operating conditions of the guide pair and measuring its fatigue life, a comparative analysis was performed between the actual experimental lifespan and the theoretical lifespan.
First, the theoretical calculation for the fatigue life of the guide pair was conducted, using the basic equation for the rated lifespan of the guide pair as provided in the [24]:
where, represents the rated life. represents the rated dynamic load. represents the test equivalent load. represents the hardness coefficient. When the raceway hardness is not less than HRC58, is taken as 1. represents the temperature coefficient. In this study, the test temperature is 25℃ ≤ 100℃, and is taken as 1. represents the lubrication coefficient. There is one slider on the tested guide rail, and is taken as 1. indicates the accuracy coefficient. The tested guide rail is classified as 3P precision and is taken as 1. Finally, represents the impact load coefficient. Under the working conditions of negligible vibrations with a medium speed range of 15m/min ≤ v ≤ 60m/min, is taken as 1.75.
Section 5.1.3 of the international standard "ISO 14728 - 1 Rolling bearings — Linear rolling bearings — Dynamic load ratings and rated life" states the calculation equation for the basic dynamic load rating C of the linear rolling guide pair as follows:
where, represents the rated dynamic load, demotes the number of steel balls within the effective contact length, is the number of rows of rolling elements, is the contact angle, is the ball diameter, is the raceway radius, and is the effective length of the raceway during the calculation process. The specific model of the guide rail used for the fatigue life verification test in this study is LGD35BH1PA3L1500IYW, which is a 35-series ball rectangular guide with a precision grade of 3P and light preload. The accuracy grade is 3P, and the pre-tightening level is light. By obtaining the corresponding geometric parameters for this model, and substituting them into Equation (11), the rated dynamic load of the guide pair is calculated to be 49,470.4 N.
Substituting the above parameters into Equation (11), the theoretical calculation equation for the fatigue life of the guide rail pair of LGD35BH can be derived as follows:
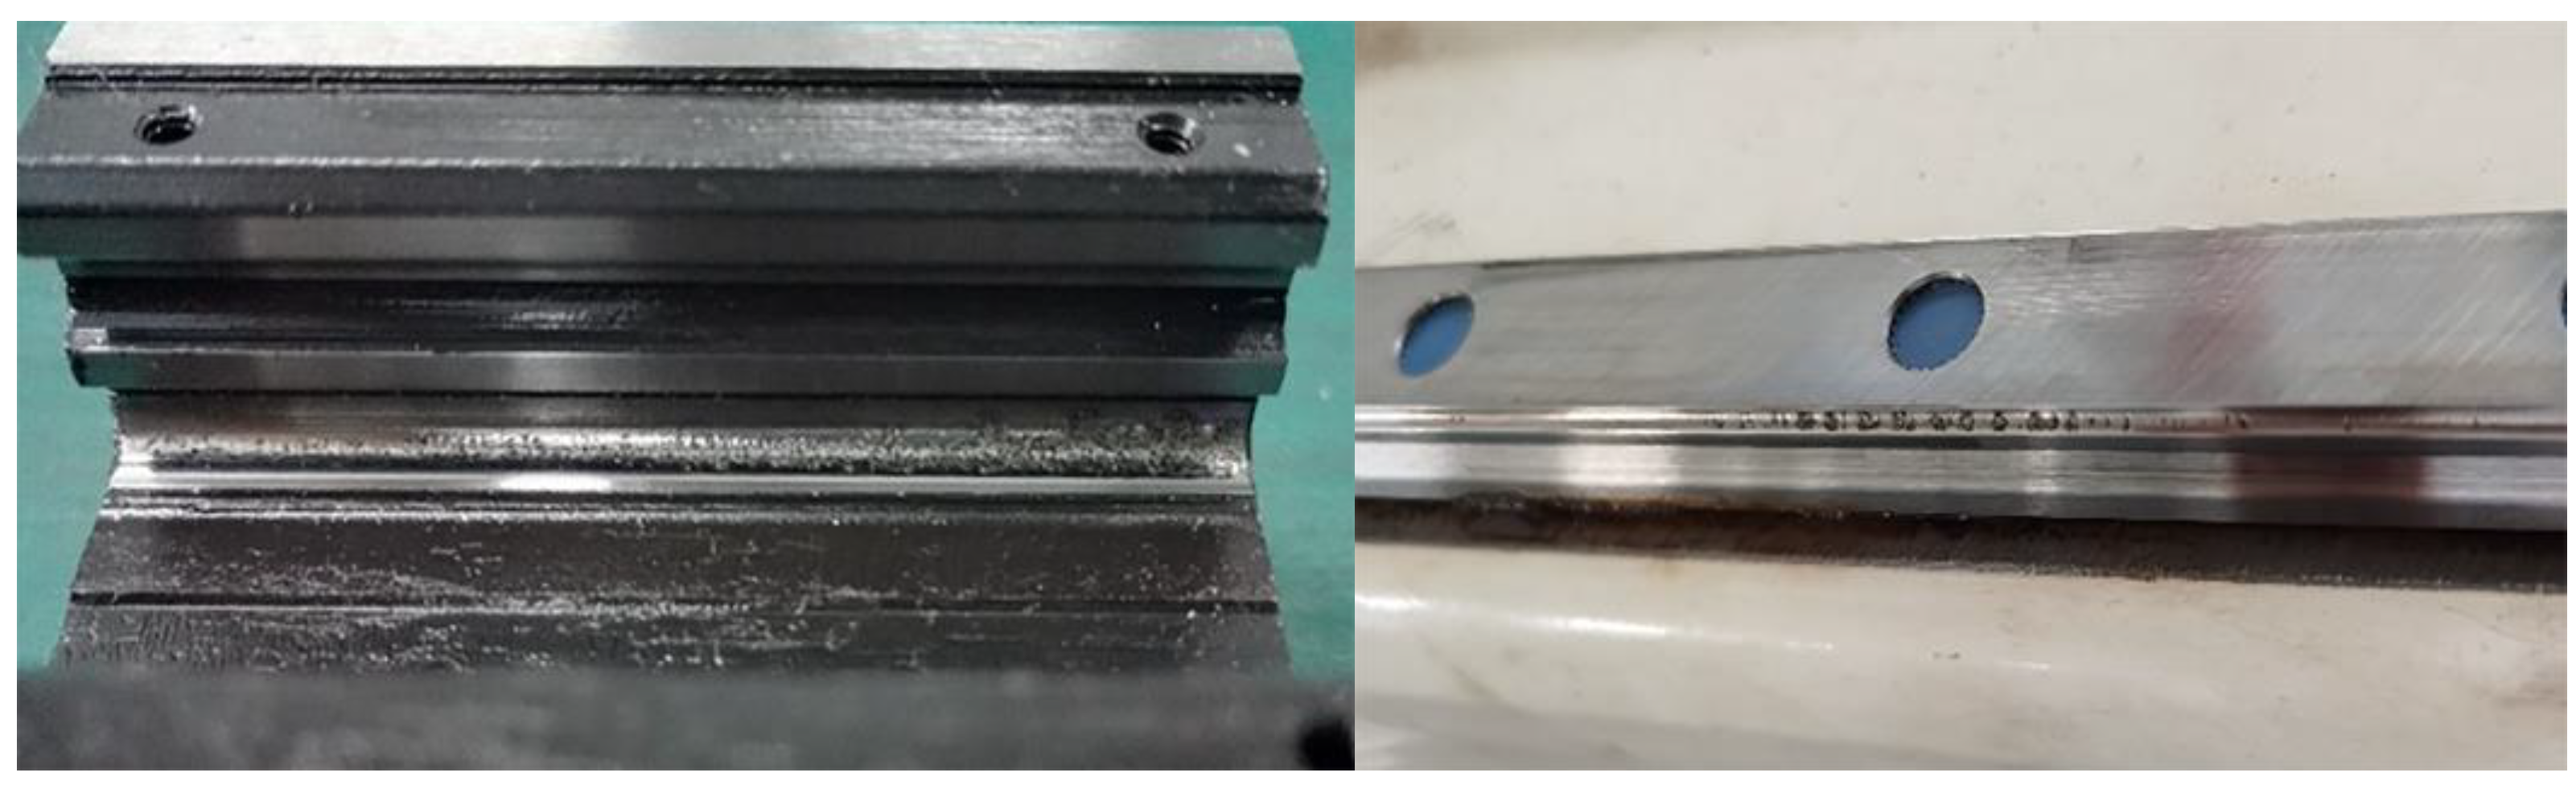
n actual fatigue life test was conducted using three randomly selected guide rail pairs from a sample batch, installed on a multi-parameter test bench. The test maintained constant loading pressure and operating speed, with pressures set at 15000 N, 20000 N, and 25000 N, and each less than half the rated dynamic load. The test bench used a vertical loading method, hence he equivalent load during the experiment was equivalent to the applied loading pressure. The operation speed and acceleration for operational stability was set at 30 m/min and 1 m/s², respectively. Pitting spalling was taken every 1km after detecting abnormal vibration or temperature rises, continuing until spalling met fatigue failure criteria. Figure 19 illustrates the fatigue failure of the slider and guide rail.
Figure 19.
Fatigue failure of the guide rail pair.
The fatigue lives of three guide rails were empirically determined under three distinct loading pressure conditions. Theoretical fatigue lifetimes for the same three guide rails were also calculated. The measurement accuracy of the test bench in assessing the fatigue lives of the guide rail trio was subsequently evaluated. As shown in Table 5, the comparison of the empirical and theoretical fatigue life results indicates that the test bench exhibits high level of accuracy in measuring the fatigue life of the guide rail pair.
Table 5.
Comparison table of motion accuracy measurement results.
| Model | Loading pressure(N) | Theoretical life(km) | Test life(km) | Accuracy rate |
|---|---|---|---|---|
| LGD35 | 15000 | 334.46 | 302.41 | 90.4% |
| 20000 | 141.19 | 150.19 | 93.5% | |
| 25000 | 72.19 | 79.66 | 89.7% |
Figure 20 illustrates a relationship between the theoretical life of the guide rail pair and the test equivalent load, as derived from equation (13). The curve displays an overall descending trend, indicating that as the experimental equivalent load increases, the theoretical lifespan decreases. The pentagram markers represent the experimentally measured fatigue life, which aligns closely with theoretical predictions. This concordance confirms the test bench's accuracy in simulating the operating conditions of the guide rail pair and in measuring fatigue life.
Figure 20.
Shows the relationship between the rated life of the guide rail pair and the experimental equivalent load.
Figure 20.
Shows the relationship between the rated life of the guide rail pair and the experimental equivalent load.

6. Conclusions
The aim of this study is to demonstrate the principles for testing motion accuracy, preload drag force, and fatigue life of rolling linear guide pairs. Based on these experimental principles, a mechanical structure and measurement and control system for a multi-parameter test bench for rolling linear guide pairs were designed. Additionally, statics analysis was conducted on the gantry, while modal analysis was performed on the upper bed to evaluate the impact of loading block thickness on the uniformity of forces experienced by the tested guide pairs, thereby verifying the rationality of the mechanical structure design of the test bench. Finally, comparative experiments were conducted to contrast the measured values of operational precision and preload drag force with manual measurements as well as to compare the actual lifespan with theoretical lifespan. The comparison results indicate that the test bench exhibits a high level of accuracy in measuring the operational precision, preload drag force, and fatigue life of the guide pairs, hence confirming the validity of the deduced formulas for operational precision. The development of this test bench effectively addresses the challenges of efficiently conducting multi-parameter detection of the comprehensive performance and fatigue life of guide pairs on a single test bench. This study provides a targeted solution for measuring the comprehensive performance and verifying the fatigue life of guide pairs.
Author Contributions
Conceptualization, Y.Z. and P.W.; methodology, Y.Z.; software, Y.Z.; validation, Y.Z., M.X. and Z.H.; formal analysis, Y.Z.; investigation, G.W.; resources, J.H.; data curation, Y.Z.; writing—original draft preparation, Y.Z.; writing—review and editing, Y.Z.; visualization, Y.Z.; supervision, P.W.; project administration, B.L.; funding acquisition, G.W. All authors have read and agreed to the published version of the manuscript.
Funding
This research was funded by Zhejiang Jianbing & Lingyan Key Technologies R&D Program, grant number 2024C01245(SD2).
Data Availability Statement
The data presented in this study are available on request from the corresponding author.
Conflicts of Interest
The authors declare no conflicts of interest.
References
- Sparham, M.; Sarhan, A.; Mardi, N.; Dahari, M.; Hamdi, M. Cutting force analysis to estimate the friction force in linear guideways of CNC machine. Measurement 2016, 85, 65–79. [Google Scholar] [CrossRef]
- Feng, G.; Wang, C. Examining the misalignment of a linear guideway pair on a feed drive system under different ball screw preload levels with a cost-effective MEMS vibration sensing system. Precis. Eng. 2017, 50, 467–481. [Google Scholar] [CrossRef]
- Huang, Z. The development trend of rolling functional components in the new era. Modern Manufacturing 2005, 04, 42–46. [Google Scholar]
- Lv, W. The Development and Prospect of by-products of Rolling Linear Guides. Metal Working (Metal Cutting) 2017, 06, 10–14. [Google Scholar]
- Yu, H.; Ran, Y.; Zhang, G.; Ying, G. A dynamic time-varying reliability model for linear guides considering wear degradation. Nonlinear Dynam. 2021, 103, 699–714. [Google Scholar] [CrossRef]
- Xu, D.; Liang, Y.; Feng, H. Design of Test and Control System for Comprehensive Performance Test bed of Rolling Linear Guide. Machine Building & Automation 2016, 45, 202–205. [Google Scholar]
- Wang, X.; Liang, Y.; Pei, J.; Wang, K.; Feng, H. Design of Test Bech for Motion Accuracy of Rolling Linear Guide Pair. Modular Machine Tool & Automatic Manufacturing Technique 2021, 08, 62–65. [Google Scholar]
- Xu, H. Research on the Design and Test Method of the Life Test Bench for Rolling Linear Guide Pairs. Master’s Thesis, Nanjing University of Science and Technology, Nanjing, China, 2014. [Google Scholar]
- Li, C.; Feng, H.; Zhao, J. The Design of Dynamic Friction Measure System of Rolling Linear Guides. Manufacturing Technology & Machine Tool 2009, 9, 25–28. [Google Scholar]
- Li, D.; Yang, X.; Zhang, Y.; et al. Development and Experimental Research on Resistance Force Measurement Equipment for Space Rolling Linear Guide. Journal of Nanjing University of Aeronautics and Astronautics, 2022, 54, 34–40. [Google Scholar]
- Zhou, Y. Comprehensive Performance Evaluation Method and Experimental Research of Rolling Linear Guide Pairs. Master’s Thesis, Nanjing University of Science and Technology, Nanjing, China, 2018. [Google Scholar]
- Qiu, Y.; Yan, R.; Lei, J.; et al. Ultimate Bearing Capacity and Fatigue Life Analysis of Marine Sandwich Composite Bolted Connection Structure, Fatigue Test and Numerical Simulation. Mar. Struct., 2025, 101, 103770. [Google Scholar] [CrossRef]
- Shi, C.; Wang, Z.; Peng, Y. Influence of Relative Difference Between Paired Guide Rails on Motion Accuracy in Closed Hydrostatic Guideways. J. Mech. Sci. Technol. 2020, 34, 631–648. [Google Scholar] [CrossRef]
- Zhou, C.; Wang, X.; Feng, H.; et al. Research on An Explicit Preload Calculation Method of Linear Rolling Guide THK-SHS35V. Chin. J. Mech. Eng-En. 2023, 59, 208–217. [Google Scholar]
- Pan,K. ; Liang, Y. et al. Life Evaluation of Rolling Linear Guide Based on Fatigue Accelerated Life Test. Modular Machine Tool & Automatic Manufacturing Technique. 2021, 05, 38–42. [Google Scholar]
- Palit, P.; Sri, P.; Gokarn, P.; et al. Rolling Contact Fatigue Failure Analysis of Ball Bearing in Gear Box. J. Fail. Anal. Prev. 2025, 25, 62–69. [Google Scholar] [CrossRef]
- Cheng, H.; Li, X.; Ma, G.; et al. Fatigue Life and Fatigue Reliability Mechanism of Ball Bearings. Journal of Mechanics 2024, 40, 79–94. [Google Scholar] [CrossRef]
- Zhang, X.; Wei, Y.; Kong, W.; et al. Failure Analyzes of High-strength Bolted Connection with Over-preload Tightening Torque under Double Shear Test. Structures 2025, 72, 108249. [Google Scholar] [CrossRef]
- Xie, K.; Cheng, L. A Novel Two-dimensional Hilbert Transform Method for Structural Vibration Measurement and Modal Analysis. Mech. Syst. Signal. Pr. 2025, 225, 112324. [Google Scholar] [CrossRef]
- Üngör, M.; Sen, O.; Yavuz, A.; et al. Feasibility Assessment of Novel Multi-Mode Camshaft Design Through Modal Analysis. Machines 2025, 13, 407. [Google Scholar] [CrossRef]
- Uttachee, C.; Punyakaew, S.; Mai, N.; et al. Dynamic Analysis and Resonance Control of a Tunable Pendulum Energy Harvester Using Cone-Based Continuously Variable Transmission. Machines 2025, 13, 365. [Google Scholar] [CrossRef]
- Li, Y.; Zhang, G.; Wang, J. Modeling and Experimental Verification of Static and Dynamic Characteristics of The Linear Rolling Guideway. P. I. Mech. Eng. C-J. Mec. 2024, 238, 8012–8036. [Google Scholar] [CrossRef]
- Zhu, Q.; Zhang, J.; Xie, F. Design and Experiment Research of RV Reducer Main Bearing Test Benches. China Mechanical Engineering 2025, 1–7. [Google Scholar]
- Wang, Z.; Zhou, Y.; Liu, J.; et al. Fatigue Life Investigation of Rubber Bearing for Heavy Trucks: Optimal Design by Using Finite Element Method with Experimental Verification. Int. J. Fatigue. 2024, 180, 108080. [Google Scholar] [CrossRef]
Disclaimer/Publisher’s Note: The statements, opinions and data contained in all publications are solely those of the individual author(s) and contributor(s) and not of MDPI and/or the editor(s). MDPI and/or the editor(s) disclaim responsibility for any injury to people or property resulting from any ideas, methods, instructions or products referred to in the content. |
© 2025 by the authors. Licensee MDPI, Basel, Switzerland. This article is an open access article distributed under the terms and conditions of the Creative Commons Attribution (CC BY) license (https://creativecommons.org/licenses/by/4.0/).
Copyright: This open access article is published under a Creative Commons CC BY 4.0 license, which permit the free download, distribution, and reuse, provided that the author and preprint are cited in any reuse.


