
Submitted:
05 July 2025
Posted:
21 July 2025
You are already at the latest version
Abstract
Enhancing the efficacy of security systems without compromising performance remains one of the most challenging areas in cybersecurity research. Several approaches have shown promise in detecting anomalies in network data, among which fuzzy set-based methods are particularly notable. The Internet of Things (IoT) comprises a vast network of interconnected digital devices that continuously generate massive volumes of data and perform real-time computations. Due to their constant exposure to the Internet, these de-vices are highly vulnerable to threats from hackers and intruders. Such malicious activi-ties are categorized as anomalies, and detecting them within the IoT environment presents a compelling research challenge. Picture fuzzy sets (PFSs), which extend intuitionistic fuzzy sets (IFSs) by incorporating a neutrality parameter alongside membership and non-membership values, provide a robust framework for modelling the imprecision, vagueness, and uncertainty inherent in IoT datasets. In this article, we propose a Picture Fuzzy c-Means (PFCM) clustering-based method for detecting anomalies in IoT data. This algorithm represents an advanced variant of the classical Fuzzy c-Means (FCM) clustering technique. Given the complex and nuanced nature of uncertainty in IoT data, the pro-posed PFCM approach offers a more effective means of identifying anomalous records. Additionally, the computational complexity of the proposed method is analysed. Experimental evaluations using real-world datasets, along with comparative analyses against FCM and Intuitionistic Fuzzy c-Means (IFCM) algorithms, demonstrate the superior performance of the proposed approach
Keywords:
IoT system
; IoT anomalies
; detection of anomalies
; Canberra distance
; Picture fuzzy sets (PFS)
; Membership degree
; Non-membership degree
; Degree of neutrality
; Picture Fuzzy c-means (PFCM) clustering algorithm
1. Introduction
Anomaly detection within the Internet of Things (IoT) ecosystem has become an increasingly critical component of cybersecurity, primarily due to the rising frequency of unauthorized access and cyberattacks [1]. With the widespread adoption of IoT devices, there has been an exponential surge in data generation, making these devices attractive targets for malicious actors. As a result, ensuring information security—particularly through effective anomaly detection—has gained significant importance. Identifying anomalies in IoT data has numerous practical applications, such as fault diagnosis, fraud prevention, predictive maintenance, and system monitoring. In scenarios where consistent and dependable responses are unavailable, anomaly detection can provide valuable insights. To tackle these challenges, this work introduces reliable approaches for detecting anomalies in IoT environments.
The Internet of Things (IoT) refers to a network of interconnected devices embedded with computing and communication capabilities, enabling them to perform a variety of tasks autonomously [2]. The primary objective of IoT is to enrich and personalize user experiences by facilitating seamless interaction with physical objects. IoT has driven major technological advancements across diverse domains such as agriculture, smart cities, healthcare, transportation, retail, and logistics. Often regarded as a global infrastructure, IoT bridges the cyber and physical worlds by building on existing systems and early-generation IoT technologies [2].
Today, IoT devices have become deeply integrated into everyday life. In agriculture, they support applications such as precision farming, livestock monitoring, and smart irrigation systems [3]. In healthcare, IoT enables solutions like remote patient monitoring, heart rate and mood tracking, ingestible sensors, and robotic surgery [4]. In education, it supports innovations such as distance learning, smart classrooms, attendance automation, augmented reality, and adaptive learning platforms [5]. Additionally, IoT is widely applied in areas including smart cities, home automation, transportation, supply chain management, and manufacturing [6].
Given their constant connectivity to the Internet and to each other, IoT devices are particularly vulnerable to malicious actors. Therefore, implementing robust security mechanisms is essential to prevent and detect intrusions within these interconnected environments.
Several approaches have been proposed to address the aforementioned problem, among which clustering-based anomaly detection of IoT data [7,8] is a prominent method. Clustering is widely recognized as an effective technique for uncovering patterns and understanding data distribution within datasets [9,10], and it has been extensively applied in the context of anomaly detection. For instance, the authors in [8] introduced a fuzzy c-means clustering approach for detecting anomalies in mixed-type data. In [11], an agglomerative hierarchical clustering algorithm was developed for anomaly detection in network traffic which uses Canberra metric measure [12,13,14,15] as distance for fomula for clustering. A hybrid model combining both partitioning and hierarchical techniques was proposed in [16] to handle anomalies in mixed datasets. Additionally, the authors in [17] presented a hybrid method that integrates rough set theory with a density-based clustering technique for detecting anomalies in high-dimensional IoT data. A two-phase approach that incorporates both partitioning and hierarchical clustering, while also considering the temporal characteristics of real-time data, was introduced in [18].
Further related works can be found in [19,20,21,22,23,24,25,26,27,28,29,30,31,32], highlighting the ongoing interest and development in this area. Notably, [33] explores insider threats, which pose significant cybersecurity challenges for industrial control systems. An online anomaly detection method using random forests was presented in [34], offering a real-time solution. Finally, [35] provides a comprehensive review of various anomaly detection techniques applicable to IoT systems.
Many of the existing algorithms proposed in the literature exhibit certain limitations, particularly in effectively detecting anomalies within IoT data. However, incorporating fuzziness into clustering techniques can help overcome several of these challenges for the following key reasons. First, fuzzy clustering enables data points to belong to multiple clusters simultaneously, which is advantageous when dealing with complex data structures, ambiguity, or overlapping class boundaries. Second, it demonstrates greater resilience to noise and anomalies, as the transition between clusters occurs gradually rather than abruptly. Third, fuzzy clustering provides a more detailed representation of the association between data points and clusters, offering a richer and more nuanced understanding of the data’s inherent structure.
In [36], the authors introduced a novel algorithm that incorporates Mahalanobis distance to enhance the accuracy of intrusion detection. In [37], a fuzzy c-means clustering method was proposed for network intrusion detection, utilizing principal component analysis to select the most discriminative features. Related research efforts can also be found in [38,39,40,41,42].
Zadeh [43] introduced the concept of fuzziness into mathematics by defining fuzzy sets (FS) based on membership degrees. This foundational idea led to the development of the mathematics of fuzziness, which has since been applied across nearly all domains of human knowledge. In response to real-world challenges, numerous extensions, generalizations, and variations of fuzzy sets have been proposed. One such extension is the intuitionistic fuzzy set (IFS), introduced by Atanassov [44], which incorporates both membership and non-membership degrees. Building on this, Cuong [45] proposed the picture fuzzy set (PFS), which further includes a degree of neutrality alongside membership and non-membership degrees.
Fuzzy sets and their extensions have been effectively employed in various applications, particularly in clustering and anomaly detection [8,9,36,37,38,40,41,42,46,47,48,49,50]. For example, an IFS-based hierarchical clustering algorithm was proposed in [51], leveraging traditional hierarchical clustering and intuitionistic fuzzy aggregation operators to cluster IFSs. In [52], the authors introduced the intuitionistic fuzzy c-means (IFCM) algorithm, which extends the well-known fuzzy c-means method by incorporating distance measures specific to IFSs [53,54]. Additionally, a hybrid method combining rough set theory and IFSs was proposed in [55] to detect anomalies in network data. This approach used the α-relation, based on the correlation coefficient of IFSs, to generate intuitionistic fuzzy rules.
As the demand for intelligent and autonomous systems grows—particularly within the Internet of Things (IoT) domain, which continuously generates massive amounts of data marked by high volume, velocity, variety, variability, veracity, value, time-sensitivity, location-awareness, and a highly unstructured, semi-structured, and heterogeneous nature—applying clustering algorithms like FCM and IFCM becomes increasingly challenging [42]. The clustering performance of FCM is often limited due to its reliance on classical fuzzy sets, which struggle with accurately modeling membership, hesitancy, and the vagueness of prototype parameters. Although IFCM addresses some of these issues and improves clustering quality to a certain extent, its effectiveness remains limited.
Motivated by these challenges, this paper aims to develop a novel fuzzy clustering approach for IoT anomaly detection using picture fuzzy sets (PFSs), with the goal of achieving higher clustering quality compared to both FCM and IFCM-based approaches.
The objectives of this paper are outlined as follows:
- Second, leveraging this distance measure, a novel fuzzy clustering method—termed the Picture Fuzzy C-Means (PFCM) algorithm [50]—is proposed to generate soft clusters from IoT data.
- Third, a comparative analysis is performed against existing clustering techniques, specifically FCM and IFCM, to evaluate the effectiveness of the proposed approach.
Additionally, the time complexity of the proposed approach is computed. The proposed algorithm is also implemented and tested using MATLAB, with experiments conducted on the NSL-KDD [56] and Skoltech Anomaly Benchmark (SAB) [57] datasets. The results demonstrate that the proposed PFCM-based method significantly outperforms both FCM and IFCM.
The structure of the paper is organized as follows: Section 2 presents the preliminaries. Section 3 details the proposed methodology. Section 4 provides the computational complexity analysis. Section 5 discusses the experimental results, and Section 6 concludes the paper with key findings, limitations, and directions for future research.
2. Preliminaries
In below, we present some important terms and definitions used in the paper.
Definition 2.1 [12,13,14,15].
Let
and
be two vectors, then the Canberra distance between X and Y is given by
Definition 2.2 [43]. Fuzzy set
where , the membership function, gives the grade of membership of each element in A.
Definition 2.3 [44]. Intuitionistic fuzzy set
where and are the membership function and non-membership function of the fuzzy set A respectively satisfying the condition 0 ≤ + ≤ 1 for every . Obviously, + is the degree of hesitation of .
Definition 2.4. Distance measure on IFSs
Let IFS(X) be the collection of all IFSs on X= {x1, x2,… xn}. A distance measure is a real-valued function
defined by
Definition 2.5 [45]. Picture fuzzy set
A PFS [45] A over X= {x1, x2,… xn} is defined as
with is the degree of positive membership, and is the degree of neutral membership and is the degree of negative membership satisfying the condition for every . Also, , is the degree of refusal membership of .
Definition 2.6. Distance measure on PFSs
Let PFS(X) be the collection of all PFSs on X (discrete or continuous), then we define a metric measure onPFS(X) as follows:
i) For discrete case

ii) For continuous case (
)
Obviously, in both the cases,
Definition 2.7.
Each IoT data instance consists of n measured variables grouped into an n-dimensional vector xi = [xi1, xi2,…xin], xi∈Rn. A set of N data instance is given by X= {Xi; i=1, 2,…N} and is expressed as N×n matrix as follows
3. Proposed Algorithm
In this section, a picture fuzzy c-means clustering algorithm [50] for the detection of IoT anomaly detection is presented. Suppose that there is an IoT dataset X consisting of N data instances of dimension n. Our aim is to device X into c clusters each of which is PFS, satisfying the following objective function
subject to the constraints
for i = 1, …N and j = 1, …c..
Using Lagrangian method the solution of the optimization problem (10) subject to (11-13) is obtained as follows:
With the help of the equations (14-17), the steps of picture fuzzy c-means (PFCM) clustering algorithm [50] for the detection of IoT anomaly is described as follows:
Picture Fuzzy c-Means (IFCM) Clustering Algorithm.
Given dataset X as expressed using (9).
Initialize: c (number of clusters), m > 1 (weighting exponent), and ε > 0 terminating threshold.
Randomly initialize: .
for each iteration k =1, 2,…..
step1 compute cluster mean =1, 2,..c using equation (17).
step2 compute
, i=1,..N, j=1,…c.
Step3 Update
using the equations (14-16) subject to the conditions (11-13).
step4Update
using equation (17)
step5 if||V(k)-V(k+1)|| < ε, then go to step6
else let k:=k+1, go to step1.
step6 End.
Here, each cluster in the final output cluster set is an PFS consisting of IoT data instances along with a positive membership degree, a neutral membership degree, and a negative membership degree. A data instance either does not belong to any of the clusters or belongs to all the clusters with low positive membership value, high neutral membership value and high non-membership value can be considered as anomaly. The flowchart of the PFCM clustering algorithm is given below in Figure 1.
4. Complexity Analysis
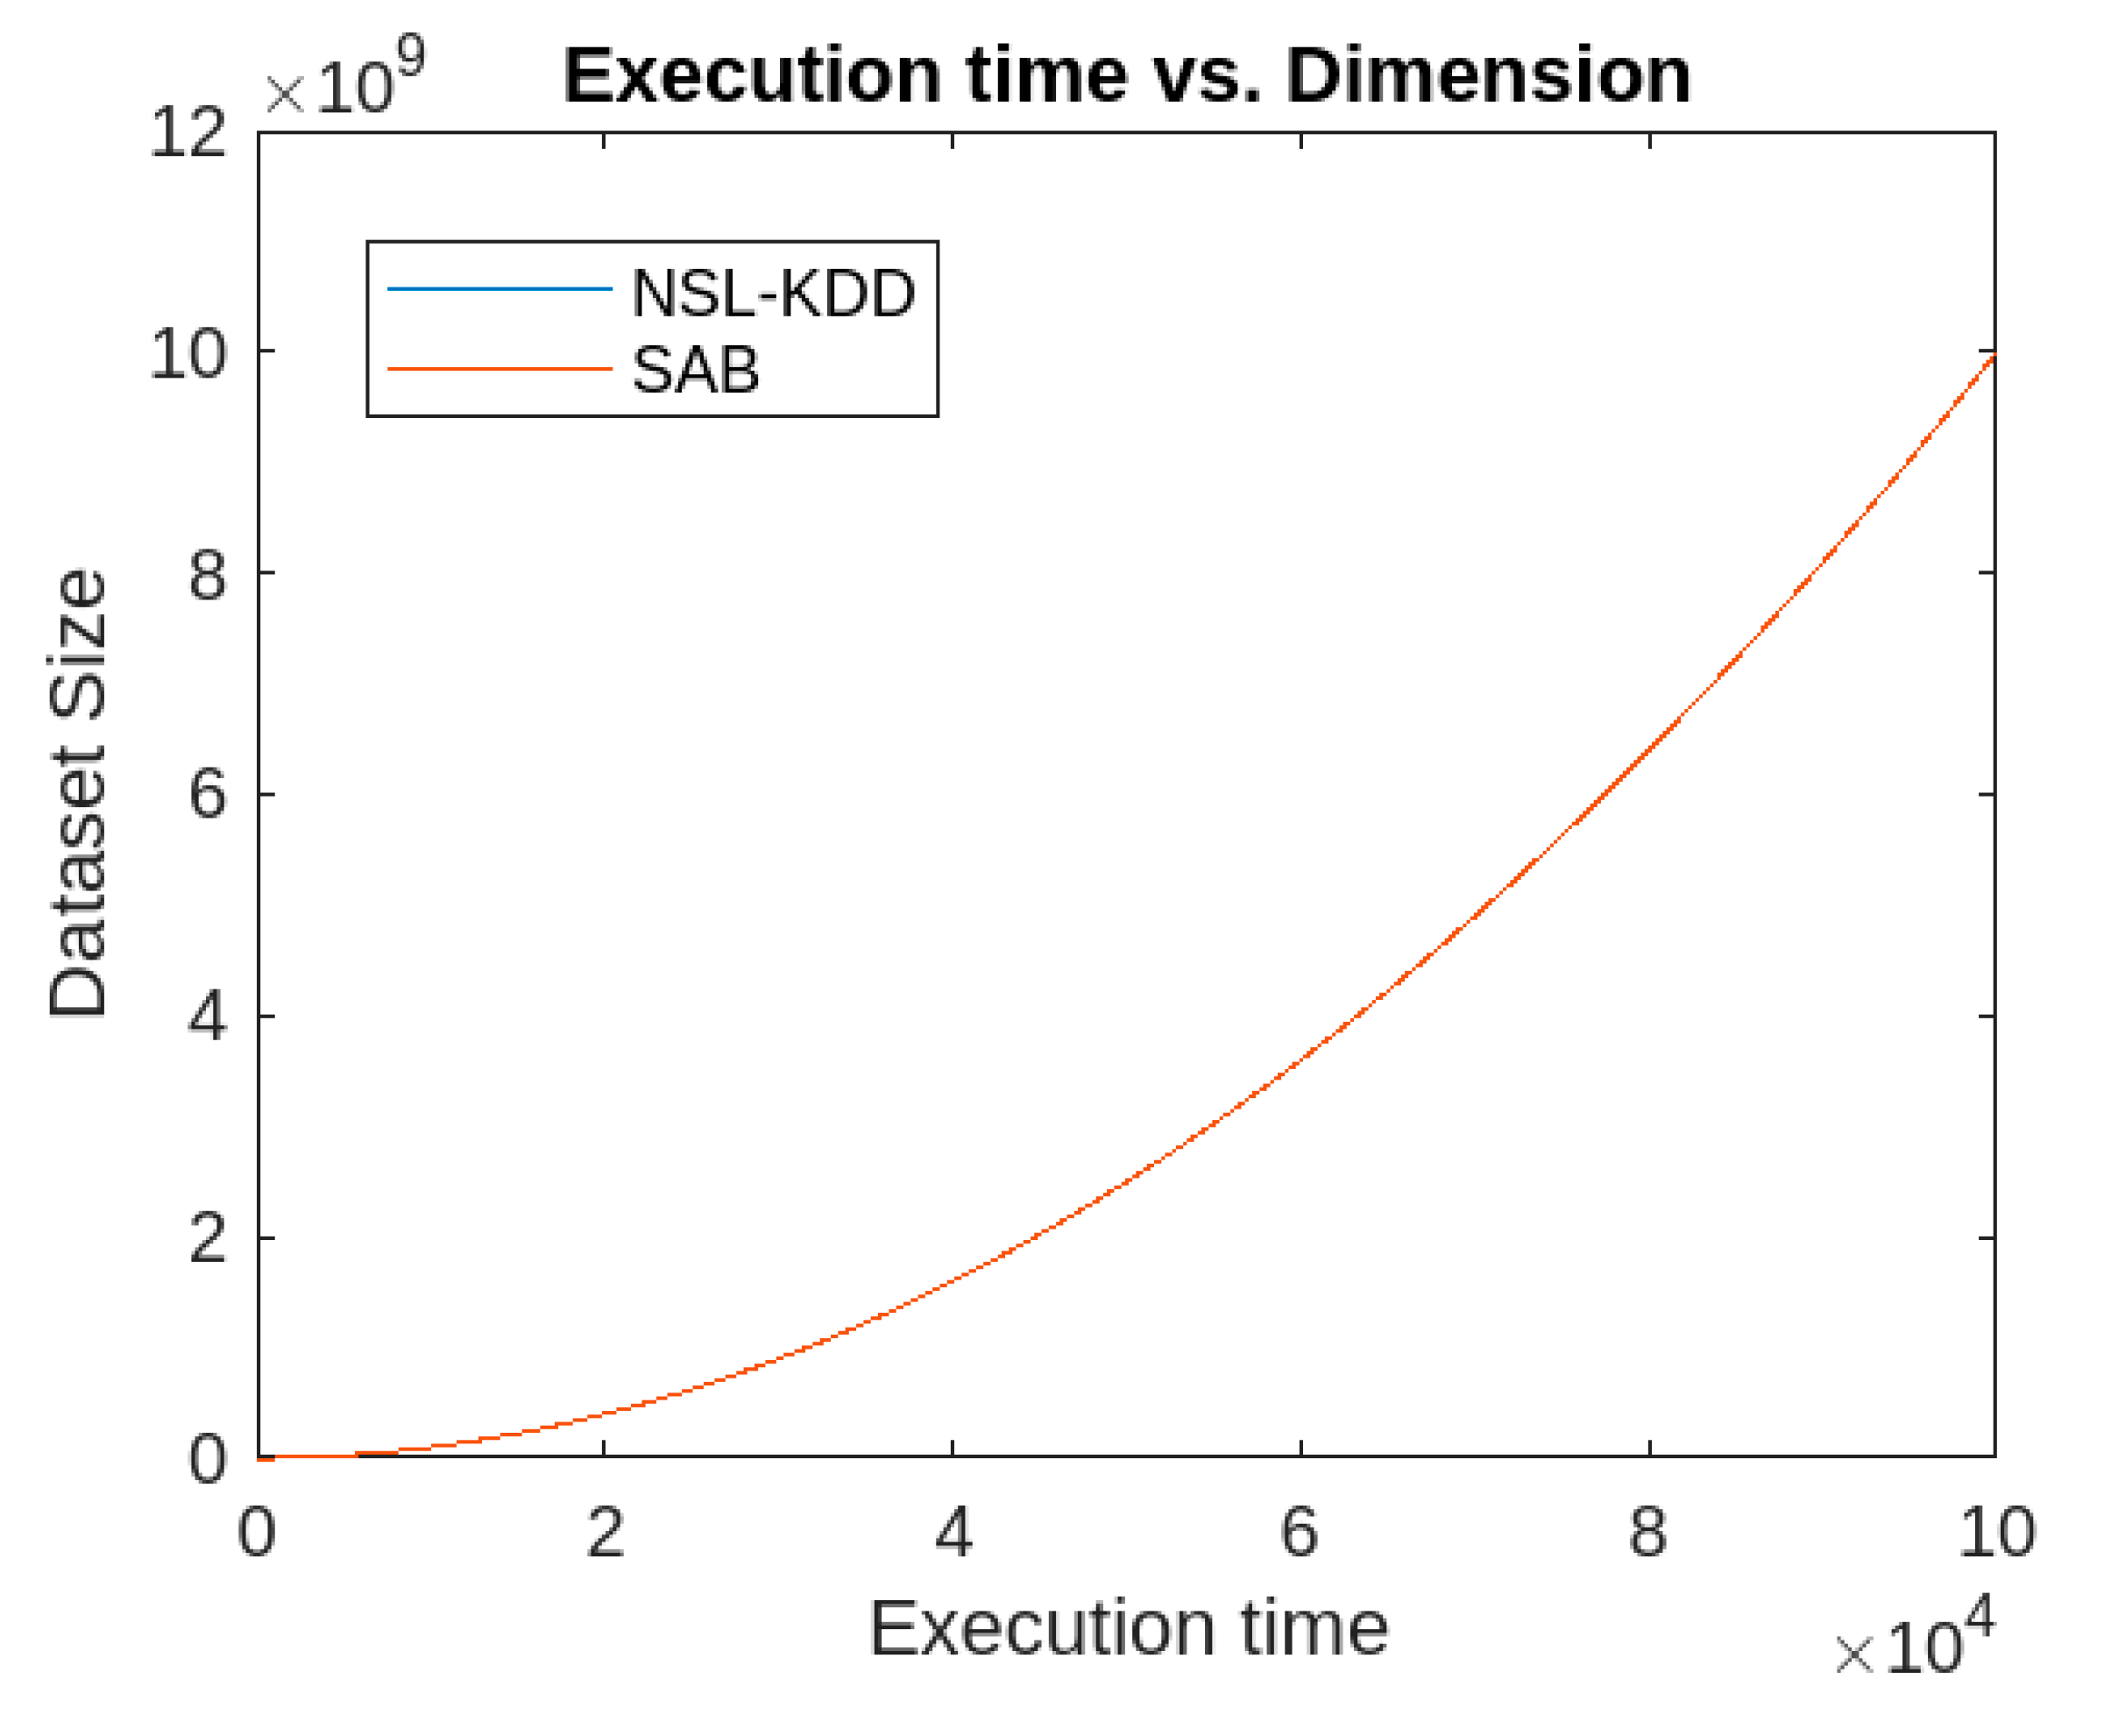
The proposed PFCM clustering-based approach computes the positive, neutral, and negative membership values in O(1, )O(1), and O(1) time. The initialization step takes O(c⋅N⋅n), where c is the number of clusters, N is the number of data instances, and n is the dimension of the IoT dataset. The distance computation also takes constant time. As a result, in each iteration, updating the membership values and cluster centroids requires O(c⋅N⋅n + c⋅N⋅n + c⋅N⋅n + c⋅N⋅n), while the convergence check requires O(c). Therefore, the total time complexity per iteration is O(c⋅N⋅n + c⋅N⋅n + c⋅N⋅n + c⋅N⋅n + c⋅N⋅n + c) = O(c⋅N⋅n). If t represents the number of iterations, the overall computational complexity of PFCM is O(t⋅c⋅N⋅n). Assuming c is small and negligible, t=O(N), and n ≤ N, the worst-case time complexity of the PFCM algorithm is O(N2⋅n). This shows that the proposed algorithm operates in quadratic time with respect to the dataset size and linear time with respect to the dataset's dimension.
5. Experimental Analysis, Results and Discussions
5.1. Experimental Analysis and Results
For finding the efficacy of the two proposed approach, the following two well-recognized datasets are employed.
NSL-KDD dataset [56]: This is a refined version of synthetic dataset KDDCup’99 [58] constructed by removing the duplicates and redundant instances and extensively used for benchmarking and evaluating intrusion detection systems. The dataset is divided into normal and attack traffic. The attack traffic is further categorized into several types, such as:
- DoS (Denial of Service)
- Probe (Scans or reconnaissance)
- R2L (Remote to Local)
- U2R (User to Root
It has around 1,47,000 data instances (normal or anomalous) with 41 features.
Skoltech Anomaly Benchmark (SAB) [57]: The dataset was developed by the Skolkovo Institute of Science and Technology (Skoltech) to support research in anomaly detection, specifically within the areas of network security and system monitoring. SAB offers well-defined evaluation metrics to assess anomaly detection models, which usually consist of the following:
- Precision: The proportion of correctly identified anomalies.
- Recall: The proportion of actual anomalies that are successfully detected.
- F1-Score: A measure that balances precision and recall.
The proposed algorithm, along with the classical k-means, FCM, and IFCM clustering methods, were implemented in MATLAB using the mentioned datasets on a standard computing machine. A partial graphical representation of the results is shown in Figure 2, Figure 3, Figure 4, Figure 5, Figure 6 and Figure 7.
Figure 2 illustrates the anomaly detection and accuracy of the k-means, FCM, IFCM, and PCM clustering algorithms, evaluated using the NSL-KDD [56] and SAB [57] datasets. The results are presented through bar diagrams, facilitating a comparative performance analysis of the algorithms based on their accuracy.
Figure 3 presents the false alarm rates of the aforementioned algorithms, evaluated using the NSL-KDD [56] and SAB [57] datasets. This enables a straightforward comparative analysis of the algorithms' performance in terms of false alarm rates.
Figure 4 presents the Denial of Service (DoS) rates and Remote-to-Local (R2L) rates for the aforementioned algorithms, evaluated using the NSL-KDD [56] and SAB [57] datasets. This allows for an easy comparative performance analysis of the algorithms in terms of DoS rates.
Figure 5 shows the User-to-Root (U2R) and Probe percentages for the aforementioned algorithms, evaluated using the NSL-KDD [56] and SAB [57] datasets. This facilitates a straightforward comparative analysis of the algorithms based on these parameters.
Figure 6 presents the precision and recall values for the aforementioned algorithms, evaluated using the NSL-KDD [56] and SAB [57] datasets. This enables a clear comparative performance analysis of the algorithms based on these parameters.
5.2. Discussions
Based on the results obtained from the proposed algorithm, the following conclusions can be drawn: For both the NSL-KDD [56] and SAB [57] datasets, the detection rate of the proposed algorithm significantly surpasses that of k-means, FCM, and IFCM. Additionally, the detection rate remains almost identical for both datasets, indicating that the proposed algorithm is the most efficient in terms of detection rate.
Similarly, the accuracy rate of the proposed algorithm is considerably higher for both datasets compared to k-means, FCM, and IFCM. Moreover, the false alarm rate of the proposed algorithm is much lower than that of the other algorithms for both datasets. Regarding the attack parameters (Denial of Service, Remote-to-Local, User-to-Root, and Probe), the proposed algorithm consistently outperforms the others. In terms of other performance metrics, the proposed method also surpasses k-means, FCM, and IFCM clustering algorithms. However, in terms of execution time, the proposed algorithm performs comparably to the FCM and IFCM algorithms.
6. Conclusions, Limitations and Lines for Future Works
6.1. Conclusions
This article proposes a picture fuzzy clustering-based approach for anomaly detection in the IoT domain. The proposed algorithm, the Picture Fuzzy C-Means (PFCM) clustering algorithm, utilizes a distance measure based on the Canberra metric to form clusters. It generates a predefined number of clusters, where each IoT data instance is associated with a positive, neutral, and negative membership value, all lying between 0 and 1, with their sum also between 0 and 1. An IoT data instance that either does not belong to any cluster, belongs to all clusters with minimal positive membership values, or belongs to all clusters with maximum neutral and negative membership values, is considered an anomaly.
The efficacy of the proposed algorithm is demonstrated through experimental studies using the NSL-KDD [56] and SAB [57] datasets, along with a comparative analysis against traditional k-means, FCM, and IFCM algorithms. The results clearly show that the proposed approach outperforms the other methods across all evaluated parameters.
The runtime complexity of the proposed algorithm is dependent on the size and dimensions of the datasets. It operates in quadratic time with respect to the dataset size and linear time with respect to the dataset's dimensions. Since the dataset’s dimension is typically much smaller than its size, the overall time complexity of the algorithm is considered quadratic. Therefore, the proposed clustering-based approach is efficient for IoT anomaly detection.
6.2. Limitations and Lines for Future Works
Although the proposed algorithm demonstrates significant efficiency compared to other methods, it still has some limitations. First, like many partitioning-based clustering algorithms, the proposed approach is sensitive to the initial selection of cluster centroids. Second, it struggles with the curse of high dimensionality, which reduces its efficiency when handling high-dimensional data. Lastly, the algorithm may not always converge to the optimal solution, as it can get trapped in local minima.
Future work can focus on the following areas:
- Developing algorithms to address high dimensionality in IoT systems.
- Exploring alternative approaches beyond unsupervised methods for IoT anomaly detection.
- Investigating techniques like bipolar fuzzy or complex fuzzy clustering for IoT anomaly detection.
Author Contributions
Conceptualization, F.N.L., V.A.S, F.A.M., M.S., M.A., and V.P; methodology, F.N.L., V.A.S, F.A.M., M.S., M.A., and V.P.; software, F.N.L., F.A.M., M.A., and V.P; validation, F.N.L., V.A.S, F.A.M., M.S., M.A., and V.P; formal analysis, V.A.S, F.A.M., M.S., M.A.; investigation, F.N.L., V.A.S, F.A.M.; resources, F.N.L., V.A.S, F.A.M., M.S., M.A., and V.P.; data curation, F.N.L., V.A.S, F.A.M., M.S., M.A., and V.P; writing—original draft preparation, F.N.L., V.A.S, F.A.M.; writing—review and editing, M.S., M.A., and V.P; visualization, M.S., M.A., and V.P; supervision, F.A.M.; project administration, F.A.M., M.S., M.A.; funding acquisition, M.S., M.A All authors have read and agreed to the published version of the manuscript.
Funding
This research received no external funding.
Abbreviations
The following abbreviations are used in this manuscript:
| IoT | Internet of Things |
| IFS | Intuitionistic fuzzy set |
| PFS | Picture fuzzy set |
| FCM | Fuzzy c-Means |
| IFCM | Intuitionistic Fuzzy c-Means |
| PFCM | Picture Fuzzy c-Means |
| SAB | Skoltech Anomaly Benchmark |
| DoS | Denial of Service |
| R2L | Remote-to-Local |
| U2R | User-to-Root |
References
- Alsaedi, A., Moustafa, N., Tari, Z., Mahmood, A., & Anwar, A., TON_IoT Telemetry Dataset: A New Generation Dataset of IoT and IIoT for Data-Driven Intru-sion Detection Systems. IEEE Access, 8, 2020, 165130–165150. [CrossRef]
- Sethi, P., & Sarangi, S., Internet of things: Architectures, protocols, and applications. Journal of Electrical and Computer Engineering, 1–25. 2017, . [CrossRef]
- Kopawar, N. A., and Wankhede, K. G., Internet of Things in Agriculture: A Review, International Journal of Scientific Research in Science, Engineering and Technology, Vol. 11 (2), 2024, pp. 161-165, doi : . [CrossRef]
- Atadoga , A., Omaghomi , T. T., Elufioye , O. A., Odilibe, I. P., Daraojimba, A. I., Owolabi , O. R., Internet of Things (IoT) in healthcare: A systematic review of use cases and benefits, International Journal of Science and Research Archive, 2024, 11(01), pp. 1511–1517, . [CrossRef]
- Dake, D. K., Bada, G. K., & Dadzie, A. E. (2023). Internet of things (IoT) applications in education: benefits and implementation challenges in Ghanaian tertiary institutions. Journal of Information Technology Education: Research, 22, 311-338. [CrossRef]
- Masmali, F. H., Miah, S. J., and Noman, N, Different Applications and Technologies of Internet of Things (IoT), Proceedings of Seventh International Congress on Information and Communication Technology, Lecture Notes in Networks and Systems 464, 2021 . [CrossRef]
- Teh, H. Y., Wang, K. I., and Kempa-Liehr, A. W. Expect the unexpected: Un-supervised feature selection for automated sensor anomaly detection, IEEE Sensors Journal, pp. 18033 – 18046, 2021. [CrossRef]
- Ren, W., Cao, J., and Wu, X. Application of network intrusion detection based on fuzzy c-means clustering algorithm, The 3rd International Symposium on Intelligent Information Technology Application, pp.19-22, 2009.
- Mazarbhuiya, F. A. and Abulaish, M, Clustering Periodic Patterns using Fuzzy Statistical Parameters, International Journal of Innovative Computing Information and Control (IJICIC), Vol. 8, No. 3(b), 2012, pp. 2113-2124.
- Shenify, M. and Mazarbhuiya, F. A., Documents Clustering using Subspace Clustering Algorithm, ICIC Express Letters, Vol. 17(12), December 2023, pp. 1405-1415. [CrossRef]
- Mazarbhuiya, F. A. AlZahrani, M. Y., and Georgieva, L. Anomaly detection using agglomerative hierarchical clustering algorithm, Lecture Notes in Electrical Engineering, Singapore, Springer, 2018, . [CrossRef]
- Lance, G. N., and Williams, W. T., Computer programs for hierarchical polythetic classification similarity analysis. Computer Journal. 9 (1), 1966, pp. 60–64.
- Lance, G. N., and Williams, W. T., Mixed-data classificatory programs I. Agglomerative Systems. Australian Computer Journal, 1967, pp. 15–20.
- Clifford, T. H. and Stephenson, W., An Introduction to Numerical Classification, Academic Press. New York- San Fransisco – London, 1975.
- Emran, S. M., and Ye, N., Robustness of Canberra Metric in Computer Intrusion Detection, Proceedings of 2001 IEEE Workshop on Information Assurance and Security, US Military Academy, NY, June 2001, pp. 80-84.
- Mazarbhuiya, F. A. AlZahrani, M. Y., and A. K. Mahanta, Detecting Anomaly Using Partitioning Clustering with Merging; ICIC Express Letters Vol. 14(10), Japan, pp. 951-960, 2020.
- Mazarbhuiya, F. A., Detecting IoT Anomaly Using Rough Set and Density Based Subspace Clustering, ICIC Express Letters, Vol. 17(12), December 2023, pp. 1395-1403. [CrossRef]
- Mazarbhuiya, F. A.; Shenify, M.; A Mixed Clustering Approach for Real-Time Anomaly Detection, Appl. Sci. 2023, 13, 4151, . [CrossRef]
- Mazarbhuiya, F. A. and Shenify, M; Real-time Anomaly Detection with Subspace Periodic Clustering Approach, Applied Science, MDPI, Vol. 13(13), 2023, Switzerland, pp. 1-21.
- Alguliyev, R.; Aliguliyev, R.; Sukhostat, L. Anomaly Detection in Big Data based on Clustering. Stat. Optim. Inf. Comput. 2017, 5, 325–340.
- Hahsler, M.; Piekenbrock, M.; Doran, D. dbscan: Fast Density-based clustering with R. J. Stat. Softw. 2019, 91, 1–30.
- Song, H.; Jiang, Z.; Men, A.; Yang, B. A Hybrid Semi-Supervised Anomaly Detection Model for High Dimensional data. Comput. Intell. Neurosci. 2017, 2017, 1–9.
- Alghawli, A.S. Complex methods detect anomalies in real time based on time series analysis. Alex. Eng. J. 2022, 61, 549–561.
- Younas, M.Z. Anomaly Detection using Data Mining Techniques: A Review. Int. J. Res. Appl. Sci. Eng. Technol. 2020, 8, 568–574.
- Thudumu, S.; Branch, P.; Jin, J.; Singh, J. A comprehensive survey of anomaly detection techniques for high dimensional big data. J. Big Data 2020, 7, 42. [CrossRef]
- Habeeb, R.A.A.; Nasauddin, F.; Gani, A.; Hashem, I.A.T.; Ahmed, E.; Imran, M. Real-time big data processing for anomaly detection: A Survey. Int. J. Inf. Manag. 2019, 45, 289–307.
- Wang, B.; Hua, Q.; Zhang, H.; Tan, X.; Nan, Y.; Chen, R.; Shu, X. Research on anomaly detection and real-time reliability evaluation with the log of cloud platform. Alex. Eng. J. 2022, 61, 7183–7193.
- Halstead, B.; Koh, Y.S.; Riddle, P.; Pechenizkiy, M.; Bifet, A. Combining Diverse Meta-Features to Accurately Identify Recurring Concept Drit in Data Streams. ACM Trans. Knowl. Discov. Data 2023. [CrossRef]
- Zhao, Z.; Birke, R.; Han, R.; Robu, B.; Bouchenak, S.; Ben Mokhtar, S.; Chen, L.Y. RAD: On-line Anomaly Detection for Highly Unreliable Data. arXiv 2019, arXiv:1911.04383. https://arxiv.org/abs/1911.04383.
- Chenaghlou, M.; Moshtaghi, M.; Lekhie, C.; Salahi, M. Online Clustering for Evolving Data Streams with Online Anomaly Detection. Advances in Knowledge Discovery and Data Mining. In Proceedings of the 22nd Pacific-Asia Conference, PAKDD 2018, Melbourne, VIC, Australia, 3–6 June 2018; pp. 508–521.
- Firoozjaei, M.D.; Mahmoudyar, N.; Baseri, Y.; Ghorbani, A.A., An evaluation framework for industrial control system cyber incidents. Int. J. Crit. Infrastruct. Prot. 2022, 36, 100487.
- Mazarbhuiya, F. A., Detecting Anomaly using Neighborhood Rough Set based Classification Approach, ICIC Express Letters, Vol. 17(1), 2023, Japan, pp. 73-80.
- Chen, Q.; Zhou, M.; Cai, Z.; Su, S. Compliance Checking Based Detection of Insider Threat in Industrial Control System of Power Utilities. In Proceedings of the 2022 7th Asia Conference on Power and Electrical Engineering (ACPEE), Hangzhou, China, 15–17, April 2022; pp. 1142–1147.
- Zhao, Z.; Mehrotra, K. G.; Mohan, C. K. Online Anomaly Detection Using Random Forest. In Recent Trends and Future Technology in Applied Intelligence; Mouhoub, M., Sadaoui, S., Ait Mohamed, O., Ali, M., Eds.; IEA/AIE 2018; Lecture Notes in Computer Science; Springer: Cham, Switzerland.
- Mustafa Al Samara, Ismail Bennis, Abdelhafid Abouaissa and Pascal Lorenz, A Survey of Outlier Detection Techniques in IoT: Review and Classification, Journal of Sensor and Actuator Networks, Vol 11(4), 2022, pp. 1-31.
- Wang, L.; Wang, J.; Ren, Y.; Xing, Z.; Li, T.; and Xia, J. A Shadowed Rough-fuzzy Clustering Algorithm Based on Mahalanobis Distance for Intrusion Detection, Intelligent Automation & Soft Computing, Tech Science Press, 2021, pp. 1-12, . [CrossRef]
- Harish, B. S.; and Kumar, S. V. A. Anomaly based Intrusion Detection using Modified Fuzzy Clustering, International Journal of Interactive Multimedia and Artificial Intelligence, Vol. 4(6), 2017, pp. 54-59, . [CrossRef]
- Gustafson, D. E. & Kessel, W., Fuzzy clustering with a fuzzy covariance matrix. In Proc. of IEEE Conf. on Decision and Control including the 17th Symposium on Adaptive Processes, San Diego, 1979, pp. 761-766. [CrossRef]
- Haldar, N. A. H.; Khan, F. A.; Ali, A.; and Abbas, H., Arrhythmia classification using Mahalanobis distance-based improved Fuzzy C-Means clustering for mobile health monitoring systems, Neurocomputing, vol.220 (12), pp. 221–235, 2017.
- Zhao, X. M.; Li, Y.; and Zhao, Q. H., Mahalanobis distance based on fuzzy clustering algorithm for image segmentation, Digital Signal Processing, vol. 43 (12), pp. 8–16, 2015.
- Ghorbani, H., Mahalanobis Distance and Its Application for Detecting Multivariate Outliers, FACTA UNIVERSITATIS (NIS) Ser. Math. Inform. Vol. 34(3), 2019, pp. 583–595 . [CrossRef]
- Shenify, M.; Mazarbhuiya, F. A. and Wungreiphi, A. S., Detecting IoT Anomalies Using Fuzzy Subspace Clustering Algorithms, Applied Science, MDPI, Vol. 14(3), 2024, Besel, Switzerland, . [CrossRef]
- Zadeh, L. A., Fuzzy Sets as Basis of Theory of Possibility, Fuzzy Sets and Systems 1, (1965), pp. 3-28.
- Atanassov, K., Intuitionistic Fuzzy Sets,'' VII ITKR Session, Sofia, 20-23 June 1983 (Deposed in Centr. Sci.-Techn. Library of the Bulg. Acad. of Sci., 1697/84) (in Bulgarian). Reprinted: {Int. J. Bioautomation,} vol.~{20(S1)}, 2016, pp. S1-S6).
- Cuong, B. C. Picture fuzzy sets. J Comput Sci Cybern 30(4), 2014,409–420.
- Bezdek, J. C.; Ehrlich R; Full, W., FCM:the fuzzy c-means clustering algorithm. Comput Geosci 10(2), 1984:191–203.
- Butkiewicz, B. S., Fuzzy clustering of intuitionistic fuzzy data. In: Rutkowski L, Korytkowski M, Scherer R, Tadeusiewicz R, Zadeh L, Zurada J (eds) Artificial intelligence and soft computing, 1st edn. Springer, Berlin, Heidelberg, 2012, pp 213–220.
- Chaira T., A novel intuitionistic fuzzy C means clustering algorithm and its application to medical images. Appl Soft Comput, 11(2), 2011:1711–1717.
- Chaira T,; Panwar A , An Atanassov’s intuitionistic fuzzy kernel clustering for medical image segmentation. Int J Comput Intell Syst 17, 2013:1–11.
- Thong, P. H. and Son, L. H., Picture fuzzy clustering: a new computational intelligence method, Soft Comput (2016) 20:3549–3562, DOI 10.1007/s00500-015-1712-7.
- Xu, Z. S., Intuitionistic fuzzy hierarchical clustering algorithms, Journal of Systems Engineering and Electronics, 2009, Vol. 20(1), pp. 90-97.
- Xu, Z.; Wu, J., Intuitionistic fuzzy C-means clustering algorithms, Journal of Systems Engineering and Electronics, Vol. 21(4), 2010, pp. 580-590.
- Szmidt, E. and Kacprzyk, J., Distances between intuitionistic fuzzy sets. Fuzzy Sets and Systems, 2000, Vol. 114(3), pp. 505–518.
- Xu, Z. S., Some similarity measures of intuitionistic fuzzy sets and their applications to multiple attribute decision making, Fuzzy Optimization and Decision Making, 2007, Vol. 6(2), pp.109–121.
- Mazarbhuiya, F. A. and Shenify, M., An Intuitionistic Fuzzy-Rough Set-Based Classification for Anomaly Detection, Applied Science, MDPI, Vol. 13(9), 2023, Switzerland, pp.1-21.
- 56. https://github.com/jmnwong/NSL-KDD-Dataset.
- https://github.com/waico/SKAB.
- KDD Cup’99 Data, http://kdd.ics.uci.edu/databases/kddcup99/kddcup99.html.
Figure 1.
Flowchart of the IFCM Clustering algorithm.
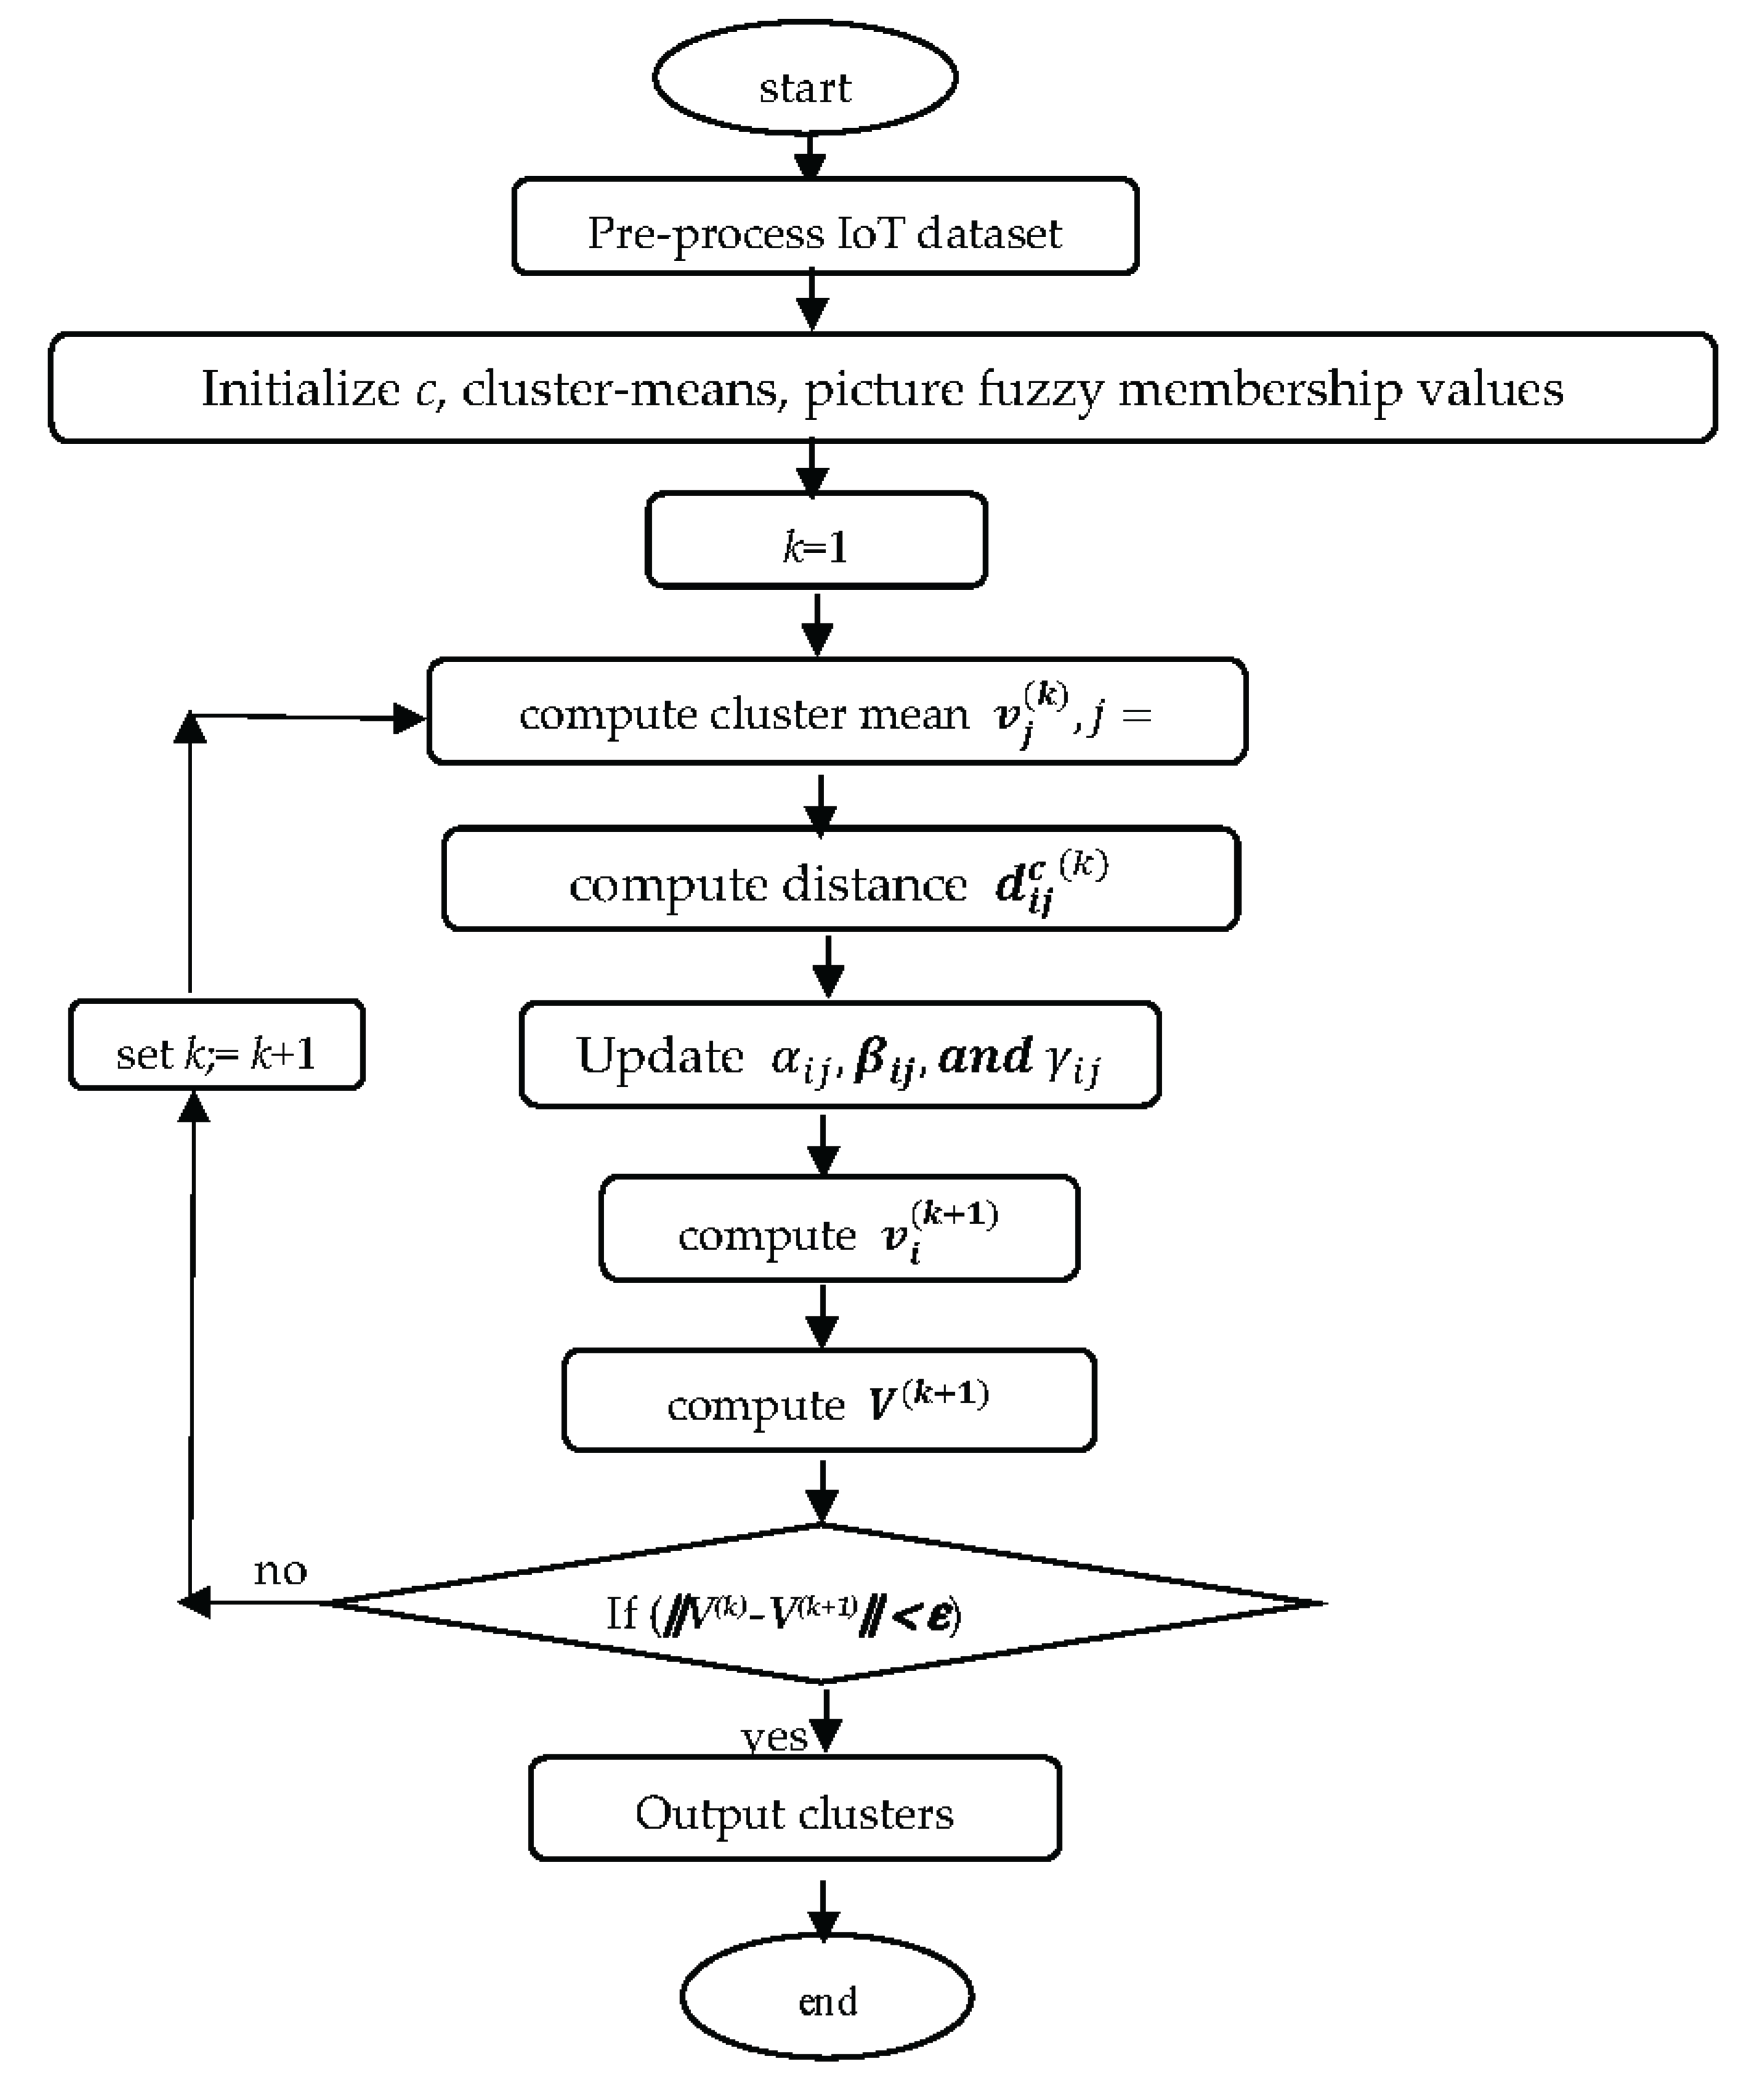
Figure 2.
% of Detection and accuracy rates of the algorithms with the given datasets.

Figure 3.
% of False alarm rates of the algorithms with the given datasets.
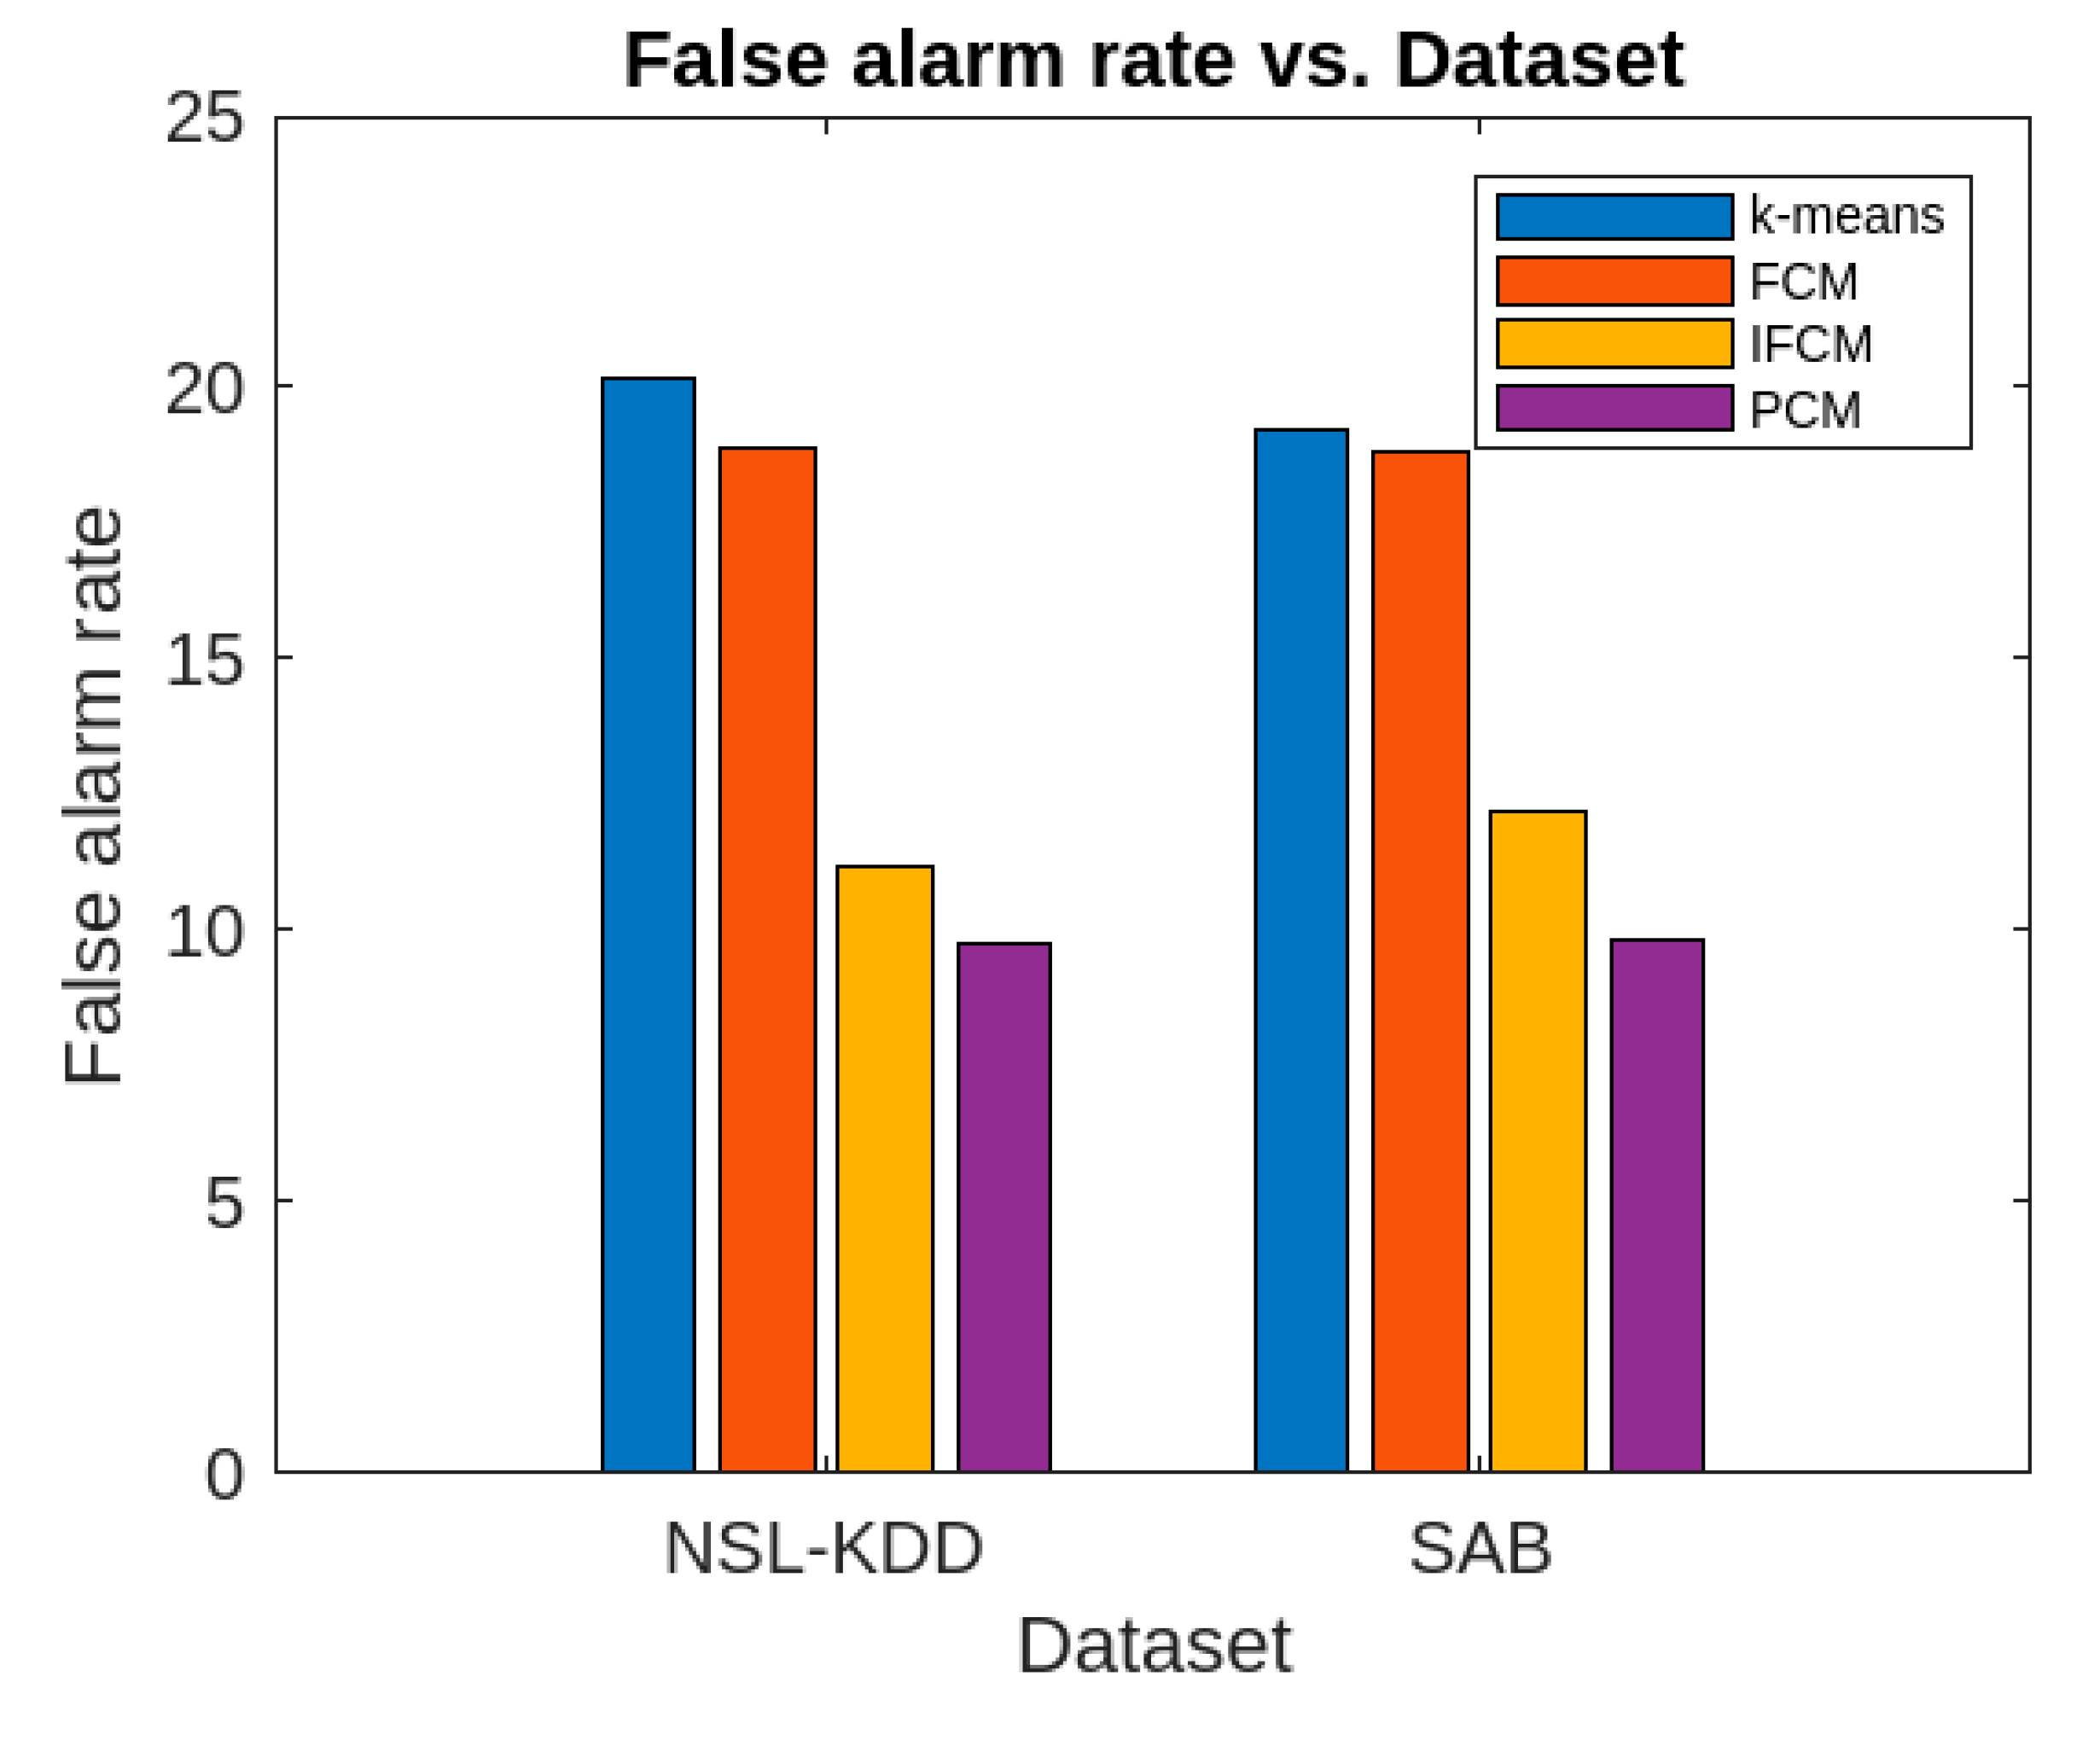
Figure 4.
% of Denial of service and Remote to local of the algorithms with the two given datasets.

Figure 5.
% of User to root of the algorithms with the two given datasets.

Figure 6.
% of Precision and Recall of the algorithms with the two given datasets.
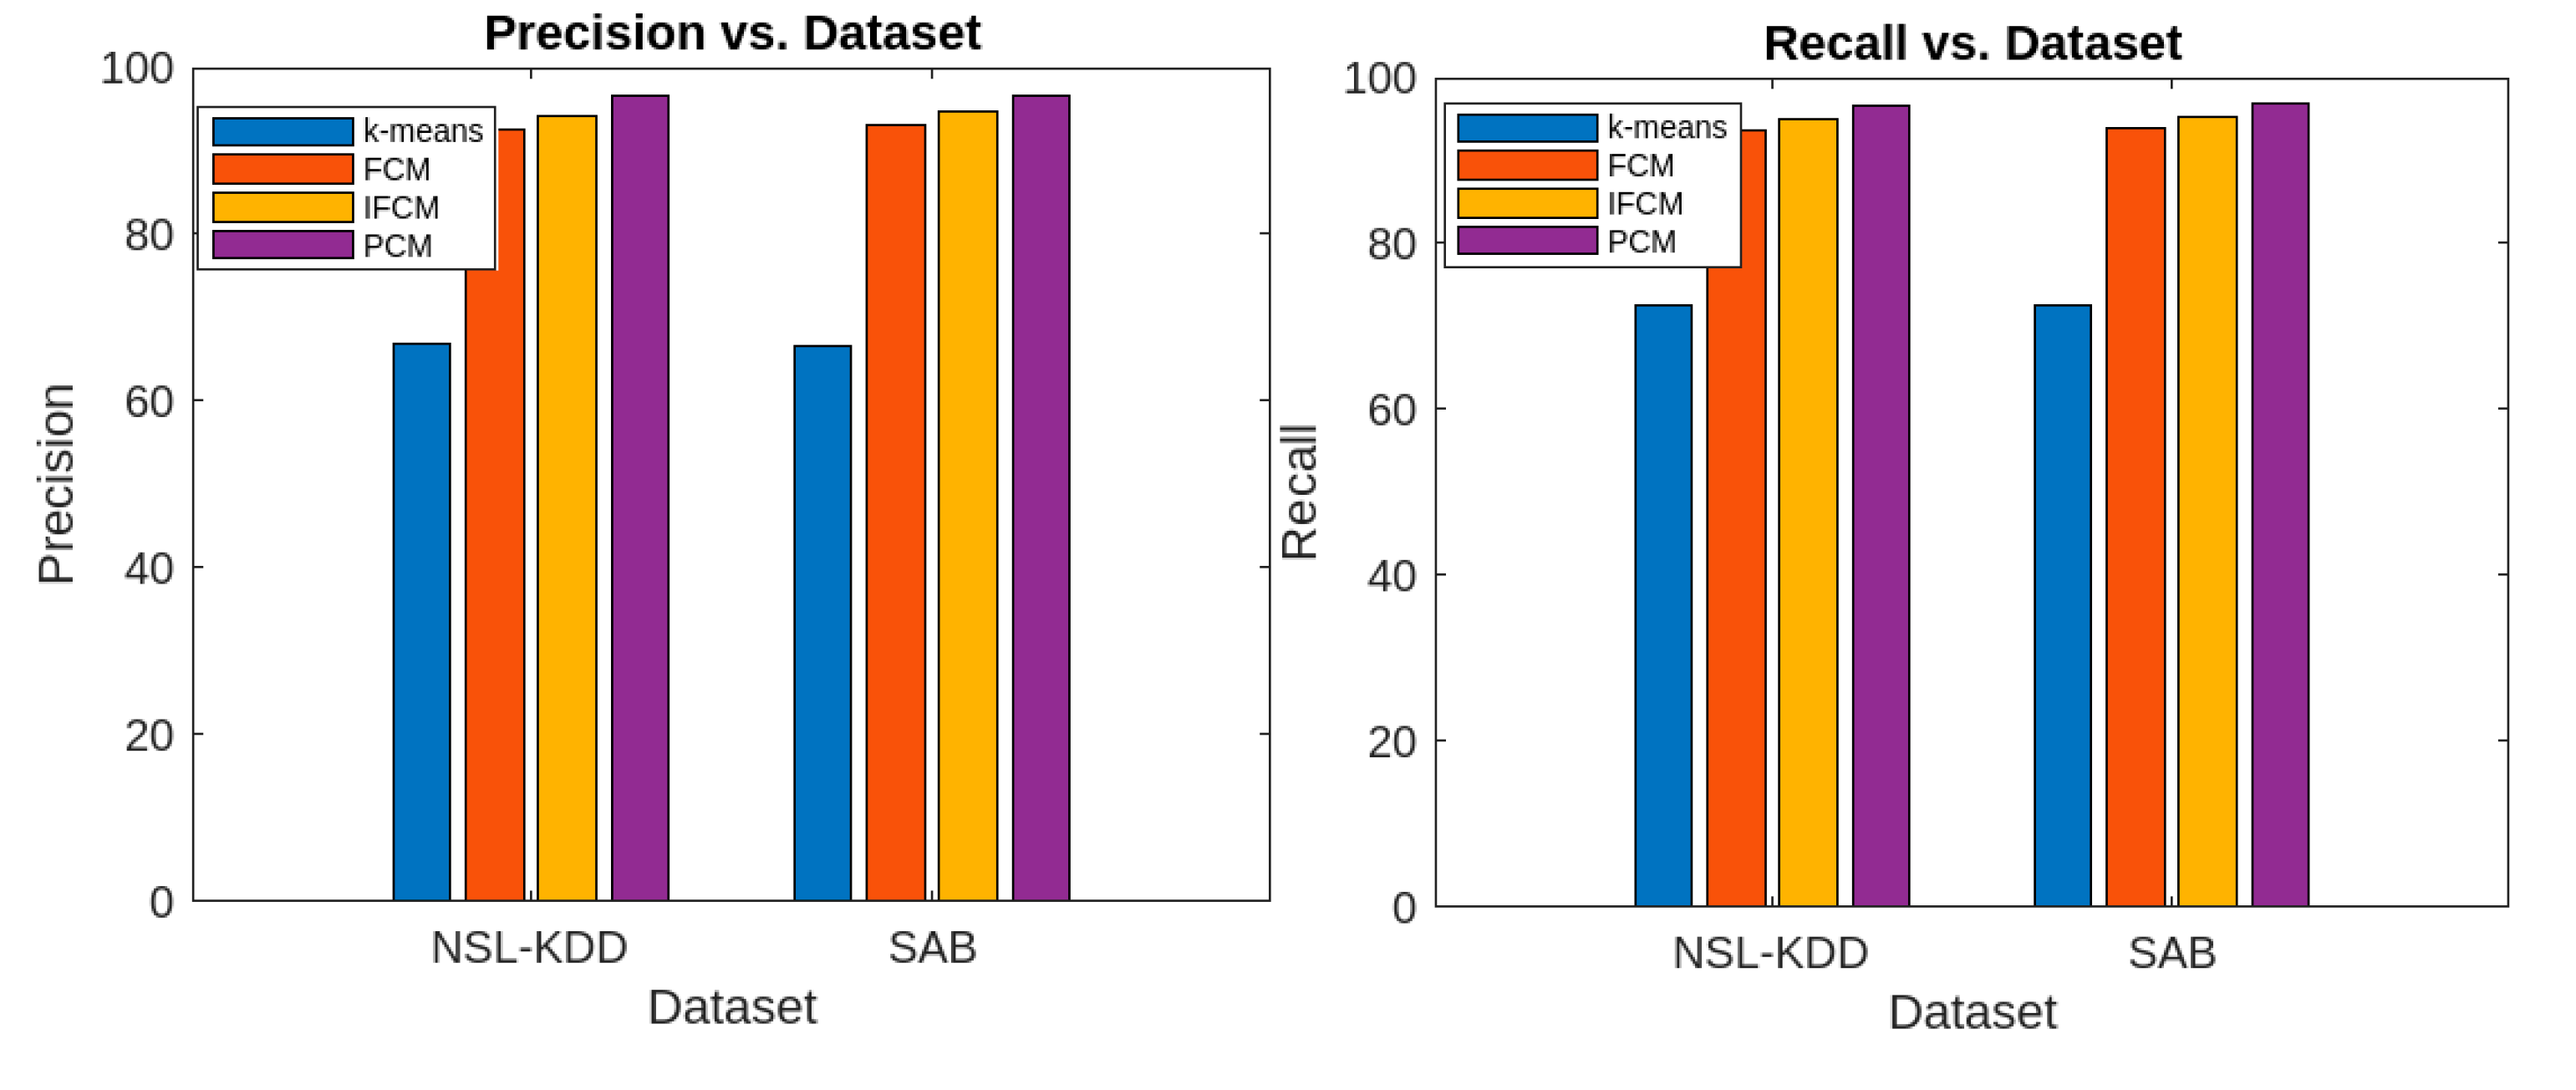
Figure 7.
% of F-score of the algorithms with the two given datasets.
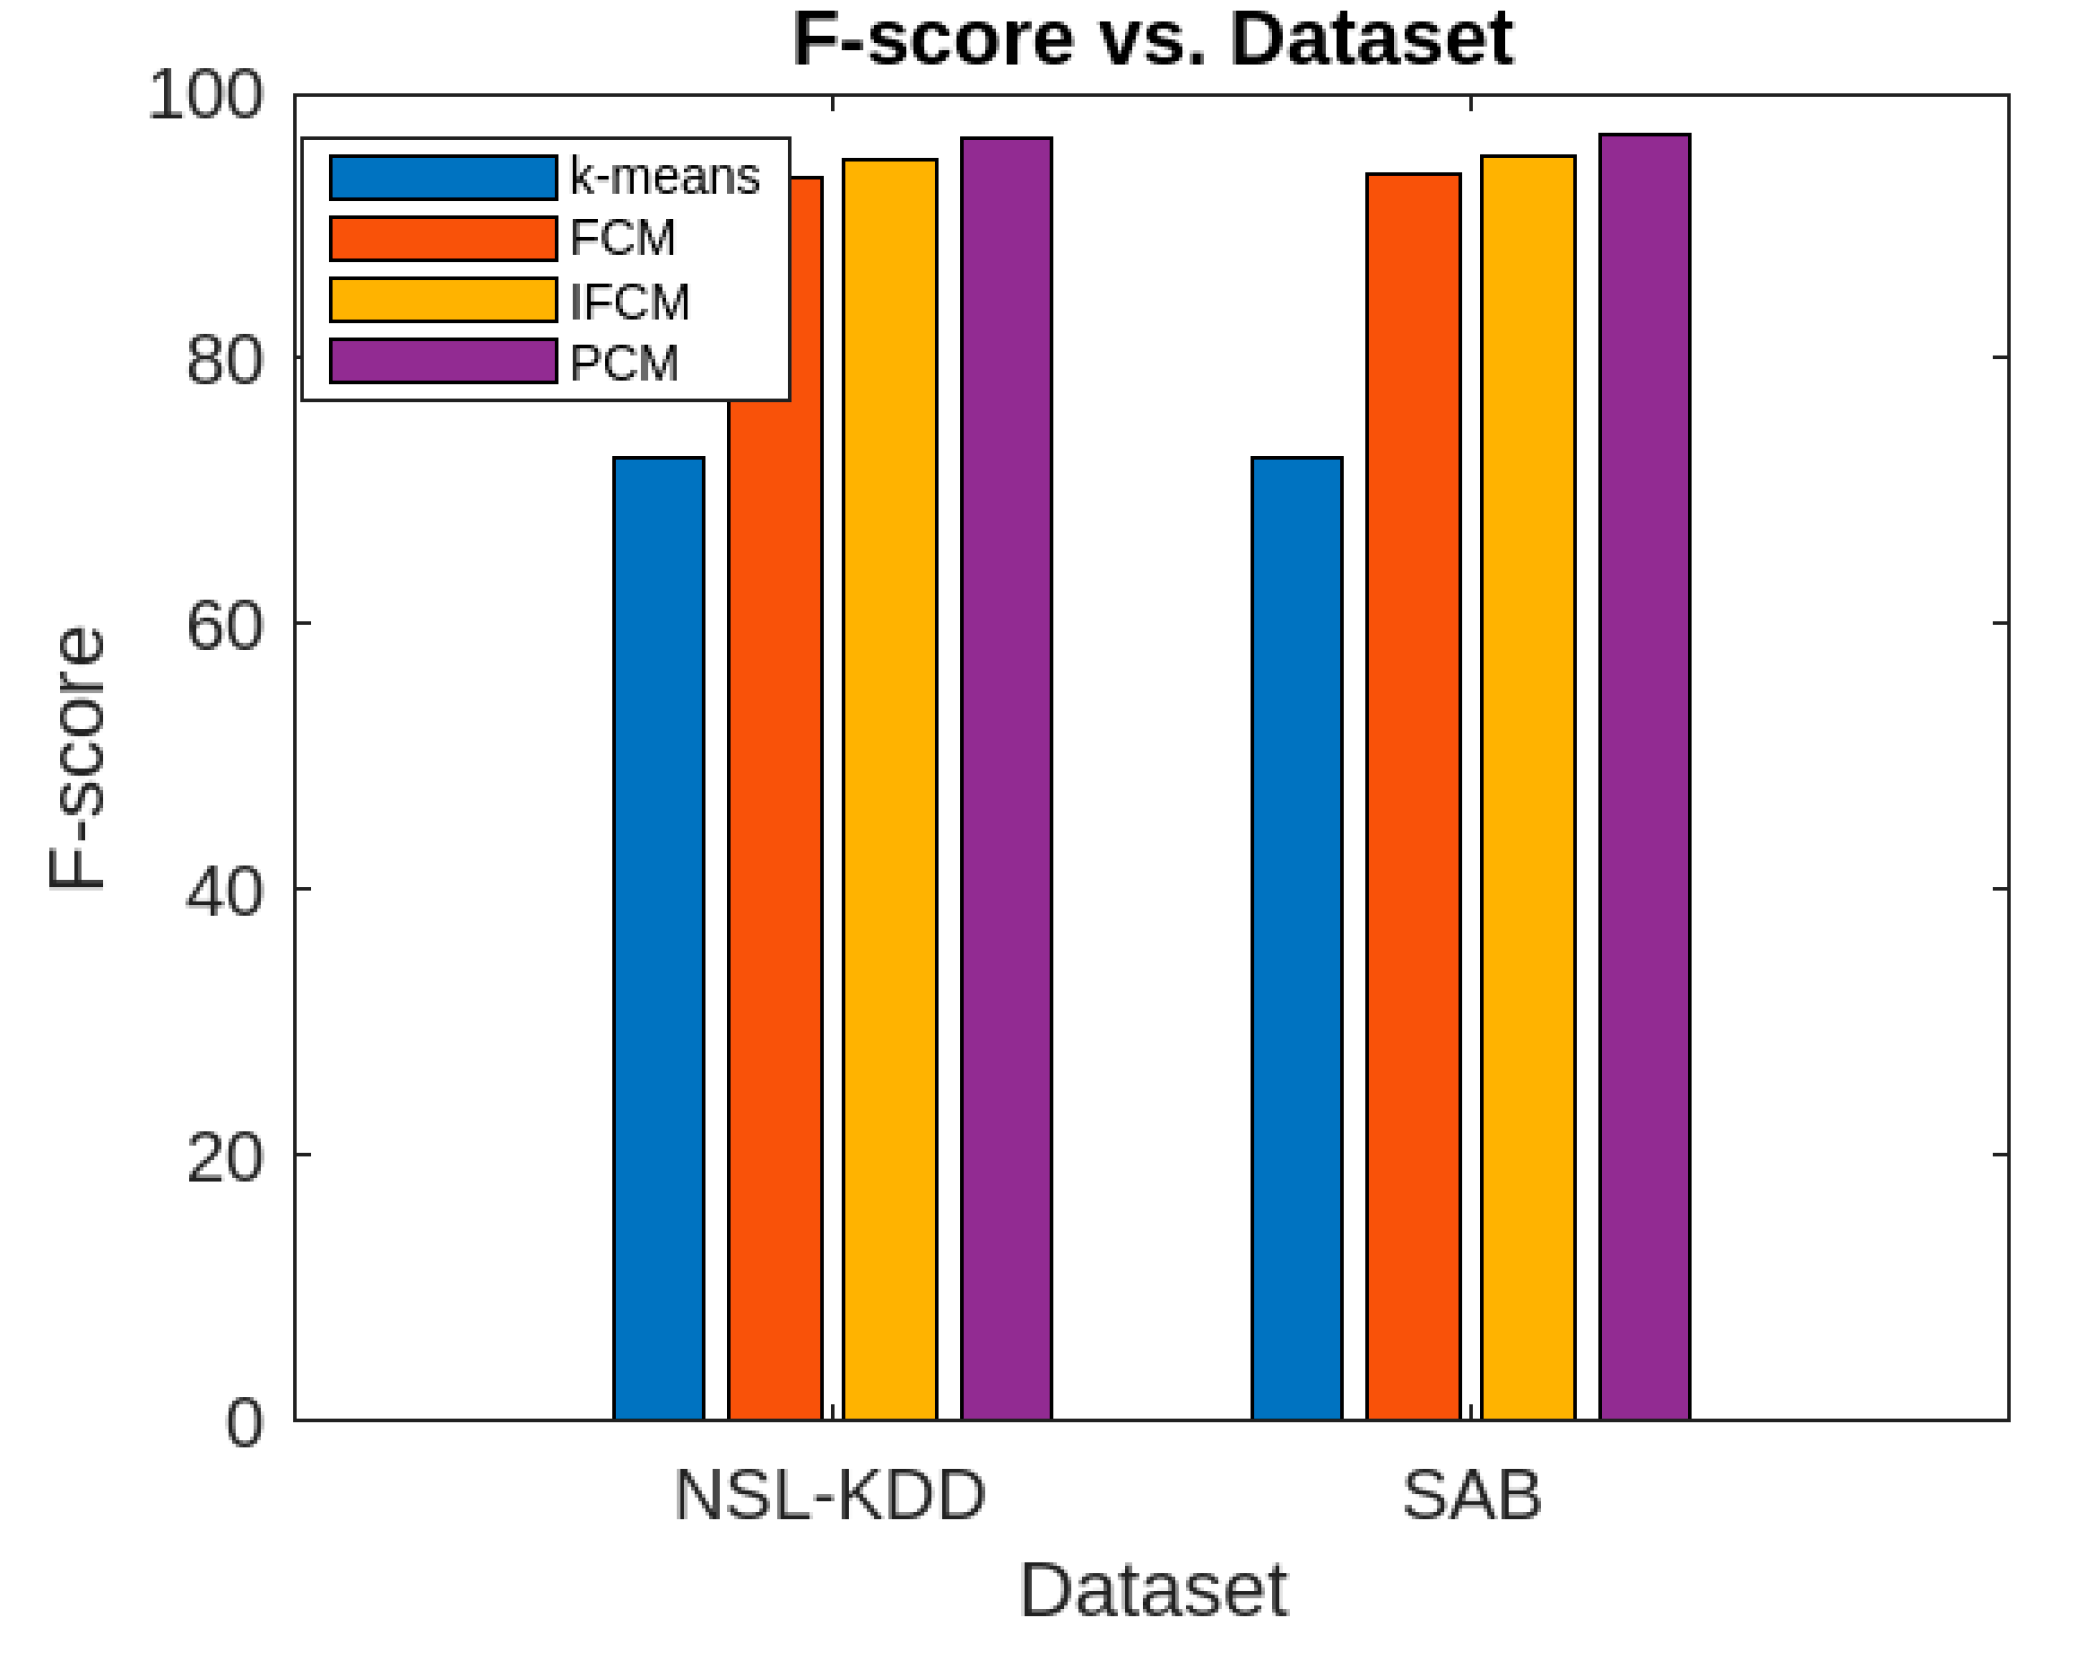
Figure 8.
Execution time with respect to dimension of the dataset.
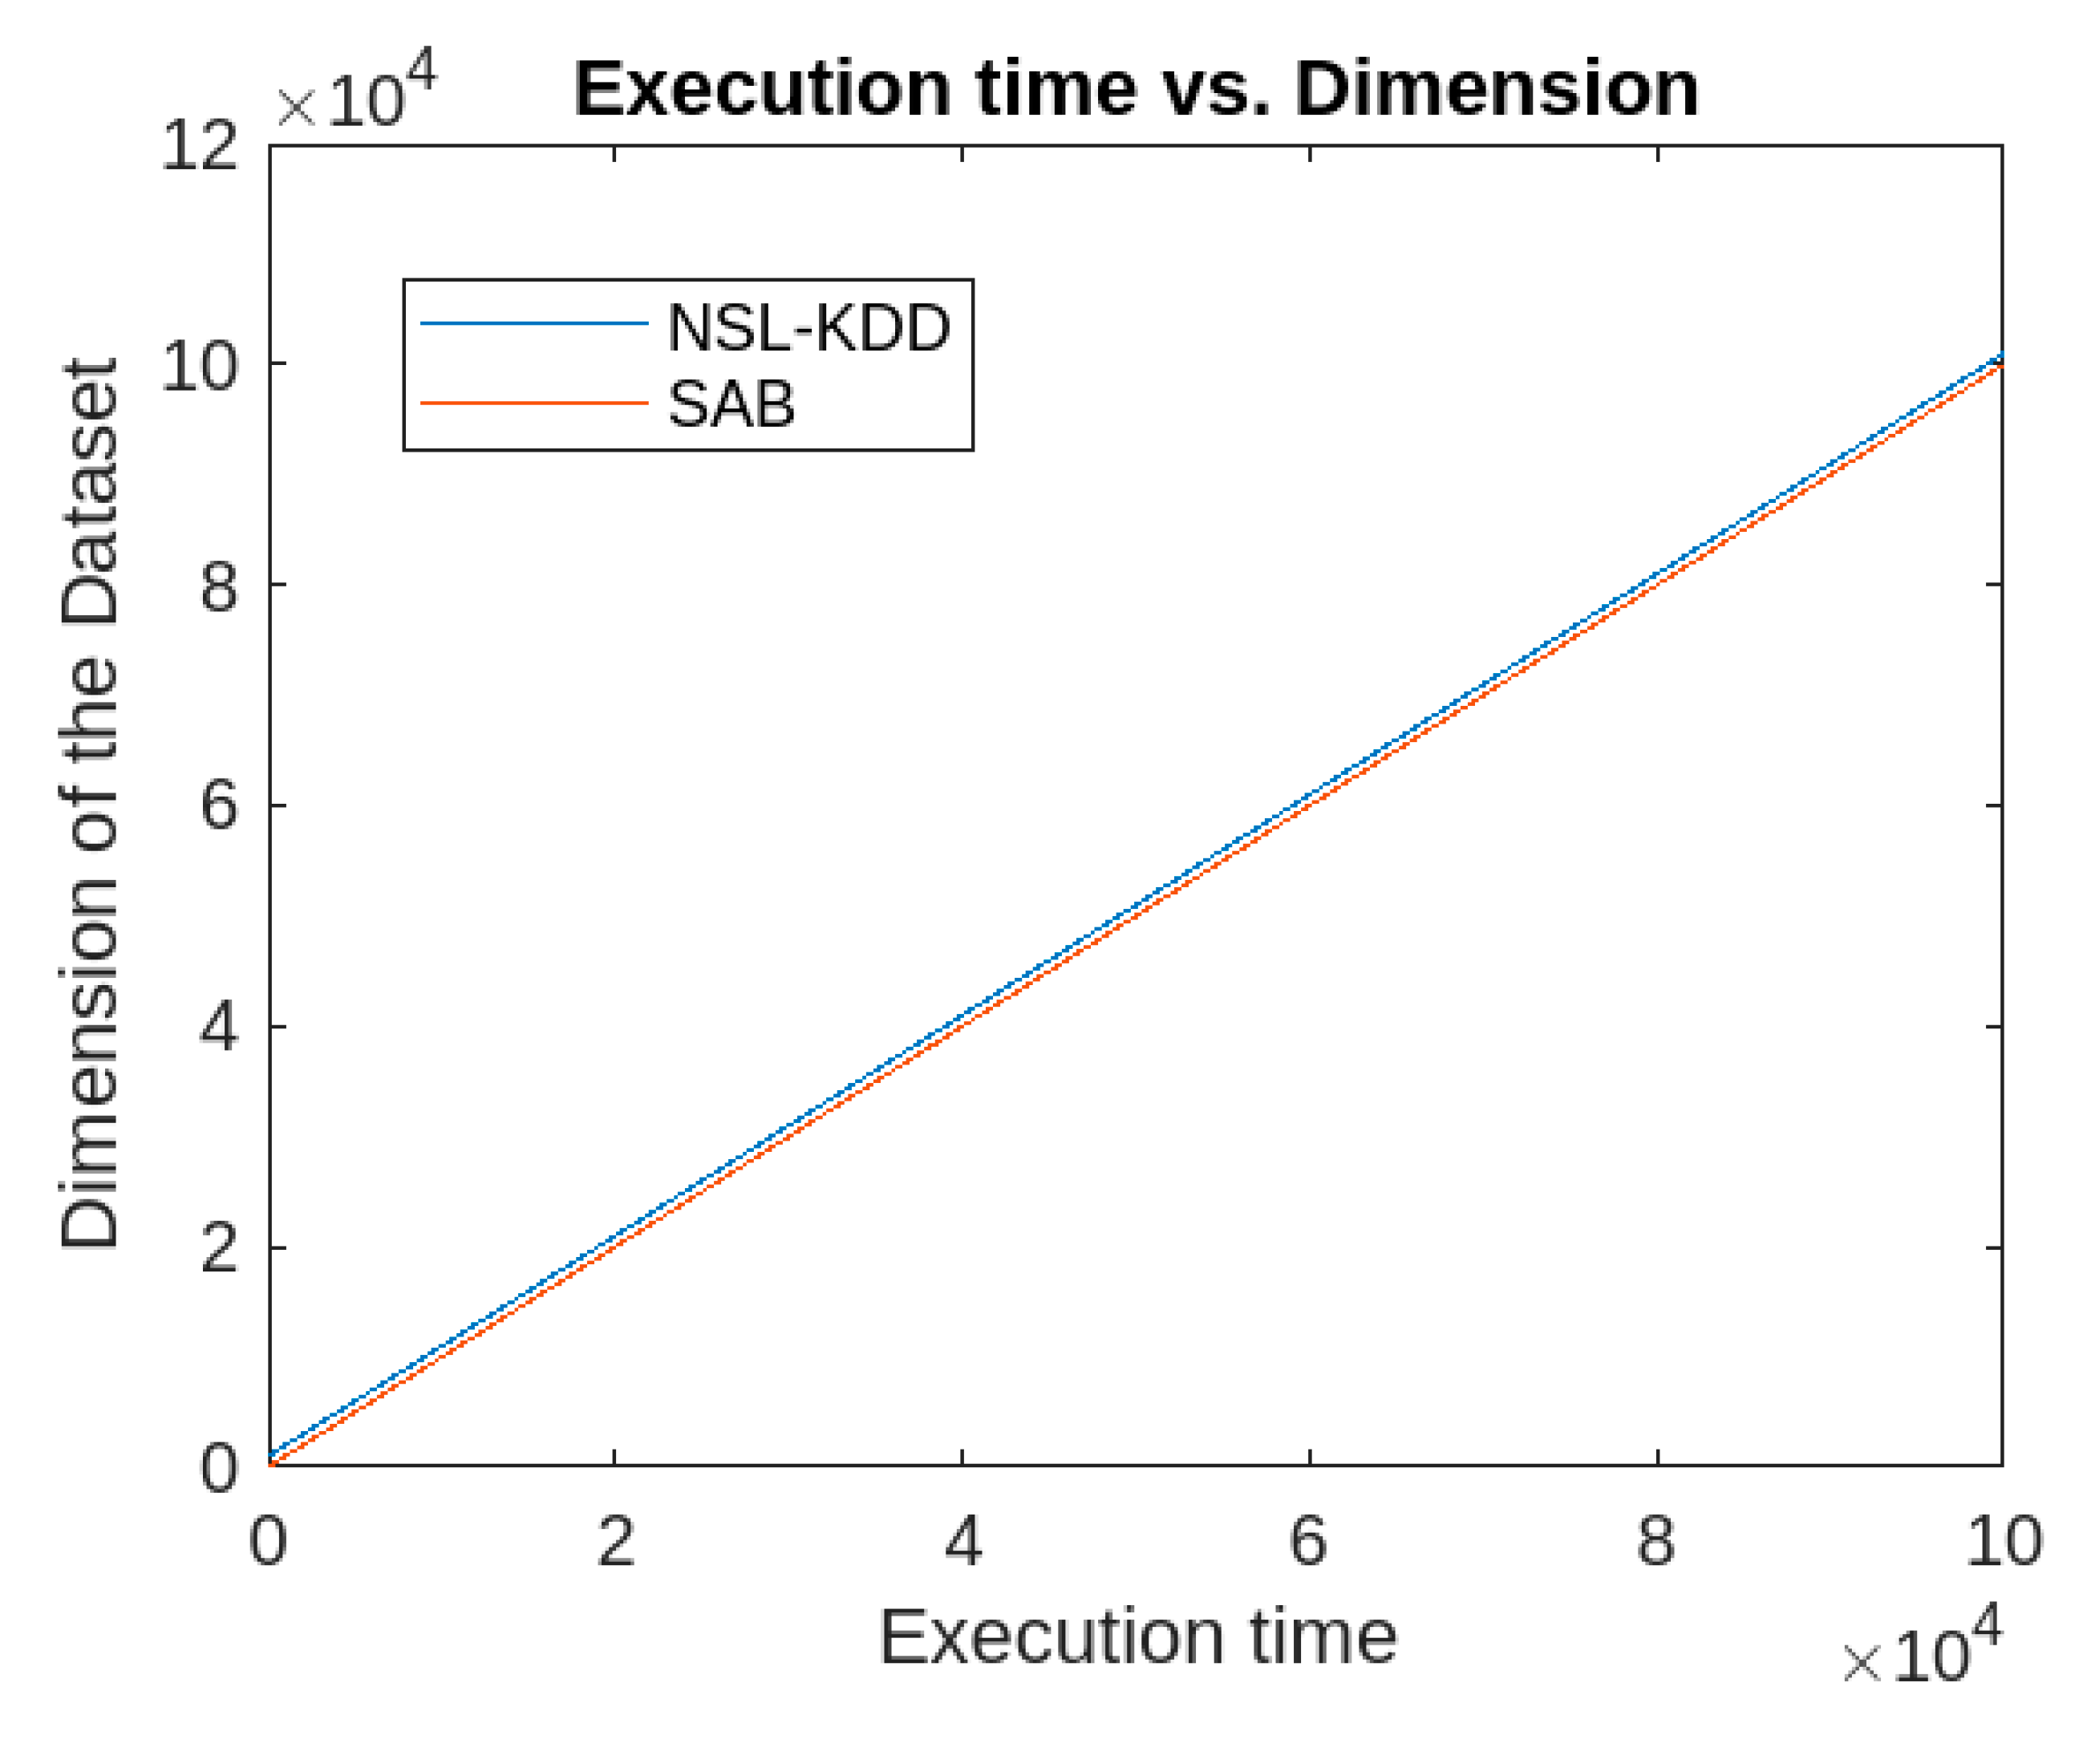
Figure 9.
Execution time with respect to the dataset size.
Disclaimer/Publisher’s Note: The statements, opinions and data contained in all publications are solely those of the individual author(s) and contributor(s) and not of MDPI and/or the editor(s). MDPI and/or the editor(s) disclaim responsibility for any injury to people or property resulting from any ideas, methods, instructions or products referred to in the content. |
© 2025 by the authors. Licensee MDPI, Basel, Switzerland. This article is an open access article distributed under the terms and conditions of the Creative Commons Attribution (CC BY) license (http://creativecommons.org/licenses/by/4.0/).
Copyright: This open access article is published under a Creative Commons CC BY 4.0 license, which permit the free download, distribution, and reuse, provided that the author and preprint are cited in any reuse.


