
Submitted:
09 May 2025
Posted:
15 May 2025
You are already at the latest version
Abstract
The accurate identification of meaningful patterns in high-dimensional and noisy datasets remains a fundamental challenge in intelligent data analysis, particularly within the domain of smart city analytics. Traditional clustering algorithms such as DBSCAN offer robustness to noise and the ability to detect clusters of arbitrary shapes. However, they suffer from critical limitations, including sensitivity to parameter selection and poor performance in handling overlapping or ambiguous data regions. To overcome these issues, this paper presents a novel hybrid clustering framework that synergistically combines fuzzy logic and Particle Swarm Optimization (PSO) with Density-Based Spatial Clustering of Applications with Noise (DBSCAN). The proposed method begins with Z-score normalization for data standardization, followed by the application of PSO to automatically optimize key DBSCAN parameters, namely Eps and MinPts, across a predefined range. A fuzzy extension of DBSCAN is then employed to enable soft clustering, which better accommodates data uncertainty and overlapping class boundaries. Experimental evaluations on urban analytics datasets from Addis Ababa demonstrate that the proposed approach achieves improved clustering quality, as evidenced by enhanced silhouette scores and intra-cluster cohesion, in comparison to traditional DBSCAN and its variants. This work contributes a flexible and intelligent clustering technique well-suited for real-world smart city applications where data ambiguity and parameter sensitivity are prevalent.
Keywords:
fuzzy DBSCAN
; particle swarm optimization
; smart city analytics
; clustering
; Z-score normalization
1. Introduction
Clustering, a foundational task in unsupervised machine learning, enables the discovery of natural groupings in unlabeled datasets by grouping similar instances based on a defined similarity or distance metric. This technique plays a crucial role in various domains, including healthcare, marketing, and especially urban analytics, where it helps in understanding patterns such as resource usage, population movement, and infrastructure demand. In urban settings, clustering is particularly effective in identifying functional zones and service patterns by analyzing vast and diverse datasets generated by smart sensors, citizen engagement platforms, and administrative systems.
Among the numerous clustering methods, DBSCAN (Density-Based Spatial Clustering of Applications with Noise) is widely preferred for both spatial and non-spatial data due to its capability to discover clusters of arbitrary shape and to manage noise effectively. It requires minimal prior knowledge of the number of clusters and works well with varying data densities. However, despite its advantages, DBSCAN has two notable limitations that hinder its applicability in more complex, real-world scenarios. First, it is highly sensitive to two user-defined parameters: Eps (neighborhood radius) and MinPts (minimum number of points to form a dense region). Small changes to these values can significantly alter the clustering results. Second, DBSCAN assigns data points to clusters in a binary fashion—either fully inside or completely outside—without accommodating partial or fuzzy memberships. This rigid assignment can be problematic in cases where data points lie on the boundaries of clusters or exhibit characteristics of multiple clusters simultaneously.
To mitigate these limitations, this work proposes Adaptive Fuzzy-PSO DBSCAN: a framework integrating fuzzy set theory [16] with PSO-tuned DBSCAN [19]. Fuzzy logic introduces graded cluster memberships, enhancing boundary handling and improving on the rigid binary assignments of traditional DBSCAN [20]. PSO dynamically tunes clustering parameters, eliminating manual trial-and-error and enhancing robustness against parameter sensitivity [19]. This integration yields improved cluster accuracy and stability. The method’s efficacy is demonstrated on Addis Ababa’s urban service datasets, which present real-world complexities like variable densities and overlapping data attributes typical in smart city analytics [1,8].
2. Related Work
Clustering remains a vital approach in analyzing complex and high-dimensional datasets, especially in smart city contexts where urban data presents inherent ambiguity and noise. Traditional density-based clustering methods like DBSCAN [20] have shown strong performance in discovering clusters of arbitrary shape and handling noise. However, DBSCAN’s performance is highly sensitive to its parameter settings (Eps and MinPts), and it does not inherently support soft clustering — a limitation in many urban applications involving overlapping or ambiguous data [17,18,25].
To address DBSCAN's parameter sensitivity, researchers have explored integrating metaheuristic algorithms such as Particle Swarm Optimization (PSO) to enhance parameter tuning. For example, Guan et al. [19] proposed a PSO-optimized density-based clustering algorithm that demonstrated improved adaptability to varying data densities. Similarly, Srinivas and Prasad [31] applied PSO for DBSCAN parameter tuning in localization tasks, showing increased accuracy and stability. More recently, Devadas et al. [33] introduced a hybrid framework using Quantum Particle Swarm Optimization (QPSO) for initializing fuzzy c-means and DBSCAN, further enhancing convergence and clustering quality.
Fuzzy logic has also been introduced to mitigate the binary cluster assignment limitation of classical DBSCAN. Ienco and Bordogna [16] proposed fuzzy extensions to DBSCAN, allowing objects to have partial membership across multiple clusters. Rad and Abdolrazzagh-Nezhad [34] combined fuzzy clustering with a nature-inspired Earthworm Optimization technique to improve robustness in data cube analysis. Similarly, El-Zeheiry et al. [32] demonstrated the benefit of combining fuzzy c-means and DBSCAN for IoT data, capturing uncertainty more effectively.
Several hybrid clustering models have emerged in recent literature, combining density-based, fuzzy, and metaheuristic methods. Chaudhry et al. [36] provided a systematic review of such hybrid models, noting significant improvements in clustering performance across diverse applications. Kazemi and Soleimani [35] proposed a game-theoretic adjustable DBSCAN variant (GTAD) tailored for urban big data clustering, reinforcing the growing trend toward flexible, context-aware clustering methods. These advancements align with smart city analytics requirements, which demand adaptive algorithms capable of handling heterogeneous data types and semantic uncertainty [37].
Applications of these clustering enhancements span various domains. For instance, fuzzy and metaheuristic clustering have been used in fall detection systems [7], waste categorization [4], gene-disease prediction [3], and urban income modeling [14]. The incorporation of clustering into broader machine learning systems also includes healthcare [8], tax avoidance detection [15], sentiment analysis [9], and price prediction [30].
Moreover, fuzzy observers and inference systems have been integrated into intelligent systems for fault detection and infrastructure management [26,27]. These works collectively underscore the relevance and versatility of fuzzy logic, swarm intelligence, and density-based clustering in smart environments.
In summary, prior research has laid the groundwork for improving DBSCAN via fuzzy logic and metaheuristic parameter optimization. However, few studies combine both approaches in a unified framework tailored for non-spatial urban datasets. The proposed fuzzy-PSO-DBSCAN hybrid contributes to this gap by integrating parameter optimization with soft clustering to enhance performance in smart city analytics.
3. Methodology
3.1. Z-Score Normalization
Each feature of the dataset is normalized to have a mean of zero and a standard deviation of one using the Z-score normalization formula:
where:
is the original value of the feature,
is the mean of the feature,
is the standard deviation of the feature.
This process ensures that all features contribute equally to the clustering process, mitigating any bias introduced by features with larger magnitudes [5].
Particle Swarm Optimization (PSO) is used to optimize the parameters for clustering. Each particle in the swarm represents a potential solution, and its position and velocity are updated iteratively according to the following equations:
where:
w is the inertia weight.
are the cognitive and social coefficients, respectively,
are random numbers in the range [0, 1],
are the best positions found by the individual particle and the entire swarm, respectively.
The fitness of each particle is evaluated using the Silhouette score, which measures the quality of clustering. This iterative process optimizes the clustering parameters by adjusting the particles’ positions [19].
3.2. Fuzzy Core Membership
The fuzzy membership of a data point to a cluster is computed based on the number of neighbors C. The membership function for each data point is given by:
where:
is a parameter controlling the steepness of the membership function,
is the threshold for the number of neighbors.
This membership function assigns a graded membership value to each data point, allowing it to belong to multiple clusters to varying degrees [16].
3.3. Fuzzy DBSCAN Clustering
For the clustering process, the optimized parameters from PSO are used with the Fuzzy DBSCAN algorithm. The membership function for each point in the dataset is determined based on its reachability and proximity to core points. The fuzzy membership of a point to a cluster is computed as:
where:
- is the distance between point and cluster
- is a parameter controlling the spread of the exponential function,
- is the total number of clusters.
4. Experimental Evaluation
4.1. Dataset
To evaluate the performance of the proposed fuzzy PSO-enhanced DBSCAN algorithm, a real-world dataset comprising public service facilities in Addis Ababa, Ethiopia was employed. This dataset includes key urban infrastructure such as education centers (schools, colleges), healthcare institutions (hospitals, clinics), and entertainment venues (cinemas, cultural centers), reflecting domains typically analyzed in smart city research [1,8]. The data were sourced through a combination of field surveys and publicly available government directories, ensuring both authenticity and relevance.
The dataset is structured with the following features:
- Type of facility (categorical: education, health, or entertainment)
- Year of establishment (numerical)
- Geographic coordinates (latitude and longitude)
These features mirror the structure and attributes commonly used in prior studies on urban infrastructure clustering [21], facilitating meaningful comparisons. For preprocessing, all numerical attributes were standardized using Z-score normalization to ensure feature comparability and reduce scale bias in clustering. The dataset was then partitioned into two temporal subsets—pre-2010 and post-2010—to assess clustering performance across time-based urban development phases.
4.2. Results
The effectiveness of the proposed clustering method was evaluated using the Silhouette Score, a widely accepted metric for quantifying intra-cluster cohesion and inter-cluster separation.
As evident from the Table 1, the fuzzy PSO-enhanced DBSCAN algorithm outperformed the traditional DBSCAN approach in both temporal subsets. The proposed method demonstrated a superior ability to capture more cohesive and well-separated clusters, particularly in the older infrastructure data, where spatial distribution tends to be more complex due to urban sprawl.
To statistically validate the performance difference, a paired t-test was conducted across multiple randomly selected data subsets. The test compared the silhouette scores produced by the two clustering methods for each subset. The results yielded a p-value less than 0.05, indicating that the improvements offered by the proposed method are statistically significant and not attributable to random variation. This statistical confirmation strengthens the case for the hybrid approach as a reliable enhancement over fixed-parameter clustering techniques.
Furthermore, the fuzzy component facilitated more flexible boundary management in clusters, which is crucial when dealing with overlapping service regions or ambiguous facility roles. The integration of PSO also enabled adaptive parameter selection, reducing the manual effort required to fine-tune DBSCAN settings such as Eps and MinPts.
4.3. GIS Visualization
Clusters were mapped using GIS tools, confirming higher spatial coherence and reduced fragmentation using the proposed method. Compared to standard DBSCAN, the fuzzy PSO-DBSCAN produced clusters that aligned more naturally with urban sector boundaries and minimized unclassified points.
Figure 1 illustrates a side-by-side comparison:
Figure 1(a) shows clustering results using standard DBSCAN, where many points remain unclustered or fragmented.
Figure 1 (b) displays the output of the proposed fuzzy PSO-DBSCAN, clearly highlighting more cohesive and semantically meaningful clusters across the study area.
5. Architecture and Application in Smart Cities
This section elaborates on the technical framework and urban analytics applications of the proposed Adaptive Fuzzy-PSO DBSCAN model. Drawing from previous research on intelligent urban infrastructure analytics [1,8,21], we propose a modular architecture that accommodates real-time data variability and heterogeneous urban information sources. Adaptive clustering mechanisms are critical for analyzing complex, noisy, and high-dimensional smart city data, especially in rapidly evolving environments.
5.1. System Architecture
The architecture of the Adaptive Fuzzy-PSO DBSCAN framework is designed to process end-to-end smart city data flows, from raw collection to actionable insight. It integrates multiple layers, each responsible for a distinct function in the data processing pipeline. This layered approach allows for modular development, scalability, and ease of integration with city-wide data infrastructures.
- Data Collection Layer: This layer ingests structured and semi-structured data from a variety of sources, including urban sensors (e.g., GPS trackers, environmental sensors), citizen mobile applications, public service directories, and historical databases. Integration is facilitated via standardized APIs and IoT gateways to support data acquisition in real time and batch modes.
- Data Preprocessing Layer: Raw inputs undergo data cleansing, transformation, and normalization. Missing values are handled through imputation, while Z-score normalization is applied to ensure comparability across heterogeneous attributes such as geographic coordinates, service categories, and timestamps. Technologies like Python Pandas or Apache Spark may be used to ensure scalability.
- Parameter Optimization Layer: This layer employs Particle Swarm Optimization (PSO) to automatically search for the optimal combination of DBSCAN parameters—specifically, Eps, , and . The fitness function is based on clustering quality metrics such as the silhouette score. This automation eliminates the need for manual tuning, which is often suboptimal in dynamic urban environments.
- Fuzzy Clustering Layer: Using the PSO-optimized parameters, a fuzzy-enhanced version of DBSCAN is executed. Unlike traditional DBSCAN, this method calculates membership degrees for each point, allowing partial assignment to multiple clusters. This fuzziness better captures the overlapping nature of urban services (e.g., education centers serving multiple districts).
- Analysis and Visualization Layer: The final output clusters are visualized using GIS tools, interactive dashboards, and spatial heatmaps. Platforms such as QGIS, Power BI, or Tableau are used to display clusters, highlight service coverage gaps, and enable real-time monitoring. These outputs are critical for urban planners, public service managers, and policymakers.
Figure 2. System architecture of the Adaptive Fuzzy-PSO DBSCAN framework for smart city data analytics.
This architecture supports the integration of future technologies such as edge computing and federated learning, enabling more responsive and secure processing of urban data. Moreover, it provides flexibility for handling multi-modal data streams and supports expansion to real-time analytics scenarios.
5.2. Urban Analytics Use Case
The proposed framework has significant potential for practical deployment in smart city scenarios, particularly in the domains of service optimization, infrastructure planning, and dynamic zoning.
For instance, in urban zoning applications, the adaptive fuzzy clustering mechanism allows for the detection of transitional or mixed-use regions that do not fit neatly into predefined categories. This facilitates the identification of service overlaps (e.g., areas covered by both health and education facilities), which can guide infrastructure investments or reallocation of resources.
The inclusion of PSO ensures that the clustering process remains robust despite fluctuations in data density or structure—critical in environments where new data points (e.g., newly built hospitals or schools) are continuously added. The fuzzy logic component further supports nuanced cluster interpretation, enabling policy stakeholders to consider uncertainty and overlapping jurisdictions in their decision-making process.
GIS-based visualization enhances the interpretability of clustering results by non-technical stakeholders. For example, city officials can easily identify underserved neighborhoods, while urban designers can simulate the effects of new service placements. As cities move towards more data-driven governance models, the ability to adaptively cluster and interpret multi-source urban data will become increasingly important [8].
6. Conclusions
This research presents an Adaptive Fuzzy-PSO DBSCAN framework tailored for intelligent urban data analysis, addressing the core limitations of traditional DBSCAN algorithms—namely, parameter sensitivity and binary cluster assignment. The integration of Z-score normalization ensures that feature scales are harmonized, making the clustering process more reliable across heterogeneous datasets.
Particle Swarm Optimization (PSO) plays a central role in parameter tuning by dynamically selecting optimal Eps and MinPts values. This eliminates the reliance on manual heuristics and improves clustering performance across different urban contexts. The fuzzy logic component introduces graded membership, allowing data points to belong to multiple clusters to varying degrees. This is particularly beneficial in modeling the inherently overlapping nature of urban systems.
Quantitative evaluation using silhouette scores demonstrated that the proposed method significantly outperformed the baseline DBSCAN:
- Pre-2010 dataset: 0.82 vs. 0.67
- Post-2010 dataset: 0.75 vs. 0.66
A paired t-test confirmed the statistical significance of these improvements (p < 0.05). Additionally, GIS-based visualization affirmed the spatial coherence and interpretability of the fuzzy clusters.
Future research directions include real-time implementation for streaming urban data, integration with Internet of Things (IoT) networks for sensor-driven clustering, and the application of alternative metaheuristic optimizers such as genetic algorithms or Ant Colony Optimization. Furthermore, the extension to multi-view and dynamic clustering models could enhance scalability for large-scale, time-variant smart city data systems.
References
- G. Schoier and G. Borruso. A Clustering Method for Large Spatial Databases. in Computational Science and Its Applications – ICCSA 2004, Springer, 2004, 1089–1095.
- R. R. Kumar et al. OPTCLOUD: An Optimal Cloud Service Selection Framework Using QoS Correlation Lens. Comput. Intell. Neurosci. 2022, 2022. [Google Scholar] [CrossRef]
- P. Das et al. [Retracted] Heterogeneous Network-Based Inductive Matrix Methods for Predicting Biomedical Gene Disease. Biomed. Res. Int. 2023, 2023, 7121514. [Google Scholar] [CrossRef]
- S. Nasir et al. Machine Learning Approach for Solid Waste Categorization in Ethiopia. Int. J. Innov. Sci. Res. Technol. 2020, 5, 283–288. [Google Scholar]
- S. Mehammed et al. Optimizing Multi-Dimensional Data-Index Algorithms for MIC Architectures. Int. J. Eng. Technol. 2022, 7, 366–372. [Google Scholar]
- M. N. Alam et al. Efficient MAC Protocol for Wireless Sensor Nodes to Lessen Hidden and Deaf Node Problem. Int. J. Electr. Electron. Eng. Technol. 2020, 11, 28–43. [Google Scholar]
- A. Ramachandran et al. Machine Learning Algorithms for Fall Detection Using Kinematic and Heart Rate Parameters – A Comprehensive Analysis. IAES Int. J. Artif. Intell. 2020, 9, 772–780. [Google Scholar] [CrossRef]
- N. S. Al-Blihed et al. Blockchain and Machine Learning in the Internet of Things: A Review of Smart Healthcare. IAES Int. J. Artif. Intell. 2023, 12, 995–1006. [Google Scholar] [CrossRef]
- N. Seman and N. A. Razmi. Machine Learning-Based Technique for Big Data Sentiments Extraction. IAES Int. J. Artif. Intell. 2020, 9, 473–479. [Google Scholar] [CrossRef]
- E. Mathew and S. Abdulla. The LSTM Technique for Demand Forecasting of E-Procurement in the Hospitality Industry in the UAE. IAES Int. J. Artif. Intell. 2020, 9, 584–590. [Google Scholar]
- S. Kumar and A. Vidhate. Internet of Things and Blockchain Integration for Security and Privacy. IAES Int. J. Artif. Intell. 2024, 13, 4037–4044. [Google Scholar] [CrossRef]
- M. Meeradevi et al. Evaluating the Machine Learning Models Based on Natural Language Processing Tasks. IAES Int. J. Artif. Intell. 2024, 13, 1954. [Google Scholar] [CrossRef]
- E. Barzizza et al. Machine Learning-Based Decision-Making Approach for Predicting Defects Detection: A Case Study. IAES Int. J. Artif. Intell. 2024, 13, 3052–3060. [Google Scholar] [CrossRef]
- G. P. Yee et al. K-Means Clustering Analysis and Multiple Linear Regression Model on Household Income in Malaysia. IAES Int. J. Artif. Intell. 2023, 12, 731–738. [Google Scholar] [CrossRef]
- S. Masrom et al. Machine Learning of Tax Avoidance Detection Based on Hybrid Metaheuristic Algorithms. IAES Int. J. Artif. Intell. 2022, 11, 1153–1163. [Google Scholar] [CrossRef]
- D. Ienco and G. Bordogna. Fuzzy Extensions of the DBSCAN Clustering Algorithm. Soft Comput. 2018, 22, 1719–1730. [Google Scholar] [CrossRef]
- H.-P. Kriegel and M. Pfeifle. Density-Based Clustering of Uncertain Data. in Proc. 11th ACM SIGKDD Int. Conf. Knowl. Disc. Data Min. (KDD) 2005, 672–677.
- E. N. Nasibov and G. Ulutagay. Robustness of Density-Based Clustering Methods with Various Neighborhood Relations. Fuzzy Sets Syst. 2009, 160, 3601–3615. [Google Scholar] [CrossRef]
- C. Guan et al. Particle Swarm Optimized Density-Based Clustering and Classification: Supervised and Unsupervised Learning Approaches. Swarm EComput. 2019, 44, 876–896. [Google Scholar]
- M. Ester et al. A Density-Based Algorithm for Discovering Clusters in Large Spatial Databases with Noise. in Proc. 2nd Int. Conf. Knowl. Disc. Data Min. (KDD) 1996, 226–231.
- M. N. Alam and Y.-C. Kim. Efficient MAC Protocol for Hybrid Wireless Network with Heterogeneous Sensor Nodes. J. Sensors 2016, 2016, 7951965. [Google Scholar]
- M. N. Alam et al. Neighbor Initiated Approach for Avoiding Deaf and Hidden Node Problems in Directional MAC for Ad Hoc Networks. Wireless Netw. 2013, 19, 587–602. [Google Scholar]
- M. N. Alam et al. A Mechanism to Improve Spatiality in Directional MAC for Wireless Ad-Hoc Networks. in Proc. ICUFN 2013, 2013, 661–666.
- P. Khan et al. Performance Analysis of WBAN MAC Protocol under Different Access Periods. Int. J. Distrib. Sens. Networks 2015, 2015. [Google Scholar]
- R. Cheng et al. Evaluating Probabilistic Queries Over Imprecise Data. in Proc. ACM SIGMOD Int. Conf. Manage. Data 2003, 551–562.
- K. Aitdaraou et al. A Fuzzy Observer Synthesis to State and Fault Estimation for Takagi–Sugeno Implicit Systems. IAES Int. J. Artif. Intell. 2023, 12, 241. [Google Scholar] [CrossRef]
- R. F. Ningrum et al. Fuzzy Mamdani Logic Inference Model in the Loading of Distribution Substation Transformer SCADA System. IAES Int. J. Artif. Intell. 2021, 10, 298–305. [Google Scholar] [CrossRef]
- A. M. Abdu et al. Machine Learning for Plant Disease Detection: An Investigative Comparison Between SVM and Deep Learning. IAES Int. J. Artif. Intell. 2020, 9, 670–683. [Google Scholar] [CrossRef]
- A. A. Ojugo and D. O. Otakore. Intelligent Cluster Connectionist Recommender System Using Implicit Graph Friendship Algorithm for Social Networks. IAES Int. J. Artif. Intell. 2020, 9, 497–506. [Google Scholar] [CrossRef]
- T. Mohd et al. Machine Learning Building Price Prediction with Green Building Determinant. IAES Int. J. Artif. Intell. 2020, 9, 379–386. [Google Scholar] [CrossRef]
- D. Srinivas and E. V. Prasad. Adaptive density-based localization algorithm using particle swarm optimization and DBSCAN clustering approach. Int. J. Comput. Appl., 2021. [Online]. Available: https://search.proquest.com/openview/b82378649d6d60e7a55b347211baf3a0.
- H. El-Zeheiry, M. Elmogy, and N. Elaraby. Fuzzy C-mean and density-based spatial clustering for internet of things data processing. in Medical Big Data and Internet of Medical Things: Advances, Challenges, and Applications, CRC Press, 2018. [Online]. Available: https://www.taylorfrancis.com/chapters/edit/10.1201/9781351030380-7.
- R. M. Devadas, V. Hiremani, and R. V. Bidwe. Hybrid Clustering With Quantum Particle Swarm Optimization Initialization for Fuzzy C-Means and DBSCAN. IEEE, 2024. [Online]. Available: https://ieeexplore.ieee.org/abstract/document/10690825.
- M. H. Rad and M. Abdolrazzagh-Nezhad. A fuzzy-based hybrid density-based clustering with Earthworm Optimization for data cube clustering. Soft Comput. 2020, 24. [Online]. Available: https://link.springer.com/article/10.1007/s00500-020-04881-0.
- U. Kazemi and S. Soleimani. A flexible game-theoretic adjustable DBSCAN (GTAD): A new approach for urban big data clustering. Soft Comput. 2025. [Online]. Available: https://link.springer.com/article/10.1007/s00500-025-10405-5.
- M. Chaudhry, I. Shafi, M. Mahnoor, and D. L. R. Vargas. Fuzzy, density-based, and metaheuristic clustering: A systematic literature review. Symmetry 2023, 15, 1679, [Online]. Available: https://www.mdpi.com/2073-8994/15/9/1679. [Google Scholar]
- A. Kousis and C. Tjortjis. Data mining algorithms for smart cities: A bibliometric analysis. Algorithms 2021, 14, 242, [Online]. Available: https://www.mdpi.com/1999-4893/14/8/242. [Google Scholar] [CrossRef]
Figure 1.
DBSCAN vs PSO-DBSCAN. Figure 1 GIS-based clustering comparison: (a) Standard DBSCAN; (b) Proposed Fuzzy PSO-DBSCAN. The proposed method demonstrates higher spatial coherence and better noise handling.
Figure 1.
DBSCAN vs PSO-DBSCAN. Figure 1 GIS-based clustering comparison: (a) Standard DBSCAN; (b) Proposed Fuzzy PSO-DBSCAN. The proposed method demonstrates higher spatial coherence and better noise handling.
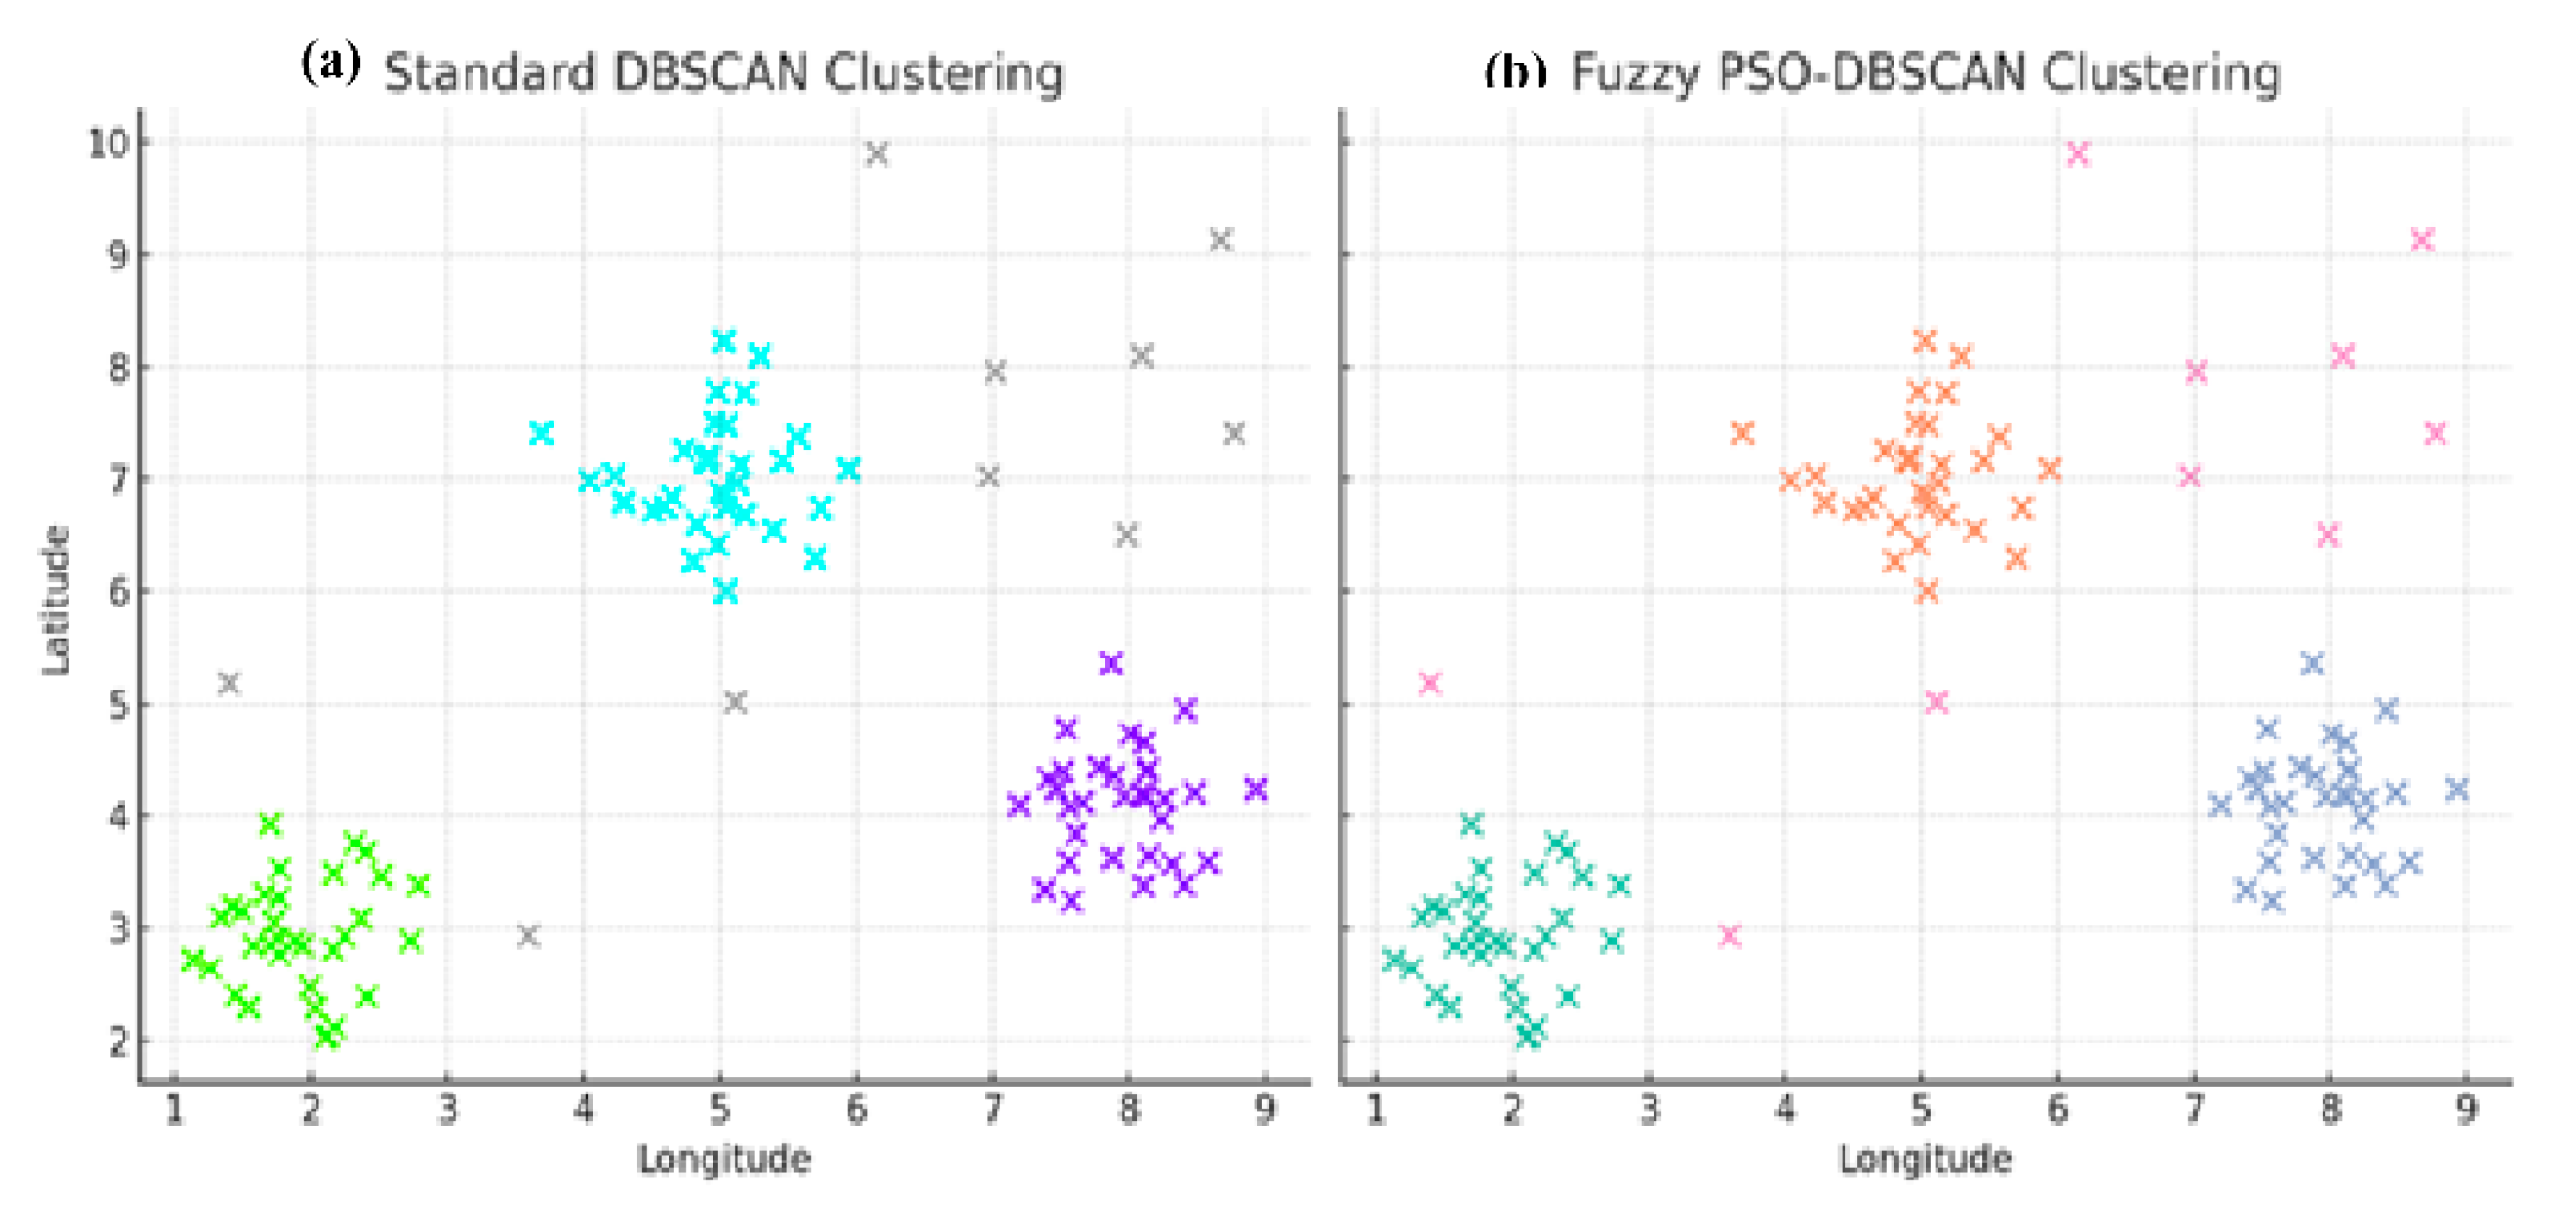
Figure 2.
Proposed system layer wise architecture.
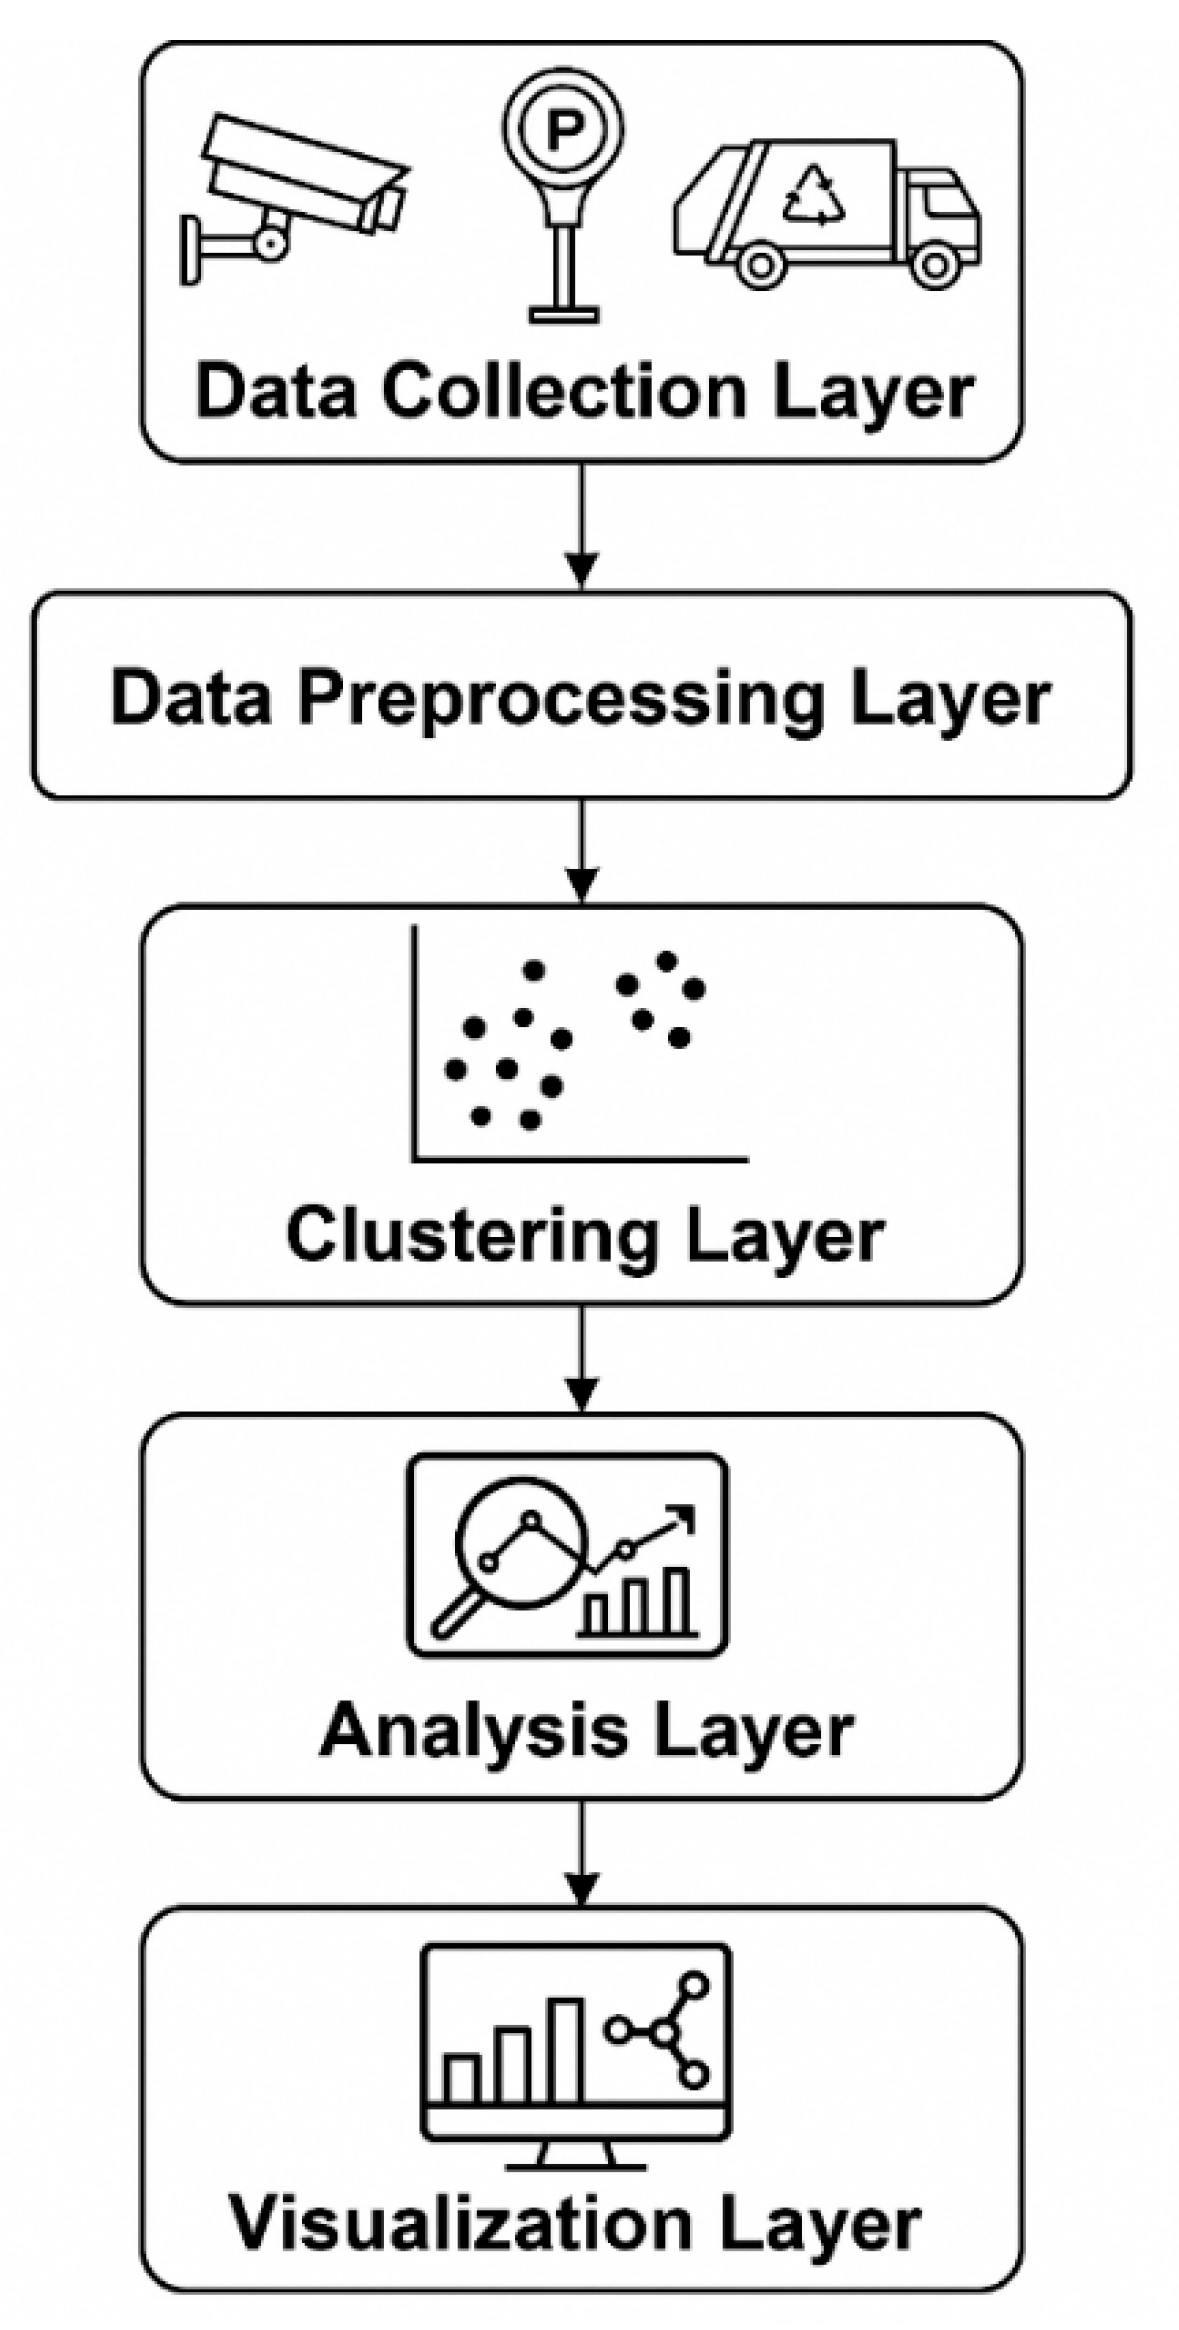

Table 1.
The results are summarized.
| Method | Pre-2010 Data | Post-2010 Data |
| Proposed Method | 0.82 | 0.75 |
| Standard DBSCAN (best) | 0.67 | 0.66 |
Disclaimer/Publisher’s Note: The statements, opinions and data contained in all publications are solely those of the individual author(s) and contributor(s) and not of MDPI and/or the editor(s). MDPI and/or the editor(s) disclaim responsibility for any injury to people or property resulting from any ideas, methods, instructions or products referred to in the content. |
© 2025 by the authors. Licensee MDPI, Basel, Switzerland. This article is an open access article distributed under the terms and conditions of the Creative Commons Attribution (CC BY) license (http://creativecommons.org/licenses/by/4.0/).
Copyright: This open access article is published under a Creative Commons CC BY 4.0 license, which permit the free download, distribution, and reuse, provided that the author and preprint are cited in any reuse.


