
Submitted:
22 May 2023
Posted:
23 May 2023
You are already at the latest version
Abstract
Finding anomalies in the real-time system is recognized as one of most challenging study in information security. It has so many applications like IoT, and Stock-Market. In any IoT system the data generated are real-time, and temporal in nature. Since due to the extreme exposure to Internet and interconnectivity of devices, the IoT systems often face issues like fraud, anomalies, intrusions etc. Discovering anomaly in such domain can be interesting. Clustering and rough set theory have been tried in many cases. Considering the time-stamp associated with IoT data, time-dependent patterns like periodic clusters can be generated which could be helpful for the efficient detection of anomalies by providing more in-depth analysis of the system. In this paper, a mixed method comprising of nano topology, a modified k-means clustering and an interval superimposition technique is used for finding fuzzy periodic clusters in the subspace generated by the nano topology. For every clusters there will be an associated sequence of time-intervals where it exists. The sequence time-intervals accompanying with each clusters may exhibit some remarkable patterns. For example, there may exist different types of periodicity namely yearly, monthly, daily, and hourly etc. For finding such fuzzy periodicity, an operation called interval-superimposition has been used. The time-intervals associated with each cluster are superimposed if they have reasonable overlapping. Each superimposed time-interval generates a fuzzy time-interval. The data instances are thought to be anomalous if they either belong to sparse clusters or don't belong to any clusters. The efficacy of the method can be assessed by means of both time-complexity analysis and comparative studies with existing clustering-based anomaly detection algorithms with a real-life and a synthetic dataset. It can been found experimentally that our method can extract anomaly with 98% of accuracy and it runs cubic time approximately.
Keywords:
Anomaly detection
; Information system
; High-dimensional data
; Dominance relation
; CORE of attribute set
; Distance function
; k-means algorithm
1. Introduction
Over the previous few years Internet of Things (IoT) networks have brought significant changes in the individual life, society and industry [1,2]. The IoT devices consists of huge number of sensors generating data over time [3] and as a result, the availability of streaming, time-series data is expanding exponentially. However, with the involvement of wide range of information and communication technology, IoT networks are exposed various security threats [4,5]. In other words, for an IoT system or the system that relies on it, there is a huge security and privacy challenges [6,7]. The challenges are in the form anomaly, fraud, intrusion or any other illegitimate activities that jeopardise the integrity of the system [8]. Although the IoT system can be reasonably protected by the defence mechanisms currently in place, malicious attackers are becoming more adept at breaking into networks. Again in the event inside attack it is more challenging to be prevented real-time. Therefore, identifying anomalies in such a system can provide actionable information in dire situations for which there are no trustworthy solutions [9,10,11,12,13,14,15,16,17,18]. Here, a new and reliable clustering-based method is put forth to address the problem.
Unsupervised learning techniques like clustering [19] are widely used to determine the distribution of data and patterns. It has recently been employed in anomaly detection as well as other branches like psychology and social science, where it has long been used extensively [20,21]. Static clustering and dynamic clustering are the two primary categories of clustering techniques. Static clustering primarily targets static datasets that are prepared before the algorithm is applied. Dynamic clustering is necessary in some applications using real-time data, such as cloud computing, IoT, finance, and stock markets. A hierarchical approach that may be applied to both static and dynamic datasets was proposed by the authors in [22]. Several incremental clustering algorithms were put forth by the authors in [23] in order to process new records or data instances as and when they are added.
There are mainly two problems encounter while dealing with anomalies in any real-time system like IoT, namely, the high-dimensionality of the data and the real-time detection of anomaly. Anomalies are often hard to find at high dimensionality. For that reason, more data are necessary to properly generalise as the number of attributes or features rises, data sparsity results. Data sparsity is brought on by these additional attributes or a sizable amount of noise from several irrelevant attributes that obscure the real anomalies. The term "curse of dimensionality" [24,25] is a well-known one used to describe the issue. As a result, it is discovered that numerous traditional anomaly detection methods [26,27,28] are inappropriate for high-dimensional data because they lose their effectiveness. [29] suggested a method for high-dimensional and categorical data anomaly detection. Similar works were presented in [30,31,32,33] Again, any real-time system like IoT generates real-time data. In such systems anomalies can be temporal or contextual [34] in nature, where the temporal order of the data is significant. To put it another way, a data instance can only be anomalous inside a particular temporal context, or more accurately, within a time-frame. Some of such anomalies can be periodic in nature i.e. occur after certain time-period of time. These anomalies are frequently difficult to detect. The development of an early warning system is one of the key applications of such abnormalities. In view of the above scenario, it is necessary to design an effective algorithm that locates clusters in the subspace of high-dimensional IoT data and detects anomalies in real-time.
Pawlak proposed rough set theory [35] to address the ambiguity and uncertainty that can be found in any dataset. Thivagar et al. [36,37], gave the notion of nano topological space in terms of the two approximations and generated CORE, a subset of attribute set of conditional attributes used for medical diagnosis. The same notion can be used for generating subset of high-dimensional IoT data
A comparison of five-time series anomaly detection techniques was done by the authors of [38]. Similar efforts were mentioned in [39,40,41,42,43,44,45,46,47]. The insider threat, which creates significant issues for the cyber security of industrial control systems, was addressed by the authors of [48]. A random forest-based strategy for online anomaly detection was presented by Zhao et al. [49]. In [50,51,52], the authors offered fuzzy-based approaches for real-time anomaly detection. In [53], the authors suggested a fuzzy neural network approach with the goal of identifying anomalies in significant cyberattacks. An effective real-time clustering-based anomaly detection system was described by the authors in [54].
Most of the algorithms discussed above have some limitations. For example, some are inefficient in finding anomaly from high-dimensional data and others are unable find real-time anomaly. Although there exist few algorithms [7,8,9,15,18,29,34,38,42,43] which efficiently detects the real-time anomaly, but a few actually addressed the periodicity of the real-time dataset. In real-time system the data generated continuously over a period of time which is the life-span of the dataset. Over the life-span of the dataset, there may be data instances of similar nature, occurs periodically. Considering the time attribute associated with IoT data as calendar dates (year_month_day_hour_minute_second), the periodic clusters can be generated where period of a cluster can be represented as sequence of life-spans of clusters. In other words, in such system it would be interesting to observe whether the clusters or anomalies generated are periodic nature or not. This information can be useful for prediction anomalies in any IoT system. In [55], the authors proposed a calendar-based periodic patterns from super-market datasets. With the help of an interval superimposition operation [56,57,58], the algorithm found match ratio which was then used to generate fully, partially and fuzzy [59] periodic patterns.
In this article, the problems of high-dimensionality, real-time and periodicity has been addressed efficiently and an algorithm is proposed which can generate fully periodic, partially periodic and fuzzy periodic clusters. It is named as RFPSCA. The algorithm uses notion of rough set theory and k-means clustering algorithm to generate clusters along with their sequence of life-spans then the interval superimposition is applied on life-spans to generate the periodicity of clusters. The objective of the paper is as follows:
Firstly, a dominance relation is defined on the dataset [60].
Secondly, an interval superimposition operation is defined and a match ratio in terms of interval superimposition is defined.
Finally, a new clustering-based method is proposed to generate periodic, partially periodic and fuzzy periodic clusters in the subspace of the dataset.
Thus, the RFPSCA first uses rough set theoretical approach to find a lower dimensional space by removing irrelevant attributes. Then the dynamic k-means clustering algorithm is applied on it to find the clusters along with their list of life-spans. At the end of this stage, each cluster will have a list of life-spans describing its period. Then the interval superimposition operation is applied on the list of life-spans to generate superimposed time-intervals along with its match ratio [55,56]. Match ratio will determine whether the corresponding cluster is fully periodic or partially periodic. Also, applying a nice method [56,57] on superimposed intervals fuzzy time interval can be generated. This way from each periodic (fully/partially) cluster fuzzy periodic clusters can be generated. Then, RFPSCA’s time-complexity is estimated. Lastly, a detailed comparative analysis is conducted with existing well-known clustering-based methods [9,10,19,46,54,61,62,63] using MATLAB implementation with Kitsune Network Attack [64] and KDDCUP’99 [65] datasets. The results efficaciously validate our technique.
The structure of the paper is as follows. In Section 2, it is discussed how this field has recently advanced. In Section 3, the problem definition is presented. Section 4 covers the proposal method (RFPSCA). Section 5 discusses the time-complexity. Section 6 of the paper contains the experiments, results, and analysis, and Section 7 of the paper contains the conclusions, limitations, and future directions.
2. Related Works
Since last couple of years IoT networks have become popular to upgrade substantially living standard of individual life, contributing the development of society and industry [1,2]. The IoT devices are generating data exponentially over time [3]. But, due to the involvement of Internet and other communication technology, IoT networks are always open to various security threats [4,5,6]. So, for any IoT system or the system which uses IoT devices the security and privacy challenges [7] are major cause of concern. Some of the common challenges for any IoT systems are in the form anomaly, fraud, intrusion or any other illegitimate activities that jeopardise the integrity of the system [8]. Although reasonable protection for IoT exist currently, but malicious attackers are becoming smart enough at breaking into networks. In [9], the authors proposed a hybrid algorithm using both partitioning and agglomerative hierarchical clustering for real-time anomaly detection. In [10], the author used a merge function in k-means algorithm to generate anomalies from mixed attribute-dataset. In [11], the authors put forwarded an agglomerative hierarchical model for the detection anomaly in network dataset. [12] built a rough set-based classification model for anomaly detection Applying automatic labelling for supervised learning, an anomaly detection scheme was proposed in [13]. An unsupervised approach for IoT anomaly detection was presented in [14]. In [15], the authors offered an efficient algorithm for online anomaly detection using self-supervised approach. In [16], the authors used correlation laws to detect anomalies. In [17], the authors proposed a new method incorporating neural process on semi-supervised anomaly detection model. In [18], the authors proposed an online anomaly detection paradigm which satisfies two key conditions: generality and scalability.
In [19], clustering paradigm was discussed in detail. Cheng et. al. [20], proposed a unified metric defined mixed attributes to generate clusters. In [21], the authors offered an agglomerative hierarchical model for clustering periodic patterns. In [22], the authors proposed a hierarchical clustering approach for both static and dynamic datasets. The authors of [23] offered many incremental clustering techniques that could handle newly added records or data instances. There are mainly two problems encounter while dealing with anomalies in any real-time system, namely, the high-dimensionality and the real-time detection of anomaly. In [24], the authors used on-class support vector machine for effectively detecting anomaly from high-dimensional data. In [25], the authors introduced a survey on contemporary anomaly detection paradigms. Kaya et. al. [26] analysed different methodologies for the communication patterns recognition. In [27], the authors suggested an efficient scheme for detection high-dimensional anomalies. In l28] the authors addressed the high-dimensionality and proposed an unsupervised method for anomaly detection in such data. A nice algorithm for anomaly detection in high-dimensional and categorical data was proposed in [29]. Taking into account the compactness and separation clusters, a nice anomaly detection algorithm was presented in [30]. In [31], the authors offered an R-based implementation density-based clustering algorithm. In [32], the authors presented a hybrid approach consisting of semi-supervised approach for anomaly detection in high-dimensional data. In [33], the authors proposed a mixed approach consisting of rough set theory and density-based clustering algorithm for the anomaly detection in high-dimensional data. In [34], the authors addressed issue of temporality of anomaly and proposed a clustering-based system for real-time anomaly detection in streaming data.
Rough set theory as tool to deal the ambiguity and uncertainty occurring any real-system was proposed by Pawlak [35]. In [36], the authors applied the rough set theory to produce nano topology. In [37], the authors applied the notion nano topology for medical diagnosis. The same notion was used for attribute reduction high-dimensional IoT data [33]. The authors carried out comparative analyses of five-time series anomaly detection methods in [38]. Alghawli [39], proposed an efficient algorithm for detection abnormal telecommunication traffic. In [40], the authors offered an anomaly detection model based on data mining approach. In [41,42,43], the authors carried out a widespread survey on anomaly detection appraoches for high-dimensional big data. Halstead et. al. [44], proposed a method using diverse meta-features for identifying recurring concept drift in data streams. In [45], the authors put forwarded a classification two-layered model for the online anomaly detection of highly unreliable data. In [46], the authors presented a scheme for online detection of anomaly in data stream. In [47], the authors proposed to evaluate cyber-risk for operation technology system. In [48], the authors discussed insider threat, which creates significant issues for the cyber security of industrial control systems. Zhao et al. [49] presented an online anomaly detection model based on random forest method. Izakian et. al. [50], proposed to introduce fuzzy in anomaly detection by proposing a fuzzy c-means-based technique. Similar works were reported in [51,52]. Souza et. al. [53], presented a fuzzy neural network-based approach for detecting anomalies in massive cyberattacks. In [54], the authors presented an effective clustering-based real-time anomaly detection system. Mahanta et. al. [55], proposed a calendar-based periodic patterns from super-market datasets. In [56], the authors used an interval operation called interval superimposition to find the solution of a fuzzy linear equation. In [58], the authors proposed a lemma call Glivenko-Cantelli lemma. Using the lemma on superimposed intervals [56], fuzzy interval [57,59] can be generated. In [60], the authors proposed a dominance relation on conditional attributes to generate set-valued ordered information systems.
3. Problem Definitions
In below, we present some important terms and definitions used in this paper.
Definition 3.1
Quadruple S=(U, A, V, f), where U is a non-empty finite set of objects, A is a finite set of attributes, V=∪Va, Va being domain of the attribute a∈A defines a set-valued information system [60]. A function f:U×A→P(V) is defined as ∀ x∈U, a∈A, 1 ≤ f(x, a)∈ Va. Also we take, the attribute set A={C∪{d}; C∩{d}=φ; C, the set of conditional and d the decision attributes}.
Definition 3.2
Definition 3.3
The attribute is an inclusion criterion if the values of some objects in U under a conditional attribute can be sorted according to inclusion increasing or decreasing preferences [60].
Definition 3.4
Let us assume a set-valued ordered information system having inclusion increasing preference. Also let us define a relation [60] as
is said to be the dominance relation on U. Whenthen, that means y is at least as good as x with reference to A.
Property 1
The inclusion dominance relation
[60] is i) reflexive, ii) unsymmetric, and iii) transitive.
Definition 3.5
Remark 1
is never be a partition of U, rather creates a covering of U, that is U=∪ .
Definition 3.6
Definition 3.7
Definition 3.9
Definition 3.10
Consider an information systemS=(U, A, V, f) consisting of m entities or objects x1, x2,...xm. Let the attribute set A has n members. Then, S is expressed as an m×n matrix with rows as objects and columns as attributes. Attributes can be designated as dimensions.
Definition 3.11
Let us consider ai=(ai1, ai2,…ain) as the ai’s numeric attribute, then the distance d(ai, Cj) between ai; i=1,2,..n and cluster Cj; j=1,2,…k is defined as follows.
where cj is the Cj,’s centroid and d(xa, Cj)∈[0, 1].
Definition 3.12
Support and core of a fuzzy set.
The support of a fuzzy set A in X is the crisp set containing every element of X with membership grades greater than zero in A and is notified by S(A) = {x ∈ X; μA(x) > 0}, whereas the core of A in X is the crisp set containing every element of X with membership grades 1 in A [see e.g., [59]]. Obviously core [t1, t2] = [t1, t2], since a closed interval [t1, t2] is an equi-fuzzy interval with membership 1 [see e.g., [56,57,59]].
Definition 3.13
Set Superimposition.
Set superimposition (S), an operation, was proposed in [56] as follows;
where (A1 − A2)(1/2)) and (A2 − A1)(1/2) are fuzzy sets [57,59] with constant membership value (1/2), and (+) signifies union of disjoint sets. To elaborate it, let A1 = [s1, t1] and A2 = [s2, t2] are two real intervals such that A1∩A2 ≠ ϕ, we will get a superimposed part. When two intervals are superimposed, each interval contributes a half of its value to the superimposed interval, so from Equation (7) we obtain
where s(1) = min(s1, s2), s(2) = max(s1, s2), t(1) = min(t1, t2), and t(2) = max(t1, t2).The superimposition process is presented using Figure 1, Figure 2 and Figure 3 below.
A1 (S) A2 = (A1 − A2)(1/2) (+) (A1∩ A2)(1) (+)(A2 − A1)(1/2)
[s1, t1](S)[s2, t2] = [s(1),t(2)](1/2) (+) [s(2),t(1)](1) (+) (s(1),t(2)](1/2)
Similarly, three intervals [s1, t1], [s2, t2], and [s3, t3], (with non-empty intersection) are superimposed to get the following expression.
[s1, t1](S)[s2, t2](S)[s3,t3]=[s(1),s(2)](1/3) (+)[s(2),s(3)](2/3) (+) [s(3),t(1)](1)(+) [t(1),t(2)](2/3) (+)[t(2),t(3)](1/3)
where the sequence {s(i); i = 1, 2, 3} arranged from {si; i = 1, 2, 3} in increasing order of magnitude and {t(i); i = 1, 2, 3} is also arranged from {ti; i = 1, 2, 3} in the similar fashion.
Let [si ,ti], i = 1,2,…,n, be n real intervals with ≠ ϕ .Using generalization (9) gives as follows.
[s1, t1](S) [s2, t2](S) ... (S)[sn, tn] = [s(1), s(2)] (1/n) (+) [s(2), s(3)](2/n) (+) ... (+) [s(r), s(r+1)](r/n) (+) ... (+) [s(n),t(1)](1)(+)[t(1),t(2)]((n−1)/n)(+)...(+)[t(n-r),t(n-r+1)](r/n)(+)...(+)[t(n-2),t(n-1)](2/n)(+)[t(n-1),t(n)](1/n)
In (10), the sequence {s(i)} is organized from {si} in increasing order of magnitude for i = 1,2,… n and similarly {t(i)} is also organized from {ti} in increasing order of magnitude [57]. It is to be noted here that the membership functions are the mixture of empirical probability distribution function and complementary probability distribution function given as follows
And
The membership function of the fuzzy interval [57,59] will be provided to us by Equations (11) and (12), which together use the Glivenko-Cantelli Lemma of order statistics [58].
Definition 3.14
Match ratio
If n be the number of periods in the life-span of dataset (no. of years/months/days etc.) and m be the number of time-intervals in the list of life-spans of any cluster, then m/n is called match ratio. Obviously, 0 ≤ m/n ≤ 1. For m/n< 1, the corresponding cluster is partially periodic and for m/nv=1, fully periodic.
4. Proposed Algorithm
For detecting anomalies, a partitioning subspace clustering approach is employed. The method first uses rough set theoretic approach for attribute or dimension reduction and then uses dynamic k-means clustering approach for finding clusters along with their life-spans. Each cluster will have a sequence of time intervals representing its life-spans. Then, interval superimposition-based approach is employed to find the periodic clusters along with the noises. The propose method is as follows. Here the dataset S=(U, A) is an information system consisting of both conditional attributes and decision attributes. First of all, the data pre-processing techniques is employed to convert the information system as set-valued ordered information system. Then, a dominance relation is generated on the ordered information system. With reference to the dominance relation, a nano topology and its basis is generated. Then the criterion reduction process is used to generate CORE(A) as a subset of attribute set A and new information system E=(U, CORE(A)) on U is formed which is a lower dimensional space. The pseudocode of the algorithm for the criterion reduction is given below.
| Algorithm 1. Subspace Generation. |
| Input. (U, A): the information system, where the attribute set A is divided into C-conditional attributes and D-decision attributes, consisting of n objects, Output: Subspace of (U, A) Step1. Generate a dominance relation on U corresponding to C and X⊆U. Step2. Generate the nano topology and its basis Step3. for each x∈C, find and Step4. if () Step5. then drop x from C, Step6. else form criterion reduction Step7. end for Step8. generate CORE(C)=∩{criterion reductions} Step9. Generate subspace of the given information system |
The above algorithm supplies the CORE of the attribute set by removing insignificant attributes which gives us a subspace E=(U, CORE(A)) of the given information system S=(U, A). Then a dynamic k-means is applied on E. The algorithm is as follows. Following is an explanation of the algorithm: First of all, it randomly picks first k –data instances from the CORE(A) as k-clusters-centroid with associated time-stamp (time of generation) as start-time of their life-spans. For each cluster, a last-time and a list is maintained to keep last time-stamp and life-span of each cluster respectively. Initially start-time =last-time. If a data instance is added to a cluster based on how far away from the cluster centroid it is, its current time-stamp (current-time) is added to the life span to obtain an updated life span, provided that the time gap between the cluster's last-time and the data instance current-time is within a predetermined range, such as tmax. Otherwise, a new life-span will start by setting current-time as start-time and the previous life-span of the cluster will be closed with last-time as end of the life-span. The life-span of the cluster will be put to the list maintained for it if its length is more than a specified length (say tmin). The life spans of the earlier and later clusters are updated if a data instance switches from one cluster to another during the execution process. For instance, if the time stamp on the outgoing data instance is either the start-time or end-time of the preceding cluster, the life-span of the prior cluster is updated by using the next or previous cluster time-stamp. Updates are made to the cluster-centroids also. Again, the life spans of the former and later clusters will not change if the time stamp of the outgoing data instance falls within those life spans, but the cluster centroids will be modified. Similar to this, if the time stamp of a data instance migrating from one cluster to another falls outside the later cluster's life-span, the cluster-centroid is updated and the later cluster's life-span is updated as well, provided that the time gap between the two clusters is within a certain limit (tmax). The pseudocode of the algorithm is given below.
| Algorithm 2: Dynamic k-means clustering algorithm |
| Input. E: Information system consisting n objects and attribute set CORE(A) ⊆ A, tmax: the maximum time-gap of consecutive time-stamp, tmin: the minimum length of life-span. Output. Set of clusters where each cluster is associated with a sequence of time intervals as its life-spans Step1. Given d1-dimensional dataset CORE(A) Step2. Select C[i]={x[i], tp[i]}; i=1,2,..k, where x[i] be the data instances or means of clusters, tp[i] points to list of time-intervals each maintained for every cluster contains time-stamps (start-time) of x[i] and start-time = last-time initially Step3. for each incoming data instance x with current time-stamp current-time Step3. { if d(x, Cj) ≤ d(x, Ci), i ≠ j; i =1, 2,…k Step4. {Add x to Cj Step5. Update mean(Cj) Step6. if (|current-time – last-time[j]|≤ tmax) Step7. {if(last-time[j] ≤ current-time) Step8. extend life-span(Cj) by setting last-time[j] = current-time Step9. else go to Step3 Step10. } Step11. else if(|last-time[j] - start-time|≥ tmin Step12. {Add [start-time[j], last-time[j]] to tp[j] Step13. set last-time[j] = start-time[j] = current-time Step14. } Step15. } Step16. } Step17. if (assign does not occur) go to Step19 Step18 else go to Step3 Step19. Output cluster set |
Here each output cluster in the final output cluster set is having a sequence of time-intervals describing its life-span. It should be noted that only clusters with life-spans of at least tmin are provided by Algorithm 2.
For each cluster with sufficient number of time intervals as its life-spans, the following procedure is applied to find periodic clusters from the interval list. The interval superimposition operation is to keep the information about the periods. The interval superimposition is used only if the periods have overlapping or non-empty intersection. Throughout algorithm3 execution, a list of superimposed time periods is maintained. The total number of periods of any clusters is taken as n (number of Years/Months etc.). To determine whether a new crisp time-interval can be superimposed on already superimposed time-interval or not. it is checked whether the interval has non-empty intersection with the core of superimposed time interval or not (the definition of core is given in Section 3). If it has then the superimposition process is computed to get a new superimposed time interval and membership values are reconstructed accordingly. The list of superimposed time intervals is initially empty. A full pass through the time interval list of a cluster is conducted during algorithm3 execution. When it switches to a new time interval, it determines if it can be superimposed on any of the previously obtained superimposed intervals. If so, the superimposition process is performed, which updates the relevant superimposed time interval. This interval is added as a new entry to the list if it does not superimpose with any of the previously acquired superimposed time intervals (kept as a list). Finally, each superimposed time intervals is examined to determine the number of time intervals superimposed in one place and kept using a counter (m). At the beginning of superimposition process of an interval the value of m is taken as 1. If an interval is superimposed the interval, then m is updated by adding 1 to it. At the execution for a cluster the match ratio is obtained with help of m and n. If match ratio is found to be 1, the corresponding cluster is fully periodic else partially periodic. Each superimposed time intervals produces a fuzzy time interval. This way, the fuzzy periodic clusters can be obtained. The pseudocode for the process is given below.
| Algorithm 3: algorithm for finding periodic(fully/partially) and fuzzy periodic clusters. |
|
Step1. For each cluster c with list of line-spans L. Step2. initially Lc=null // Lc is the list of superimposed intervals Step3. lt = L.get() // lt points to the 1st time interval (life-span) in L Step4. Lc = append(lt) Step5. m=1 // m = number of intervals superimposed Step6. while((lt=L.get())!=null) Step7. {flag = 0 Step8. while ((lct =L.get())!=null) Step9. if (compsuperimp(lt, lct) Step10. flag =1 Step11. if (flag == 0) Step12. Lc.append(lt) } Step13. } Step14. } Step15. compsupeimp(lt, lct) Step16. if(|intersect(lct, lt)!=null)| Step17. { superimp(lct, lt) Step18. m++ Step19. return 1 Step20. } Step21 return 0 Step22. match ratio = m/n // n = number periods in the whole dataset. Step23. if (match=1) Step24. the cluster c is fully periodic Step25. else partially periodic Step26. generate fuzzy intervals from superimposed intervals to get fuzzy periodic clusters. Step27. End |
The function compsuperimp(lt, lct) initially finds the intersection between lt and the core of lct. If it is found to be non-empty, the function computes the superimposition process by reconstructing the membership values. If lt has been superimposed on lct it returns 1 else otherwise returns 0. get () and append () are functions operating on time interval lists to get a pointer to the next time interval in a list and to append a time interval into a list respectively. For each cluster, a counter (m) is also kept in order to keep track of how many time intervals are superimposed in one place. The match ratio is computed with the help of m. If the match ratio is found to be 1, the corresponding cluster is fully periodic else partially periodic. Finally, the fuzzy intervals can be generated with the help of superimposed intervals to get fuzzy periodic patterns The flowchart for the proposed method is described in Figure 4 below.
Anomalies are data instances or groups of data instances that either belong to sparse clusters or don't fit the defined life-spans. As a result, a data instance may be anomalous depending on both its generation time and its distance from clusters.
5. Complexity Analysis
For generating dominance classes and corresponding classes, the algorithm needs to compare values of all the possible pairs of objects from U in all dimensions, there can be at most |U|×|U|×|C| number of comparison. So, the computational complexity for step1 is O(n2.d), where |U|=n, and |C|=d. For generating the nano topology, the lower approximation and approximation of the set has to be generated, which takes computational time O(|X|.|U|). So the total computational cost of step1 and step2 is O(n2.d+|X|.|U|)= O(n2.d) which is the worst-case complexity. From step3 for loop starts and it runs over the at most all the attribute set. The computation of step 4 to step7 takes constant time say O(k1), where k1=constant. Therefore, the computational cost from step3 to step8 is O(k1d). Similarly, that of step9 and 10 is also constant say O(k2), where k2=constant. The overall complexity of algorithm 1 is O(n2.d + k1d+ k2)=O(n2.d). For finding complexity of Algorithm 2, the following steps are taken. Let k (≤ n) be number of clusters. The computational cost of centroid is O(n + n.k.d1) = O(n.k.d1), where d1 (≤d), is the dimension of the CORE. Also, O(2n.k) = O(n.k) is the time required compute the minimum distance and time-gap for each cluster. The cost of updating cluster-mean and life-span is O(2k). The total cost of Algorithm 2 is O(i(n.k.d1 + n.k + k)) = O(i.n.k.d1) = O(n3) as i (≤ n), the number of iterations, k ≤ n, and d1 is considerably small. The worst-case complexity of the whole method is O(n2.d + n3). For finding time-complexity of Algorithm 3, we proceed as follows. Let n1 be the size of sequence of time-intervals associated with a cluster and n2 be the average number of time-intervals superimposed. For each time-interval of a cluster, it is required to make pass through the list of superimposed time-intervals to check whether the corresponding time-interval can be superimposed on any of the available superimposed time-intervals or not. For this the intersection of the current time-interval with the core of the superimposed time-interval is computed which requires O(1) time. If the current time-interval superimposes then its boundaries are to be inserted into two sorted arrays used to keep the end points of the superimposed time-intervals (one sorted array for left end points and other for right end points). Now, searching in a sorted array requires O(log n1) time and insertion needs O(n1) time. The two end points requires O(2(log n1 + n1)) = O(n1) time. For one cluster the process requires O(n1 .p .n2) time, where p is size of the list superimposed time-intervals. But p = O(n1), and n2 = O(n1); the overall time-complexity in the worst-case is O(n13). For k clusters, the total time-complexity in worst-case is O(k .n13). Therefore, the worst-case complexity of the whole method is O((n2.d + n3) + k .n13). Also k = O(n), which gives the time-complexity as O(n2.d + n3 + n .n13) = O(n3 + n .n13), as d ≤ n, which is the time-complexity of the method in worst-case. Since the time-complexity of the method depending on n and n1, and not depending on d (dimension). It runs mostly cubic time. The algorithm looks efficient for finding anomalies in high-dimensional data
6. Experimental Analysis and Results.
In this Section the experimental studies are conducted and comparative analysis of the proposed method is performed against ten different clustering-based anomaly detection algorithms namely k-means [19], IF (Isolation Forest) [61,62], SC (Spectral Clustering) [54], HDBSCAN (hierarchical density-based spatial clustering of applications with noise) [63], ACA (Agglomerative Clustering Algorithm) [54], LOF (Local Outlier Factor) [54], SSWLOFCC (streaming sliding window local outlier factor coreset clustering algorithm) [54], PCM (Partitioning Clustering with Merging) [10], OnCAD (Online Clustering and Anomaly Detection) [46], and MCA (Mixed Clustering Algorithm) [9]. The dataset employed for the experiment is Kitsune Network Attack dataset [64] and KDDCUP’99dataset [65], collected through the UCI machine repository. The Kitsune dataset [64] is a multi-variate, sequential, time-series dataset with real and temporal attributes. It has 27,170,754 data instances and its number of attributes is 115. Whereas, KDDCUP’99 [65] is a multi-variate dataset with numeric, categorical and temporal attributes. It has 4,898,431 data instances and its number of attributes is 41.
The proposed method is implemented using MATLAB. The implementation process consists of three stages, input data pre-processing, periodic subspace clustering, and testing. First of all, the method accepts the input data converts it to set-valued matrix. The matrix representation of the dataset is the information system. Since rough set can’t deal with continuous attribute, so they are discretized at the same. The algorithm1 is then applied to find the subset of the attribute set by removing the insignificant attributes and by using the concept of dominance relation, nano topology and its basis. The algorithm1 gives subset as CORE of the attribute set. Then the algorithm2 is applied on CORE to find clusters along with the set of sequence time-intervals where each cluster is associated with a sequence time intervals describing its life-span. For, the efficient implementation, two parameters namely tmin (minimum length of a life-span = 180 minutes) and tmax (maximum time-gap between two consecutive time-stamps associated with a cluster =20 minutes) are to be specified. Then the algorithm3 is applied the clusters to generate periodic, partially periodic and fuzzy periodic clusters. The performances of the method along with afore-mentioned methods in terms of accuracies in detection rate are recorded. The details of the outcomes of the investigations are presented both in the tabular form and graphically in Table 1 and graphically in Figure 5, Figure 6, Figure 7, Figure 8, Figure 9, Figure 10 and Figure 11 respectively below.
It following observations can be drawn from the obtained results.
The k-means algorithm is reasonably good as per as the accuracy of anomaly detection is concern. However, it is sensitive to both the dataset and the dimensions. It is also sensitive to the distribution of the dataset in the plane. It cannot supply periodic clusters
The IF model is reasonably good in terms of the accuracy of the anomaly detection, however, it is efficient up to a certain dimensional dataset and beyond which its efficacy decreases rapidly. It cannot supply periodic clusters.
The SC algorithm is not good in terms of both the accuracy of anomaly detection and the execution time. It is not applicable for finding periodic clusters
The HDBSCAN is very poor both in terms both the accuracy of detection and the execution. Though it works very good in lower dimensional data, its performance decreases with respect to increment in the dimension of dataset. It is not applicable for finding periodic clusters.
The ACA is reasonably good in terms of both the accuracy of anomaly detection and the execution time, however it is very sensitive to the order of input to the algorithm. It not useful in determining periodic clusters.
The LOF algorithm is quite better in terms of both the accuracy of anomaly detection and the execution time. However, it has similar issues like k-means algorithm.
The SSWLOFCC is a better algorithm as per as real-time anomaly detection is concern. Its performance does not depend much on the size of the dataset. However, its execution increases with increment of the dimension as well as the size of the dataset. It also cannot extract periodic clusters.
The PCM is an algorithm consisting of both k-means and hierarchical agglomerative approaches. However, its performance decreases with the increase of the size of the dataset and the dimension. As its performance heavily depends on both the algorithm. It cannot be used for finding periodic clusters.
The OnCAD has a problem dimensionality. Its accuracy of the anomaly detection and the execution time fall rapidly with the increase of the data size and dimensions. It cannot find periodic clusters.
The MICA is very good as per as the accuracy of anomaly detection is concern. It has the accuracy of 98% which is quite impressive. It execution time is also reasonably good. However, it cannot be used for finding periodic clusters.
The proposed algorithm (RFPSCA) is very good as per as the accuracy of anomaly detection is concern. Its detection rate is almost same for both the datasets with different sizes and dimensions. Its accuracy of the detection rate is 98% and 98.3% for KDDCUP’99 [65] and Kitsune [64] datasets respectively. It has the ability to extract periodic clusters which others cannot. Though, its execution time is little more than that of others, the rate of increase is reasonably less. Extra time requires is the time of finding subspace and extracting periodicity. Thus, the execution time of RFPSCA depends mostly on the dataset sizes and the number of periods associated with a cluster as its life-span.
Moreover, the RFPSCA’s time-complexity is compared in contradiction of that of k-means [19], IF model [61,62], SC Algorithm [54], HDBSCAN algorithm [63], ACA Algorithm [54], LOF algorithm [54], SSWLOFCC algorithm [54], PCM algorithm [10], OnCAD algorithm [46], and MCA Algorithm [9]. The results are presented graphically in Figure 12 and Figure 13. It has been found that most of the aforesaid algorithms not only depends on dataset sizes but also on dimension of the dataset. In fact, some are inefficient in high-dimensional data and other efficacy decreases with the increase of dataset’s size and dimension. However, RFPSCA depends mostly on size of dataset and is a bit dependent on the sequence of time-intervals associated with every clusters which is negligible factor. So, RFPSCA runs mostly in cubic time.
7. Conclusions, Limitations and Lines for Future works
7.1. Conclusions.
In this article, a clustering-based method for finding IoT anomalies in a subspace is given. The method first uses, nano topology-based attribute reduction approach for finding subspace as a CORE. Then, a dynamic k-means clustering approach is employed to find k-clusters in the subspace. It is to be mentioned here that the clusters obtained by the aforesaid approach will have k-number of sequence time-intervals where each cluster is associated with a sequence describing its life-span. Then, using an interval superimposition method a match for each cluster is computed which determines whether the cluster is fully or partially period. The set of superimposed time-intervals will give fuzzy time intervals. At the end, the method supplies fuzzy periodic clusters in the subspace. Since the obtained clusters are periodic nature, they provide more detail information about the nature of the data instances. The anomalies would be mostly doubtful instances which do not belongs any of the periodic clusters. The proposed method is named as RFPSCA.
The time-complexity of the method is computed and found to be O(n3 + n .n13) in worst-case, where n = the number of instances and n1 = the maximum number of intervals associated with any cluster. Obviously n1 is very small in comparison to n. Therefore, the method runs in cubic time approximately.
For finding efficacy further, ten well-known clustering-based algorithm taken and a detailed comparative analysis is conducted against RFPSCA with two well-known datasets namely KDDCUP’99 [65] and Kitsune [64] Network anomaly detection datasets. RFPSCA is found be efficient than others for detecting anomalies in high-dimensional data. Experimentally, it has been found that that RFPSCA can extract anomaly with around 98% of accuracy.
7.2. Limitations and Future directions of work
The proposed RFPSCA has some limitations. Firstly, it is unable to deal with continuous data as since rough set is inefficient to handle continuous data. Secondly, since the method is partitioning-based approach uses k-means algorithm, it has the similar issues like k-means algorithm in finding anomalies. For example, the centroid of any cluster can be pulled by anomalies or there may be a cluster of anomalies extracted by the method which looks like normal cluster. Finally, the method cannot detect anomalies from temporal interval data.
Future works can be possible in the following lines
Method other than k-means approach can be employed for efficient IoT anomaly detection.
Effective method can be proposed to deal with continuous attributes or temporal interval dataset.
Funding
The corresponding author states that the work does not have any external funding.
Data Availability Statement
The data, code and other materials can be made available on request.
Conflicts of Interest
There is no conflict of interest or competing interests among the authors.
References
- Xu, L.D.; He, W.; Li, S. Internet of Things in Industries: A Survey. IEEE Trans. Ind. Inform. 2014, 10, 2233–2243. [Google Scholar] [CrossRef]
- Sisinni, E.; Saifullah, A.; Han, S.; Jennehag, U.; Gidlund, M. Industrial Internet of Things: Challenges, Opportunities, and Directions. IEEE Trans. Ind. Informatics 2018, 14, 4724–4734. [Google Scholar] [CrossRef]
- Sethi, P.; Sarangi, S.R. Internet of Things: Architectures, Protocols, and Applications. J. Electr. Comput. Eng. 2017, 2017, 1–25. [Google Scholar] [CrossRef]
- Papaioannou, M.; Karageorgou, M.; Mantas, G.; Sucasas, V.; Essop, I.; Rodriguez, J.; Lymberopoulos, D. A Survey on Security Threats and Countermeasures in Internet of Medical Things (IoMT). Trans. Emerg. Telecommun. Technol. 2020, 33. [Google Scholar] [CrossRef]
- Mantas, G.; Komninos, N.; Rodriguz, J.; Logota, E.; and Marques, H. Security for 5G Communications. in Fundamentals of 5G Mobile Networks. Wiley, 2015, pp. 207–220. [CrossRef]
- Zarpelão, B.B.; Miani, R.S.; Kawakani, C.T.; de Alvarenga, S.C. A survey of intrusion detection in Internet of Things. J. Netw. Comput. Appl. 2017, 84, 25–37. [Google Scholar] [CrossRef]
- Makhdoom, I.; Abolhasan, M.; Lipman, J.; Liu, R.P.; Ni, W. Anatomy of Threats to the Internet of Things. IEEE Commun. Surv. Tutorials 2018, 21, 1636–1675. [Google Scholar] [CrossRef]
- Zachos, G.; Essop, I.; Mantas, G.; Porfyrakis, K.; Ribeiro, J.C.; Rodriguez, J. Generating IoT Edge Network Datasets based on the TON_IoT Telemetry Dataset. 2021 IEEE 26th International Workshop on Computer Aided Modeling and Design of Communication Links and Networks (CAMAD). LOCATION OF CONFERENCE, PortugalDATE OF CONFERENCE; pp. 1–6.
- Mazarbhuiya, F.A.; Shenify, M. A Mixed Clustering Approach for Real-Time Anomaly Detection. Appl. Sci. 2023, 13, 4151. [Google Scholar] [CrossRef]
- Mazarbhuiya, F.A.; AlZahrani, M.Y.; Mahanta, A.K. Detecting Anomaly Using Partitioning Clustering with Merging. ICIC Express Lett. 2020, 14, 951–960. [Google Scholar]
- Mazarbhuya, F.A.; AlZahrani, M.Y.; Georgieva, L. Anomaly Detection Using Agglomerative Hierarchical Clustering Algorithm; ICISA 2018. Lecture Notes on Electrical Engineering (LNEE); Springer: Hong Kong. 2019; Volume 514, pp. 475–484.
- Mazarbhuiya, F. A. Detecting Anomaly using Neighborhood Rough Set based Classification Approach. ICIC Express Lett. 2023, 17, 73–80. [Google Scholar]
- Al Mamun, S. M. A.; Valmaki, J. Anomaly Detection and Classification in Cellular Networks Using Automatic Labeling Technique for Applying Supervised Learning. Procedia Comput. Sci. 2018, 140, 186–195. [Google Scholar] [CrossRef]
- Liu, Y.; Wang, H.; Zheng, X.; Tian, L. An Efficient Framework for Unsupervised Anomaly Detection over Edge-Assisted Internet of Things. ACM Trans. Sens. Networks 2023. [Google Scholar] [CrossRef]
- Mozaffari, M.; Doshi, K.; Yilmaz, Y. Self-Supervised Learning for Online Anomaly Detection in High-Dimensional Data Streams. Electronics 2023, 12, 1971. [Google Scholar] [CrossRef]
- Angiulli, F.; Fassetti, F.; Serrao, C. Anomaly detection with correlation laws. Data Knowl. Eng. 2023, 145. [Google Scholar] [CrossRef]
- Zhou, F.; Wang, G.; Zhang, K.; Liu, S.; Zhong, T. Semi-Supervised Anomaly Detection Via Neural Process. IEEE Trans. Knowl. Data Eng. 2023, 35, 10423–10435. [Google Scholar] [CrossRef]
- Retting, L.; Khayaati, M.; Cudre-Mauroux, P.; Piorkowski, M. Online anomaly detection over Big Data streams. In Proceedings of the 2015 IEEE International Conference on Big Data. Santa Clara, CA, USA, 29 October–1 November 2015. [Google Scholar]
- Hartigan, J.A. Hartigan Clustering Algorithms. John Wiley & Sons: 1975.
- Cheng, Y.-M.; Jia, H. A Unified Metric for Categorical and Numeric Attributes in Data Clustering. Hong Kong University Technical Report; Publisher: 2011. Available online: https://www.comp.hkbu.edu.hk/tech-report.
- Mazarbhuiya, F.A.; Abulaish, M. Clustering Periodic Patterns using Fuzzy Statistical Parameters. Int. J. Innov. Comput. Inf. Control. 2012, pp. 2113–2124.
- Gil-Garcia, R.; Badia-Contealles, J.M.; Pons-Porrata, A. Dynamic Hierarchical Compact Clustering Algorithm. In Progress in Pattern Recognition, Image Analysis and Applications. Sanfeliu, A., Cortés, M.L., Eds.; CIARP 2005, LNCS 3775; Springer: Berlin, Heidelberg; pp. 302–310.
- Hammouda, K.; Kamel, M. Efficient phrase-based document indexing for Web document clustering. IEEE Trans. Knowl. Data Eng. 2004, 16, 1279–1296. [Google Scholar] [CrossRef]
- Erfani, S.M.; Rajasegarar, S.; Karunasekera, S.; Leckie, C. High-dimensional and large-scale anomaly detection using a linear one-class SVM with deep learning. Pattern Recognit. 2016, 58, 121–134. [Google Scholar] [CrossRef]
- Hodge, V. , Austin, J. A survey of outlier detection methodologies, Artif Intell Rev vol..22(2), pp. 85–126, 2004.
- Kaya, M.-F.; Schoop, M. Analytical Comparison of Clustering Techniques for the Recognition of Communication Patterns. Group Decis. Negot. 2021, 31, 555–589. [Google Scholar] [CrossRef]
- Aggarwaal C., C.; and Philip, S. Y. An effective and efficient algorithm for high-dimensional outlier detection, VLDB J. vol. 14(2), pp. 211–221, 2005.
- Ramchandran, A.; Sangaiaah, A. K. Chapter 11 - Unsupervised Anomaly Detection for High Dimensional Data—an Exploratory Analysis, Computational Intelligence for Multimedia Big Data on the Cloud with Engineering Applications, Intelligent Data-Centric Systems, pp. 233-251, 2018.
- Retting, L.; Khayati, M.; Cudre-Maurooux, P.; Piorkowski, M. Online anomaly detection over Big Data streams. In Proceedings of the 2015 IEEE International Conference on Big Data, Santa Clara, CA, USA, 29 October–1 November 2015. [Google Scholar]
- Alguliyev, R.; Aliguliyev, R.; Sukhostat, L. Anomaly Detection in Big Data based on Clustering. Stat. Optim. Inf. Comput. 2017, 5, 325–340. [Google Scholar] [CrossRef]
- Hahsler, M.; Piekenbrock, M.; Doran, D. dbscan: Fast Density-Based Clustering with R. J. Stat. Softw. 2019, 91, 1–30. [Google Scholar] [CrossRef]
- Song, H.; Jiang, Z.; Men, A.; Yang, B. A Hybrid Semi-Supervised Anomaly Detection Model for High-Dimensional Data. Comput. Intell. Neurosci. 2017, 2017, 1–9. [Google Scholar] [CrossRef]
- Mazarbhuiya, F. A.
- Ahmed, S.; Lavin, A. ; Purdy, S; and Aghaa, Z. Unsupervised real-time anomaly detection for streaming data, Neurocomputing 262 (2017) pp. 134–147.
- Pawlak, Z. , Rough sets, International Journal of Computer and Information Sciences. vol. 11, pp. 341–356, 1982.
- Thivagar, M. L.; Richaard, C. On nano forms of weakly open sets, International Journal of Mathematics and Statistics Invention. vol. 1(1), pp. 31–37, 2013.
- Thivagar, M.L.; Priyalatha, S. Medical diagnosis in a indiscernibility matrix based on nano topology. Cogent Math. 2017, 4. [Google Scholar] [CrossRef]
- Kim, B.; Alawami, M.A.; Kim, E.; Oh, S.; Park, J.; Kim, H. A Comparative Study of Time Series Anomaly Detection Models for Industrial Control Systems. Sensors 2023, 23, 1310. [Google Scholar] [CrossRef]
- Alghawli, A.S. Complex methods detect anomalies in real time based on time series analysis. Alex. Eng. J. 2021, 61, 549–561. [Google Scholar] [CrossRef]
- Younas, M.Z. Anomaly Detection using Data Mining Techniques: A Review. Int. J. Res. Appl. Sci. Eng. Technol. 2020, 8, 568–574. [Google Scholar] [CrossRef]
- Thudumu, S.; Branch, P.; Jin, J.; Singh, J. (. A comprehensive survey of anomaly detection techniques for high dimensional big data. J. Big Data 2020, 7, 1–30. [Google Scholar] [CrossRef]
- Habeeb, R.A.A.; Nasaruddin, F.; Gani, A.; Hashem, I.A.T.; Ahmed, E.; Imran, M. Real-time big data processing for anomaly detection: A Survey. Int. J. Inf. Manag. 2018, 45, 289–307. [Google Scholar] [CrossRef]
- Wang, B.; Hua, Q.; Zhang, H.; Tan, X.; Nan, Y.; Chen, R.; Shu, X. Research on anomaly detection and real-time reliability evaluation with the log of cloud platform. Alex. Eng. J. 2022, 61, 7183–7193. [Google Scholar] [CrossRef]
- Halstead, B.; Koh, Y.S.; Riddle, P.; Pechenizkiy, M.; Bifet, A. Combining Diverse Meta-Features to Accurately Identify Recurring Concept Drift in Data Streams. ACM Trans. Knowl. Discov. Data 2023, 17, 1–36. [Google Scholar] [CrossRef]
- Zhao, Z.; Birke, R.; Han, R.; Robu, B.; Buchenak, S.; Ben Mokhtar, S.; Chen, L.Y. RAD: On-line Anomaly Detection for Highly Unreliable Data. arXiv arXiv:1911.04383. https://arxiv.org/abs/1911.04383, 2019.
- Chenaghlou, M.; Moshtghi, M.; Lekhie, C.; Salahi, M. Online Clustering for Evolving Data Streams with Online Anomaly Detection. In Advances in Knowledge Discovery and Data Mining. In Proceedings of the 22nd Pacific-Asia Conference, PAKDD 2018, Melbourne, VIC, Australia, 3–6 June 2018; pp. 508–521. [Google Scholar]
- Firoozjaei, M.D.; Mahmoudyar, N.; Baseri, Y.; Ghorbani, A.A. An evaluation framework for industrial control system cyber incidents. Int. J. Crit. Infrastruct. Prot. 2021, 36, 100487. [Google Scholar] [CrossRef]
- Chen, Q.; Zhou, M.; Cai, Z.; Su, S. Compliance Checking Based Detection of Insider Threat in Industrial Control System of Power Utilities. 2022 7th Asia Conference on Power and Electrical Engineering (ACPEE). LOCATION OF CONFERENCE, ChinaDATE OF CONFERENCE; pp. 1142–1147.
- Zhao, Z.; Mehrootra, K.G.; Mohan, C.K. Online Anomaly Detection Using Random Forest. In Recent Trends and Future Technology in Applied Intelligence; Mouhoub, M., Sadaoui, S., Ait Mohamed, O., Ali, M., Eds.; IEA/AIE 2018; Lecture Notes in Computer Science; Springer: Cham, Switzerland.
- Izakian, H.; Pedryecz, W. Anomaly detection in time series data using fuzzy c-means clustering. In Proceedings of the 2013 Joint IFSA World congress and NAFIPS Annual meeting, Edmonton, AB, Canada, 24–28 June 2013. [Google Scholar]
- Decker, L.; Leite, D.; Giommi, L.; Bonacorsi, D. Real-Time Anomaly Detection in Data Centers for Log-based Predictive Maintenance using an Evolving Fuzzy-Rule-Based Approach. arXiv, 2020; arXiv:2004.13527v1. [Google Scholar]
- Masdari, M.; Khezri, H. Towards fuzzy anomaly detection-based security: a comprehensive review. Fuzzy Optim. Decis. Mak. 2020, 20, 1–49. [Google Scholar] [CrossRef]
- de Campos Souza, P.V.; Guimarães, A.J.; Rezenede, T. S.; Silva Araujo, V. .J.; Araujo, V. S. Detection of Anomalies in Large-Scale Cyberattacks Using Fuzzy Neural Networks. AI 2020, vol. 1, pp. 92–116. https://www.mdpi.com/2673-2688/1/1/5.
- Habeeb, R.A.A.; Nasauddin, F.; Gani, A.; Hashem, I.A.T.; Amanullah, A.M.E.; Imran, M. Clustering-based real-time anomaly detection—A breakthrough in big data technologies. Spec. Issue: ‘Context Aware Mobil. Internet Things Enabling Technol. Appl. Chall. ‘Intell. Resour. Manag. Cloud Comput. Netw. 2022, vol. 33, e3647.
- Mahanta, A.K.; Mazarbhuiya, F.A.; Baruah, H.K. Finding calendar-based periodic patterns. Pattern Recognit. Lett. 2008, 29, 1274–1284. [Google Scholar] [CrossRef]
- Mazarbhuiya, F.A.; Mahanta, A.K.; Baruah, H.K. Solution of the Fuzzy Equation A + X = B Using the Method of Superimposition. Appl. Math. 2011, 02, 1039–1045. [Google Scholar] [CrossRef]
- Zadeh, L. Fuzzy sets as a basis for a theory of possibility. Fuzzy Sets Syst. 1978, 1, 3–28. [Google Scholar] [CrossRef]
- Loeve, M. Probability Theory. Springer Verlag: New York, NY, USA, 1977.
- Klir, J.; and Yuan, B. Fuzzy Sets and Logic Theory and Application. Prentice Hill Pvt. Ltd.: 2002, New Jersey USA.
- Qiana, Y.; Dang, C.; Liaanga, J.; and Tangc, D. Set-valued ordered information systems Information Sciences. Vol. 179, pp. 2809-2832, 2009.
- Stripling, E.; Baesens, B.; Chizi, B.; Broucke, S.V. Isolation-based conditional anomaly detection on mixed-attribute data to uncover workers' compensation fraud. Decis. Support Syst. 2018, 111, 13–26. [Google Scholar] [CrossRef]
- Ding, Z.; Fei, M. An Anomaly Detection Approach Based on Isolation Forest Algorithm for Streaming Data using Sliding Window. IFAC Proc. Vol. 2013, 46, 12–17. [Google Scholar] [CrossRef]
- Abdullah, J.; and Chandran, N. Hierarchical Density-based Clustering of Malware Behaviour. Journal of Telecommunication, Electronic and Computer Engineering (JTEC), 2017. 9(2-10): p. 159-164.
- Kitsune Network Attack Dataset, Available online: https://github.com/ymirsky/Kitsune-py.
- UCI KDD Archive KDD Cup 1999 Data. Available online: http://kdd.ics.uci.edu/databases/kddcup99/kddcup99.html (accessed on Ocotber 2007).
Figure 1.
Interval [1, 4].
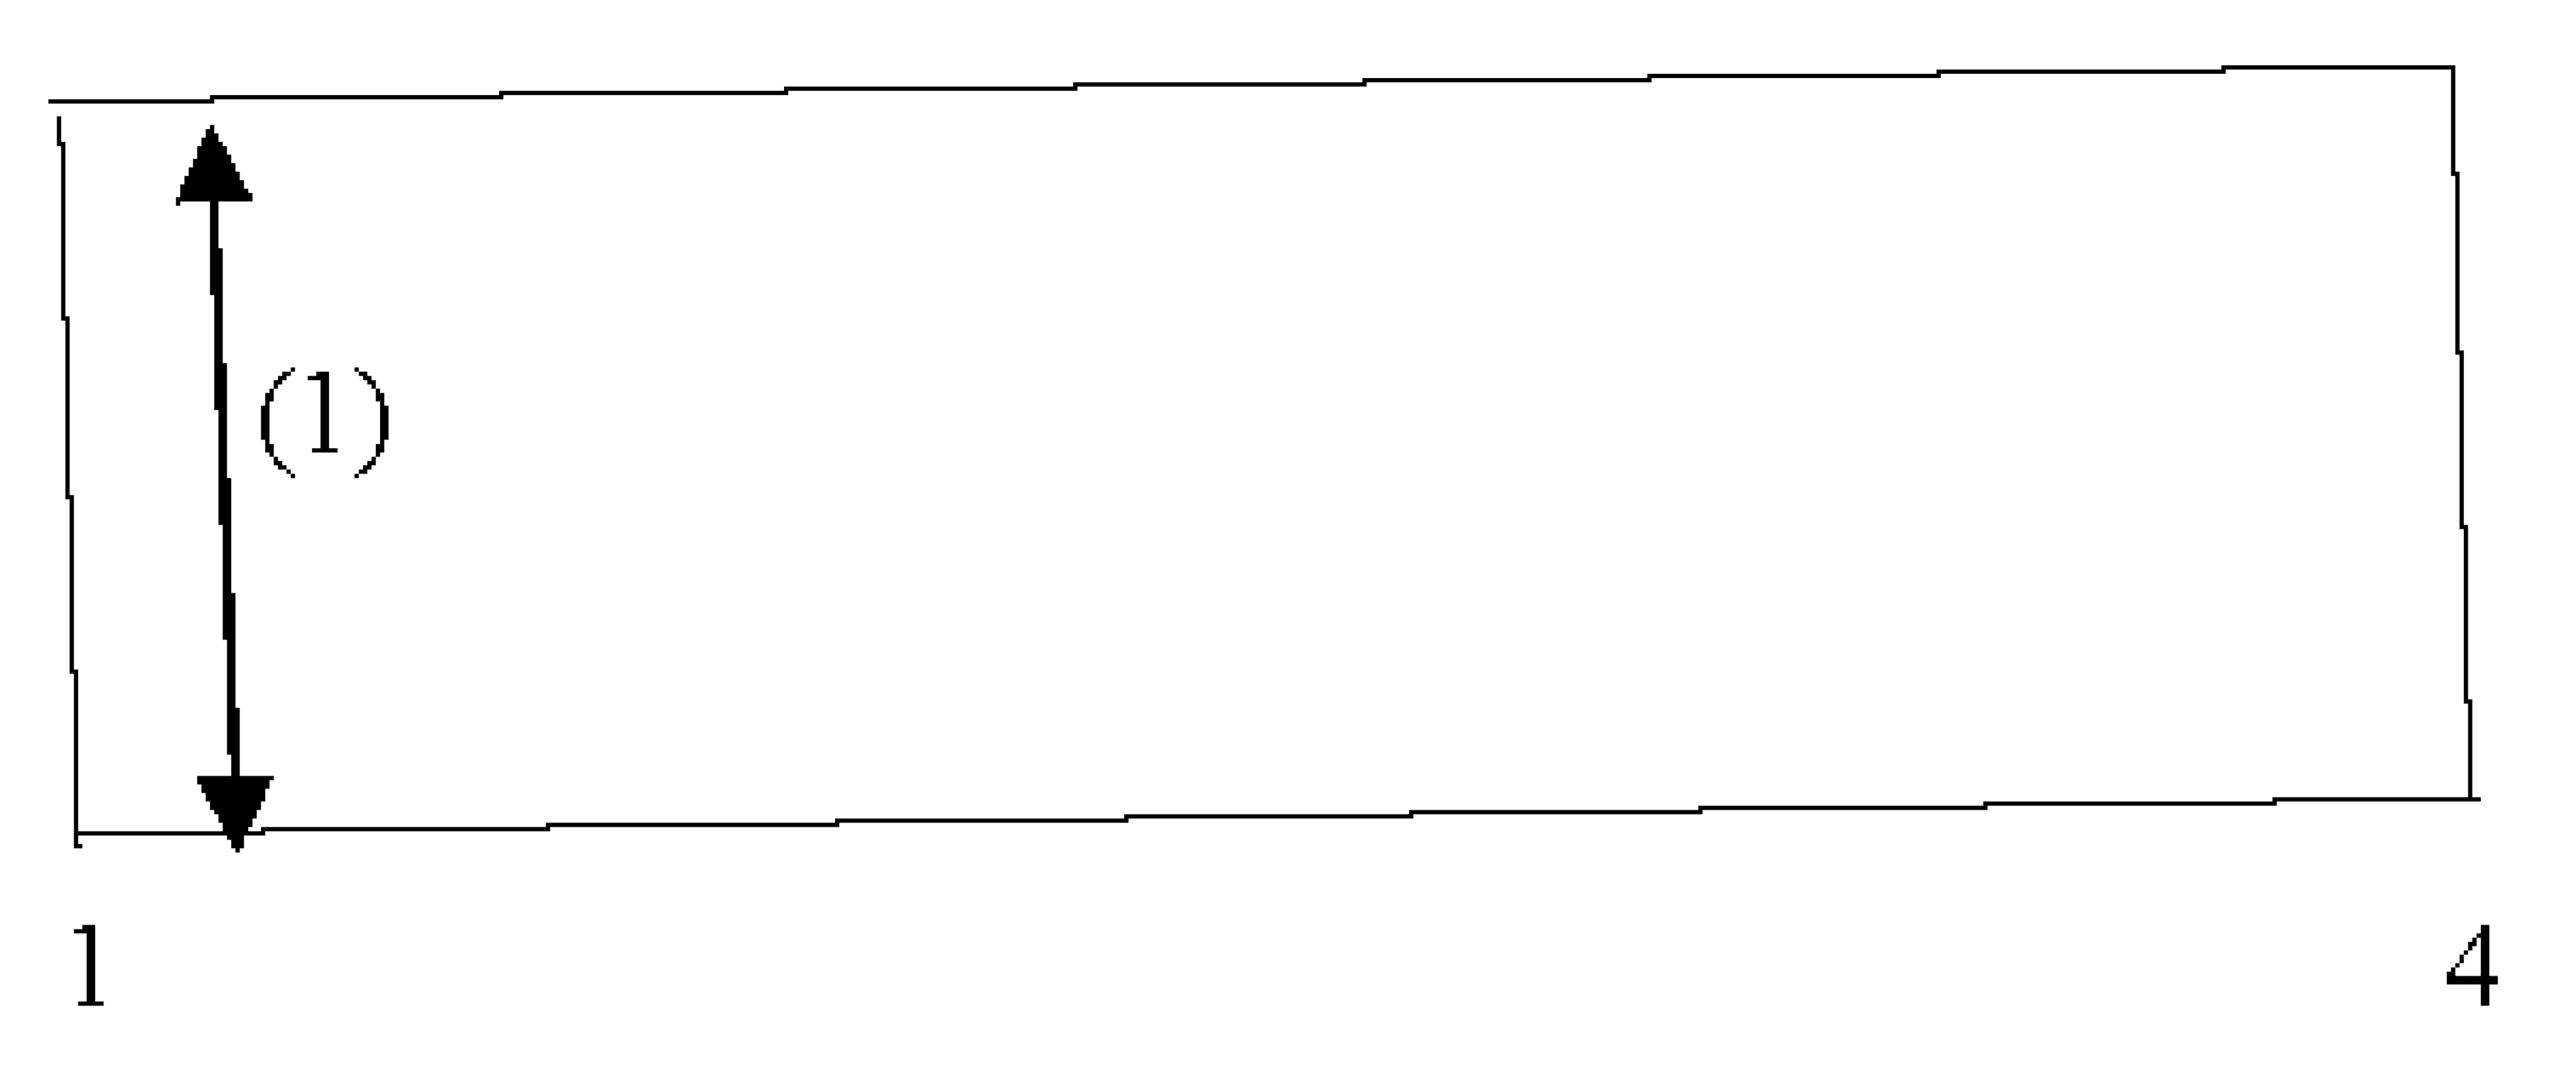
Figure 2.
Interval [3, 6].
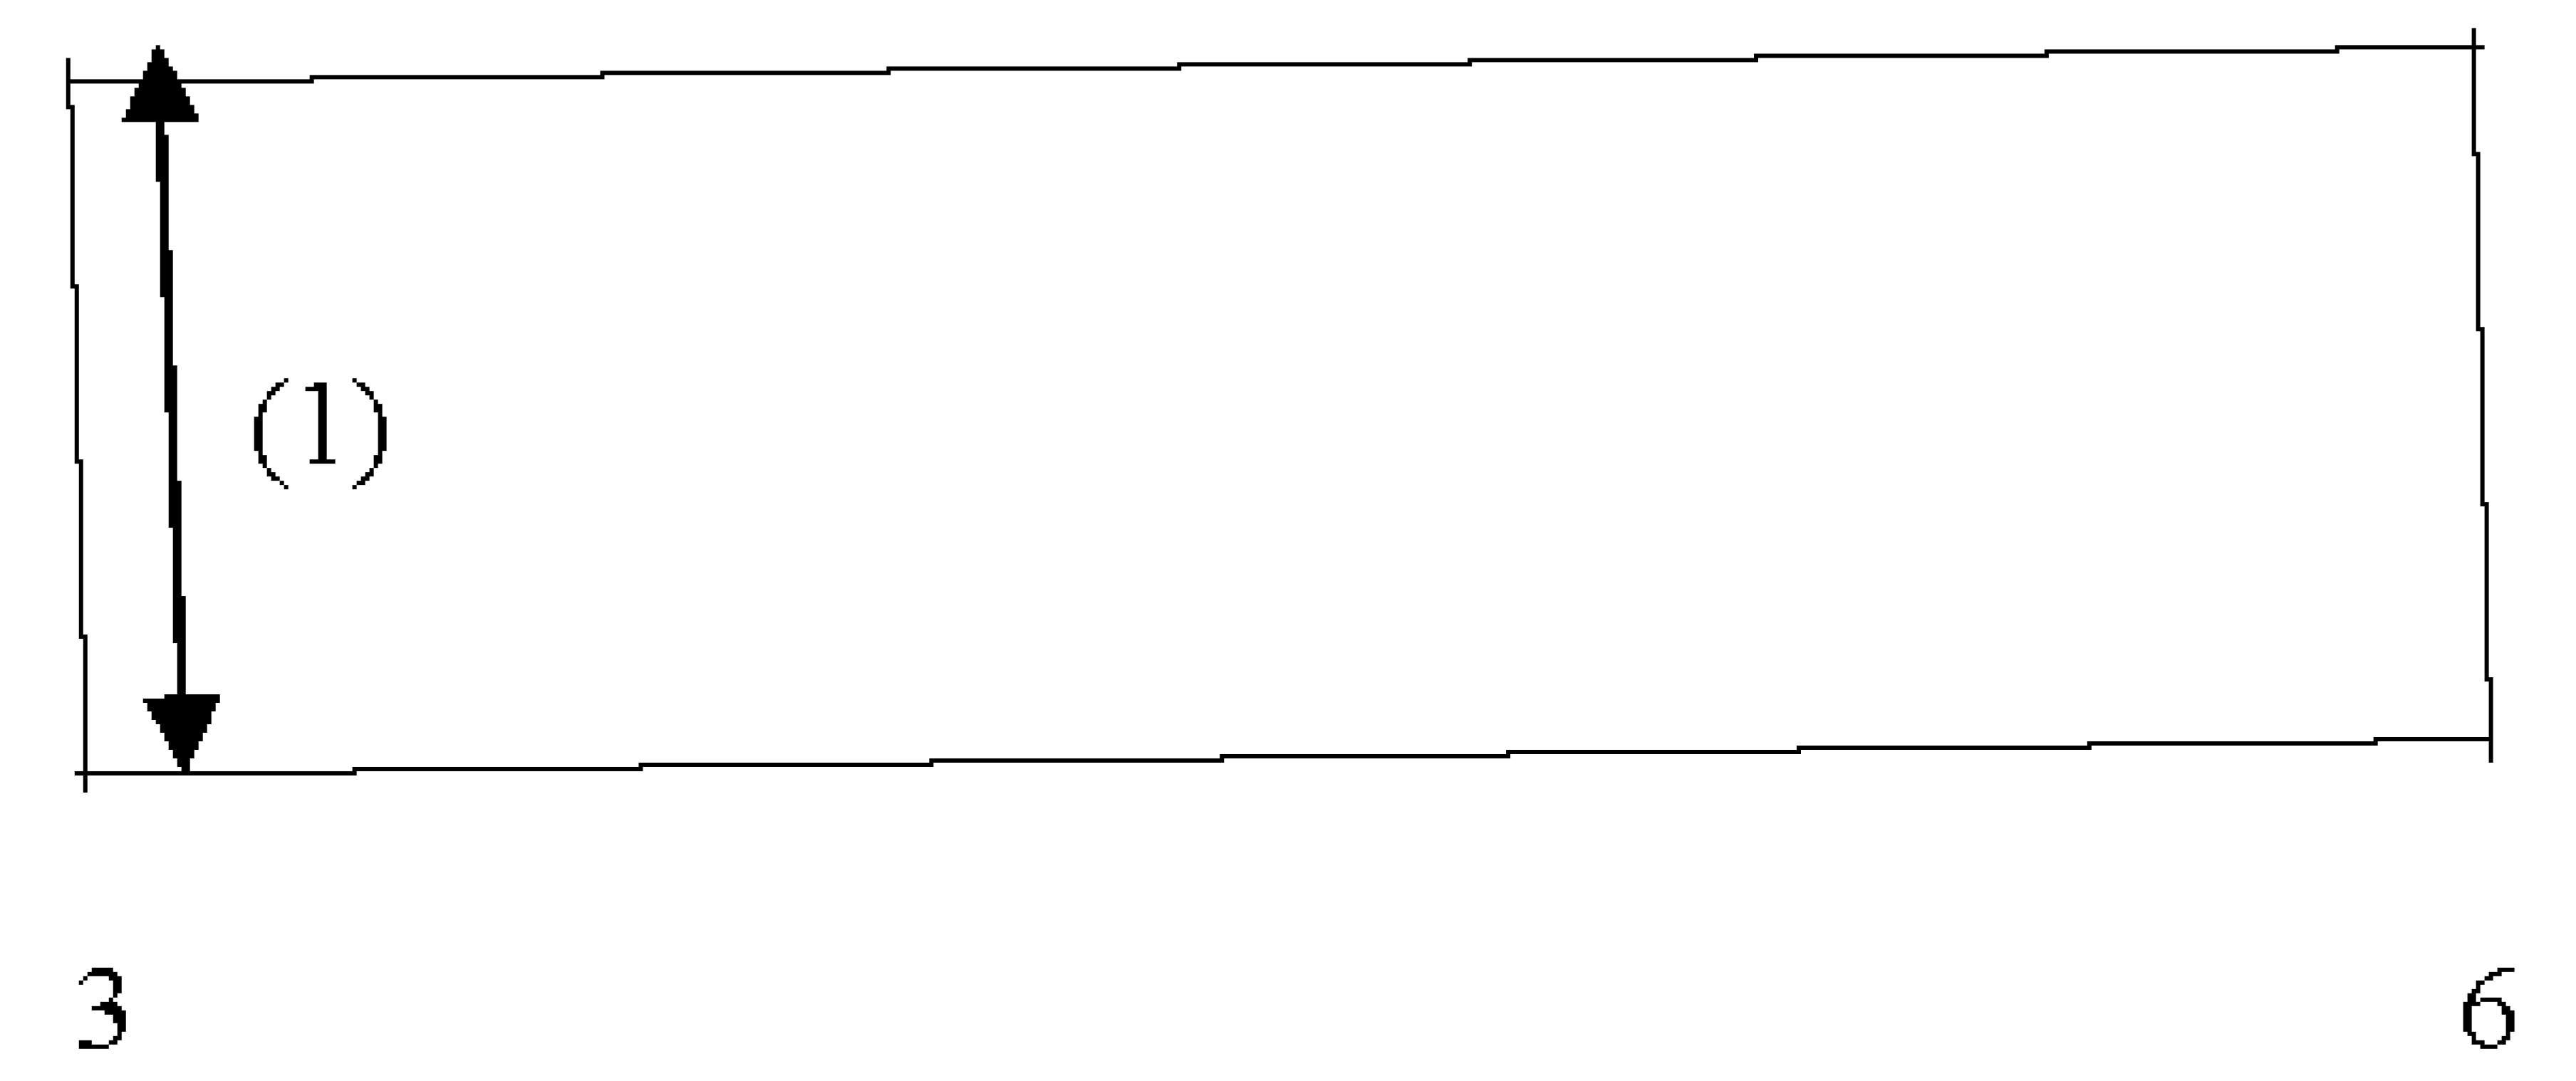
Figure 3.
Superimposed interval [1, 3](1/2) + [3, 4](1) + [4, 6](1/2).
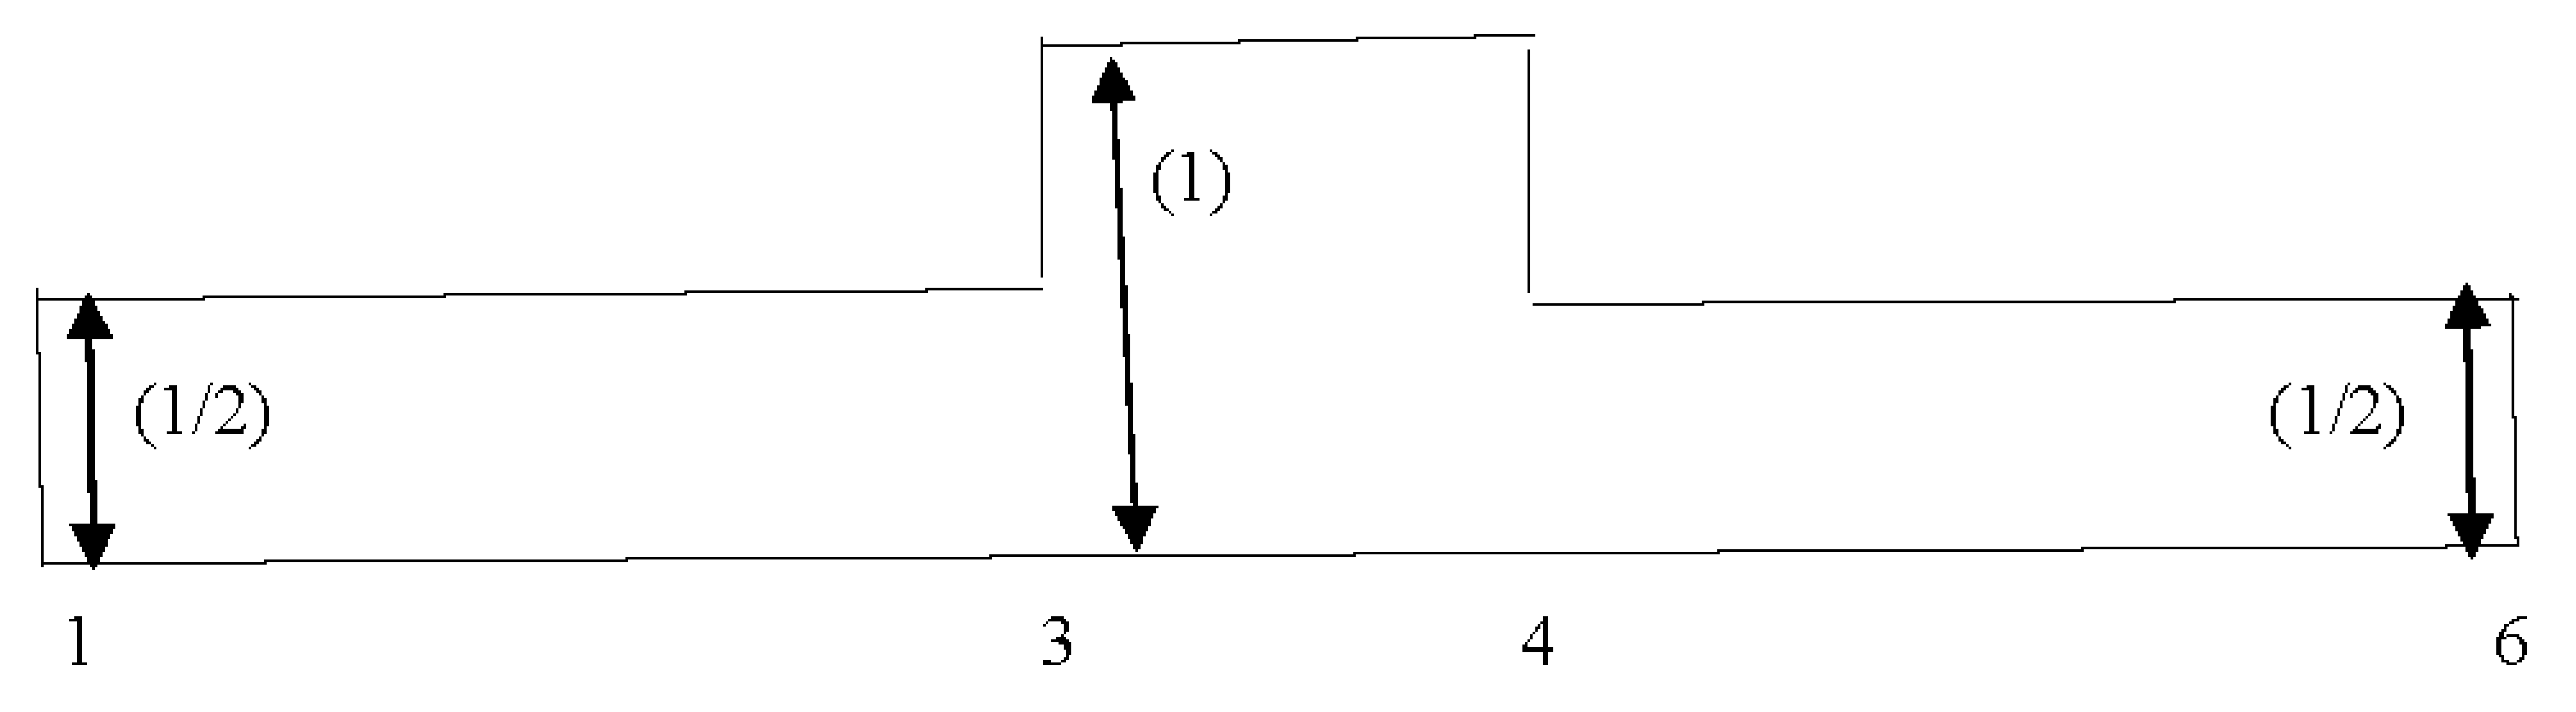
Figure 4.
Flowchart of the proposed method (RFPSCA).
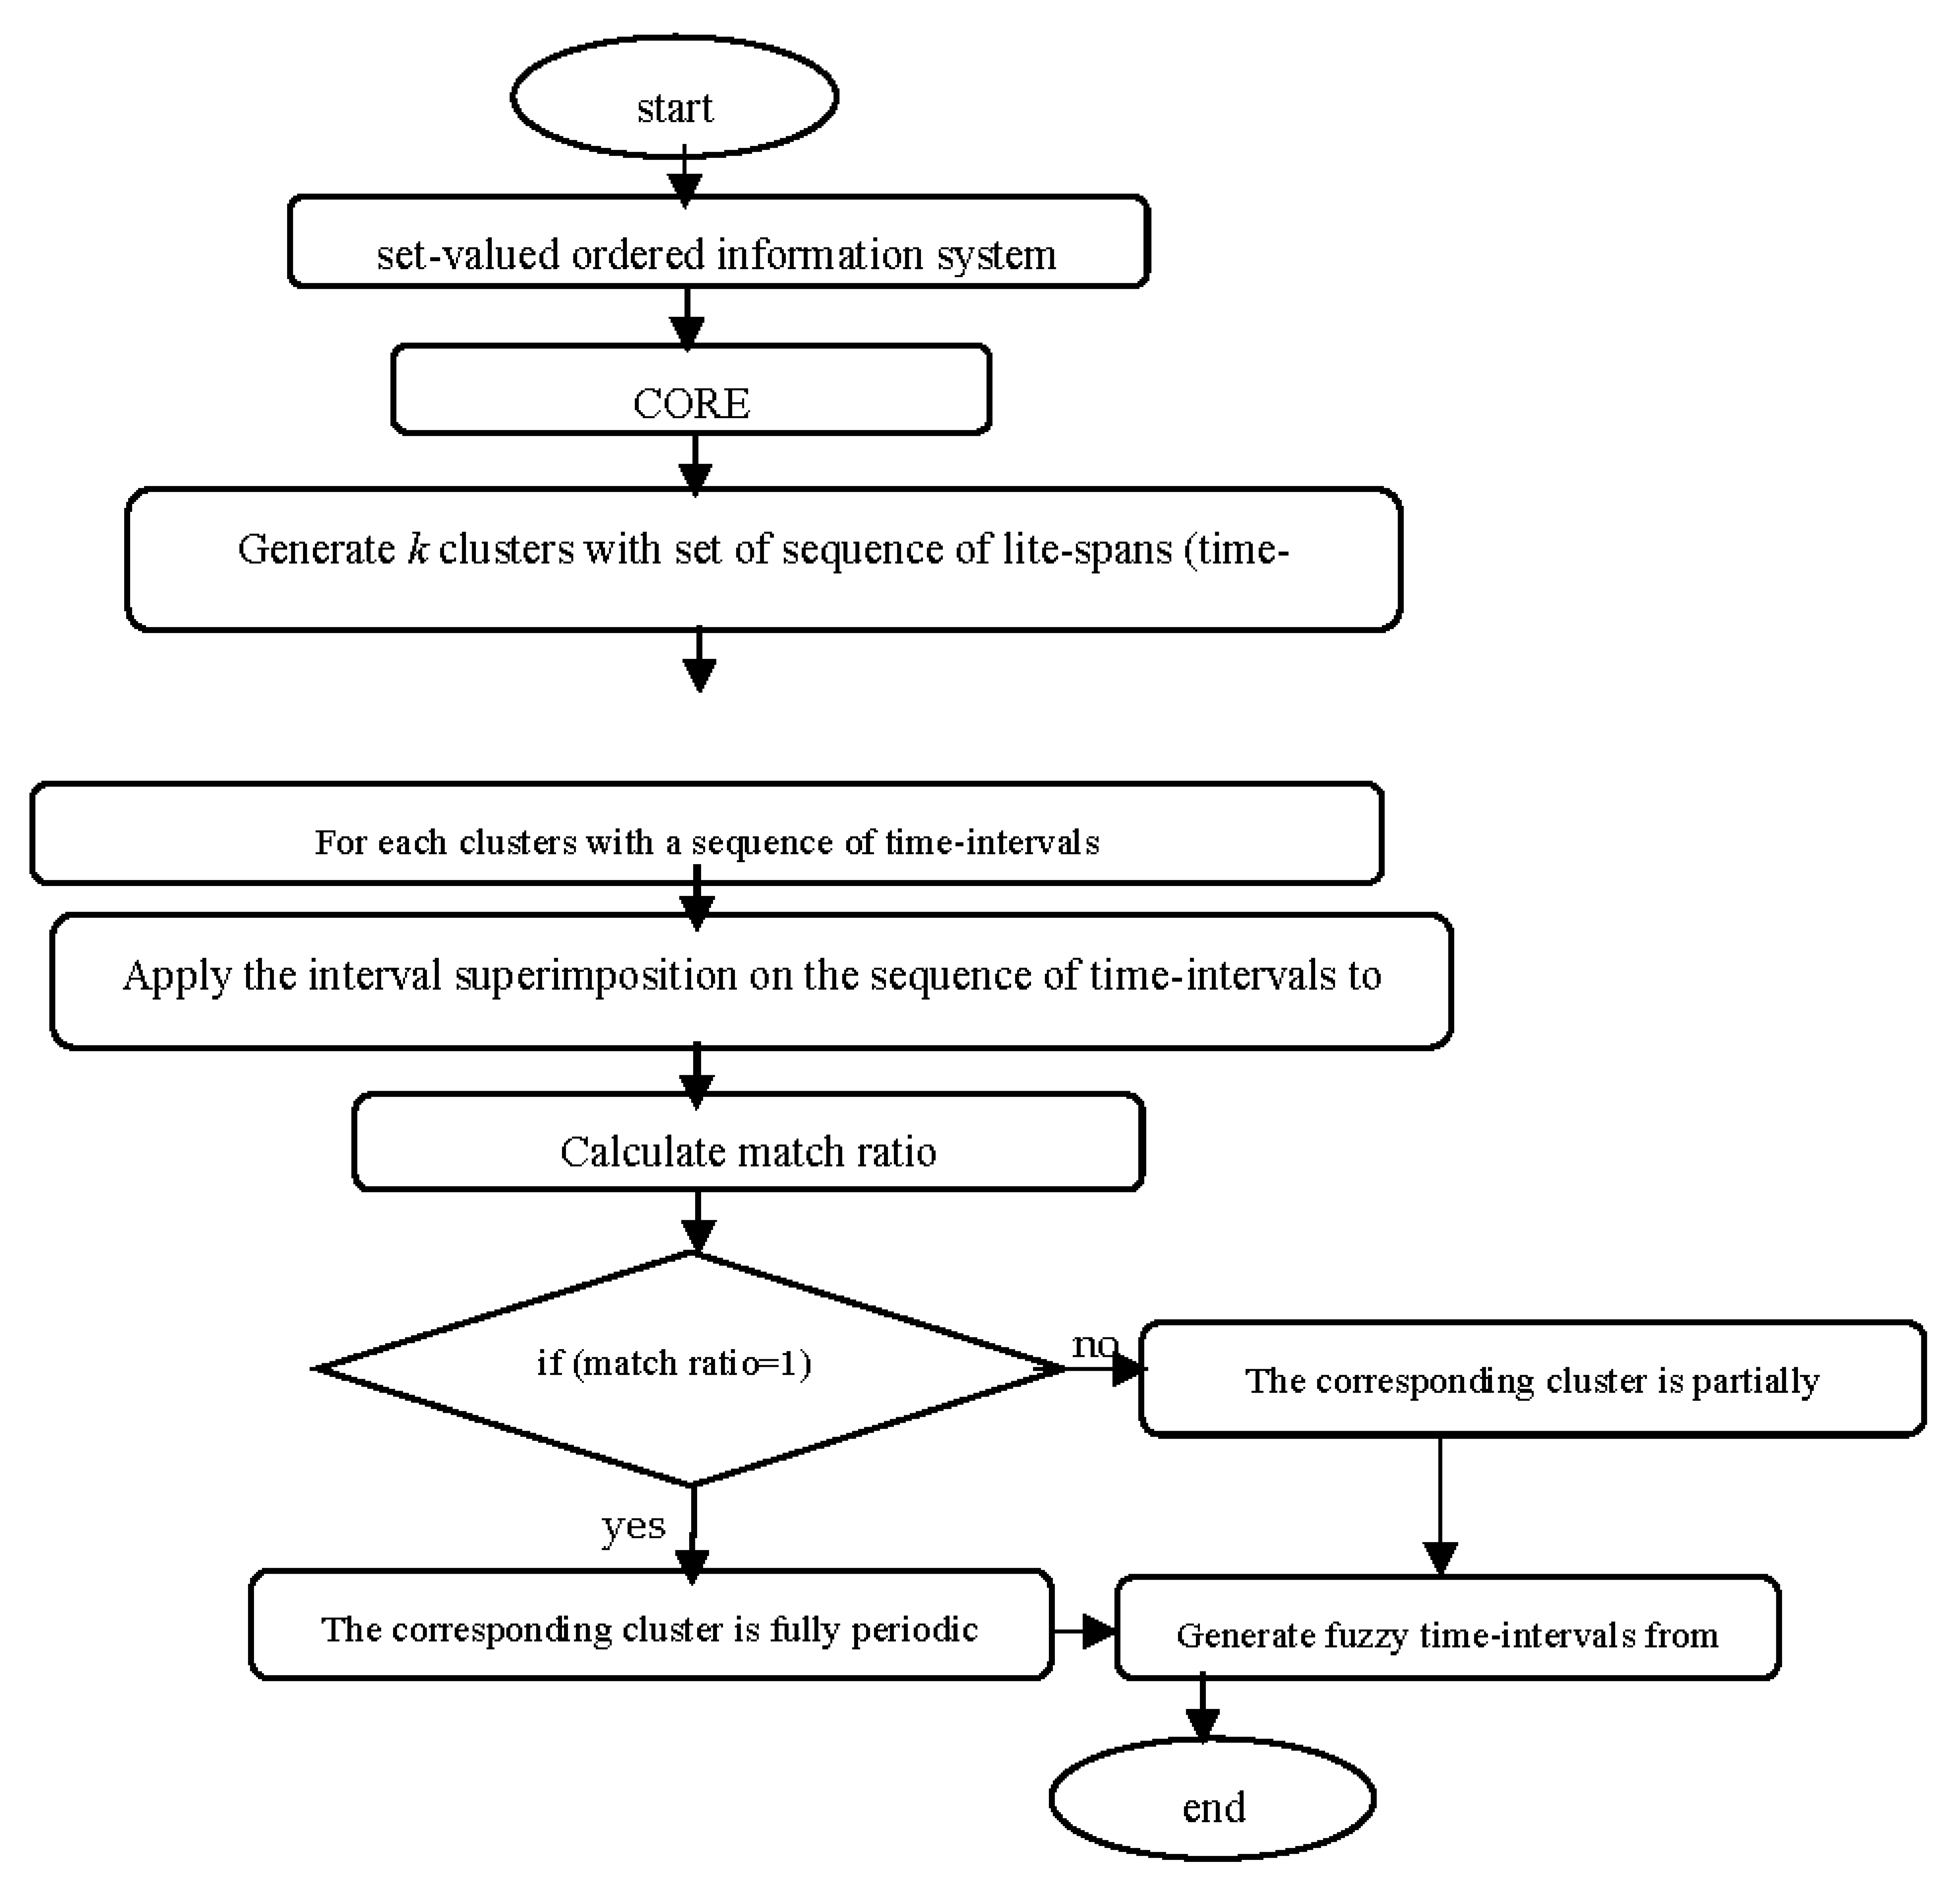
Figure 5.
Comparative analysis of RFPSCA with other existing methods in terms of accuracy of detection.
Figure 5.
Comparative analysis of RFPSCA with other existing methods in terms of accuracy of detection.
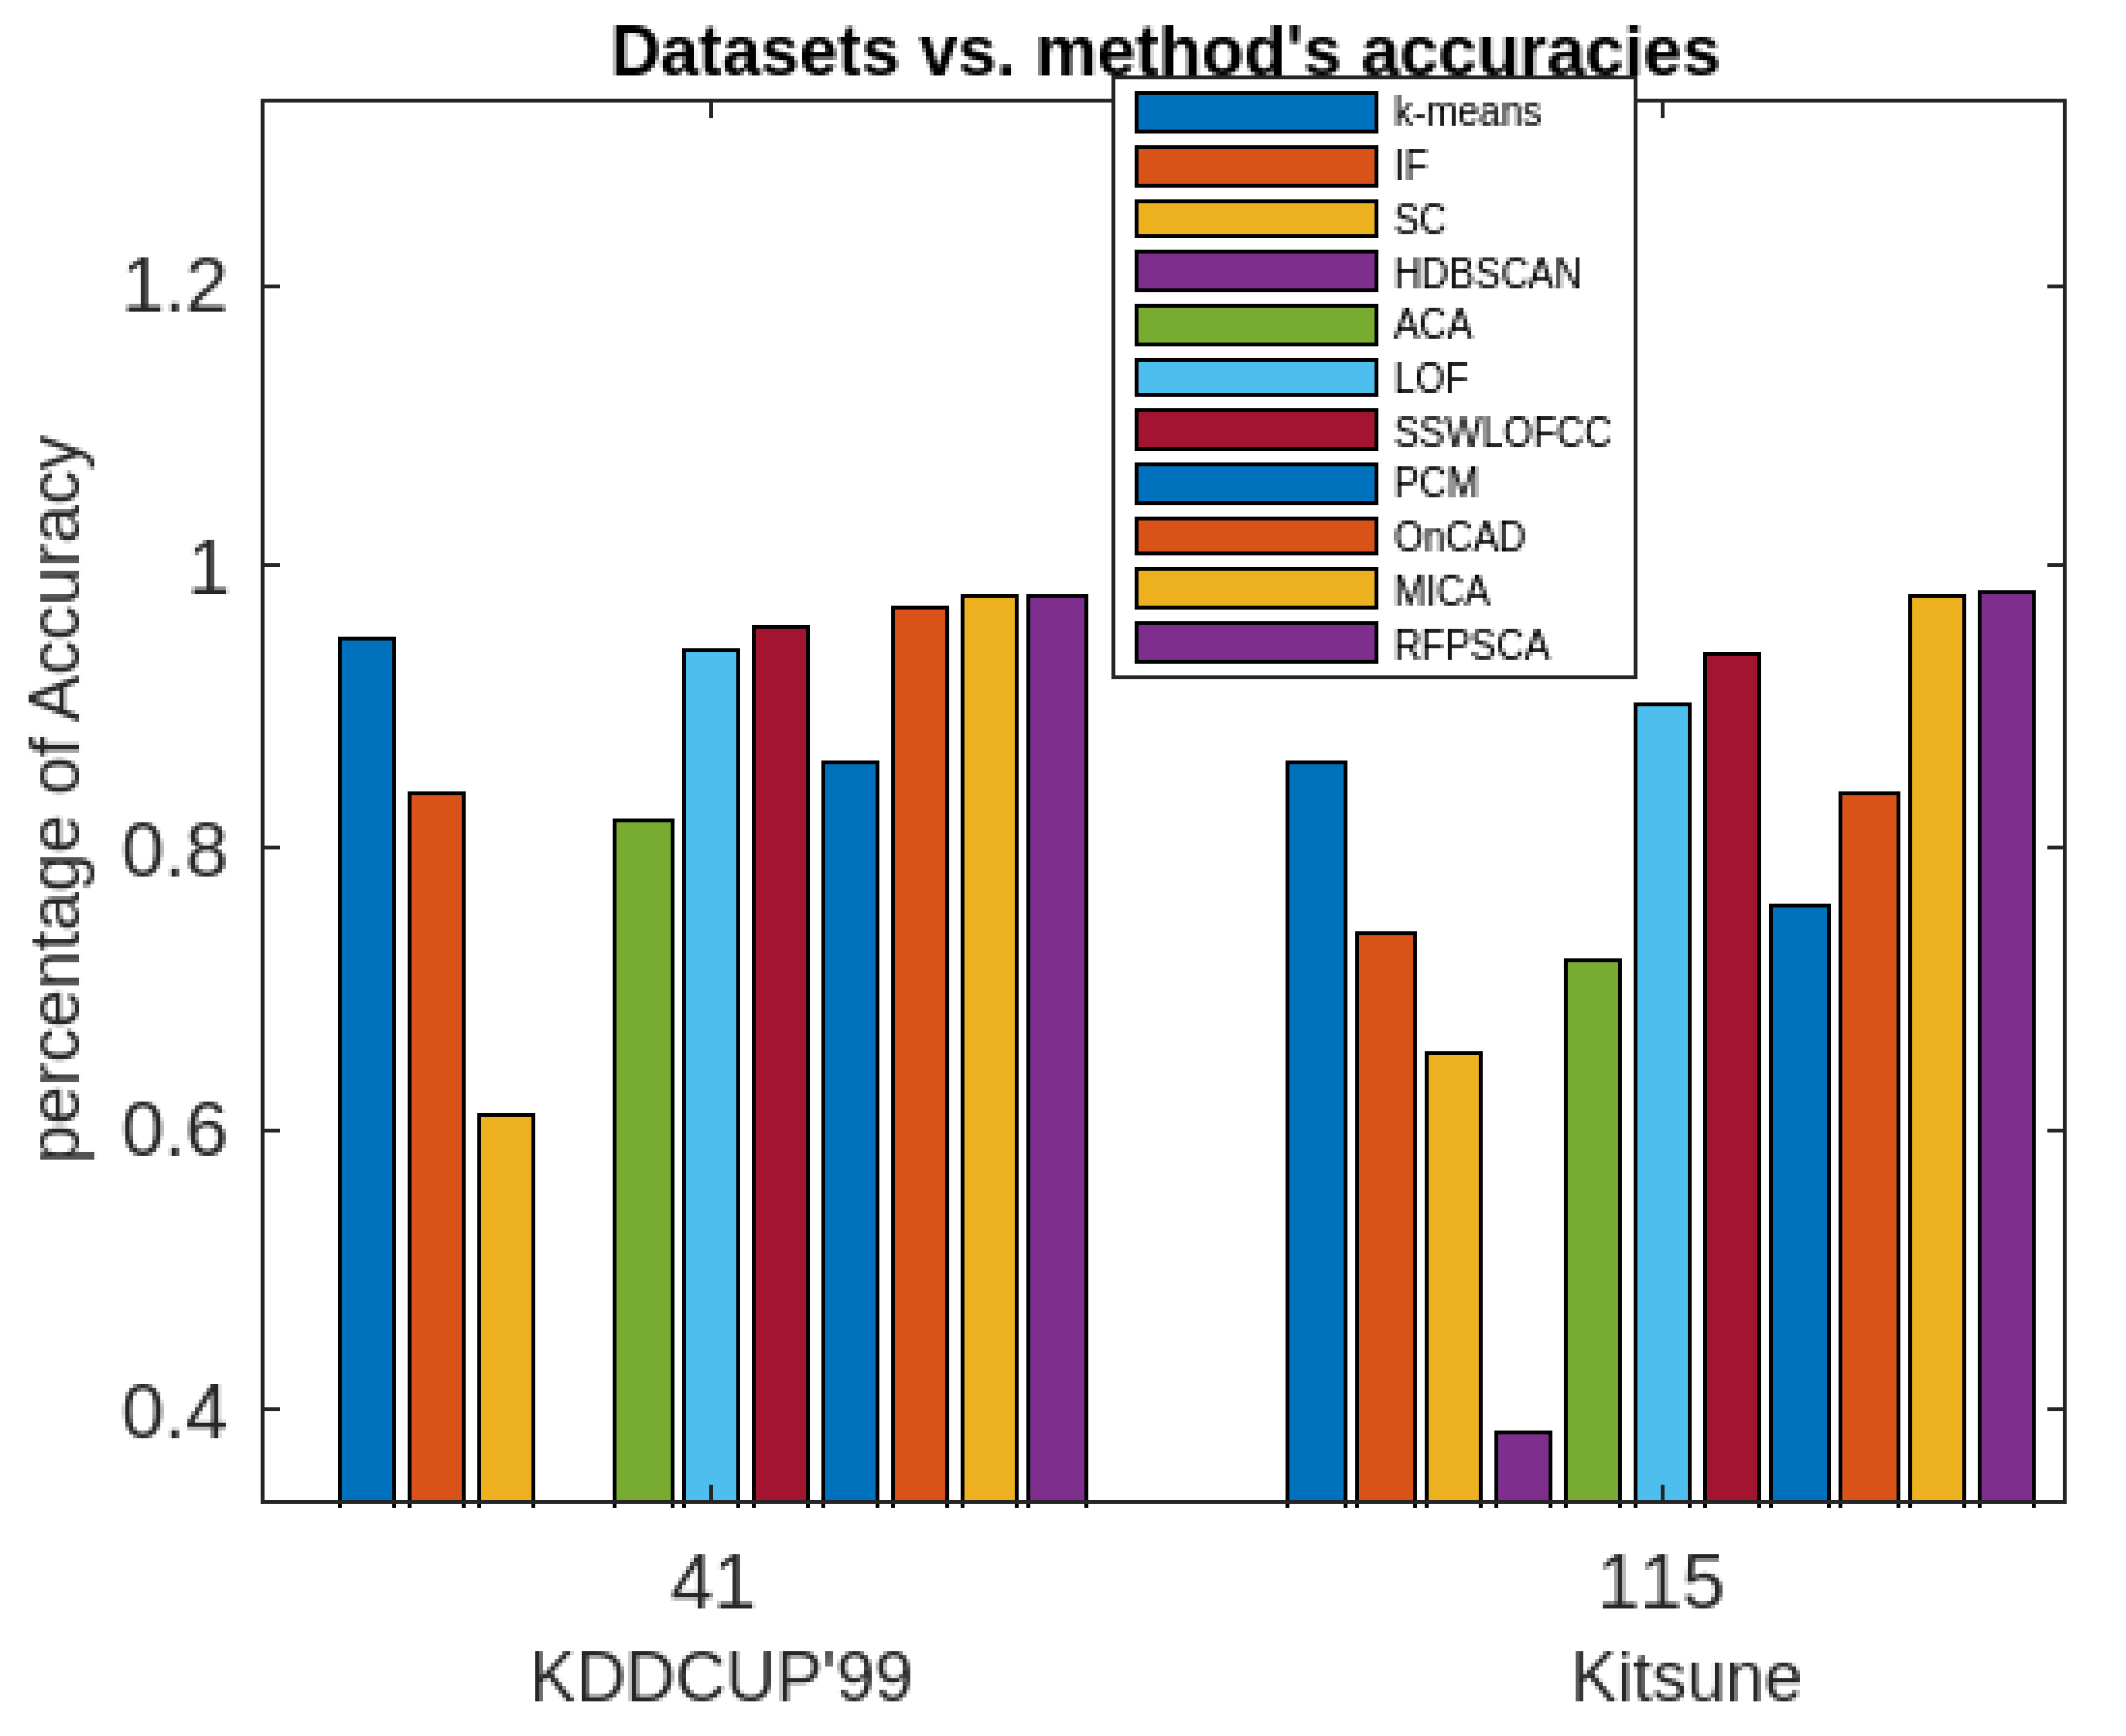
Figure 6.
Comparative analysis of RFPSCA with other existing methods in terms of execution time.
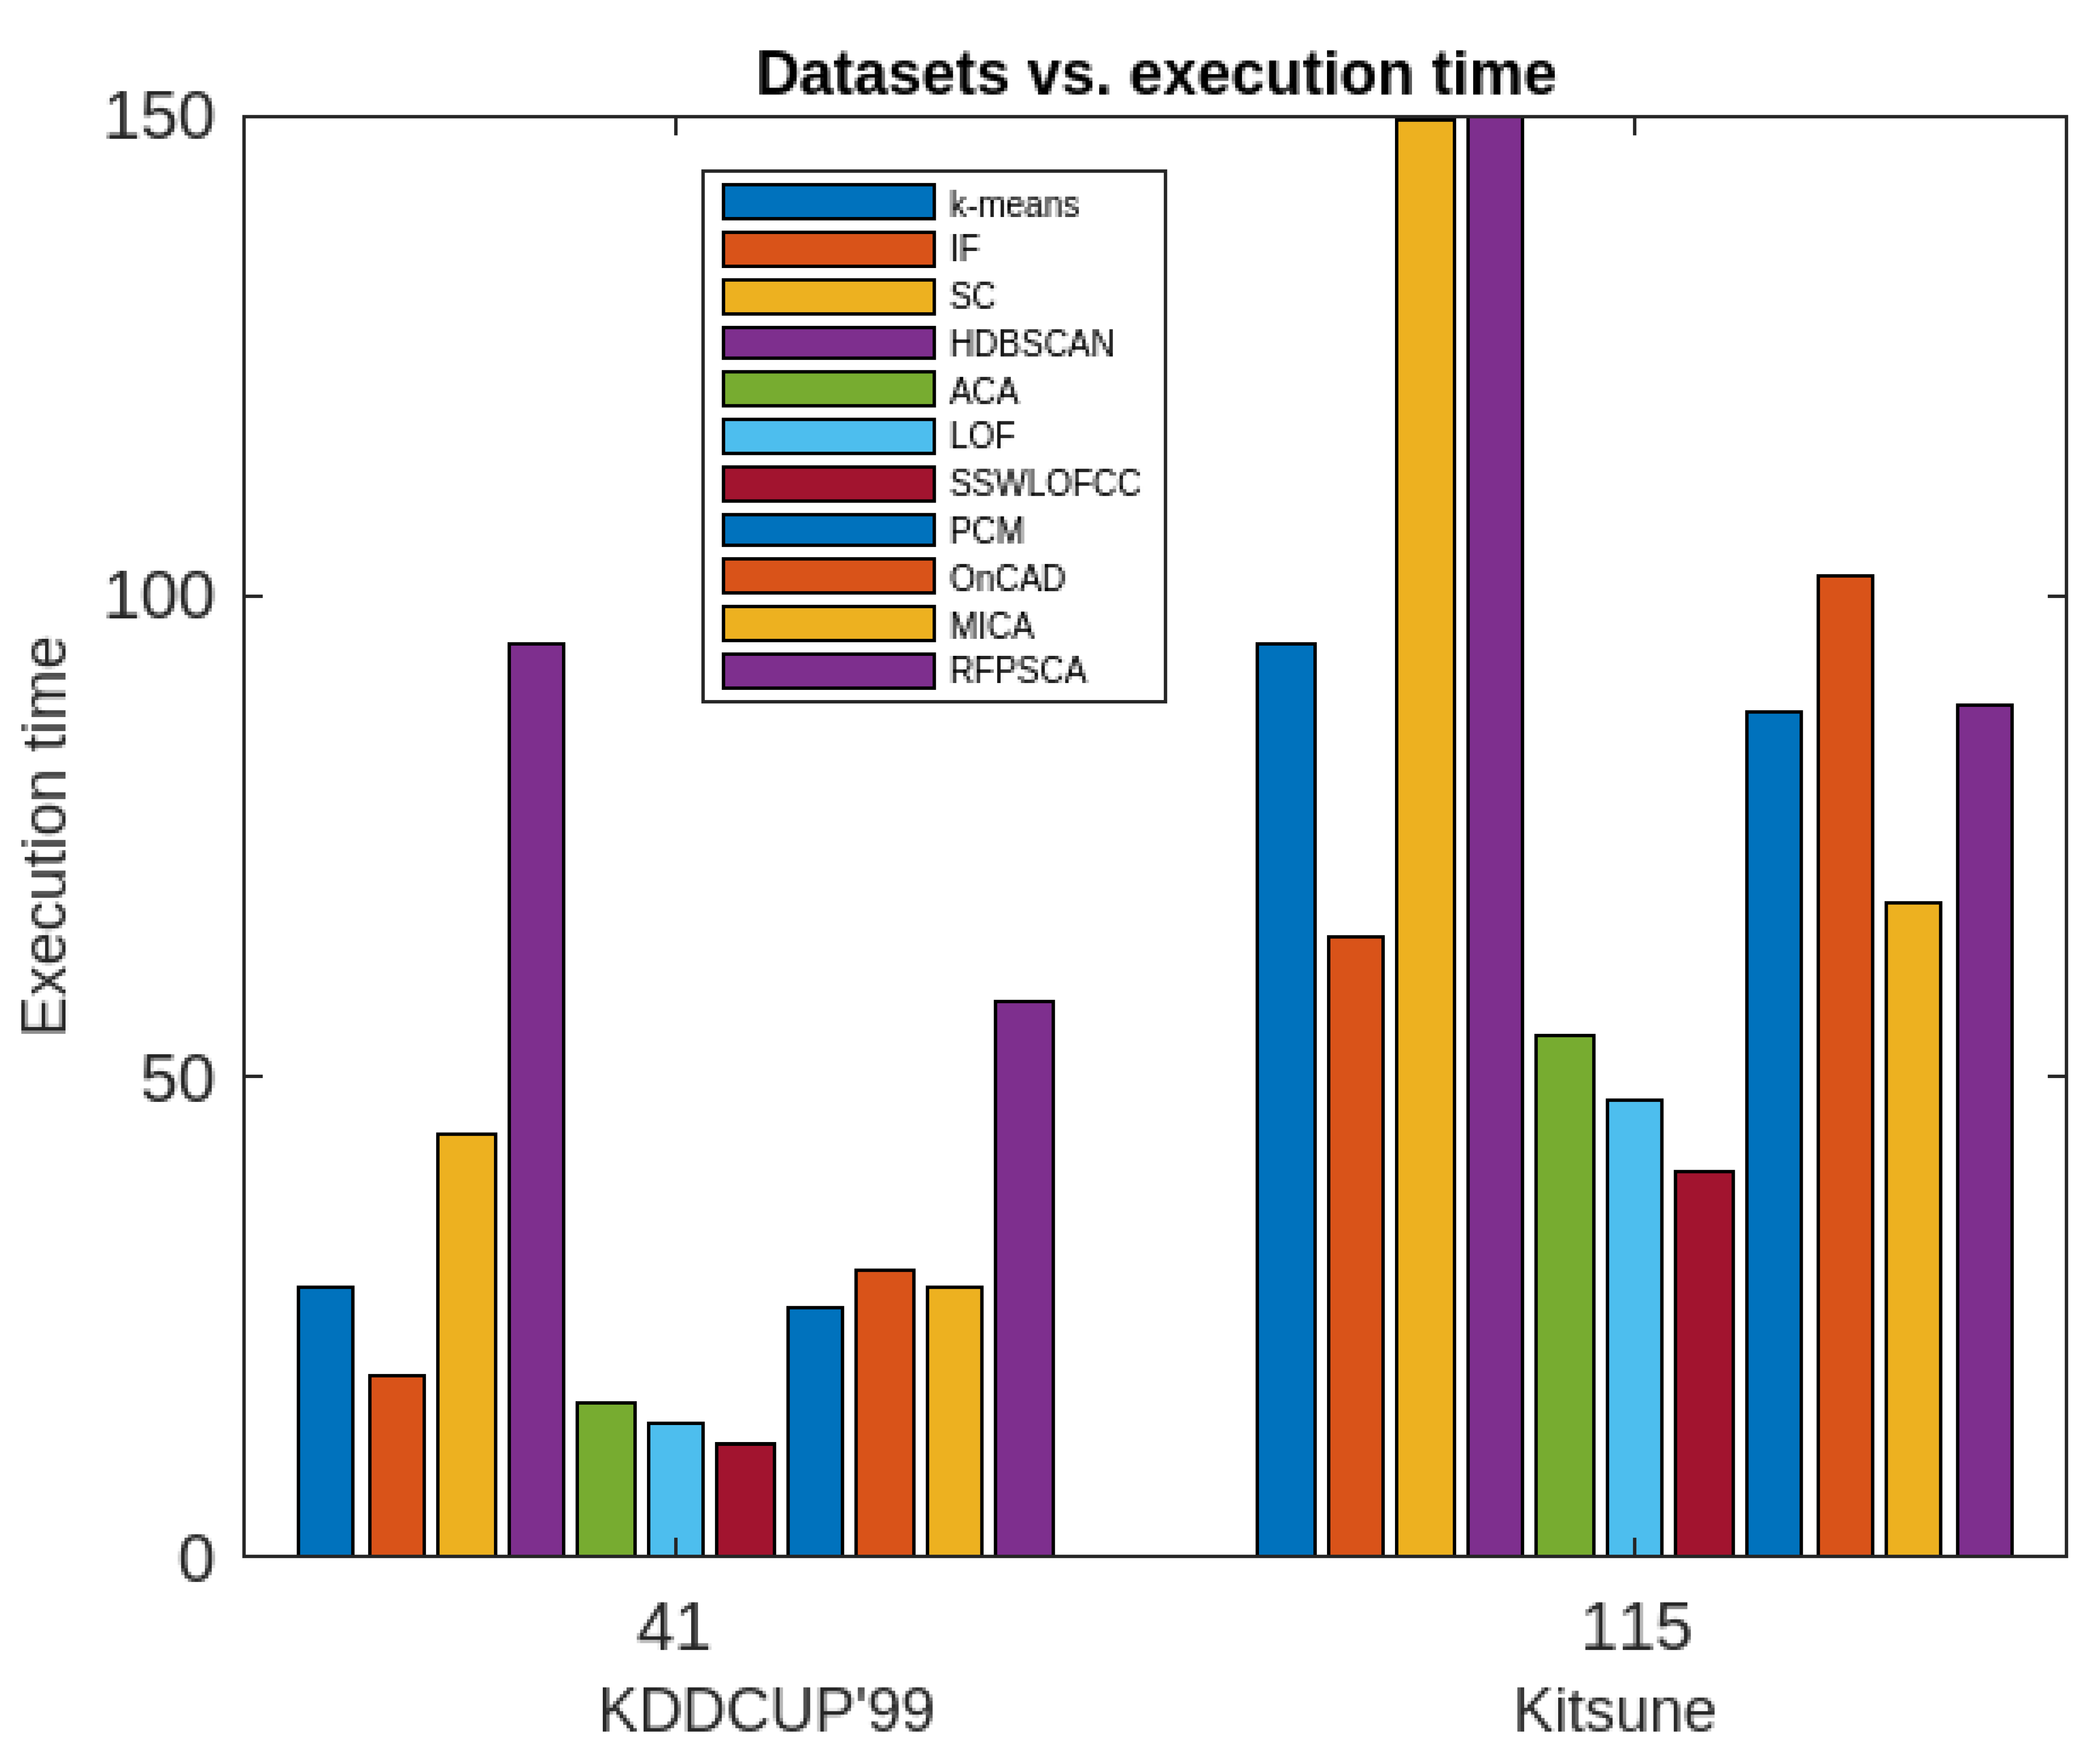
Figure 7.
Comparative analysis of all the 11 methods in terms of accuracy using KDDCUP’99.
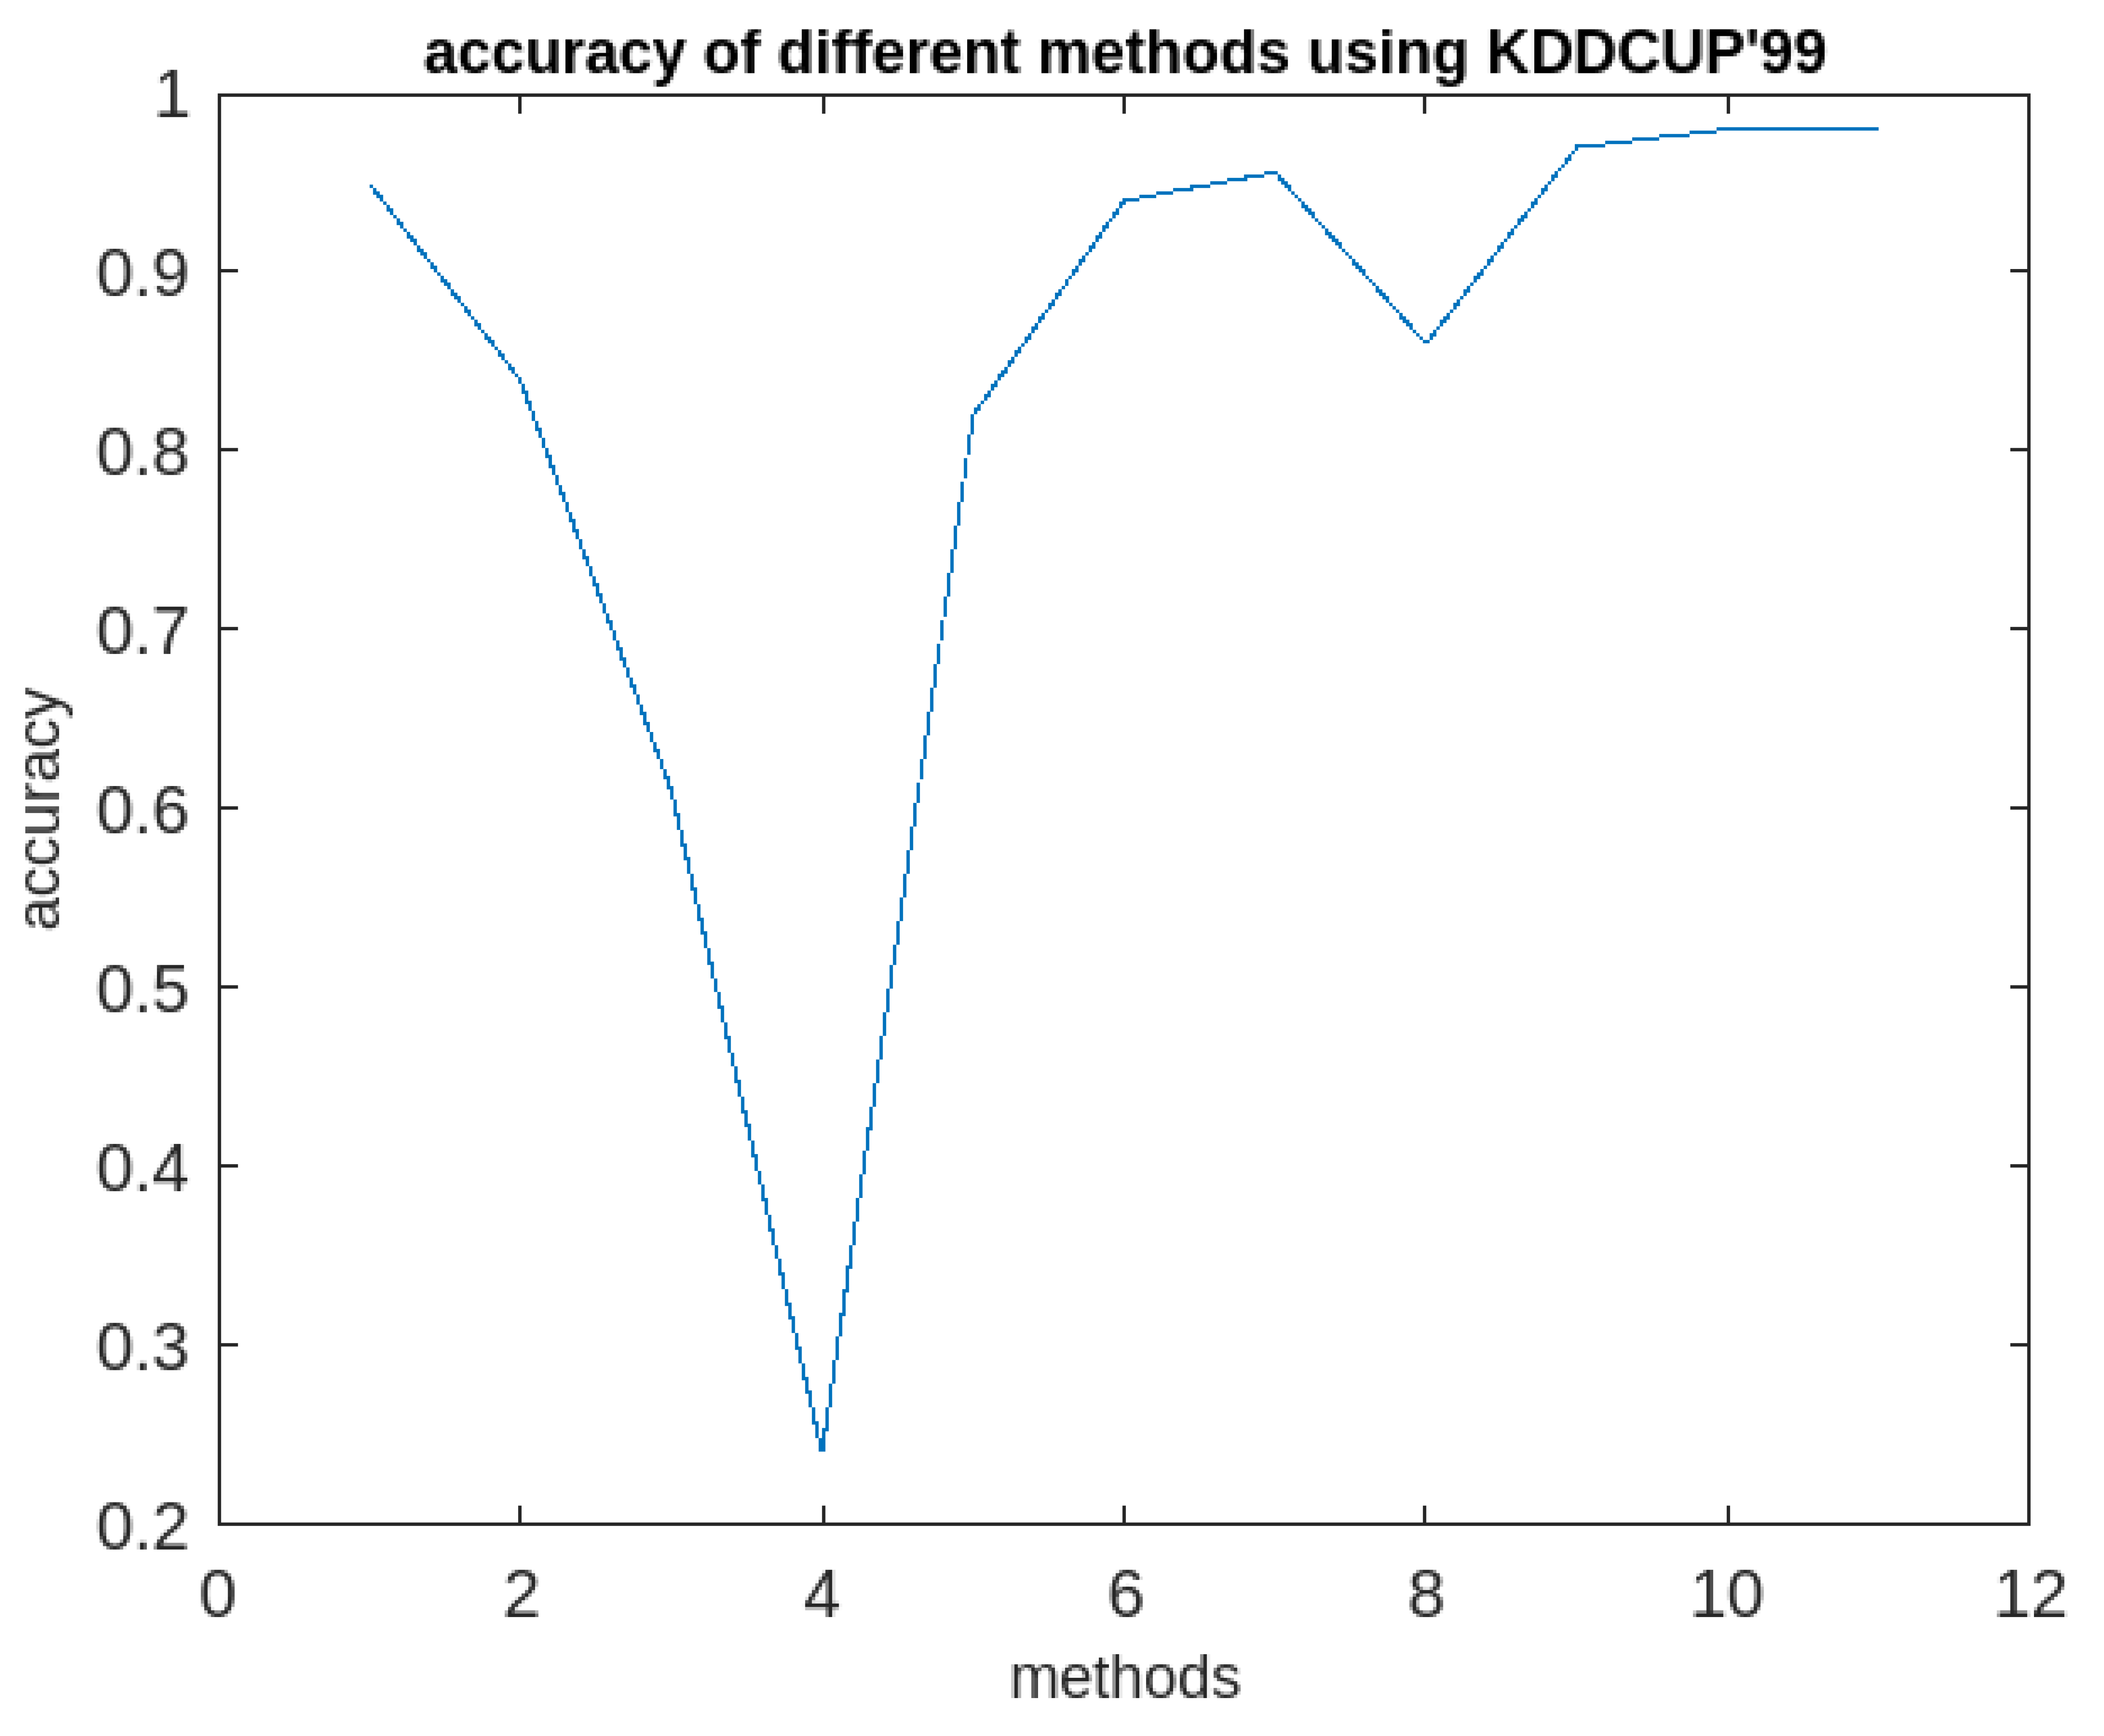
Figure 8.
Comparative analysis of all the 11 methods in terms of accuracy using Kitsune dataset.
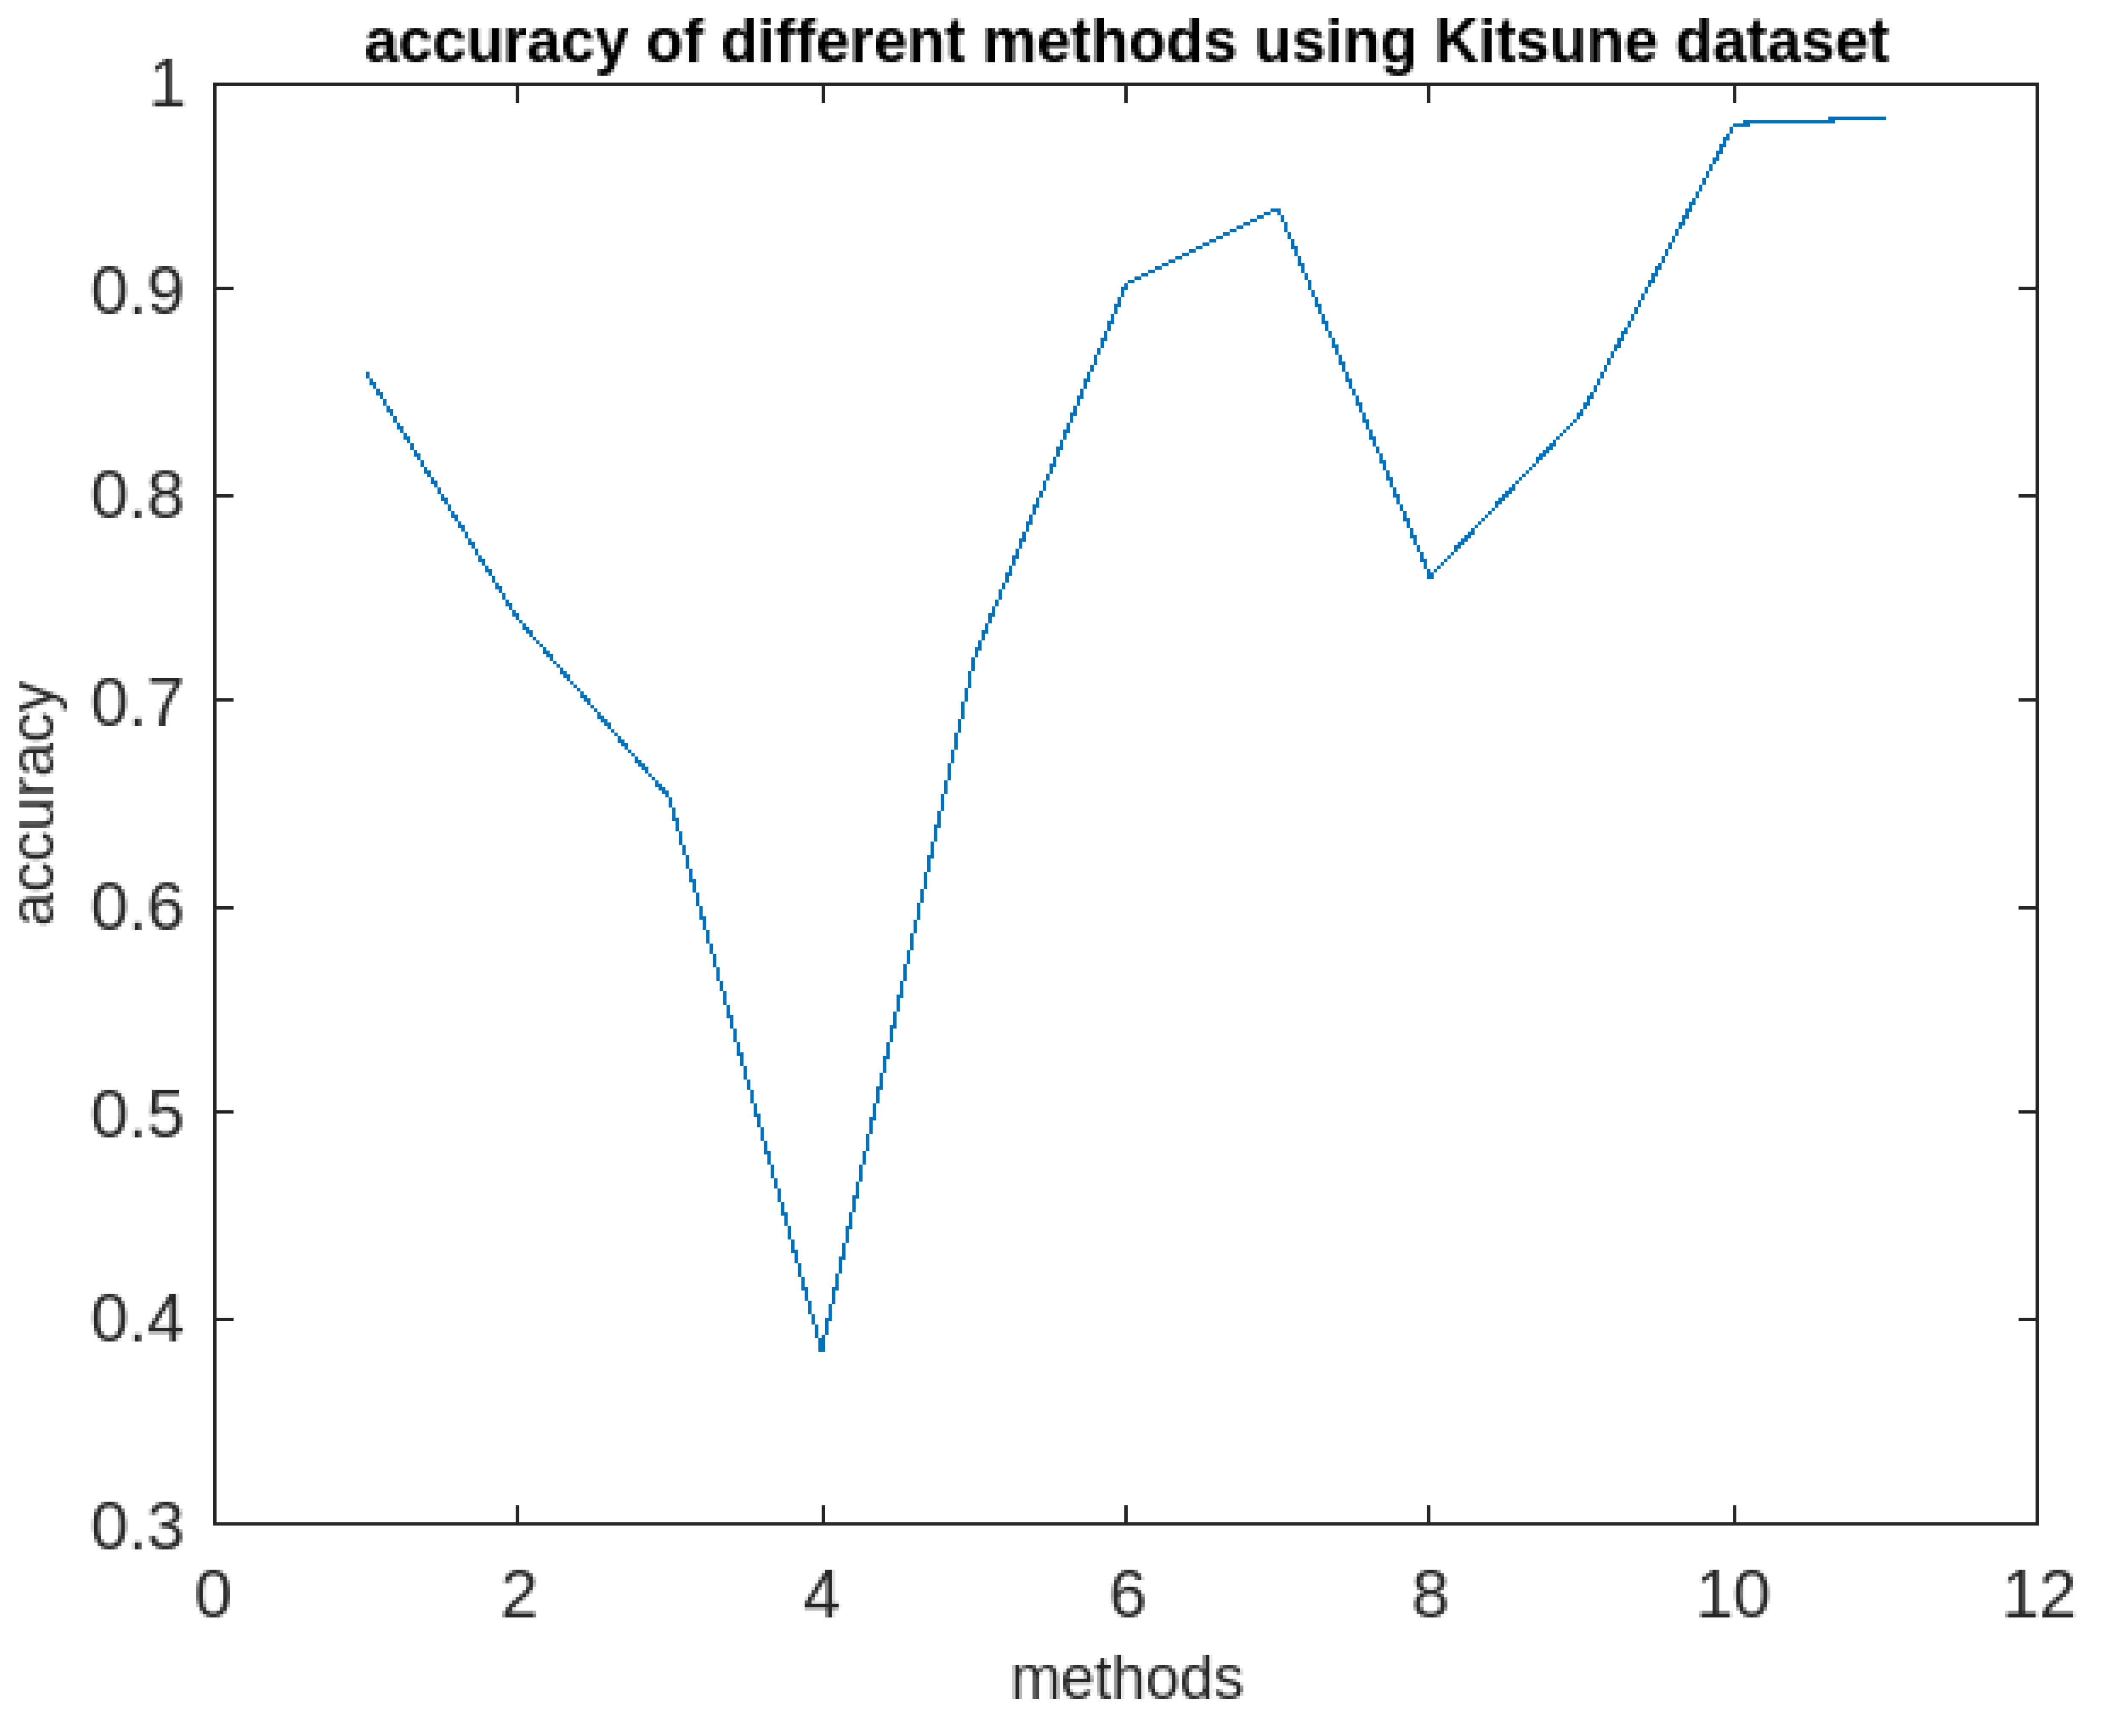
Figure 9.
Comparative analysis of all the 11 methods in terms of execution time using KDDCUP’99.
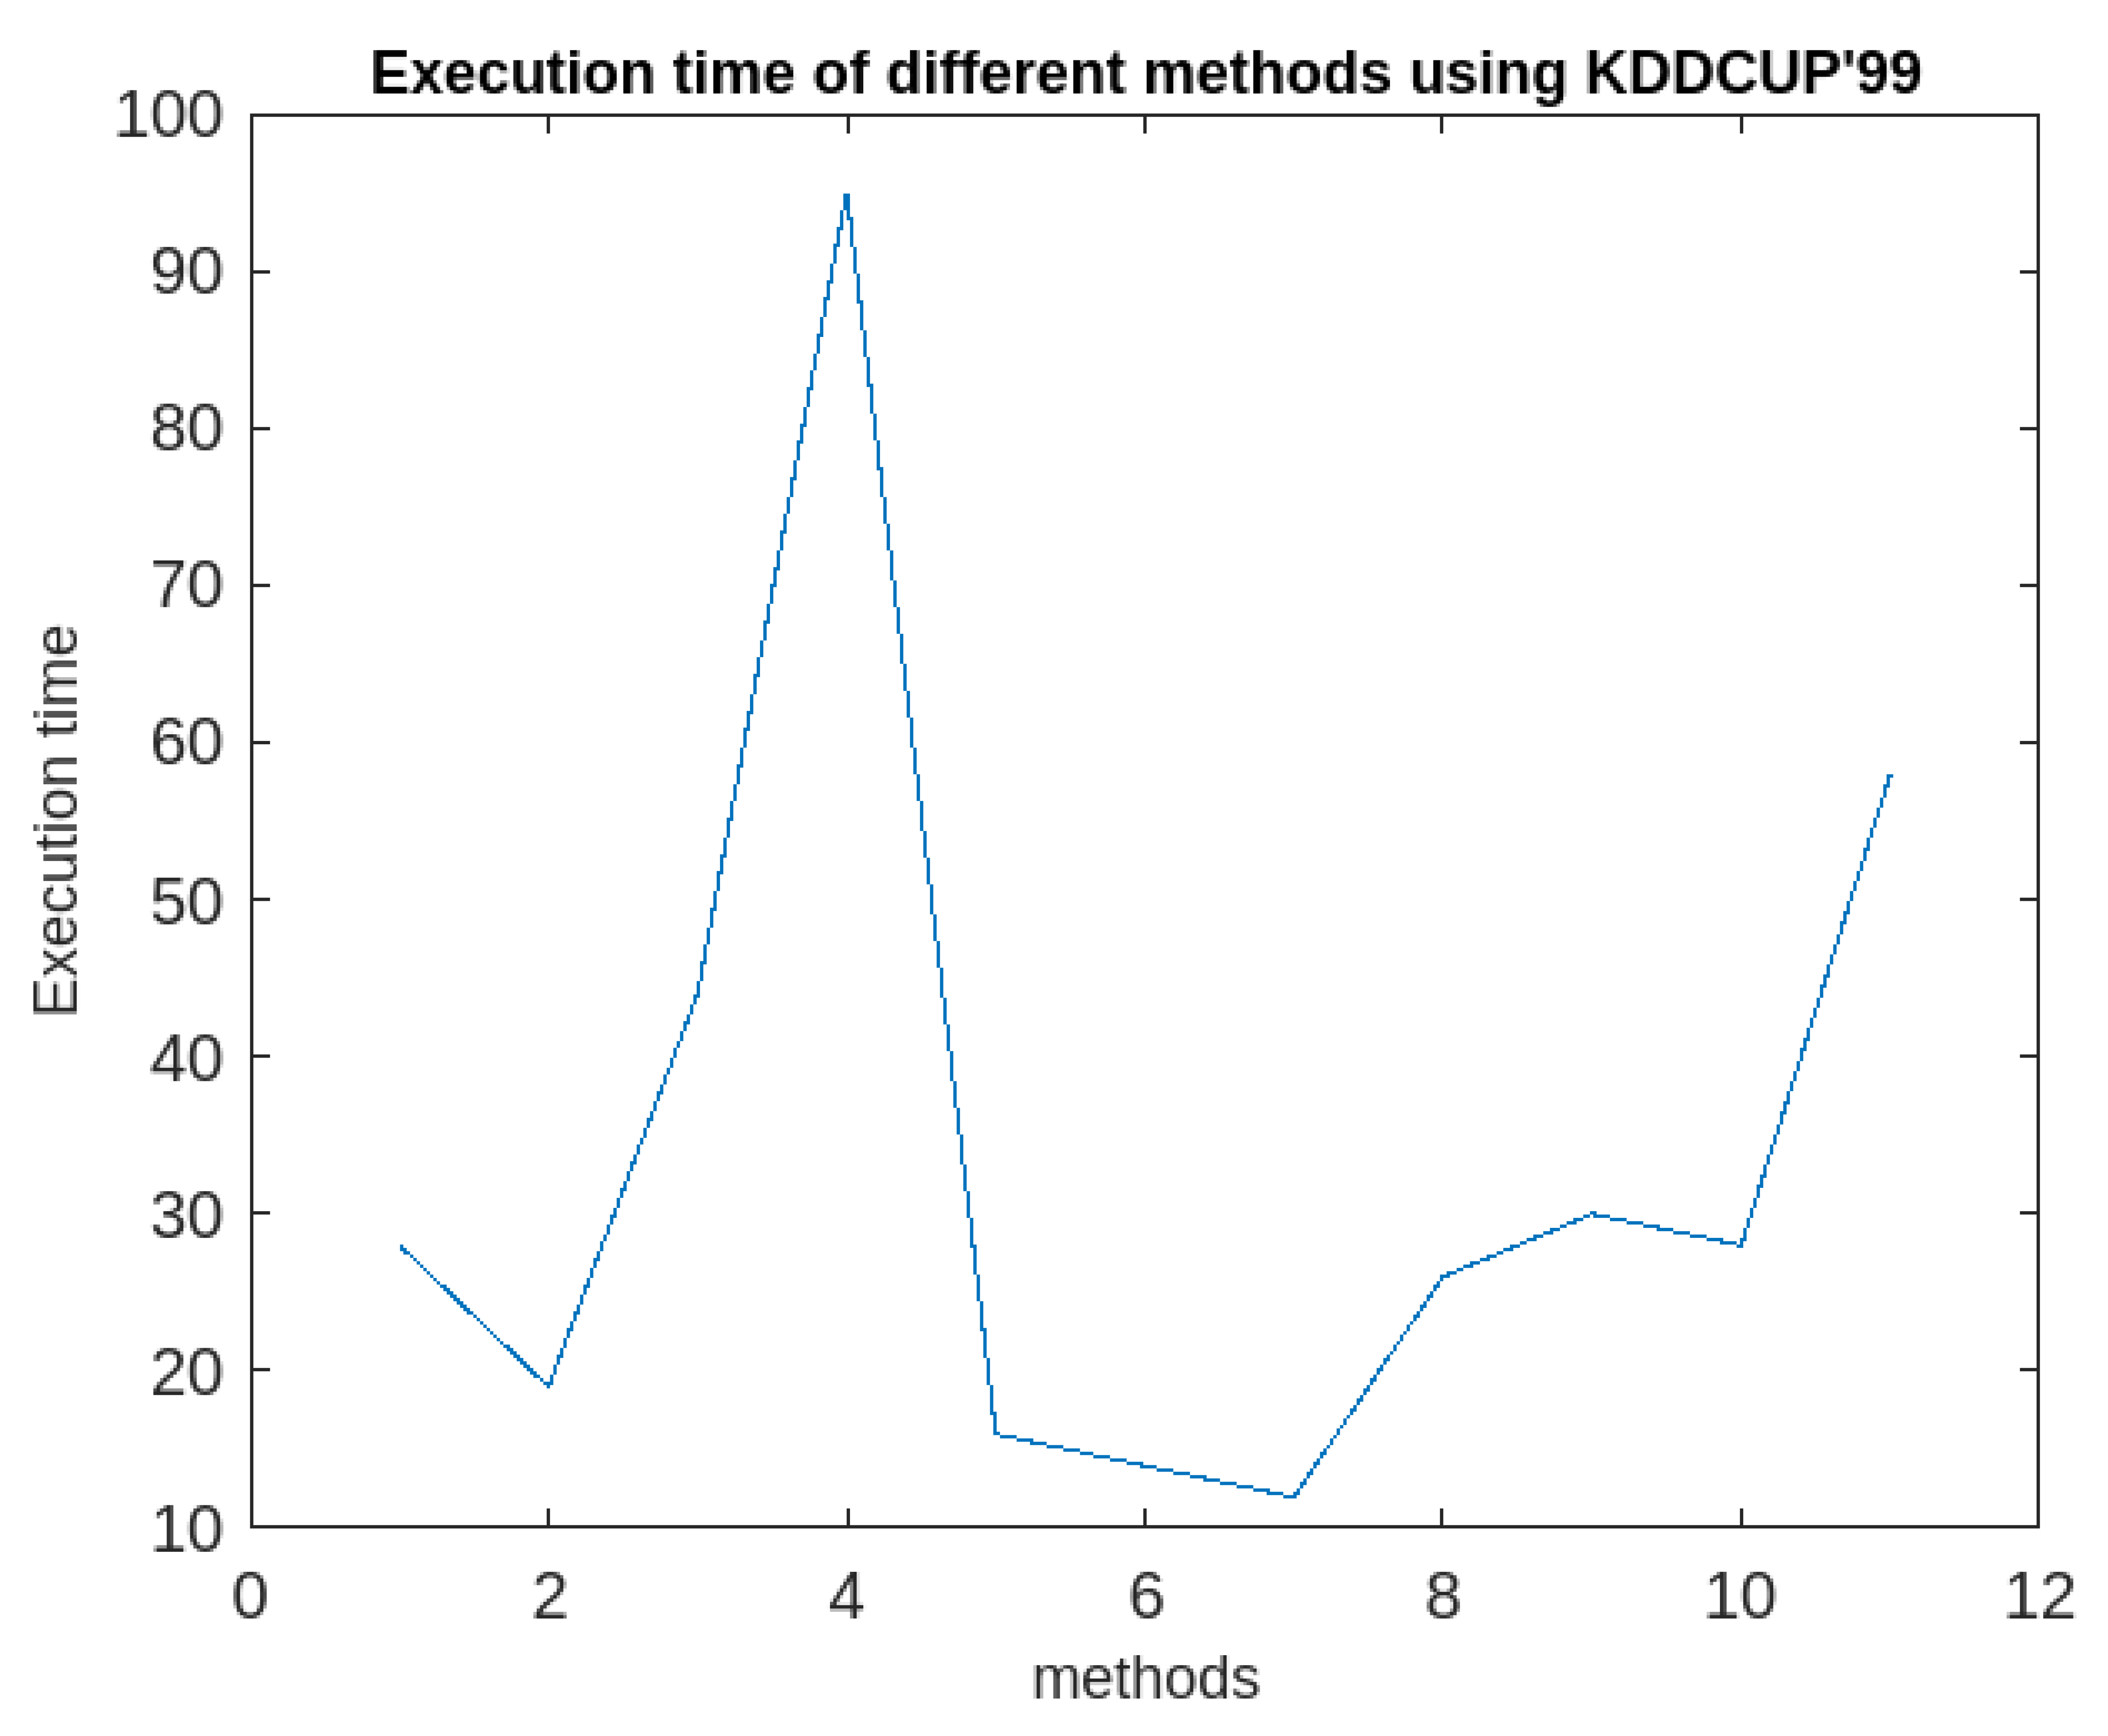
Figure 10.
Comparative analysis of all the 11 methods in terms of execution time using KDDCUP’99.
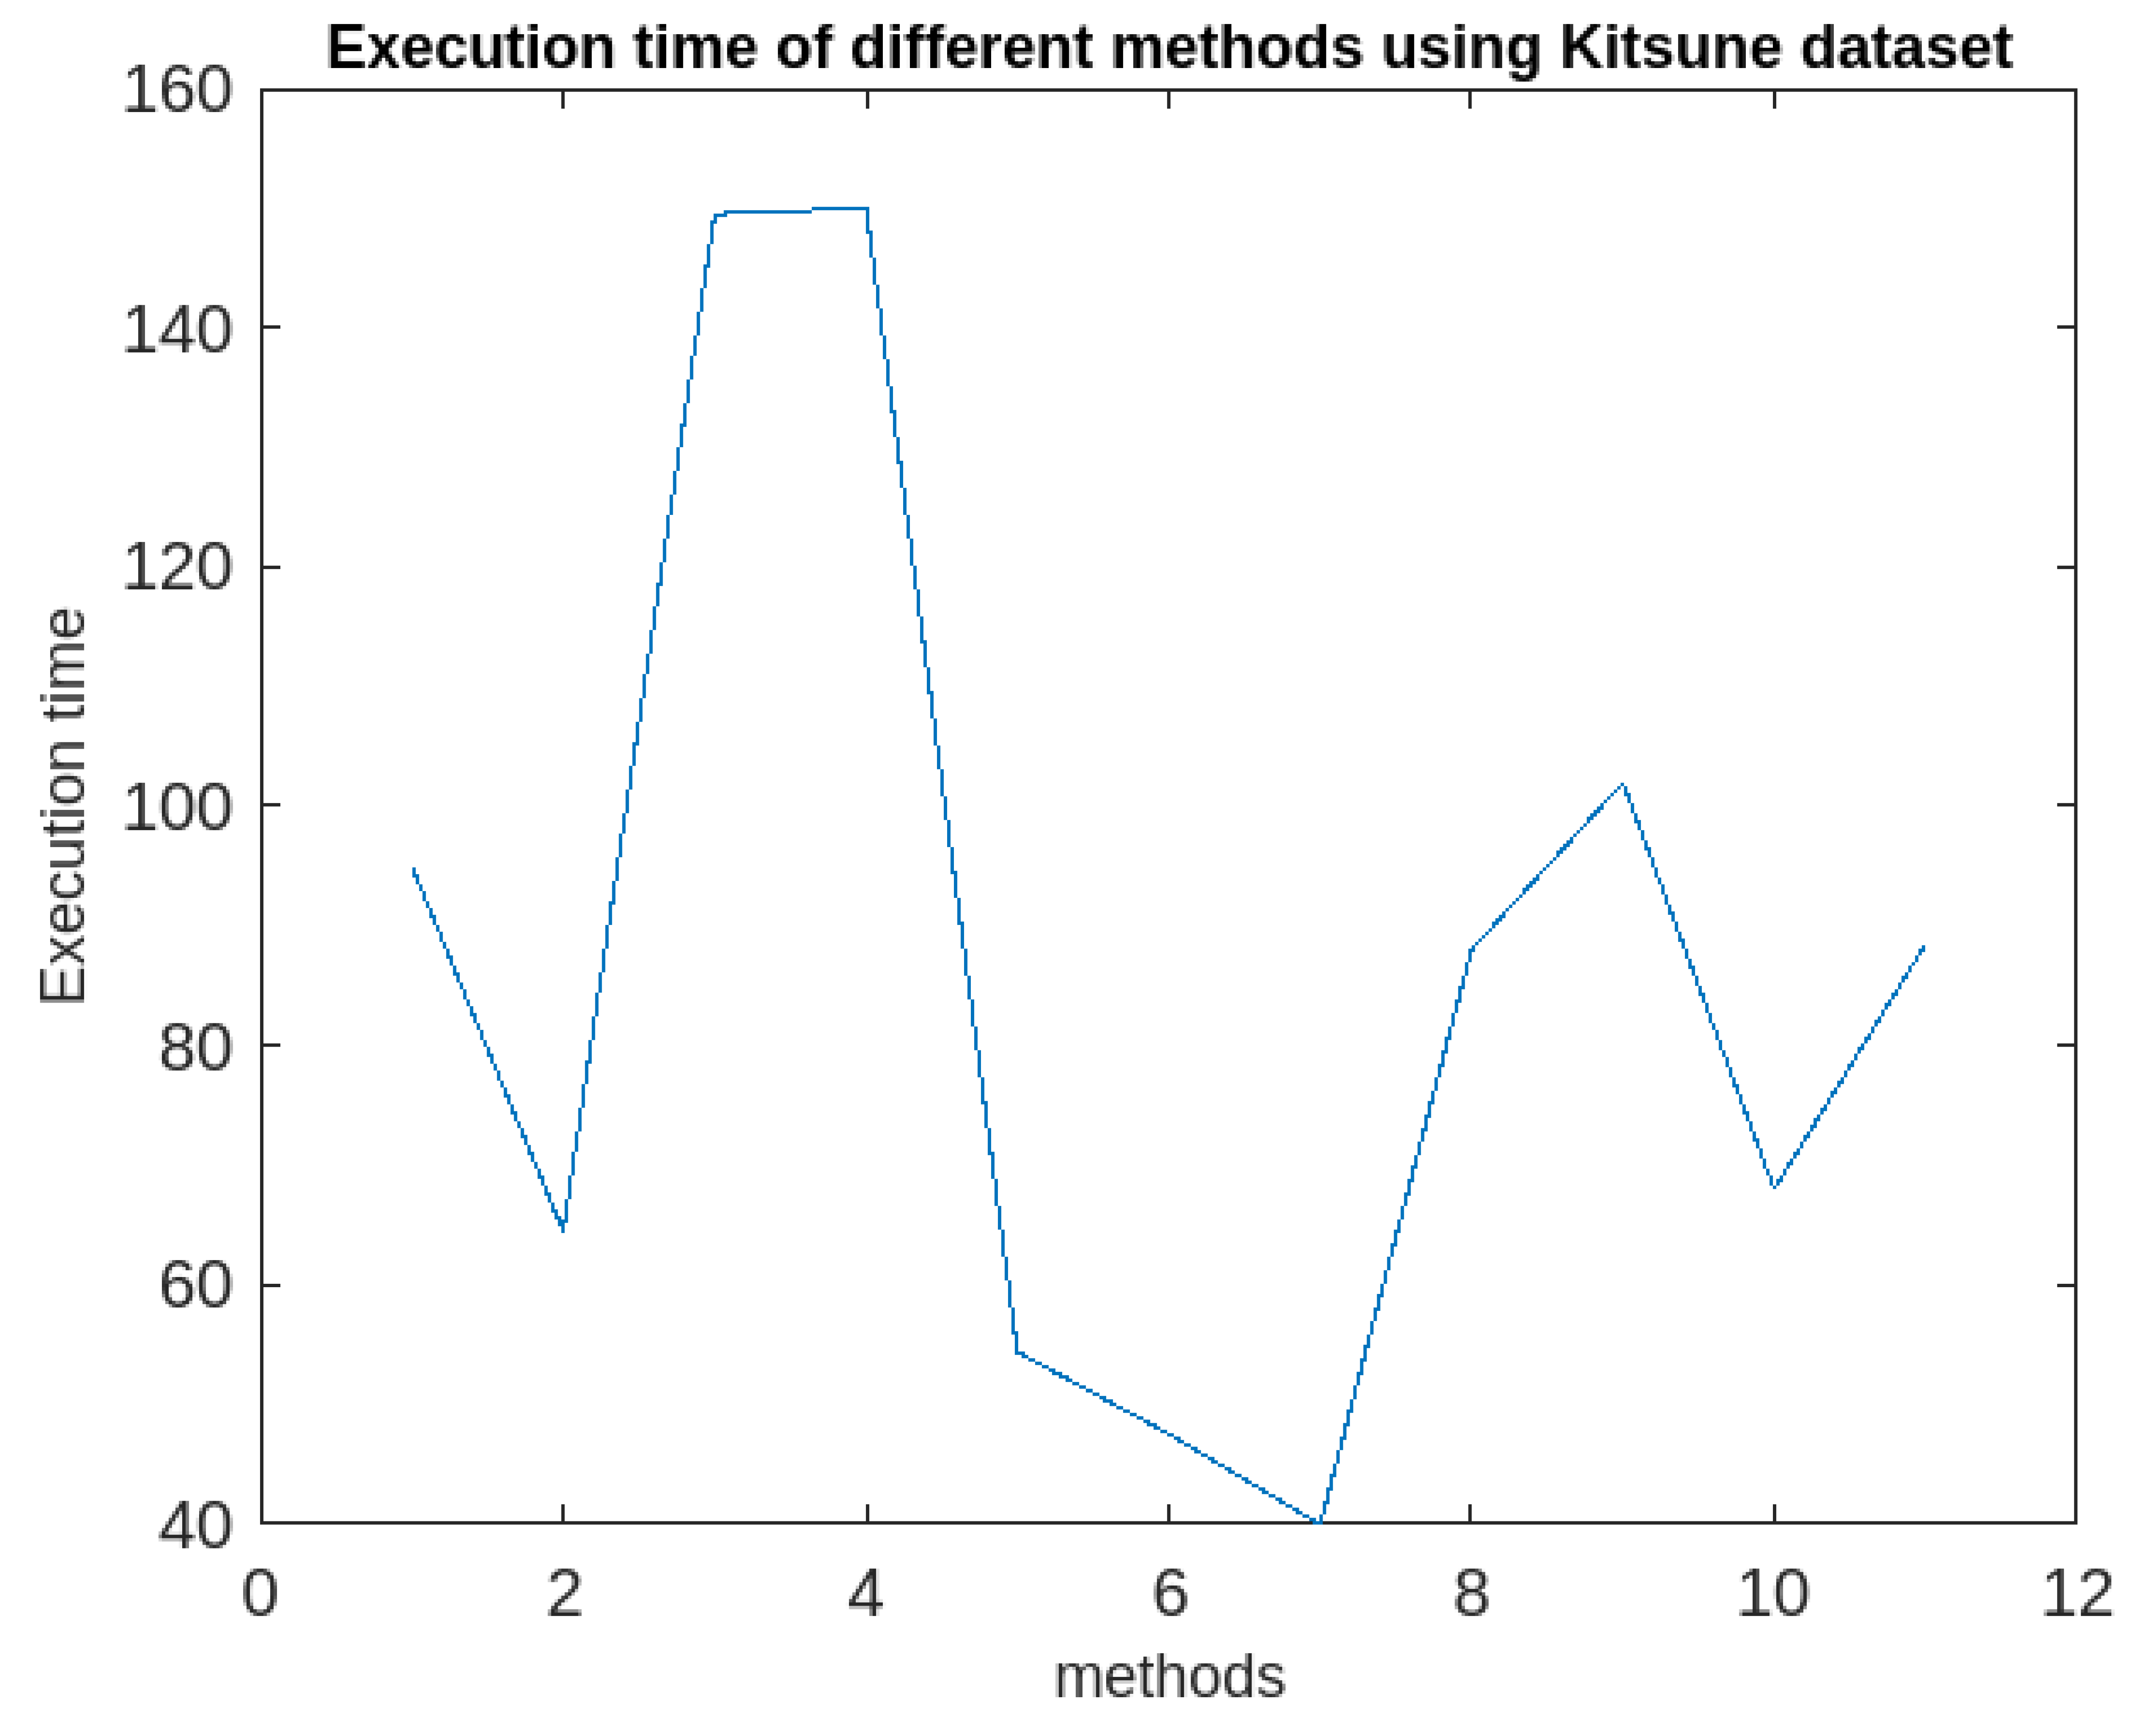
Figure 11.
Comparative analysis of RFPSCA with other existing methods in terms of both accuracy and execution time.
Figure 11.
Comparative analysis of RFPSCA with other existing methods in terms of both accuracy and execution time.
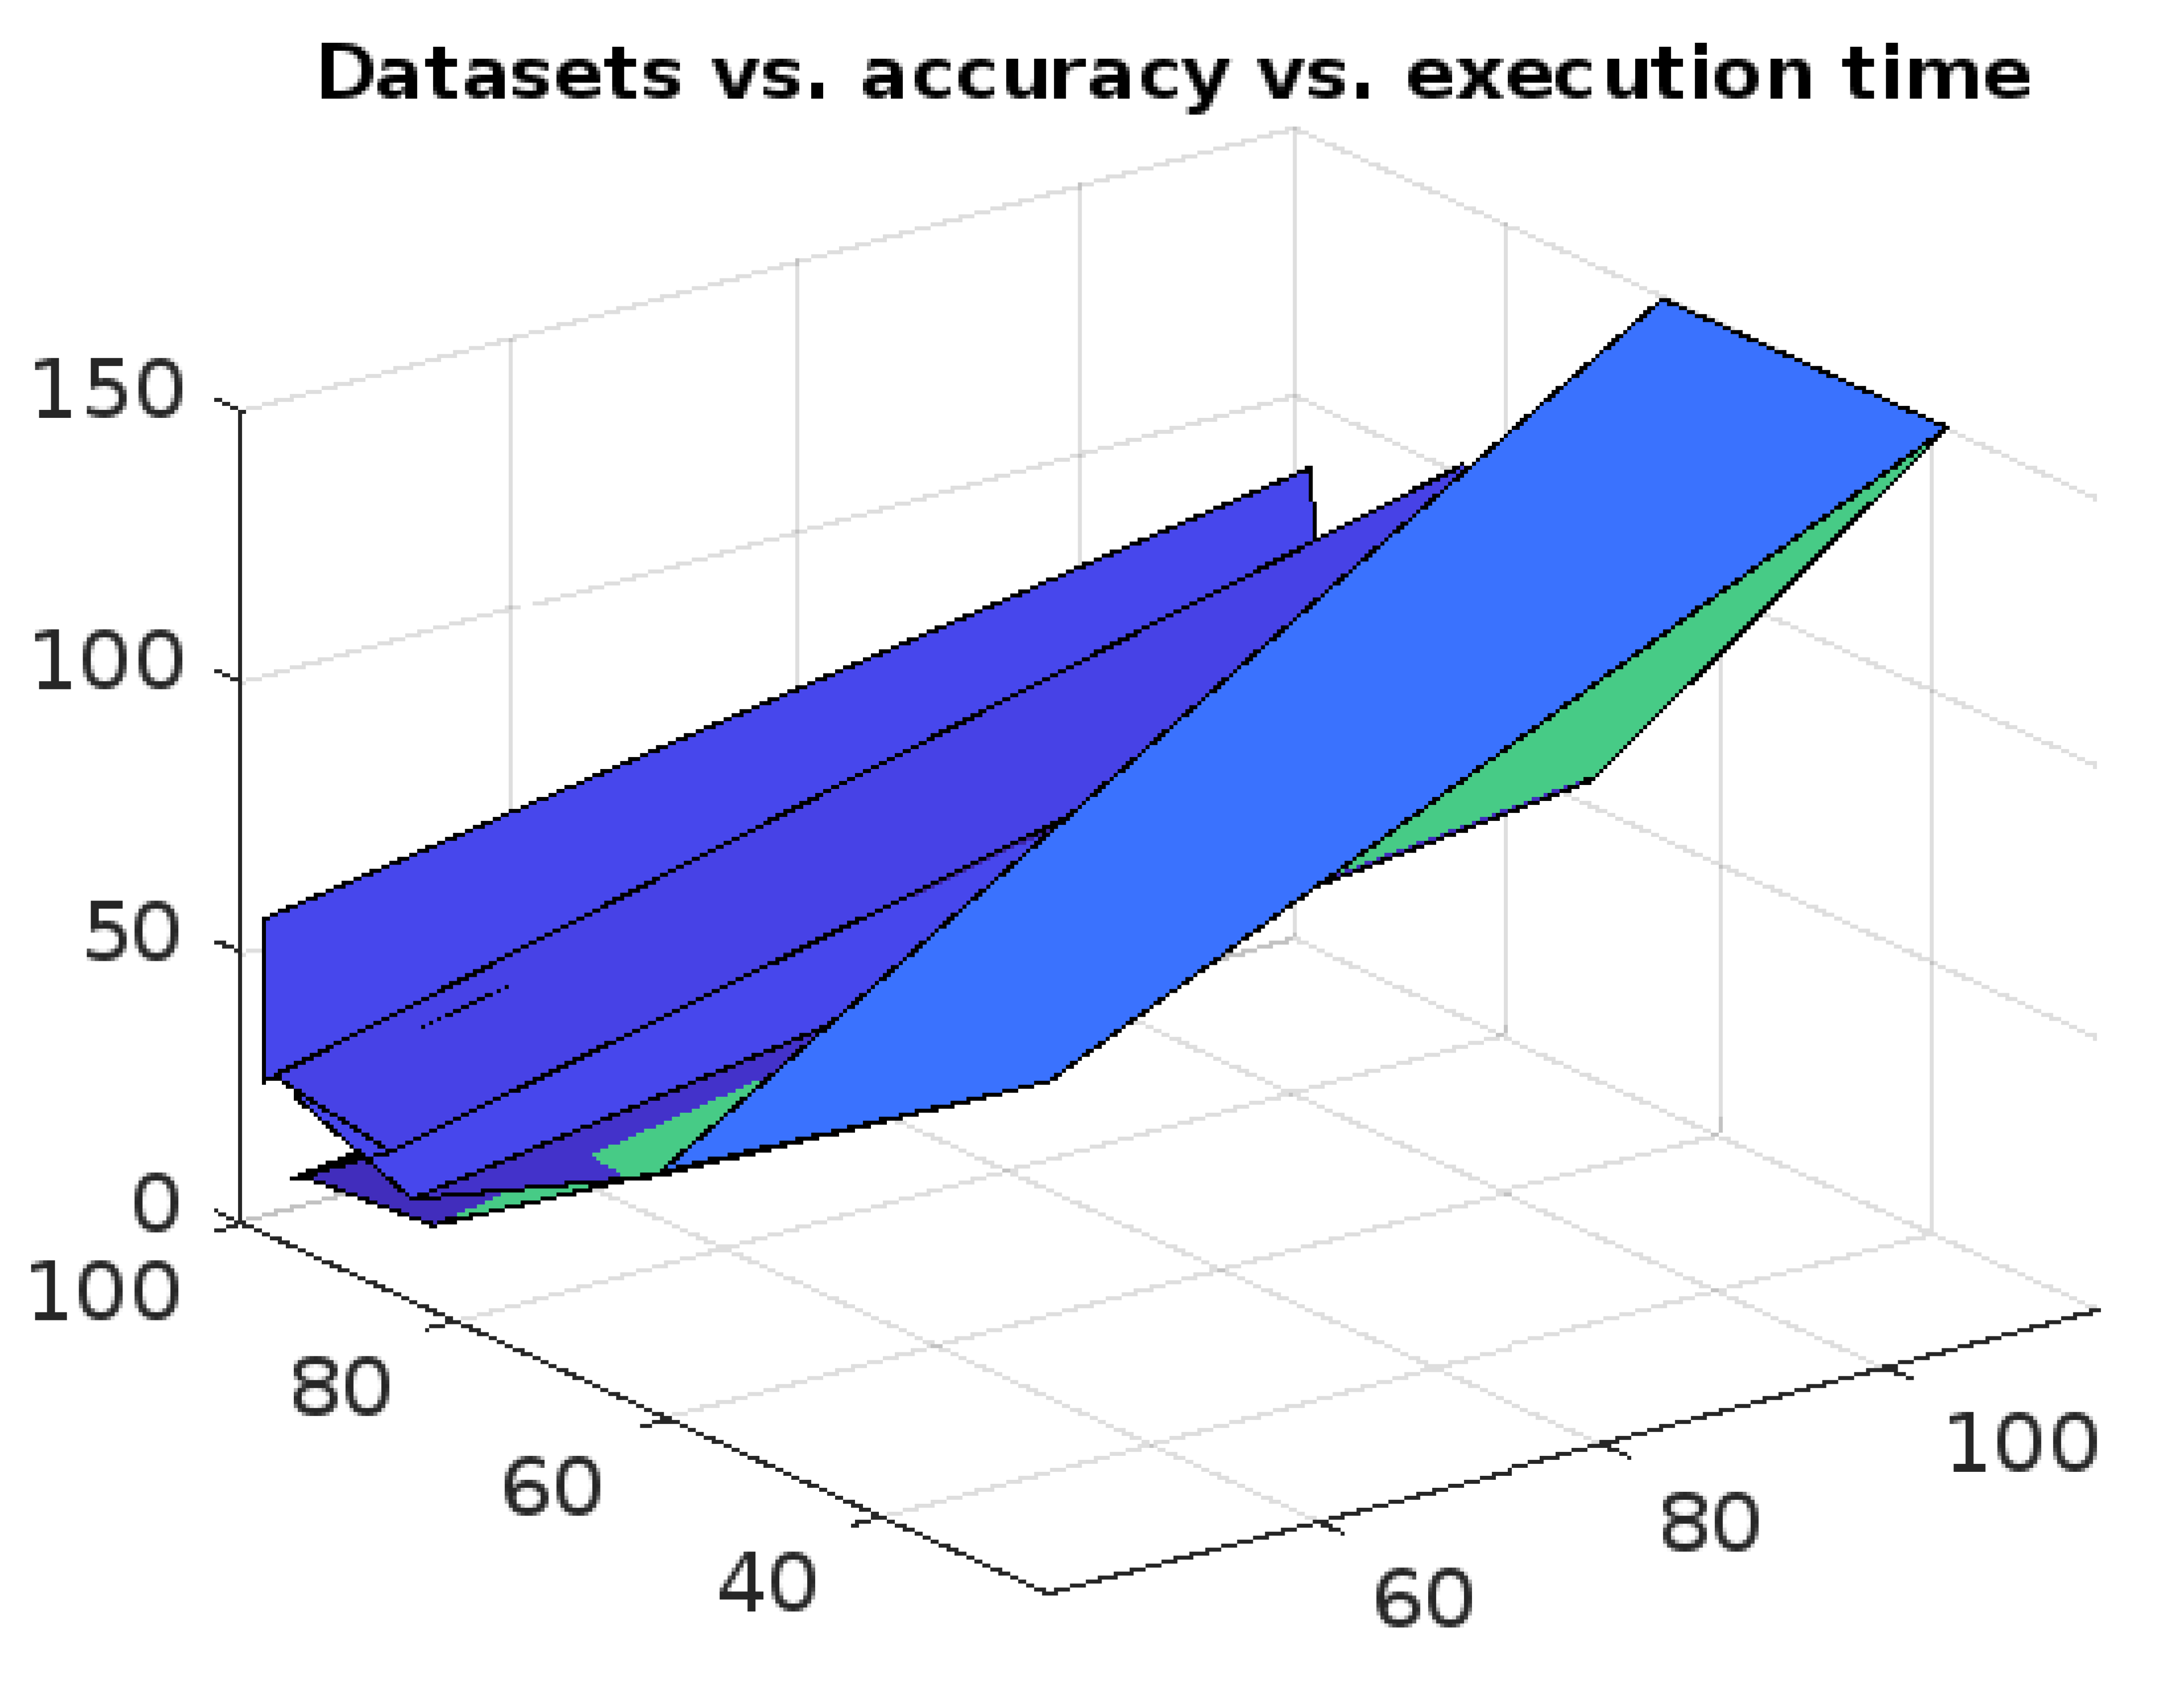
Figure 12.
Comparative analysis of all the aforesaid methods in terms of time-complexity.
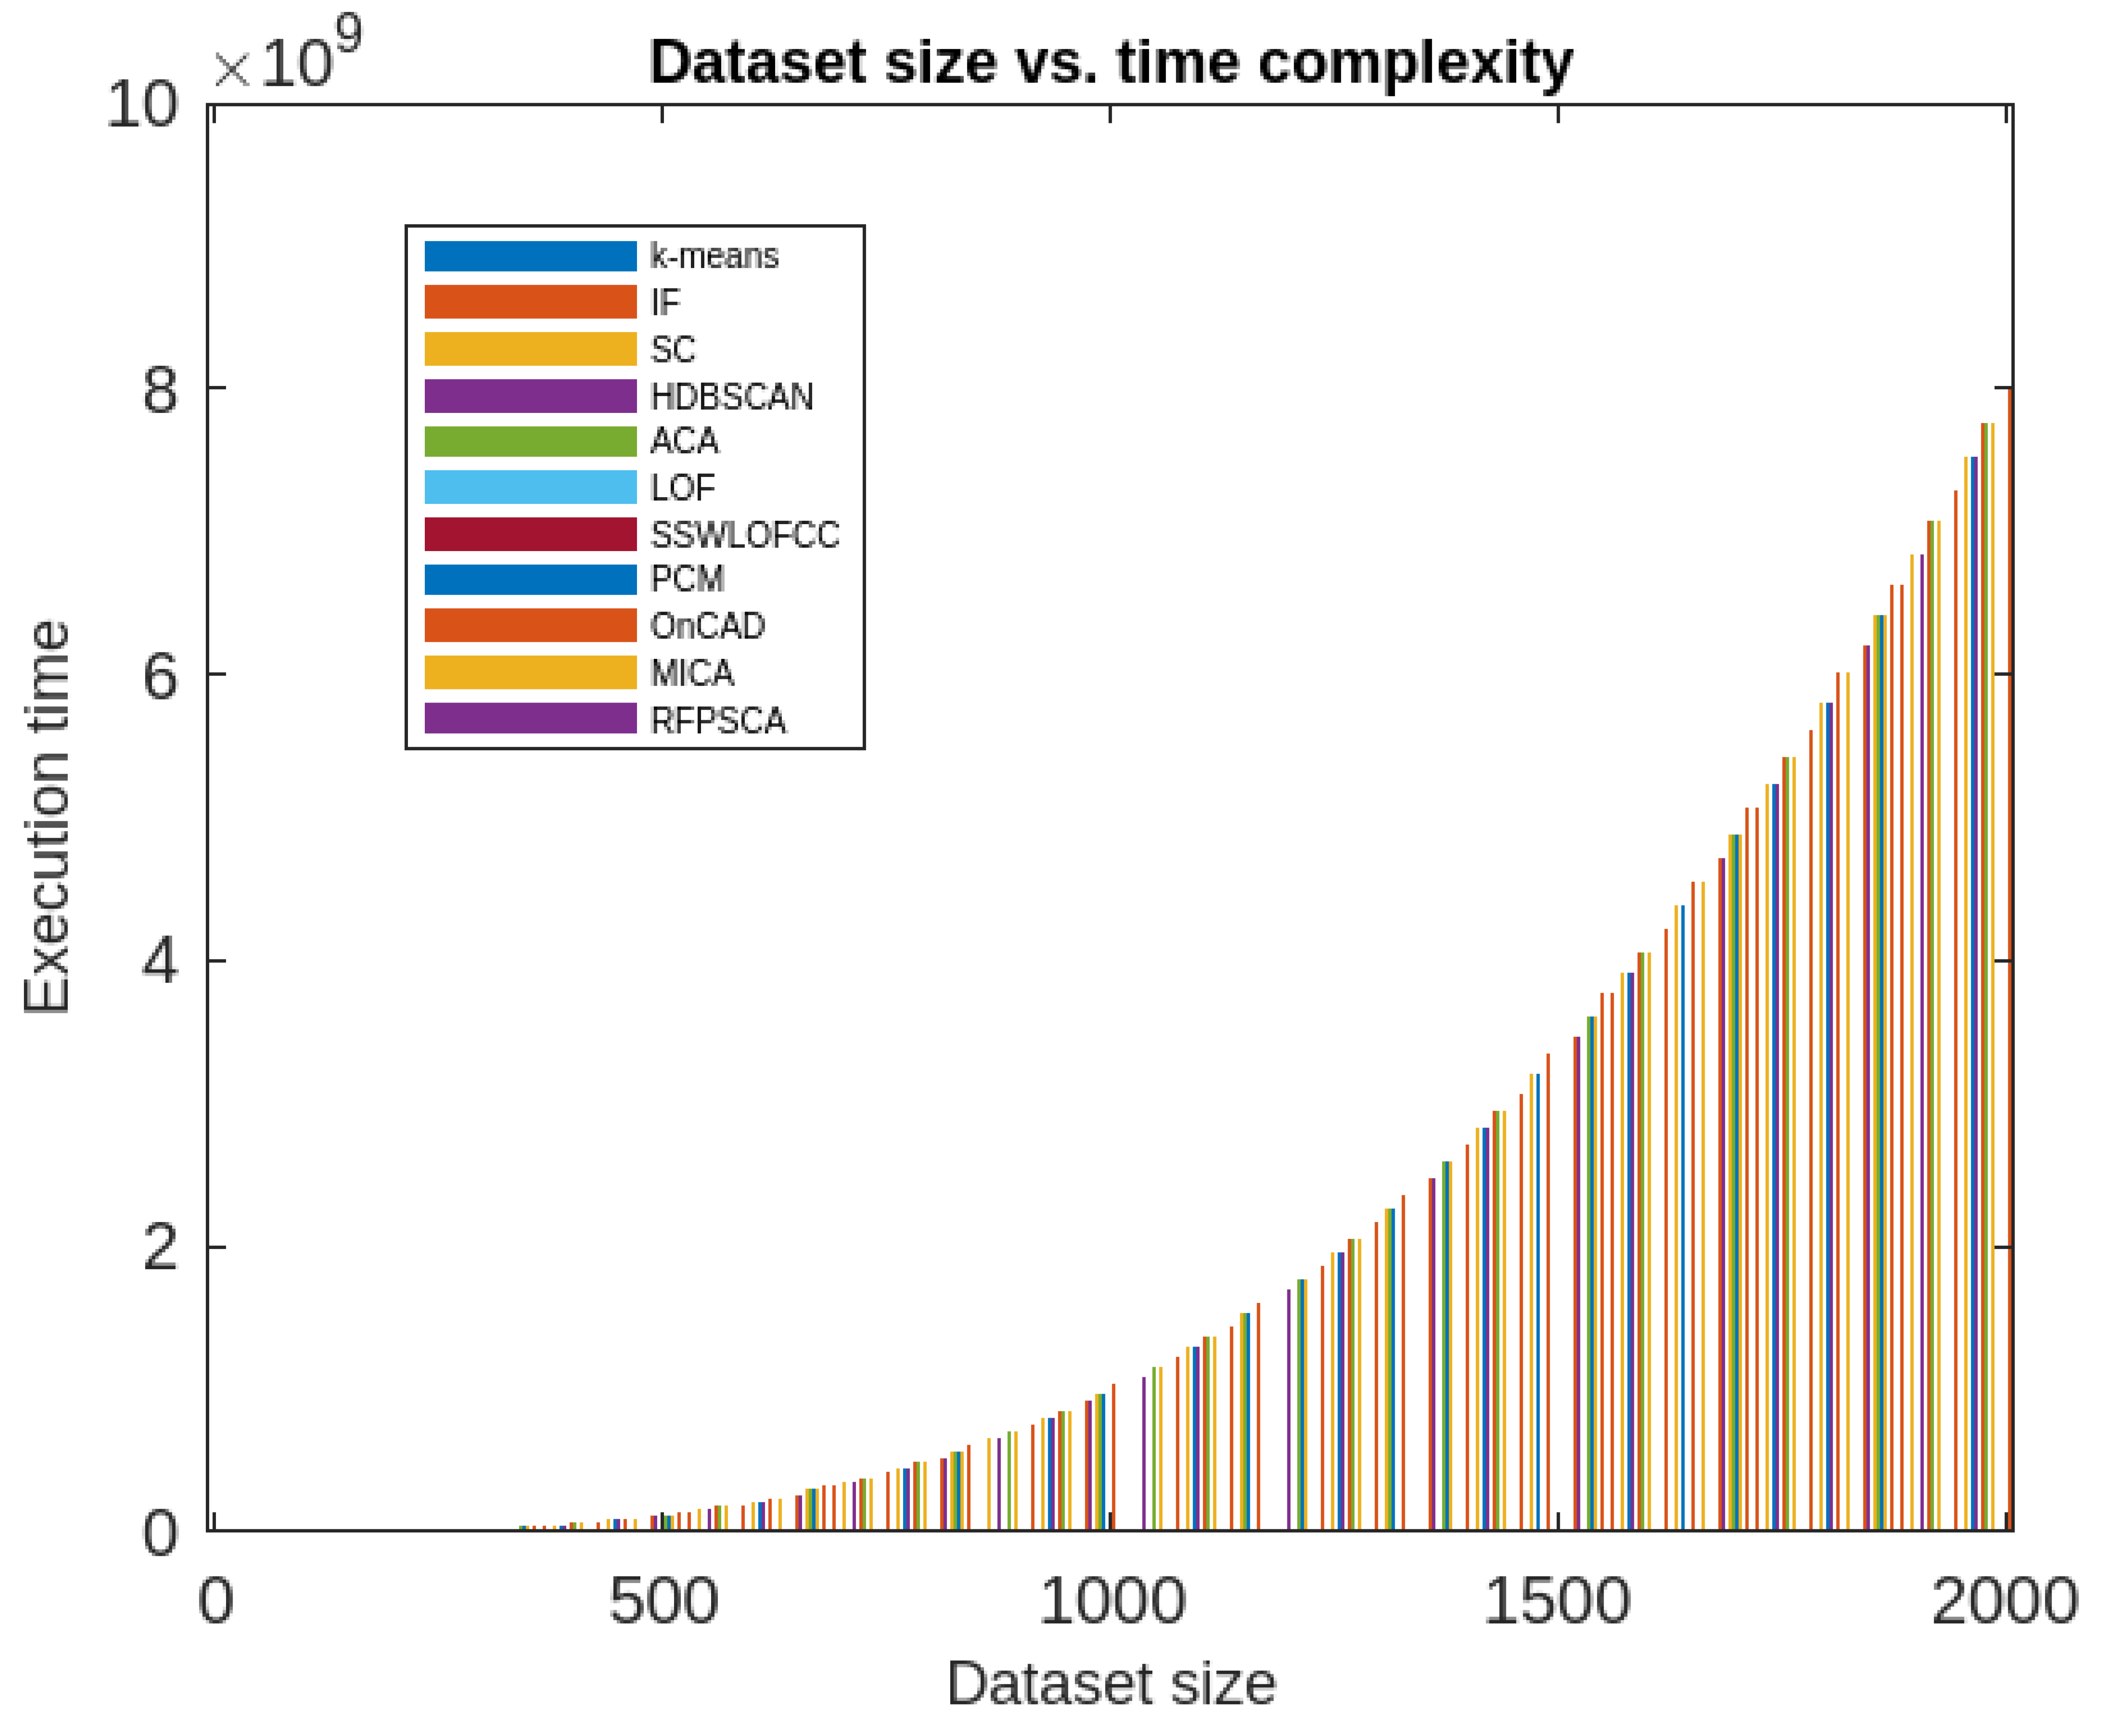
Figure 13.
Comparative analysis of all the aforesaid methods in terms of time-complexity.
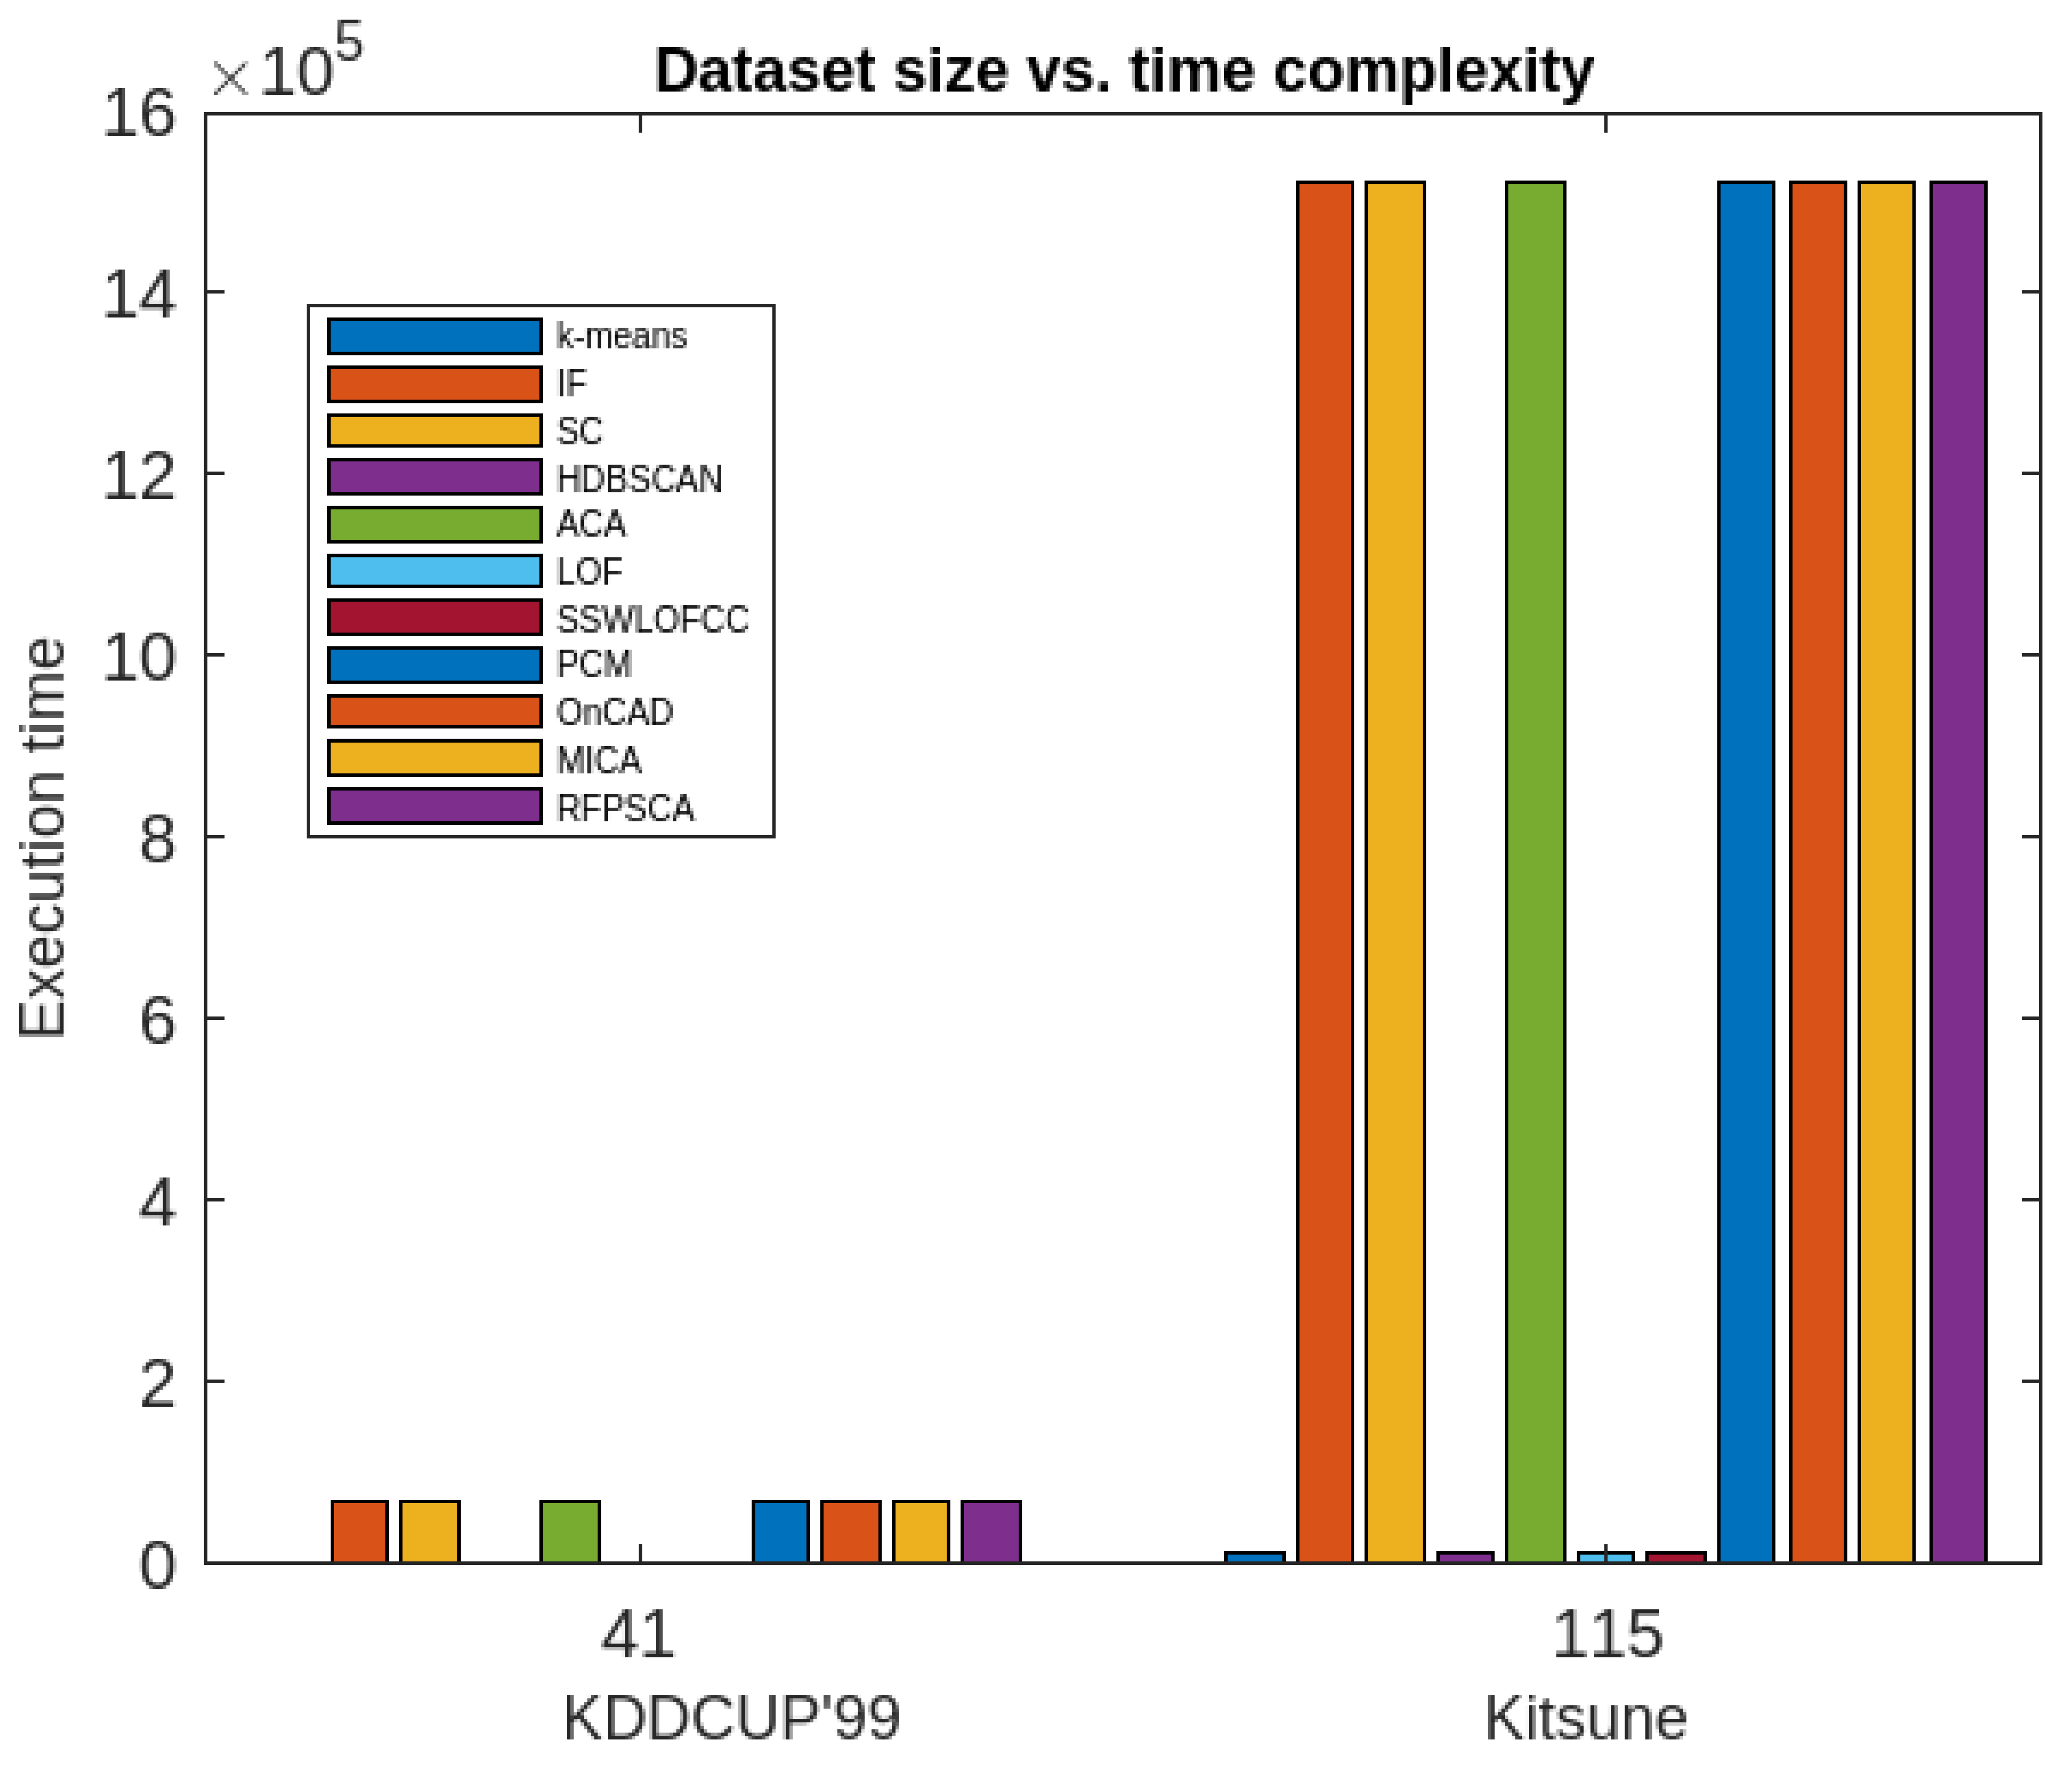

Table 1.
Comparative performances analysis of proposed method with some well-known existing methods.
Table 1.
Comparative performances analysis of proposed method with some well-known existing methods.
| Algorithms | Accuracy | Execution time | Periodic clusters obtained | |||
|---|---|---|---|---|---|---|
| KDDCUP’99 (41 attributes) |
Kitsune (115 attributes) |
KDDCUP’99 (41 attributes) |
Kitsune (115 attributes) |
|||
| 1 | k-means | 95% | 86% | 28 | 95 | × |
| 2 | IF model | 84% | 74% | 19 | 64.5 | × |
| 3 | SC | 61.1% | 65.3% | 44 | 149.5 | × |
| 4 | HDBSCAN | 24.1% | 38.5% | 95 | 150 | × |
| 5 | ACA | 82% | 72% | 16 | 54.4 | × |
| 6 | LOF | 94.7% | 90.2% | 14 | 47.6 | × |
| 7 | SSWLOFCC | 95.6% | 93.9 | 12 | 40 | × |
| 8 | PCM | 86% | 76% | 26 | 88 | × |
| 9 | OnCAD | 97% | 84% | 30 | 102 | × |
| 10 | MICA | 98% | 98% | 28 | 68 | × |
| 11 | Proposed Approach (RFPSCA) |
98% | 98.3% | 58 | 88.5 | √ |
Disclaimer/Publisher’s Note: The statements, opinions and data contained in all publications are solely those of the individual author(s) and contributor(s) and not of MDPI and/or the editor(s). MDPI and/or the editor(s) disclaim responsibility for any injury to people or property resulting from any ideas, methods, instructions or products referred to in the content. |
© 2023 by the authors. Licensee MDPI, Basel, Switzerland. This article is an open access article distributed under the terms and conditions of the Creative Commons Attribution (CC BY) license (http://creativecommons.org/licenses/by/4.0/).
Copyright: This open access article is published under a Creative Commons CC BY 4.0 license, which permit the free download, distribution, and reuse, provided that the author and preprint are cited in any reuse.


