
Submitted:
18 July 2025
Posted:
21 July 2025
You are already at the latest version
Abstract
Computer-Aided Design (CAD) software has long served as a foundation for planning and modeling in Architecture, Engineering, and Construction (AEC). In recent years, the introduction of Augmented Reality (AR) and Virtual Reality (VR) has significantly reshaped the CAD landscape, offering novel interaction paradigms that bridge the gap between digital prototypes and real-world spatial understanding. These technologies have enabled users to engage with 3D architectural content in more immersive and intuitive ways, facilitating improved decision-making and communication throughout design workflows.
As digital design services grow more complex and span multiple media platforms—from desktop-based modeling to immersive AR/VR environments—evaluating usability and User Experience (UX) becomes increasingly challenging. This paper presents a longitudinal usability and UX study of a multiplatform house design pipeline comprising a web-based application for initial house creation, a mobile AR tool for contextual exterior visualization, and VR applications that allow full-scale interior exploration and configuration. Together, these components form a unified yet heterogeneous service experience across different devices and modalities.
We describe the iterative design and development of this system over three distinct phases (lasting two years), each followed by user studies targeting different participant profiles and design maturity levels. The paper outlines our approach to cross-platform UX evaluation, including methods such as the Think-Aloud Protocol (TAP), standardized usability metrics, and structured interviews. Results from the studies provide insight into user preferences, interaction patterns, and system coherence across platforms. From both participant and evaluator perspectives, the iterative methodology contributed to significant improvements in system usability, reduced cognitive load, and a clearer mental model of the design process. Our findings highlight important considerations for future research and practice in the design of integrated, multiplatform XR services for AEC, but other domains as well.
Keywords:
Computer-aided design
; building information modeling
; augmented reality
; virtual reality
; extended reality
1. Introduction
Throughout the evolution of the Architecture, Engineering, and Construction (AEC) industry, technological innovation has served as a driving force behind advances in how professionals design and communicate spatial ideas [1]. One of the most significant milestones in this evolution has been the development and widespread adoption of Computer-Aided Design (CAD) tools. For decades, CAD software has enabled architects and engineers to move beyond traditional drafting methods, offering digital environments for modeling, visualization, and revision. While 2D drawings remain foundational, the transition to 3D modeling has become indispensable for accurately representing both the form and function of proposed structures.
Three-dimensional architectural visualizations have become standard practice for translating floor plans into spatial representations that are easier to interpret, not only for professionals but also for clients and other stakeholders. These representations help bridge the gap between abstract plans and tangible understanding. However, traditional screen-based displays, typically viewed from a bird’s-eye or orthographic perspective, often fail to convey the true sense of space and scale. Experiencing an environment from a first-person perspective, where spatial relationships and depth cues align with natural human perception, remains the gold standard for pre-construction spatial assessment, especially for the clients.
Over the past decade, immersive technologies such as Virtual Reality (VR) and Augmented Reality (AR) have matured and become increasingly accessible [2]. These technologies offer precisely the kind of spatial immersion that traditional CAD tools lack. VR allows users to step inside their designs, exploring life-sized virtual environments with a sense of presence and interactivity that can dramatically improve spatial comprehension. As Lach et al. [3] note, VR facilitates effective assessment of architectural environments by simulating realistic visuals and enabling interactive walkthroughs in a risk-free and cost-efficient manner. Also, VR medium allows the users to remain in control of their actions and surroundings. In parallel, AR overlays digital content onto the physical world, enabling users to visualize design elements in real-world contexts using mobile devices or head-mounted displays. This blending of digital and physical environments, as shown by Hajirasouli et al. [4], enhances on-site decision-making, increases the accuracy of spatial planning, and helps reduce costs and errors.
Despite the advantages of immersive systems, they are not without limitations. VR interaction paradigms—such as hand tracking and controller-based input—may offer fluid navigation but often lack the precision required for detail-oriented modeling tasks. Similarly, while AR is useful for contextual visualization, its effectiveness is limited by screen size, lighting conditions, and user comfort. Moreover, prolonged exposure to immersive environments can lead to fatigue or disorientation, raising concerns about the long-term ergonomics of such platforms [5]. Conversely, desktop applications remain superior in terms of fine control and interface familiarity, making them essential for detailed design work.
Given these trade-offs, we propose a promising approach — to integrate multiple platforms into a cohesive design pipeline. By combining the modeling strengths of desktop CAD systems with the spatial clarity of AR and VR, a hybrid workflow can emerge that leverages the best of each medium. However, this strategy introduces new challenges. Designing for a single platform already requires careful consideration of usability and interaction design. Extending that effort to multiple, heterogeneous platforms—each with its own technical constraints, interaction modalities, and user expectations—significantly increases complexity. Furthermore, such workflows are no longer just isolated software products; they form complex service ecosystems that span multiple devices, environments, and modes of interaction. A user might begin designing a house in a browser-based application, transition to a VR headset to experience the interior at full scale, and then switch to a mobile AR interface to visualize how the building would appear on a real plot of land. Across these transitions, users expect a seamless and coherent experience—both in terms of data fidelity and interaction logic. Achieving this level of continuity is a key challenge in the design of cross-media services. To better navigate these challenges, we aim to gain insight into how users interact with such systems under real-world conditions by conducting extensive Usability and User Experience (UX) tests.
In this paper, we present an end-to-end multiplatform system developed to support the design, visualization, and evaluation of modular eco-friendly houses. The pipeline includes a web-based design application for structural planning, a mobile AR component for on-site exterior visualization, and VR modules built in both Unity and Unreal Engine for immersive interior exploration. Throughout the project’s development, we emphasized user-centered design principles and conducted three rounds of usability and user experience (UX) testing, each informing the next development phase.
Our objective was to better understand how users perceive, interact with, and transition between platforms that serve different yet complementary purposes. The evaluation framework included Think-Aloud Protocol (TAP) observations, structured interviews, and standardized UX measurement instruments. Through this iterative process, we aimed to identify pain points early, prioritize usability improvements, and ensure a coherent experience across all touchpoints in the pipeline. In doing so, we contribute insights into the design and evaluation of complex, cross-platform XR services for design-intensive domains such as architecture and construction.
This paper discusses the methodology and findings from three user studies conducted on a system that integrates a web interface for the modular design of residential houses with a smartphone AR application for on-site visualization and VR applications for interior visualization and modification. The system also includes additional components for energy requirement calculations, material procurement and transport planning, as well as robotic preparation and assembly of modular panels; while these provide context for how the pipeline could automate the entire design-to-construction process, they are not the focus of this paper. We focus on intuitive interfaces aimed at non-expert users, as widening the user base beyond AEC professionals further emphasizes the need for high usability. In this paper, we outline our methodology for conducting iterative usability/UX testing, using a combination of measures applied to three distinct but interconnected components of the system: web, AR, and VR. We provide an overview of our findings, including participants’ overall impressions of each component and key observations of their experiences during testing. This paper presents the extension of our previous work [6], which we expand through inclusion of the results of a third user study to evaluate the final development cycle, as well as presenting the additional data from the first two studies which was not included in the original paper. This allows us to highlight how iterative improvements impacted user performance and satisfaction, and to discuss broader implications of evaluating a multiplatform, multi-device design pipeline in practice.
2. Related Work
Recent studies highlight that AR and VR technologies have greatly improved how designers and stakeholders visualize and communicate building designs. These Extended Reality (XR) tools enable immersive, intuitive exploration of architectural models. Researchers have catalogued multiple AEC use cases for XR – from stakeholder engagement and design support/review to construction and operations support [7]. By “stepping inside” virtual models, architects and clients can better grasp spatial relationships and aesthetic outcomes, leading to more informed discussions. The use of VR can enhance design communication among project professionals [8], allowing rich multimedia presentations in virtual space that improves stakeholder participation. Overall, the past decade’s research shows that XR-driven visualization is advancing design communication, making complex building information more accessible and collaborative
Immersive technologies in AEC have been extensively reviewed by Alizadehsalehi et al. [9] and Trindade et al. [10], focusing on Building Information Modeling (BIM) integration in Extended Reality (XR) [11] environments encompassing both VR and AR systems. However, their analyses predominantly emphasize technological advances and implementation strategies. Notably, they do not specifically address applications in residential building design, where the focus is on end-user conceptualization rather than technical specifications. Furthermore, these surveys lack user-centric approaches and empirical user studies, underscoring a gap in research on the practical usability and UX of XR in residential design contexts.
User-centered research targeting residential design and planning is limited. A handful of studies have investigated the integration of immersive technologies in design review processes, employing diverse methodologies to assess UX and system effectiveness. Mastrolembo Ventura et al. [12] and Paes and Irizarry [13] explore usability-focused, BIM-based design processes in VR, stressing the importance of structured protocols as well as human factors and user-friendly interfaces. Meanwhile, Rashidi et al. [14] and Kim et al. [15] examine Mixed Reality (MR) and VR tools for construction and design review, evaluating aspects like collaboration and efficiency. These works highlight that, beyond technical feasibility, the success of AR/VR in AEC workflows depends on considerations of usability and user acceptance.
Some research has specifically examined AR and VR for consumer-oriented home design. For example, Poushneh and Vasquez [16] studied AR in retail showroom contexts and found positive impacts on customer satisfaction and willingness to buy. Lee et al. [17] evaluated VR for interior design decision-making and emphasized ease of use as a critical factor in user adoption. While these studies contribute insights into user evaluation of AR/VR in related domains, they are largely platform-specific and do not address multi-platform interoperability. The present work therefore bridges multiple technologies—web, AR, and VR—in a single design pipeline, focusing on iterative user-centered evaluation across all components.
3. System Architecture
This paper focuses on three primary components of a larger, integrated system (as introduced in Introduction: a web-based design interface, and dedicated VR and AR applications, each shown in Figure 1. The system also comprises an automatic house assembly using robotic production lines, but that is out of scope of this paper. Although each application serves a distinct purpose and employs different technologies, they all interact with the same underlying house model stored on a centralized server.
A. Web Interface: The web interface serves as the initial point of interaction in the multiplatform house design system. It provides users with a powerful browser-based environment to model a customizable 3D house layout using standard architectural elements. The system supports intuitive interaction through client-side rendering and offers functionality suitable for both casual users and technically advanced use cases. The graphical user interface (GUI) of the web interface is depicted in Figure 2.
The most important features of the web interface are:
- 3D House Model Creation: Users can construct a complete structural model by placing load-bearing walls, partition walls, floors, ceilings, and furniture.
- Dimension Control: The interface supports dynamic adjustment of parameters such as width, height, and beam thickness, with validation and enforcement of predefined minimum and maximum values.
- Collision Detection: The system includes real-time collision detection, which prevents placing objects (e.g., furniture) in invalid positions, such as outside the boundaries of a room or embedded within structural walls.
- Construction Rule Enforcement: The system automatically adheres to domain-specific construction constraints, such as modular segment lengths (e.g., up to 625 mm), minimum widths (e.g., 300 mm), expansion gaps every 4 meters, and appropriate placement of structural components such as threaded rods.
- Design Persistence: Users can save and later resume work via backend integration. Models are stored on a server and tied to individual user accounts.
- Export Capabilities: Completed designs can be exported in STL or OBJ file formats, enabling downstream use in simulation tools or external CAD software.
When a user initiates a new design session, a default layout is automatically loaded, consisting of four exterior walls and a floor slab. Users may modify the house by resizing it, repositioning or removing interior walls, adding doors and windows, and furnishing the space with movable and rotatable items. Common editing functions such as undo, redo, and a global reset option are provided for ease of use. To enable server-side data persistence, users are required to log in. Once authenticated, they can save their design to the database or load previously stored models. The web application is hosted online, ensuring broad accessibility without installation. While all rendering and interactive operations are executed client-side for performance, authentication and persistent data handling occur on the server-side.
The web application is implemented using a combination of web and graphics technologies:
- The front-end is developed using Blazor WebAssembly (Blazor WASM), a single-page application (SPA) framework that allows developers to build interactive web applications using C# instead of JavaScript. Blazor WASM relies on the .NET runtime compiled to WebAssembly, which runs directly in the browser at near-native speed and supports both front-end and back-end development within a single ecosystem.
- The 3D visualization is powered by Three.js, a lightweight WebGL-based JavaScript library known for its efficiency in rendering interactive 3D scenes with minimal computational overhead on the client.
- For server-side processing, the system uses Blazor Server in combination with a GraphQL API and a PostgreSQL database.
B. Model Generator Application Programming Interface (API): A custom-designed API is central to the multiplatform workflow, enabling seamless integration between the web, AR, and VR components. The API facilitates bidirectional communication between immersive applications (AR/VR) and the cloud-based web service, supporting real-time model generation and content synchronization.
The API is RESTful in design and operates over secure HTTPS protocols to ensure safe data exchange. Core functionalities of the API are:
- User authentication,
- Retrieval of saved house designs,
- Dynamic 3D house model creation (e.g., floor, roof, walls etc.), and
- Dynamic loading of 3D assets (i.e., furniture models).
House designs are stored and transmitted in a structured JSON format, which encapsulates all essential parameters for procedural reconstruction—such as room dimensions, wall positions, and furniture layout. Upon receiving a request from an AR or VR client, the API returns the JSON representation of a specific design retrieved from the server. This data is then parsed on the client side, and the virtual environment is reconstructed using modular building components.
The procedural generation scripts, implemented in C#, dynamically instantiate the architecture and interior layout in Unity-based applications. The geometry is constructed by modifying presets for floor, roof, walls, windows, and doors. This approach ensures platform consistency and minimizes file sizes, as the geometry is constructed in real time rather than transferred as large 3D models.
Beyond initial model reconstruction, the API also supports asset streaming—allowing AR and VR applications to fetch individual 3D object files from the server and position them according to the saved layout. This functionality is intended only for the furniture and enables a very broad set of possible models to be loaded, as the server-side furniture database can easily be expanded. The furniture is stored in .glb format. While this approach downloads 3D information, all downloaded files are cached, and before requesting the 3D model from the server a check is performed to determine has the model already been downloaded, and if it has it is loaded from the cache. This modular approach ensures efficient loading and enables flexible updates of interior elements.
Following insights from early user studies, the API was extended to support interactive updates from the VR environment. Users can reposition furniture inside the VR app, and their adjustments (object transforms) can be transmitted back to the server via the API. These updates are then persistently stored, effectively enabling redecoration and ongoing layout personalization within the immersive environment.
C. Augmented Reality (AR) Application: AR application enables users to visualize and interact with their custom-designed 3D house models in real-world outdoor environments. AR application is developed for Android handheld mobile devices. The decision to focus on smartphones—rather than head-mounted AR displays—was driven by practical considerations: the primary use case involves on-site outdoor visualization, where consumer-grade AR headsets often struggle due to glare, limited mobility, and insufficient brightness in direct sunlight. Additionally, smartphones are a standard device which everyone has, while the market penetration of AR headsets is still very low.
The project was implemented as a 3D Unity application using the Universal Render Pipeline (URP) for optimized performance and visual fidelity. All scripting was done in C#, leveraging Unity’s native support for cross-platform development.
To support AR functionality, the following Unity packages were integrated:
- AR Foundation (com.unity.xr.arfoundation), v5.1.3,
- Google ARCore XR Plugin (com.unity.xr.arcore), v5.1.3,
- OpenXR Plugin (com.unity.xr.openxr), v1.10.0.
The AR application first requires user authentication. Participants could log into their personal accounts, synchronize with the web platform, and load their previously designed houses directly from the AR app.
Once the model is selected, user is provided with a tutorial. The tutorial showcases how to scan surfaces, how to place the virtual model in the real world, and how to manipulate the model. Figure 3 shows the tutorial GUI.
The application provides markerless plane detection, allowing users to scan their physical surroundings and identify horizontal surfaces suitable for placing virtual content. Once a plane is recognized, users can place a virtual 3D model of a house directly into the physical space. The app includes a screen-space manipulation system: instead of using fixed global axes, movement along the X and Z axes is dynamically aligned with the camera orientation and user’s finger position, enabling intuitive touch-based control as requested by the users in the initial subjective studies. To enhance spatial awareness, a real-time visualization of the local coordinate system is displayed during manipulation. Movement along the Y-axis is restricted to remain above the detected surface, preventing the model from "sinking" below the floor plane (Figure 3). The interface adapts dynamically to landscape orientation, with responsive scaling applied to all key UI elements. Finally, the user can view the house which is registered and tracked automatically with respect to the surrounding real world and through that evaluate the best possible position of the house as it is shown in Figure 4.
D. Virtual Reality (VR) Application(s): The Virtual Reality (VR) applications allow users to immerse themselves inside a life-sized 3D model of the house they previously designed via the web interface. The main functionalities supported by the VR system include:
- Displaying the 3D house model within an interactive virtual environment,
- Supporting user movement through multiple navigation methods, and
- Enabling visualization and manipulation of interior furniture.
By the third development cycle, the project included two VR applications with equivalent functionality but built using different engines: Unity and Unreal Engine. This dual implementation was introduced to compare differences in performance and user experience (UX) based on engine-level rendering pipelines and interaction models. Both versions were deployed on the same hardware platform—a VR headset (i.e., Meta Quest 3) using handheld controllers for input. It should be noted that in first two studies the Unity application was run on the untethered Meta Quest 3, while in the third study, due to the requirement of the high-fidelity ray casting shaders implemented in the Unreal VR application, VR applications were run on the PC with a powerful GPU, while they were displayed on the tethered Meta Quest device. While variations in rendering fidelity and interaction responsiveness are evident (as shown by Figure 5), both VR applications used the same server-hosted data and fulfilled an identical role within the multiplatform design pipeline. Participants in the final user study engaged with both versions, enabling a direct usability and UX comparison.
Both VR applications follow the same general workflow. Upon launch, the application retrieves the user’s saved house model from the server and loads it into the virtual scene. Users are initially presented with a tutorial, which combines textual instructions and short video demonstrations to introduce the VR interface and basic interaction techniques. The tutorial screens and instructions which are connected to the view of the controllers are shown in Figure 6.
For navigation, users can choose between teleportation and smooth locomotion, depending on their comfort and preference. Teleportation locomotion is enabled through an indicator on the end of a ray which showcases the user where he/she will be teleported and in which direction he/she will be facing after the teleportation as shown in Figure 7. The same figure also shows the control helper overlay over the controller, showing the function of each button in the application. After the first user study (referred to as Study 1), the VR applications were extended to support interactive interior layout editing. Users gained the ability to grab, move, and rotate furniture objects directly in VR. These layout changes can either be saved back to the server or discarded, enabling iterative reconfiguration of the design in an immersive context.
4. Study Methodology
A. Experiment Design and Procedure:
We adopted an iterative testing approach, conducting a series of three user studies (Study 1, Study 2, and Study 3) on successive versions of the system. Each new study was built upon the feedback and results of the prior studies, with refinements implemented between cycles. This approach was chosen to inform the development process with user feedback early and often. Study 1 and Study 2 have been described in our earlier work [6]; in this paper we include the third study to evaluate the pipeline at a more mature development stage. To minimize initial costs and complexity, Study 1 was conducted with a single group of 6 participants (Group A). After improvements were made based on Study 1 findings, Study 2 involved a total of 12 participants, divided into two groups: Group A (the same 6 returning participants from Study 1) and Group B (6 new participants). This design enabled within-subject comparisons for Group A across the first two studies, while Group B provided between-subject feedback to validate whether the changes after Study 1 improved the experience for new users. By the end of Study 2, the sample size and diversity had effectively increased, helping uncover additional usability issues that the first group might not have encountered.
Study 3 further expanded the participant base to 15 users, divided into three groups. The first group consisted of participants who had taken part in both previous studies (returning members of Group A – 5 out of 6), thus experiencing all iterations of the system. The second group included participants from Study 2 (returning members of Group B – 3 out of 6) who had not seen the very first iteration. The third group comprised entirely of seven new users who had no prior exposure to the system. This third group included several experts from relevant fields—architecture (user ID 17), computing (user IDs 13,15, 18 and 19), and marketing (user IDs 14 and 16)—in order to obtain informed evaluations and diverse perspectives on the system’s final prototype. By involving both returning and new participants (including domain experts) in Study 3, we aimed to assess how first-time users perceive the improved system and whether expert opinions align with those of lay users.
All studies followed a similar core procedure (illustrated in Figure 8 Studies 1–2, extended analogously for Study 3 with the only difference being that in Study 3 there were two VR applications tested). Participants undertook a workflow that spanned all three platforms in the pipeline. First, each participant was asked to design and save a simple house using the web application. The design task specified creating a house with two rooms, including appropriate doors, windows, and some interior furniture. Participants were informed of a maximum house footprint of 6×6 meters due to the size of the outdoor AR test area. Each participant used a provided user account (pre-created for convenience) to log into the web app and save their house blueprint to the server.
Next, participants performed immersive visualization tasks using the AR and VR applications. In Studies 1 and 2, each participant used one AR application (smartphone-based) and one VR application (Unity-based) to view their designed house. In Study 3, participants used the AR application and two VR applications (Unity and Unreal). The order of AR and VR tasks was counterbalanced in Studies 1–2 (some participants did AR first, others VR first) to mitigate ordering effects. In Study 3, since there were two VR applications, there was additional randomization as the order of trying the Unity vs. Unreal VR app was alternated between participants. All web and VR tasks took place in an indoor usability lab setting, while the AR task was performed outdoors on an empty lot, to allow life-size placement of the virtual house. For the web design task, a standard desktop computer with a keyboard/mouse setup was used. The AR task used an Android smartphone (with the AR app installed), and the VR tasks were conducted with a standalone VR HMD (Meta Quest devices: Quest 2 for Study 1, and Quest 3 for Studies 2–3) along with its hand-held controllers. Participants were given a brief introduction to the VR equipment and safety, but they interacted with the applications on their own, relying on the built-in tutorials and on-screen guidance. Although participants received instructions on the tasks and use of the VR HMD, they interacted with the application independently, relying on the built-in tutorials and instructions.
Throughout each task, we collected both qualitative and quantitative data, employing a triangulation approach that combines multiple data sources to improve validity of the study [18]. We triangulated between qualitative and quantitative, as well as subjective and objective measures as illustrated in Figure 9.
Participants were encouraged to verbalize their thoughts, observations, feelings, and strategies while interacting with the system, following the Concurrent Think-Aloud (CTA) protocol [19]. An administrator observed and took notes on participant behavior and comments. After completing each platform’s task (web, AR, and VR), a short, structured interview was conducted. In Studies 1 and 2, the interview included questions about the participant’s expectations, any difficulties in finding needed information, perceived time to complete the task, and suggestions for future improvements. Based on feedback from Study 1, an additional question about the usefulness and clarity of the in-app tutorials/instructions was added in Study 2. For Study 3, the interview questions were adjusted to capture participants’ overall impressions of each application in its final form. After each of the four components in Study 3 (web, AR, Unity VR, Unreal VR), participants were asked: (1) “What is your general impression of this application?” (2) “If you could change anything in this application, what would you change?” (3) “If this application were commercially available, would you use it?”. After completing all tasks, participants were also asked to comment on the overall system concept (considering also the automated fabrication aspects that were explained to them), including which component they found most useful.
Participants also completed several standardized questionnaires at different points in the study (summarized in Table 1). Before beginning any tasks, a demographic and background questionnaire gathered basic information (age, gender, education, occupation) as well as prior experience with relevant technologies (e.g., CAD software, interior design tools, AR, VR) and real estate experience (ownership or past involvement in home buying, building, renovation, etc.). This was done to ensure a diverse sample and to later interpret results in light of user background. To quantify individual differences in affinity for technology, we administered the Affinity for Technology Interaction (ATI) scale [20] as a pre-test measure. During the study, after each application task, participants filled out a one-item Experience Quality (QoE) questionnaire (rating overall experience quality on a 5-point Mean Opinion Score scale from 1=Poor to 5=Excellent). They also filled out the System Usability Scale (SUS) [21] after each of the three platform tasks (web, AR, VR). To assess the sense of spatial presence provided by the immersive applications, we used selected dimensions from the MEC Spatial Presence Questionnaire (MEC-SPQ) [22]. Specifically, we included subscales that measure the Spatial Situation Model (SSM), Self-Location (SPSL), Possible Actions (SPPA), and Suspension of Disbelief (SoD), each rated on a 5-point agreement scale. These presence questionnaires were administered after each AR/VR task (and not for the web app, since spatial presence is only relevant to XR experiences). Finally, to evaluate technology acceptance of the overall system, we employed a modified Technology Acceptance Model (TAM) questionnaire [23,24] at the end of the session. This questionnaire, administered once after using all components, gathered user ratings of the system’s perceived ease of use (PEU) and perceived usefulness (PU), as well as their attitude toward use (ATU) and behavioral intention to use (BIU) the system in the future. Unlike the other questionnaires which were tied to specific applications, the TAM-based questions were phrased to assess the entire multiplatform system (web+AR+VR together) as an approach to house design. All questionnaires were provided in the users’ native language (Croatian), using either established translations or carefully translated/adapted versions to ensure comprehension.
B. Participants
A total of 6 participants (ages 25–59) took part in Study 1, 12 participants (ages 23–68) in Study 2, and 15 participants (ages 27–59) in Study 3. Across all studies, we recruited adult users with varied backgrounds to capture a wide range of perspectives. Participants ranged from their early 20s to late 60s in age, with educational levels from high school to PhD. Professions included students, engineers, designers, marketing specialists, and architects, among others. None of the participants in any study were AEC industry professionals specializing in CAD or BIM, as our target user base is non-experts. However, by Study 3 we intentionally included a few domain experts (in architecture and related fields) as part of the third group to evaluate the system from an expert standpoint as well.
Prior experience with AR/VR varied widely. A minority had significant prior exposure to VR or AR; many had little to no experience with immersive technologies or interior design software (IDSW). Participants’ prior experience with technologies relevant to this study was highly diverse, though generally limited. This variability was intentional, as it allowed us to observe both tech-savvy and less tech-oriented users. The sample in Study 3 (with all details shown in Table 2) also varied in real-estate experience – some participants had personal experience in home ownership or renovation, while others did not – to gauge the system’s appeal to those with a potential practical interest in home design versus those approaching it purely as a novel technology demo. Additionally, compared to participants in the first and second groups, those in the third group demonstrated a higher affinity for technological interaction, as measured by the Affinity for Technology Interaction (ATI) scale [20]. This suggests a greater level of user expertise in evaluating application quality and strengthens the representativeness of the sample, as early adopters of such systems are typically more inclined toward technology use. For the same reason, it is encouraging that third-group participants also reported a higher interest in the specific domain of construction, renovation, and fixed property design, as measured by the MEC-SPQ questionnaire [22].
The same instrument was used to assess visual-spatial imagery ability, which varied widely among participants. All related data are presented in Table 2, It is important to highlight that the inclusion of participants with lower levels of technological affinity, domain interest, and spatial reasoning ability improves the study’s ability to capture experiences across a broader spectrum of users.
All participants were volunteers who gave informed consent. They were briefed on the study procedure and made aware that they could take breaks or withdraw at any time. During the sessions, an administrator was present to ensure safety (especially during VR tasks) and to observe but intervened only if participants had technical difficulties or questions. Each study session (for one participant) lasted roughly 1.5 to 2 hours, including the introduction, tasks, interviews, and questionnaires. Participants received a small token of appreciation for their time upon completing the study.
5. Study Results and Discussion
Given the iterative nature of our development, we summarize the results across the three studies with an emphasis on how user feedback and performance changed over time. In this section, we first report key quantitative results from user questionnaires and logged usage data, then discuss qualitative observations and participant feedback. Due to the small sample size in all three studies we present the quantitative results reporting the number of ratings rather than descriptive statistics such as means or modes, as recommended in [25]. Finally, we reflect on the overall UX of the multiplatform pipeline and the effectiveness of the iterative approach.
A. Task Completion and Interaction Times:
As in previous testing iterations, participants spent the most time using the web application, with an average duration of 15 minutes and 7 seconds (Table 3). One outlier significantly skewed this result by spending nearly an hour on the task. Excluding this participant, the average drops to 14 minutes and 22 seconds, marking the shortest usage time across all three studies (compared to 16:03 in the second study and 15:39 in the first). This decline suggests that returning participants benefited from prior experience, and it may also indicate improved usability in the updated version. Among new participants, the average time was even lower, at 12 minutes and 27 seconds (or 14:05 when excluding the fastest user). Usage of the web application remained longer than the immersive apps, which is expected given the more complex nature of the design task compared to virtual walkthroughs
In the AR application, participants spent an average of 6 minutes and 3 seconds, which is shorter than the average duration in the previous study (7 minutes and 54 seconds) and the first study (7 minutes and 8 seconds). When isolating only the third participant group, the average remains slightly higher at 6 minutes and 34 seconds, but still below earlier iterations. These results suggest that improvements made in response to user feedback from earlier testing cycles likely had a positive impact on learnability and usability, helping participants navigate the interface more efficiently and complete the task more quickly.
Across the three study cycles and application types, one general trend was a reduction in task completion times for similar tasks, suggesting usability improvements. For instance, in the VR application, the average time participants spent accomplishing the required tasks (exploring the house and rearranging furniture) decreased from Study 2 to Study 3. In Study 2, users in the VR app (Unity) spent on average ~11 minutes 19 seconds on the task, whereas in Study 3 the average for the same VR app was ~7 minutes 3 seconds. It should be noted that in Study 1 the average was 5 minutes and 10 seconds, but that was before the functionality of the furniture manipulation was added. This drop indicates that the modifications made after Study 2 (e.g., refining the VR controls and tutorial) successfully made the interface more learnable and efficient for new users. Also, this might be a result of some users first using Unreal VR app and therefore familiarizing themselves with the app functionalities and goals. Even first-time users in Study 3 (Group 3) completed the VR tasks in reasonable time (~8m14s on average for Unity VR), only slightly longer than experienced users, which underscores the improved intuitiveness of the final design.
In Study 3, where two VR applications were available, we observed minimal differences in task time between the Unity and Unreal versions. Participants from the experienced groups (1 and 2) spent on average 7 minutes 27 seconds in the Unity VR app vs. 7 minutes 53 seconds in the Unreal VR app. New users (group 3) similarly spent about 8 minutes 14 seconds in Unity vs. 8 minutes 36 seconds in Unreal on average. These small differences (on the order of only 20–30 seconds) suggest that neither version posed a significant difficulty barrier. If anything, the Unity app was used slightly faster; this could imply it was a bit easier to use, a notion echoed by participant comments who often found the Unity interactions more straightforward. On the other hand, some users also chose to spend a bit longer exploring the Unreal VR environment, possibly drawn by its different visuals. Overall, the comparable times indicate that both implementations were viable, and any usability differences were subtle.
B. User Experience Ratings (Qualitative of Experience)
Users’ individual ratings provided by each participant (ID) across all three studies (S) and groups (G), with results from QoE, SUS and MEC-SPQ (SSM, SPSL, SPPA, SoD) questionnaires are presented in Table 4. Due to the space constrains we omit the data regarding the Unreal VR application, but as is shown in the Figure 10 showcasing the QoE scores of Unity and Unreal VR applications the scores are very similar, and this similarity spans across majority of the tested metrics.
In this subsection and the following we interpret the data presented in Table 4. Participants provided an overall Quality of Experience (QoE) rating (on a 1–5 scale) for each application after use. The results showed that immersive applications achieved very positive scores, especially by the final study. In Study 1, participants rated their experience with the web app around “good” on average, but AR and VR experiences tended to be rated “very good.” By Study 2, as the applications were improved, the QoE ratings rose. By Study 3, the VR applications received the highest QoE scores among all components, with median ratings at the top end of the scale for many participants. Figure 3 (from Study 3) illustrates this trend: both the Unity and Unreal VR apps achieved higher median QoE scores than the web or AR apps, indicating that users found the immersive parts of the pipeline particularly engaging. Notably, the Unity-based VR app received slightly higher QoE ratings than the Unreal-based VR app across all participant groups (Figure 10). According to participant feedback, this was likely due to the Unity app’s interaction mechanics being a bit more polished or familiar – users reported that grabbing and moving objects felt more natural in Unity VR, and a few preferred its visual style or interface feedback. Meanwhile, the AR application was also rated positively (typically “very good” on average) in Study 3 as is depicted in Figure 11. There was more variance in AR QoE ratings for some groups (e.g., Group 2’s AR ratings were slightly lower), but this was largely attributed to one or two individuals encountering minor tracking issues or being generally less impressed with AR. Encouragingly, the entirely new users (Group 3) gave the highest QoE ratings to both the AR and web applications in Study 3, despite never having seen them before. This suggests that the iterative improvements (such as better AR instructions and a revamped web UI) made a strong positive first impression on novices.
In Study 1, participants seemed to be the least satisfied with the web application compared to immersive applications. Participants highlighted shortcomings in interface design, e.g., inconsistencies in UI element positioning and lack of guidance throughout the application. The web application, as the core tool for house design in our system, offers a significantly more complex set of features compared to the immersive applications. This complexity may have made the web application harder to design and implement effectively and in a satisfactory way. Web application scores improved in Study 2. Also, they were slightly lower in Study 3 than in Study 2, but if omitting a highly critical user 14 the scores are almost the same, indicating that further work is needed on the web application.
From an iterative development perspective, these QoE results confirmed that changes between cycles were moving the system in the right direction. The fact that returning users (Group 1) continued to rate the system highly – and even higher in many cases – while new users (Group 3) also rated it well indicates that we addressed many of the initial pain points. In summary, by the final evaluation, users generally found the experience of designing in web and then visualizing in AR/VR to be engaging and of high quality.
C. Usability and Interface Satisfaction
We measured perceived usability primarily via the System Usability Scale (SUS), which yields a score out of 100 for each application. Consistent with the QoE trends, usability ratings improved with each iteration of development. After Study 1, the web application had the lowest SUS score (participants identified various interface issues), whereas the VR app had a higher SUS. By Study 2, the SUS for the web app increased considerably thanks to a major UI overhaul (new color scheme, iconography, and layout). That redesign, executed in the second development phase, made the web interface clearer and more intuitive; users in Study 2 expressed satisfaction with the cleaner visual design and better-organized tools. Study 2’s results already indicated significantly improved web usability and experience quality over Study 1, although certain metrics like perceived usefulness had room for further improvement.
In Study 3, the SUS results for each platform were positive (61,48 for web, 69,81 for AR and 81,30 for Unity VR). Figure 12 shows boxplots of SUS scores for the two VR applications, which were both rated as “excellent – A grade” by participants across the board. In fact, the VR interfaces received the highest usability scores of any component, over all three studies. Users appreciated the combination of clear instructions, responsive controls, and effective UI design in VR, commenting that after a brief learning curve, the tasks (locomotion, object interaction, menu usage) were easy to perform. There were minor differences between Unity and Unreal VR apps’ SUS: a few participants in Group 2 rated the Unreal VR app’s usability a bit lower, likely reflecting their adjustment to the alternate control scheme. However, both VR implementations were rated very similarly and well within “acceptable” ranges. This high degree of usability in VR is notable, given that VR can often suffer from control complexity; it suggests that our efforts to streamline interactions (and provide tutorials) were effective.
The AR application’s usability was rated as above average as a score of 68 is generally perceived as average with grade C+/C (Study 2 and Study 3 respectively). Participants in Group 3 (the new users) gave the AR app the best usability scores, with an extremely high median on SUS. This is possibly because many of them were younger and tech-savvy, adapting quickly to the AR interface. Group 1’s AR usability ratings were also positive, while Group 2’s were a bit more mixed (one of the returning older users still found AR somewhat challenging, which lowered that group’s average). Nonetheless, the majority of participants found the AR app to be highly usable in the detailed interviews, citing the intuitive surface scanning and straightforward placement controls. By Study 3, only minor usability complaints remained for AR (e.g., a wish for slightly faster tracking initialization or more feedback when the model is anchored).
The web application in Study 3 was perceived as increasingly usable when compared to the early-stage Study 1 and similarly usable when compared with the Study 2. The overall score is in marginal zone with grade C-/D (in Study 2 and Study 3 respectively). The new-user Group 3 gave the web app the highest SUS ratings of all groups, indicating that first-time users now find it quite easy to use. This is a strong indicator that the iterative UI/UX improvements paid off. Group 1 and Group 2 also rated the web interface positively, though Group 2 (who only saw it from Study 2 onwards) was generally the most critical across measures (this trend of Group 2 being “stricter” in ratings was observed in many metrics).
In summary, by the final cycle, all three platform components achieved improvements in usability levels over the course of the development, with the VR apps topping the list, followed by AR and web. The high SUS scores for VR and AR suggest that our cross-platform design did not compromise usability—on the contrary, with careful design each modality can be made approachable. The results also underscore the value of iterative refinement: changes between studies (like reorganizing toolbar layouts, adding confirmation dialogs, refining controller mappings, etc.) were guided by user feedback and led to measurable improvements in perceived usability.
D. Spatial Presence and Immersion
For the Spatial Situation Model (SSM) dimension (which gauges how well users internalize the spatial layout of the environment), participants generally gave high ratings for both AR and VR with VR being the significantly higher (average 3,87 vs 4,47 in Study 3). In AR, ratings were a bit varied among individuals, but the median indicated that users could get a “very good” idea of the house’s size and room layout via the AR experience. Many users commented that being able to walk around the projected house on the actual ground gave them a concrete sense of its dimensions. The VR applications, owing to full immersion, scored extremely high on SSM – most participants almost “felt” the space as if it were real. Interestingly, the Unreal VR app scored slightly higher than the Unity VR app on SSM (average 4,66 vs 4,46 respectively). Since both VR versions had the same geometry and scale, this difference likely stems from visual realism: participants found the Unreal Engine’s graphics (textures, lighting) more realistic, which may have enhanced depth cues and spatial perception. Several users indeed remarked that shadows and lighting in the Unreal VR made rooms feel more lifelike, potentially explaining the marginal edge in spatial comprehension scores for Unreal.
The Self-Location (SPSL) dimension reflects the feeling of “being there” in the virtual environment versus the real world. As expected, AR scored lower on self-location then VR (average 3,67 vs 4,48 In Study 3)– since users in AR can still see the real surrounding environment and know they are standing outdoors, they didn’t feel “transported” somewhere else (AR by nature doesn’t fully replace reality). Nonetheless, even with AR, a number of participants reported moments of strong presence (several indicated that after placing the house, they did get a very good sense of being co-located with the virtual structure). The VR apps scored significantly higher on self-location than AR, given the fully virtual setting. Moreover, the Unreal VR app outperformed the Unity VR app on self-location ratings as well (average 4,73 vs 4,48). This again likely ties back to the heightened visual realism in Unreal – the more convincing the virtual world, the easier it is for users to feel present in it. Users with both VR experiences often noted that while both were immersive, the Unreal version’s graphics sometimes made them “forget for a moment” that they were in a lab, slightly more so than Unity’s graphics.
For Possible Actions (SPPA), which measures the perceived interactivity and the user’s sense of agency in the environment, VR also rated higher than AR. The AR application inherently has limited interactions (one can place/move the house model, but not much beyond that), so AR’s SPPA scores were modest (average 3,48 in Study 3, but in other studies it had very similar average scores). This is expected, as the AR app’s purpose was primarily viewing, not heavy interaction. In VR, participants could navigate and move objects, yielding higher agency. Interestingly, participants rated Unity and Unreal VR nearly the same on SPPA on average. Both VR apps allowed the exact same set of interactions, and participants acknowledged that interactivity was “very similar” between them. The Unreal app showed slightly less variance in SPPA scores (users were more consistent in rating it), but there was no clear consensus on which was better. In fact, a number of participants explicitly said they found Unity’s interactions easier or more responsive, whereas a couple preferred Unreal’s physics feel. The near-equal SPPA outcome is somewhat surprising given the noted interaction differences; as the report notes, this result was “unexpected and without a clear explanation”. It could be that despite Unity’s interaction mechanics being preferred, users still felt they could do as much in Unreal, even if it took a bit more effort, resulting in similar perceived agency.
Finally, Suspension of Disbelief (SoD) was measured to see if users could ignore system imperfections and remain immersed. Overall, VR scored higher than AR on SoD (again, not surprising since AR users are continuously reminded of reality). However, a notable finding was that the Unity VR app scored better on SoD than the Unreal VR app (average 2,4 vs 2,23). This is the inverse of the pattern seen in the other presence subscales and ties back to user comments: while Unreal’s graphics were more realistic, the Unity app’s smoother interaction and interface caused fewer “breaks in immersion.” Participants reported that certain interaction quirks in the Unreal app (e.g., slightly less intuitive object grabbing or a few minor bugs) would momentarily remind them they were in a simulation, thereby “pulling them out” of the experience. In Unity VR, because interactions were a bit more seamless, they could stay immersed and ignore small flaws more easily. This highlights an important trade-off: visual realism (Unreal) boosts perceptual immersion, but interaction design (Unity’s strength) is crucial for maintaining that immersion. In a few cases, users noted that struggling with controls in Unreal made them more critically aware of the test setting and the system itself, rather than just enjoying the experience.
In summary, the presence results show that our VR applications were successful in delivering a strong sense of spatial presence, with the Unreal engine providing a slight edge in spatial perception and “being there,” whereas the Unity version excelled in providing frictionless interactions that help sustain immersion. The AR application, while inherently less immersive, still contributed meaningfully by allowing users to gauge real-world scale and context, which is a unique benefit of AR (several participants pointed out that only in AR could they see the house in relation to real outdoor surroundings, a perspective VR could not give).
E. Technology Acceptance
Beyond usability and experience in the moment, it is critical that users are willing to adopt a new multiplatform solution like ours. We assessed this through the modified TAM questionnaire at the end of Study 3, and the results were highly encouraging. Participants gave very high ratings for perceived ease of use and usefulness of the overall system. The median rating for Perceived Ease of Use (PEU) was at the maximum end of the 7-point scale (median = 7, mean well above 6 as shown in Figure 13). In fact, a large number of participants rated ease of use as 7/7, indicating they found the system as a whole to be straightforward and manageable, despite having to use three different applications. This is a strong testament to the success of our usability - focused iterations – by the final cycle, the multi-app workflow did not overwhelm users. Achieving such a high PEU is notable, as ease of use is a known driver of user adoption for new technology.
The Perceived Usefulness (PU) of the system was rated very highly, with an average and median of about 6 out of 7 (as shown in Figure 13). Participants clearly recognized the value in what the system offers: they saw how being able to design a house and then immediately visualize and experience it in AR/VR could save time, reduce mistakes, and improve decision-making compared to traditional methods. Many participants – including those with some home ownership or architecture experience – commented that such a pipeline would be “extremely useful” for planning renovations or communicating ideas with clients. High perceived usefulness is critical, as it correlates with motivation to adopt the system in practice. The fact that users believed the system would bring real benefits (not just be a cool demo) bodes well for its real-world applicability.
Participants also reported an extremely positive attitude toward using the system (ATU) (Figure 14). The average ATU score was above 6/7, with the median near 7. This indicates that users not only see the system’s utility, but they also liked the idea of using it and were generally enthusiastic about it. A positive attitude suggests that if the system were available, users would have a favorable disposition toward incorporating it into their routines or projects. Qualitatively, several participants said they found the experience “fun” and “engaging,” and importantly, not frustrating – which ties back into attitude. This emotional acceptance is important for technologies that might otherwise intimidate new users (combining web, AR, and VR could seem complex, but our participants felt it was approachable and even enjoyable).
Finally, and perhaps most importantly, the Behavioral Intention to Use (BIU) the system was very strong (Figure 14). We expected some caution here – after all, our pipeline involves significant technology and the context of house design is a high-investment, infrequent activity. It would be understandable if participants were hesitant to say they’d use it in real life. However, the results showed a median BIU of 6/7 (and an average above 5/7). In other words, users expressed a clear willingness to use this system if it were available for their own home design or buying projects. This is remarkable given the complexity behind the system. It suggests that the concept of an integrated design+VR/AR workflow resonates with users – they see enough value that they would invest time/money to use it. One participant (an architect) noted that they “would recommend this to clients or colleagues” if it were a product, and a marketing professional in the group said they could see people “paying for this service when planning to build a house.” Of course, a few users did remain cautious – as expected, a couple of participants pointed out they wouldn’t personally use it unless they were actually in the market to design or build a home, which is a fair point given not everyone frequently has such projects. Even so, the overall intent-to-use signal was very positive, indicating a strong market potential for a solution like this.
To put it succinctly, our technology acceptance findings demonstrate that users not only find the multiplatform system usable and useful, but they are also genuinely interested in using it moving forward. This aligns with the ultimate goal of our project: to create a tool that people want to use, bridging the gap from novelty demo to practical adoption.
F. Qualitative Feedback and UX Findings
Throughout all studies, we collected rich qualitative feedback that guided improvements. By Study 3, many earlier issues had been resolved, but participants still offered insights. Common themes from the final study’s feedback included:
- Web Interface Feedback: New users in Study 3 generally found the web app easy to use, praising the simplified color scheme and icons introduced in the second cycle. Some returning users noted that certain features (like the wall editing tool) had become more intuitive after redesign. A couple of participants suggested adding more “smart” features, such as alignment aids or a short tutorial in the web app (noting that the VR had a tutorial but the web relied on users discovering functionality). This is a potential area for future enhancement.
- AR Application Feedback: Users enjoyed placing the house on real ground and found it “satisfying” to walk around it. One issue that a few participants (especially older ones) had was difficulty viewing the phone screen in bright outdoor lighting; they suggested perhaps adding a mode for higher contrast in the UI for outdoor use. Tracking was generally robust. Several users in Group 3 commented that the AR app would be even more useful if it allowed them to modify the design on the spot (e.g., move a door and see the change immediately), essentially combining design and AR visualization. This points to an interesting future direction of blending editing capabilities into the AR module.
- VR Application Feedback: The introduction of object interaction in VR (after Study 1) was very well received. Participants in Studies 2–3 spent extra time moving furniture and genuinely exploring interior layouts. The tutorial in VR was highlighted as extremely helpful by new users – in Study 1 some users struggled at first without guidance, whereas by Study 3 almost everyone smoothly followed the tutorial prompts and got comfortable with VR controls. This underscores the importance of good onboarding in VR. Users did point out differences between Unity vs. Unreal VR: a few preferred the slightly sharper visuals of Unreal, but more preferred the interaction responsiveness of Unity. In interviews, many stated they would want the “best of both” – suggesting that if development continued, we should aim to combine Unreal’s rendering realism with Unity-like interaction polish. On the technical side, no participants reported simulation sickness issues in VR, which suggests our comfort settings (teleport locomotion default, etc.) were effective.
- Multi-platform Workflow: When asked about the overall experience of using three different applications, most participants reacted positively. They liked the ability to “carry over” their creation from web into AR and VR seamlessly. One participant noted that it “felt like an ecosystem of tools that all talk to each other,” which was our intent. A couple of less tech-experienced users admitted they felt a bit anxious when switching devices (e.g., going from PC to phone to VR headset), but they said the clear instructions at each step reassured them. We did provide a printed one-page instruction sheet summarizing the workflow (especially in Study 3), which participants could refer to; this proved useful for those worried they might miss a step. Overall, users recognized the benefit of each platform: the web for precise input, AR for context, and VR for immersion. Many concurred that all three in combination gave them a fuller understanding of their design than any single platform could.
- Administrative Observations: From the moderator’s perspective, each iterative test cycle saw smoother participant behavior. In Study 1, most participants asked a lot of questions and needed occasional guidance (e.g., “How do I delete a wall?” or “The AR isn’t detecting the ground, what should I do?”). By Study 3, such queries were rare – participants largely navigated on their own. This indicates the system became more self-explanatory and reliable, reducing the need for intervention. We still observed some natural points of confusion: for instance, in the AR app, nearly everyone tried to use a pinch gesture to scale the house (which was not a feature – the house auto-scales to real size). We did not implement scaling because the goal was true scale visualization, but this user instinct might suggest allowing a temporary scale for preview could be considered (though it conflicts with realism). In VR, one or two users in Study 3 tried to grab walls or the floor (not just furniture), expecting they could modify structural elements in VR as well. This was not enabled – VR editing was limited to furniture in our implementation. It seems that once users got comfortable, they wanted to do more. This is a positive sign of engagement, though it also raises scope considerations for future development (full editing in VR would be a significant extension).
G. Comparative Discussion of Iterative Methodology
Our findings highlight the value of an iterative, user-centered development methodology for multiplatform systems. By incorporating user feedback from the first two studies, we implemented targeted changes that yielded measurable improvements by the third study. For example, early users in Study 1 struggled with the VR controls and gave the VR app a somewhat mediocre usability score. In response, we redesigned the VR interaction scheme and added the tutorial. The result was a dramatic increase in user confidence by Study 2 and 3. Similarly, Study 1 revealed UI design issues on the web app (participants found the interface cluttered and the color scheme distracting). We engaged in a second-cycle interface redesign of the web component – changing the color palette to neutral tones, simplifying icons, and re-organizing toolbars for a more logical workflow. Study 2 confirmed that the new interface significantly improved clarity and intuitiveness, with users expressing satisfaction with the visual design and layout. Yet, some metrics in Study 2 (like perceived usefulness and some presence aspects) did not improve as much as expected, indicating room for further refinement. We addressed these in the final development cycle by, for instance, integrating more realistic graphics (to boost presence) and expanding our test scenarios to emphasize real-world usefulness (possibly influencing perceived usefulness). The end result in Study 3 was that all key metrics either improved or reached high levels, and no major new usability problems surfaced, suggesting that our iterative adjustments successfully converged on a user-friendly design.
It is important to note that our sample sizes were relatively small (a total of 6 / 12 / 15 unique users, some overlapping). This was a conscious decision in line with qualitative usability methodology – Nielsen’s 5-user rule [26] was used as a guideline, where 5–6 users can uncover the majority of usability issues in each cycle. While this limits the statistical power for quantitative analysis, we mitigated it by focusing on clear trends and consistency of feedback across participants rather than on significance testing. The triangulation of methods (observation, interviews, questionnaires) gave us confidence in interpreting the results despite the sample size. For a research/development project, this approach was efficient and effective at improving the system. However, for future work or product development, a larger-scale evaluation (with dozens or hundreds of users) would be beneficial to validate these findings in a broader population.
From an administrative perspective, conducting tests in multiple environments (lab for web/VR and outdoor for AR) posed logistical challenges, but these were manageable. We ensured consistency by using the same basic task structure and by training the administrators to follow a script. One lesson learned is that environmental factors can impact user experience – e.g., outdoor conditions (sunlight, uneven ground) can affect AR more than we anticipated. This is something not usually encountered in lab studies, so it was a valuable insight for deploying AR in the field.
Overall, our experience and results underscore that iteratively evaluating a complex multiplatform system is not only feasible but highly beneficial. Each platform informed improvements in the others (for instance, seeing users struggle in AR made us realize we needed better instructions which we then delivered via the web app beforehand and via on-screen prompts). By the final iteration, we achieved a level of synergy among the web, AR, and VR components that likely would not have been possible without intermediate user feedback cycles.
5. Conclusions
This paper presented an extended evaluation of a complex, multiplatform system for house design and visualization, aimed at non-expert users. Our pipeline combined a web-based 3D house design tool with mobile AR and VR applications to provide users with a comprehensive experience: from designing a floor plan to visualizing the home on an actual site and immersively walking through a life-sized virtual interior. We adopted an iterative development and testing methodology, conducting three cycles of user studies and refining the system based on the findings of each cycle.
Through this process, we identified and addressed numerous usability and UX challenges inherent in a cross-platform workflow. Early-stage user feedback led to significant improvements such as a redesigned web interface (yielding better clarity and usability) and enhanced AR/VR interaction designs (resulting in more intuitive controls and stronger immersion). The final round of user studies with 15 participants (including both returning users and new domain-expert users) demonstrated that the system achieved a satisfactory level of usability and user experience quality across all components. Users were able to effectively use the web, AR, and VR applications in concert, and they reported high satisfaction with the overall experience. Quantitative measures in the third study showed high usability scores and experience ratings for each platform, and importantly, very positive technology acceptance outcomes. Participants found the system easy to use and useful for its intended purpose, expressed a positive attitude toward using it, and indicated a strong intention to use it in the future. This combination of factors suggests a promising market potential for the developed solution if it were to be productized, as even a diverse group of users (in terms of age, expertise, and background) showed enthusiasm for the concept.
Nonetheless, the system is not yet without room for improvement. As expected in a development project of limited duration, some features are at a prototype level and the overall solution has not reached full maturity. Users provided constructive suggestions, such as extending editing capabilities to the AR/VR apps and further streamlining the device transition process. These and other refinements (e.g., optimizing AR performance under various conditions, unifying the best aspects of both VR implementations) would be valuable steps toward preparing the system for real-world deployment. Additionally, while our evaluation focused on UX and usability, future work could integrate other dimensions such as collaborative use (multiple users designing or reviewing together) or longitudinal use (testing how users interact with the system over a longer period or multiple projects).
In conclusion, our work demonstrates the feasibility and benefits of a multiplatform house design pipeline that leverages web, AR, and VR in an integrated workflow. The iterative UX evaluation was crucial in navigating the challenges of such a heterogeneous system, and it ensured that the end result caters to the needs and capabilities of end users. The findings from three user studies underline that even non-expert users can comfortably adopt advanced tools when those tools are designed with usability in mind from the start. By combining precision design, context-aware AR visualization, and immersive VR exploration, the system offers a richer understanding of home designs than traditional methods, potentially reducing errors and increasing user confidence in the design process. The overwhelmingly positive feedback regarding ease of use, usefulness, and willingness to use suggests that solutions like ours could see wide acceptance in the AEC domain and beyond. With continued development and polish, such a pipeline could empower home buyers, owners, and builders to better envision and realize their building projects, bridging the gap between professional design software and accessible consumer experiences. Overall, the project highlights a pathway for bringing XR technologies into everyday domains through thoughtful, user-centered design and evaluation.
Author Contributions
Conceptualization, Mirko Sužnjević; methodology, Sara Vlahović; software, Mirta Moslavac, Katarina Mišura, Lovro Boban, and Ana Jović; validation, Mirko Sužnjević, Sara Vlahović and Katarina Mišura; formal analysis, Katarina Mišura and Sara Vlahović; data curation Katarina Mišura; writing—original draft preparation, Mirko Sužnjević; writing—Mirko Sužnjević, Sara Vlahović, Mirta Moslavac, Ana Jović; visualization, Katarina Mišura; supervision, Mirko Sužnjević; project administration, Mirko Sužnjević; funding acquisition, Mirko Sužnjević. All authors have read and agreed to the published version of the manuscript.
Funding
This research has been funded by the Croatian National Recovery and Resilience Plan (NPOO) under the project Research and Development of Multiple Innovative Products, Services and Business Models Aimed at Strengthening Sustainable Tourism and the Green and Digital Transition of Tourism (ROBOCAMP), with grant number NPOO.C1.6.R1-I2.01.
Institutional Review Board Statement
The study was conducted in accordance with the Declaration of Helsinki and approved by the Ethics Committee of Faculty of Electrical Engineering and Computing document classification number 023-01/24-01/1 on 30.4.2024. for studies involving humans.
Informed Consent Statement
Informed consent was obtained from all subjects involved in the study.
Data Availability Statement
All data is available upon request from the authors of the paper. Please send your inquiries on mirko.suznjevic@unizg.fer.hr.
Acknowledgments
During the preparation of this manuscript/study, the author(s) used ChatGPT v4 for the purposes of grammar check and text errors detection. The authors have reviewed and edited the output and take full responsibility for the content of this publication.
Conflicts of Interest
The authors declare no conflicts of interest.
Abbreviations
The following abbreviations are used in this manuscript:
| CAD | Computer-Aided Design |
| AEC | Architecture, Engineering, and Construction |
| AR | Augmented Reality |
| VR | Virtual Reality |
| UX | User Experience |
| QoE | Quality of Experience |
| TAP | Think-Aloud Protocol |
| SUS | System Usability Scale |
| MEC | Measurement, Effects, Conditions |
| SPQ | Spatial Presence Questionnaire |
| SSM | Spatial Situation Model |
| SPSL | Spatial Situation Self-Location |
| SPPA | Spatial Situation Possible Actions |
| SoD | Suspension of Disbelief |
| TAM | Technology Acceptance Model |
| PEU | Perceived Ease of Use |
| PU | Perceived Usefulness |
| ATU | Attitude Toward Use |
| BIU | Behavioral Intention to Use |
References
- Manzoor, B.; Othman, I.; Pomares, J.C. Digital Technologies in the Architecture, Engineering and Construction (AEC) Industry—A Bibliometric—Qualitative Literature Review of Research Activities. IJERPH 2021, 18, 6135. [Google Scholar] [CrossRef] [PubMed]
- Dudley, J.; Yin, L.; Garaj, V.; Kristensson, P.O. Inclusive Immersion: A Review of Efforts to Improve Accessibility in Virtual Reality, Augmented Reality and the Metaverse. Virtual Reality 2023, 27, 2989–3020. [Google Scholar] [CrossRef]
- Lach, E.; Benek, I.; Zalewski, K.; Skurowski, P.; Kocur, A.; Kotula, A.; Macura, M.; Pamuła, Z.; Stankiewicz, M.; Wyrobek, T. Immersive Virtual Reality for Assisting in Inclusive Architectural Design. In Proceedings of the International Conference on Man–Machine Interactions; Springer; 2019; pp. 23–33. [Google Scholar]
- Hajirasouli, A.; Banihashemi, S.; Drogemuller, R.; Fazeli, A.; Mohandes, S.R. Augmented Reality in Design and Construction: Thematic Analysis and Conceptual Frameworks. CI 2022, 22, 412–443. [Google Scholar] [CrossRef]
- Bhowmik, A.K. Virtual and Augmented Reality: Human Sensory-perceptual Requirements and Trends for Immersive Spatial Computing Experiences. J Soc Info Display 2024, 32, 605–646. [Google Scholar] [CrossRef]
- Vlahović, S.; Moslavac, M.; Mišura, K.; Boban, L. ; Jović, A; Sužnjević, M. Usability and User Experience Evaluation of a Multiplatform House Design Pipeline: Navigating Web, VR, and Mobile AR Workflows. MIPRO (In press). 2025. [Google Scholar]
- Wang, X.; Love, P.E.D.; Kim, M.J.; Park, C.-S.; Sing, C.-P.; Hou, L. A Conceptual Framework for Integrating Building Information Modeling with Augmented Reality. Automation in Construction 2013, 34, 37–44. [Google Scholar] [CrossRef]
- Wen, J.; Gheisari, M. Using Virtual Reality to Facilitate Communication in the AEC Domain: A Systematic Review. CI 2020, 20, 509–542. [Google Scholar] [CrossRef]
- Alizadehsalehi, S.; Hadavi, A.; Huang, J.C. From BIM to Extended Reality in AEC Industry. Automation in Construction 2020, 116, 103254. [Google Scholar] [CrossRef]
- Verdelho Trindade, N.; Ferreira, A.; Madeiras Pereira, J.; Oliveira, S. Extended Reality in AEC. Automation in Construction 2023, 154, 105018. [Google Scholar] [CrossRef]
- Rauschnabel, P.A.; Felix, R.; Hinsch, C.; Shahab, H.; Alt, F. What Is XR? Towards a Framework for Augmented and Virtual Reality. Computers in Human Behavior 2022, 133, 107289. [Google Scholar] [CrossRef]
- Mastrolembo Ventura, S.; Castronovo, F.; Ciribini, A.L.C. A Design Review Session Protocol for the Implementation of Immersive Virtual Reality in Usability-Focused Analysis. Journal of Information Technology in Construction (ITcon) 2020, 25, 233–253. [Google Scholar] [CrossRef]
- Paes, D.; Irizarry, J. A Usability Study of an Immersive Virtual Reality Platform for Building Design Review: Considerations on Human Factors and User Interface. In Proceedings of the Construction Research Congress 2018; American Society of Civil Engineers: New Orleans, Louisiana, March 29, 2018; pp. 419–428. [Google Scholar]
- Rashidi, A.; Maalim, A.M.; Gutierrez-Bucheli, L.; Maxwell, D.; Arashpour, M. Evaluating the Effectiveness of BIM-Based Virtual Reality for Coordinating the Design Disciplines in a Building Renovation Project. IOP Conf. Ser.: Earth Environ. Sci. 2022, 1101, 032019. [Google Scholar] [CrossRef]
- Kim, J.I.; Li, S.; Chen, X.; Keung, C.; Suh, M.; Kim, T.W. Evaluation Framework for BIM-Based VR Applications in Design Phase. Journal of Computational Design and Engineering 2021, 8, 910–922. [Google Scholar] [CrossRef]
- Poushneh, A.; Vasquez-Parraga, A.Z. Discernible Impact of Augmented Reality on Retail Customer’s Experience, Satisfaction and Willingness to Buy. Journal of Retailing and Consumer Services 2017, 34, 229–234. [Google Scholar] [CrossRef]
- Lee, J.G.; Seo, J.; Abbas, A.; Choi, M. End-Users’ Augmented Reality Utilization for Architectural Design Review. Applied Sciences 2020, 10, 5363. [Google Scholar] [CrossRef]
- Salkind, N.J. Encyclopedia of Research Design; SAGE Publications, 2010; ISBN 9781412961271.
- Ericsson, K.A.; Simon, H.A. Verbal Reports as Data. Psychological Review 1980, 87, 215–251. [Google Scholar] [CrossRef]
- Franke, T.; Attig, C.; Wessel, D. A Personal Resource for Technology Interaction: Development and Validation of the Affinity for Technology Interaction (ATI) Scale. International Journal of Human–Computer Interaction 2019, 35, 456–467. [Google Scholar] [CrossRef]
- Brooke, J. SUS-A Quick and Dirty Usability Scale. Usability evaluation in industry 1996, 189, 4–7. [Google Scholar]
- Vorderer, P.; Wirth, W.; Gouveia, F.R.; Biocca, F.; Saari, T.; Jäncke, L.; Böcking, S.; Schramm, H.; Gysbers, A.; Hartmann, T.; et al. Mec Spatial Presence Questionnaire. Retrieved Sept 2004, 18, 2015. [Google Scholar]
- Davis, F.D. A Technology Acceptance Model for Empirically Testing New End-User Information Systems: Theory and Results. PhD Thesis, Massachusetts Institute of Technology, 1985.
- Alharbi, S. Using the Technology Acceptance Model in Understanding Academics’ Behavioural Intention to Use Learning Management Systems. International Journal of Advanced Computer Science and Applications 2014. [Google Scholar] [CrossRef]
- Barnum, C.M. Usability Testing Essentials: Ready, Set... Test!; Morgan Kaufmann. 2020. [Google Scholar]
- Why You Only Need to Test with 5 Users. Available online: https://www.nngroup.com/articles/why-you-only-need-to-test-with-5-users/ (accessed on 28 June 2025).
Figure 1.
Illustration of the system for design, visualisation and modification, and creation of houses.
Figure 1.
Illustration of the system for design, visualisation and modification, and creation of houses.
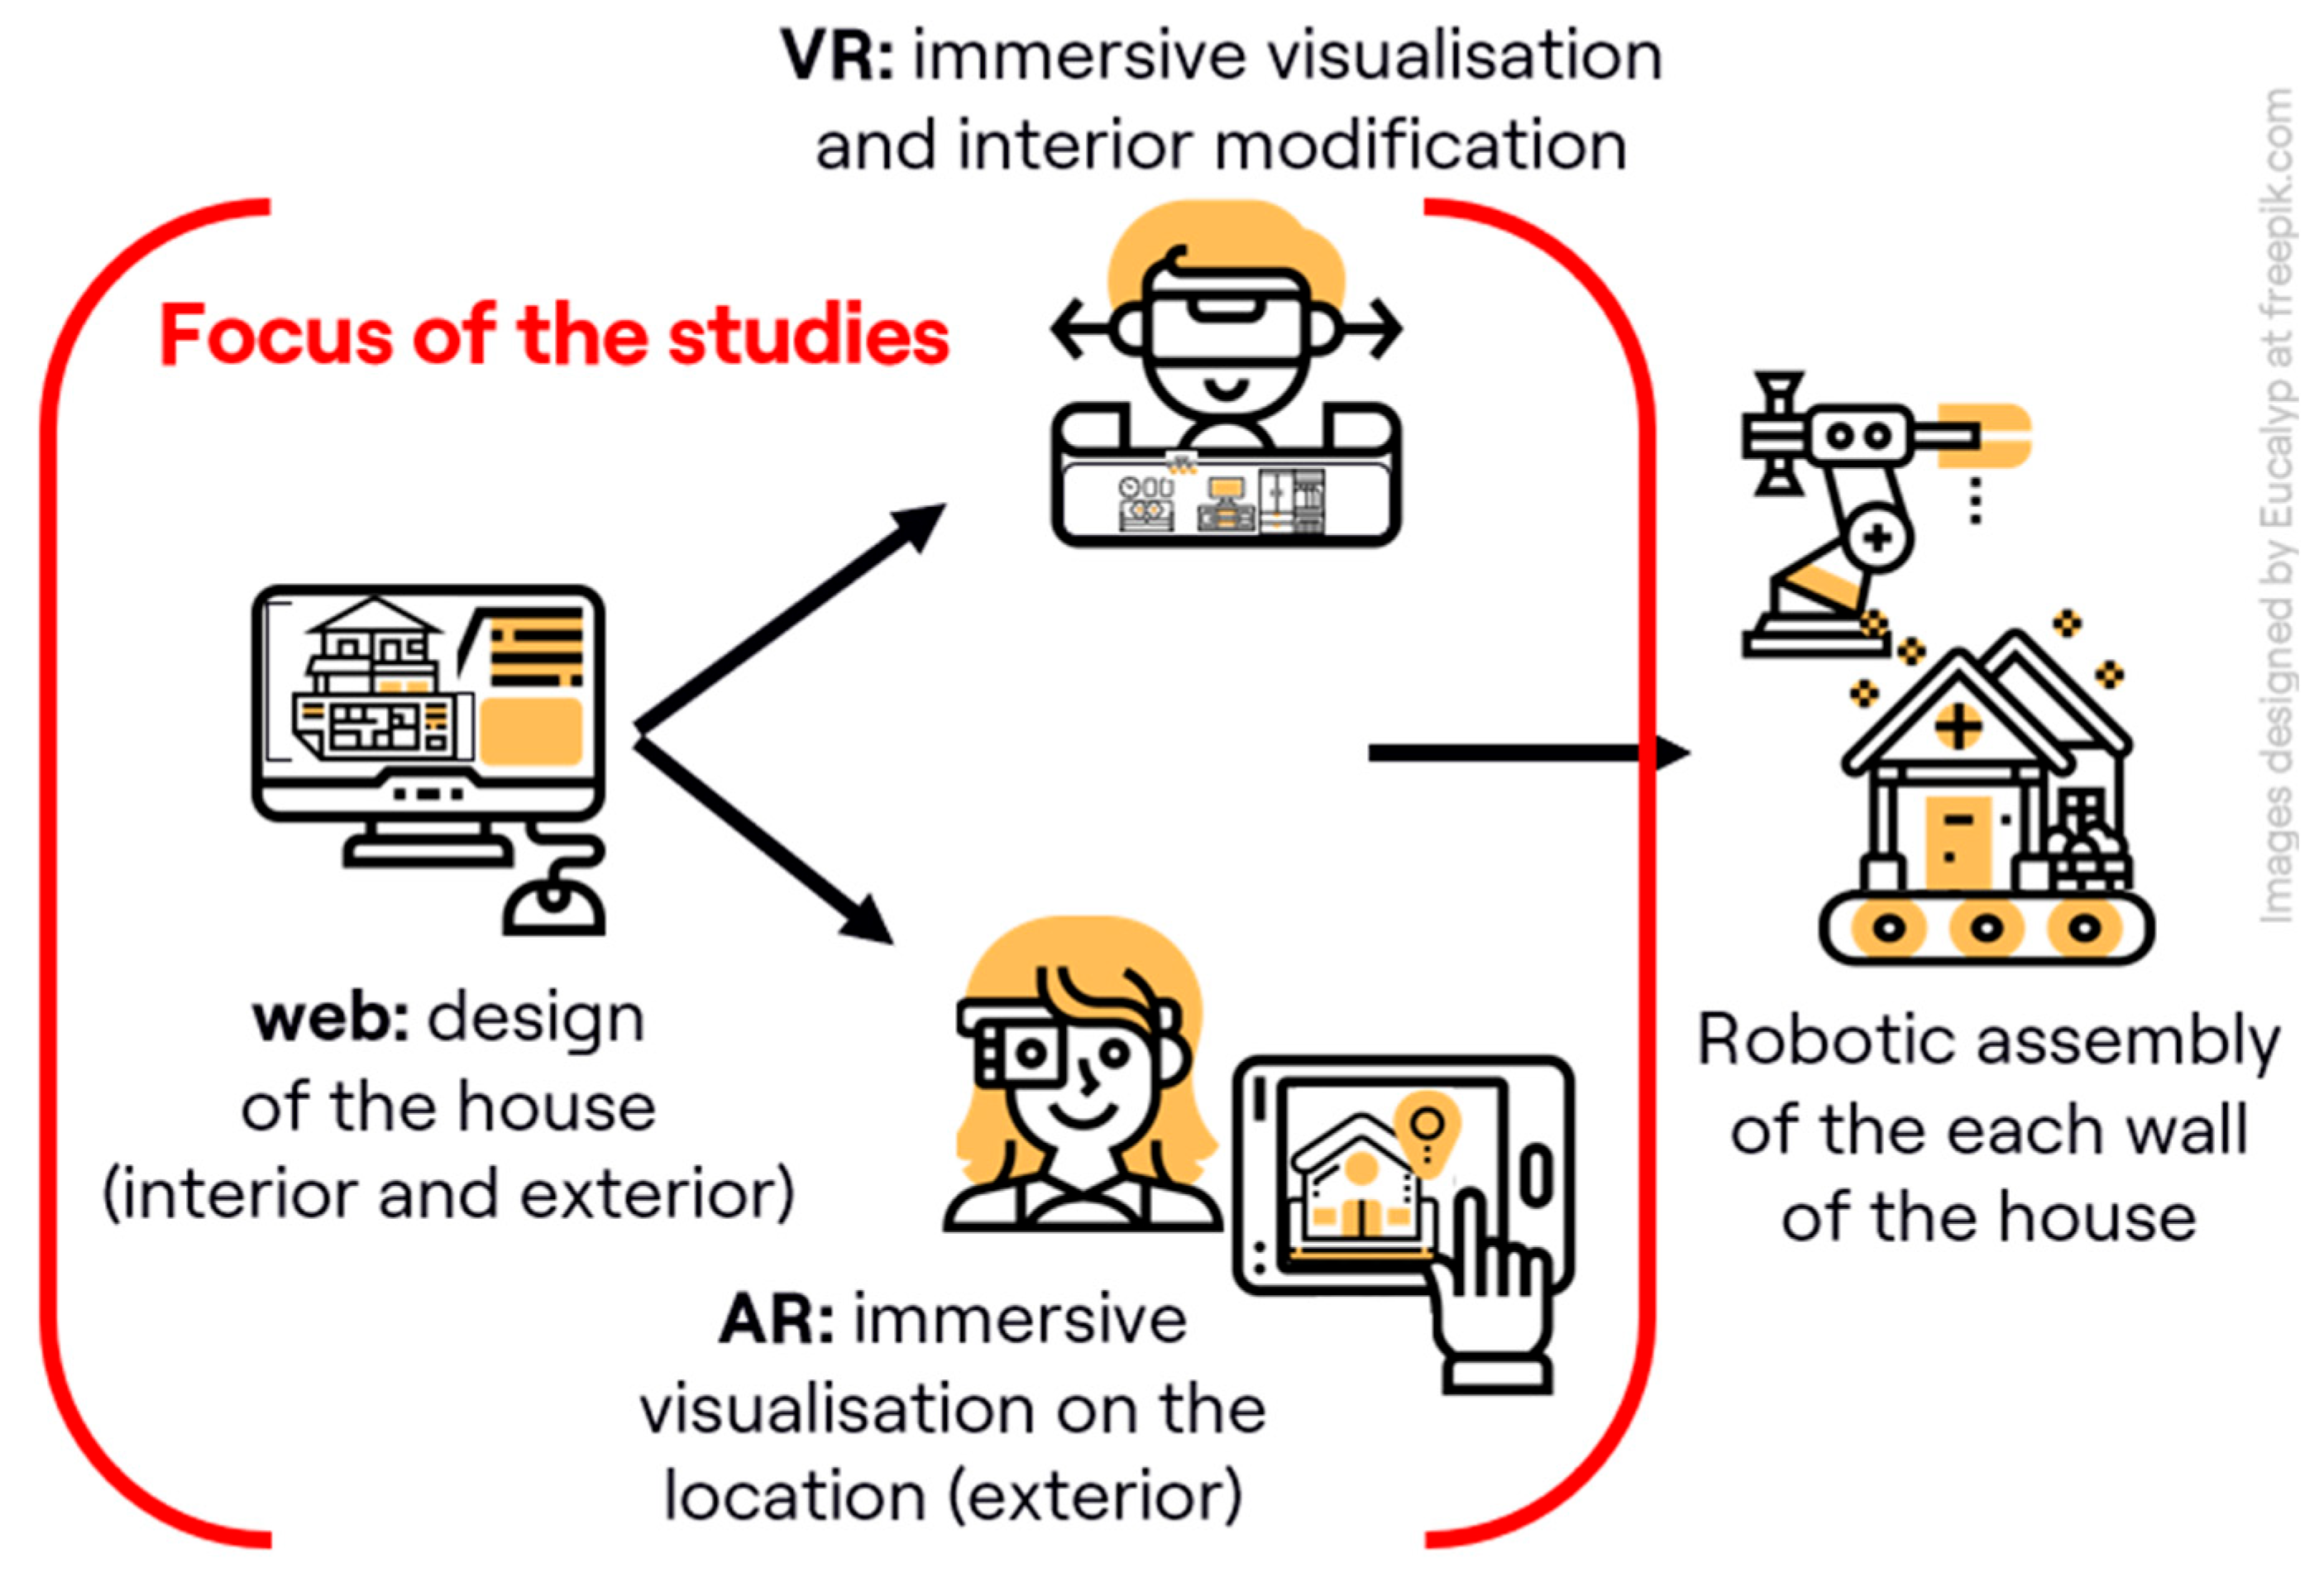
Figure 2.
GUI of the web interface.
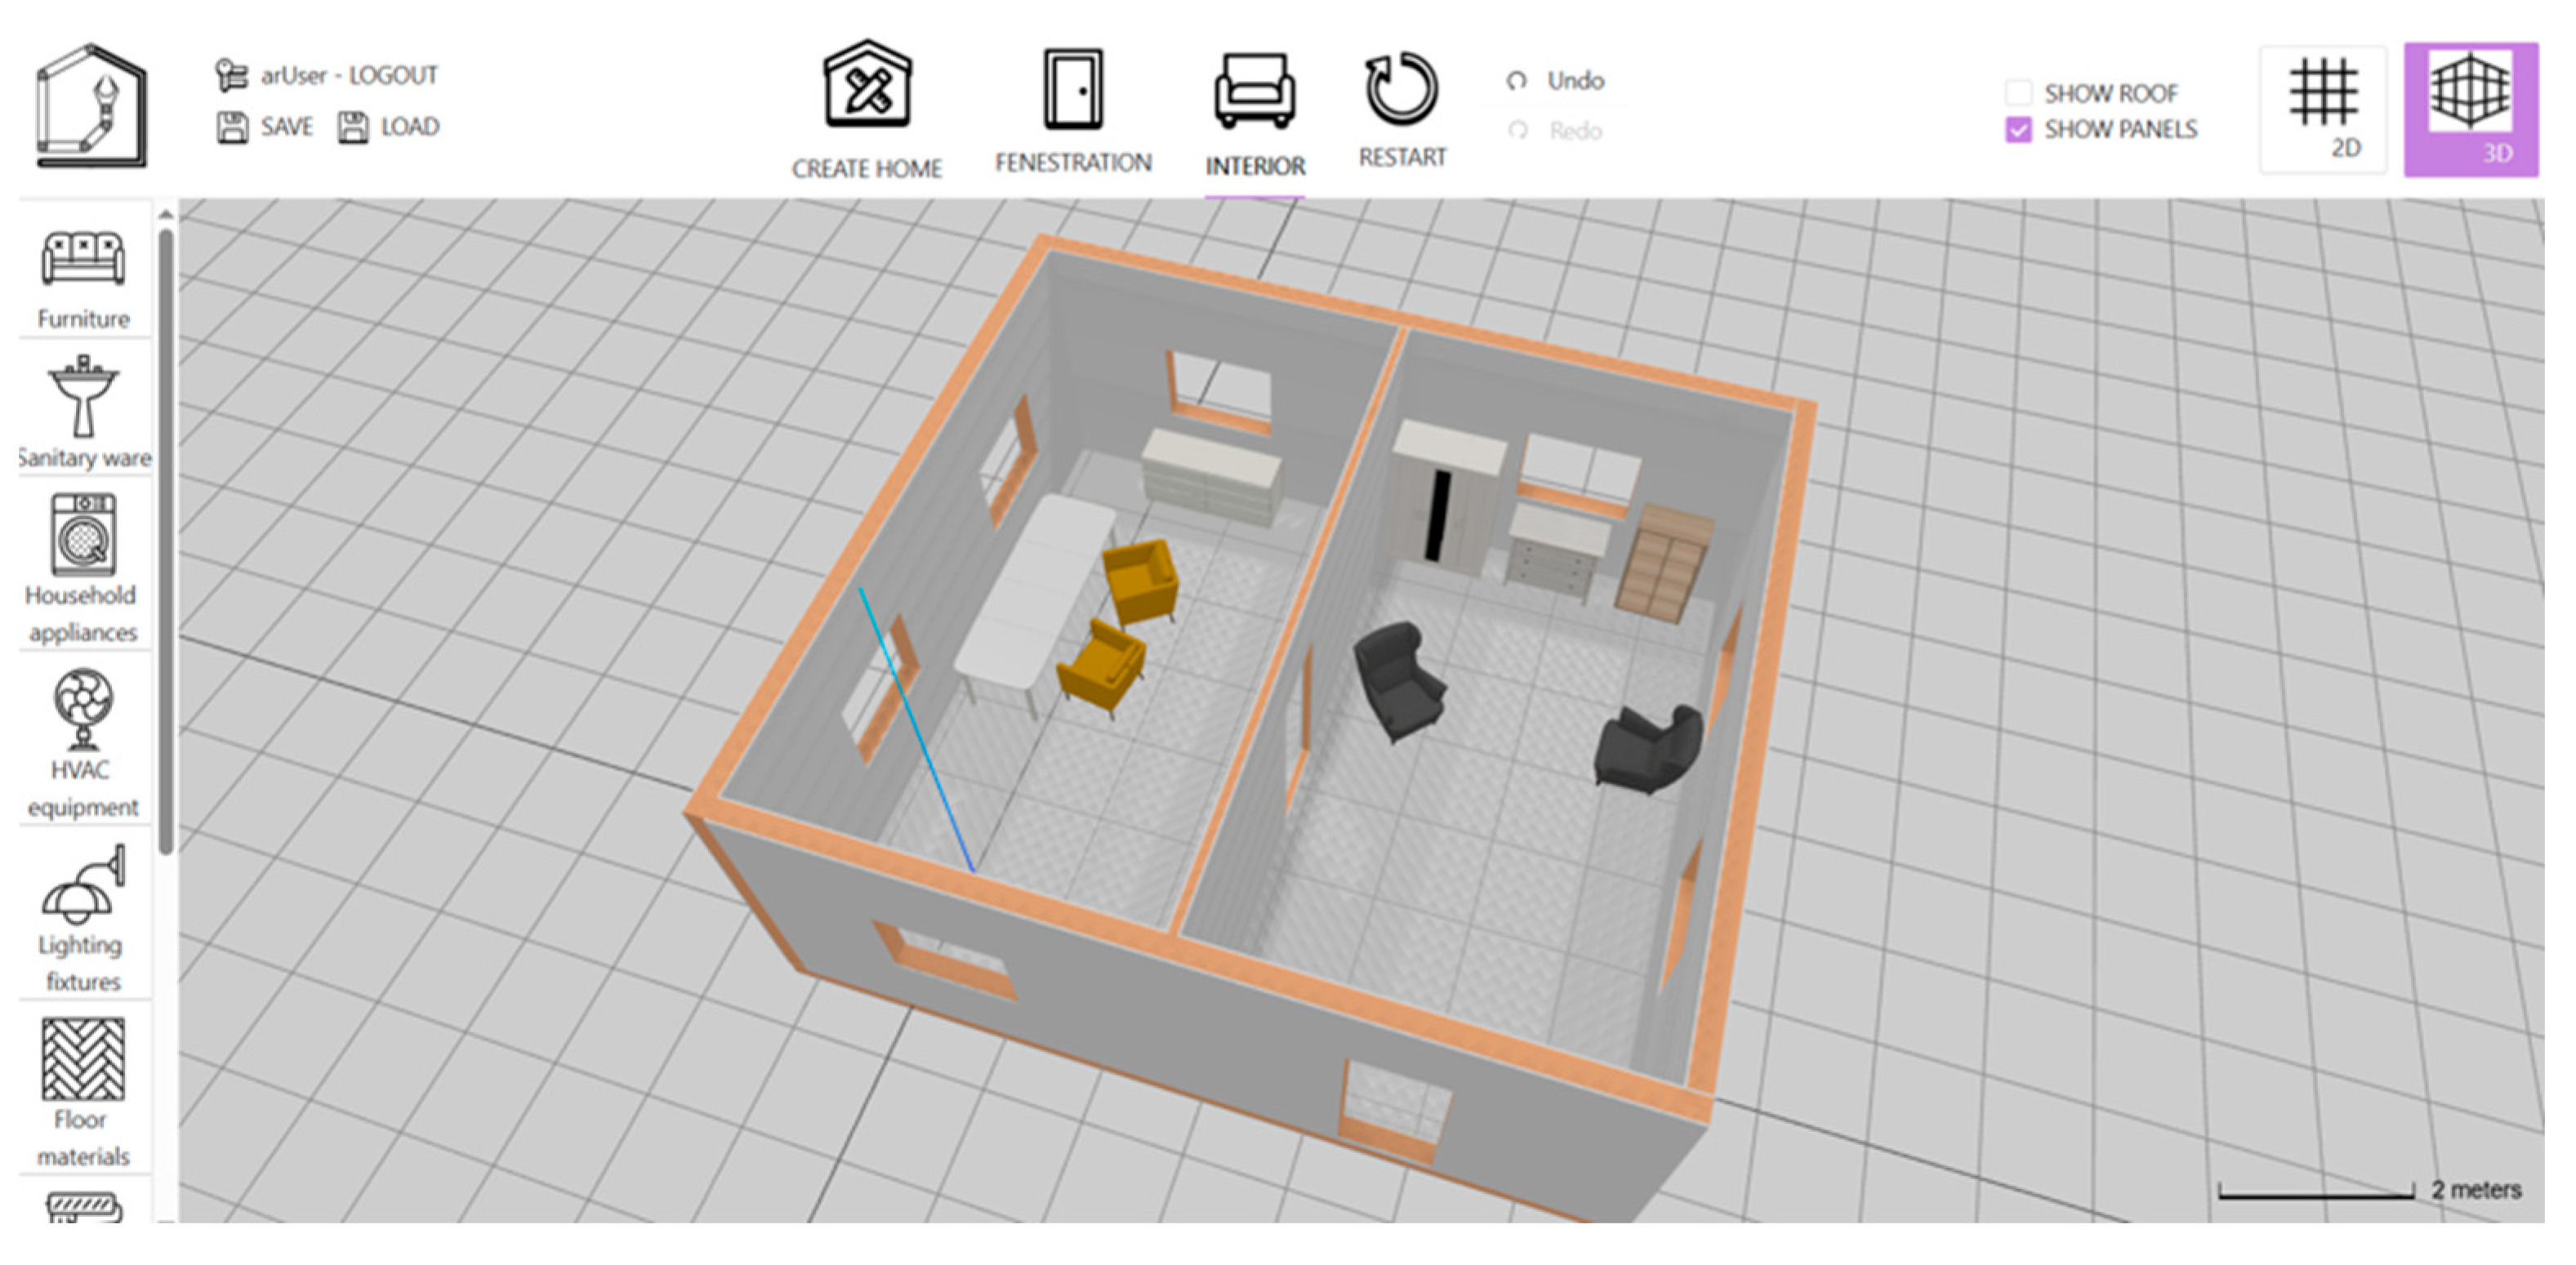
Figure 3.
Screenshots of the ScanSurfacePrompt TapToPlacePrompt and control UI for house manipulation.
Figure 3.
Screenshots of the ScanSurfacePrompt TapToPlacePrompt and control UI for house manipulation.
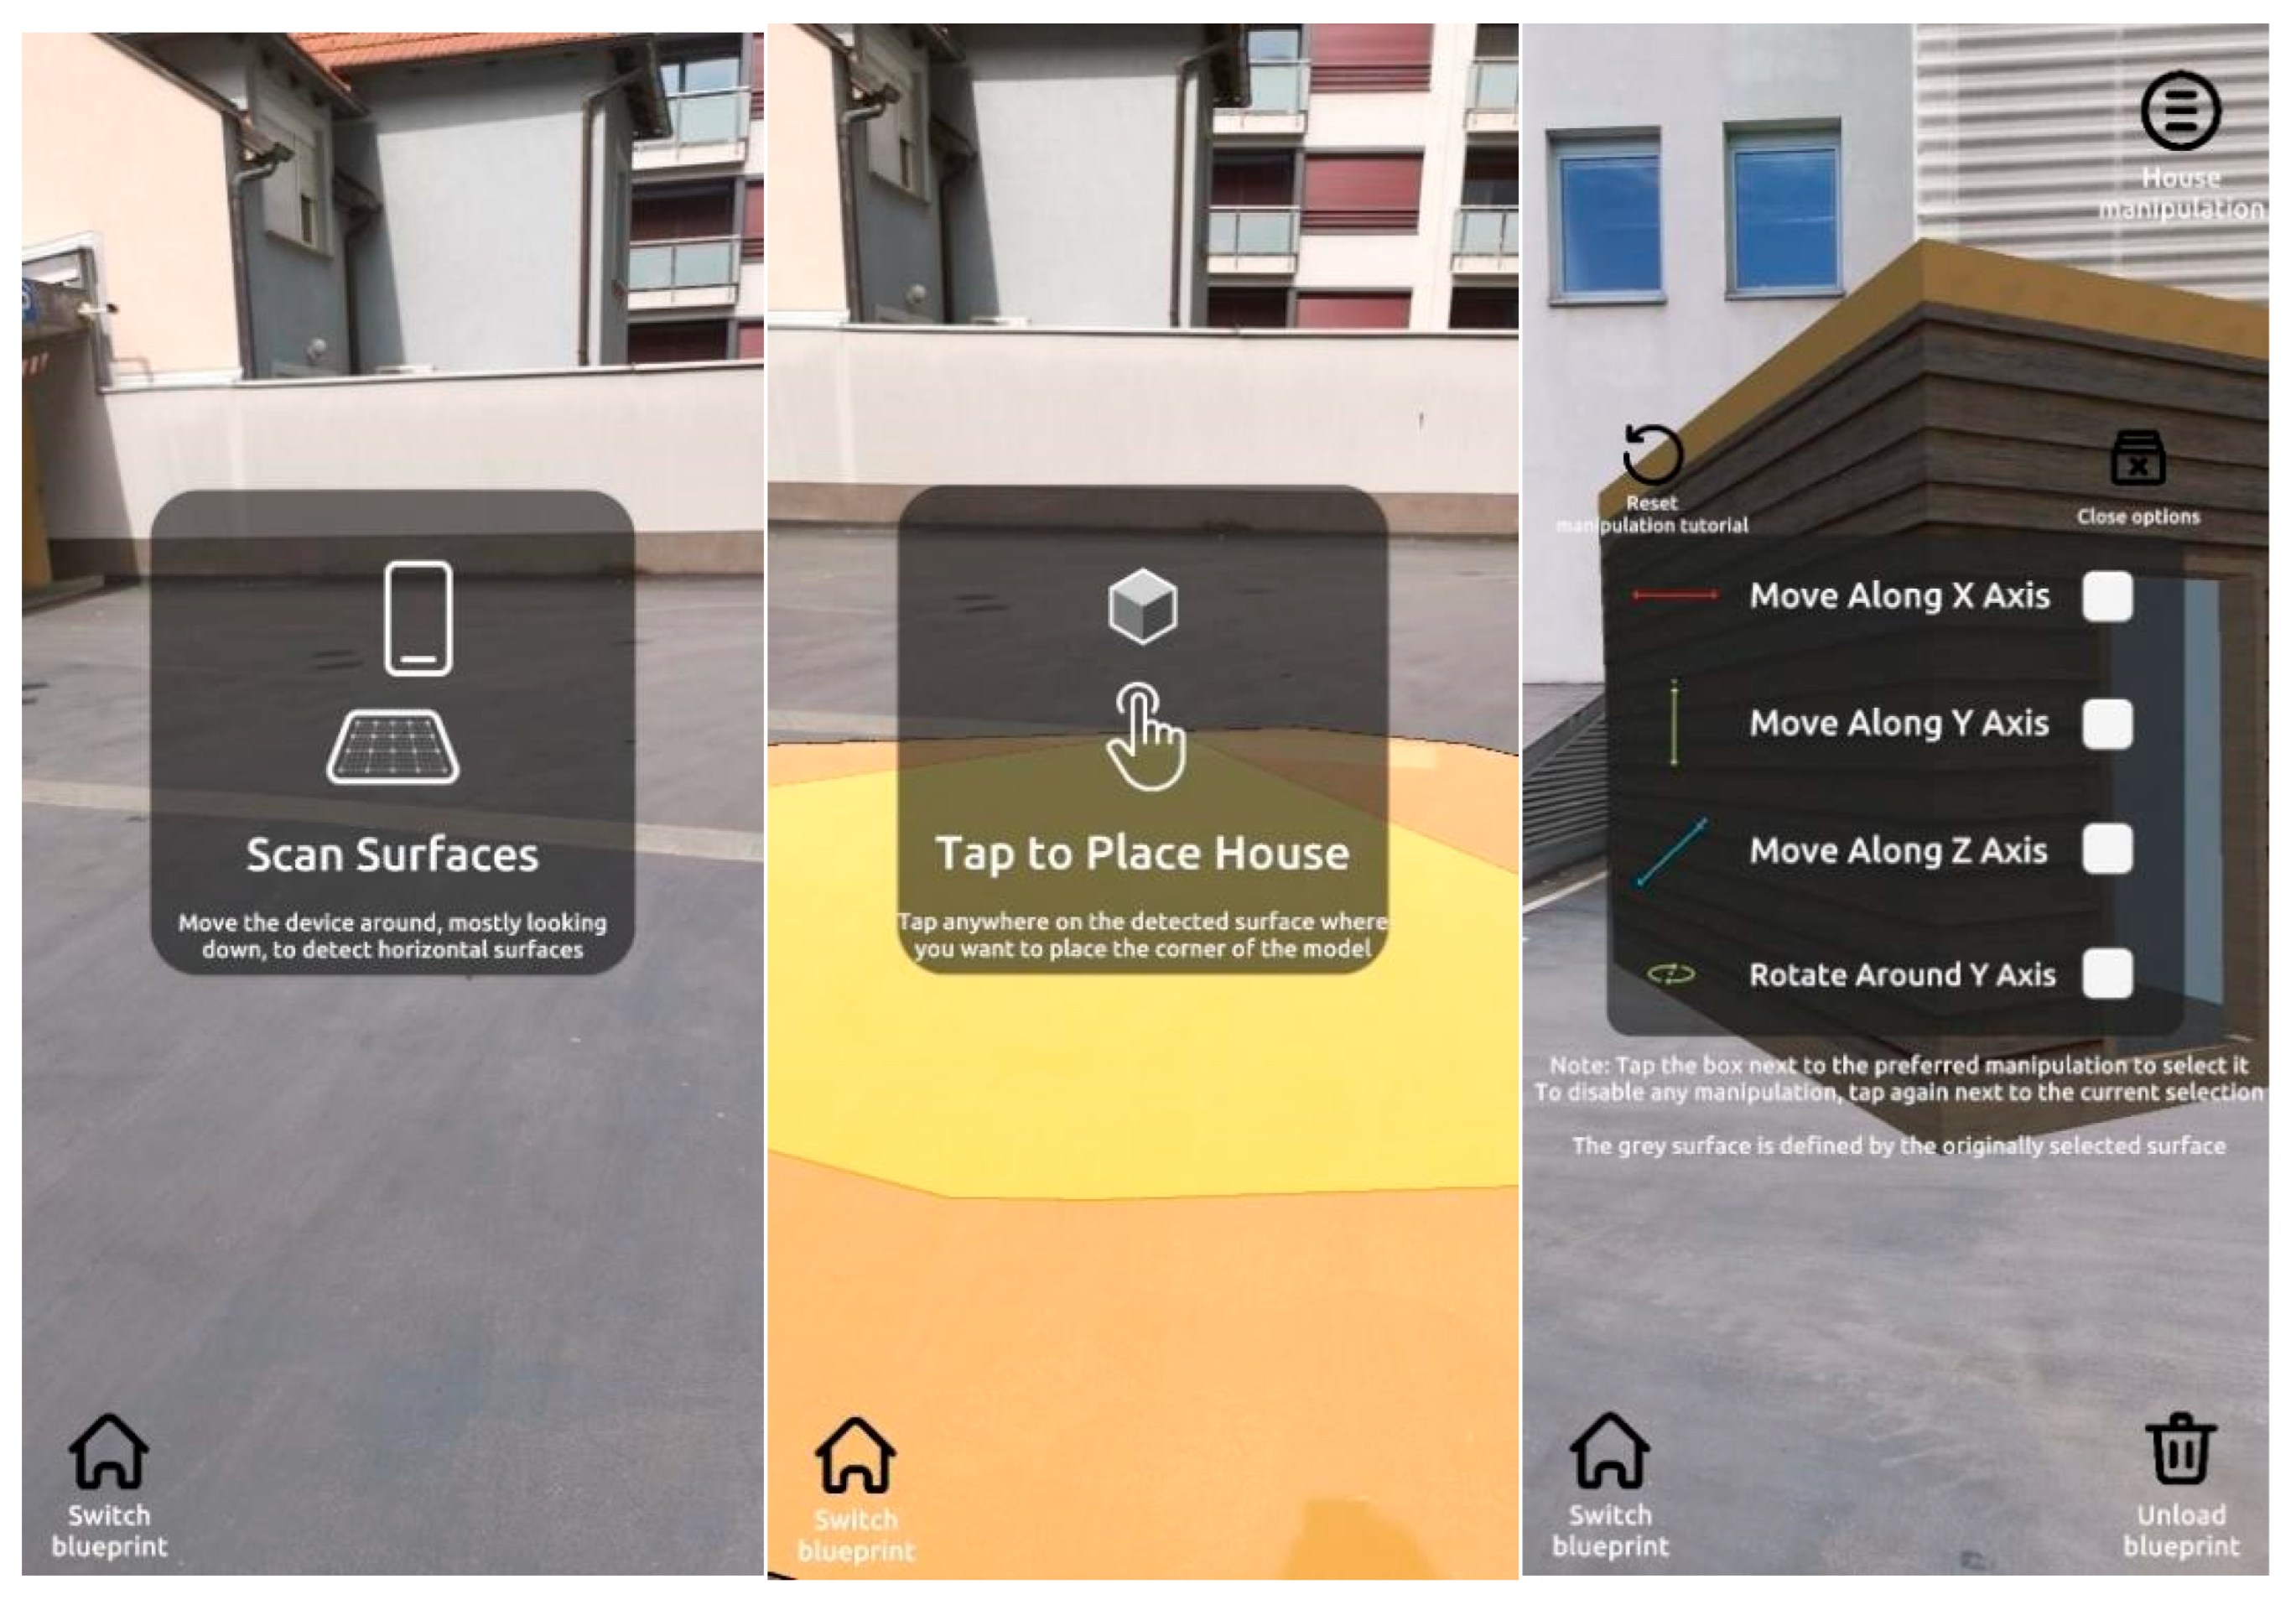
Figure 4.
Visualization of the registered and tracked 3D model of the house through AR app.
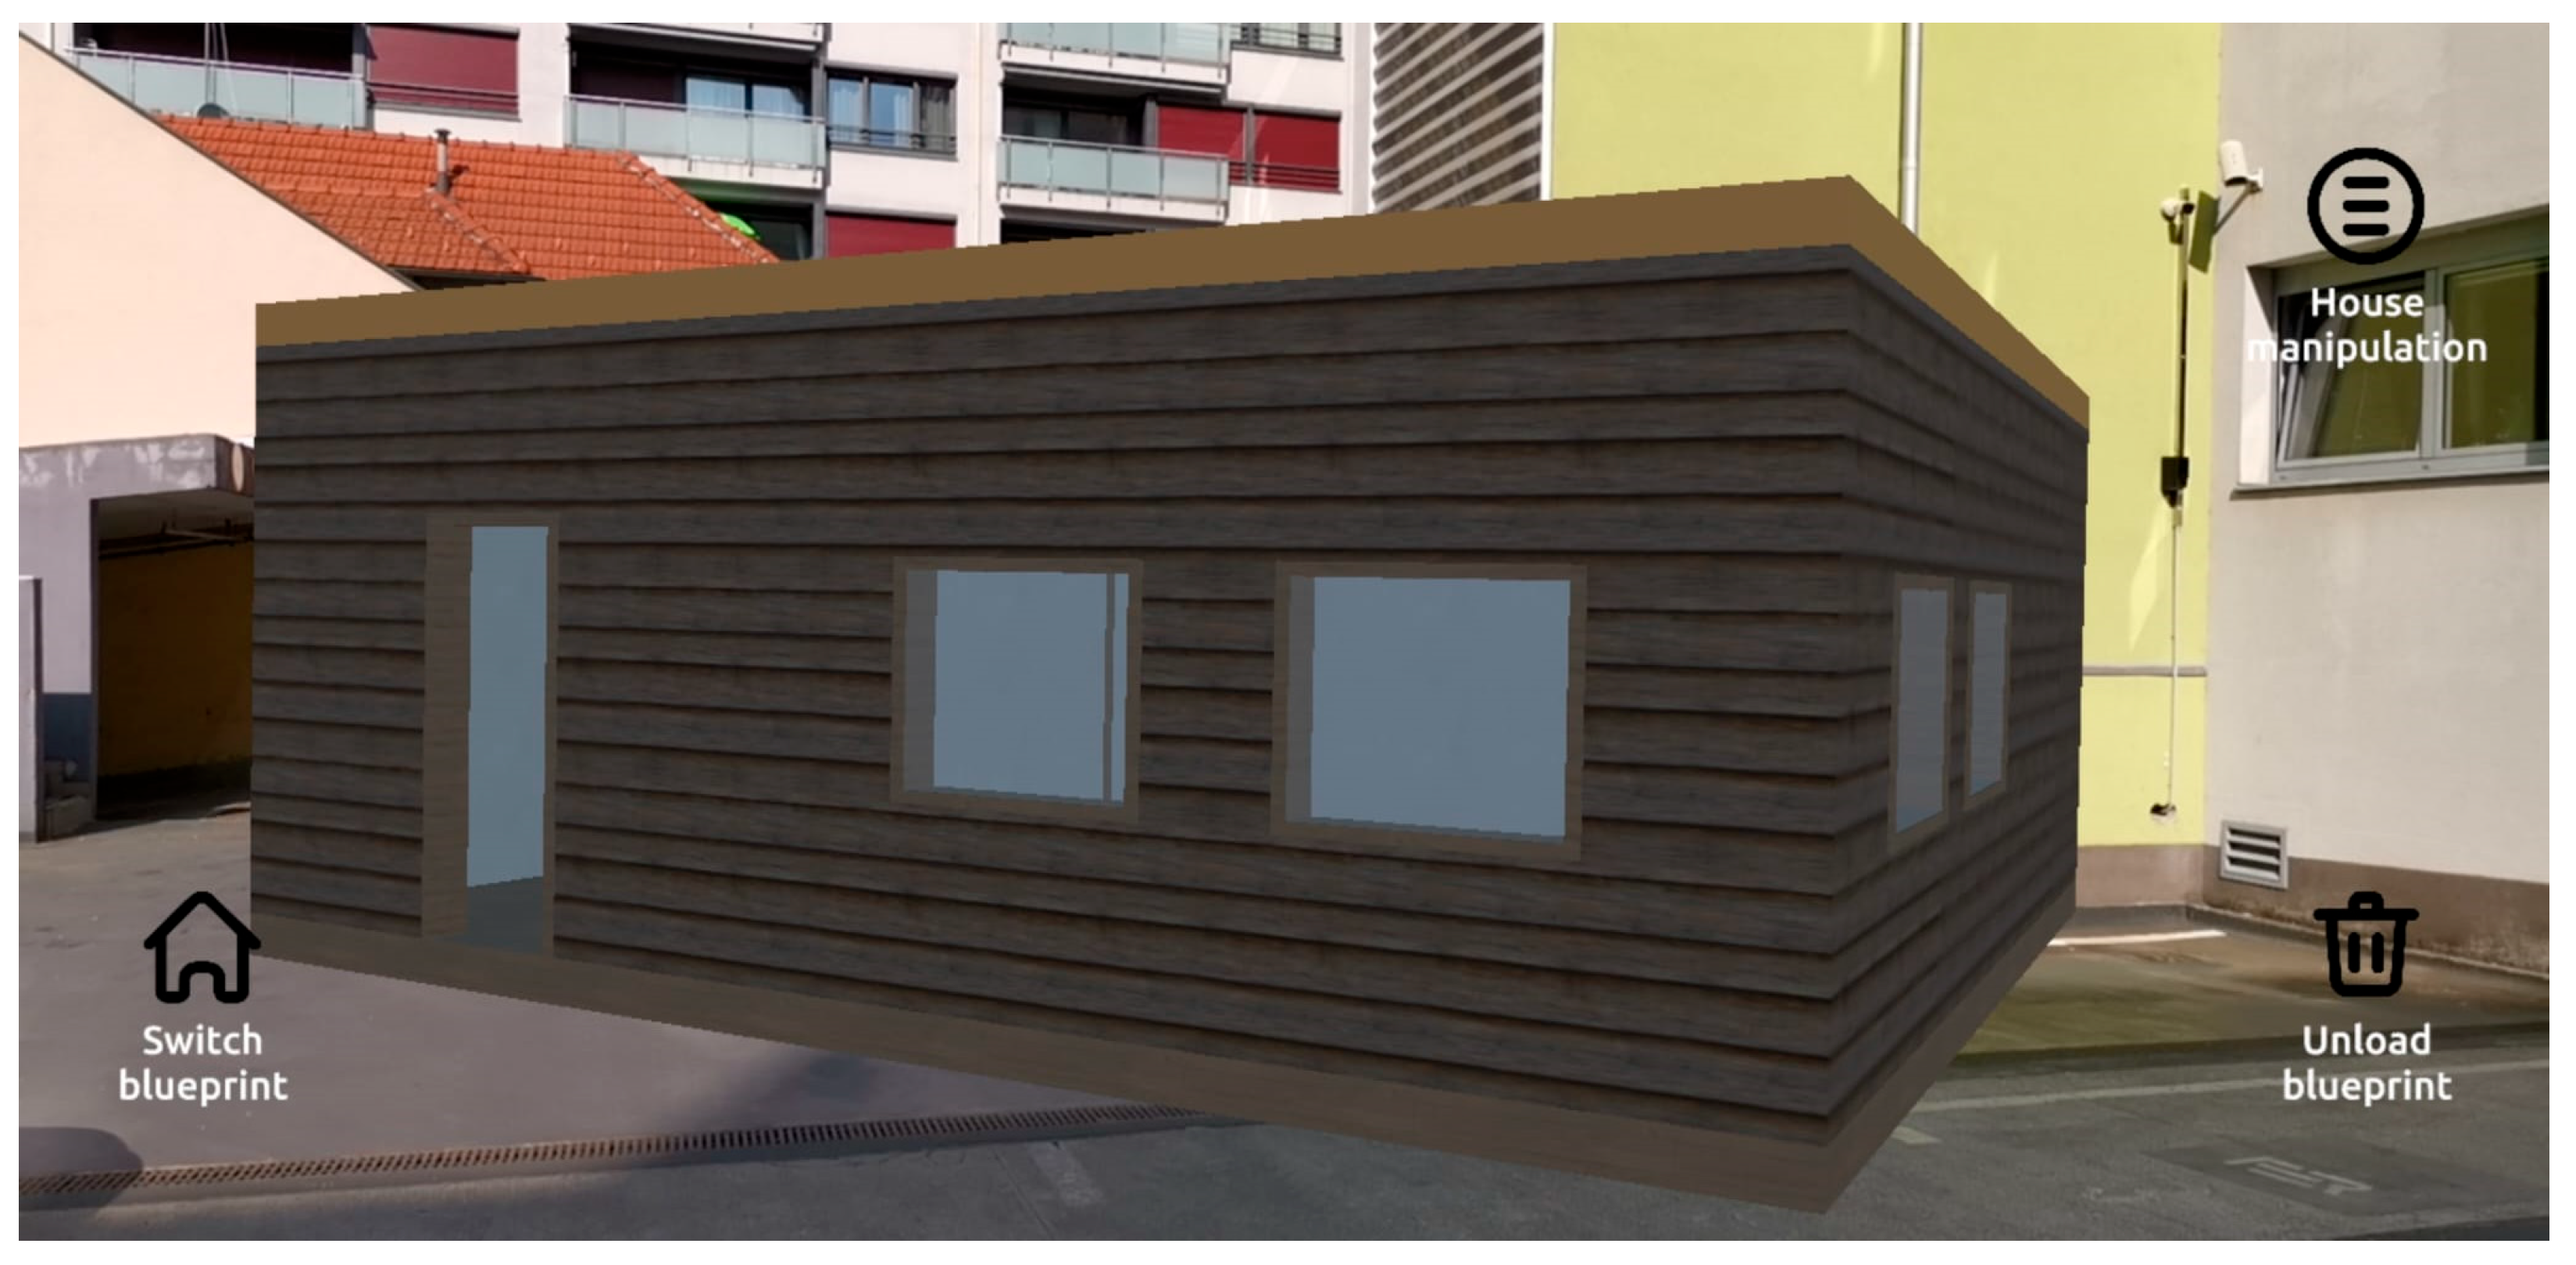
Figure 5.
The same room visualized in Unity (left) and Unreal VR applications.
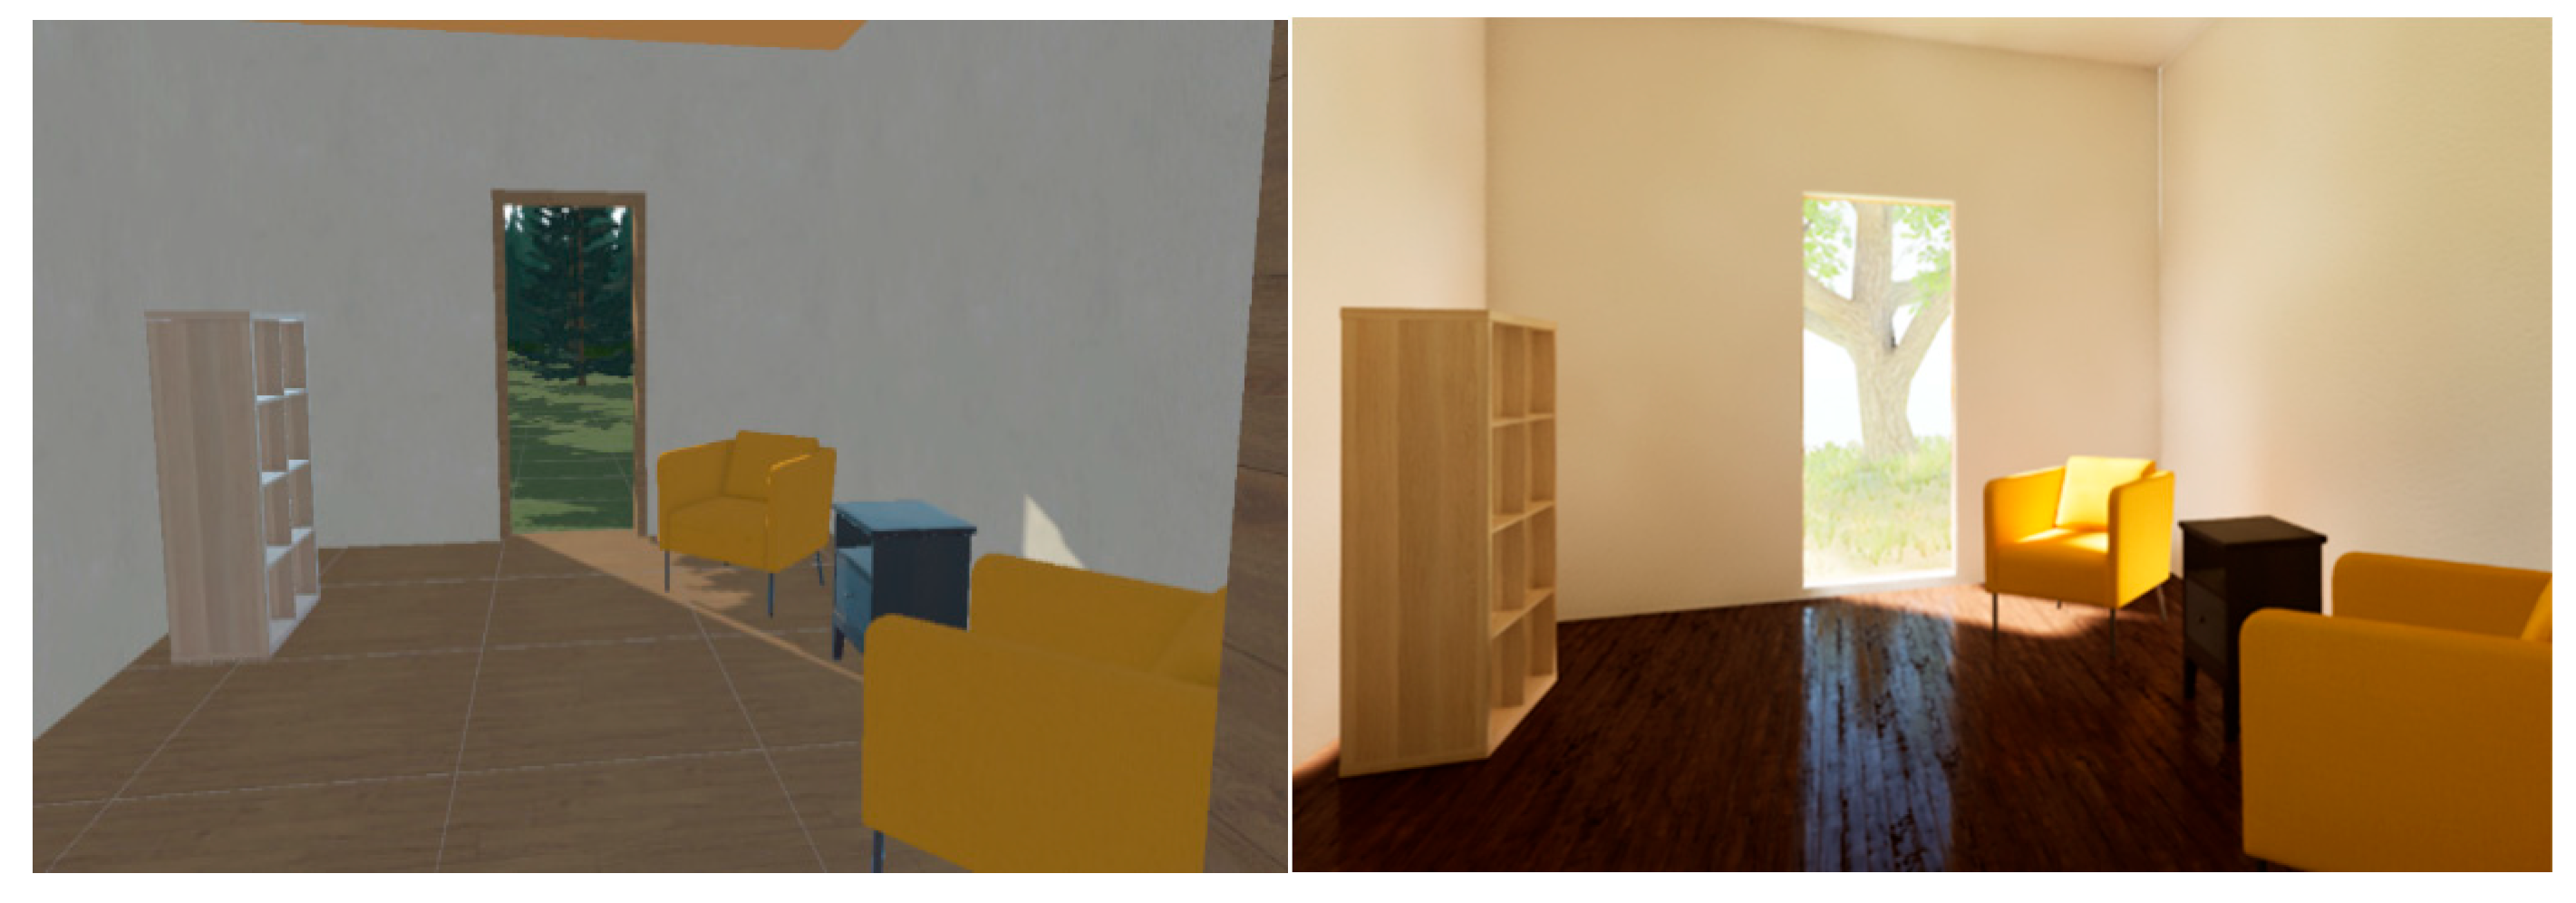
Figure 6.
Tutorial screens for the Unity VR application.
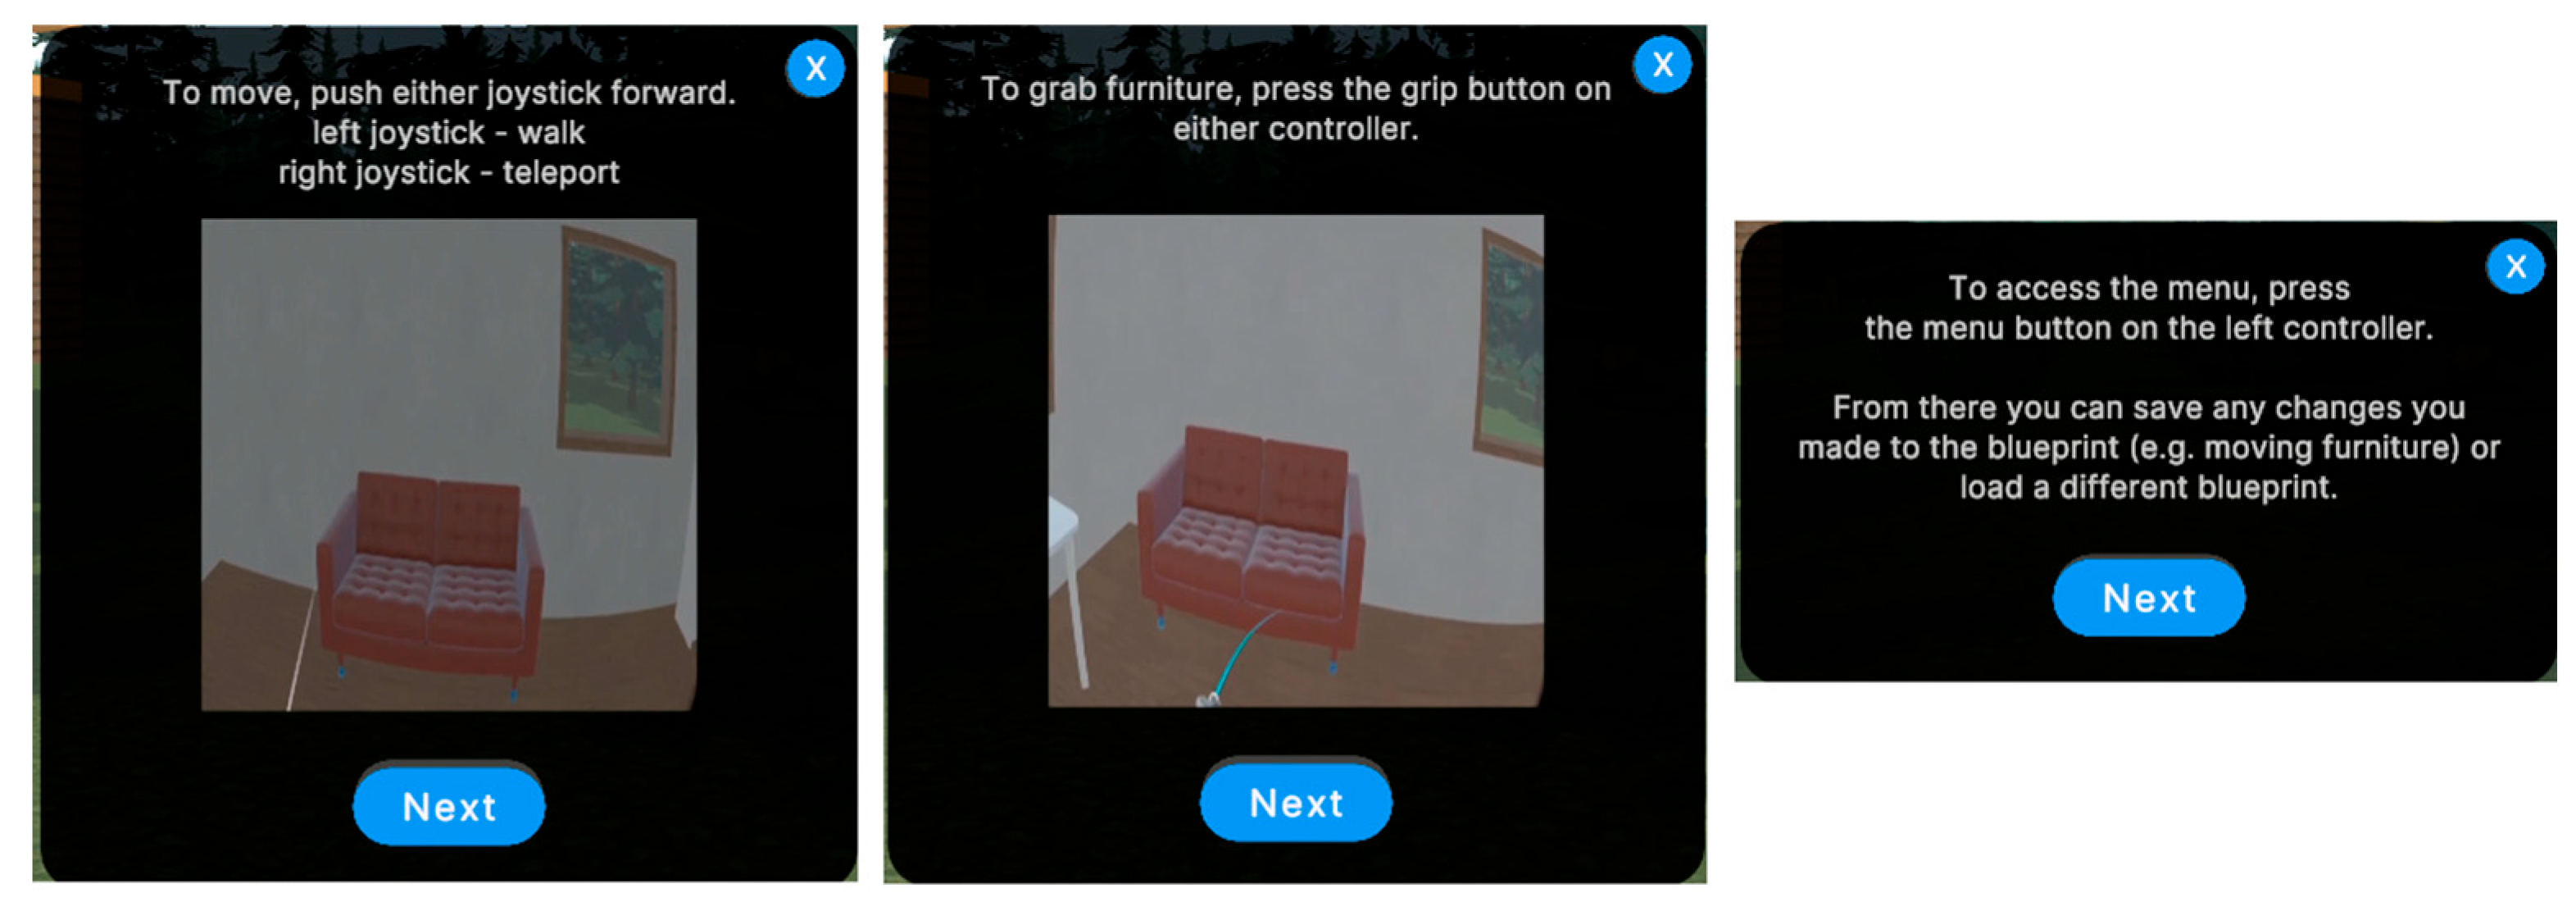
Figure 7.
Teleportation locomotion indicator in the Unreal (left) and Unity (right) VR application.
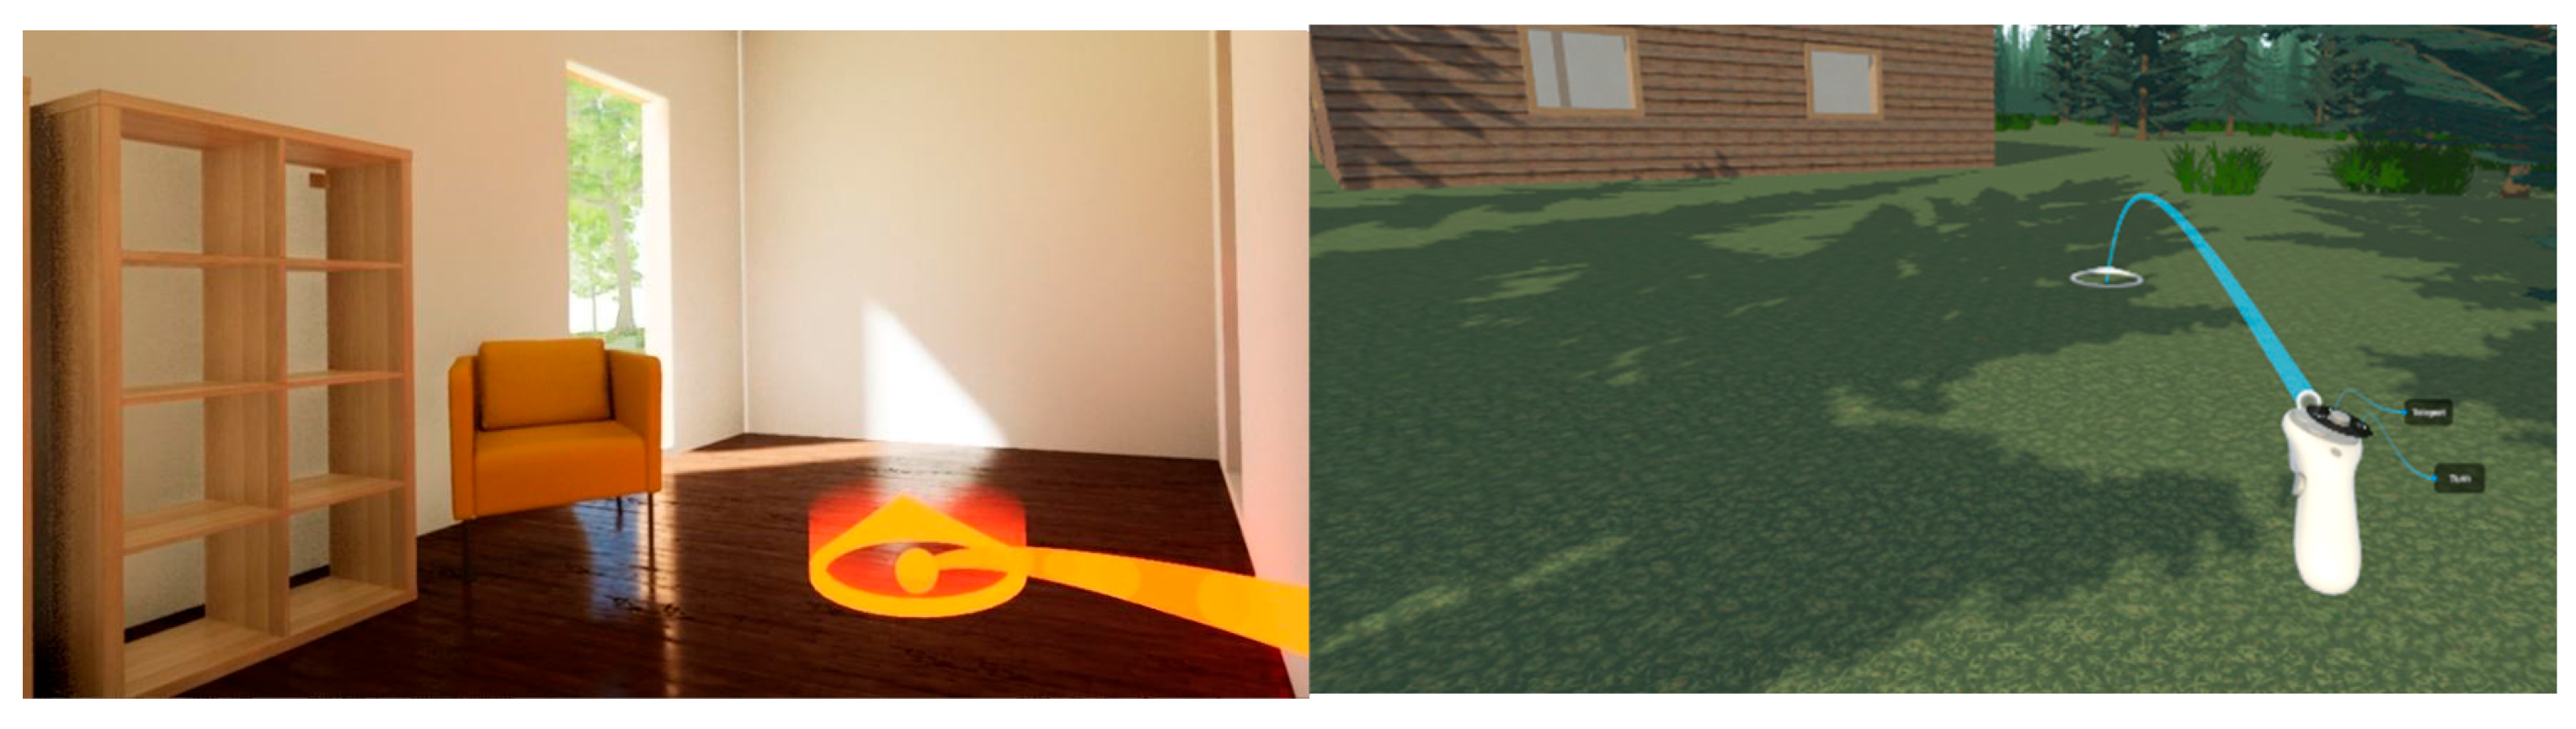
Figure 8.
Study procedure flow.
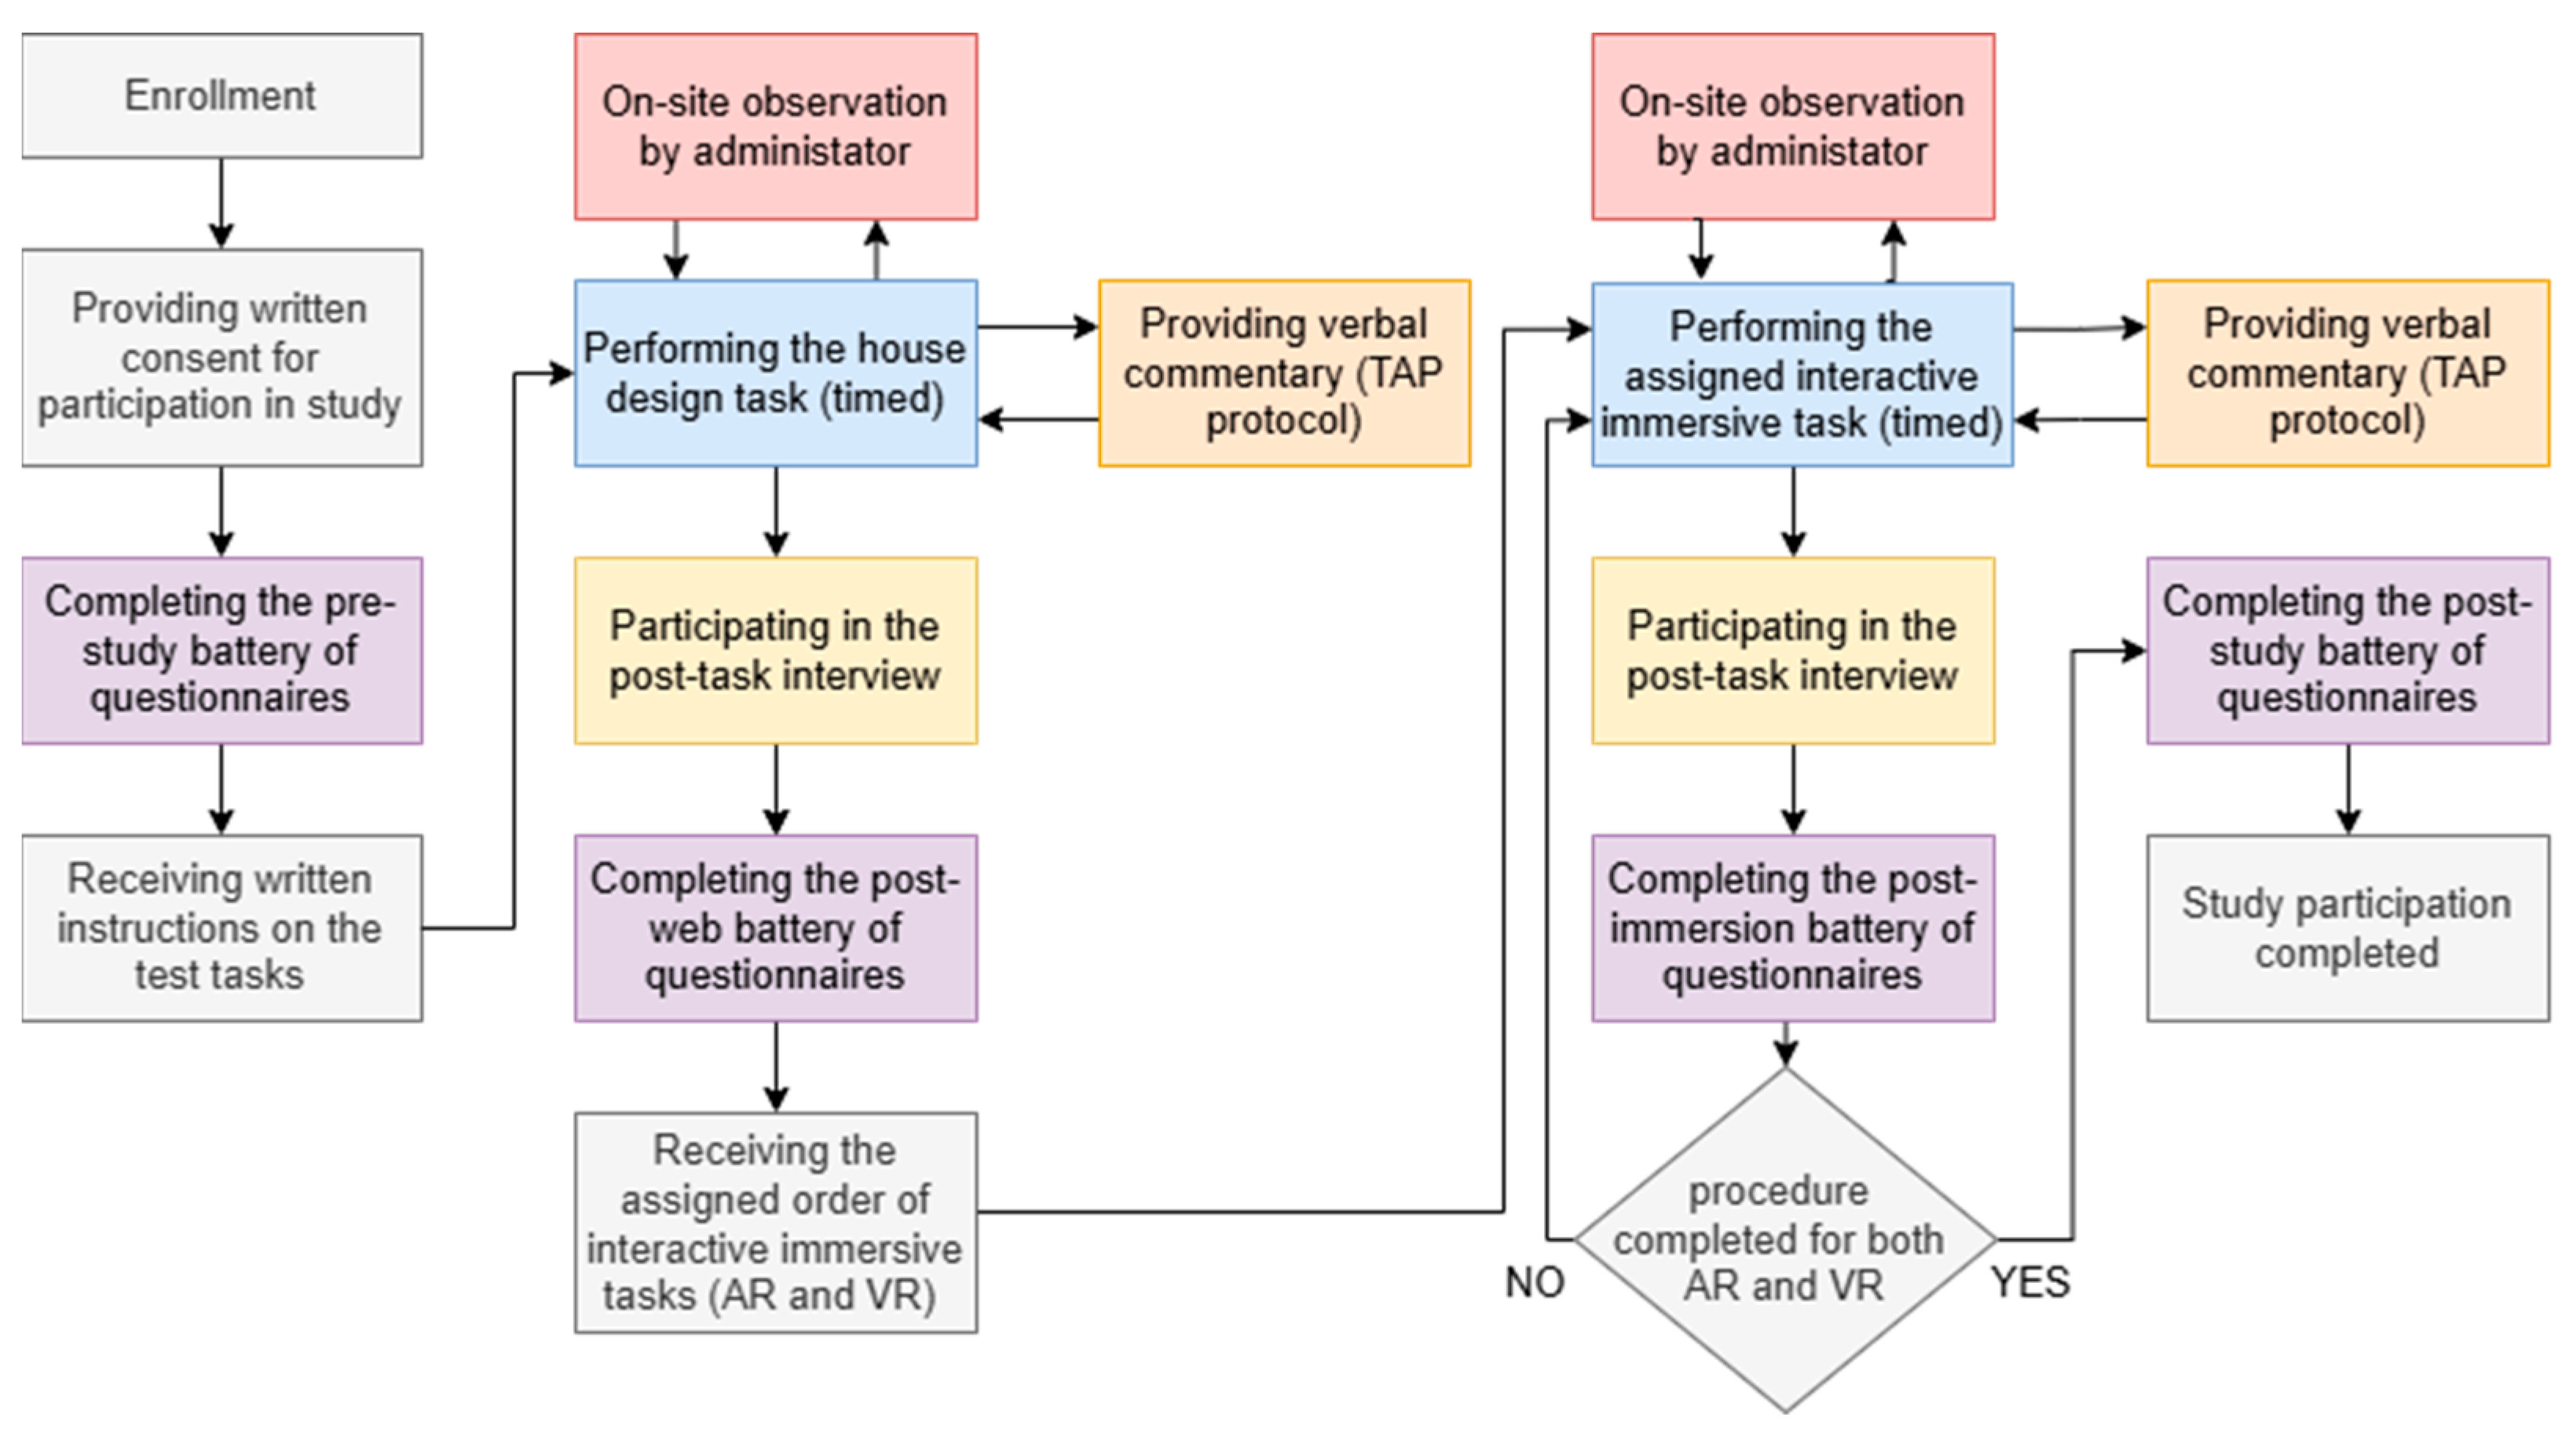
Figure 9.
Characteristics of collected measures.
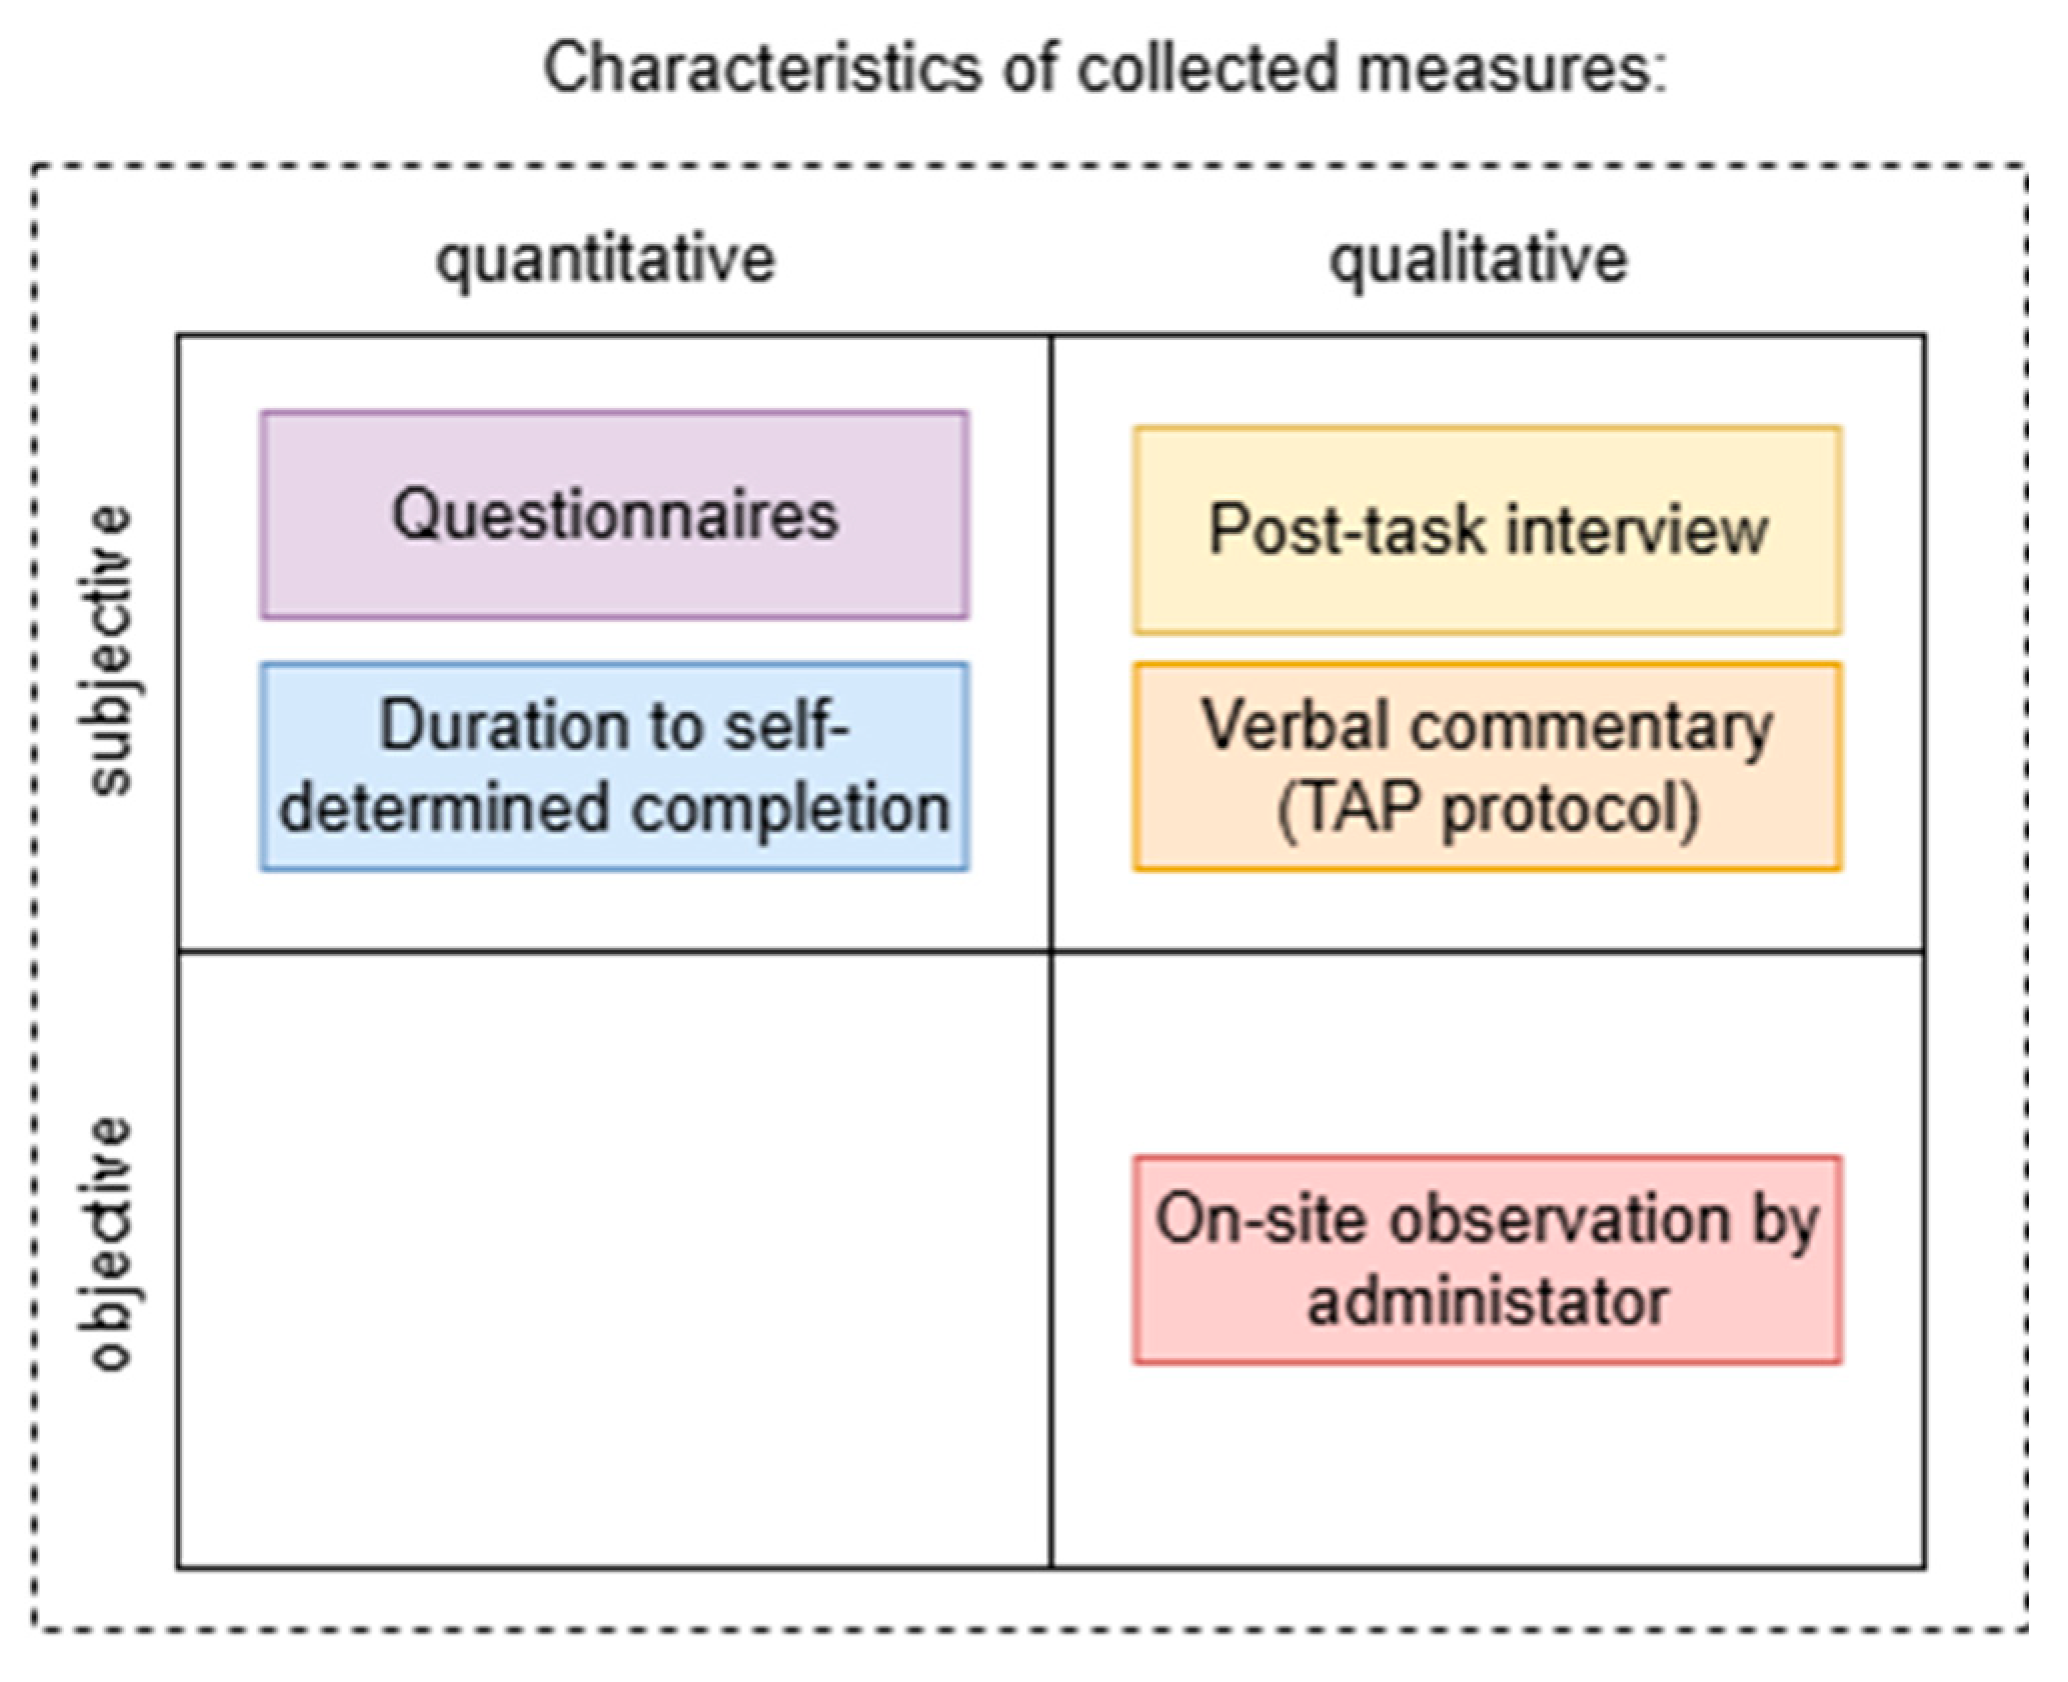
Figure 10.
Box plot of the QoE scores of Unity (left) and Unreal (right) VR applications.
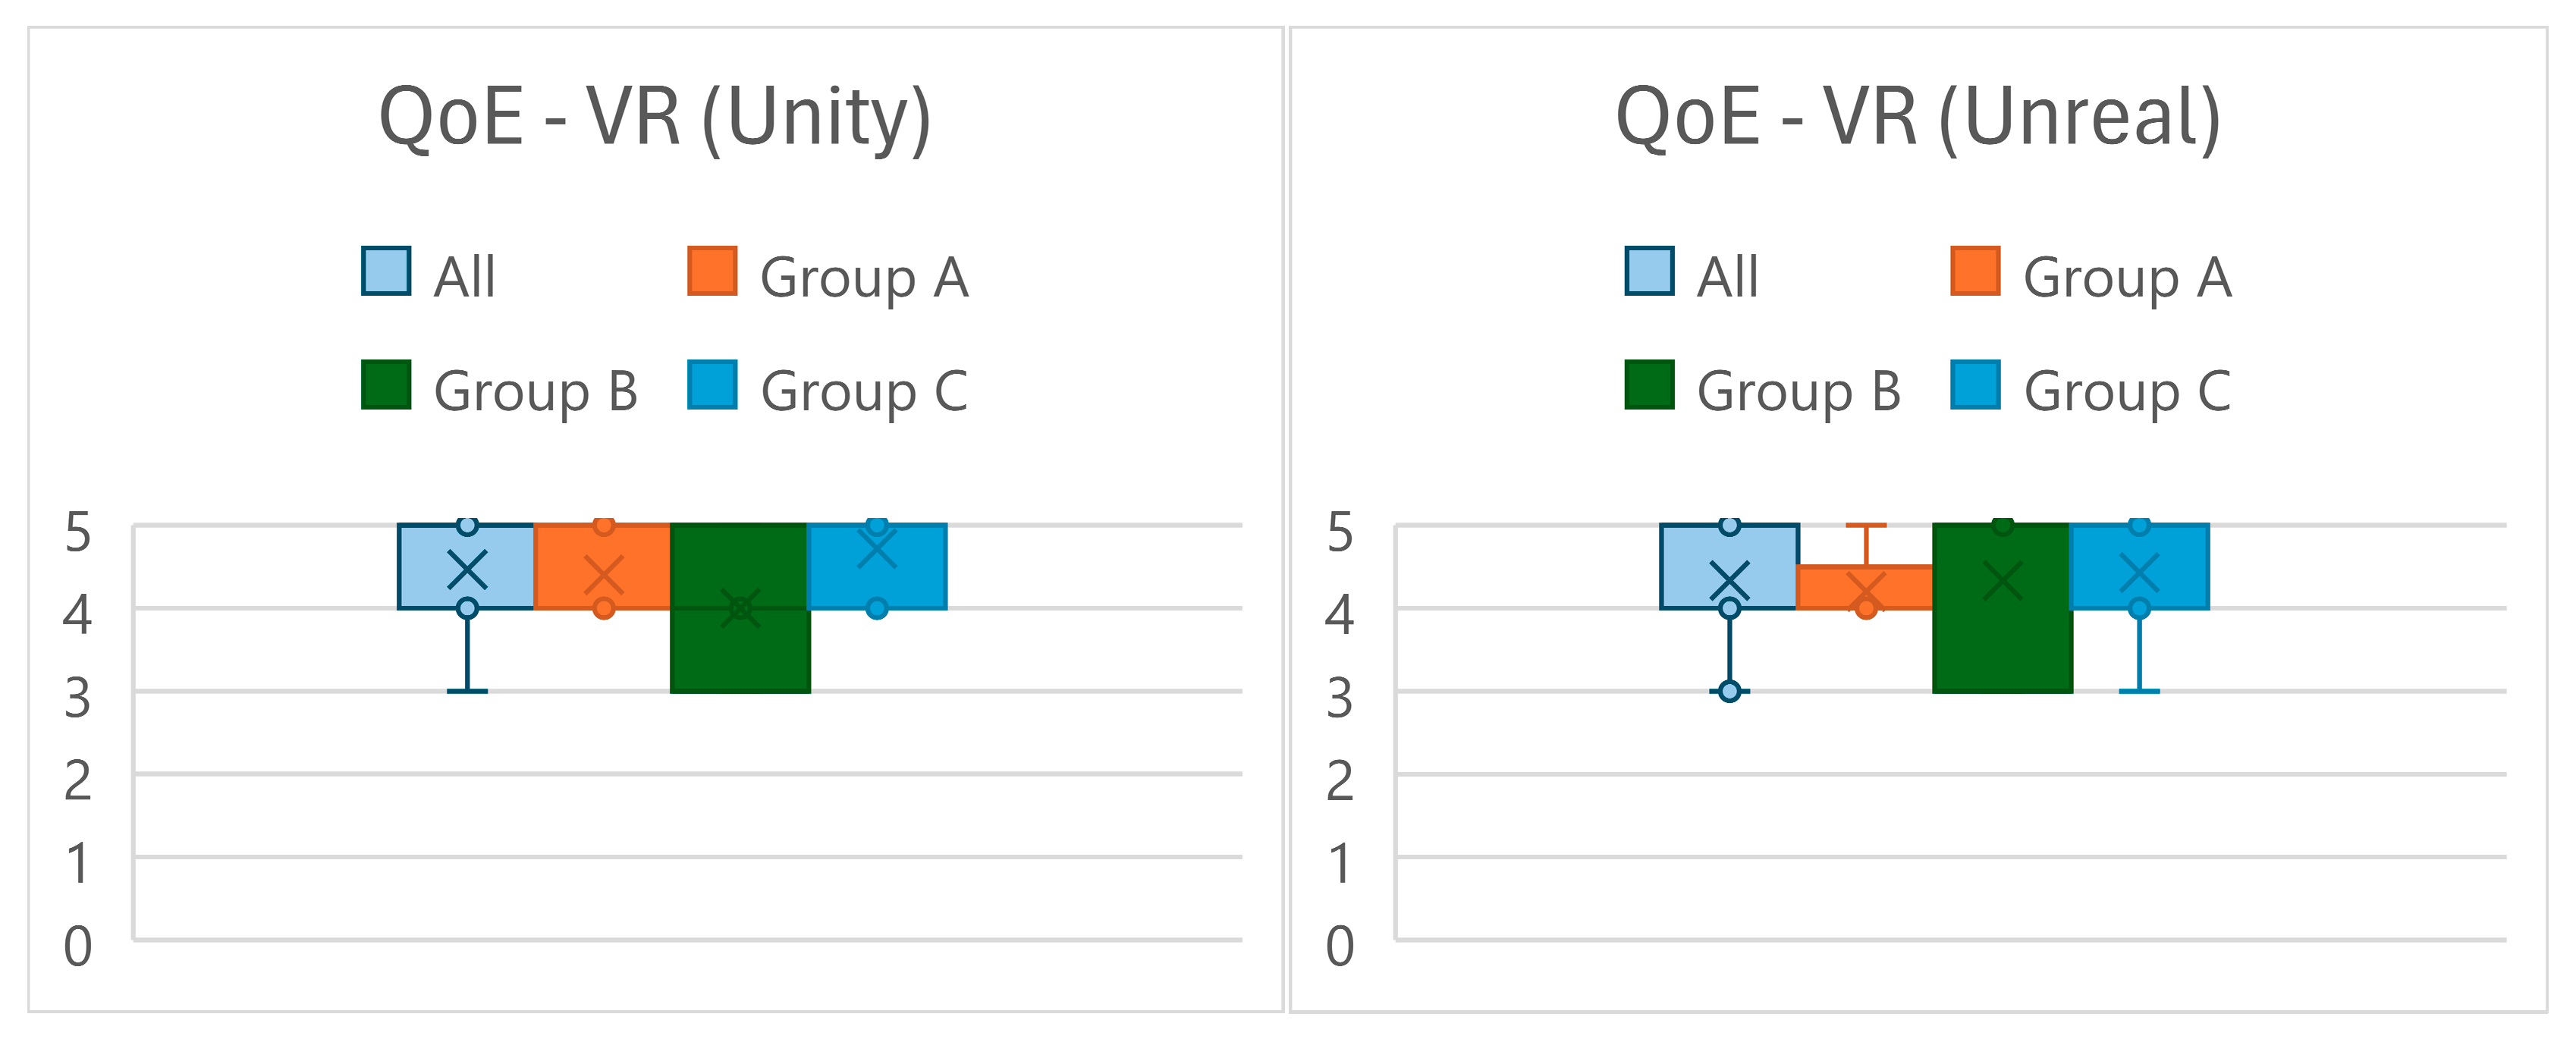
Figure 11.
Box plot of the QoE scores of AR and web applications.
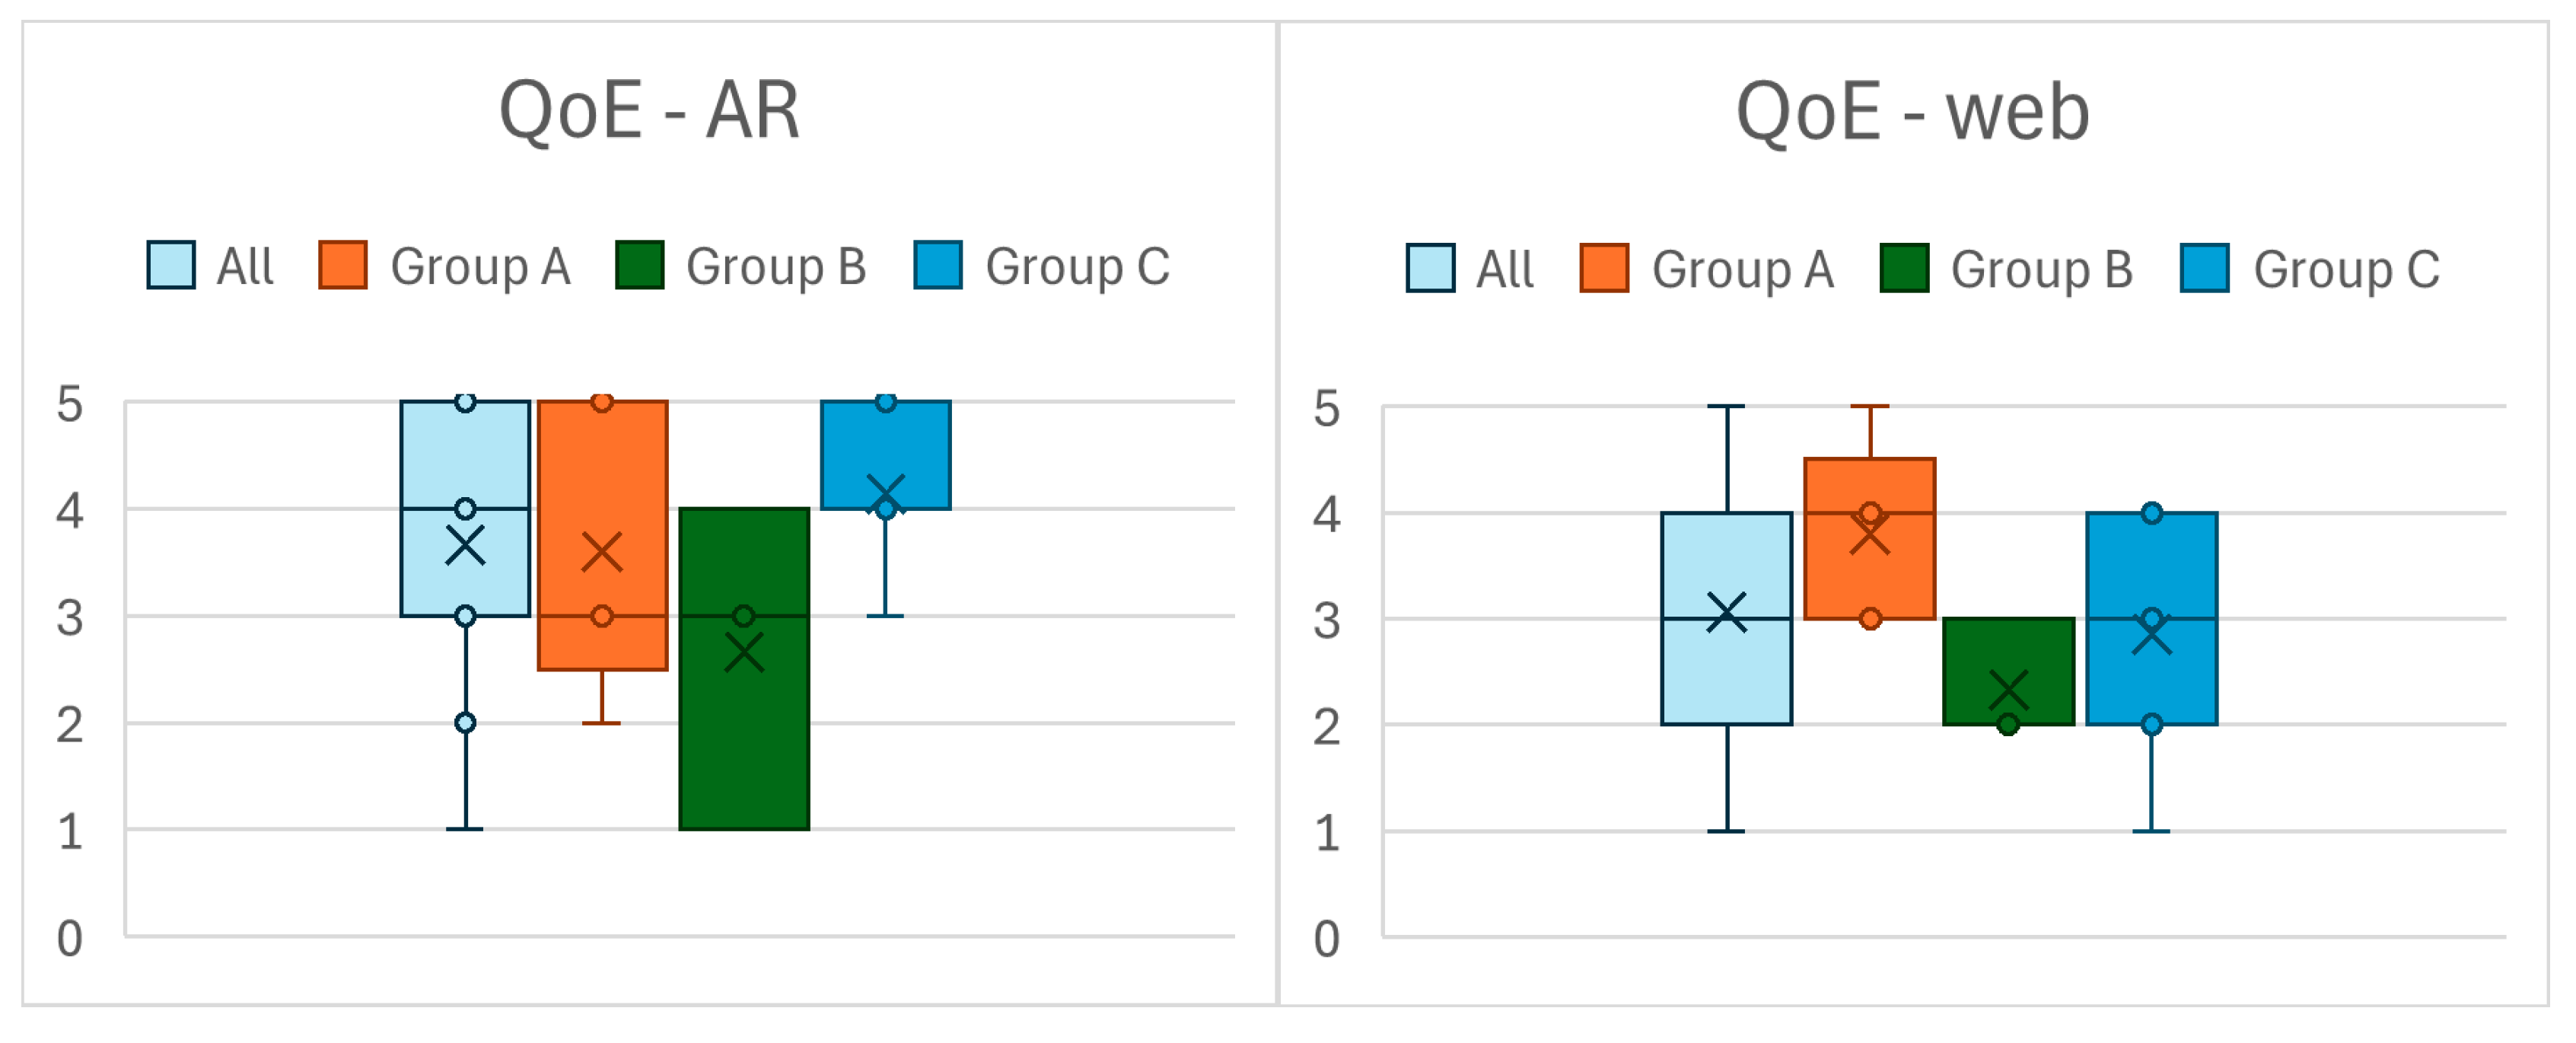
Figure 12.
Box plot of the SUS scores of Unity (left) and Unreal (right) VR applications.
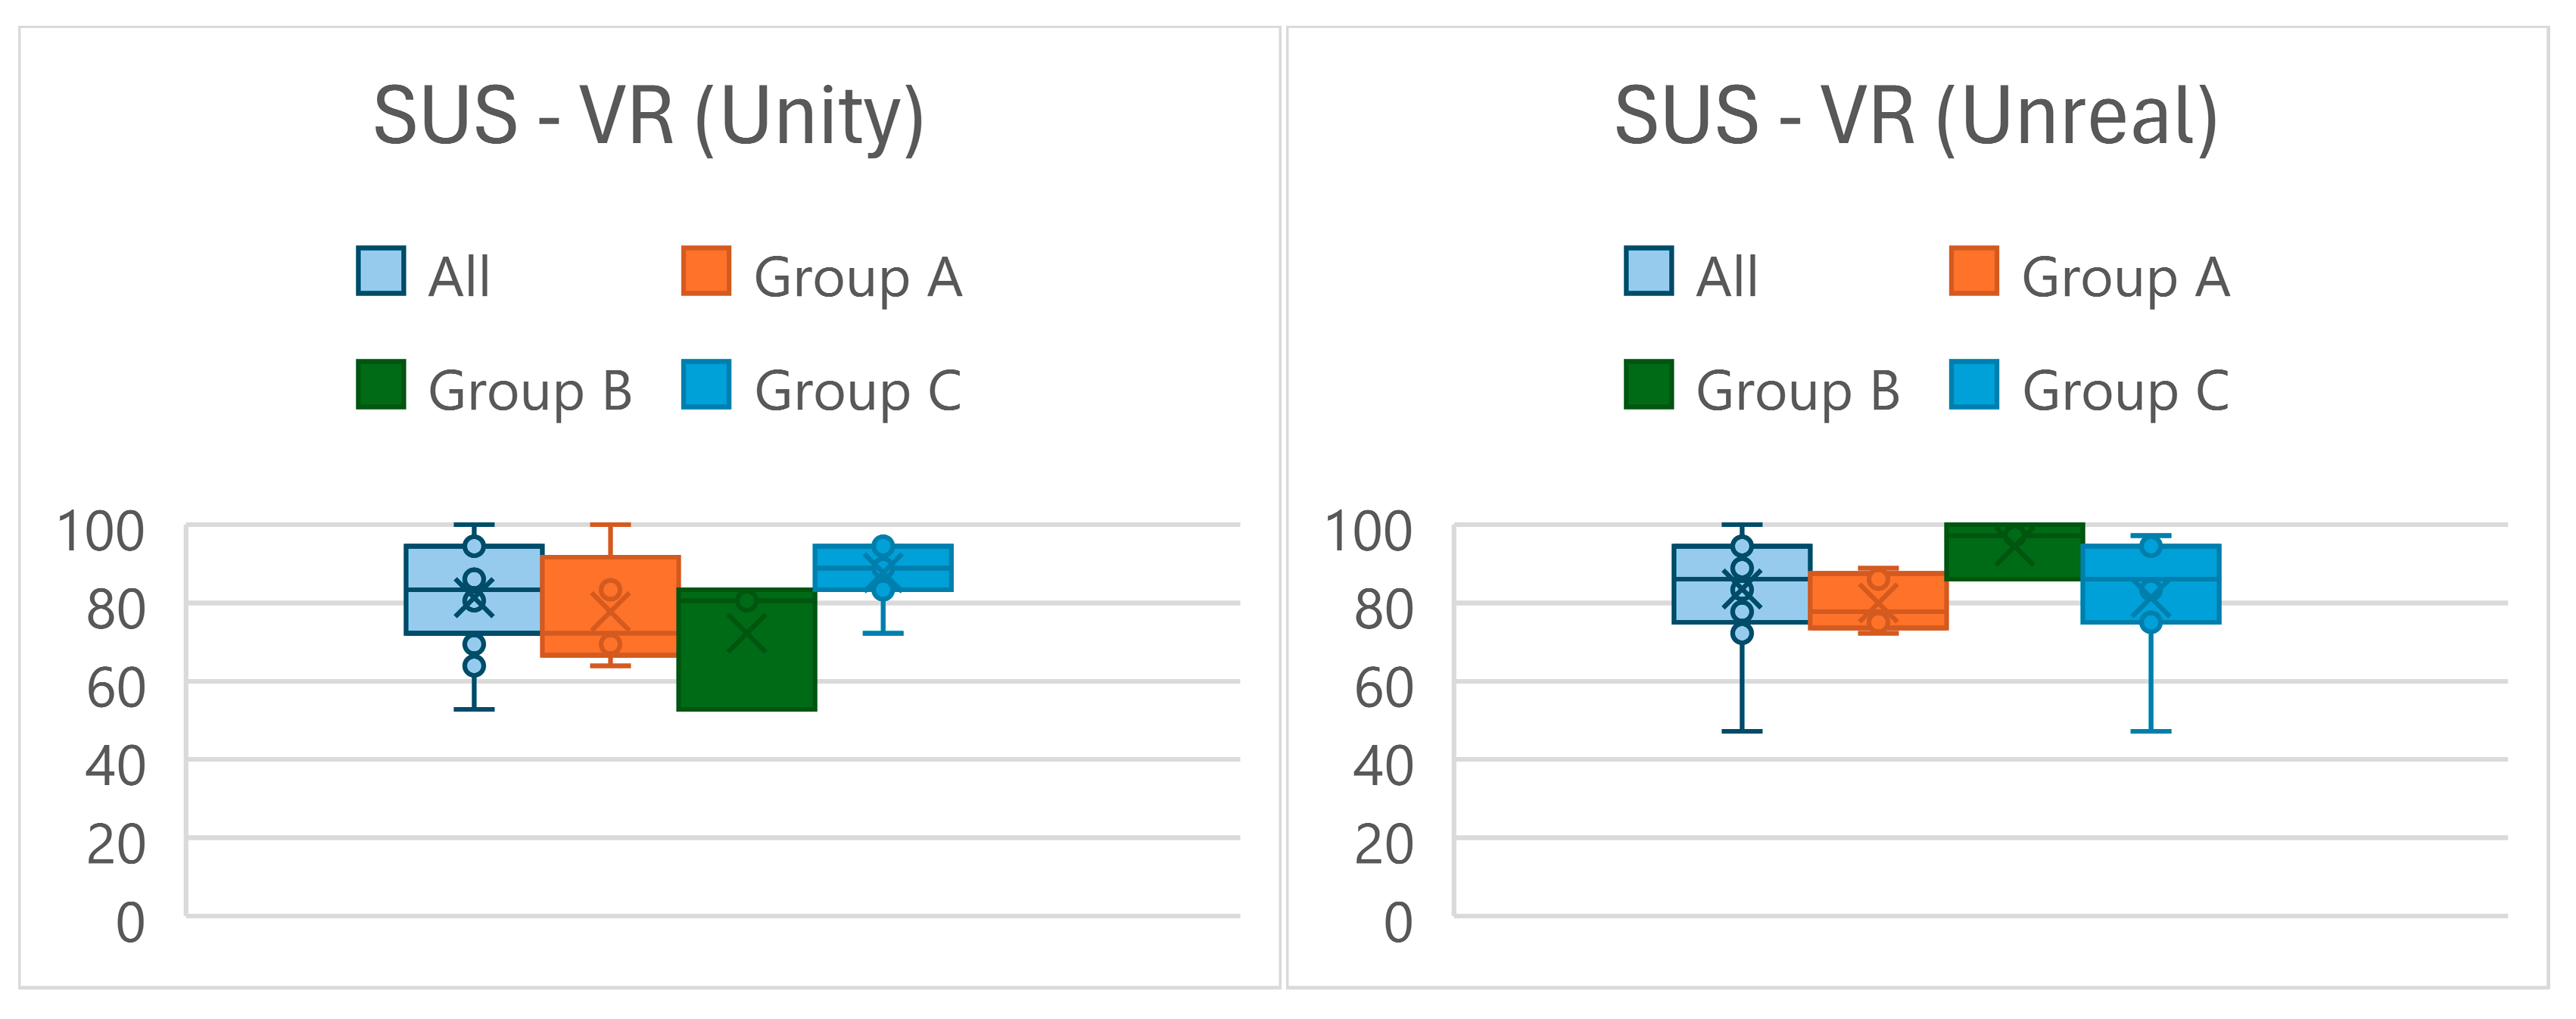
Figure 13.
Perceived Ease of Use (TAM-PEU) (left) and Perceived Usefulness (TAM-PU) (right).
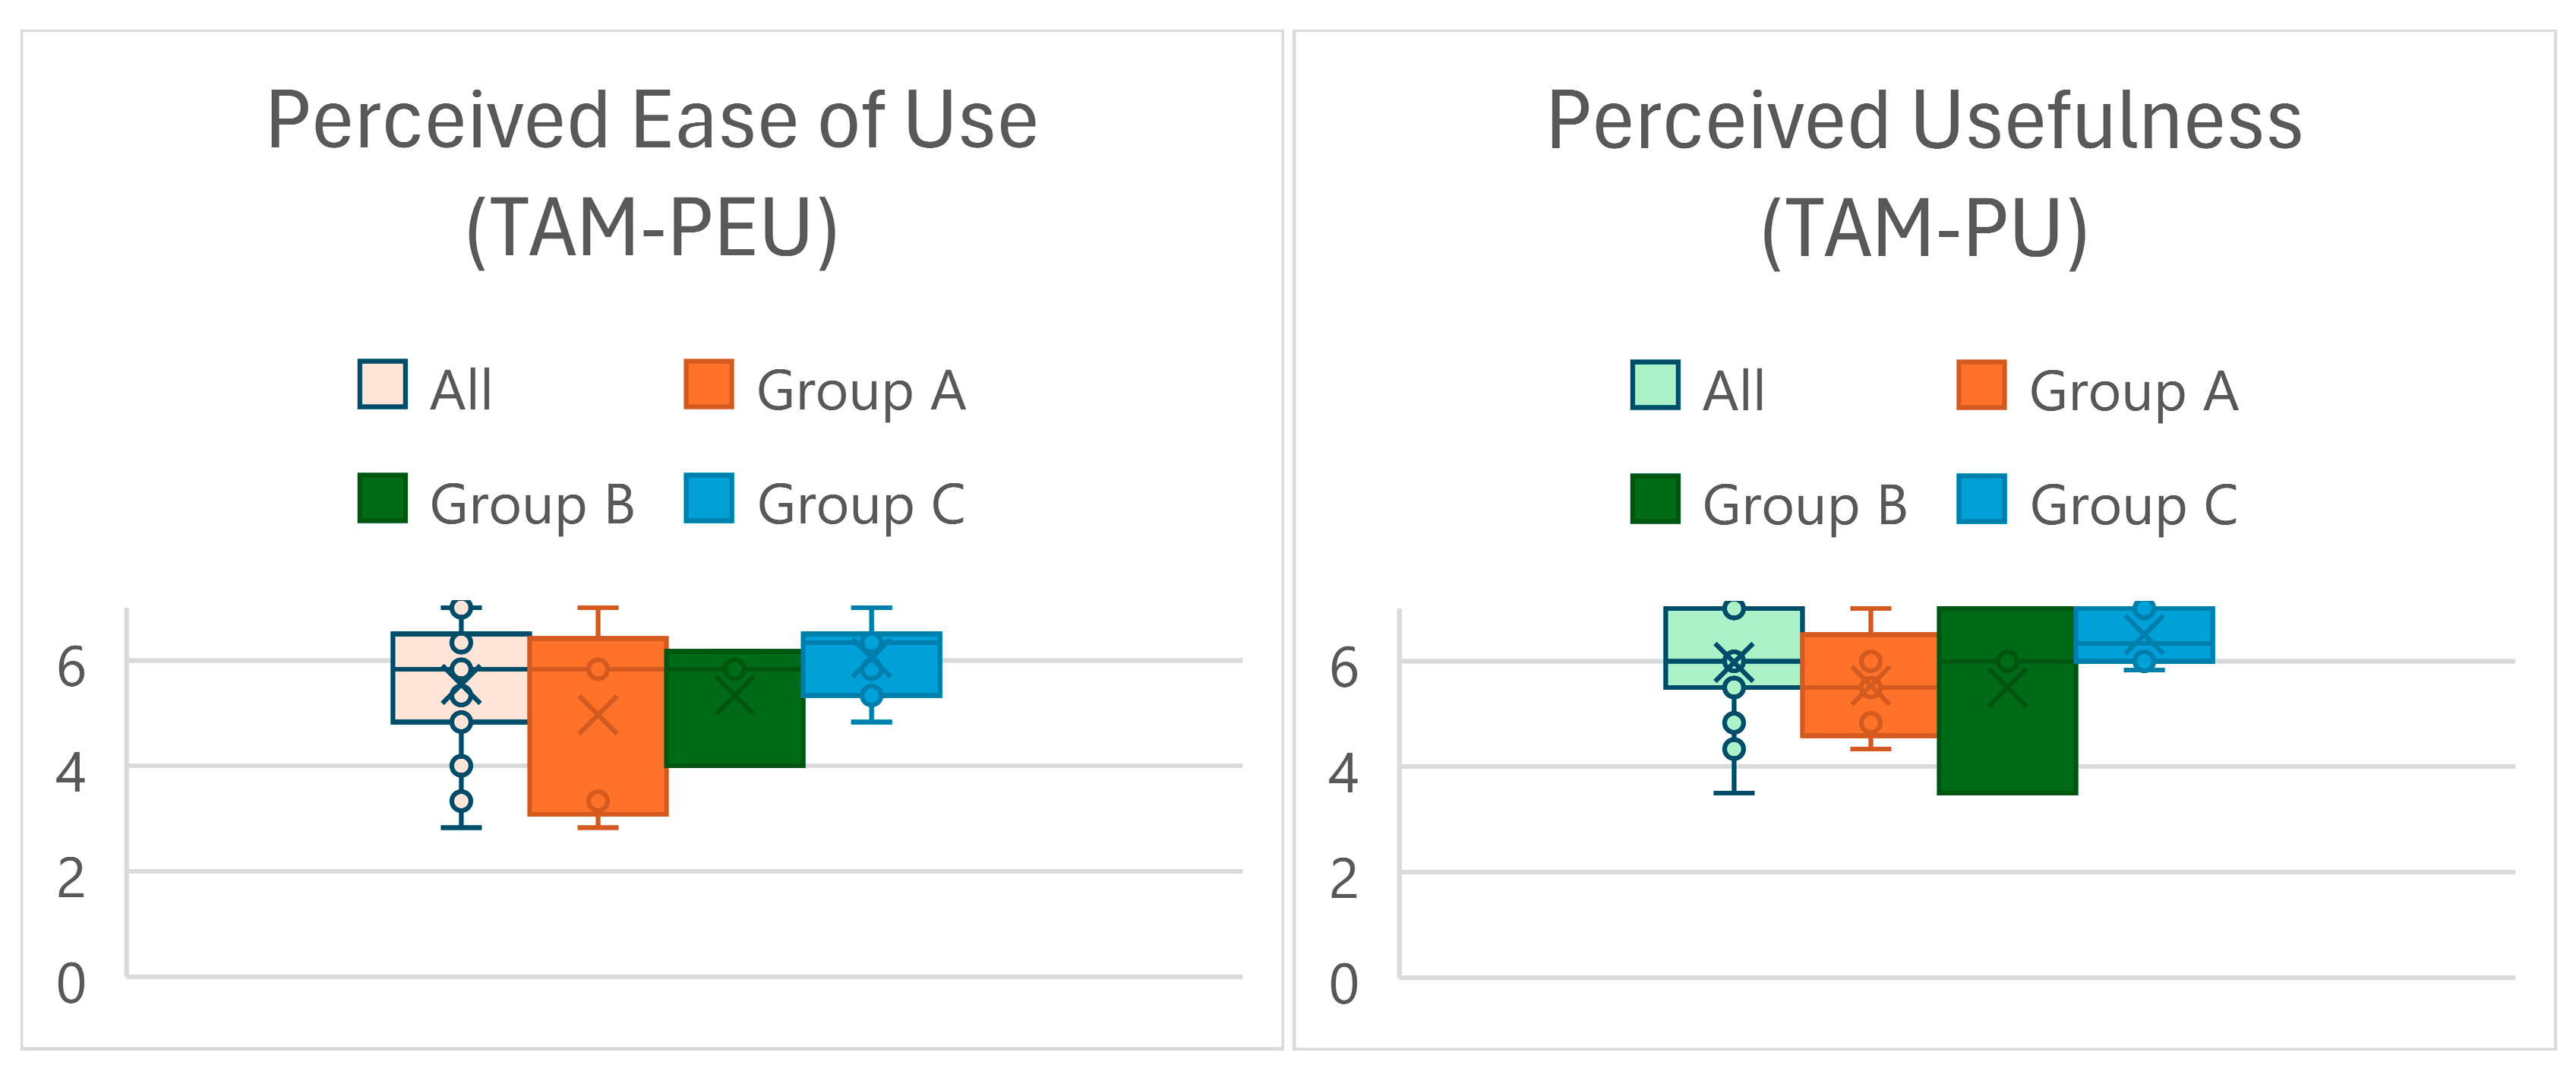
Figure 14.
Behavioral Intention to Use (TAM-BIU) (left) and Attitude Toward Using (TAM-ATU) (right).
Figure 14.
Behavioral Intention to Use (TAM-BIU) (left) and Attitude Toward Using (TAM-ATU) (right).
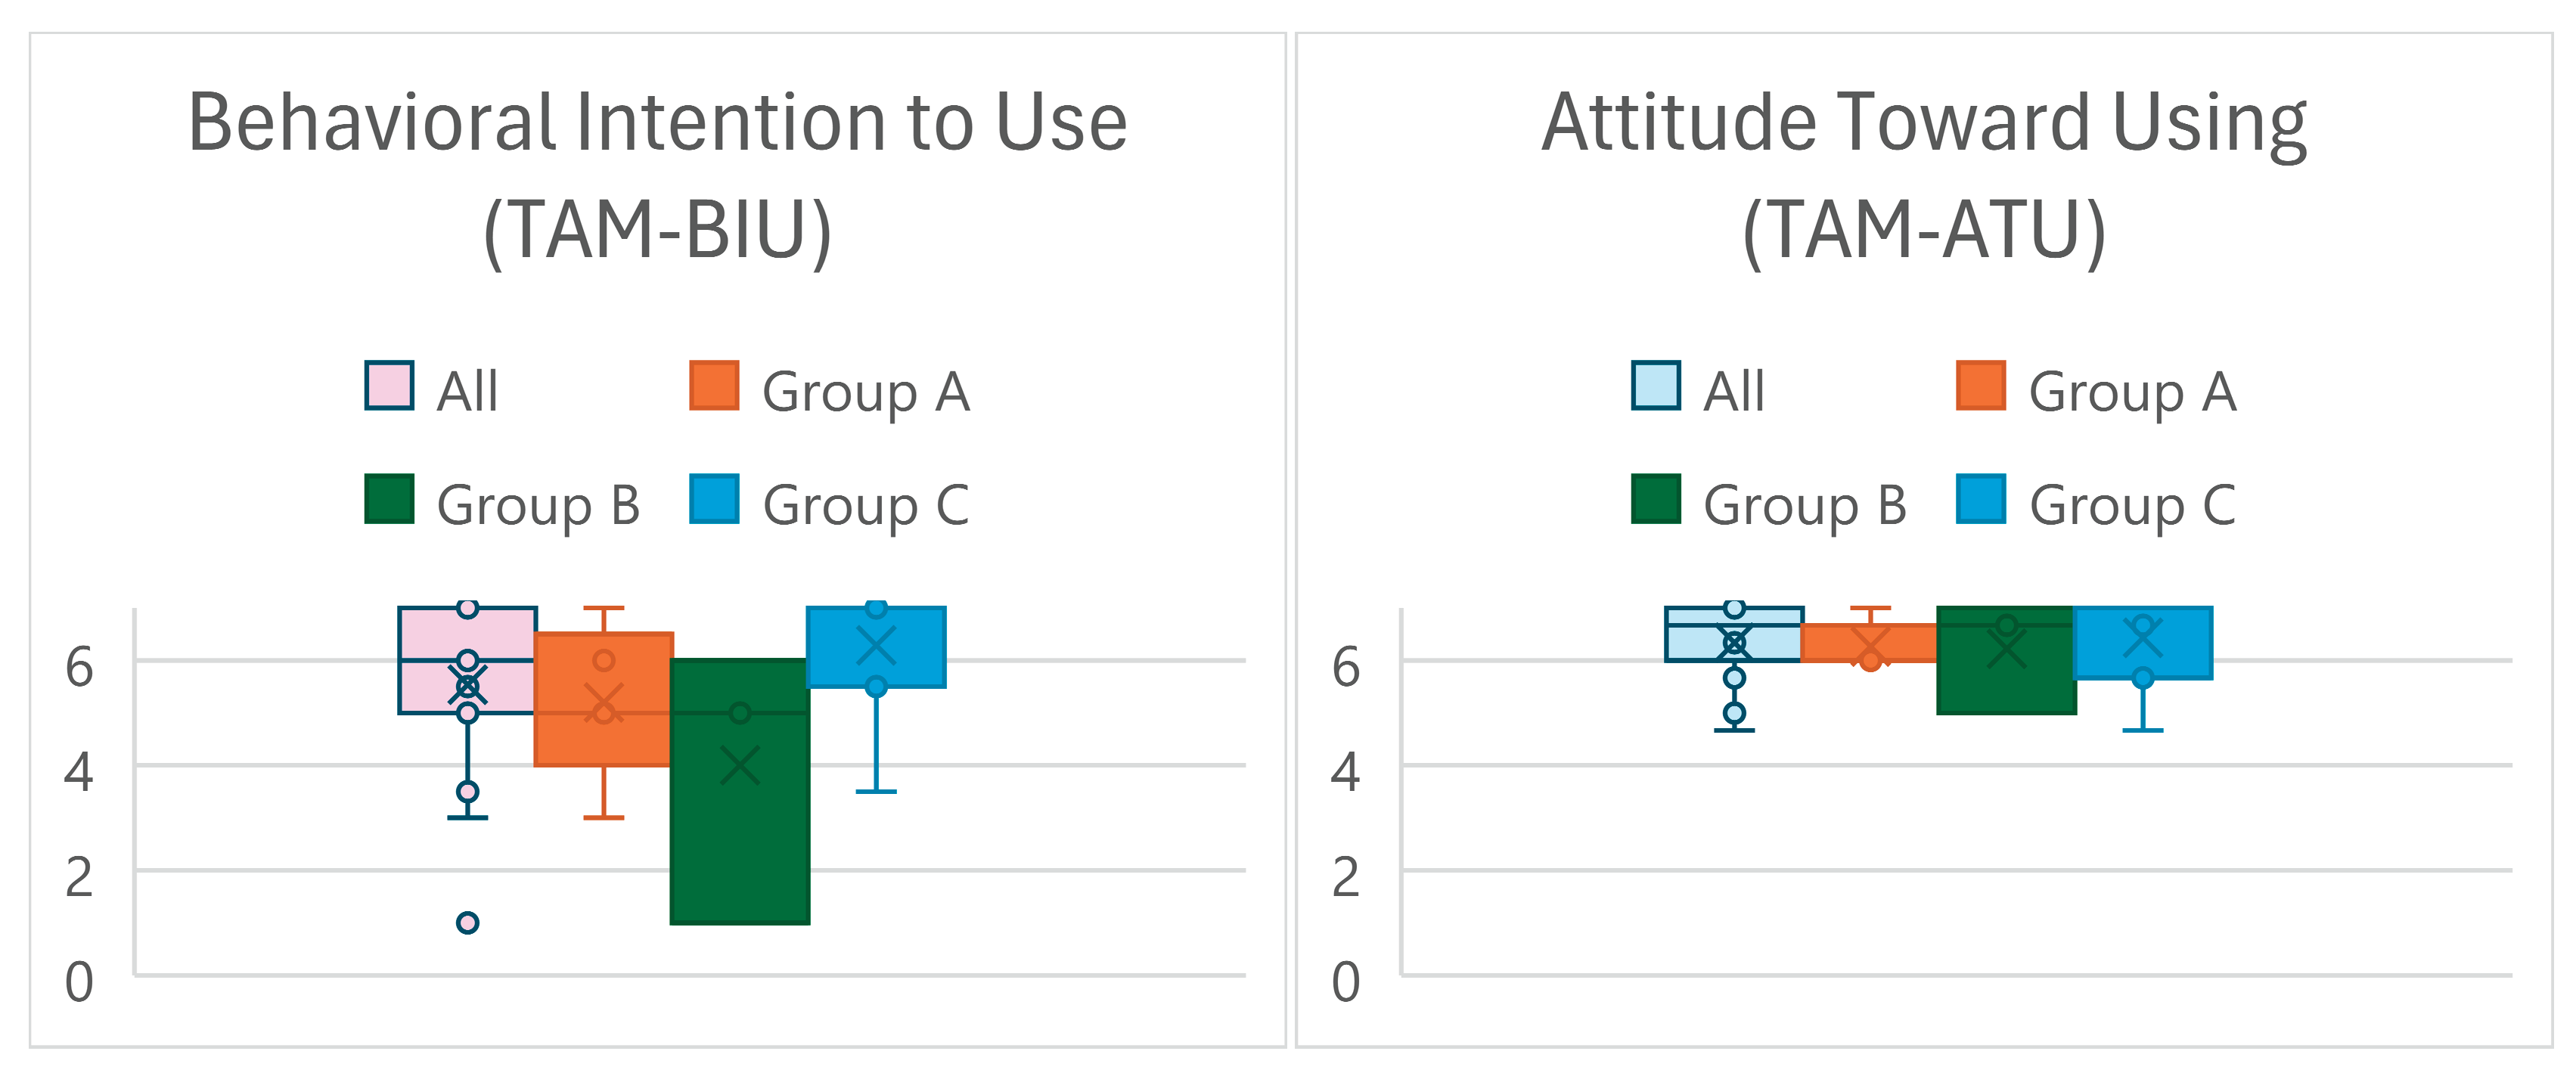

Table 1.
n overview of questionnaires used in the study.
| Questionnaire | Evaluated aspects/dimensions | Abbreviation | Timing | Anchors | Scoring |
|---|---|---|---|---|---|
|
Custom Participant Data Questionnaire |
Age, Sex, Education, Previous Experience with CAD Software, Interior Design Software, AR, And VR | / | Pre-study | / | / |
| Affinity For Technology Interaction (ATI) | Affinity for Technology Interaction | ATI | Pre-study | 1 - 'completely disagree' to 5 - 'completely agree' |
Mean of all items |
| System Usablity Scale (SUS) | System Usability | SUS | Post-web, post-immersion | 1 - 'strongly disagree' to 5 - 'strongly agree' |
Scored based on [21] (range 0-100) |
| Measurement, Effects, Conditions Spatial Presence Questionnaire (MEC-SPQ) | Spatial Situation Model Spatial Presence: Self Location Spatial Presence: Possible Actions Suspension of Disbelief Domain Specific Interest Visual Spatial Imagery |
MEC-SPQ SSM MEC-SPQ SPSL MEC-SPQ SPPA MEC-SPQ SoD MEC-SPQ DSI MEC-SPQ VSI |
Post-immersion Post-immersion Post-immersion Post-immersion Post-study Pre-study |
1 - 'I do not agree at all' to 5- 'I fully agree' |
Mean of all items per dimension, certain items reversed as described in [22] |
| Single-Item Quality of Experience (QoE) | Quality of Experience | QoE | Post-web, Post-immersion |
1 - 'bad'; to 5 - 'excellent' | / |
| Modified Technology Acceptance Model (Tam) Questionnaire | Perceived Ease of Use Perceived Usefulness Attitude Toward Usage Behavioural Intention to Use |
TAM PEU TAM PU TAM ATU TAM BIU |
Post-study Post-study Post-study Post-study |
1 - 'totally disagree' to 5 - 'totally agree' |
Mean of all items per dimension |
| Item 1 from the SUS questionnaire was omitted as it is contextually irrelevant. Thus, scoring was adjusted to a 0–100 scale based on 9 items instead of 10. | |||||
Table 2.
An overview of participant characteristics.
| Characteristics | Group | |||||||||||||||
|---|---|---|---|---|---|---|---|---|---|---|---|---|---|---|---|---|
| A | B | C | ||||||||||||||
| ID | 1 | 3 | 4 | 5 | 6 | 7 | 8 | 9 | 13 | 14 | 15 | 16 | 17 | 18 | 19 | |
| Age | 42 | 34 | 33 | 59 | 59 | 25 | 26 | 68 | 30 | 33 | 29 | 28 | 45 | 27 | 31 | |
| Sex [M/F] | M | M | F | F | M | F | M | F | F | F | F | M | F | F | M | |
| ATI | 5,11 | 4,33 | 2,78 | 2,56 | 4,00 | 4,44 | 3,33 | 1,67 | 4,11 | 4,22 | 4,78 | 3,78 | 3,56 | 4,33 | 4,33 | |
| MEC-SPQ | DSI | 3,75 | 3,50 | 2,25 | 3,50 | 4,00 | 3,00 | 1,00 | 5,00 | 5.00 | 4.00 | 5.00 | 4,25 | 5.00 | 5.00 | 2,25 |
| VSI | 5,00 | 3,25 | 3,00 | 2,75 | 4,25 | 1,75 | 4,00 | 4,00 | 5.00 | 4.00 | 2,25 | 4.00 | 5.00 | 4.00 | 3,50 | |
|
Tech experience |
CAD | 4 | 3 | 2 | 1 | 3 | 1 | 1 | 1 | 2 | 1 | 3 | 2 | 5 | 3 | 1 |
| IDSW | 5 | 3 | 3 | 1 | 2 | 2 | 3 | 2 | 5 | 4 | 4 | 2 | 1 | 4 | 1 | |
| VR | 5 | 2 | 2 | 1 | 2 | 2 | 3 | 2 | 3 | 1 | 2 | 4 | 1 | 4 | 1 | |
| AR | 5 | 2 | 2 | 1 | 2 | 5 | 5 | 1 | 3 | 1 | 4 | 4 | 1 | 3 | 2 | |
| Real Estate Experience | Ownership | ✓ | ✓ | ✓ | ✓ | ✓ | ✓ | ✓ | ✓ | ✓ | ✓ | ✓ | ||||
| Buying | ✓ | ✓ | ✓ | ✓ | ✓ | ✓ | ✓ | ✓ | ✓ | |||||||
| Building | ✓ | ✓ | ||||||||||||||
| Adapting | ✓ | ✓ | ✓ | ✓ | ✓ | ✓ | ✓ | ✓ | ||||||||
| Interior design | ✓ | ✓ | ✓ | ✓ | ✓ | ✓ | ✓ | ✓ | ✓ | ✓ | ✓ | |||||
Table 3.
Time spent in web, AR and both VR applications in Study 3 (time format mm:ss).
| ID | Web | AR | VR - Unity | VR - Unreal |
|---|---|---|---|---|
| 1 | 08:00 | 06:30 | 05:25 | 13:48 |
| 3 | 13:26 | 05:33 | 06:55 | 07:38 |
| 4 | 14:31 | 05:00 | 06:07 | 05:06 |
| 5 | 13:26 | 07:01 | 06:38 | 07:21 |
| 6 | 13:21 | 04:25 | 05:29 | 04:51 |
| 7 | 16:42 | 04:35 | 07:45 | 07:28 |
| 8 | 07:27 | 04:22 | 05:18 | 05:09 |
| 9 | 14:37 | 07:25 | 16:03 | 11:43 |
| 13 | 04:14 | 04:32 | 02:54 | 03:34 |
| 14 | 59:59 | 11:43 | 16:48 | 12:36 |
| 15 | 15:32 | 04:08 | 05:51 | 08:15 |
| 16 | 19:45 | 05:40 | 06:26 | 09:35 |
| 17 | 23:42 | 07:20 | 07:06 | 08:00 |
| 18 | 15:43 | 04:00 | 07:33 | 08:59 |
| 19 | 12:25 | 08:40 | 11:01 | 09:15 |
Table 4.
dividual ratings provided by each participant (ID) across both studies (S) and groups (G): Results from QoE, SUS and MEC-SPQ (SSM, SPSL, SPPA, SoD) questionnaires.
Table 4.
dividual ratings provided by each participant (ID) across both studies (S) and groups (G): Results from QoE, SUS and MEC-SPQ (SSM, SPSL, SPPA, SoD) questionnaires.
| Web | AR | VR (only Unity version) | ||||||||||||||
|---|---|---|---|---|---|---|---|---|---|---|---|---|---|---|---|---|
| S | G | ID | QoE | SUS | QoE | SUS | SSM | SPSL | SPPA | SoD | QoE | SUS | SSM | SPSL | SPPA | SoD |
| 1 | A | 1 | 2 | 44,44 | 1 | 36,11 | 5,00 | 5,00 | 3,50 | 1,50 | 5 | 91,67 | 5,00 | 5,00 | 2,25 | 3,50 |
| 2 | 2 | 52,78 | 4 | 83,33 | 3,75 | 3,50 | 3,25 | 2,50 | 4 | 86,11 | 4,75 | 5,00 | 2,50 | 2,75 | ||
| 3 | 3 | 72,22 | 4 | 75,00 | 3,75 | 3,50 | 3,00 | 2,50 | 4 | 94,44 | 4,75 | 5,00 | 5,00 | 2,50 | ||
| 4 | 2 | 44,44 | 4 | 75,00 | 3,00 | 3,00 | 3,00 | 2,75 | 4 | 75,00 | 4,75 | 5,00 | 5,00 | 4,00 | ||
| 5 | 2 | 27,78 | 3 | 44,44 | 2,25 | 3,50 | 2,75 | 3,00 | 4 | 61,11 | 4,50 | 4,50 | 4,25 | 3,25 | ||
| 6 | 4 | 47,22 | 5 | 83,33 | 5,00 | 5,00 | 5,00 | 3,00 | 4 | 72,22 | 4,00 | 4,00 | 4,00 | 3,50 | ||
| 2 | A | 1 | 4 | 80,56 | 5 | 100,00 | 5,00 | 5,00 | 5,00 | 3,50 | 5 | 100,00 | 5,00 | 5,00 | 5,00 | 4,25 |
| 2 | 4 | 80,56 | 4 | 72,22 | 3,50 | 3,75 | 4,00 | 1,25 | 5 | 94,44 | 4,75 | 5,00 | 4,50 | 3,25 | ||
| 3 | 4 | 86,11 | 4 | 83,33 | 4,00 | 3,50 | 3,25 | 2,75 | 4 | 88,89 | 4,00 | 4,25 | 4,00 | 2,75 | ||
| 4 | 3 | 58,33 | 2 | 44,44 | 2,50 | 2,25 | 2,25 | 3,00 | 4 | 75,00 | 3,50 | 4,00 | 4,00 | 3,25 | ||
| 5 | 3 | 69,44 | 3 | 63,89 | 3,75 | 3,75 | 3,50 | 3,50 | 4 | 75,00 | 4,25 | 5,00 | 4,25 | 3,00 | ||
| 6 | 4 | 72,22 | 4 | 75,00 | 4,25 | 4,50 | 4,00 | 3,75 | 4 | 69,44 | 4,25 | 4,00 | 4,00 | 3,50 | ||
| B | 7 | 3 | 66,67 | 4 | 80,56 | 3,50 | 3,25 | 3,00 | 2,00 | 4 | 83,33 | 4,75 | 4,25 | 4,25 | 1,50 | |
| 8 | 4 | 63,89 | 2 | 52,78 | 1,75 | 2,00 | 2,00 | 1,50 | 3 | 61,11 | 5,00 | 3,75 | 3,50 | 1,25 | ||
| 9 | 3 | 66,67 | 2 | 30,56 | 4,25 | 4,50 | 3,75 | 1,25 | 5 | 66,67 | 4,50 | 5,00 | 4,25 | 2,75 | ||
| 10 | 3 | 83,33 | 5 | 100,00 | 5,00 | 5,00 | 5,00 | 3,00 | 5 | 91,67 | 5,00 | 5,00 | 5,00 | 3,75 | ||
| 11 | 2 | 36,11 | 4 | 80,56 | 3,50 | 4,00 | 3,75 | 2,25 | 5 | 83,33 | 5,00 | 5,00 | 5,00 | 5,00 | ||
| 12 | 2 | 52,78 | 4 | 75,00 | 3,50 | 2,25 | 2,75 | 4,00 | 4 | 66,67 | 3,25 | 3,75 | 3,75 | 4,00 | ||
| 3 | A | 1 | 5 | 83,33 | 5 | 100,00 | 5,00 | 4,75 | 5,00 | 0,50 | 5 | 100,00 | 5,00 | 5,00 | 5,00 | 1,00 |
| 3 | 4 | 55,56 | 3 | 88,89 | 4,00 | 3,75 | 3,75 | 2,50 | 4 | 83,33 | 4,00 | 4,00 | 4,00 | 2,50 | ||
| 4 | 3 | 44,44 | 3 | 38,89 | 2,75 | 2,75 | 2,50 | 3,50 | 4 | 63,89 | 3,25 | 3,75 | 4,00 | 4,25 | ||
| 5 | 3 | 58,33 | 2 | 38,89 | 2,75 | 2,75 | 2,50 | 1,75 | 4 | 69,44 | 4,50 | 3,75 | 4,75 | 3,00 | ||
| 6 | 4 | 72,22 | 5 | 80,56 | 4,25 | 4,00 | 4,00 | 3,00 | 5 | 72,22 | 4,00 | 4,25 | 4,00 | 2,75 | ||
| B | 7 | 3 | 66,67 | 4 | 80,56 | 4,50 | 3,75 | 4,75 | 1,00 | 4 | 80,56 | 4,25 | 4,25 | 4,75 | 1,25 | |
| 8 | 2 | 47,22 | 3 | 44,44 | 3,25 | 2,75 | 3,25 | 2,00 | 3 | 52,78 | 3,75 | 3,00 | 2,75 | 1,75 | ||
| 9 | 2 | 27,78 | 1 | 11,11 | 1,00 | 1,75 | 1,00 | 0,50 | 5 | 83,33 | 5,00 | 5,00 | 5,00 | 2,50 | ||
| C | 13 | 2 | 69,44 | 3 | 69,44 | 4,50 | 3,25 | 3,75 | 2,25 | 5 | 88,89 | 5,00 | 5,00 | 4,75 | 2,75 | |
| 14 | 1 | 38,89 | 4 | 44,44 | 2,75 | 3,75 | 2,25 | 0,50 | 5 | 72,22 | 4,75 | 5,00 | 4,00 | 0,50 | ||
| 15 | 4 | 75,00 | 4 | 94,44 | 4,50 | 5,00 | 4,75 | 2,00 | 5 | 94,44 | 4,50 | 5,00 | 5,00 | 3,75 | ||
| 16 | 4 | 86,11 | 5 | 94,44 | 5,00 | 5,00 | 2,75 | 2,00 | 4 | 86,11 | 5,00 | 5,00 | 4,50 | 3,25 | ||
| 17 | 3 | 69,44 | 5 | 100,00 | 5,00 | 5,00 | 5,00 | 1,00 | 5 | 83,33 | 5,00 | 5,00 | 4,00 | 2,25 | ||
| 18 | 3 | 72,22 | 4 | 91,67 | 4,75 | 4,00 | 3,75 | 2,50 | 5 | 94,44 | 5,00 | 5,00 | 5,00 | 2,00 | ||
| 19 | 3 | 55,56 | 4 | 69,44 | 4,00 | 2,75 | 3,25 | 2,25 | 4 | 94,44 | 4,00 | 4,25 | 4,50 | 2,50 | ||
Disclaimer/Publisher’s Note: The statements, opinions and data contained in all publications are solely those of the individual author(s) and contributor(s) and not of MDPI and/or the editor(s). MDPI and/or the editor(s) disclaim responsibility for any injury to people or property resulting from any ideas, methods, instructions or products referred to in the content. |
© 2025 by the authors. Licensee MDPI, Basel, Switzerland. This article is an open access article distributed under the terms and conditions of the Creative Commons Attribution (CC BY) license (http://creativecommons.org/licenses/by/4.0/).
Copyright: This open access article is published under a Creative Commons CC BY 4.0 license, which permit the free download, distribution, and reuse, provided that the author and preprint are cited in any reuse.


