Submitted:
18 July 2025
Posted:
21 July 2025
You are already at the latest version
Abstract
One of the unresolved questions in stress-response biology remains the mechanism of coordination of expression levels in plants between the slow preparation phase and the rapid reactive response to stress exposure. In this work, we proposed a two-level analysis covering simultaneously transcriptional and translational profiles of Solanum lycopersicum under short-term cold stress, hardening and their combination. By combining polysome profiling and total transcriptome analysis, we revealed that expression under cold stress is not a linear chain but a structurally separated system with two coordinated centres of regulation. Hardening activates a robust transcriptional programme with a focus on biogenesis, light signalling and structural adaptations. In contrast, acute stress initiates selective translation of metabolic and defence proteins without prior enhancement of transcription. Modular analysis (WGCNA) showed low overlap between transcriptional and translational networks, indicating functional divergence between levels of regulation. In this work, we demonstrate that the cold response is a strategic reallocation of resources between expression levels depending on the type of signal. The work forms a bridge between basic biology and applied breeding, offering targets promising for targeted improvement of plant stress tolerance and further bioengineering of adaptive agrocultures.
Keywords:
Solanum lycopersicum
; cold stress
; translation
; transcription
; differential expression
1. Introduction
Throughout the long evolutionary process, plants have faced many different environmental challenges, one of which is the deleterious effects of low temperatures. Despite the long-term trend of increasing average temperature, plants are regularly affected by low-temperature stress, which is one of the key abiotic factors that inhibit their growth, development and geographical spreading [1]. Spring frosts are the most destructive effects caused by changing weather conditions. In this case, the preservation of metabolic activity, as well as the survival of the plant as a whole when exposed to low distribution temperatures, implies the initiation of a number of complex adaptation mechanisms that entail various kinds of biochemical, physiological and structural changes [2,3]. Generally, plant response to cold affects many aspects of plant life, forming collectively a concerted chain of reactions at molecular, cellular and organismal levels, which ultimately aims to provide plant resistance to cold stress [4].
According to the current model of low-temperature perception by plants, some of the first transformations to which they undergo as a result of cold exposure are a decrease in the fluidity of cell membranes and, as a consequence, conformational changes in membrane proteins, including receptor proteins. Excitation of cold receptors together with depolymerisation of the cytoskeleton of plant cells leads to the initiation of complex signalling cascades accompanied by the involvement of secondary messengers, namely calcium ions and reactive oxygen species (ROS), which transmit external signals inside the cell [5]. In the course of signal transduction, there is regulation of the activity of various kinases that perform both the processes of temperature signal perception and propagation and activation of cold response gene expression, including transcription factors (TFs). One of these factors is CBF (C-repeat binding factor), whose expression significantly increases in response to cold stress. CBF expression is positively regulated in the presence of ICE1 (Inducer of CBF Expression 1), in contrast to MYB15, which has the opposite effect. CBF directly binds to cis-elements in the promoters of COR (cold-regulated) genes, inducing their expression with the subsequent formation of various osmotic and antifreeze proteins responsible for the protection and subsequent stabilisation of cellular structures, preventing the formation of intracellular ice crystals, and eliminating the effects of dehydration. Due to the excessive formation of AFCs accompanying cold shock, antioxidant defence mechanisms are also triggered in plant cells to reduce oxidative stress [6,7]. In addition, lipids, as the main part of cell membrane structure, undergo changes that ensure membrane fluidity due to the action of desaturase enzymes aimed at increasing the content of unsaturated fatty acids in their composition [8]. This concept of plant reactions in response to cold stress gives only a partial idea of the adaptation mechanism of their survival under unfavourable environmental conditions.
For a complete understanding of the interaction of the processes occurring during the response of plants to low-temperature stress, it is necessary to pay special attention to the comparison of gene expression regulation systems at the transcription and translation stages. This approach is intended to expand the understanding of the mechanisms of protein synthesis adaptation and modification processes under stress conditions. Cold stress changes the nature of the transcription of many genes; some of them are inhibited, as, for example, it happens with genes responsible for energy production during photosynthesis, presumably to prevent photooxidative damage to the photosynthetic apparatus. On the contrary, another part of genes is expressed to a higher degree, as their products represent defence proteins and enzymes of the antioxidant system necessary for plant adaptation. One of the regulatory tools continuously changing during cold exposure are transcription factors, which are able to coordinate the adaptation process through the interaction of a complex regulatory network. Meanwhile, it has been reported that a substantial fraction of cold-inducible genes (approximately 25%) encode TFs [9]. To date, many different TF families are known; some of them are CBF/DREB, MYB, bHLH, WRKY, NAC, bZIP, etc., which at the molecular level are directly involved in the regulation of plant adaptation mechanisms. These transcriptional factors are able to recognise and bind to specific motifs located in the promoters of stress-responsive genes, providing a fine regulation of their expression and consequently shaping the plant response [10,11].
However, a high level of transcripts of certain genes does not guarantee a high level of the corresponding proteins, because before proceeding to translation, mRNA undergoes a number of post-transcriptional changes, such as splicing, polyadenylation and capping of pre-mRNA, which regulate its stability and translational availability. MicroRNAs (miRNAs) are considered to be among the key post-transcriptional regulators of expression, capable of leading to the degradation of mRNAs with which they are complementary. Moreover, many miRNA target genes encode transcription factors, some of which are responsible for plant reactions to cold stress. Also, during post-transcriptional changes, pre-mRNA undergoes alternative splicing (AS), which produces different mRNA variants, increasing the diversity of translated proteins [12]. At the translational level, stress conditions induce plants to selectively translate key proteins critical for survival, while the synthesis of other proteins is reduced or ceases altogether, thus optimising the energy losses of the cell. Translational regulation of pre-existing mRNAs is a rapid alternative way to control gene expression [13]. Also, one of the key aspects of the cellular response is the temporal shift in activation of transcription and translation processes. The occurrence of stress entails a rapid change in the transcript levels of various genes, but their translation may be delayed to varying degrees. This flexible mechanism of temporal coordination of transcription and translation processes allows the synthesis of the most essential proteins for survival to occur first, thereby freeing up cellular resources for higher priority targets. An approach based on the integration of transcription and translation data has the potential to expand the understanding of how plants overcome environmental challenges and ensure long-term tolerance to low temperatures.
In the work presented here, we examine the transcriptional response of model plants to a stressor paired with the translational response. Our primary objective was to compare differential expression patterns for possible identification of characteristic regulatory patterns.
2. Results
2.1. Experimental Design
Experimental conditions included control (22°C), hardening (4°C, 5 days), low-temperature stress (exposure of non-hardened plants at 0°C for 2 hours), and a combined version (exposure of hardened plants at 0°C for 2 hours). Total RNA preparations were used to obtain information on expression levels, and polysome fractions obtained by polysome profiling were used to analyse the involvement of mRNAs in the translation process.
2.2. Assessment of the Level of Plant Stress Due to Low Temperatures
After the experimental plants were exposed to the specified temperature conditions, we had to confirm their (the plants’) physiological status. For this purpose, we applied widely used tests for biochemical markers of low-temperature stress: sugars accumulation, electrolyte output and malonic dialdehyde accumulation.
2.3. Sequencing of mRNA Libraries
All mRNA libraries were sequenced in two technical repetitions on the Illumina 6000 platform. At least 30M reads per sample in each direction (PE) were obtained. The length of the reads was 150 bp. Phred quality score of the reads filtered for further analysis was 30 or more. Raw reads as well as preprocessing results (read counts received with kallisto) are deposited in GEO (GSE282483).
2.4. Analysis of Primary Sequencing Results Using Principal Component Analysis (PCA)
We applied the principal component analysis (PCA) to form a first impression of the data and to reduce the dimensionality of the data. The principal component distribution (Figure 1) shows that all experimental samples fall into two groups: samples reflecting transcriptional dynamics and transcriptional dynamics. In our opinion, the compact subclustering of transcripts from hardened plants (Hardening and Combo) separately from control and stressed plants can be explained quite simply – hardening is a time-consuming process, unlike the short-term stress exposure used in this study. That is, the model plants under conditions of low positive temperatures had time to change the expression profile at the transcriptome level, whereas plants exposed to short-term low temperatures did not have such an opportunity. In general, transcripts from total RNA (matched transcription) also formed a significantly more compact cluster than translational samples (polysome fraction). This pattern may be partly explained by the greater lability of translation in terms of regulation.
2.5. Differential Expression Analysis
Differential expression analyses were performed for all comparisons, identifying three groups of genes: Up – genes with increased expression (logFC > 1), Down – genes with decreased expression (logFC < -1), and stable – genes with stable transcription levels (-1 <= logFC <= 1). After searching for differentially expressed genes using the edgeR package, the initial results were presented as UpSet plots (Figure 2), where the height of the bars in the plot reflects the size of the intersection of the DEGs sets for the corresponding comparison variants. Despite the rather general nature of the data presented, some striking features can be identified.
For the Up group, i.e., for genes with increased expression, we can note the size of the primary DEGs sets ranging from 3000 to 4000 genes, with the Combo_vs_Hargening and Stress_vs_Control comparisons falling out of this pattern, which can be explained in the same way as the distribution of PCA data – stress (in the presented experiment) is a short-term effect (2 hours), which may not be sufficient to significantly alter the transcriptional profile. The Combo_vs_Stress, Combo_vs_Control and Hardening_vs_Control samples show a curious similarity in the composition of DEGs, both when compared pairwise and jointly. If we keep in mind that the Stress sample is not significantly different from the control sample and the Combo sample is not significantly different from the Hardening sample, it is not difficult to find an explanation for these results.
The distribution of DEGs compositions with reduced expression (Down group) almost completely qualitatively coincides with the results of the Up group, which does not require additional explanation.
Special attention should be paid to the group of genes with stable expression. In this case, the sizes of gene sets for individual comparisons reflect not differentially expressed genes but genes common to both comparisons. The Combo_vs_Stress, Combo_vs_Stress, Combo_vs_Control, Hardening_vs_Control, and Hardening_vs_Control samples demonstrate a certain similarity in the composition of DEGs (623 genes).
However, simply comparing samples of DEGs is not the most informative approach, primarily due to the different sizes of these samples. To offset the impact of differences in the size of DEGs sets, we calculated Jaccard coefficients and presented them as heat maps (Figure 3) for a more relevant comparison of differential expression analysis data. With this representation, groups with common gene subsets remain the same as when considering the primary data while gaining quantitative characterisation.
2.6. Differential Translation Analysis
While transcriptomic data (reflecting the expression profile at the transcriptional stage) are suitable for direct comparison, polysome sequencing results (indirectly reflecting translation intensity) cannot be compared directly with each other. This is primarily due to the direct influence of transcript start amounts on the number of ribosome-bound transcripts. Based on a previously proposed methodology [14,15], we applied normalisation to the starting transcript quantities for comparisons between samples, which requires analysis of total transcriptomes. Also, because transcript length directly affects the number of bound ribosomes (although this relationship may be indirect and rather unobvious), it makes sense to normalise differential expression data to transcript length for within-sample comparisons, but this is not necessary for between-sample comparisons.
Translational efficiency – the ratio of the number of RFPs (of a given gene/data isoform) to the total number of reads mapped to the coding region of a given gene/data isoform.
Change in translational efficacy – the ratio (or difference in the case of logarithmic values) of the translational efficacy values for the two samples being compared [16].
Translational ratio – the ratio of the number of transcripts translated (of a given gene/data isoform) to the total number of transcripts (of a given gene/data isoform) [17].
Changes in translational ratio – the ratio (or difference in the case of logarithmic values) of the translational ratio values for the two samples being compared.
Thus, to study the dynamics of translation between samples, we calculated the translational rate for each experimental sample as
And already then the samples were compared with each other according to this parameter
We also analysed differential translation for all comparison variants, identifying three groups of genes: Up – genes with increased translation level, Down – genes with decreased translation and genes with stable translation level. When examining the resulting UpSet plots (Figure 4), it can be concluded that in contrast to the differential expression data, where the Stress and Control samples had minor differences, the differential translation data show significantly larger differences, which can be explained by a higher rate of translation regulation as opposed to transcription.
For both Up and Down, the largest sizes of primary DTGs sets can be observed in the Stress_vs_Hardening comparison group (2812 and 4033, respectively). At the same time, if we take into account that the Combo sample, in contrast to Stress, has insignificant differences with the Hardening and Control samples, it can be concluded that the hardening method contributes significantly to plant resistance to low temperatures.
It is noteworthy that for the Stable group there is a set of 235 genes whose stable expression level is maintained for all experimental conditions, which is consistent with the Jaccard coefficients for the corresponding group (Figure 5), where the degree of similarity in pairwise comparisons ranges from 12% to 28%. It can be assumed that this gene pool is responsible for the functioning of basic aspects of plant cell viability and retains its translational activity regardless of stress or hardening conditions. However, analyses of gene ontologies did not reveal notable features of GO term enrichment.
2.7. Term Enrichment Analysis of Gene Ontologies
The next stage of the presented study was the functional characterisation of the investigated set of differentially expressed (for the transcription stage) and differentially translated genes (for translation, respectively).
KEGG
Up: pathways associated with ribosomal activity and regulation of protein synthesis (KEGG:03010, 03050, 03008) are predominant in the transcription step, particularly pronounced in Stress_T_vs_Hardening_T, Combo_T_vs_Control_T and Hardening_T_vs_Control_T comparisons. This reflects the activation of genetic programmes that prepare the cell for stress. In contrast, the translation step is dominated by metabolic pathways (KEGG:01100, 01110) related to energy metabolism, biosynthesis of secondary metabolites and carbohydrate metabolism. This is particularly expressed under Combo_vs_Stress, Combo_vs_Control and Hardening_vs_Control conditions. A comparison of expression levels within the experimental groups showed that under stress conditions transcription and translation are regulated independently: active transcription of ribosomal components is combined with metabolic compensation at the level of translation. In hardened plants, a stable combination of regulatory activity at the level of transcription and metabolic rearrangement in translation was observed. Under combined conditions (Combo), transcriptional responses are attenuated, whereas translation remains active, which may indicate the formation of stress memory and a switch of regulation to the posttranscriptional level. Thus, transcription reflects the preparatory phase of the response, while translation provides rapid metabolic adaptation. This emphasises the importance of integrated analysis of both expression levels for understanding the mechanisms of plant cold tolerance.
Stable: the KEGG:03010 ribosome-compared Stress_T_vs_Hardening_T, Combo_T_vs_Control_T, Combo_T_vs_Stress_T, and Hardening_T_vs_Control_T pathway is the most stable in transcription. This reflects the stable activity of the protein synthesis system. The KEGG:01200, 01230, 01100, and 01110 pathways associated with basic metabolism and degradation of substances are also repeated. At the level of translation, stability of metabolic processes prevails. KEGG:01230 is regularly active in several comparisons (Hardening_vs_Control, Combo_vs_Hardening, Stress_vs_Control), indicating maintenance of catabolic activity. Separate stable signals are observed at KEGG:03015, 00250, and 00330 (ribosome assembly, amino acid metabolism), whereas the ribosomal pathway (KEGG:03010) is conserved only in Combo_vs_Control and Combo_vs_Stress. Comparison of levels shows that transcription ensures stable expression of components of the protein machinery, while translation ensures stability of metabolic processes. The highest concordance is observed in the Combo group, which may reflect the physiological stability formed after hardening. Thus, stable genes represent a functional core that maintains basic cellular processes independent of external conditions.
Down: analysis of genes with reduced expression revealed that pathways related to general metabolism (KEGG:01100) and biosynthesis of secondary metabolites (KEGG:01110) are most pronouncedly repressed. These changes are particularly characteristic at the level of translation, where in most comparisons – including Stress_vs_Hardening, Combo_vs_Hardening and Stress_vs_Control – the number of annotated genes in these pathways exceeds 70. Simultaneously, a number of transcriptional comparisons such as Hardening_T_vs_Control_T, Combo_T_vs_Control_T and Combo_T_vs_Stress_T also show decreased activity of these same metabolic cascades as well as associated carbohydrate and amino acid metabolism pathways (00520, 00195, 00630, 00710, etc.). At the level of transcription, suppression of ribosomal and regulatory pathways – KEGG:03010, 03050, 03008 – was prominent, especially in the Stress_T_vs_Hardening_T comparison, which may reflect inhibition of synthesis of components of the translational machinery under conditions of transient or repeated stress. However, ribosomal pathways were suppressed less frequently and less significantly during the translation step, indicating that the main protein synthesising activity was retained even with a general decrease in metabolism. Thus, the reduced expression encompasses both key metabolic processes and individual elements of the translation system. This indicates the transition of cells into the energy-saving mode, in which transcription of most metabolic genes is reduced and translation becomes selective. The most pronounced and complex changes are noted in comparisons involving stressors after hardening, emphasising the significance of the sequence of exposure and the presence of adaptive metabolic rearrangement.
GO:MF
Functional annotation of genes by GO:MF category revealed systematic differences in molecular functions depending on the direction of expression change. The genes with increased expression are characterised by the predominance of functions providing translational response, regulation of protein metabolism and energy-dependent interactions. In particular, activities related to translation factors (GO:0008135), rRNA binding (GO:0019843), translation initiators (GO:0003743), and GTP- and ATP-binding proteins are enriched. These patterns are particularly represented when comparing stressed and hardened plants, reflecting enhanced translational activity and mobilisation of the protein synthesising apparatus as a key adaptive strategy. The group with unchanged expression exhibits predominantly general molecular functions lacking strict context specificity. Prominent among these are functions of binding and non-specific catalytic activity, including binding profiles and general-purpose enzymatic activities that show neither stress nor metabolic orientation. This spectrum of function appears to correspond to a basic molecular pool that is not subject to dynamic regulation in response to changes in conditions. Genes with reduced expression are predominantly associated with metabolic and signalling functions requiring coenzyme support and ion transport. Enriched activities include metal and ion binding (including calmodulin-dependent), functions related to biotin and iron-sulfur clusters, and redox enzyme activities. In particular, suppression of the activities of NAD(P)H-dependent reductases, flavin-binding enzymes and carboxylases may indicate systemic inhibition of certain energy and anabolic fluxes under stress conditions. Such functional shifts are particularly noticeable when comparing stressed plants with controls and indicate a prioritised shutdown of part of the metabolic and transduction cascades. Thus, the spectrum of molecular functions strictly correlates with the directionality of the transcriptional response: stress is associated with activation of protein synthesising and translational-regulatory functions, hardening is associated with rearrangement of enzymatic and coenzyme-dependent pathways, and stable functions remain the background of constant activity.
GO:CC
The functional distribution of transcripts and translationally active mRNAs across cellular components (GO:CC) revealed distinct differences in the spatial organisation of the genetic response to cold stress, hardening and their combination. At the transcriptional level, genes with reduced expression were predominantly localised in chloroplast and photosynthetic structures, including photosystems I and II, thylakoid membranes and the plastid envelope, reflecting systemic suppression of light-dependent processes under stress and, in part, in hardered and combined variants. At the same time, suppression of mitochondrial and ribosomal components was observed, especially in the Stress_T_vs_Hardening_T comparison, where structures related to protein transport (vesicles, EPR and Golgi complex compartments) are also involved. This indicates a broader impact of stress on the energy and protein synthetic infrastructure of cells. In contrast, genes with increased transcriptional activity showed enrichment in terms related to ribosomes, proteasomes, peptidase complexes and structures involved in protein degradation and translation regulation (e.g., preribosome, small-subunit processome). This is particularly pronounced in the Combo_T_vs_Control_T and Hardening_T_vs_Control_T comparisons. Variants involving stress (Stress_T_vs_Hardening_T) also activated chloroplast photosystems, indicating a possible recovery of photosynthetic function under some conditions. At the level of translation, trends were generally maintained but were more selective. Increased expression was predominantly associated with ribosomal subunits and proteasome complexes in the Stress_vs_Hardening, Combo_vs_Hardening, and Hardening_vs_Control comparisons, emphasising the activation of rapid protein regulation and degradation systems under conditions of recovery and adaptation. Variants showing increased expression of genes encoding chloroplast components (Combo_vs_Stress, Hardening_vs_Control) indicated the possibility of reactivation of photosynthetic processes under certain pretreatment. In turn, the reduced translational activity was concentrated in chloroplast-related structures including photosystems, thylakoids and plastid membranes, especially in the Stress_vs_Control and Combo_vs_Stress comparisons. This further emphasises the repressive role of cold on photosynthetic activity. Interestingly, genes with unchanged expression at both transcriptional and translational levels were consistently associated with ribosomes and transport vesicles (e.g., ER-to-Golgi vesicles) as well as spliceosomal complexes. This may indicate that a baseline level of transcriptional and translational activity is maintained to ensure cellular homeostasis even under stress. Thus, GO analysis by cell component revealed a multilevel rearrangement of intracellular architecture in response to stress and adaptive interventions.
GO: BP
Under conditions of stress and hardening, decreased expression of genes related to carbohydrate transport (GO:0008643) and pigment metabolism (GO:0042440, GO:0046148) was observed. This may indicate a redistribution of resources under stress conditions aimed at maintaining vital functions. Increased expression of genes involved in the localisation of proteins to organelles (GO:0033365, GO:0072599) indicates activation of processes that ensure proper functioning of cellular structures in response to stress effects. Decreased expression of genes related to amino acid catabolism (GO:0009063) and photosynthetic processes (GO:0009767) may reflect adaptation of metabolic pathways to altered environmental conditions. This allows the plant to efficiently utilise available resources and maintain energy balance. Genes with unchanged expression associated with key metabolic processes, such as amino acid synthesis and photosynthesis regulation, show resistance to stress. This emphasises the importance of maintaining basic cellular functions for plant survival. Thus, a comprehensive analysis of differential gene expression at the transcriptional and translational level under various stresses and hardening has revealed key biological processes involved in plant adaptation. The obtained data may serve as a basis for further studies of molecular mechanisms of plant resistance to unfavourable environmental factors.
WGCNA
To conclude the study, we analysed weighted gene co-expression networks (WGCNA). Following the scheme presented above, data corresponding to transcription and translation were analysed separately.
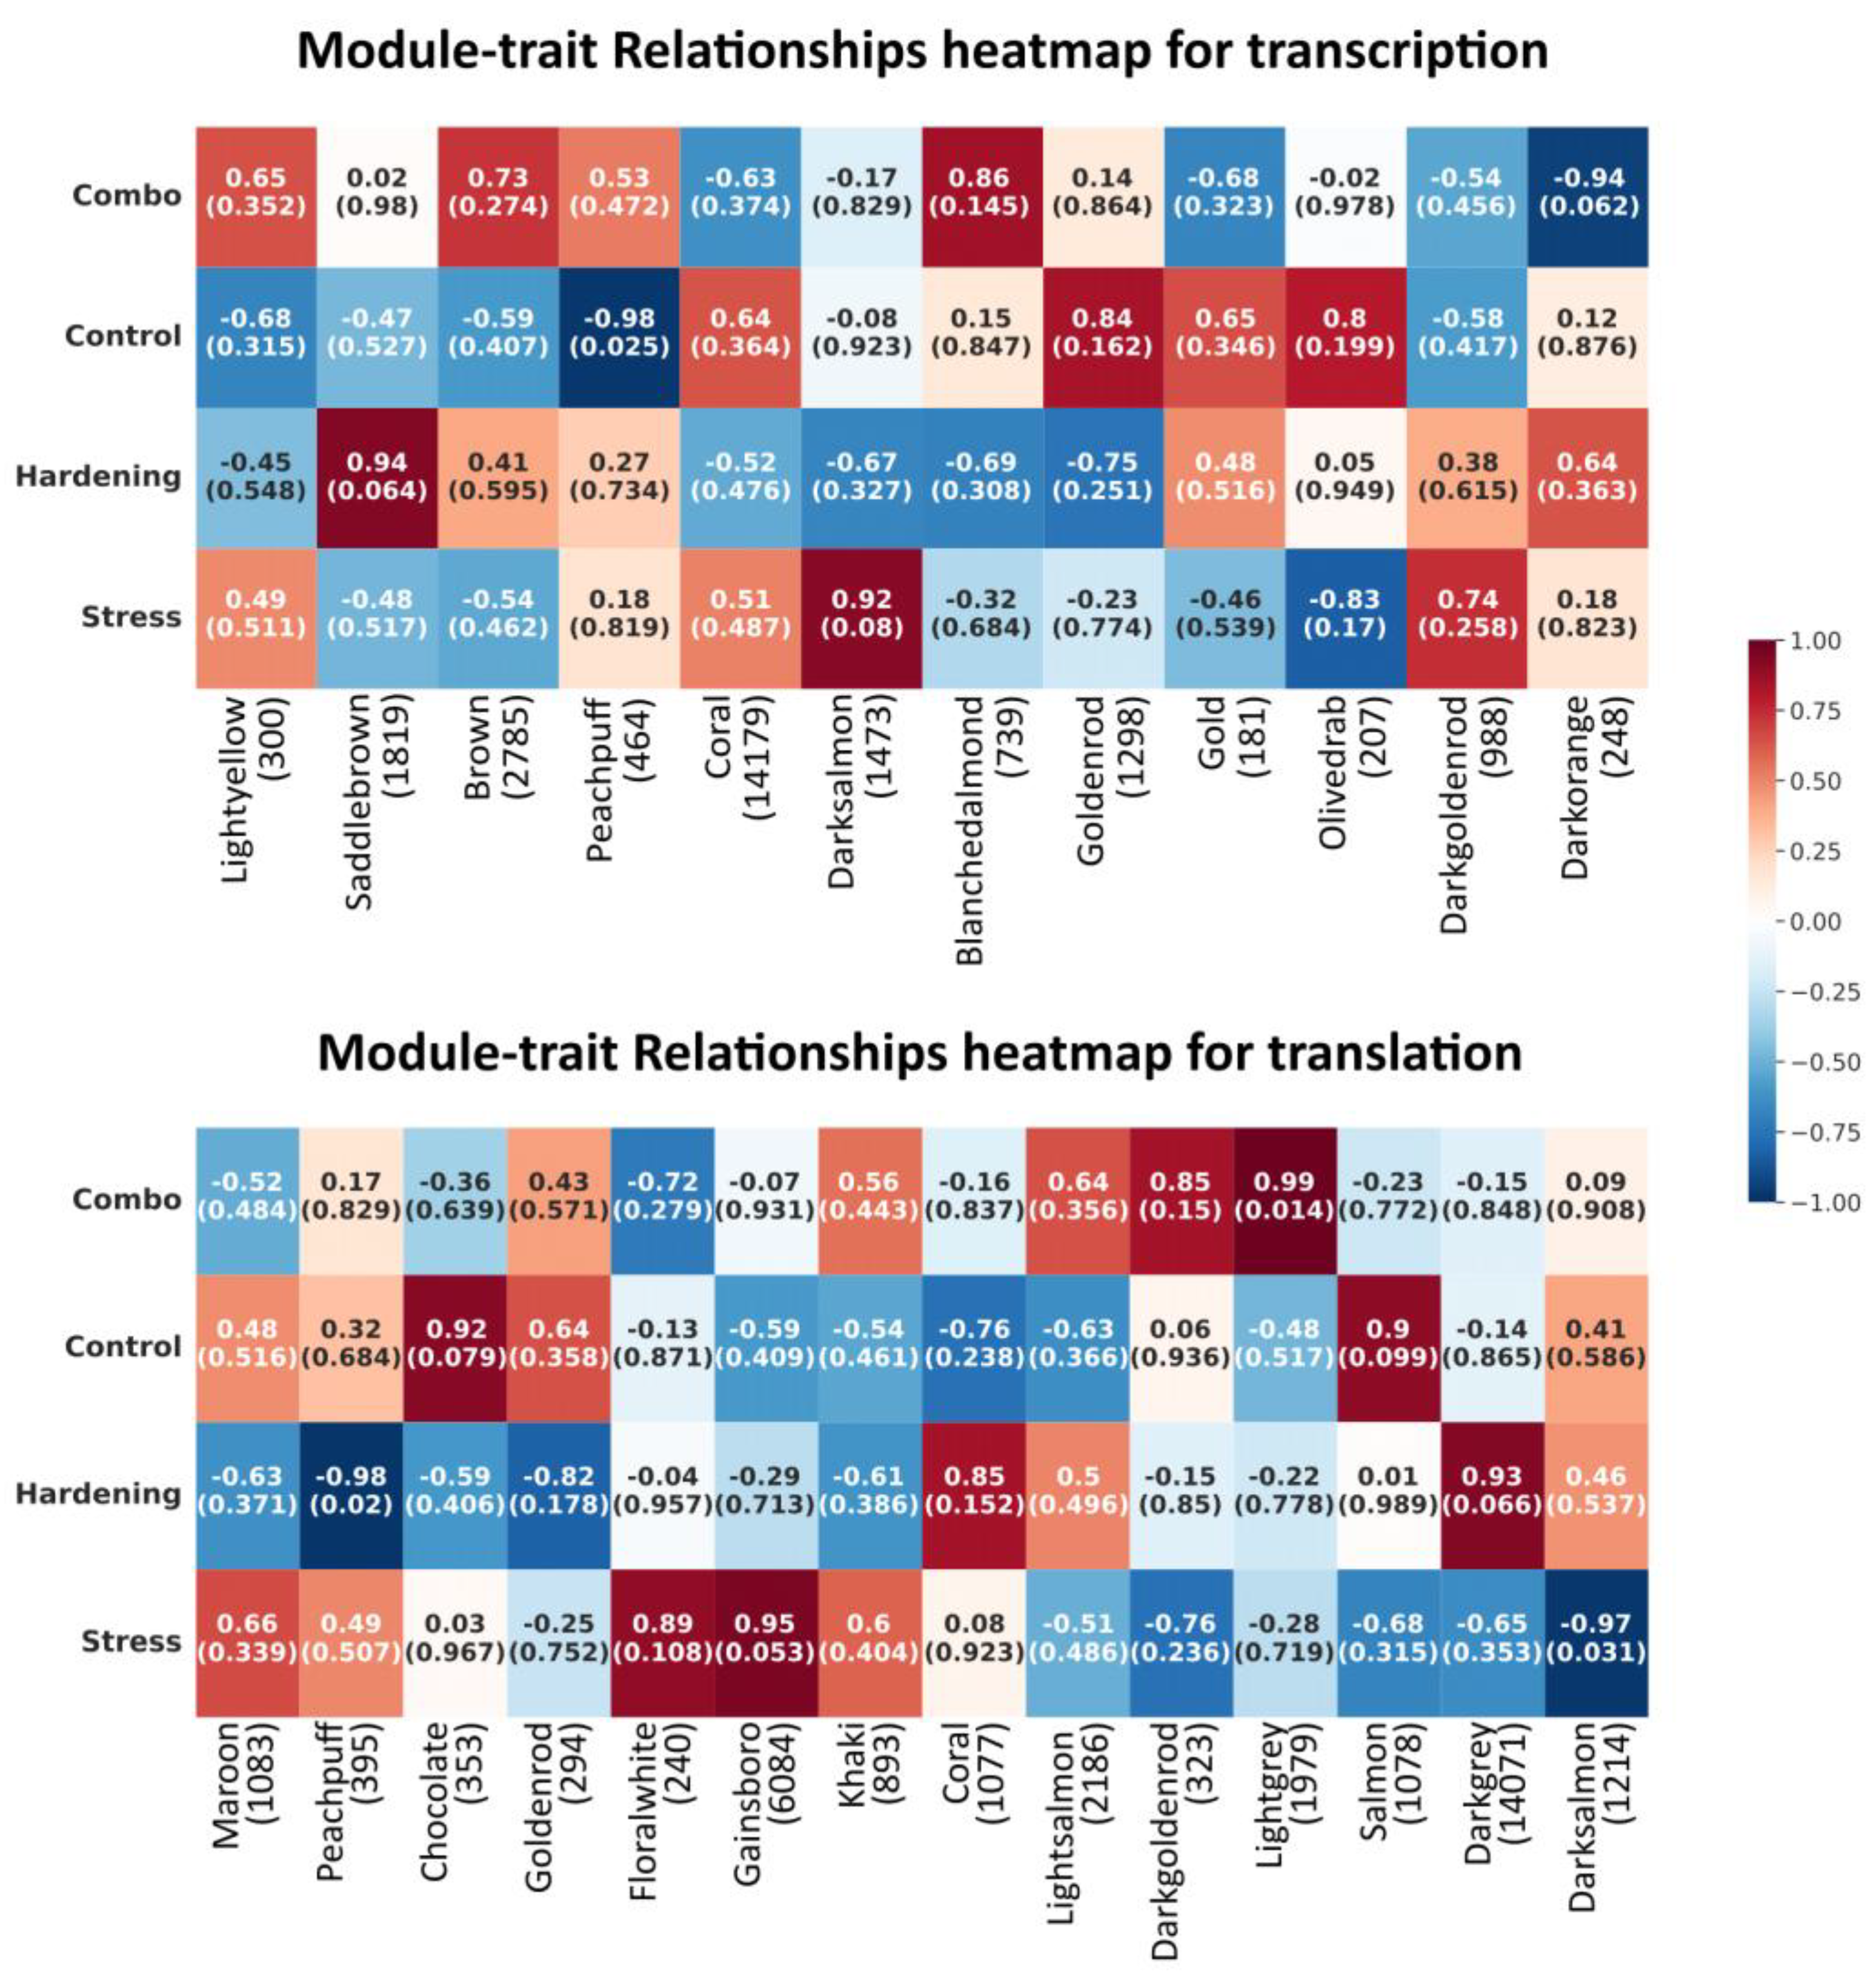
For transcriptional data, 12 modules (groups of genes whose expression shows correlation) were obtained; for data obtained for the translation step, 15 modules were obtained. For each of the steps (transcription and translation), the correlation between module and experimental conditions was examined (summarised data are presented as heat maps in Appendix A). As can be seen for each condition, distinct co-expression modules were identified, differing both in the degree of correlation and in the power of these modules. It is worth noting, however, that in the vast majority of cases the p-value is quite large (values indicated in brackets in the heat maps). Therefore, even if the observed regularities do occur, they cannot be considered statistically reliable, and additional experiments may be required to confirm them. Nevertheless, a certain number of comparisons are successful on p-value. For these modules, we performed additional functional enrichment analyses, which showed the following.
For the transcriptional samples, the correlation between the control conditions and the peachpuff module can be considered statistically significant. The correlation coefficient in this case is -0.98 (p-value = 0.025), indicating a general decrease in gene expression of this module in control conditions (for other processing conditions, the data are not statistically significant but show a weak positive correlation within 0.2–0.5). This module includes 464 genes. Functionally, these genes are annotated with high-level terms such as cellular component organisation or biogenesis, plastid organisation, cellular component organisation, thylakoid membrane organisation, response to light stimulus, plastid membrane organisation, mitotic cell size control checkpoint signalling, etc. For enrichment with GO:BP terms, in case of KEGG, these are Ribosome, Ribosome biogenesis in eukaryotes, and TCA cycle Krebs cycle (Appendix A).
For the translational samples, 3 modules with p-value < 0.05 were identified: peachpuff (395 genes), correlation coefficient -0.98 (p-value = 0.02); lightgrey (1979 genes), correlation coefficient -0.99 (p-value = 0.014); and darksalmon (1214 genes), correlation coefficient -0.97 (p-value = 0.031).
Modules were associated with the following experimental conditions: peachpuff – hardening, lightgrey – a combination of hardening and stress, and darksalmon – stress.
Functional enrichment analysis of the genes of the peachpuff module (for translation) shows the predominance of high-level terms such as translation, macromolecule biosynthetic process, gene expression, biosynthetic process, protein metabolic process, macromolecule metabolic process, negative regulation of gene expression via chromosomal CpG island methylation, protein targeting to ER, etc. For enrichment with GO:BP terms, in the case of KEGG and WP, they are Ribosome, Ribosome biogenesis in eukaryotes, and TCA cycle Krebs cycle. These processes are suppressed in hardered plants.
For the light grey module, closely positively correlated with combined effects, genes are annotated with the following terms: positive regulation of ubiquitin protein ligase activity, positive regulation of post-translational protein modification, positive regulation of protein modification by small protein conjugation or removal, positive regulation of transferase activity, regulation of post-translational protein modification, regulation of protein modification by small protein conjugation or removal, positive regulation of protein metabolic process, transcription preinitiation complex assembly, lipid X metabolic process. For enrichment of KEGG terms: Lipoic acid metabolism, ubiquitin-mediated proteolysis, amino sugar and nucleotide sugar metabolism.
For the darksalmon module, whose constituent genes are repressed in plants under stress, enrichment is observed for the following terms: transport, acetyl-CoA metabolic process, cellular process, regulation of transport, cellular localisation, regulation of monoatomic ion transmembrane transport, organophosphate biosynthetic process, organophosphate metabolic process, purine-containing compound metabolic process, membrane lipid metabolic process, acyl-CoA metabolic process, purine-containing compound biosynthetic process, nitrogen compound transport, protein transport, lipid metabolic process, regulation of transmembrane transport, positive regulation of translational elongation, positive regulation of translational termination, amide biosynthetic process, lipid biosynthetic process, carboxylic acid metabolic process, regulation of translational elongation, organic acid biosynthetic process. KEGG term enrichment: Biosynthesis of unsaturated fatty acids and Valine, leucine and isoleucine biosynthesis.
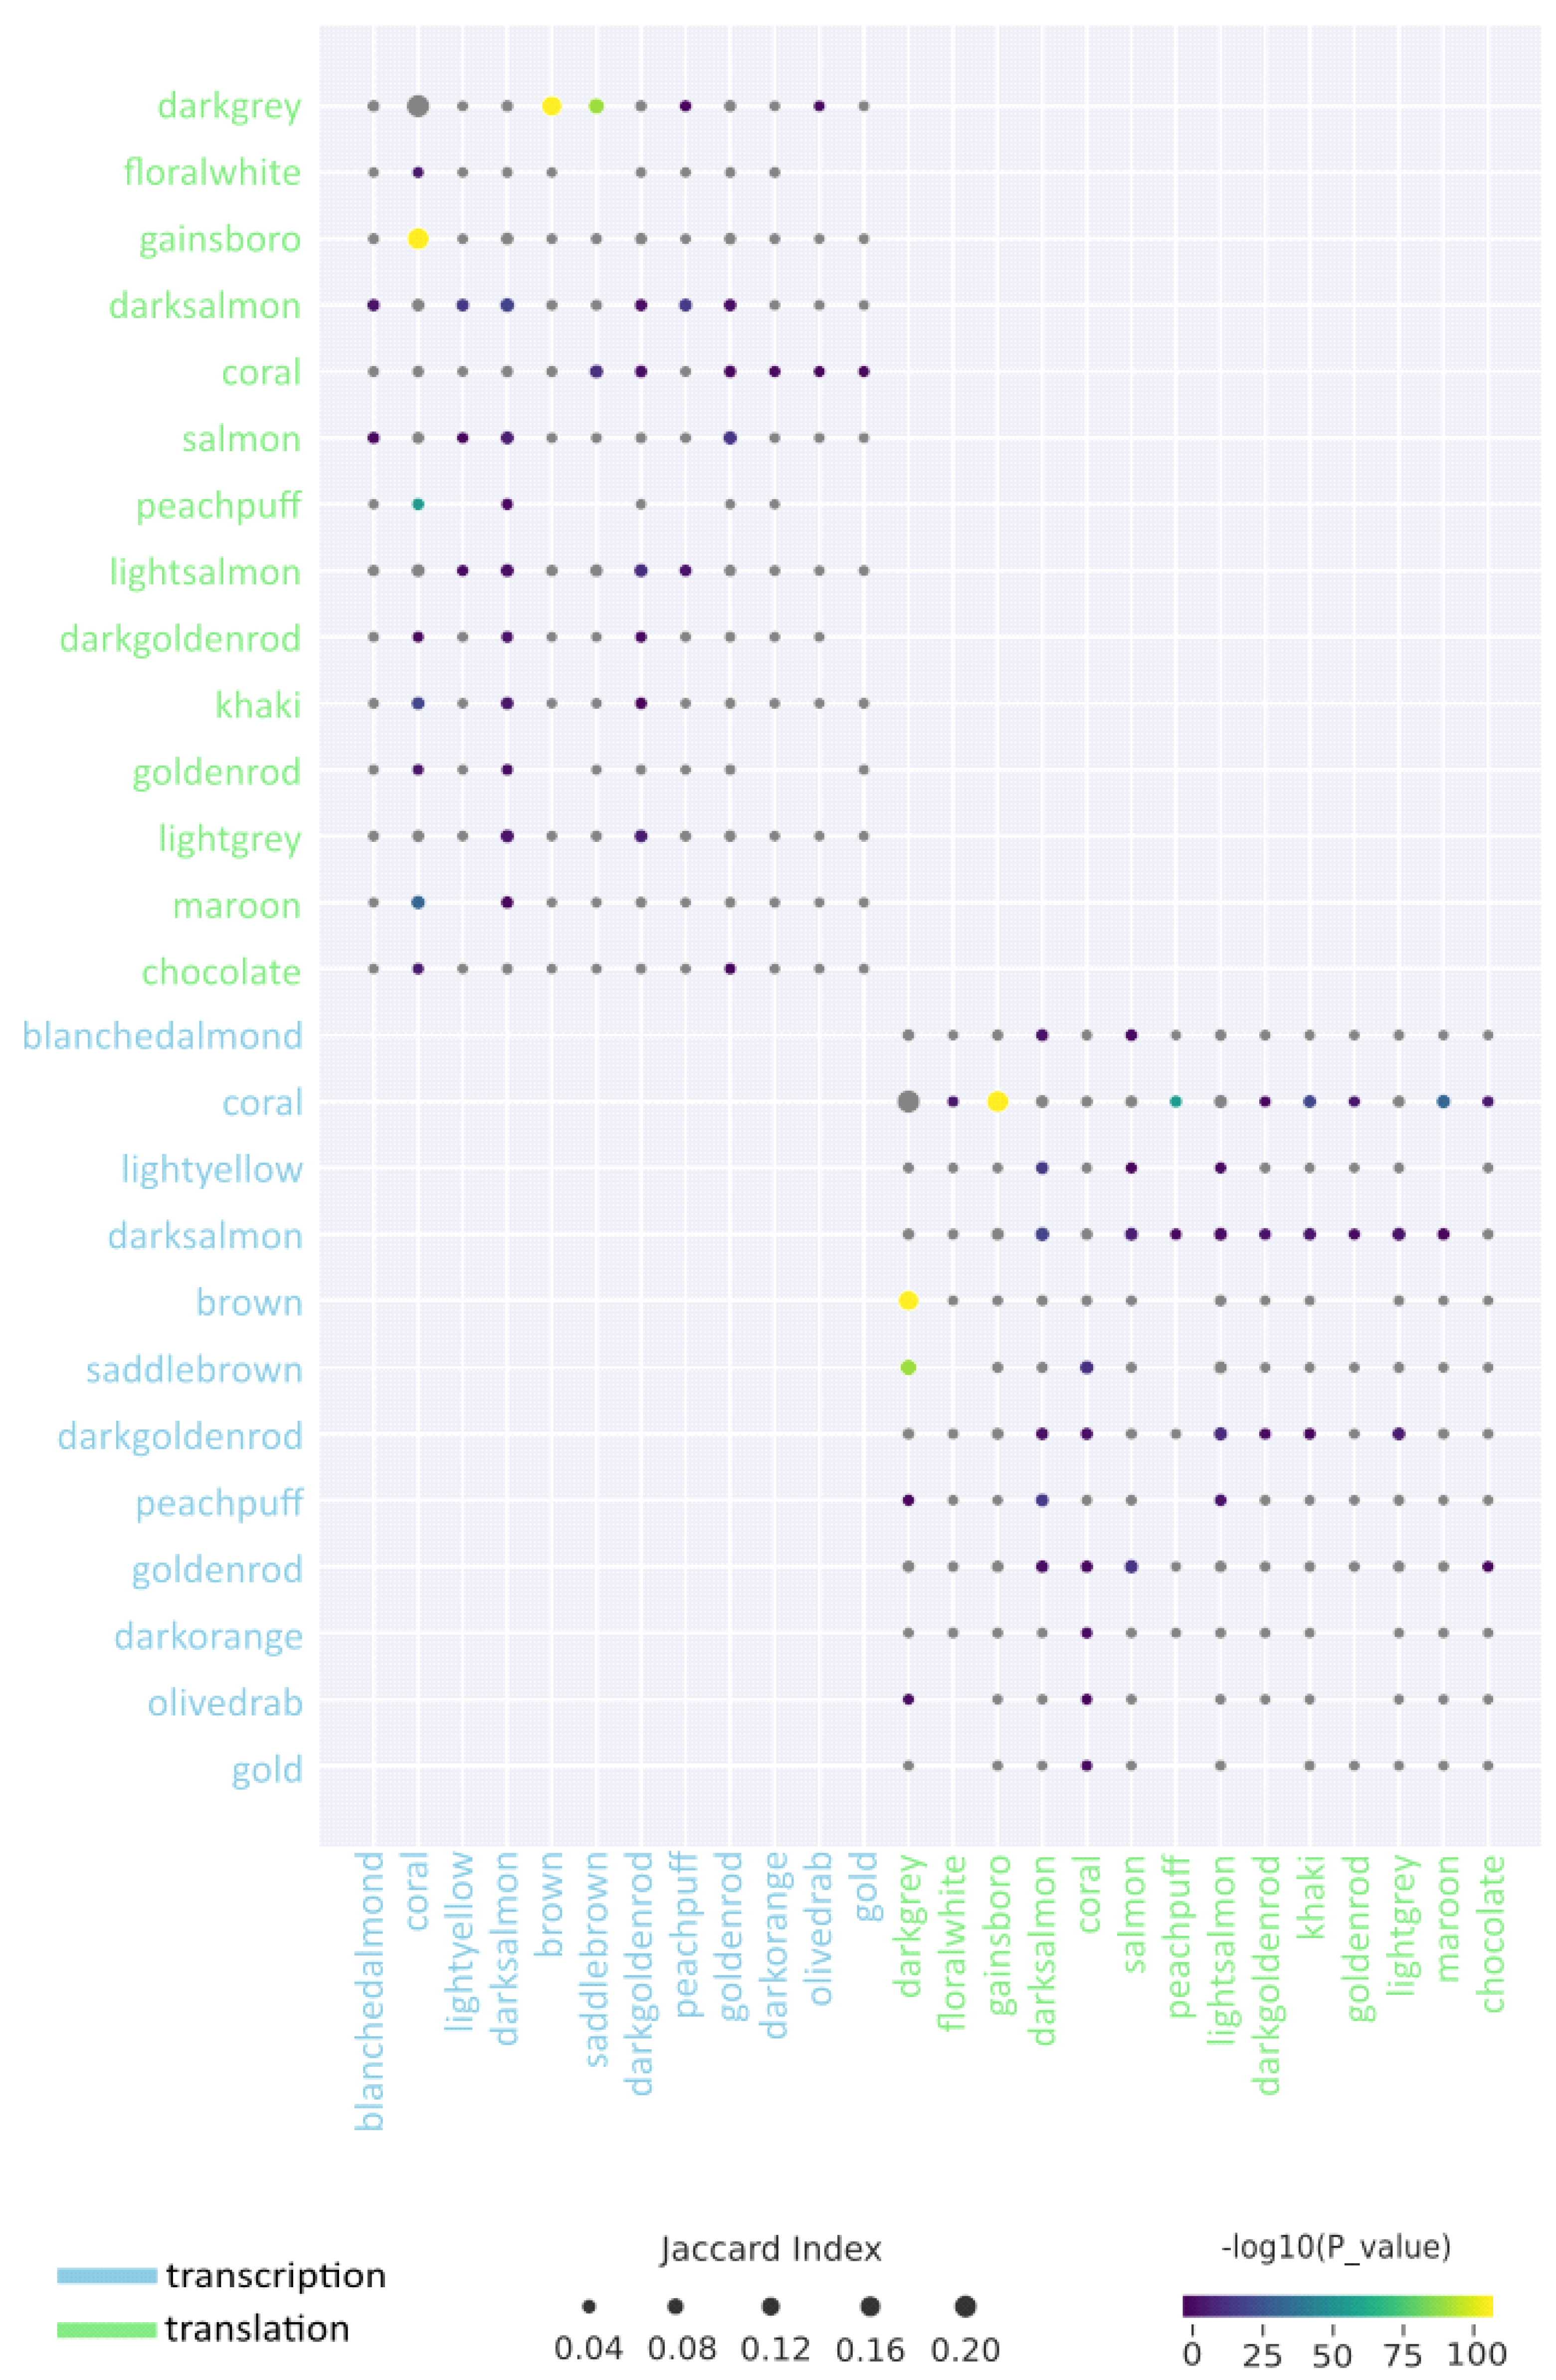
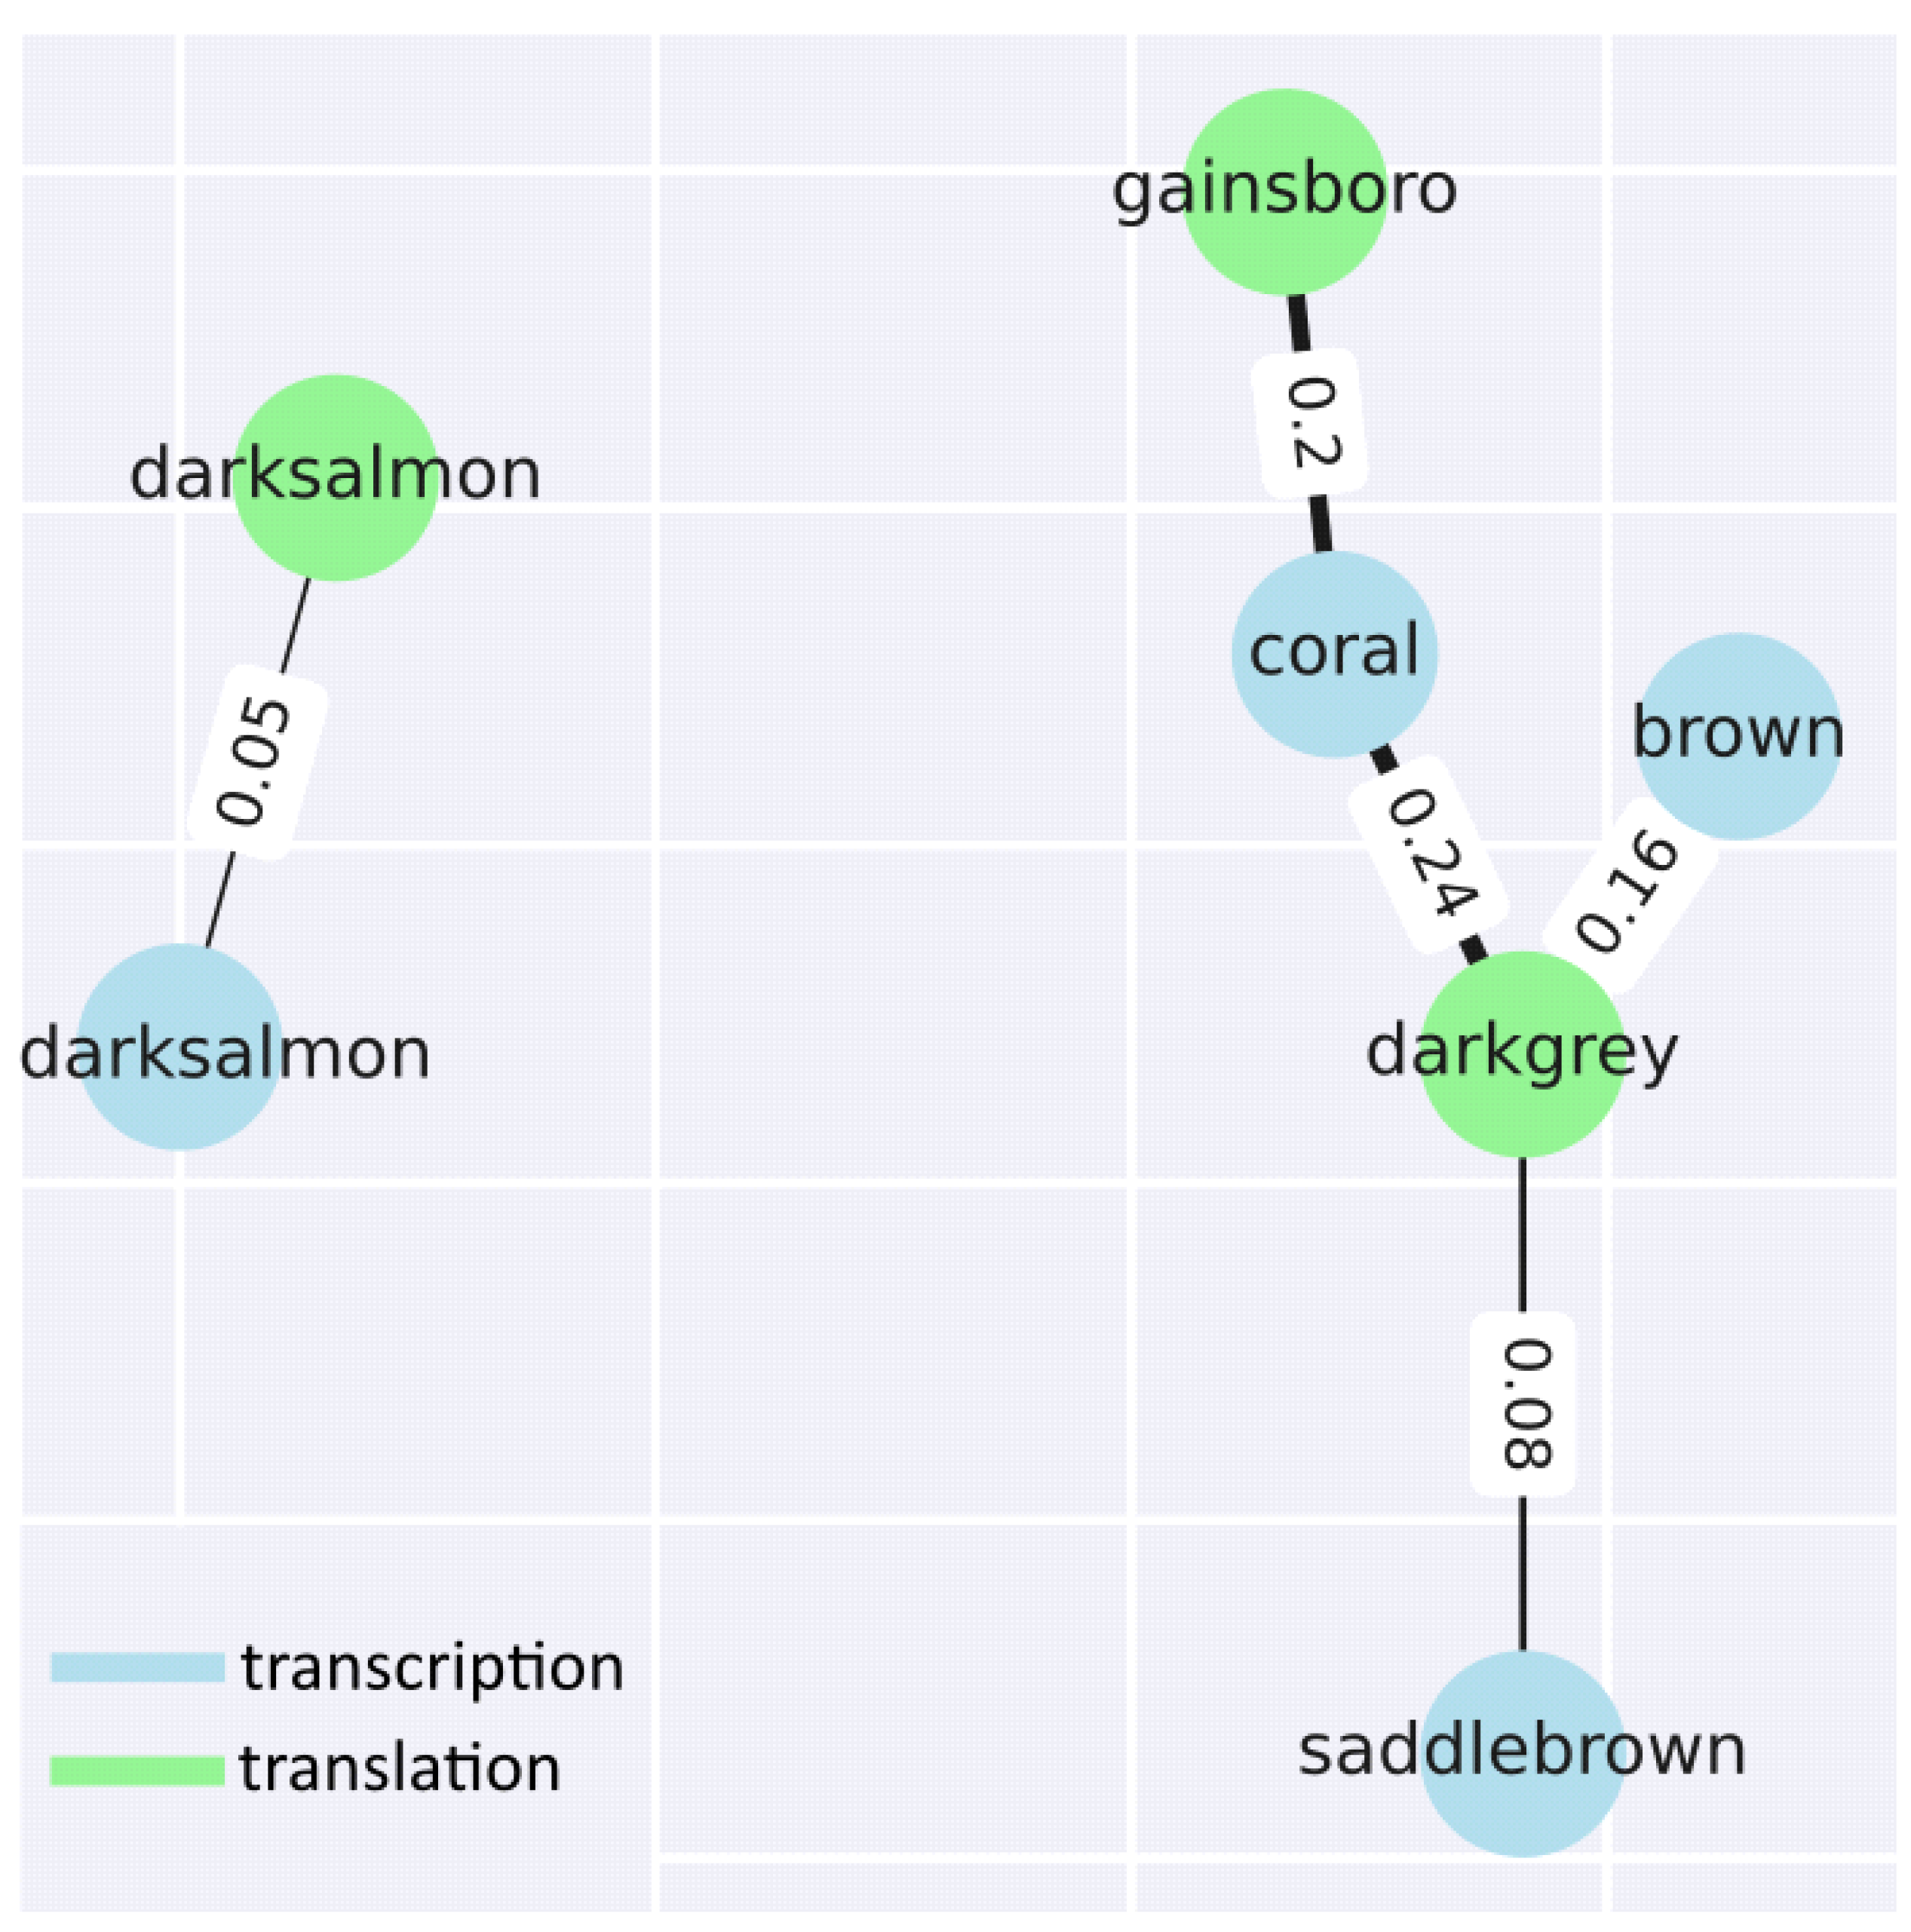
In addition to identifying and analysing the modules within each step, two groups of modules corresponding to each step were compared. As expected, based on the data described above, only 2 groups of modules show similarities (as expressed using the Jaccard coefficient) greater than 5%. If we look in more detail, the darksalmon modules for transcription and translation show insignificant similarity at the level of 5% (recall that the names do not indicate similarity, commonality, etc., and are chosen by the programme used for the analysis). The translational modules gainsboro and darkgrey and the transcriptional modules coral, brown and saddlebrown are more related. Excluding statistically insignificant comparisons, the following 3 comparisons were identified: gainsboro (translation) vs. coral (transcription); darkgrey (translation) vs. brown (transcription); and darkgrey (translation) vs. saddlebrown (transcription) (Figure 6, Appendix B).
Next, functional enrichment analysis was performed for common genes of similar modules. The comparison of gainsboro vs. coral demonstrates the predominance of such terms as MAPK cascade, acyl-CoA metabolic process, membrane fusion, negative regulation of abscisic acid-activated signalling pathway, heat acclimation, regulation of intracellular signal transduction, proteasome-mediated ubiquitin-dependent protein catabolic process, energy derivation by oxidation of organic compounds, positive regulation of signalling, proteasomal protein catabolic process, translational initiation, and carbohydrate derivative catabolic process.
The leading terms for darkgrey vs. brown are oxylipin biosynthetic process, glucan catabolic process, photosynthesis, light harvesting, nitrate metabolic process, polysaccharide catabolic process, galacturonan metabolic process, and response to light intensity. For the last comparison, steroid metabolic process, carboxylic acid catabolic process, cellular response to toxic substances, cellular oxidant detoxification, response to jasmonic acid, and response to fatty acids were identified.
3. Discussion
The analysis of transcriptomic and translational data allowed us to comprehensively characterise the response of tomato plants to low-temperature exposure and to identify key differences in the regulation of gene expression at the transcription and translation stages. The results obtained confirm that these two levels are activated by the plant at different times and with different functional orientation, forming a coordinated but hierarchically separated strategy of adaptation to stress.
At the transcriptional stage, cold stress caused significant changes in the expression of a large number of genes. This was especially characteristic under conditions of hardening and combined exposure, where genes related to ribosome biogenesis, transcription regulation, signalling pathways and primary metabolism were activated. However, short-term exposure to cold stress caused less pronounced transcriptional changes, probably due to insufficient exposure duration for complete rearrangement of the transcriptome. These differences are consistent with the results of PCA and differential expression analysis, where hardened plants form distinct clusters, while short-term stressed plants remain closer to the control. However, a different pattern was observed at the translation stage, with many genes showing significant changes in their translational activity, especially under stress conditions. Functional analysis (KEGG and GO) confirmed differences in the pathways involved and molecular functions at the two levels of regulation. Transcriptionally active genes were more often related to ribosomal components, transcription regulators and signalling molecules. In contrast, genes related to metabolism, biosynthesis of secondary metabolites and catabolic processes predominated at the translation stage. This may reflect a redistribution of resources within the cell (transcription prepares the cell for stress, having the greatest impact during hardening, whereas translation is activated under extremely stressful conditions, providing a rapid metabolic response). Functional category analysis by cell component (GO:CC) allowed us to clarify the spatial organisation of the molecular response of plants to cold stress. The decrease in the transcriptional activity of genes associated with chloroplasts and elements of the photosynthetic apparatus reflects the general suppression of light-dependent processes under conditions of reduced temperature. In contrast, increased activity was demonstrated by genes localised in ribosomes, proteasomes and other protein complexes involved in protein synthesis and utilisation, both at the transcriptional and translational levels. This indicates activation of the cellular protein control system, which allows timely removal of damaged proteins and their replacement with new ones functionally relevant for adaptation to stress. Integral modular co-expression analysis (WGCNA) demonstrated that transcriptional and translational co-expression networks form separate but partially overlapping modules reflecting specific cell states. The most significant modules were found to be those associated with the states of stress, hardening, and their combinations. In particular, genes responsible for ribosome biogenesis and basic synthetic processes were suppressed in hardened plants, which may indicate a decrease in total energy expenditure and the formation of metabolic resistance. In contrast, under acute stress, modules involved in transport, lipid metabolism, transmembrane transport and translation regulation are activated. This emphasises the switch of regulation to the post-transcriptional level characteristic of the rapid response. WGCNA analysis not only allows us to decompose the overall expression space into functional units but also to identify potential points of regulatory integration between transcription and translation levels. The resulting modules are of interest as candidates for functional validation as well as possible downstream bioengineering of cultivated plants.
4. Materials and Methods
4.1. Cultivation of Experimental Plants
Tomato plants (Solanum lycopersicum L., selection line YALF) were grown under controlled conditions in a climate chamber (25±1°C, 16-h photoperiod, 100 μmol quanta/(m2s)). 28-day-old plants with 5-7 true leaves were used for experiments.
4.2. Creation of Low-Temperature Stress Conditions
Hardening and damaging (stress) conditions were created for induction of adaptive mechanisms and subsequent comprehensive evaluation of tomato plant resistance to low temperatures. Hardening was carried out in a climatic chamber LIC-240 (“Binder”, Germany) at +4 ºС, 16-hour photoperiod and illumination 200 µmol/(m2s) for 5 days. Damaging (stress) conditions were achieved by chilling plants at 0 °C for 2 hours. The parameters of exposure regimes were selected in preliminary experiments.
The degree of stress load on plants as a result of low temperatures was assessed by two complementary parameters: relative electrolyte leakage (in %) from leaf tissue to the water phase, an indicator reflecting membrane integrity, and accumulation of malonic dialdehyde, a key marker of lipid peroxidation.
Electrolyte leakage (in %) was calculated using the formula: 100 × (conductivity of the tested sample before or after freezing / conductivity of the same sample after boiling). Electrical conductivity of aqueous extracts was determined using an SG7-ELK conductometer (“Mettler Toledo”, Switzerland).
The content of malonic dialdehyde (MDA) was determined by reaction with thiobarbituric acid. A suspension of leaves (300 mg) was homogenised in 5 ml of extraction medium (0.1 M Tris-HCl buffer, pH 7.6, containing 0.35M NaCI). To 3 ml of homogenate, 2 ml of 0.5% thiobarbituric acid in 20% trichloroacetic acid was added, incubated at 95 ºC for 30 min, cooled, filtered and optical density recorded at 532 nm wavelength.
4.3. Determination of Sugars Content
Tomato leaf samples (~500 mg) were fixed in boiling 96% ethanol. The tissue was then ground in a porcelain mortar and sugars were extracted by triple washing with 80% ethanol.
Glucose content was determined using a glucose oxidase reaction-based kit (GAGO-1KT, Sigma-Aldrich).
For quantitative analysis of fructose and sucrose, the method with resorcinol reaction was used.
4.4. Preparation of mRNA Libraries
For subsequent mRNA analysis, plant material was separated into two fractions:
- total RNA;
- polysome-associated RNA.
4.5. Total RNA Isolation
Total RNA was isolated by phenol-chloroform extraction using ExtractRNA reagent (Evrogen, cat. no. BC032) according to the manufacturer’s instructions. The obtained samples were additionally treated with DNAase I (Thermo Scientific, cat. no. EN0521). RNA concentration and purity were assessed spectrophotometrically using a Synergy H1 microplate reader (BioTek, USA). RNA integrity was checked by electrophoresis in 1% agarose gel.
4.6. Polysome Profiling
Profiling was performed according to the method described by Lecampion et al. [18], including the following steps:
- preparation of a sucrose gradient of four layers (50%, 35% and two layers of 20% each);
- salt buffer: 400 mM Tris-HCl (pH 8.4), 200 mM KCl, 100 mM MgCl₂;
- polysome buffer: 4x saline buffer supplemented with 5.26 mM EGTA, 0.5% Triton X-100, 50 μg/ml cycloheximide and 50 μg/ml chloramphenicol;
- ultracentrifugation at 175,000 g for 2 h 45 min at 4 °C;
- precipitation of polysome fractions with isopropanol.
4.7. Sequencing of mRNA Libraries
Sequencing was performed in two technical repeats for each sample, totalling 24 libraries. Preparation of cDNA libraries and sequencing itself was performed by Evrogen (Moscow, Russia).
TruSeq mRNA Stranded kit (Illumina) was used for enrichment of poly(A)+ fractions. The cDNA synthesis was performed using random primers. The resulting cDNA libraries were adapted for the Illumina platform.
The quality of the libraries was checked using the Fragment Analyzer system. Quantification was performed by qPCR. After quality control and concentration normalisation, the pooled library pool was sequenced on the Illumina NovaSeq 6000 platform. Paired-end reads of 150 base pairs in length were obtained. FASTQ files were generated using bcl2fastq v2.20 software (Illumina), and the quality assessment format was Phred+33.
The total number of reads generated was 2,885,042,754. All raw data are deposited in the GEO database under access number GSE282483.
4.8. Primary Data Processing
The quality of raw reads was assessed using FastQC software [19]. Preliminary filtering was performed using the fastp utility, including:
- adapter removal (TruSeq3);
- exclusion of short reads (<30 nucleotides);
- filtering for low linguistic complexity (<30%);
- base correction and default quality filtering.
4.9. Classification of Reads
Reads were classified using the kallisto software [20] based on the tomato transcriptome (assembly SL3.1). Kallisto provides quantification of transcripts without the need for additional counting tools. Pseudo-alignment was performed with bootstrapping (100 iterations), with filtered reads as input.
Classification data are also deposited in GEO (GSE282483).
4.10. Differential Expression Analysis
Identification of genes with altered expression levels under different conditions was performed using the edgeR library [21]. The quasi-linear generalised logarithmic regression model with negative binomial distribution was used for variance estimation. Statistical hypothesis testing was performed using the F-test.
Classified reads obtained by kallisto analysis served as input data.
To visualise the results we used the upset library [22] in Python, as well as built-in visualisation tools from the edgeR package.
4.11. GO Enrichment Analysis
Functional analysis of annotated genes was performed using the gprofiler2 package in the R environment, which provides access to the tools of the g:Profiler platform [23].
GO analysis was structured into three levels:
- Experimental level - comparison between experimental conditions.
- Expression dynamics - categorisation of genes into groups with increased, decreased or unchanged expression.
- Representation level - identification of over- and under-represented terms.
Filters were used to increase the biological significance of the results:
- term_size ≤ 250 - maximum number of child terms;
- intersection_size ≥ 10 - minimum number of annotated genes for a term.
The filtered results were visualised as clustered heatmaps for further analysis.
4.12. Data Processing and Visualisation
Custom scripts in Python and R were used for batch file processing - including renaming, sorting, and other data operations. Anaconda Software Distribution [24] was used as the development environment, and development was performed in the interactive Jupyter Notebook environment [25].
The following libraries were used for data processing and building visualisations:
- Python:
- numpy - for working with arrays;
- scipy - for statistical analysis;
- pandas - for processing tabular data;
- seaborn, matplotlib - for plotting graphs and diagrams.
- 2.
- R:
- tidyverse - a set of packages for processing and visual presentation of structured data.
The GNU Parallel utility [26] was used for parallel processing.
4.13. Confirmation of Differential Expression Data by qPCR
Genes that demonstrated significant differential expression by transcriptome analysis were selected for validation. Fold change values were divided into six quantiles, from which representative genes present in all four experimental groups were selected: control, acclimation, stress and acclimation + stress.
Primers were designed using Primer3 software. Their specificity and efficiency were tested both in silico and experimentally.
qPCR reactions were performed on a QuantStudio 5 instrument (Thermo Scientific) using the SYBR Green system (Evrogen) according to the manufacturer’s recommendations. Each reaction was performed in three technical repeats for each sample.
Expression levels were normalised for the housekeeping control genes: RPL2, EF-1-alpha, UBI. Relative expression levels were calculated using the ΔΔCt method.
4.14. WGCNA
Weighted gene co-expression networks were analysed using the pyWGCNA library, which implements the functionality of the classical WGCNA package [27] to work in the Python programming environment [28]. The analysis of transcriptional data did not differ from that proposed by the developers: the input data were expression indices presented in TPM.
At the same time, the analysis of correlations between gene expression levels at the translational level is less developed than at the translational level. For this purpose, we used a pre-calculated parameter - translational ratio. Also, the obtained data were normalised so that the expression levels totalled 1 million for each sample. Such an approach is far from ideal, but we were forced to improvise.
5. Conclusions
Transcription and translation appear to form different strategies for cell and organism survival. Long-term and rapid, respectively. This can be seen most prominently under contrasting conditions in organisms whose strategies are all limited to biochemical and, at best, physiological responses. Exposure of plants to low temperatures is the best way to study this process (the process of diversification of expression strategies). The results of this study demonstrate that the expression response of plants to low-temperature stress is realised as a two-level, functionally separated system, where transcription and translation perform complementary but not duplicative functions. The use of parallel analysis of total and polysome-associated RNA allowed us to trace how plants redistribute expression priorities depending on the nature and duration of temperature exposure.
Hardening induces a large-scale and stable rearrangement of the transcriptional profile characterised by activation of genes involved in ribosome biogenesis, photosynthesis regulation and structural adaptations. In this case, short-term stress is not accompanied by pronounced changes in the transcriptome but causes a sharp shift in the composition of translated mRNAs, reflecting the activation of rapid posttranscriptional control. The translational level appears to be more sensitive to acute stress, showing selective activation of metabolic and proteolytic pathways without involving a wide range of transcripts.
Functional analysis confirmed that under stress conditions there is a suppression of the activity of genes localised in chloroplasts and mitochondria, accompanied by increased expression of ribosome components, proteasomes and protein complexes responsible for protein utilisation and modification. This indicates the transition of cells into the mode of protection and redistribution of resources in favour of adaptive and compensatory processes. Of particular interest is the group of stable genes that retain a constant level of expression under any conditions of exposure, indicating the existence of a basic functional core of the cellular response unaffected by fluctuations in regulatory activity.
Of particular significance are the results of the module analysis (WGCNA), which revealed a weak correlation between transcriptional and translational co-expression networks. Most modules were found to be specific either to a single level of regulation or to a particular mode of action (stress, hardening, combined conditions). This emphasises the structural separation of regulatory cascades and the independent tuning of expression within different phases of the stress response.
Overall, the data presented suggest that cold stress induces not just activation of defence genes but a profound structural rearrangement of the entire expression architecture of the cell. Under these conditions, transcription performs the role of preparation and rearrangement of networks, whereas translation realises the operative synthesis of adaptive proteins selected from the already existing pool of transcripts. This phase and functional separation of expression levels emphasises the need for an integrated approach to the study of plant stress physiology. The discovered regulatory patterns, co-expression modules and stable gene clusters can be used in the future to create markers of cold tolerance and develop new bioengineering solutions in crop production.
Supplementary Materials
The following supporting information can be downloaded at the website of this paper posted on Preprints.org, Figure A1, Appendix A; Figure B1, Appendix B.
Author Contributions
Author SAV and TAA contributed equally to this work. SAV and TAA designed the experiments. SDS, DIS, POS and PVN collected samples and performed the experiments. SAV and TAA drafted the manuscript and all authors revised it.
Funding
This research was funded by Russian Science Foundation, RSF grant number 22-74-10064. The work was carried out within the framework of the state assignment of the Ministry of Science and Higher Education of the Russian Federation (topic no. 122042700043-9).
Institutional Review Board Statement
Not applicable.
Informed Consent Statement
Not applicable.
Data Availability Statement
All raw data and preprocessed reads are deposited in the GEO database under access number GSE282483.
Acknowledgments
The authors of the article would like to thank the head of the Laboratory of Functional Genomics of the Timiryazev Institute of Plant Physiology, RAS, I.V.Goldenkova-Pavlova, for valuable advice and support during the research.
Conflicts of Interest
The authors of this work declare that they have no conflicts of interest.
Appendix A
Figure 1.
Statistically significant correlations of module expression with control conditions for transcriptional and translational data.
Figure 1.
Statistically significant correlations of module expression with control conditions for transcriptional and translational data.
Appendix B
Figure 1.
Comparison of transcriptional and translational coexpression modules with functional enrichment.
Figure 1.
Comparison of transcriptional and translational coexpression modules with functional enrichment.
References
- Janská, A.; Maršík, P.; Zelenková, S; Ovesná, J. Cold Stress and Acclimation – What Is Important for Metabolic Adjustment? Plant Biology 2010, 3, 395–405. [CrossRef]
- Kazemi-Shahandashti; Seyyedeh-Sanam; Reza Maali-Amiri. Global Insights of Protein Responses to Cold Stress in Plants: Signaling, Defence, and Degradation. Journal of Plant Physiology 2018, 226, 123–135. [CrossRef]
- Bhattacharya, A. Physiological Processes in Plants Under Low Temperature Stress. Singapore: Springer Singapore, 2022. [CrossRef]
- Van Loon, L.C.; Rep, M.; Pieterse, C.M.J. Significance of Inducible Defense-Related Proteins in Infected Plants. Annual Review of Phytopathology 2006, 44, 135–162. [CrossRef]
- Guo; Xiaoyu; Dongfeng Liu; Kang Chong. Cold Signaling in Plants: Insights into Mechanisms and Regulation. Journal of Integrative Plant Biology 2018, 60, 745–756. [CrossRef]
- Chen; Xuexue; Yanglin Ding; Yongqing Yang; Chunpeng Song; Baoshan Wang; Shuhua Yang; Yan Guo; Zhizhong Gong. Protein Kinases in Plant Responses to Drought, Salt, and Cold Stress. Journal of Integrative Plant Biology 2021, 63, 53–78. [CrossRef]
- Guo; Xiaoyu; Dongfeng Liu; Kang Chong. Cold Signaling in Plants: Insights into Mechanisms and Regulation. Journal of Integrative Plant Biology 2018, 60, 745–756. [CrossRef]
- Golizadeh; Farzane; Hassan Hassani Kumleh. Physiological Responses and Expression Changes of Fatty Acid Metabolism–Related Genes in Wheat (Triticum Aestivum) Under Cold Stress. Plant Molecular Biology Reporter 2019, 37, 224–36. [CrossRef]
- Knight; Marc, R.; Heather Knight. Low-temperature Perception Leading to Gene Expression and Cold Tolerance in Higher Plants. New Phytologist 2012, 195, 737–751. [CrossRef]
- Mehrotra; Shakti; Saurabh Verma; Smita Kumar; Sandhya Kumari; Bhartendu Nath Mishra. Transcriptional Regulation and Signalling of Cold Stress Response in Plants: An Overview of Current Understanding. Environmental and Experimental Botany 2020, 180, 104243. [CrossRef]
- Jin; Jingjing; Hui Zhang; Jianfeng Zhang; Pingping Liu; Xia Chen; Zefeng Li; Yalong Xu; Peng Lu; Peijian Cao. Integrated Transcriptomics and Metabolomics Analysis to Characterize Cold Stress Responses in Nicotiana Tabacum. BMC Genomics 2017, 18. [CrossRef]
- Abdullah; Siti Nor Akmar; Azzreena Mohamad Azzeme; Kobra Yousefi. Fine-Tuning Cold Stress Response Through Regulated Cellular Abundance and Mechanistic Actions of Transcription Factors. Frontiers in Plant Science 2022, 13. [CrossRef]
- Muñoz; Alfonso; Mar Castellano, M. Regulation of Translation Initiation under Abiotic Stress Conditions in Plants: Is It a Conserved or Not so Conserved Process among Eukaryotes? Comparative and Functional Genomics 2012, 1–8. [CrossRef]
- Wang; Tong; Yizhi Cui; Jingjie Jin; Jiahui Guo; Guibin Wang; Xingfeng Yin; Qing-Yu He; Gong Zhang. Translating mRNAs Strongly Correlate to Proteins in a Multivariate Manner and Their Translation Ratios Are Phenotype Specific. Nucleic Acids Research 2013, 41, 4743–54. [CrossRef]
- Chothani, S.; Adami, E.; Ouyang, J.F.; Viswanathan, S.; Hubner, N.; Cook, A.S.; Schafer, S.; Rackham, O.J.L. deltaTE: Detection of Translationally Regulated Genes by Integrative Analysis of Ribo-seq and RNA-seq Data. Current Protocols in Molecular Biology 2019, 129. [CrossRef]
- Chothani, S.; Adami, E.; Ouyang, J.F.; Viswanathan, S.; Hubner, N.; Cook, A.S.; Schafer, S.; Rackham, O.J.L. deltaTE: Detection of Translationally Regulated Genes by Integrative Analysis of Ribo-seq and RNA-seq Data. Current Protocols in Molecular Biology 2019, 129. [CrossRef]
- Wang; Tong; Yizhi Cui; Jingjie Jin; Jiahui Guo; Guibin Wang; Xingfeng Yin; Qing-Yu He; Gong Zhang. Translating mRNAs Strongly Correlate to Proteins in a Multivariate Manner and Their Translation Ratios Are Phenotype Specific. Nucleic Acids Research 2013, 41, 4743–54. [CrossRef]
- Lecampion, B.; Desroches, J.; Jeffrey, R.G.; Bunger, A.P. Experiments versus Theory for the Initiation and Propagation of Radial Hydraulic Fractures in Low-permeability Materials. Journal of Geophysical Research: Solid Earth 2017, 122, 1239–63. [CrossRef]
- FastQC. https://qubeshub.org/resources/fastqc].
- Bray, N.L.; Pimentel, H.; Melsted, P.; Pachter, L. Near-Optimal Probabilistic RNA-Seq Quantification. Nature Biotechnology 2016, 34, 525–27. [CrossRef]
- Chen, Y.; Pal, B.; Visvader, J.E.; Smyth, G.K. Differential Methylation Analysis of Reduced Representation Bisulfite Sequencing Experiments Using edgeR. F1000Research 2018, 2055. [CrossRef]
- Lex, A.; Gehlenborg, N.; Strobelt, H.; Vuillemot, R.; Pfister, H. UpSet: Visualization of Intersecting Sets. IEEE Transactions on Visualization and Computer Graphics 2014, 20, 1983–92. [CrossRef]
- Reimand, J.; Arak, T.; Adler, P.; Kolberg, L.; Reisberg, S.; Peterson, H.; Vilo, J. G:Profiler—a Web Server for Functional Interpretation of Gene Lists (2016 Update). Nucleic Acids Research 2016, 44, 83–89. [CrossRef]
- Anaconda Software Distribution, 2020. https://docs.anaconda.com.
- Jupyter, 2015. https://jupyter.org.
- Tange, O. GNU Parallel 20210822 (‘Kabul’). Zenodo, 2021. [CrossRef]
- Langfelder, P.; Horvath, S. WGCNA: An R Package for Weighted Correlation Network Analysis. BMC Bioinformatics 2008, 9. [CrossRef]
- Rezaie, N.; Reese, F.; Mortazavi, A. PyWGCNA: A Python Package for Weighted Gene Co-Expression Network Analysis. Bioinformatics 2023, 39. [CrossRef]
Figure 1.
Principal component analysis. The area inside the yellow border is the cluster of all transcriptional data. The area inside the green border is the cluster of all translational data.
Figure 1.
Principal component analysis. The area inside the yellow border is the cluster of all transcriptional data. The area inside the green border is the cluster of all translational data.
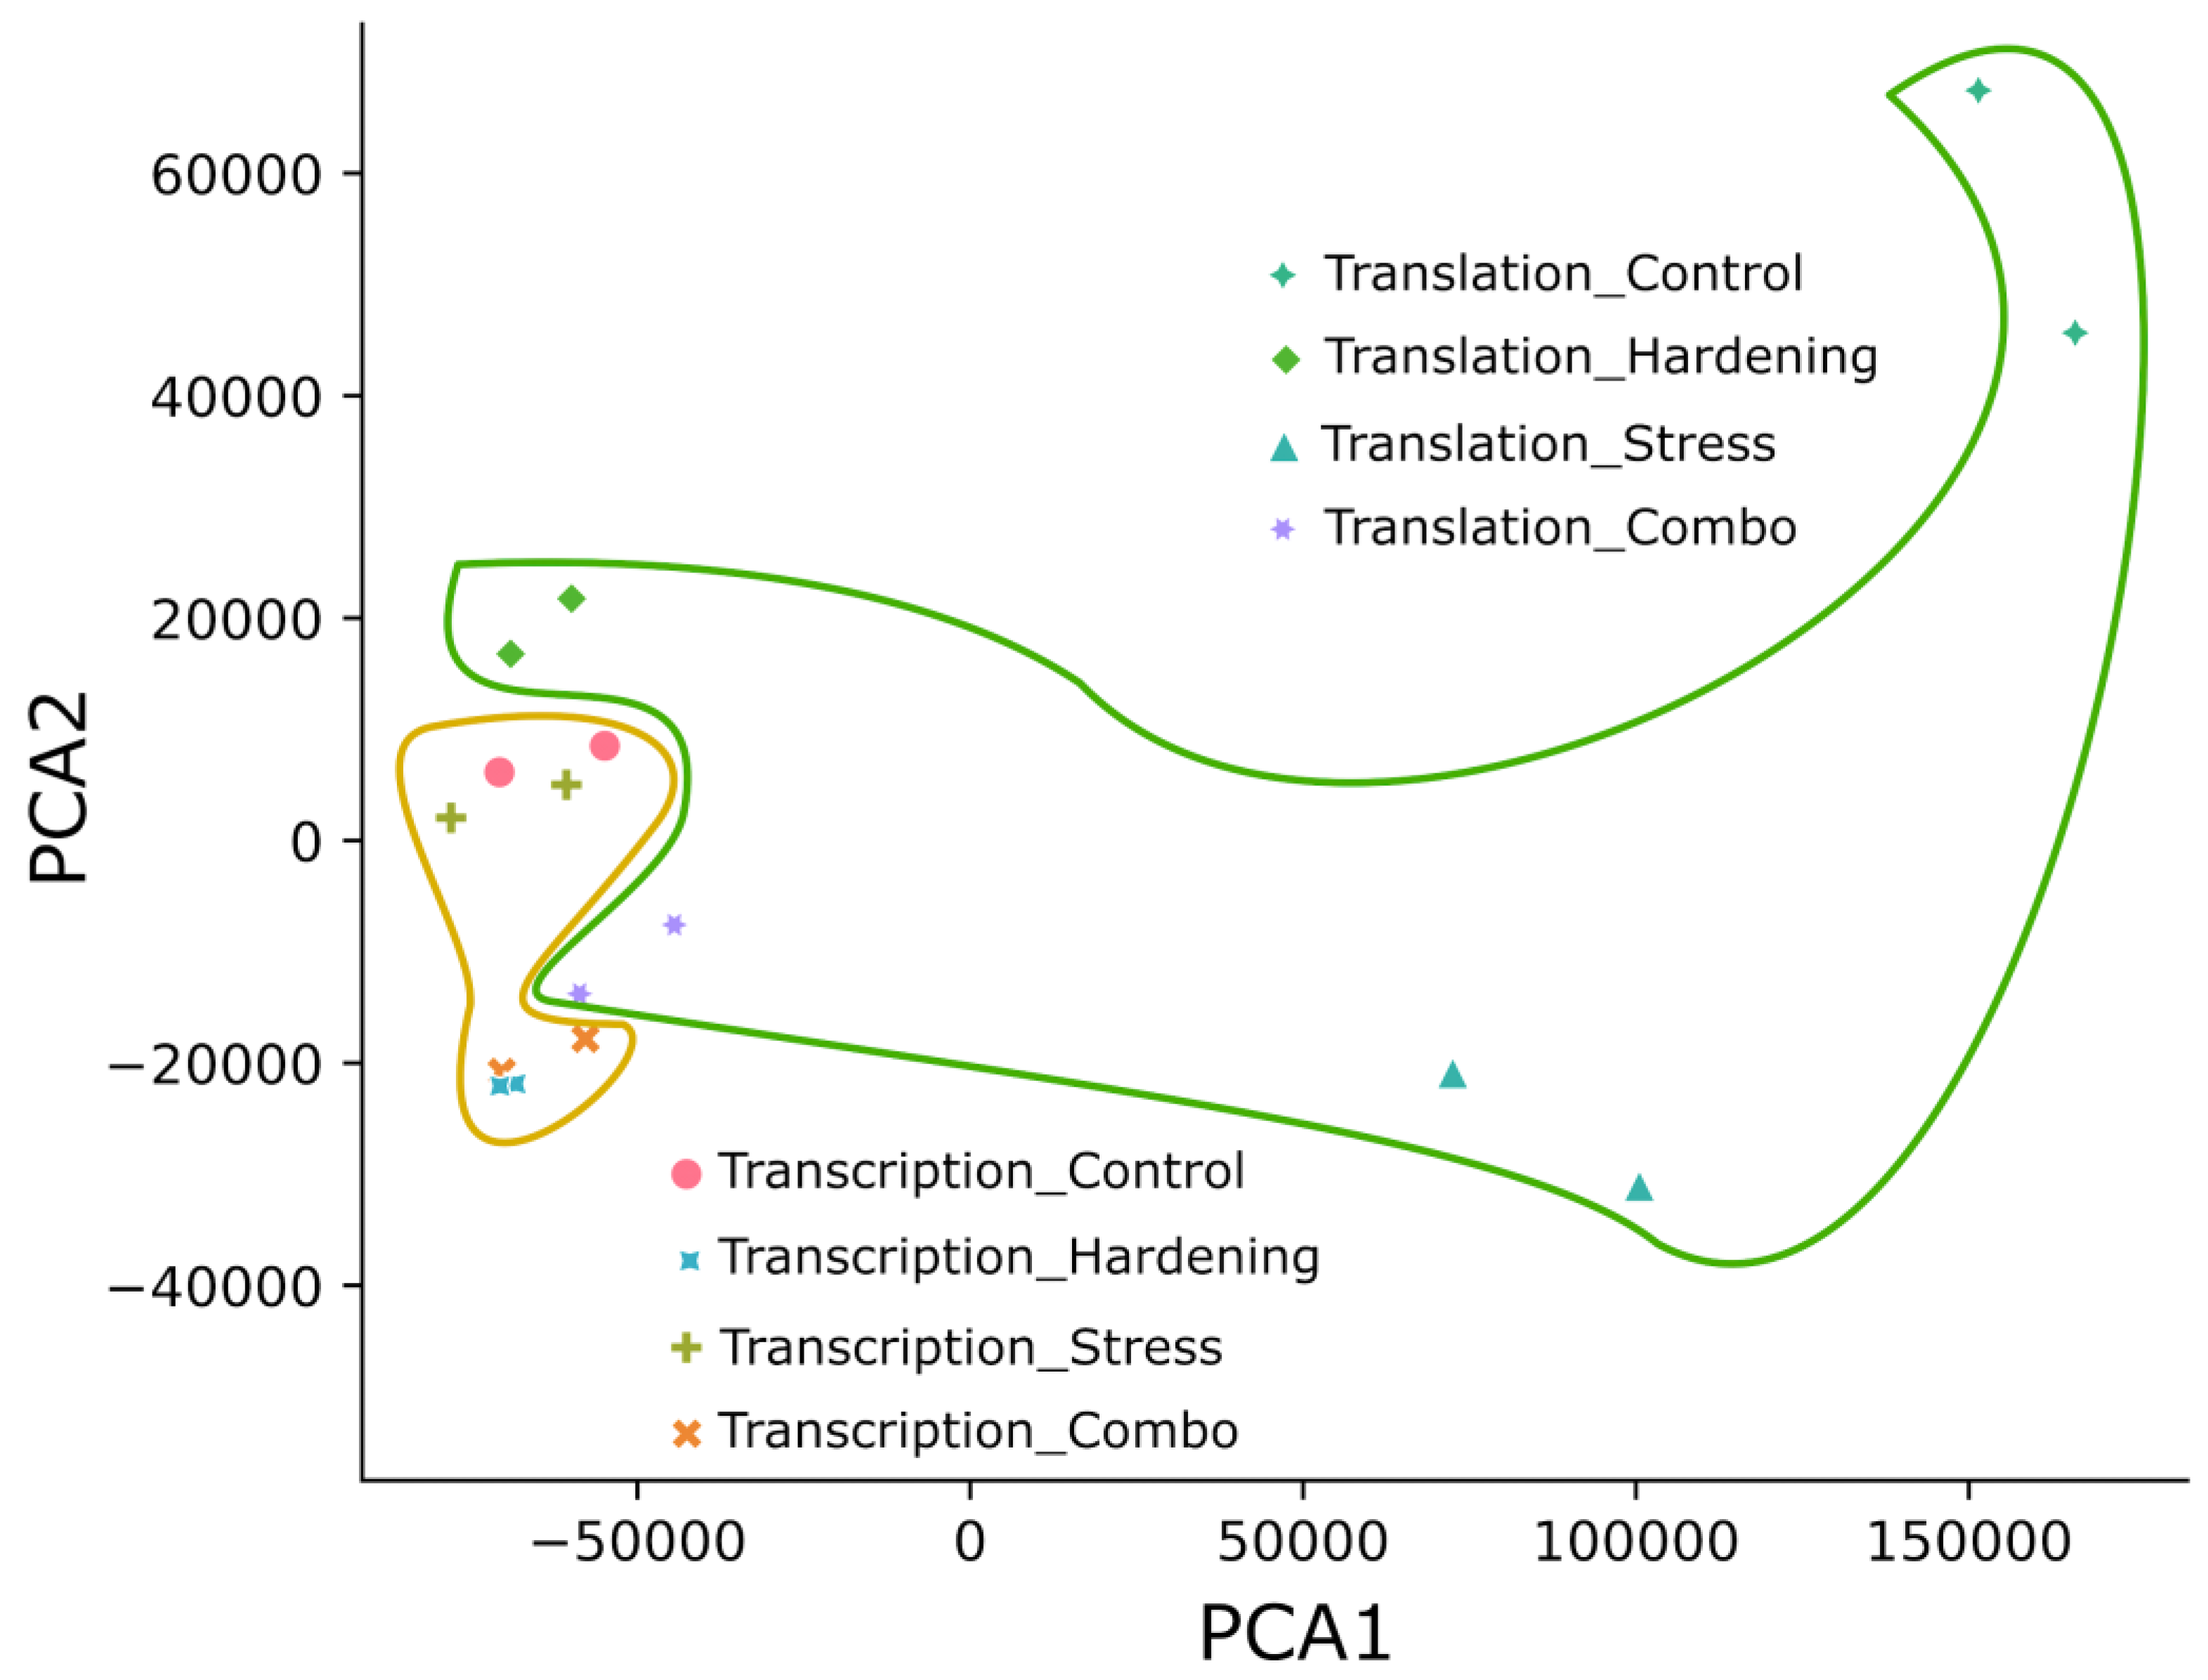
Figure 2.
UpSet plot of intersections between differentially expressed gene groups across conditions.
Figure 2.
UpSet plot of intersections between differentially expressed gene groups across conditions.
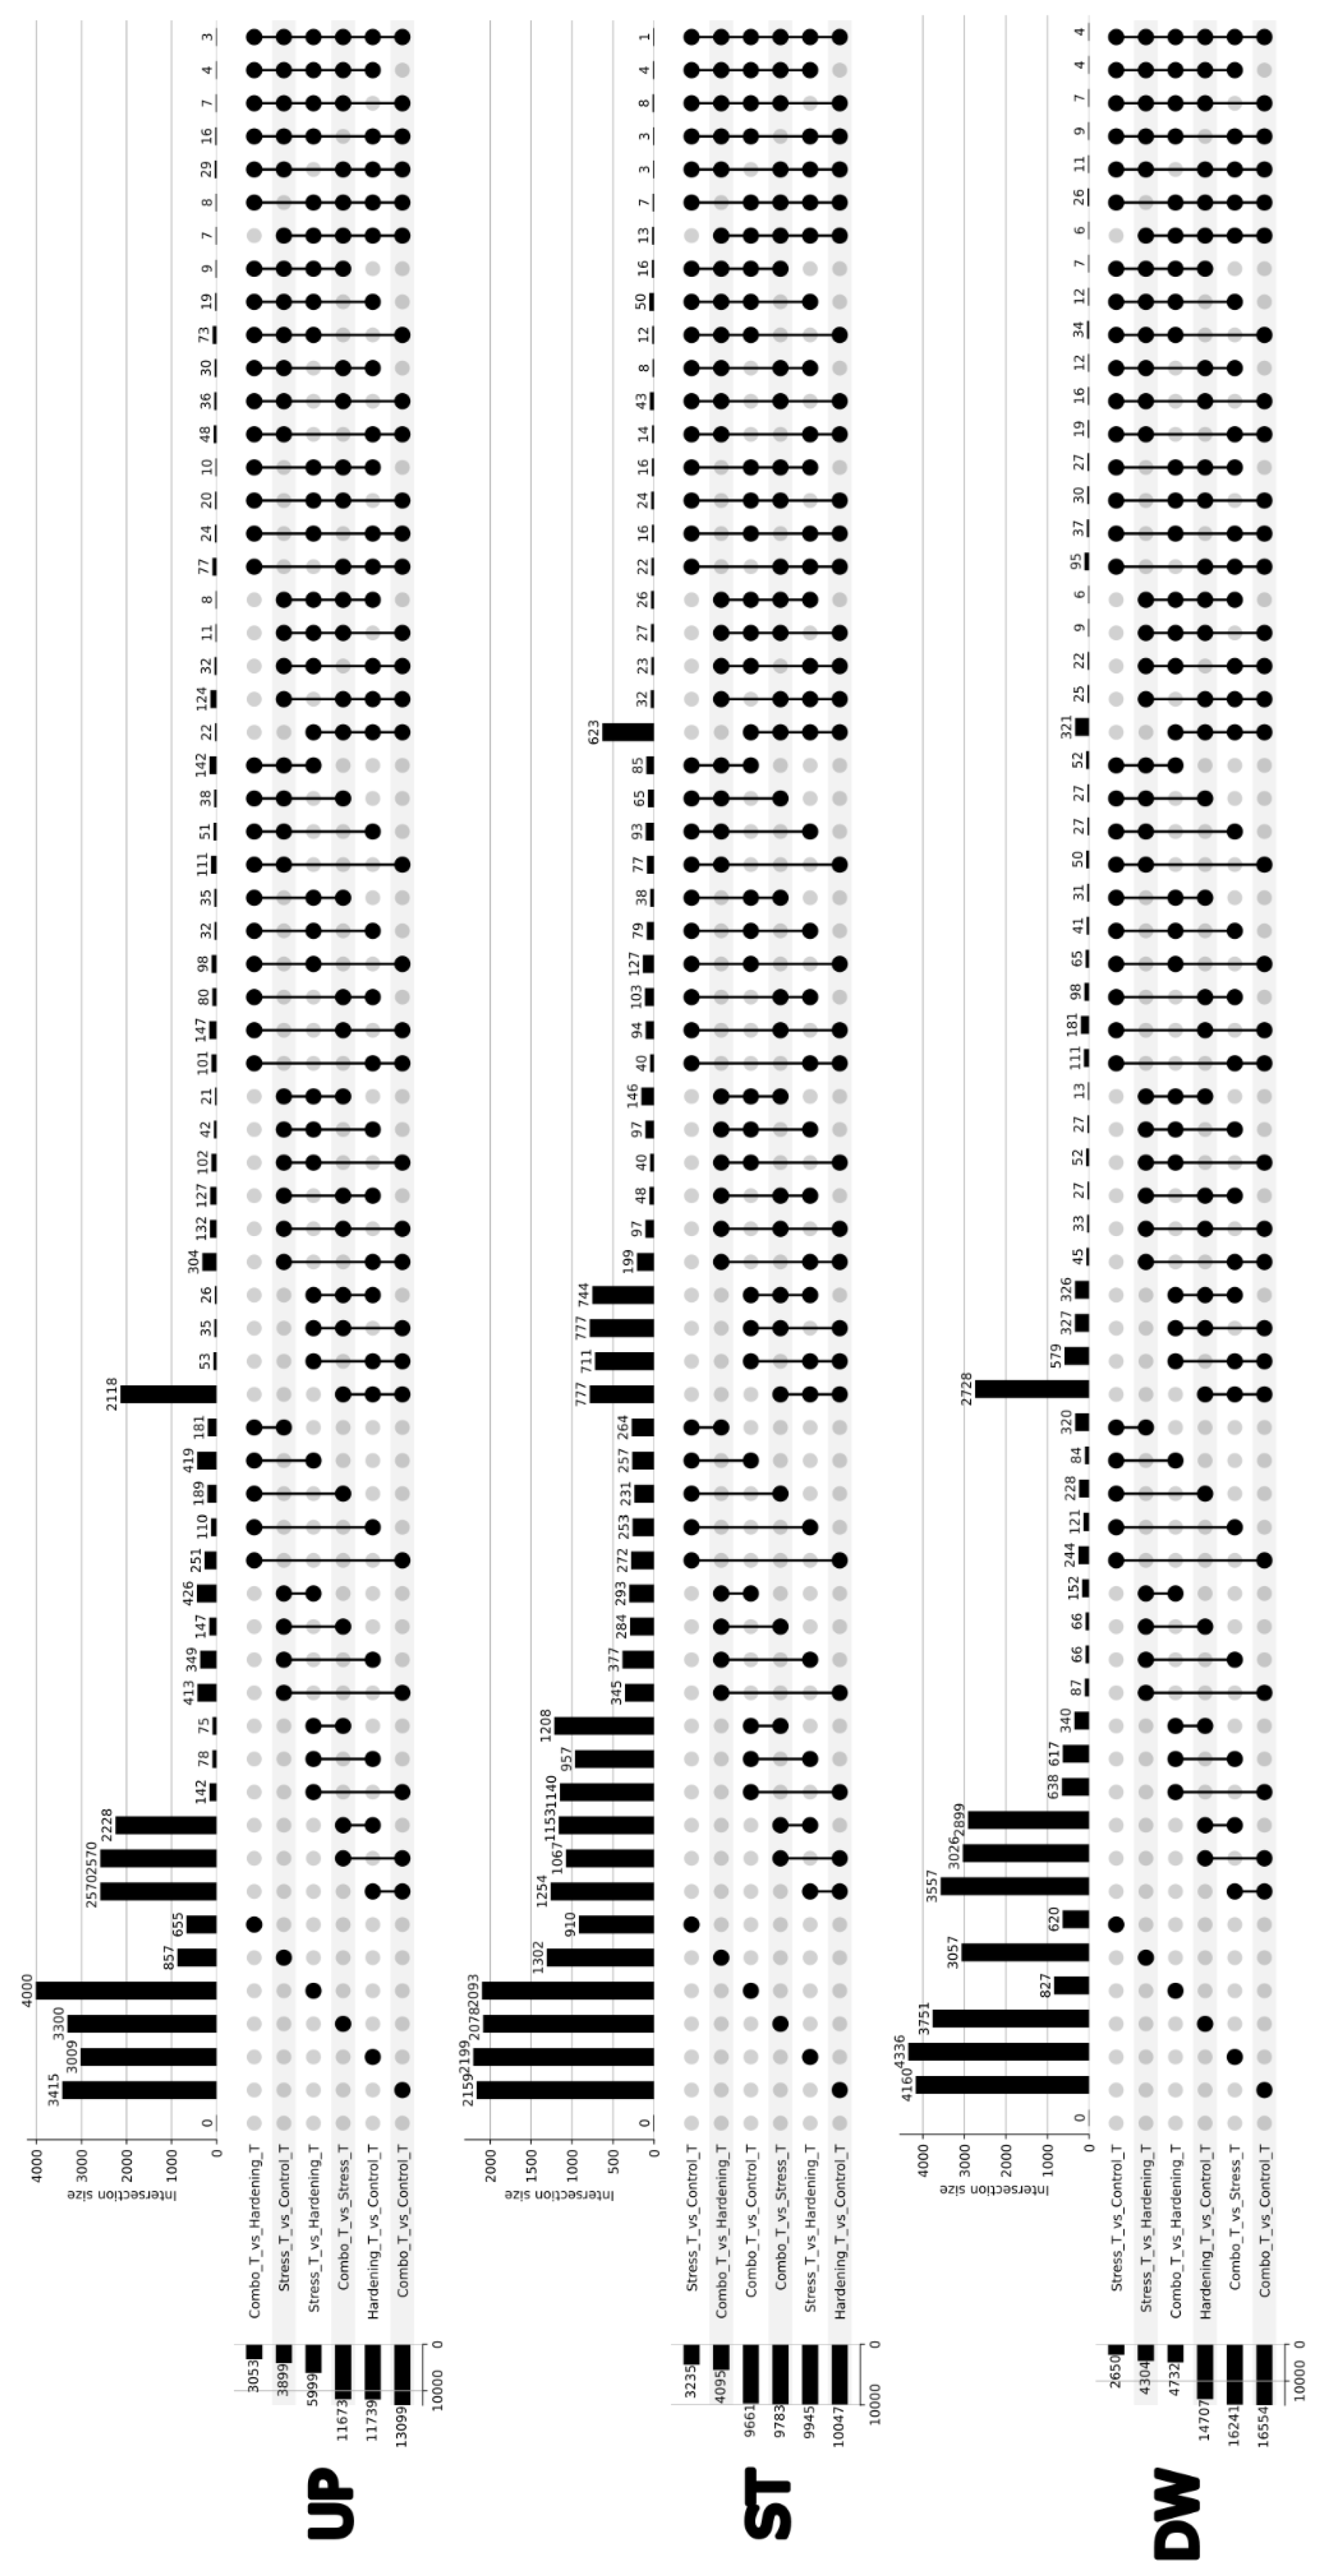
Figure 3.
Clustering of differentially expressed gene sets (DEGs) across conditions using the Jaccard Index.
Figure 3.
Clustering of differentially expressed gene sets (DEGs) across conditions using the Jaccard Index.
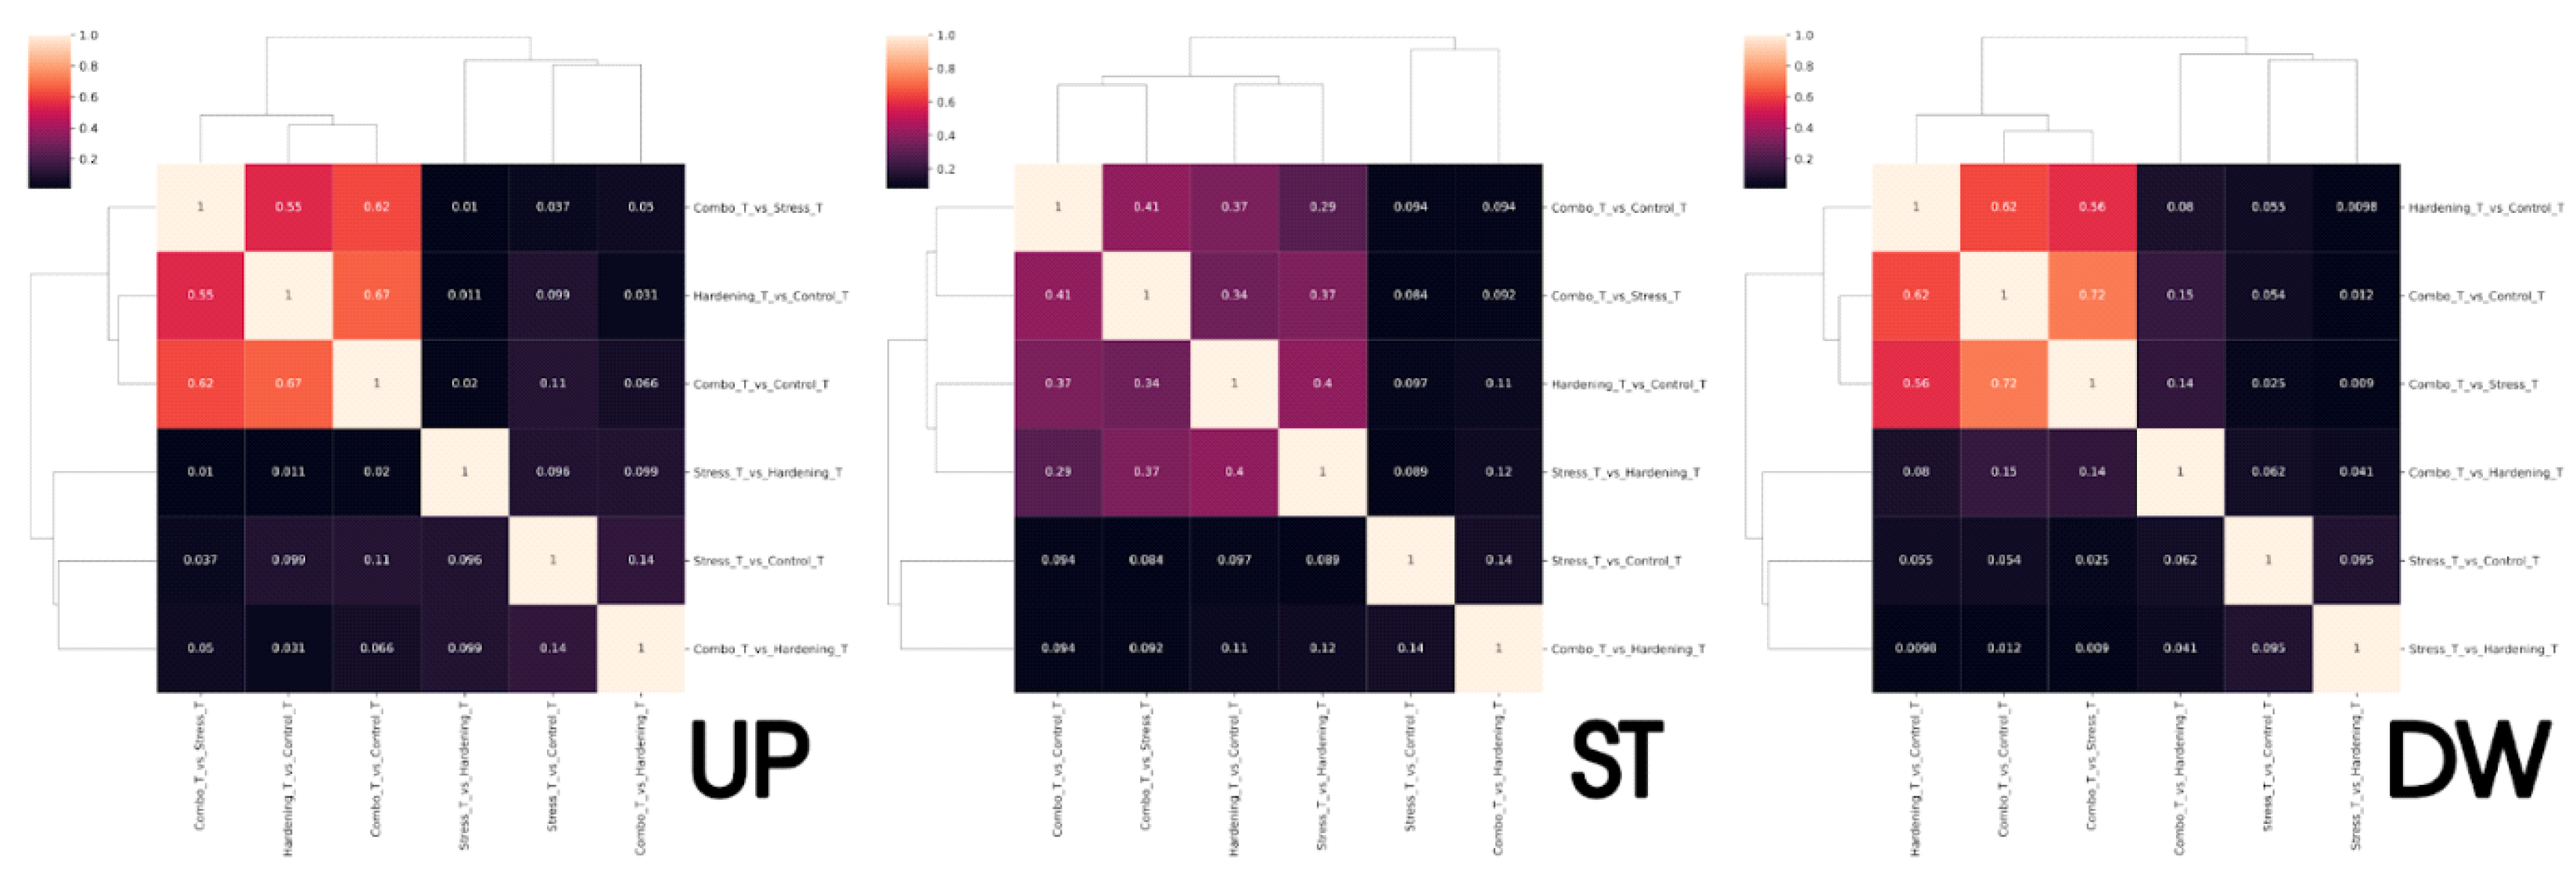
Figure 4.
Upset plot showing intersections of genes with differential translational efficiency across conditions.
Figure 4.
Upset plot showing intersections of genes with differential translational efficiency across conditions.
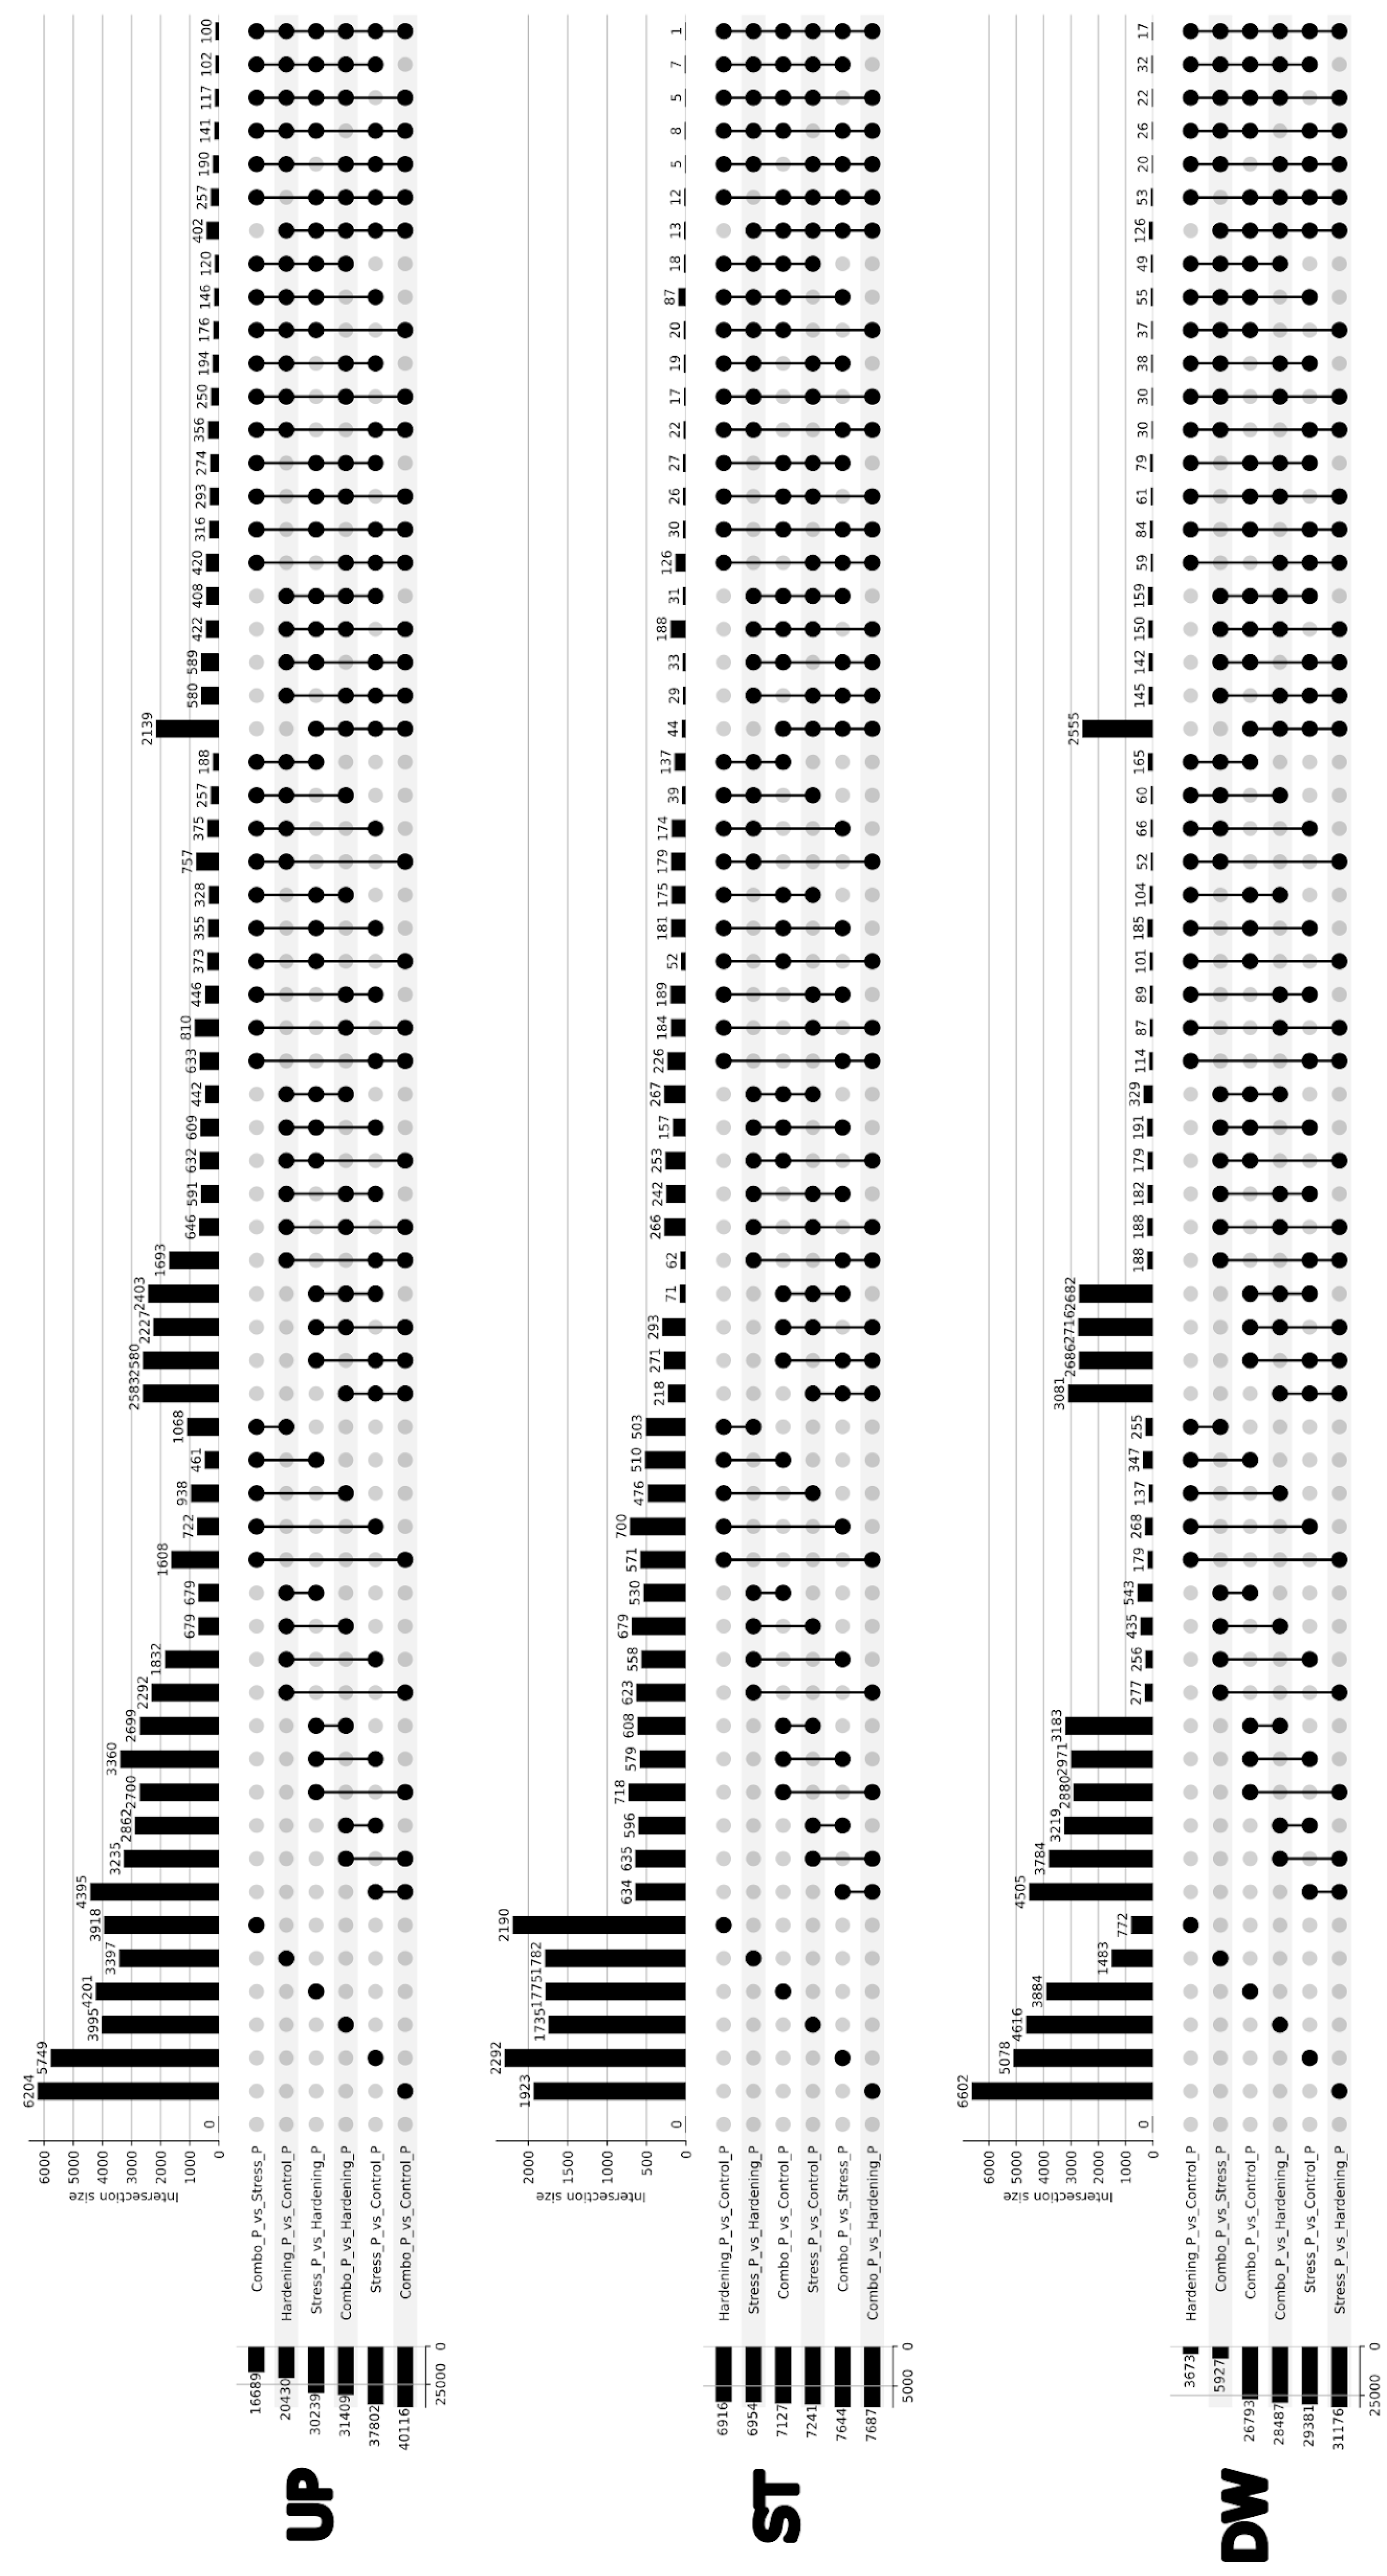
Figure 5.
Clustering of differentially translated gene sets across conditions using the Jaccard Index highlighting a stable gene subset.
Figure 5.
Clustering of differentially translated gene sets across conditions using the Jaccard Index highlighting a stable gene subset.
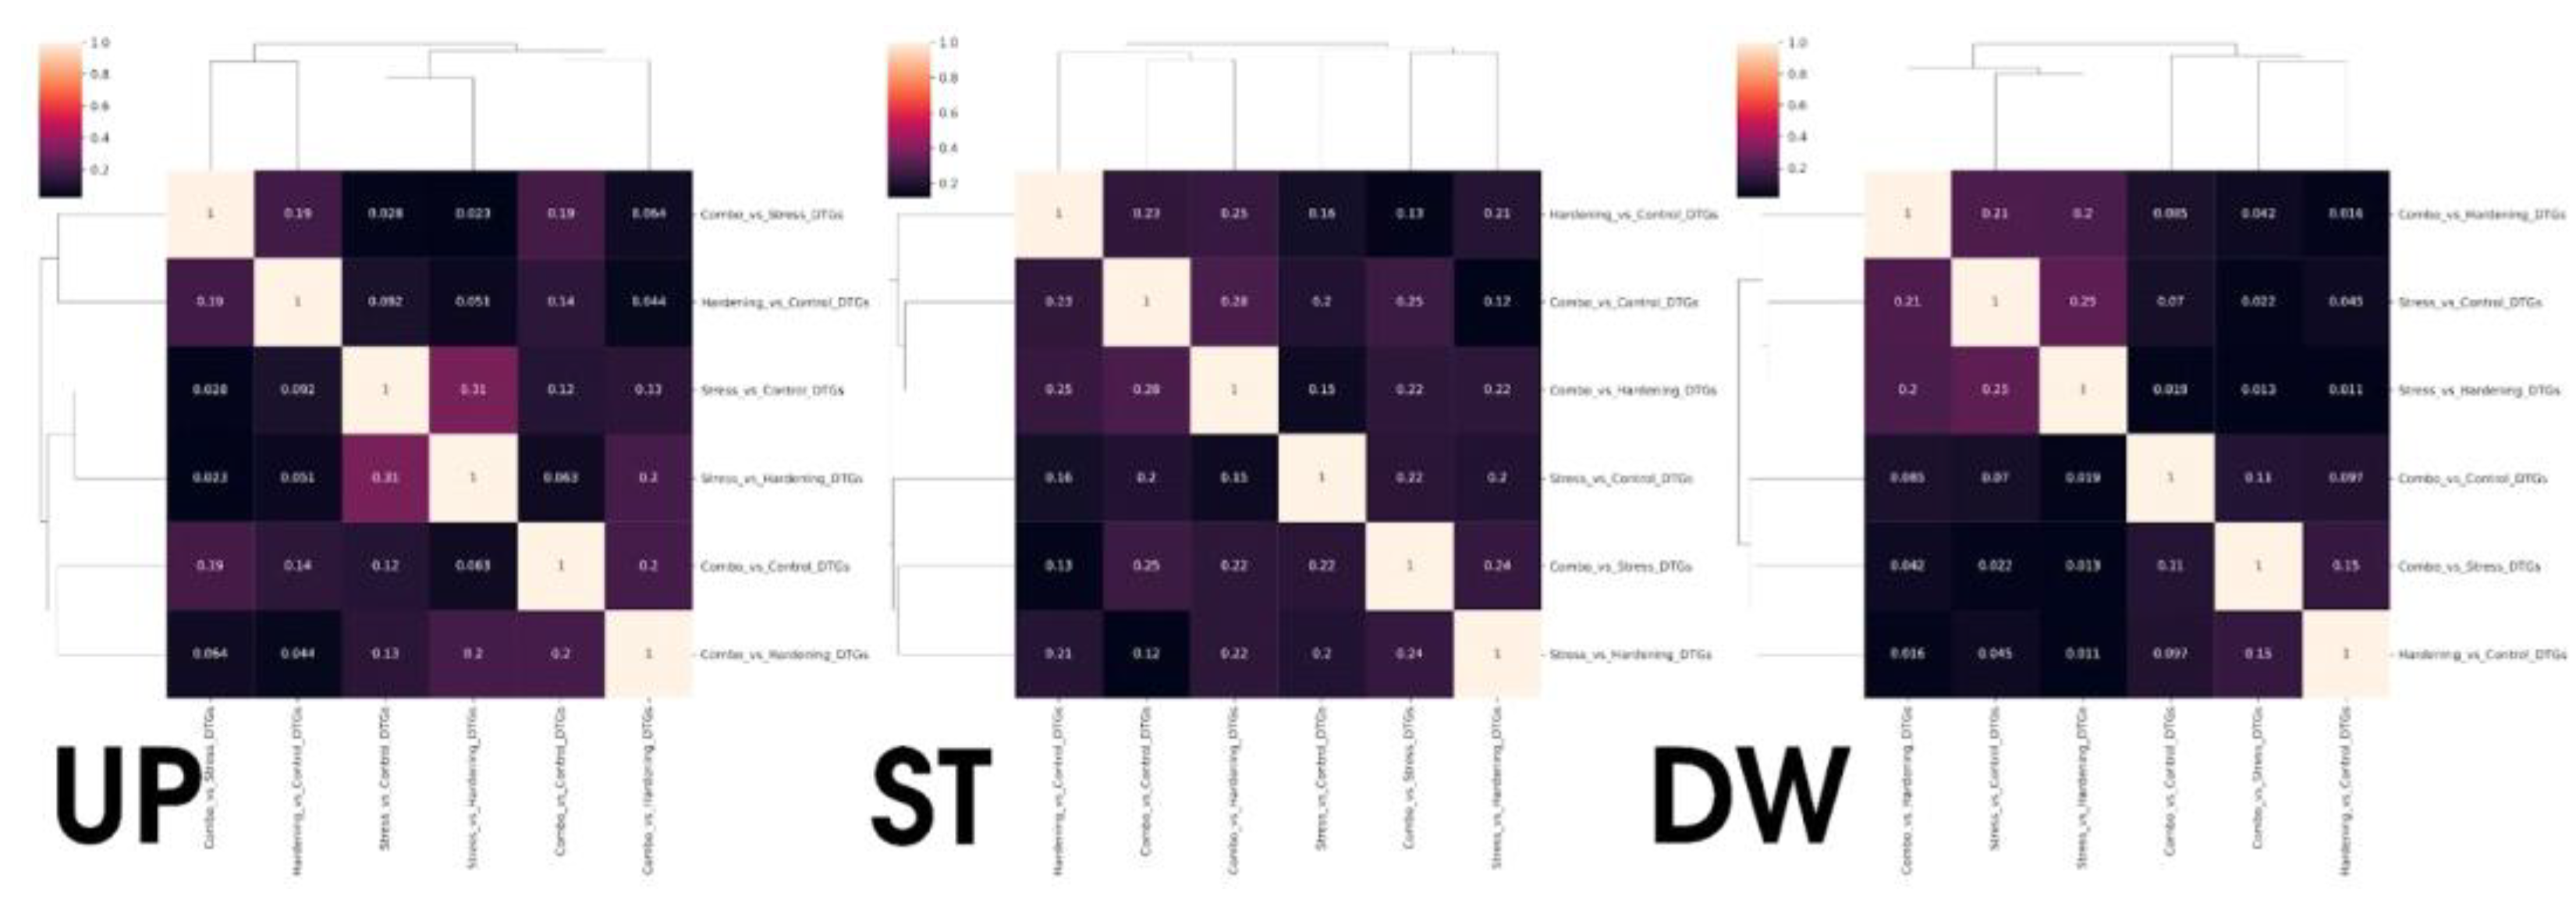
Figure 6.
Jaccard-based comparison of transcriptional and translational coexpression modules. Diagram showing the overlap between transcriptional and translational coexpression modules based on the Jaccard index. Most module pairs exhibit low similarity (J < 0.05), except for three significant overlaps: gainsboro (translation) vs. coral (transcription), darkgrey (translation) vs. brown (transcription), and darkgrey (translation) vs. saddlebrown (transcription). These pairs were selected for further GO enrichment analysis. Module names are automatically assigned and do not imply functional similarity.
Disclaimer/Publisher’s Note: The statements, opinions and data contained in all publications are solely those of the individual author(s) and contributor(s) and not of MDPI and/or the editor(s). MDPI and/or the editor(s) disclaim responsibility for any injury to people or property resulting from any ideas, methods, instructions or products referred to in the content. |
© 2025 by the authors. Licensee MDPI, Basel, Switzerland. This article is an open access article distributed under the terms and conditions of the Creative Commons Attribution (CC BY) license (http://creativecommons.org/licenses/by/4.0/).
Copyright: This open access article is published under a Creative Commons CC BY 4.0 license, which permit the free download, distribution, and reuse, provided that the author and preprint are cited in any reuse.


