
Submitted:
17 July 2025
Posted:
18 July 2025
You are already at the latest version
Preprints on COVID-19 and SARS-CoV-2
Abstract
Background: The SARS-CoV-2 Omicron variant has become a dominant driver of the COVID-19 pandemic due to its high transmissibility and immune escape potential. Although clinical outcomes are generally mild to moderate, the inflammatory mechanisms triggered by Omicron subvariants remain poorly defined. The goal of this study was to consider both viral evolution and host immune response by assessing plasma cytokine levels in patients infected with SARS-CoV-2 Omicron subvariants. Methods: A total of 115 individuals were recruited, including 40 with laboratory-confirmed SARS-CoV-2 infection by RT-qPCR. Demographic, clinical, and comorbidity data were collected. Plasma levels of IL-6, TNF, IFN-γ, IL-4, IL-2, IL-10, and IL-17A were quantified using Cytometric Bead Array. Subvariant data were obtained from GISAID records and grouped into early (BA.1-lineage) and late (BA.4/BA.5-lineage) Omicron clusters. Statistical analysis included nonparametric and parametric tests, correlation matrices, and multivariate comparisons. Results: Pharyngitis, nasal discharge, cough, and headache were the most common symptoms among infected individuals. Despite no significant variation in symptom distribution across subvariants, infected patients showed higher levels of IFN-γ, TNF, IL-10, IL-4, and IL-2 than non-infected controls (p < 0.05). IL-4 and IL-10 were significantly higher in early Omicron infections. No associations were observed between cytokine levels and comorbidities. A significant correlation was found between reporting fewer symptoms and having received three vaccine doses. Conclusions: Infection with Omicron subvariants elicits a strong but balanced cytokine response. Despite genetic divergence between lineages, immune and clinical patterns remain conserved, with vaccination appearing to mitigate symptom burden.
Keywords:
COVID-19
; cytokines
; SARS-Co-2 variants
; interleukins
1. Introduction
SARS-CoV-2 infection, the etiological agent of COVID-19, triggers a complex immune response that can be critical for both infection resolution and disease progression. Since the onset of the pandemic, it has become evident that the severity of COVID-19 is not solely dependent on viral replication, but also on an exacerbated inflammatory response characterized by a dysregulated increase in inflammatory mediators, particularly pro-inflammatory cytokines, a phenomenon widely known as a cytokine storm [1].
In the context of viral infection, the activation of different T helper (Th) cell subsets plays a crucial role in modulating the immune response. Th1, Th2, and Th17 profiles, in particular, are especially relevant in COVID-19, as they are involved in coordinating inflammatory and antiviral responses as well as regulating adaptive immunity [2,3,4]. The Th1 profile, associated with the production of IFN-γ, IL-2, and TNF, is linked to effective antiviral defense, whereas the Th2 profile, characterized by the production of IL-4 and IL-10, plays a more modulatory and anti-inflammatory role. In contrast, the Th17 response, represented by IL-17A, is essential for neutrophil recruitment and the maintenance of tissue inflammation [5].
An imbalance in the production of these cytokines may lead to more severe clinical outcomes, including the development of cytokine storm, respiratory failure, and, in critical cases, multiple organ failure [6]. The severity of COVID-19 has been widely associated with dysregulation of the inflammatory response, characterized by elevated levels of various pro- and anti-inflammatory cytokines, which are frequently reported in hospitalized patients [7,8,9].
In parallel with the evolution of the pandemic, the emergence of multiple SARS-CoV-2 variants significantly impacted the epidemiological course of COVID-19. Among the variants of concern (VOCs)—such as Gamma (P.1), Delta (B.1.617.2), and, more recently, Omicron (B.1.1.529)—the latter marked a turning point in the pandemic, characterized by substantial changes in viral transmissibility, immune evasion, and clinical presentation. Since its identification in late 2021, Omicron has rapidly diversified into multiple subvariants, prompting growing interest in its potential to differentially modulate host immune responses. This raises critical questions regarding how these subvariants influence the interplay between viral replication, immunological escape, and the host’s inflammatory response [10,11,12,13,14].
Understanding how these subvariants influence the balance between pro- and anti-inflammatory mediators is essential for elucidating the immunological mechanisms underlying disease severity and the variability in clinical manifestations. In particular, cytokines associated with Th1 (IFN-γ, IL-2, TNF), Th2 (IL-4, IL-10), and Th17 (IL-17A) responses, along with IL-6 as a central inflammatory marker, are key elements in defining the immune profile during acute SARS-CoV-2 infection.
In this context, the present study aimed to evaluate serum concentrations of Th1-, Th2-, and Th17-related cytokines in patients with acute COVID-19 caused by Omicron subvariants. Additionally, the study investigates whether distinct subvariants are associated with specific immunological or clinical patterns.
2. Materials and Methods
2.1. Data Collection and Biological Samples
This study included biological samples collected from 115 individuals (≥18 years), of both sexes, who presented with suspected COVID-19 at two medical care units located in the metropolitan region of Belém, Pará, Brazil. Sample collection was conducted between December 2021 and March 2022.
Following the signing of an informed consent form, clinical, sociodemographic, and comorbidity-related data were obtained through structured interviews. Simultaneously, 10 mL of whole blood were collected via venipuncture using a vacuum collection system con-taining ethylenediaminetetraacetic acid (EDTA) as an anticoagulant. In addition, nasopha-ryngeal swab samples were collected for SARS-CoV-2 molecular testing and genomic se-quencing.
Samples were processed at the Immunology Laboratory of the Virology Section of the Evandro Chagas Institute. Whole blood was aliquoted and stored, and plasma and swab was sepa-rated for subsequent analysis. Whole blood aliquots were used for RNA extraction and RT-qPCR, while plasma samples were reserved for cytokine quantification. Nasopharynge-al swabs were processed for viral RNA extraction and used in whole-genome sequencing procedures performed by a collaborating research group.
2.2. Genotyping Data Acquisition
The blood samples used in this study were previously processed by a collaborating research group responsible for SARS-CoV-2 variant identification. Viral RNA was extract from nasopharyngeal swab specimens using a silica column-based commercial kit, followed by SARS-CoV-2 detection via RT-qPCR using probes and primers targeting conserved viral re- gions. For genotyping, whole-genome sequencing was carried out on the Illumina MiSeq plat- form, employing a library preparation protocol specific to SARS-CoV-2.
Raw sequencing reads underwent stringent quality control, including adapter removal and base trimming using Phred score thresholds. Reads were then aligned to the SARS-CoV-2 reference genome (NC_045512.2) using the BWA-MEM algorithm. Variant consensus sequences were assembled with a minimum depth of 30× and manually curated using specialized bioinformatics software. Lineage classification was performed using the Phylogenetic Assignment of Named Global Outbreak Lineages (PANGOLIN) tool, and sequence quality and clade assignment were further validated using the Nexclade web platform.
The final lineage assignment for each individual was deposited in the GISAID (Global Initiative on Sharing All Influenza Data) database. For the present study, variant data corresponding to the individuals included in our cohort were retrieved directly from GISAID using sample-specific identifiers.
2.3. Plasma Measurement of Cytokine Levels
Serum levels of the cytokines IL-6, TNF, IFN-γ, IL-4, IL-2, IL-10, and IL-17A were quantified using flow cytometry, employing the BD FACS Canto II cytometer and the Human Th1/Th2/Th17 Cytometric Bead Array (CBA) kit (BD Biosciences, San Diego, CA, USA).
The assay was performed strictly according to the manufacturer’s instructions. Briefly, the method is based on the use of distinct sets of beads, each conjugated with a specific capture antibody targeting one of the selected cytokines. Upon incubation with the plasma samples and a PE-conjugated detection reagent, the bead–cytokine–detection antibody complexes were formed and analyzed by flow cytometry.
Fluorescence signals were detected in the FL-3 channel, allowing for simultaneous and quantitative measurement of the cytokines in a multiplexed format. Data acquisition and analysis were conducted using BD FACSDiva™ software, and cytokine concentrations were calculated based on standard curves generated from known concentrations provided in the kit.
2.4. Statistical Analysis
All statistical analyses were performed using JASP (version 0.17.2) and GraphPad Prism (version 10.5.0). Initially, descriptive statistics were used to summarize clinical, demographic, and immunological variables. The Shapiro–Wilk test was applied to evaluate the normality of continuous variables.
Comparative analyses between groups were conducted using parametric or non-parametric tests, depending on the distribution of the data. For variables showing normal distribution, Student’s t-test was employed; for non-normally distributed variables, the Mann–Whitney U test or Kruskal–Wallis test followed by Dunn’s post hoc test were applied, as appropriate.
Associations between categorical variables, such as symptoms and SARS-CoV-2 RT-qPCR results or comorbidity status, were evaluated using the chi-square test or Fisher’s exact test, depending on expected frequencies.
To assess relationships between categorical and continuous variables—such as the association between reported symptoms and cytokine levels—parametric or non-parametric tests were chosen according to the distribution of the cytokine data: Student’s t-test was applied for normally distributed cytokines, and the Mann–Whitney U test was used for those that deviated from normality.
Spearman’s rank correlation test was used to explore associations between continuous variables, including the number of reported symptoms and cytokine levels, as well as to generate a correlation matrix assessing potential interactions among Th1-, Th2-, and Th17-related cytokines.
All statistical analyses adopted a significance threshold of p < 0.05 and a 95% confidence interval.
2.5. Ethical Aspects
This study was approved by the Research Ethics Committee of the Evandro Chagas Institute (CAAE: 36869120.3.0000.0019; CEP approval number: 4.307.466) and conducted in accordance with Resolution No. 466/2012 of the Brazilian National Health Council (CNS) for research involving human subjects. All participants signed an informed consent form.
3. Results
3.1. Demographic Characterization and Diagnostic Confirmation
A total of 115 adult individuals, aged 18 years or older, participated in this study. Of these, 40 participants (34.78%) were diagnosed with COVID-19 through a positive molecular RT-qPCR test for SARS-CoV-2, while the remaining 75 individuals (65.22%) tested negative. Table 1 summarizes the main sociodemographic and clinical characteristics of the study population, including sex, age distribution, comorbidity status, and number of reported symptoms.
The participants in this study were stratified into three age groups: < 25 years, 25–50 years, and > 50 years. Among COVID-19-positive individuals (n = 40), 2 (5.0%) were aged < 25 years, 30 (75.0%) were between 25 and 50 years, and 8 (20.0%) were older than 50 years. Among the negative group (n = 75), 7 (9.3%) were aged < 25 years, 53 (70.7%) between 25 and 50 years, and 15 (20.0%) were over 50 years old. A Chi-squared test revealed no statistically significant differences in age distribution between the positive and negative groups (p = 0.707).
Regarding sex, the sample comprised 40% males and 60% females. In the positive group, 9 individuals (22.5%) were male and 31 (77.5%) were female; in the negative group, 20 (26.7%) were male and 55 (73.3%) female. No significant differences in sex distribution were observed between groups (p = 0.624, Chi-squared test).
Conversely, a statistically significant difference was observed in the prevalence of self-reported comorbidities. Among COVID-19-positive individuals, 16 (40.0%) reported at least one comorbidity, compared to 21 (28.0%) in the negative group (p = 0.029, Chi-squared test), suggesting a possible association between comorbidity presence and SARS-CoV-2 positivity.
3.2. Symptomatologic Comparison Between Groups
The comparison between the groups with positive and negative molecular teste for SARS-CoV-2 revealed a statistically significant difference for some symptoms reported, using the Chi-squared test.
Among positive group, the most frequently reported symptoms were pharyngitis (82.5%), nasal discharge (80.0%), headache (77.5%), cough (72.5%), fatigue (57.5%), chills (57.5%), fever (55.0%), and muscle pain (52.5%). In contrast, the negative group exhibited lower symptom frequencies, notably nasal discharge (70.0%), headache (66.7%), fatigue (45.0%), fever (46.7%), and cough (27.5%). Statistically significant differences between group were found for: Pharyngitis with positive individuals 82.5% vs. 60.0% for negative individuals (p = 0.017), Chills with positive individuals 57.5% vs. 20.0% for negative individuals (p = < 0.001), and Painful breathing with positive individuals presenting 17.5% vs. 5.0% in negatives (p = 0.041). Others symptoms did not show statistically significant differences between groups (p > 0.05).
Additionally, we evaluated the individual symptom burden based on the total number of symptoms reported per participant. The median number of reported symptoms was 7 (interquartile range: 5–9) in the positive group and 5 (IQR: 4–7) in the negative group. As the variable did not follow a normal distribution (as determined by the Shapiro-Wilk test), we applied the Mann-Whitney U test, which indicated as statistically significant difference between the groups (U = 541; p = 0.005), as illustrated in Figure 1A.
3.3. Symptoms Presented by the Positive Group
The distribution of 16 self-reported clinical symptoms among individuals with confirmed SARS-CoV-2 infection (n = 40) was analyzed using the chi-square goodness-of-fit test, to determine which symptoms occurred at frequencies significantly different from what would be expected under a uniform distribution.
The most frequently reported symptoms in this group were pharyngitis (82.5%), nasal discharge (80.0%), headache (77.5%), cough (72.5%), fever (55.0%), chills (57.5%), fatigue (57.5%), muscle pain (52.5%), joint pain (37.5%), and loss of taste (25.0%). Symptoms reported less frequently included dyspnea (15.0%), anosmia (12.5%), abdominal pain (20.0%), vomiting (7.5%), and painful breathing (17.5%).
Among the 16 symptoms assessed, four showed statistically significant frequencies according to the chi-square goodness-of-fit test (p < 0.05), indicating that they occurred more frequently than expected by chance: Pharyngitis (p = 0.017), Cough (p = 0.008), Nasal discharge (p = 0.014), Headache (p = 0.029).
These symptoms are marked with an asterisk in Figure 1B, which graphically displays the frequency of each reported symptom within the SARS-CoV-2 positive group.
3.4. Omicron Subvariants Identified in the Sample
Genomic sequencing of SARS-CoV-2–positive samples revealed the exclusive circulation of subvariants belonging to the Omicron variant (B.1.1.529). A total of 11 distinct Omicron subvariants were identified, reflecting the high genetic diversification of this lineage during the study period. The most frequently detected subvariants were: BA.1.14.1, identified in 30.0% of cases (n = 12), BA.1.1, in 25.0% (n = 10), BA.5.2.1, in 12.5% (n = 5), BA.5.1, in 10.0% (n = 4) and BA.1, in 7.5% (n = 3). The remaining subvariants—BA.1.1.14, BA.1.17, BA.4, BA.4.1, BA.5, and BA.5.1.22—were each identified in 2.5% of the sample (n = 1).
These proportions are illustrated in Figure 1C. The predominance of BA.1-derived subvariants suggests that early Omicron subvariants were still widely circulating during the sampling period, with a notable presence of BA.5-related subvariants in lower frequency.
3.5. Correlation of the Most Frequent Symptoms of the Positive Group with the Identified Variants
In order to investigate whether the high prevalence of certain clinical symptoms in SARS-CoV-2–positive individuals could be associated with specific subvariants of the Omicron variant, we conducted Fisher’s exact test to evaluate the relationship between each of the four most frequently reported symptoms—pharyngitis, nasal discharge, headache, and cough—and the 11 Omicron subvariants identified in the cohort (n = 40).
The analysis did not reveal any statistically significant association between the presence of these symptoms and the infecting subvariant: Pharyngitis was reported across all subvariants, with the highest frequencies in BA.1.14.1 (n = 10), BA.1.1 (n = 7), and BA.5.1 (n = 4), resulting in a p value of 0.879 (Figure 1D); Cough occurred most frequently in BA.1.1 (n = 8), BA.1.14.1 (n = 9), and BA.5.1 (n = 3), but no significant association was observed (p = 0.428) (Figure 1E); Nasal discharge was present in nearly all subvariants, particularly BA.1.14.1 (n = 9), BA.1.1 (n = 6), and BA.5.2.1 (n = 4), with a p value of 0.904 (Figure 1F); Headache showed a broad distribution among subvariants, especially in BA.1.14.1 (n = 9), BA.1.1 (n = 7), and BA.5.2.1 (n = 3), with a p value of 0.981 (Figure 1G).
These results suggest that the elevated frequencies of these four symptoms within the SARS-CoV-2–positive group cannot be explained by the subvariant distribution in this sample. Rather, they appear to represent common clinical features of acute Omicron infection, irrespective of subvariants.
3.6. Comparison of Plasma Cytokine Levels Between SARS-CoV-2 Positive and Negative Individuals
To investigate potential differences in inflammatory profiles, plasma concentrations of IL-17A, IFN-γ, TNF, IL-10, IL-6, IL-4, and IL-2 were compared between individuals who tested positive and negative for SARS-CoV-2 by RT-qPCR. As all cytokine variables deviated from normality according to the Shapiro–Wilk test (p < 0.001 for all markers), the Mann–Whitney U test was applied for group comparisons.Significant differences were identified in the levels of IFN-γ (p = 0.020), TNF (p < 0.001), IL-10 (p < 0.001), IL-4 (p < 0.001), and IL-2 (p < 0.001), all of which were elevated in the SARS-CoV-2–positive group. Conversely, no statistically significant differences were found for IL-17A (p = 0.311) or IL-6 (p = 0.673). These findings are illustrated in Figure 2, which displays raincloud plots representing the distribution, density, and central tendency of cytokine levels across the two study groups.
3.7. Association Between Clinical Symptoms and Serum Cytokine Levels in Patients with Acute COVID-19
To investigate whether specific clinical symptoms were associated with alterations in cytokine levels, we conducted an association analysis between the 16 self-reported symptoms and the plasma concentrations of seven cytokines: IL-17A, IFN-γ, TNF, IL-10, IL-6, IL-2, and IL-4, in individuals who tested positive for SARS-CoV-2. The corresponding p-values for each symptom–cytokine pair are presented in Table 2.
Overall, no statistically significant associations were observed between any of the reported symptoms and cytokine levels following chi-square goodness-of-fit testing (p > 0.05 for all comparisons). Only one comparison yielded a p-value below the conventional significance threshold: the association between loss of taste and IFN-γ levels (p = 0.038). However, this result did not remain significant after adjustment for multiple comparisons, underscoring the absence of robust correlations between individual symptoms and systemic cytokine concentrations.
All other symptoms, including pharyngitis, headache, fever, dyspnea, myalgia, and others, showed no statistically significant associations with any of the measured cytokines. These findings suggest that, in this cohort, individual clinical manifestations were not significantly associated with circulating levels of Th1-, Th2-, or Th17-associated cytokines, nor with the central inflammatory marker IL-6.
3.8. Correlation Between Cytokine Levels and Identified Omicron Subvariants
Patients were categorized according to the Omicron subvariant with which they were infected, as identified by genomic sequencing. Serum concentrations of various pro-inflammatory and regulatory cytokines, including IL-6, TNF, IL-4, IFN-γ, IL-17A, IL-10, and IL-2, were quantified in pg/mL. Due to the frequently non-parametric nature of cytokine data, the Kruskal-Wallis test was employed to perform comparisons between the subvariant groups, ensuring the statistical robustness of the analysis.
The results, detailed in Figure 3 (A-G) of the report, consistently demonstrated the absence of statistically significant differences in the levels of all evaluated cytokines among the Omicron subvariant groups. The obtained p-values were as follows: for IL-6, p=0.095; for TNF, p=0.241; for IL-4, p=0.154; for IFN-γ, p=0.278; for IL-17A, p=0.725; for IL-10, p=0.374; and for IL-2, p=0.397. The uniformity of these p-values, all exceeding the significance threshold of 0.05, suggests that the innate and adaptive immune response mediated by these specific cytokines, within this cohort, was not differentially modulated by the specific Omicron subvariants. This finding may indicate that, for these particular cytokines, the host’s response to SARS-CoV-2 infection might be more influenced by intrinsic individual factors or the overall viral load, rather than the genomic specificity of the viral subvariant.
3.9. Comparison of Serum Cytokine Levels Between Omicron Subvariant Clusters
To investigate potential differences in the inflammatory response induced by distinct Omicron subvariants, RT-qPCR–positive individuals were grouped into two clusters based on previously described genomic and epidemiological characteristics. Cluster 1 included early Omicron subvariants from the BA.1 lineage (BA.1, BA.1.1, BA.1.14.1, BA.1.1.14, and BA.1.17), while Cluster 2 comprised more recent subvariants (BA.4, BA.4.1, BA.5, BA.5.1, BA.5.2.1, and BA.5.1.22) characterized by additional spike protein mutations associated with enhanced immune evasion and reinfection capacity.
Based on Shapiro–Wilk test results, cytokines with non-normal distribution (IL-17A, IFN-γ, TNF, IL-2, and IL-6) were analyzed using the Mann–Whitney U test, while normally distributed cytokines (IL-4 and IL-10) were compared using the independent samples t-test. A p-value < 0.05 was considered statistically significant.
As shown in Figure 4, cytokines IL-6 (p = 0.006), IL-2 (p = 0.026), IL-4 (p < 0.001), and IL-10 (p = 0.006) displayed statistically significant differences between the clusters, with higher concentrations observed in Cluster 1. No significant differences were observed for IL-17A, IFN-γ, or TNF.
3.10. Interrelationships Among Serum Cytokine Levels in Infected Individuals
A Spearman correlation analysis was performed to investigate potential monotonic associations between serum levels of IL-17A, IFN-γ, TNF, IL-10, IL-6, IL-4, and IL-2 in individuals positive for SARS-CoV-2. The correlation coefficients (ρ) and respective p-values are summarized in Figure 4.
Statistically significant positive correlations were observed between several cytokines, notably involving IL-10, which correlated moderately with TNF (ρ = 0.74; p = 2.111e-06), IL-6 (ρ = 0.70; p = 1.118e-05), IL-4 (ρ = 0.64; p = 9.712e-05), and IL-2 (ρ = 0.76; p = 8.429e-07). TNF also showed strong correlations with IL-2 (ρ = 0.77; p = 4.738e-07) and IL-4 (ρ = 0.57; p = 0.001), in addition to a moderate correlation with IL-6 (ρ = 0.50; p = 0.004). IL-6 was also significantly correlated with IL-2 (ρ = 0.75; p = 1.521e-06) and IL-4 (ρ = 0.54; p = 0.002).
IL-17A displayed a statistically significant, though weaker, correlation with IFN-γ (ρ = 0.43; p = 0.016) and IL-10 (ρ = 0.43; p = 0.015). No other significant associations were detected between IFN-γ and the remaining cytokines, except for IL-17A.
Overall, the results suggest a marked trend of coordinated expression among Th1, Th2, and Th17 cytokine profiles, indicating potential co-activation of these immune response pathways in patients with acute COVID-19. The statistically significant associations observed highlight the integrated nature of cytokine-mediated inflammatory processes in this context.
3.11. Correlation Between Symptom Burden Clusters and Plasma Cytokine Levels
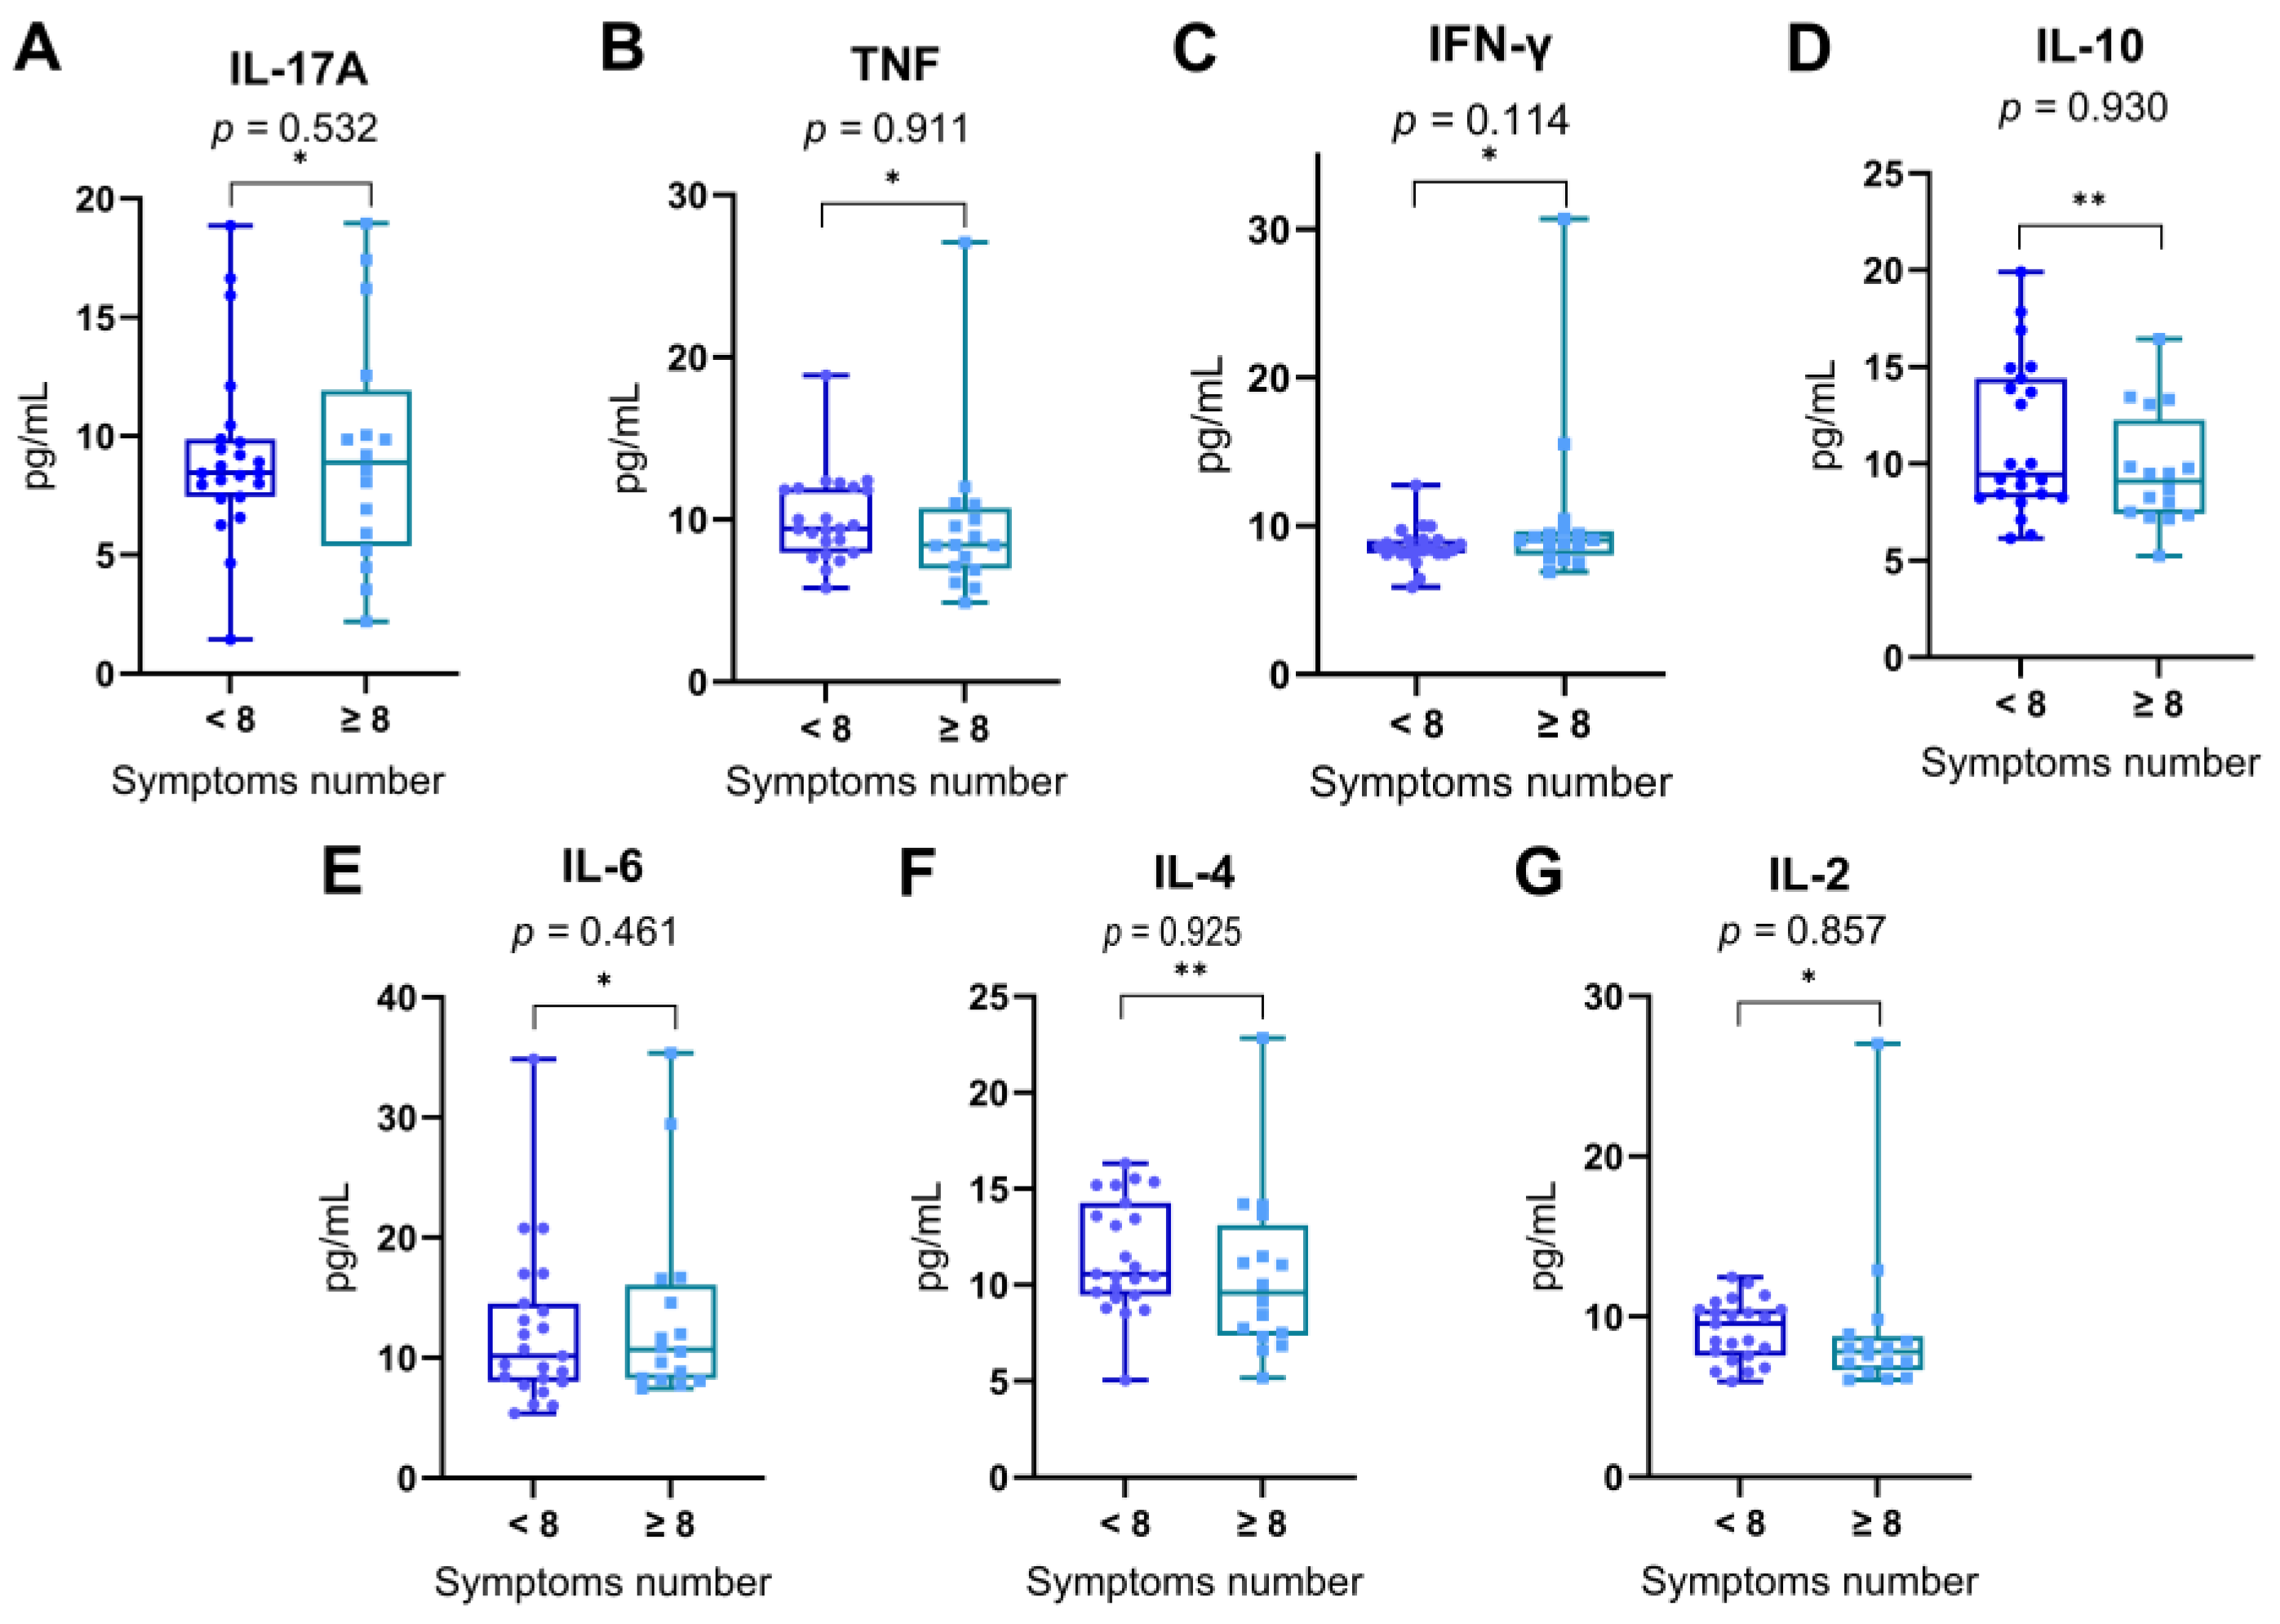
In order to explore whether the overall symptom burden during acute SARS-CoV-2 infection was associated with differential expression of cytokines, patients were stratified into two groups based on the total number of symptoms reported: those reporting fewer than eight symptoms (< 8) and those reporting eight or more symptoms (≥ 8), using the median symptom count as a threshold. Serum levels of IL-17A, TNF, IFN-γ, IL-10, IL-6, IL-4, and IL-2 were compared between these two groups (Figure 5).
Comparative analysis revealed no statistically significant differences in cytokine concentrations between individuals with lower and higher symptom counts for any of the measured cytokines: IL-17A (p = 0.532), TNF (p = 0.911), IFN-γ (p = 0.114), IL-10 (p = 0.930), IL-6 (p = 0.461), IL-4 (p = 0.925), and IL-2 (p = 0.857). Statistical significance was evaluated using the Mann–Whitney U test for non-normally distributed cytokines and the Student’s t-test for normally distributed cytokines.
These findings indicate that the systemic cytokine response does not appear to be directly modulated by the number of symptoms reported during acute infection in this cohort.
Figure 6.
Serum cytokine levels in individuals with lower or higher numbers of reported symptoms. Patients were grouped according to the total number of symptoms reported during acute SARS-CoV-2 infection: those reporting fewer than 8 symptoms (< 8) and those reporting 8 or more symptoms (≥ 8), based on the median symptom count in the cohort. Levels of (A) IL-17A, (B) TNF, (C) IFN-γ, (D) IL-10, (E) IL-6, (F) IL-4, and (G) IL-2 were compared between the two groups. Data are shown as box-and-whisker plots, representing the median, interquartile range, and full range. Statistical differences were assessed using the Mann–Whitney U test (*) for non-normally distributed variables and the Student’s t-test (**) for normally distributed variables. No statistically significant differences were observed between groups (p > 0.05 for all comparisons).
3.12. Assessment of the Influence of Comorbidities on Plasma Cytokine Concentrations
To assess whether the presence of comorbidities influenced plasma cytokine concentrations, SARS-CoV-2–positive individuals were stratified into two groups: with comorbidities (n = 16) and without comorbidities (n = 24). Data normality was assessed using the Shapiro–Wilk test, which indicated that most cytokines (IL-17A, IFN-γ, TNF, IL-6, and IL-2) exhibited non-normal distributions (p < 0.05), whereas IL-4 (p = 0.120) and IL-10 (p = 0.011) were treated as normally distributed for analytical purposes.
Accordingly, non-parametric comparisons were performed using the Mann–Whitney U test for IL-17A (U = 182, p = 0.614), IFN-γ (U = 180, p = 0.370), TNF (U = 164, p = 0.784), IL-6 (U = 154, p = 0.856), and IL-2 (U = 173, p = 0.705). Parametric comparisons using the unpaired Student’s t-test were applied to IL-10 and IL-4, which also revealed no statistically significant differences between the groups (IL-10: t = 0.862, p = 0.467; IL-4: t = 0.722, p = 0.237).
Taken together, these findings suggest that the presence of comorbidities did not significantly influence the plasma levels of any of the evaluated cytokines during acute SARS-CoV-2 infection in this study cohort.

Table 3.
Comparison of Plasma Cytokine Levels in SARS-CoV-2–Positive Individuals With and Without Comorbidities.
Table 3.
Comparison of Plasma Cytokine Levels in SARS-CoV-2–Positive Individuals With and Without Comorbidities.
| Cytokine | Comorbidity (m#) | p value | |
|---|---|---|---|
| Yes n = 16 | No n = 24 | ||
| IL-17A | 9.75 | 9.95 | 0.614a |
| TNF | 9.85 | 10.34 | 0.784a |
| IFN-y | 10.02 | 11.93 | 0.370a |
| IL-10 | 10.61 | 10.7 | 0.467b |
| IL6 | 14.00 | 12.71 | 0.856a |
| IL-4 | 9.99 | 10.9 | 0.237b |
| IL-2 | 9.35 | 10.23 | 0.705a |
n = number of individuals; m# mean cytokine dosage in pg/mL, a Mann–Whitney U test; b Student’s t-test.
3.13. Assessment of the Influence of the Number of Doses of the COVID-19 Vaccine on the Frequency of Reported Symptoms
To investigate whether the number of COVID-19 vaccine doses received was associated with the burden of symptoms reported during acute infection, participants were categorized according to the number of doses received (2 or 3) and stratified by the total number of reported symptoms (< 8 or ≥ 8), based on the median symptom count in the cohort.
A chi-square test of independence revealed a statistically significant association between vaccination status and symptom frequency (χ2 = 3.88; df = 1; p = 0.049), as presented in Figure 7. Among individuals who received three doses, a higher proportion (73.7%) reported fewer than eight symptoms, whereas only 26.3% reported eight or more symptoms. In contrast, individuals who received only two doses showed the opposite pattern, with 57.1% reporting eight or more symptoms and 42.9% reporting fewer symptoms.
The odds ratio was calculated at 0.268 (95% CI: 0.0703–1.02), suggesting that individuals who received three doses of the vaccine were less likely to report a higher symptom burden compared to those who received two doses. Although the confidence interval marginally includes 1.0, the result indicates a potential protective effect of the third vaccine dose in mitigating symptom severity during acute SARS-CoV-2 infection.
4. Discussion
The clinical and immunological characterization of this cohort of adult individuals from the Northern region of Brazil provided a comprehensive evaluation of cytokine expression patterns and their potential correlations with clinical manifestations, viral subvariants, and relevant epidemiological factors during the acute phase of COVID-19 caused by Omicron subvariants.
Initially, the clinical and demographic analysis revealed that, despite the predominance of mild to moderate disease, individuals who tested positive for SARS-CoV-2 reported a significantly higher symptom burden than those who tested negative. The most frequent symptoms—such as pharyngitis, nasal discharge, headache, and cough, were consistent with those commonly reported in the literature during Omicron waves [15,16,17]. These findings reinforce the notion that even in non-severe cases, acute COVID-19 can present with a broad symptom spectrum that overlaps with other respiratory infections, thus underlining the importance of molecular diagnosis for etiological confirmation.
Despite the high frequency of certain symptoms among infected individuals, no statistically significant associations were observed between these symptoms and the identified Omicron subvariants. This suggests that genomic differences among subvariants may not translate into clearly distinguishable clinical phenotypes [18]. This observation could be attributed to functional conservation in viral entry or replication mechanisms across subvariants, or alternatively, to host-related factors, such as immune status, vaccination history, or comorbidities—playing a more decisive role in shaping the clinical outcome [19,20]. Additionally, the absence of statistical associations may also reflect the limited sample size and fragmentation of frequencies across subvariants. Nonetheless, the relatively homogeneous distribution of dominant symptoms across genetically distinct variants supports the hypothesis of a stable clinical profile within the Omicron lineage, despite its considerable evolutionary diversity [21,22].
Importantly, the immunological analysis comparing SARS-CoV-2 positive, and negative individuals demonstrated significantly elevated levels of pro-inflammatory cytokines in the infected group, particularly IFN-γ, TNF, IL-10, IL-2, and IL-4. These results are in agreement with previous studies that reported Th1-dominant activation and variable engagement of Th2 and Th17 pathways during SARS-CoV-2 infection [23,24]. The absence of statistically significant differences in IL-6 and IL-17A may suggest a more controlled inflammatory response in Omicron infections compared to earlier variants, consistent with the clinical observation of reduced severity during Omicron-dominant waves [25,26,27].
Interestingly, the correlation analysis between specific symptoms and cytokine levels did not yield strong associations. While an initial link was observed between altered taste and IFN-γ, this finding did not remain significant after multiple comparison correction. These findings suggest that, within the context of Omicron, clinical symptomatology may not be tightly linked to discrete cytokine levels, but rather result from complex immunological interactions shaped by prior immunity, viral load, and individual variability [28,29,30].
The analysis of a potential association between serum cytokine levels and the identified SARS-CoV-2 subvariants represented a key step in understanding the immunological dynamics induced by infection. In this study, individuals who tested positive for SARS-CoV-2 were stratified according to the Omicron subvariants identified through viral genotyping, with the aim of exploring whether genomic differences among these subvariants could influence the systemic inflammatory profile. The exclusive predominance of Omicron subvariants in our cohort is explained by the temporal window of sample collection, which took place between late 2021 and early 2022—a period during which Omicron had become the globally dominant variant, effectively replacing previous variants of concern, such as Delta [20,31,32].
Despite the genomic diversity observed among these subvariants, the results indicated no statistically significant differences in the plasma concentrations of the cytokines analyzed. These findings suggest that, in the clinical context of mild to moderate acute infections caused by Omicron, the systemic pro-inflammatory immune profile remains relatively conserved across circulating subvariants. This supports the hypothesis of a more uniform immune response within this lineage’s evolutionary trajectory [33,34].
Of particular note was the comparative analysis of cytokine levels between individuals infected with older (BA.1-lineage) and more recent (BA.4/BA.5-lineage) subvariants. This revealed significantly higher levels of IL-2, IL-4, IL-6, and IL-10 among those infected with earlier Omicron subvariants. These differences may reflect a more robust immune activation during early Omicron waves, potentially due to lower population-level immunity or a different set of spike mutations [20,35]. Conversely, BA.4 and BA.5 are known to possess enhanced immune escape capacity, which may attenuate cytokine induction or modulate the inflammatory kinetics [36,37].
The cytokine correlation matrix revealed a robust positive association between IL-10, TNF, IL-2, and IL-6, indicating a potentially synchronized activation of both pro-inflammatory and immunomodulatory pathways during acute SARS-CoV-2 infection. This pattern suggests that, rather than an uncontrolled inflammatory surge, the immune response in these individuals—infected predominantly by Omicron subvariants—was characterized by a dynamic interplay between effector and regulatory cytokines [38,39,40,41].
IL-6 and TNF are well-established mediators of acute inflammation, typically upregulated in response to viral infection and often associated with disease severity in COVID-19. Their concurrent positive correlation with IL-10, a key anti-inflammatory cytokine involved in dampening excessive immune activation and preserving tissue integrity, may reflect an active immunoregulatory mechanism aimed at containing local and systemic damage. Similarly, the observed alignment with IL-2, a cytokine pivotal for T cell proliferation and immune homeostasis, reinforces the notion of a coordinated immune response rather than a dysregulated cytokine storm [42,43,44,45].
Such a balanced inflammatory environment is particularly relevant in the context of Omicron-dominant infections, which have been epidemiologically associated with milder clinical presentations compared to earlier variants such as Delta. This coordinated cytokine expression may underlie the relative clinical stability observed in most individuals during this period, offering immunological insight into the mechanisms that contributed to reduced hospitalization rates despite high transmission levels [46,47,48].
Additional analyses of host-related variables demonstrated that the presence of comorbidities was not significantly associated with altered cytokine levels in this cohort. Meanwhile, the number of COVID-19 vaccine doses received showed a significant inverse association with the frequency of reported symptoms, suggesting that booster doses may help attenuate not only disease severity but also overall symptom burden, an effect supported by recent literature on vaccine-induced immunomodulation [49,50,51,52].
Together, these findings provide a detailed view of how different Omicron subvariants interact with the host immune system in real-world settings. Despite the absence of a strong association between variant identity and clinical or immunological profiles, the study highlights the importance of monitoring cytokine responses and symptom expression across different waves of infection.
The relevance of these data extends to current and emerging variants such as XBB.1.5, EG.5, and JN.1, which are direct descendants of Omicron. While these newer variants exhibit enhanced immune evasion and transmissibility, they likely maintain conserved patterns of immune activation, particularly within the Th1, Th2, and Th17 axes. Understanding the cytokine dynamics elicited by early Omicron subvariants, as presented here, provides a useful framework for interpreting immunopathological responses to future variants [53,54,55,56,57].
Lastly, although the current study offers valuable insights, it is essential to acknowledge limitations such as sample size, cross-sectional design, and the absence of direct functional assays. Future studies incorporating longitudinal designs, larger cohorts, and functional immune profiling are warranted to further elucidate the trajectory and consequences of SARS-CoV-2–induced immune responses in diverse populations.
5. Conclusions
This study offers a comprehensive immunological and clinical assessment of individuals infected with SARS-CoV-2 Omicron subvariants during the acute phase of COVID-19. Our findings highlight a high burden of upper respiratory symptoms, consistent with the clinical profile of Omicron-dominant waves, and demonstrate elevated concentrations of Th1-, Th2-, and Th17-associated cytokines in infected individuals compared to negative individuals. Despite the genetic diversity among subvariants, symptom frequency and cytokine levels were not significantly associated with specific lineages, suggesting a conserved clinical and immunological response pattern within the Omicron lineage.
Importantly, we observed a significant correlation between vaccine dose number and reduced symptom burden, supporting the protective immunomodulatory role of booster immunization. Additionally, a comparative analysis of cytokine profiles between individuals infected with early versus later Omicron subvariants revealed distinct inflammatory patterns, reinforcing the importance of monitoring viral evolution and its immunological implications.
Together, these findings contribute to a growing body of evidence regarding the immune response to Omicron and provide a valuable reference for interpreting responses to currently circulating and future SARS-CoV-2 variants. They underscore the need for ongoing genomic and immunological surveillance, particularly in underrepresented populations, to guide public health strategies and inform targeted interventions.
Author Contributions
All authors contributed to the research development. All authors contributed to the development of the research. M.A.B wrote and reviewed the article and data analysis; I.R.B, L.R.C.C, M.R.M.C, E.T.P.J, J.A.M.S, I.B.C, and P.F.R.N performed collected data and biological samples; R.C.M.S. performed the clinical analysis of the volunteer patients in the research. V.F.B.C, D.S-O and H.R.R curated the documents of the collected data. I.B.C, A.C.P.S and J.A.L.N performed the serum cytokine dosage; I.K.M.L, A.M.S.C, M.C.d.S and P.YN performed the molecular tests for viral detection of the SARS-CoV-2 agent; A.M.S.C, M.C.d.S, D.M.V and W.D.C.J performed the identification of virus variants; I.B-C and L.C.S participated in the supervision and review of the paper; M.A.B and I.B-C designed the research. I.B-C was involved in the conceptualization and administration of the research. All authors have read and agreed to the published version of the manuscript.
Funding
This research received no external funding
Institutional Review Board Statement
The study was conducted in accordance with the Declaration of Helsinki and approved by the Research Etics Committee of the Evandro Chagas Institute under protocol number CAAE: 36869120.3.0000.0019 and conducted in accordance with Resolution No. 466/2012 of the Brazilian National Health Council (CNS) for research involving human subjects. All participants signed an informed consent form.
Informed Consent Statement
Written informed consent was obtained from all subjects involved in the study.
Data Availability Statement
The authors declare that the research was conducted in the absence of any commercial or financial relationships that could be construed as a potential conflict of interest.
Acknowledgments
The authors would like to thank all the volunteers who agreed to participate in the study, the National Council for Scientific and Technological Development (CNPq), the UNIMED hospital group and the Evandro Chagas Institute.
Conflicts of Interest
The authors declare that the research was conducted in the absence of any commercial or financial relationships that could be construed as a potential conflict of interest.
Abbreviations
The following abbreviations are used in this manuscript:
| BA.1, BA.4, BA.5 | Specific subvariants of the SARS-CoV-2 Omicron variant |
| BD | Becton, Dickinson and Company |
| CBA | Cytometric Bead Array |
| CI | Confidence Interval |
| COVID-19 | Coronavirus Diseade 2019 |
| EDTA | Ethylenediaminetetraacetic acid |
| GISAID | Global Initiative on Sharing All Influenza Dara |
| IFN- γ | Interferon gamma |
| IL | Interleukin |
| IQR | Interquartile Range |
| JASP | Jeffreys’s Amazing Statistics Program |
| PANGOLIN | Phylogenetic Assignment of Named Global Outbreak Lineages |
| RT-qPCR | Reverse Transcripton Quantitative Polymerase Chain Reaction |
| SARS-CoV-2 | Severe Acute Respiratory Syndrome Coronavirus 2 |
| SD | Standard Deriation |
| Th1 | T helper type 1 |
| Th17 | T helper type 17 |
| Th2 | T helper type |
| TNF | Tumor Necrosis Factor |
| VOC | Variant of Concern |
References
- Gusev, E.; Sarapultsev, A.; Solomatina, L.; Chereshnev, V. SARS-CoV-2-Specific Immune Response and the Pathogenesis of COVID-19. Int. J. Mol. Sci. 2022, 23, 1716. [Google Scholar] [CrossRef]
- Wu, Y.; Chen, Y. Reduction and Functional Exhaustion of T Cells in Patients With Coronavirus Disease 2019 (COVID-19). Front. Immunol. 2020, 11. [Google Scholar] [CrossRef] [PubMed]
- Zhu, J.; Yamane, H.; Paul, W.E. Differentiation of Effector CD4 T Cell Populations. Annu. Rev. Immunol. 2010, 28, 445–489. [Google Scholar] [CrossRef] [PubMed]
- Mescher, M.F.; Curtsinger, J.M.; Agarwal, P.; Casey, K.A.; Gerner, M.; Hammerbeck, C.D.; Popescu, F.; Xiao, Z. Signals Required for Programming Effector and Memory Development by CD8+ T Cells. Immunol. Rev. 2006, 211, 81–92. [Google Scholar] [CrossRef]
- Gil-Etayo, F.J.; Suàrez-Fernández, P.; Cabrera-Marante, O.; Arroyo, D.; Garcinuño, S.; Naranjo, L.; Pleguezuelo, D.E.; Allende, L.M.; Mancebo, E.; Lalueza, A.; et al. T-Helper Cell Subset Response Is a Determining Factor in COVID-19 Progression. Front. Cell. Infect. Microbiol. 2021, 11, 624483. [Google Scholar] [CrossRef]
- Hu, B.; Huang, S.; Yin, L. The Cytokine Storm and COVID-19. J. Med. Virol. 2021, 93, 250–256. [Google Scholar] [CrossRef]
- Huang, C.; Wang, Y.; Li, X.; Ren, L.; Zhao, J.; Hu, Y.; Zhang, L.; Fan, G.; Xu, J.; Gu, X.; et al. Clinical Features of Patients Infected with 2019 Novel Coronavirus in Wuhan, China. The Lancet 2020, 395, 497–506. [Google Scholar] [CrossRef]
- Zhu, Z.; Cai, T.; Fan, L.; Lou, K.; Hua, X.; Huang, Z.; Gao, G. Clinical Value of Immune-Inflammatory Parameters to Assess the Severity of Coronavirus Disease 2019. Int. J. Infect. Dis. 2020, 95, 332–339. [Google Scholar] [CrossRef]
- Del Valle, D.M.; Kim-Schulze, S.; Huang, H.-H.; Beckmann, N.D.; Nirenberg, S.; Wang, B.; Lavin, Y.; Swartz, T.H.; Madduri, D.; Stock, A.; et al. An Inflammatory Cytokine Signature Predicts COVID-19 Severity and Survival. Nat. Med. 2020, 26, 1636–1643. [Google Scholar] [CrossRef]
- Carabelli, A.M.; Peacock, T.P.; Thorne, L.G.; Harvey, W.T.; Hughes, J.; COVID-19 Genomics UK Consortium; De Silva, T.I.; Peacock, S.J.; Barclay, W.S.; De Silva, T.I.; et al. SARS-CoV-2 Variant Biology: Immune Escape, Transmission and Fitness. Nat. Rev. Microbiol. 2023. [Google Scholar] [CrossRef]
- Bazargan, M.; Elahi, R.; Esmaeilzadeh, A. OMICRON: Virology, Immunopathogenesis, and Laboratory Diagnosis. J. Gene Med. 2022, 24, e3435. [Google Scholar] [CrossRef]
- Parsons, R.J.; Acharya, P. Evolution of the SARS-CoV-2 Omicron Spike. Cell Rep. 2023, 42, 113444. [Google Scholar] [CrossRef]
- Shrestha, L.B.; Foster, C.; Rawlinson, W.; Tedla, N.; Bull, R.A. Evolution of the SARS-CoV-2 Omicron Variants BA.1 to BA.5: Implications for Immune Escape and Transmission. Rev. Med. Virol. 2022, 32, e2381. [Google Scholar] [CrossRef] [PubMed]
- Jacobsen, H.; Cobos Jiménez, V.; Sitaras, I.; Bar-Zeev, N.; Čičin-Šain, L.; Higdon, M.M.; Deloria-Knoll, M. Post-Vaccination T Cell Immunity to Omicron. Front. Immunol. 2022, 13, 944713. [Google Scholar] [CrossRef] [PubMed]
- Han, Y.; Guo, J.; Li, X.; Zhong, Z. Differences in Clinical Characteristics between Coronavirus Disease 2019 (COVID-19) and Influenza: A Systematic Review and Meta-Analysis. Npj Prim. Care Respir. Med. 2025, 35, 8. [Google Scholar] [CrossRef] [PubMed]
- Menni, C.; Valdes, A.M.; Polidori, L.; Antonelli, M.; Penamakuri, S.; Nogal, A.; Louca, P.; May, A.; Figueiredo, J.C.; Hu, C.; et al. Symptom Prevalence, Duration, and Risk of Hospital Admission in Individuals Infected with SARS-CoV-2 during Periods of Omicron and Delta Variant Dominance: A Prospective Observational Study from the ZOE COVID Study. The Lancet 2022, 399, 1618–1624. [Google Scholar] [CrossRef]
- Radhakrishnan, N.; Liu, M.; Idowu, B.; Bansari, A.; Rathi, K.; Magar, S.; Mundhra, L.; Sarmiento, J.; Ghaffar, U.; Kattan, J.; et al. Comparison of the Clinical Characteristics of SARS-CoV-2 Delta (B.1.617.2) and Omicron (B.1.1.529) Infected Patients from a Single Hospitalist Service. BMC Infect. Dis. 2023, 23, 747. [Google Scholar] [CrossRef]
- De Prost, N.; Audureau, E.; Préau, S.; Favory, R.; Guigon, A.; Bay, P.; Heming, N.; Gault, E.; Pham, T.; Chaghouri, A.; et al. Clinical Phenotypes and Outcomes Associated with SARS-CoV-2 Omicron Variants BA.2, BA.5 and BQ.1.1 in Critically Ill Patients with COVID-19: A Prospective, Multicenter Cohort Study. Intensive Care Med. Exp. 2023, 11, 48. [Google Scholar] [CrossRef]
- Chavda, V.; Bezbaruah, R.; Deka, K.; Nongrang, L.; Kalita, T. The Delta and Omicron Variants of SARS-CoV-2: What We Know So Far. Vaccines 2022, 10, 1926. [Google Scholar] [CrossRef]
- Morris, C.P. Omicron Subvariants: Clinical, Laboratory, and Cell Culture Characterization.
- Gomes, B.B.M.; Ferreira, N.N.; Garibaldi, P.M.M.; Dias, C.F.S.D.L.; Silva, L.N.; Almeida, M.A.A.L.D.S.; De Moraes, G.R.; Covas, D.T.; Kashima, S.; Calado, R.T.; et al. Impact of SARS-CoV-2 Variants on COVID-19 Symptomatology and Severity during Five Waves. Heliyon 2024, 10, e40113. [Google Scholar] [CrossRef]
- Kwok, K.O.; Wei, W.I.; Mcneil, E.B.; Tang, A.; Tang, J.W.-T.; Wong, S.Y.S.; Yeoh, E.K. Comparative Analysis of Symptom Profile and Risk of Death Associated with Infection by SARS-CoV-2 and Its Variants in Hong Kong. J. Med. Virol. 2024, 96, e29326. [Google Scholar] [CrossRef]
- Martonik, D.; Parfieniuk-Kowerda, A.; Rogalska, M.; Flisiak, R. The Role of Th17 Response in COVID-19. Cells 2021, 10, 1550. [Google Scholar] [CrossRef] [PubMed]
- Silva, M.J.A.; Ribeiro, L.R.; Lima, K.V.B.; Lima, L.N.G.C. Adaptive Immunity to SARS-CoV-2 Infection: A Systematic Review. Front. Immunol. 2022, 13, 1001198. [Google Scholar] [CrossRef]
- Liu, W.; Huang, Z.; Xiao, J.; Wu, Y.; Xia, N.; Yuan, Q. Evolution of the SARS-CoV-2 Omicron Variants: Genetic Impact on Viral Fitness. Viruses 2024, 16, 184. [Google Scholar] [CrossRef] [PubMed]
- Chatterjee, S.; Bhattacharya, M.; Nag, S.; Dhama, K.; Chakraborty, C. A Detailed Overview of SARS-CoV-2 Omicron: Its Sub-Variants, Mutations and Pathophysiology, Clinical Characteristics, Immunological Landscape, Immune Escape, and Therapies. Viruses 2023, 15, 167. [Google Scholar] [CrossRef] [PubMed]
- Huang, J.; Xia, M.; Liu, R.; Wang, S.; Duan, X.; Peng, J.; Li, E.; Zhou, Y.; Li, C.; Zhang, Q.; et al. Comparative Analysis of Clinical and Immunological Profiles across Omicron BA.5.2 Subvariants Using next-Generation Sequencing in a Chinese Cohort. Front. Cell. Infect. Microbiol. 2023, 13, 1288914. [Google Scholar] [CrossRef]
- Lee, H.K.; Knabl, L.; Walter, M.; Knabl, L.; Dai, Y.; Füßl, M.; Caf, Y.; Jeller, C.; Knabl, P.; Obermoser, M.; et al. Prior Vaccination Exceeds Prior Infection in Eliciting Innate and Humoral Immune Responses in Omicron Infected Outpatients. Front. Immunol. 2022, 13, 916686. [Google Scholar] [CrossRef]
- Yu, S.; Lin, Y.; Li, Y.; Chen, S.; Zhou, L.; Song, H.; Yang, C.; Zhang, H.; Zhou, J.; Sun, S.; et al. Systemic Immune Profiling of Omicron-Infected Subjects Inoculated with Different Doses of Inactivated Virus Vaccine. Cell 2023, 186, 4615–4631.e16. [Google Scholar] [CrossRef]
- Wang, H.; Liu, C.; Xie, X.; Niu, M.; Wang, Y.; Cheng, X.; Zhang, B.; Zhang, D.; Liu, M.; Sun, R.; et al. Multi-Omics Blood Atlas Reveals Unique Features of Immune and Platelet Responses to SARS-CoV-2 Omicron Breakthrough Infection. Immunity 2023, 56, 1410–1428.e8. [Google Scholar] [CrossRef]
- Wang, W.; Jin, Q.; Liu, R.; Zeng, W.; Zhu, P.; Li, T.; Wang, T.; Xiang, H.; Zhang, H.; Chen, Q.; et al. Virological Characteristics of SARS-CoV-2 Omicron BA.5.2.48. Front. Immunol. 2024, 15, 1427284. [Google Scholar] [CrossRef]
- Taboada, B.I.; Zárate, S.; García-López, R.; Muñoz-Medina, J.E.; Gómez-Gil, B.; Herrera-Estrella, A.; Sanchez-Flores, A.; Salas-Lais, A.G.; Roche, B.; Martínez-Morales, G.; et al. SARS-CoV-2 Omicron Variants BA.4 and BA.5 Dominated the Fifth COVID-19 Epidemiological Wave in Mexico. Microb. Genomics 2023, 9. [Google Scholar] [CrossRef]
- Guo, Y.; Han, J.; Zhang, Y.; He, J.; Yu, W.; Zhang, X.; Wu, J.; Zhang, S.; Kong, Y.; Guo, Y.; et al. SARS-CoV-2 Omicron Variant: Epidemiological Features, Biological Characteristics, and Clinical Significance. Front. Immunol. 2022, 13, 877101. [Google Scholar] [CrossRef]
- Carabelli, A.M.; Peacock, T.P.; Thorne, L.G.; Harvey, W.T.; Hughes, J.; COVID-19 Genomics UK Consortium; De Silva, T.I.; Peacock, S.J.; Barclay, W.S.; De Silva, T.I.; et al. SARS-CoV-2 Variant Biology: Immune Escape, Transmission and Fitness. Nat. Rev. Microbiol. 2023. [Google Scholar] [CrossRef] [PubMed]
- Naveed Siddiqui, A.; Musharaf, I.; Gulumbe, B.H. The JN.1 Variant of COVID-19: Immune Evasion, Transmissibility, and Implications for Global Health. Ther. Adv. Infect. Dis. 2025, 12, 20499361251314763. [Google Scholar] [CrossRef] [PubMed]
- Gjorgjievska, M.; Mehandziska, S.; Stajkovska, A.; Pecioska-Dokuzovska, S.; Dimovska, A.; Durmish, I.; Ismail, S.; Pavlovska, T.; Stojchevska, A.; Amedi, H.; et al. Case Report: Omicron BA.2 Subvariant of SARS-CoV-2 Outcompetes BA.1 in Two Co-Infection Cases. Front. Genet. 2022, 13, 892682. [Google Scholar] [CrossRef] [PubMed]
- Sarkar, A.; Omar, S.; Alshareef, A.; Fanous, K.; Sarker, S.; Alroobi, H.; Zamir, F.; Yousef, M.; Zakaria, D. The Relative Prevalence of the Omicron Variant within SARS-CoV-2 Infected Cohorts in Different Countries: A Systematic Review. Hum. Vaccines Immunother. 2023, 19, 2212568. [Google Scholar] [CrossRef]
- Castro-Trujillo, S.; Castro-Meneses, J.; Rojas, M.C.; Castro-Amaya, M.; Lastra, G.; Narváez, C.F. Regulatory Cytokines Modulate Early Isotype-Specific Response Associated with COVID-19 Survival. Front. Immunol. 2025, 16, 1543626. [Google Scholar] [CrossRef]
- Hasanvand, A. COVID-19 and the Role of Cytokines in This Disease. Inflammopharmacology 2022, 30, 789–798. [Google Scholar] [CrossRef]
- Ghaffarpour, S.; Ghazanfari, T.; Ardestani, S.K.; Naghizadeh, M.M.; Vaez Mahdavi, M.R.; Salehi, M.; Majd, A.M.M.; Rashidi, A.; Chenary, M.R.; Mostafazadeh, A.; et al. Cytokine Profiles Dynamics in COVID-19 Patients: A Longitudinal Analysis of Disease Severity and Outcomes. Sci. Rep. 2025, 15, 14209. [Google Scholar] [CrossRef]
- Li, X.; Pakanati, V.; Liu, C.; Wang, T.; Morelli, D.; Korpak, A.; Baraff, A.; Isaacs, S.N.; Vittor, A.; Chang, K.-M.; et al. Peripheral Blood Cytokine Profiles Predict the Severity of SARS-CoV-2 Infection: An EPIC3 Study Analysis. BMC Infect. Dis. 2025, 25, 677. [Google Scholar] [CrossRef]
- Niedźwiedzka-Rystwej, P.; Majchrzak, A.; Kurkowska, S.; Małkowska, P.; Sierawska, O.; Hrynkiewicz, R.; Parczewski, M. Immune Signature of COVID-19: In-Depth Reasons and Consequences of the Cytokine Storm. Int. J. Mol. Sci. 2022, 23, 4545. [Google Scholar] [CrossRef]
- Najafi-Fard, S.; Petruccioli, E.; Farroni, C.; Petrone, L.; Vanini, V.; Cuzzi, G.; Salmi, A.; Altera, A.M.G.; Navarra, A.; Alonzi, T.; et al. Evaluation of the Immunomodulatory Effects of Interleukin-10 on Peripheral Blood Immune Cells of COVID-19 Patients: Implication for COVID-19 Therapy. Front. Immunol. 2022, 13, 984098. [Google Scholar] [CrossRef] [PubMed]
- Rarani, F.Z.; Rashidi, B.; Jafari Najaf Abadi, M.H.; Hamblin, M.R.; Reza Hashemian, S.M.; Mirzaei, H. Cytokines and microRNAs in SARS-CoV-2: What Do We Know? Mol. Ther.—Nucleic Acids 2022, 29, 219–242. [Google Scholar] [CrossRef] [PubMed]
- Qudus, M.S.; Tian, M.; Sirajuddin, S.; Liu, S.; Afaq, U.; Wali, M.; Liu, J.; Pan, P.; Luo, Z.; Zhang, Q.; et al. The Roles of Critical Pro-inflammatory Cytokines in the Drive of Cytokine Storm during SARS-CoV-2 Infection. J. Med. Virol. 2023, 95, e28751. [Google Scholar] [CrossRef] [PubMed]
- Wu, W.; Dietze, K.K.; Gibbert, K.; Lang, K.S.; Trilling, M.; Yan, H.; Wu, J.; Yang, D.; Lu, M.; Roggendorf, M.; et al. TLR Ligand Induced IL-6 Counter-Regulates the Anti-Viral CD8+ T Cell Response during an Acute Retrovirus Infection. Sci. Rep. 2015, 5, 10501. [Google Scholar] [CrossRef]
- Sun, J.; Dodd, H.; Moser, E.K.; Sharma, R.; Braciale, T.J. CD4+ T Cell Help and Innate-Derived IL-27 Induce Blimp-1-Dependent IL-10 Production by Antiviral CTLs. Nat. Immunol. 2011, 12, 327–334. [Google Scholar] [CrossRef]
- Karnowski, A.; Chevrier, S.; Belz, G.T.; Mount, A.; Emslie, D.; D’Costa, K.; Tarlinton, D.M.; Kallies, A.; Corcoran, L.M. B and T Cells Collaborate in Antiviral Responses via IL-6, IL-21, and Transcriptional Activator and Coactivator, Oct2 and OBF-1. J. Exp. Med. 2012, 209, 2049–2064. [Google Scholar] [CrossRef]
- Zhang, H.; Yang, P.; Gu, X.; Sun, Y.; Zhang, R.; Zhang, D.; Zhang, J.; Wang, Y.; Ma, C.; Liu, M.; et al. Health Outcomes One Year after Omicron Infection among 12,789 Adults: A Community-Based Cross-Sectional Study. Lancet Reg. Health—West. Pac. 2025, 56, 101507. [Google Scholar] [CrossRef]
- You, L.; Zhang, L.; Ouyang, S.; Gao, B.; Li, Y.; Li, J.; Wu, N.; Wang, H.; Sun, S.; Li, J.; et al. Multiple Infections with Omicron Variants Increase Breadth and Potency of Omicron-Specific Neutralizing Antibodies. Cell Discov. 2025, 11, 49. [Google Scholar] [CrossRef]
- McMahon, W.C.; Kwatra, G.; Nunes, M.C.; Izu, A.; Koen, A.L.; Greffrath, J.; Shalekoff, S.; Tiemessen, C.T.; Shinde, V.; Bennett, C.; et al. T-Cell Responses Induced by SARS-CoV-2 Index-Virus Nanoparticle Protein Vaccine to the Ancestral and Omicron Variants 6 Months Following Primary Vaccination. Commun. Med. 2025, 5, 220. [Google Scholar] [CrossRef]
- Fantini, J.; Yahi, N.; Colson, P.; Chahinian, H.; La Scola, B.; Raoult, D. The Puzzling Mutational Landscape of the SARS-2-variant Omicron. J. Med. Virol. 2022, 94, 2019–2025. [Google Scholar] [CrossRef] [PubMed]
- Buchan, S.A.; Chung, H.; Brown, K.A.; Austin, P.C.; Fell, D.B.; Gubbay, J.B.; Nasreen, S.; Schwartz, K.L.; Sundaram, M.E.; Tadrous, M.; et al. Estimated Effectiveness of COVID-19 Vaccines Against Omicron or Delta Symptomatic Infection and Severe Outcomes. JAMA Netw. Open 2022, 5, e2232760. [Google Scholar] [CrossRef]
- Ma, K.C.; Shirk, P.; Lambrou, A.S.; Hassell, N.; Zheng, X.; Payne, A.B.; Ali, A.R.; Batra, D.; Caravas, J.; Chau, R.; et al. Genomic Surveillance for SARS-CoV-2 Variants: Circulation of Omicron Lineages — United States, January 2022–May 2023. MMWR Morb. Mortal. Wkly. Rep. 2023, 72, 651–656. [Google Scholar] [CrossRef] [PubMed]
- Beraud, G.; Bouetard, L.; Civljak, R.; Michon, J.; Tulek, N.; Lejeune, S.; Millot, R.; Garchet-Beaudron, A.; Lefebvre, M.; Velikov, P.; et al. Impact of Vaccination on the Presence and Severity of Symptoms in Hospitalized Patients with an Infection of the Omicron Variant (B.1.1.529) of the SARS-CoV-2 (Subvariant BA.1). Clin. Microbiol. Infect. 2023, 29, 642–650. [Google Scholar] [CrossRef]
- Batra, L.; Saxena, D.; Poddar, T.; Zahin, M.; Amraotkar, A.; Bezold, M.M.; Kitterman, K.T.; Deitz, K.A.; Lasnik, A.B.; Keith, R.J.; et al. Mucosal and Serum Neutralization Immune Responses Elicited by COVID-19 mRNA Vaccination in Vaccinated and Breakthrough-Infection Individuals: A Longitudinal Study from Louisville Cohort. Vaccines 2025, 13, 559. [Google Scholar] [CrossRef]
- Huang, C.; Hu, X.; Wang, D.; Gong, R.; Wang, Q.; Ren, F.; Wu, Y.; Chen, J.; Xiong, X.; Li, H.; et al. Multi-Cohort Study on Cytokine and Chemokine Profiles in the Progression of COVID-19. Sci. Rep. 2024, 14, 10324. [Google Scholar] [CrossRef]
Figure 1.
(A) Difference in the mean number of reported symptoms between RT-qPCR–positive and –negative individuals for SARS-CoV-2 (Mann-Whitney U test, p = 0.0096). (B) Frequency of reports for 16 investigated symptoms among the positive individuals. Symptoms marked with an asterisk (*) showed a statistically significant distribution (p < 0.05), being more frequently reported in the overall sample. (C) Distribution of Omicron subvariants identified by genomic sequencing among the SARS-CoV-2–positive individuals (n = 40). (D–G) Frequency of the most frequently reported symptoms (pharyngitis, cough, nasal discharge, and headache) distributed across subvariants, with corresponding p-values from Fisher’s exact test indicating no significant association between subvariants and symptom occurrence.
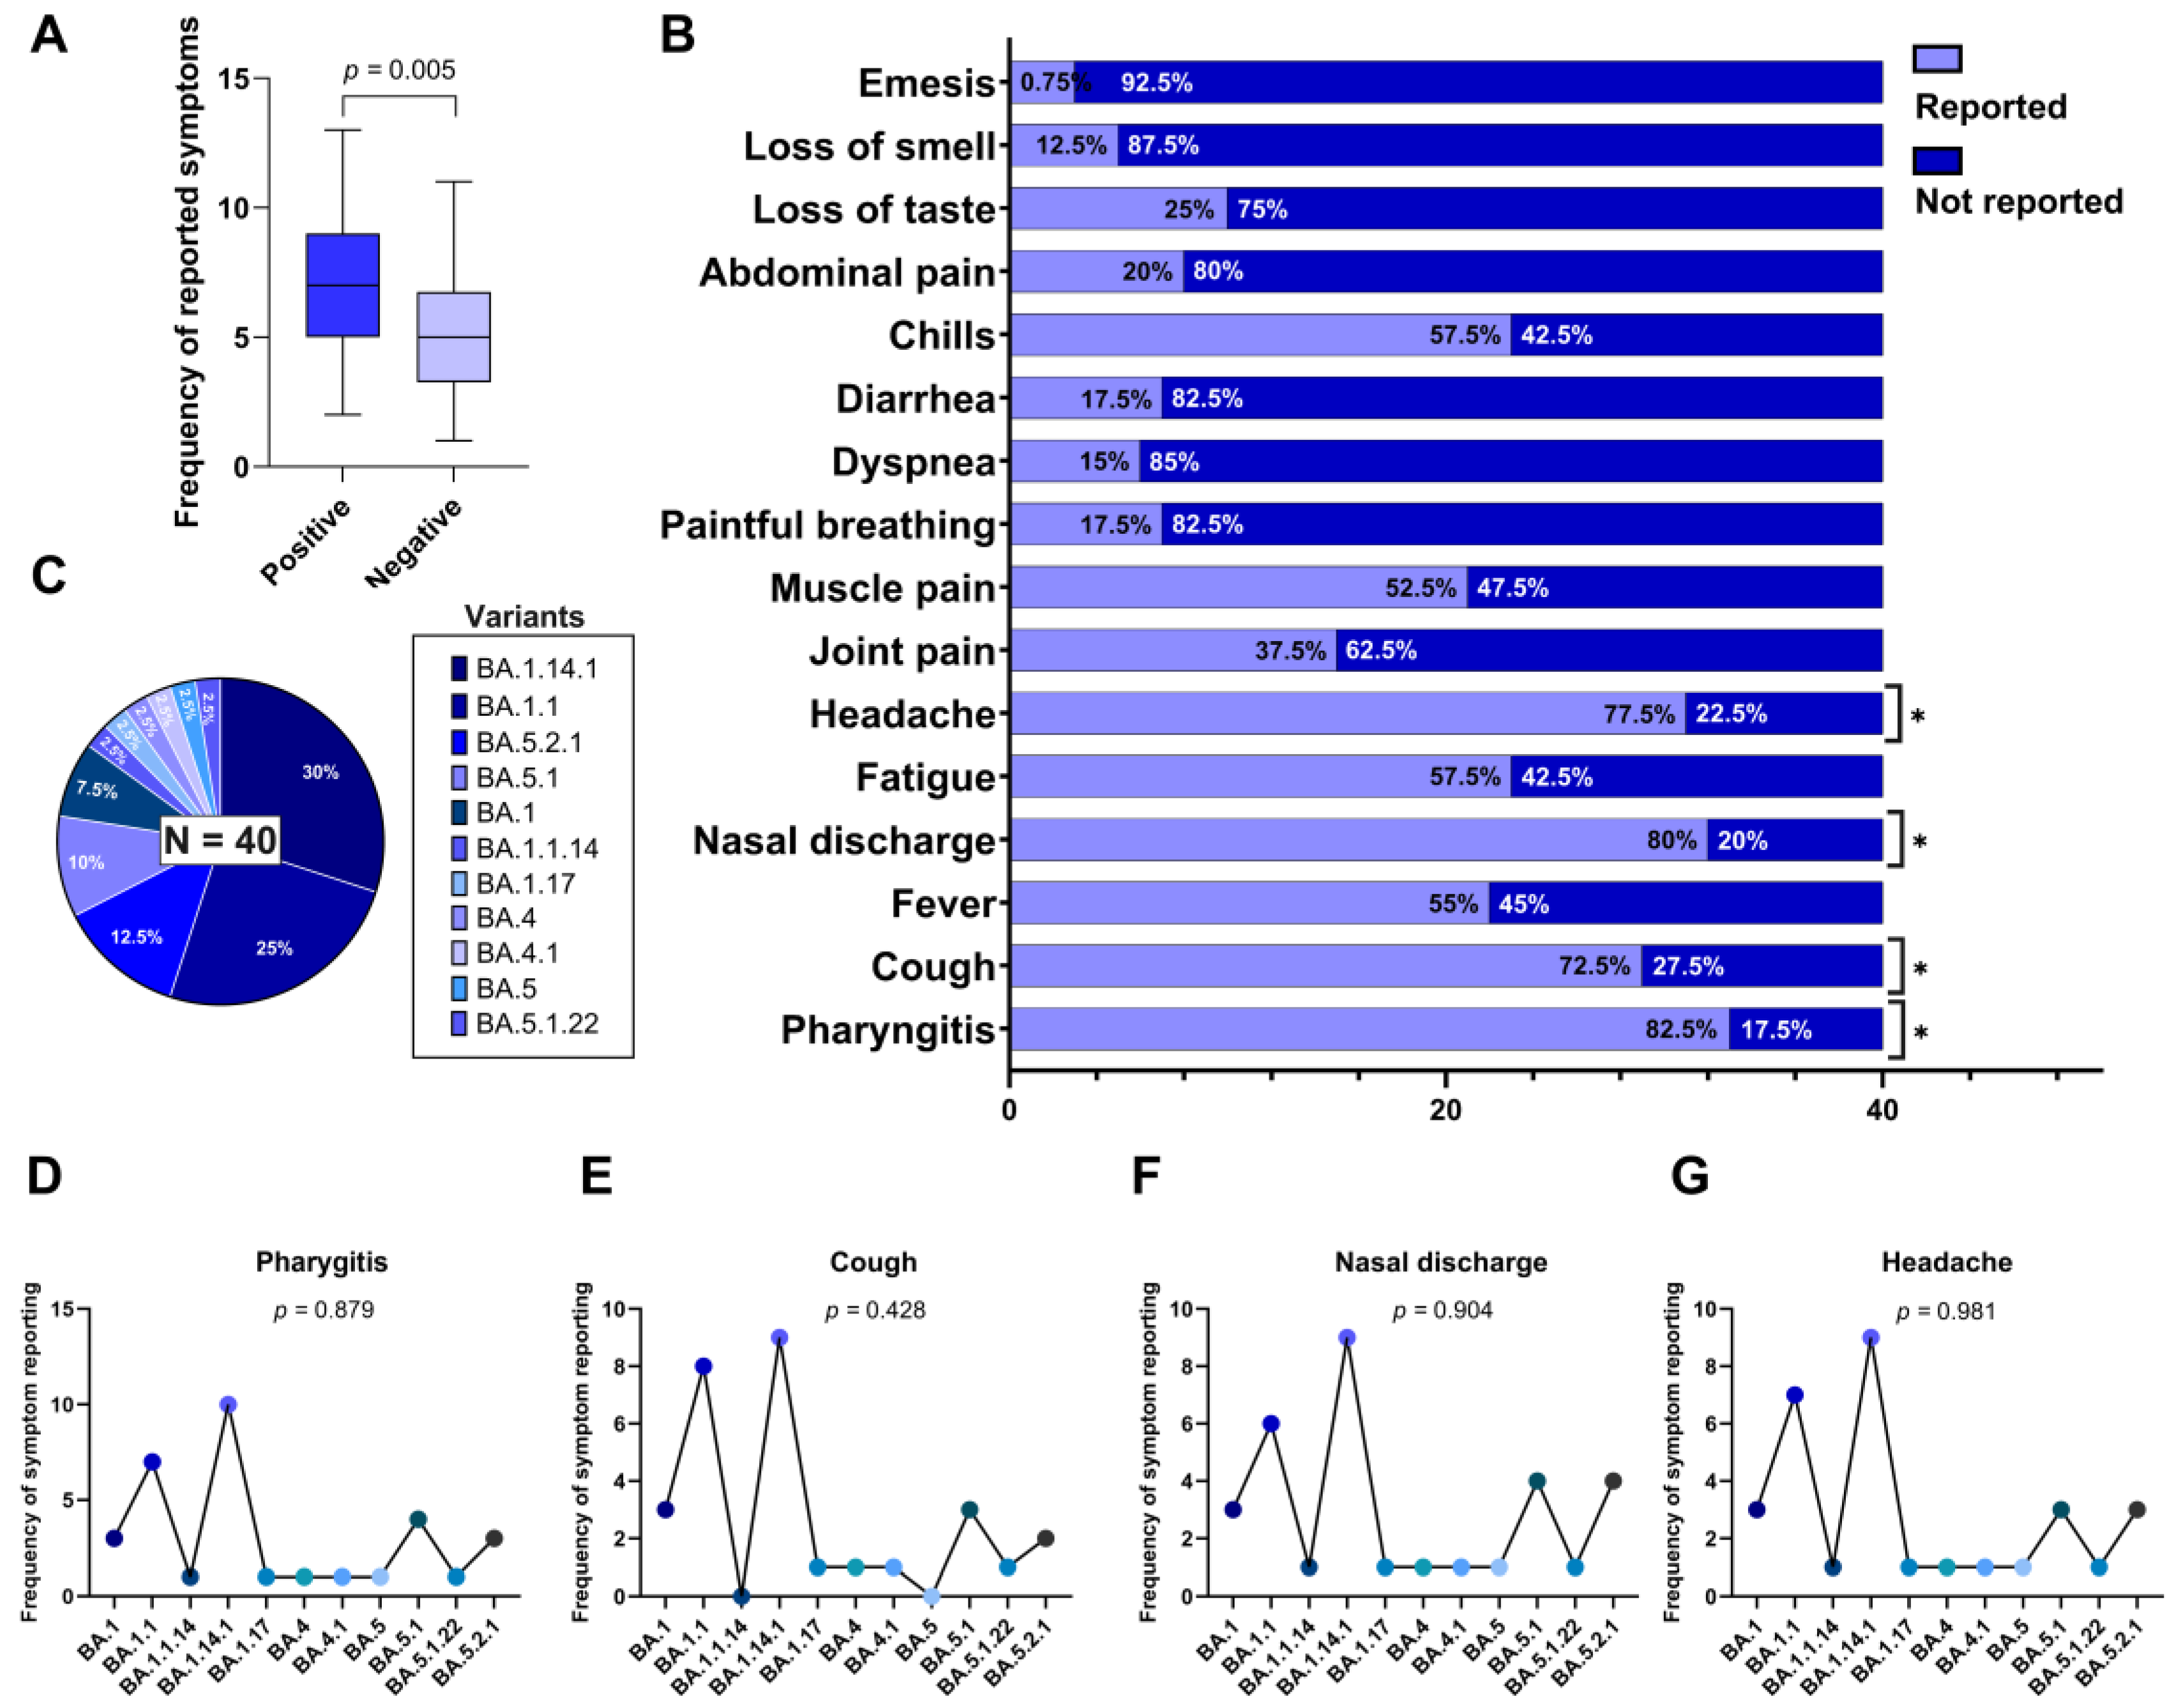
Figure 2.
Cytokine levels (pg/mL) were measured for IL-17A (A), IFN-γ (B), TNF (C), IL-6 (D), IL-2 (E), IL-4 (F), and IL-10 (G). Each panel combines violin plots (representing data distribution density), boxplots (indicating median, interquartile range, and range), and individual data points (jittered for visibility). Groups are divided by RT-qPCR result: SARS-CoV-2–positive (top, dark blue) and SARS-CoV-2–negative (bottom, light blue). Statistical comparisons were performed using the non-parametric Mann–Whitney U test (p-values displayed on each panel). Statistically significant differences (p < 0.05) were observed for IFN-γ, TNF, IL-2, IL-4, and IL-10.
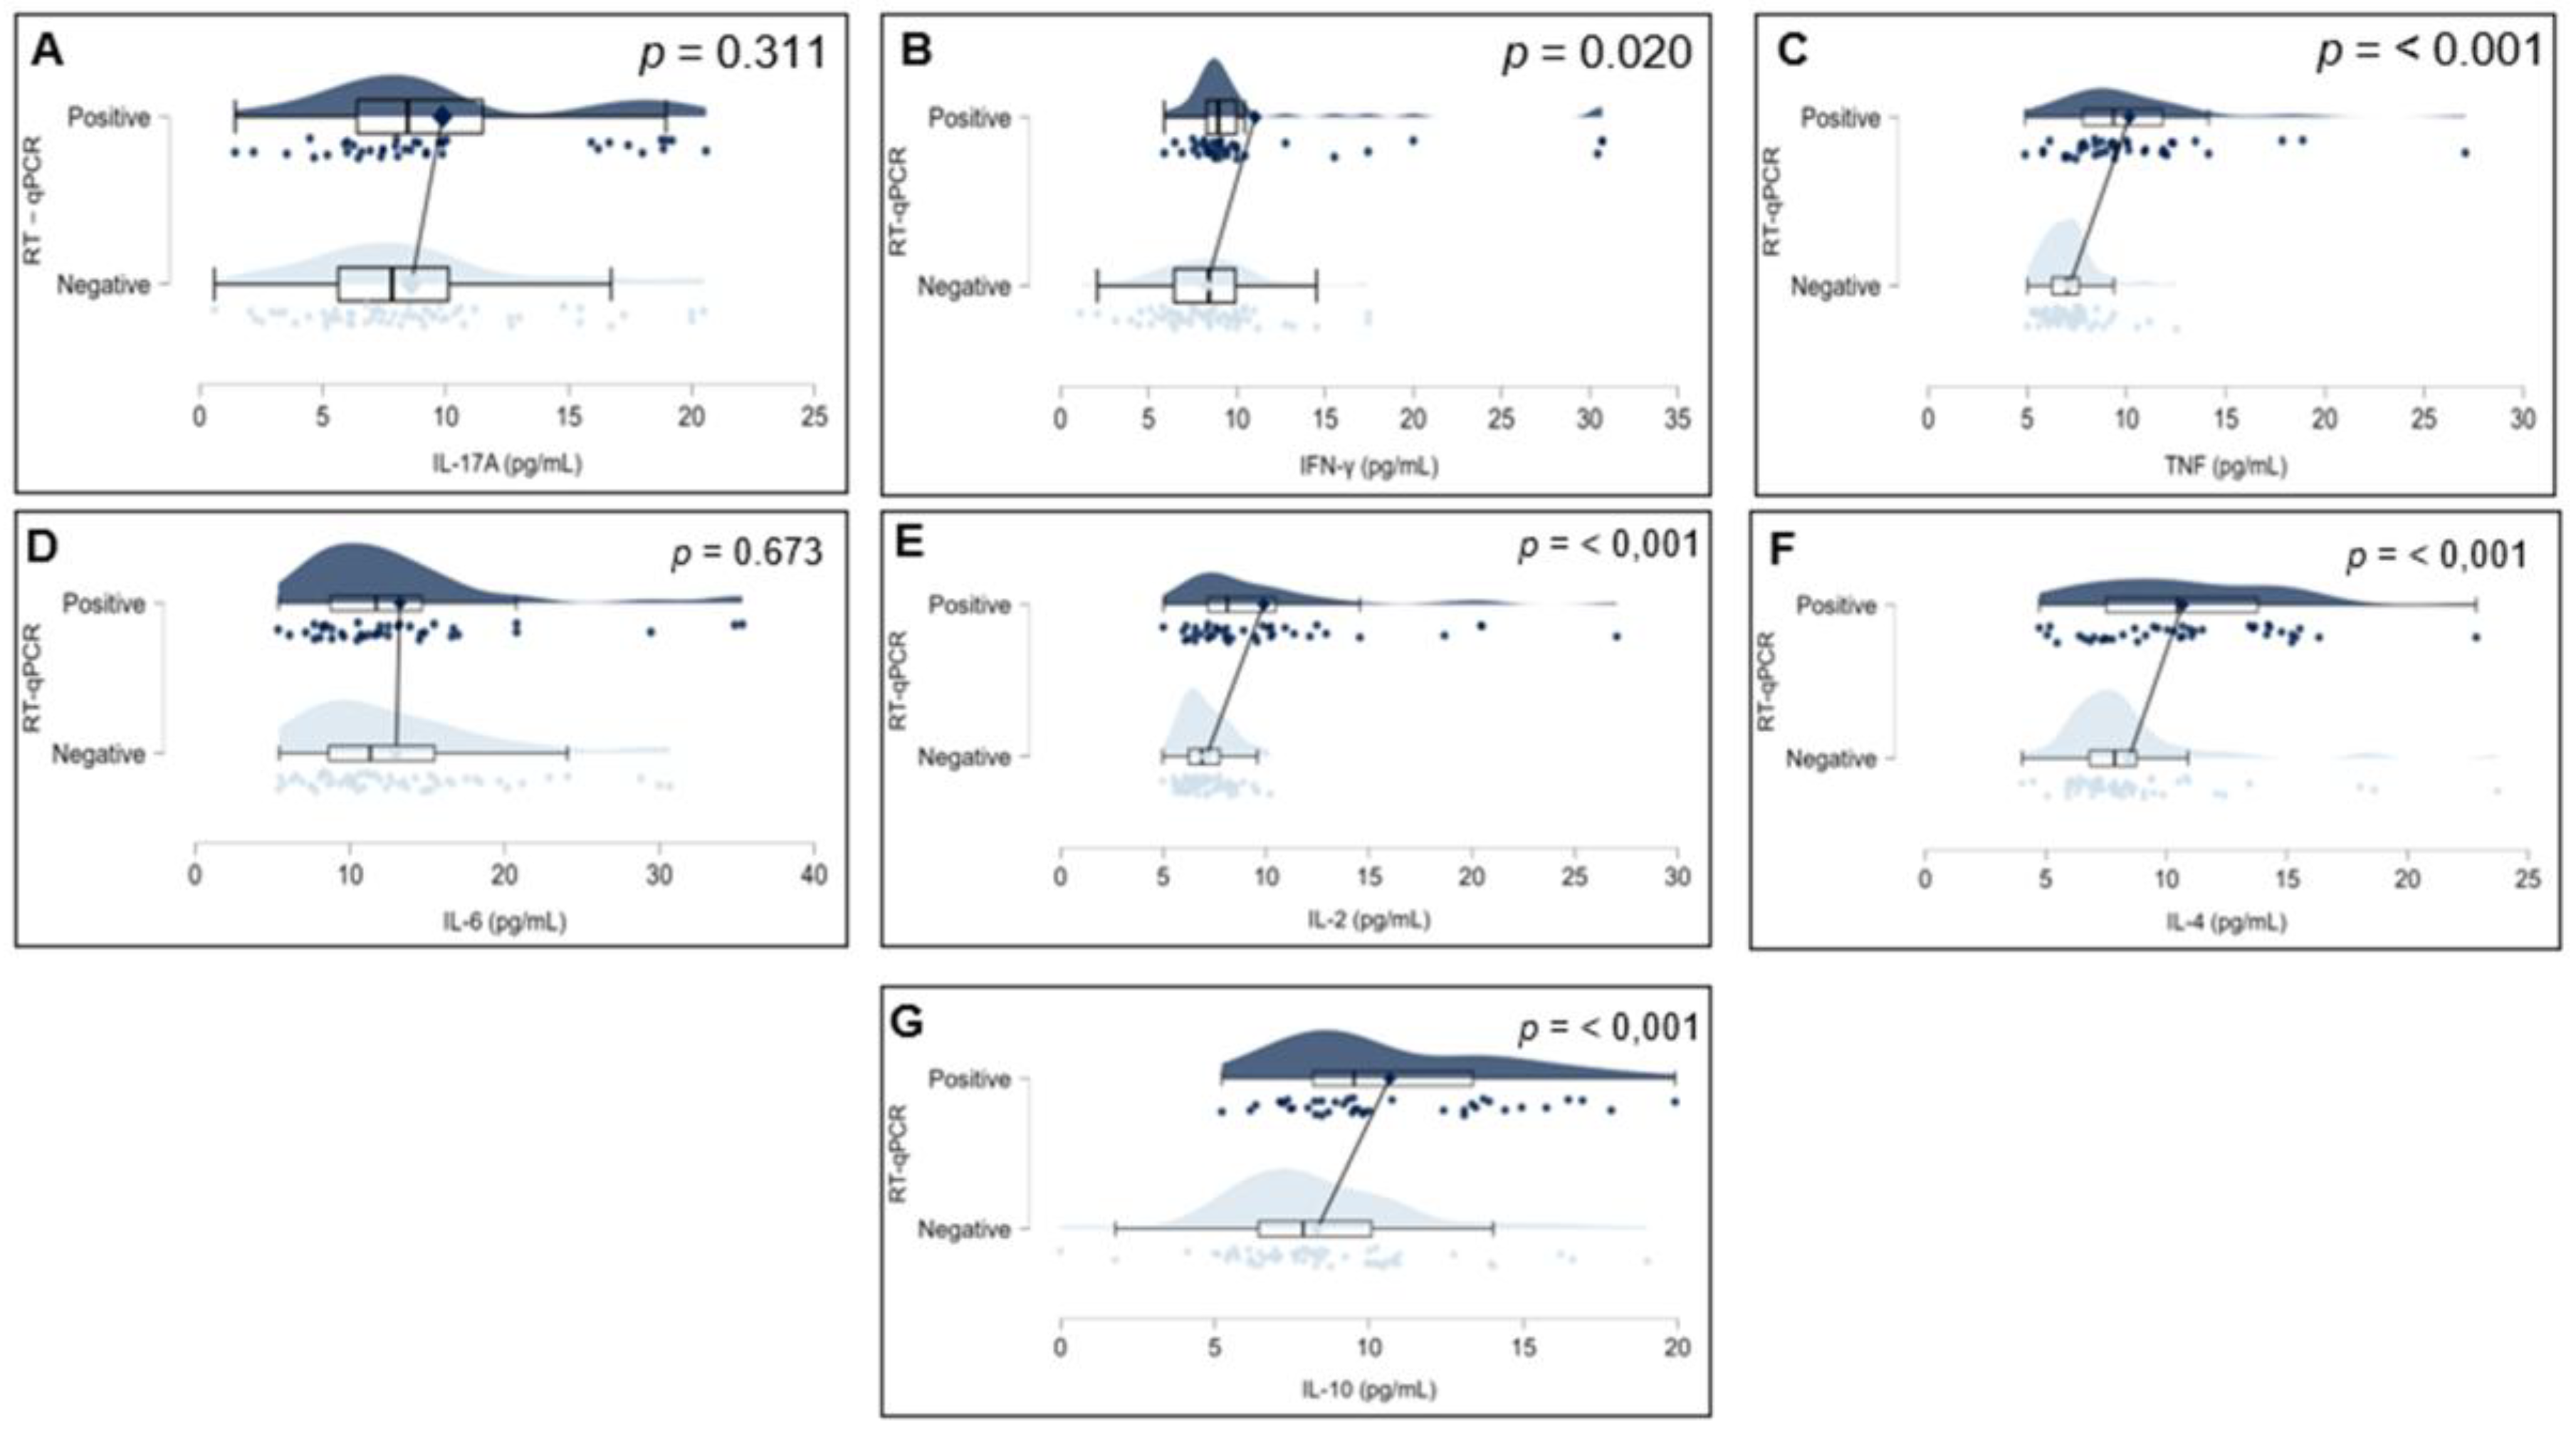
Figure 3.
Distribution of serum cytokine levels in RT-qPCR–positive individuals.Boxplots represent the concentration (pg/mL) of IL-17A, IFN-γ, TNF, IL-10, IL-6, IL-4, and IL-2 across different Omicron subvariants. The central lines indicate the median, boxes represent the interquartile range (IQR), and whiskers denote minimum and maximum values. Shapiro–Wilk test p-values are shown above each cytokine, indicating deviations from normality in most distributions (p < 0.05), except for IL-10 and IL-4, which did not significantly depart from normality. Notably, the variants on the X-axis are arranged in chronological order, from the earliest to the most recently emerged subvariant (left to right), enabling visual analysis of temporal patterns in cytokine expression. Associations between cytokine levels and viral subvariants were statistically evaluated using the Kruskal–Wallis test, appropriate for nonparametric comparisons among multiple independent groups.
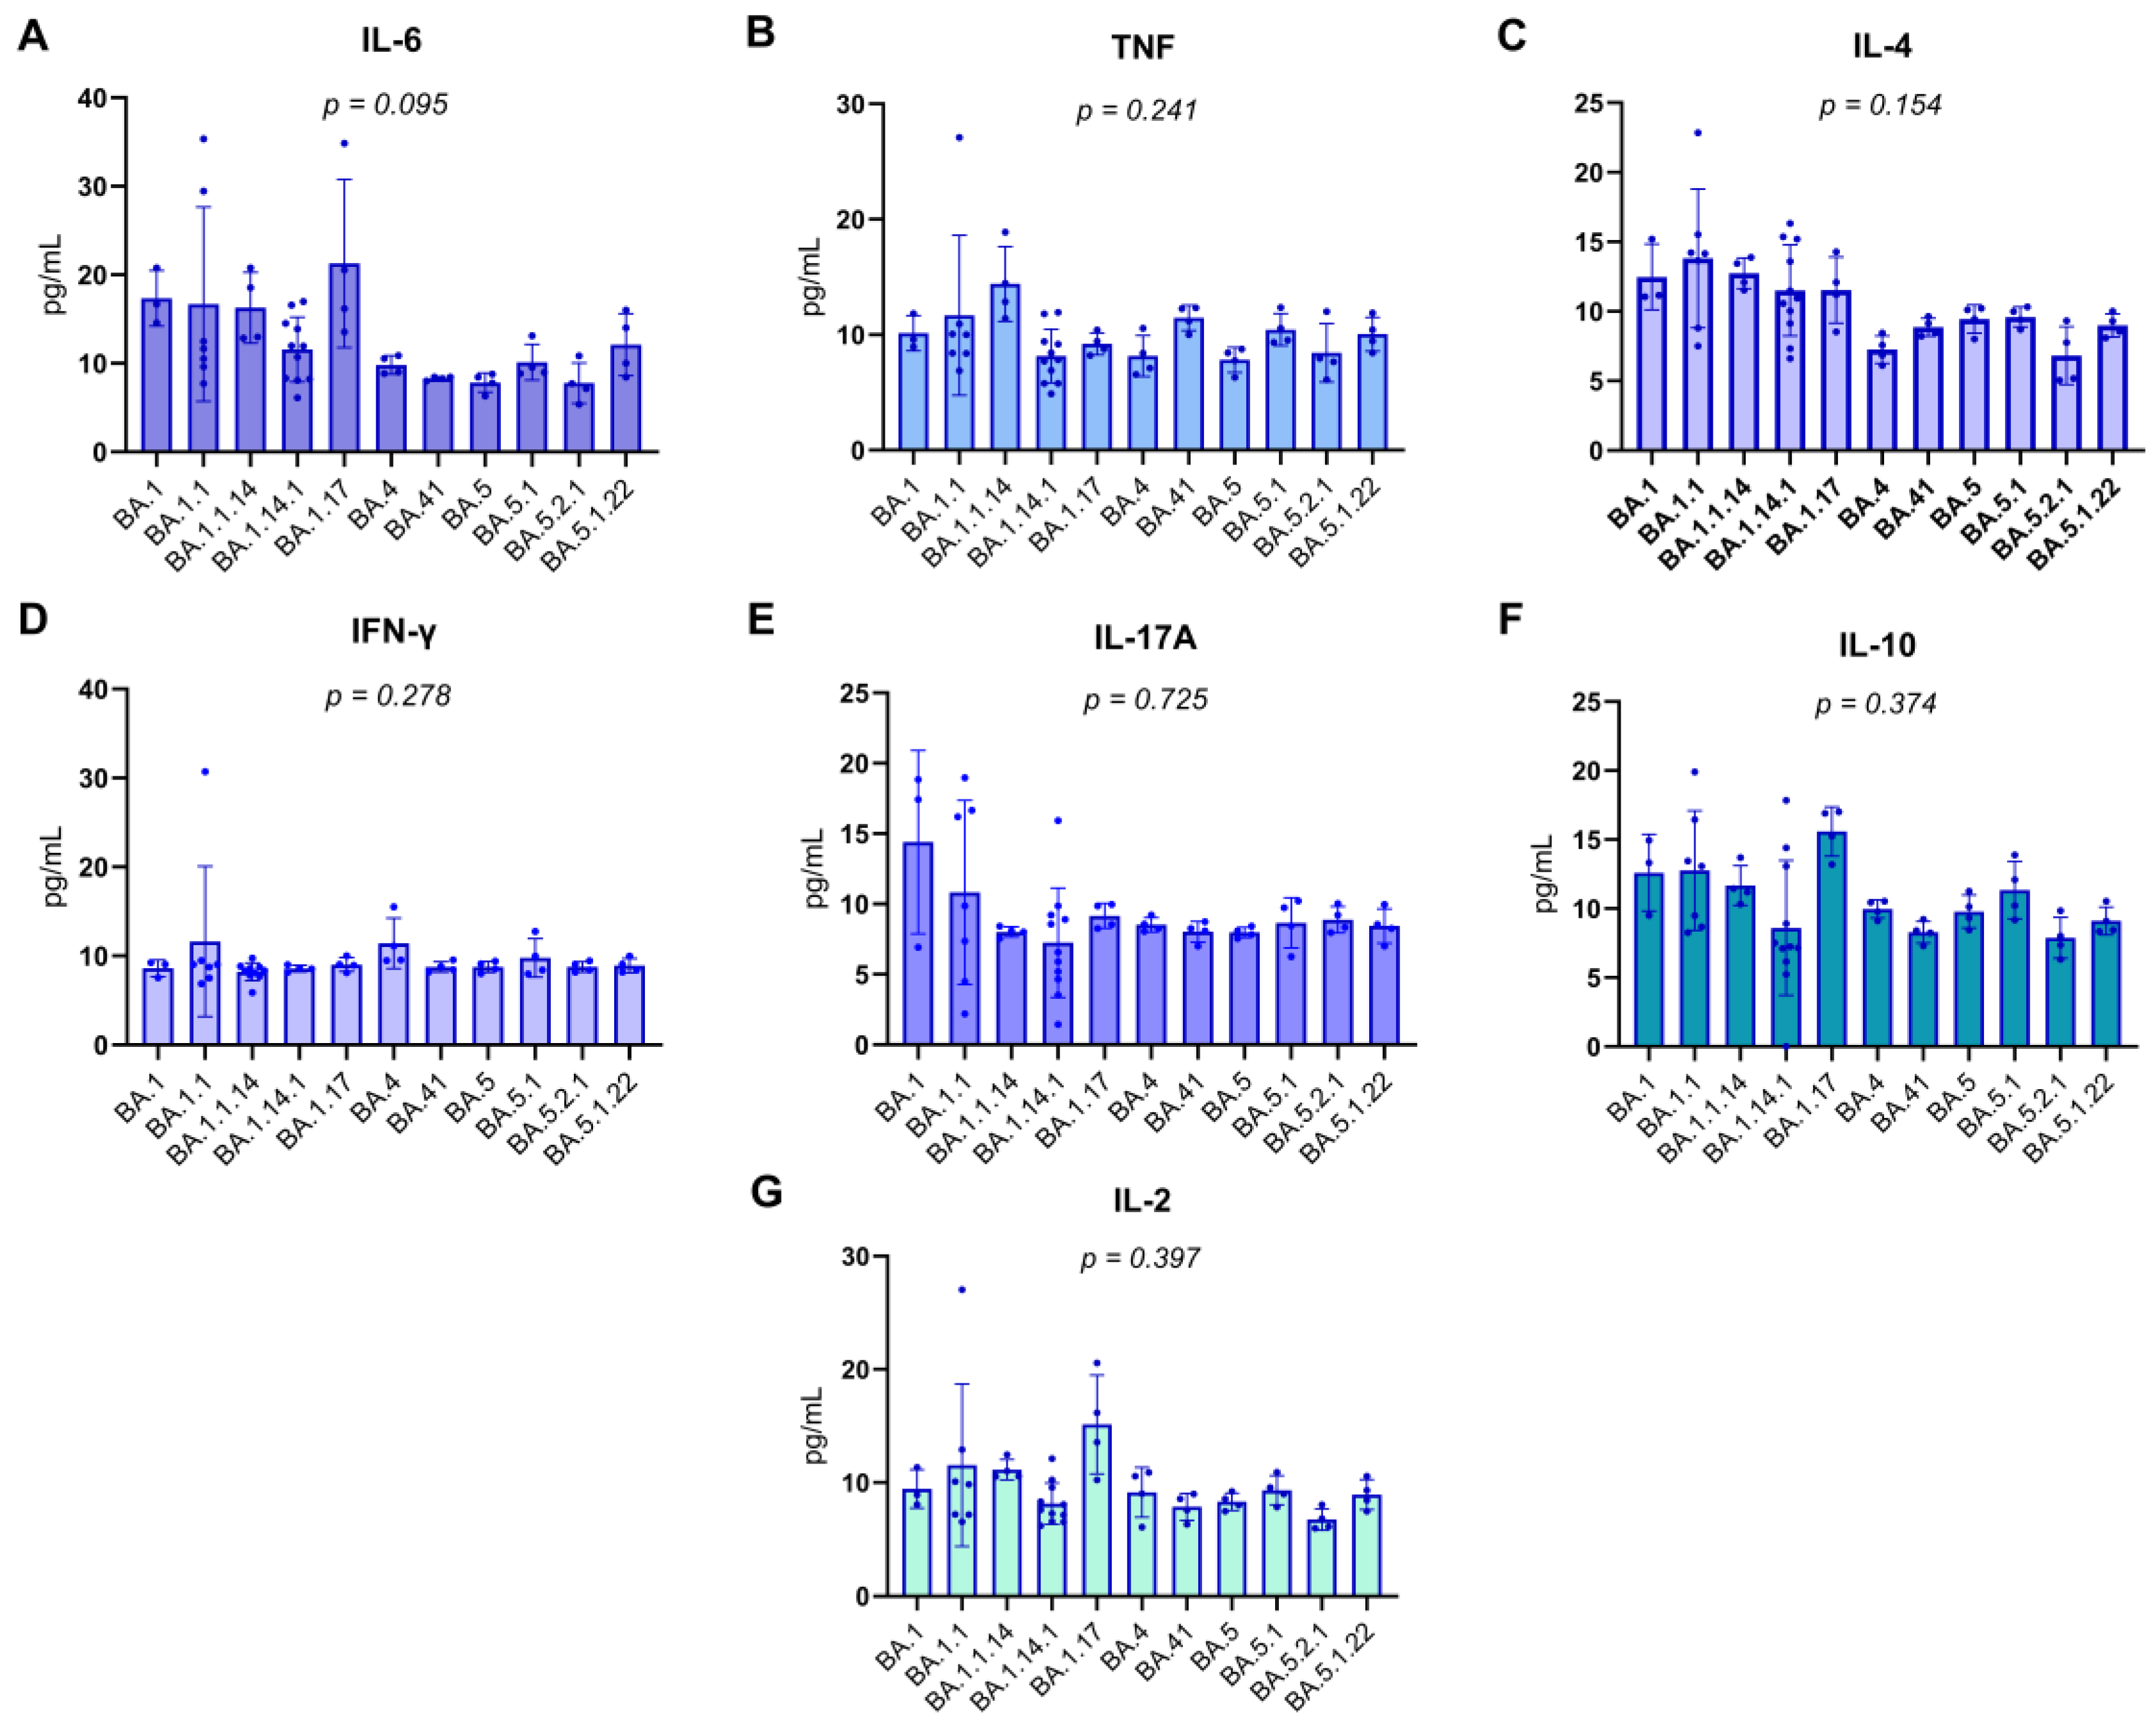
Figure 4.
Comparison of serum cytokine concentrations between individuals infected with early (Cluster 1) and late (Cluster 2) Omicron subvariants. Cluster 1 comprises individuals infected with Omicron BA.1-lineage variants (BA.1, BA.1.1, BA.1.14.1, BA.1.1.14, and BA.1.17), while Cluster 2 includes individuals infected with BA.4/BA.5-lineage variants (BA.4, BA.4.1, BA.5, BA.5.1, BA.5.2.1, and BA.5.1.22). Serum cytokine levels (pg/mL) were measured for IL-17A, TNF, IFN-γ, IL-2, IL-4, IL-6, and IL-10. Boxplots represent the median, interquartile range (IQR), and full data range. Statistical comparisons between groups were performed using the Mann–Whitney U test (*) for cytokines with non-normal distribution and the Student’s t-test (**) for those with normal distribution, based on the Shapiro–Wilk test of normality. A p-value < 0.05 was considered statistically significant (#).
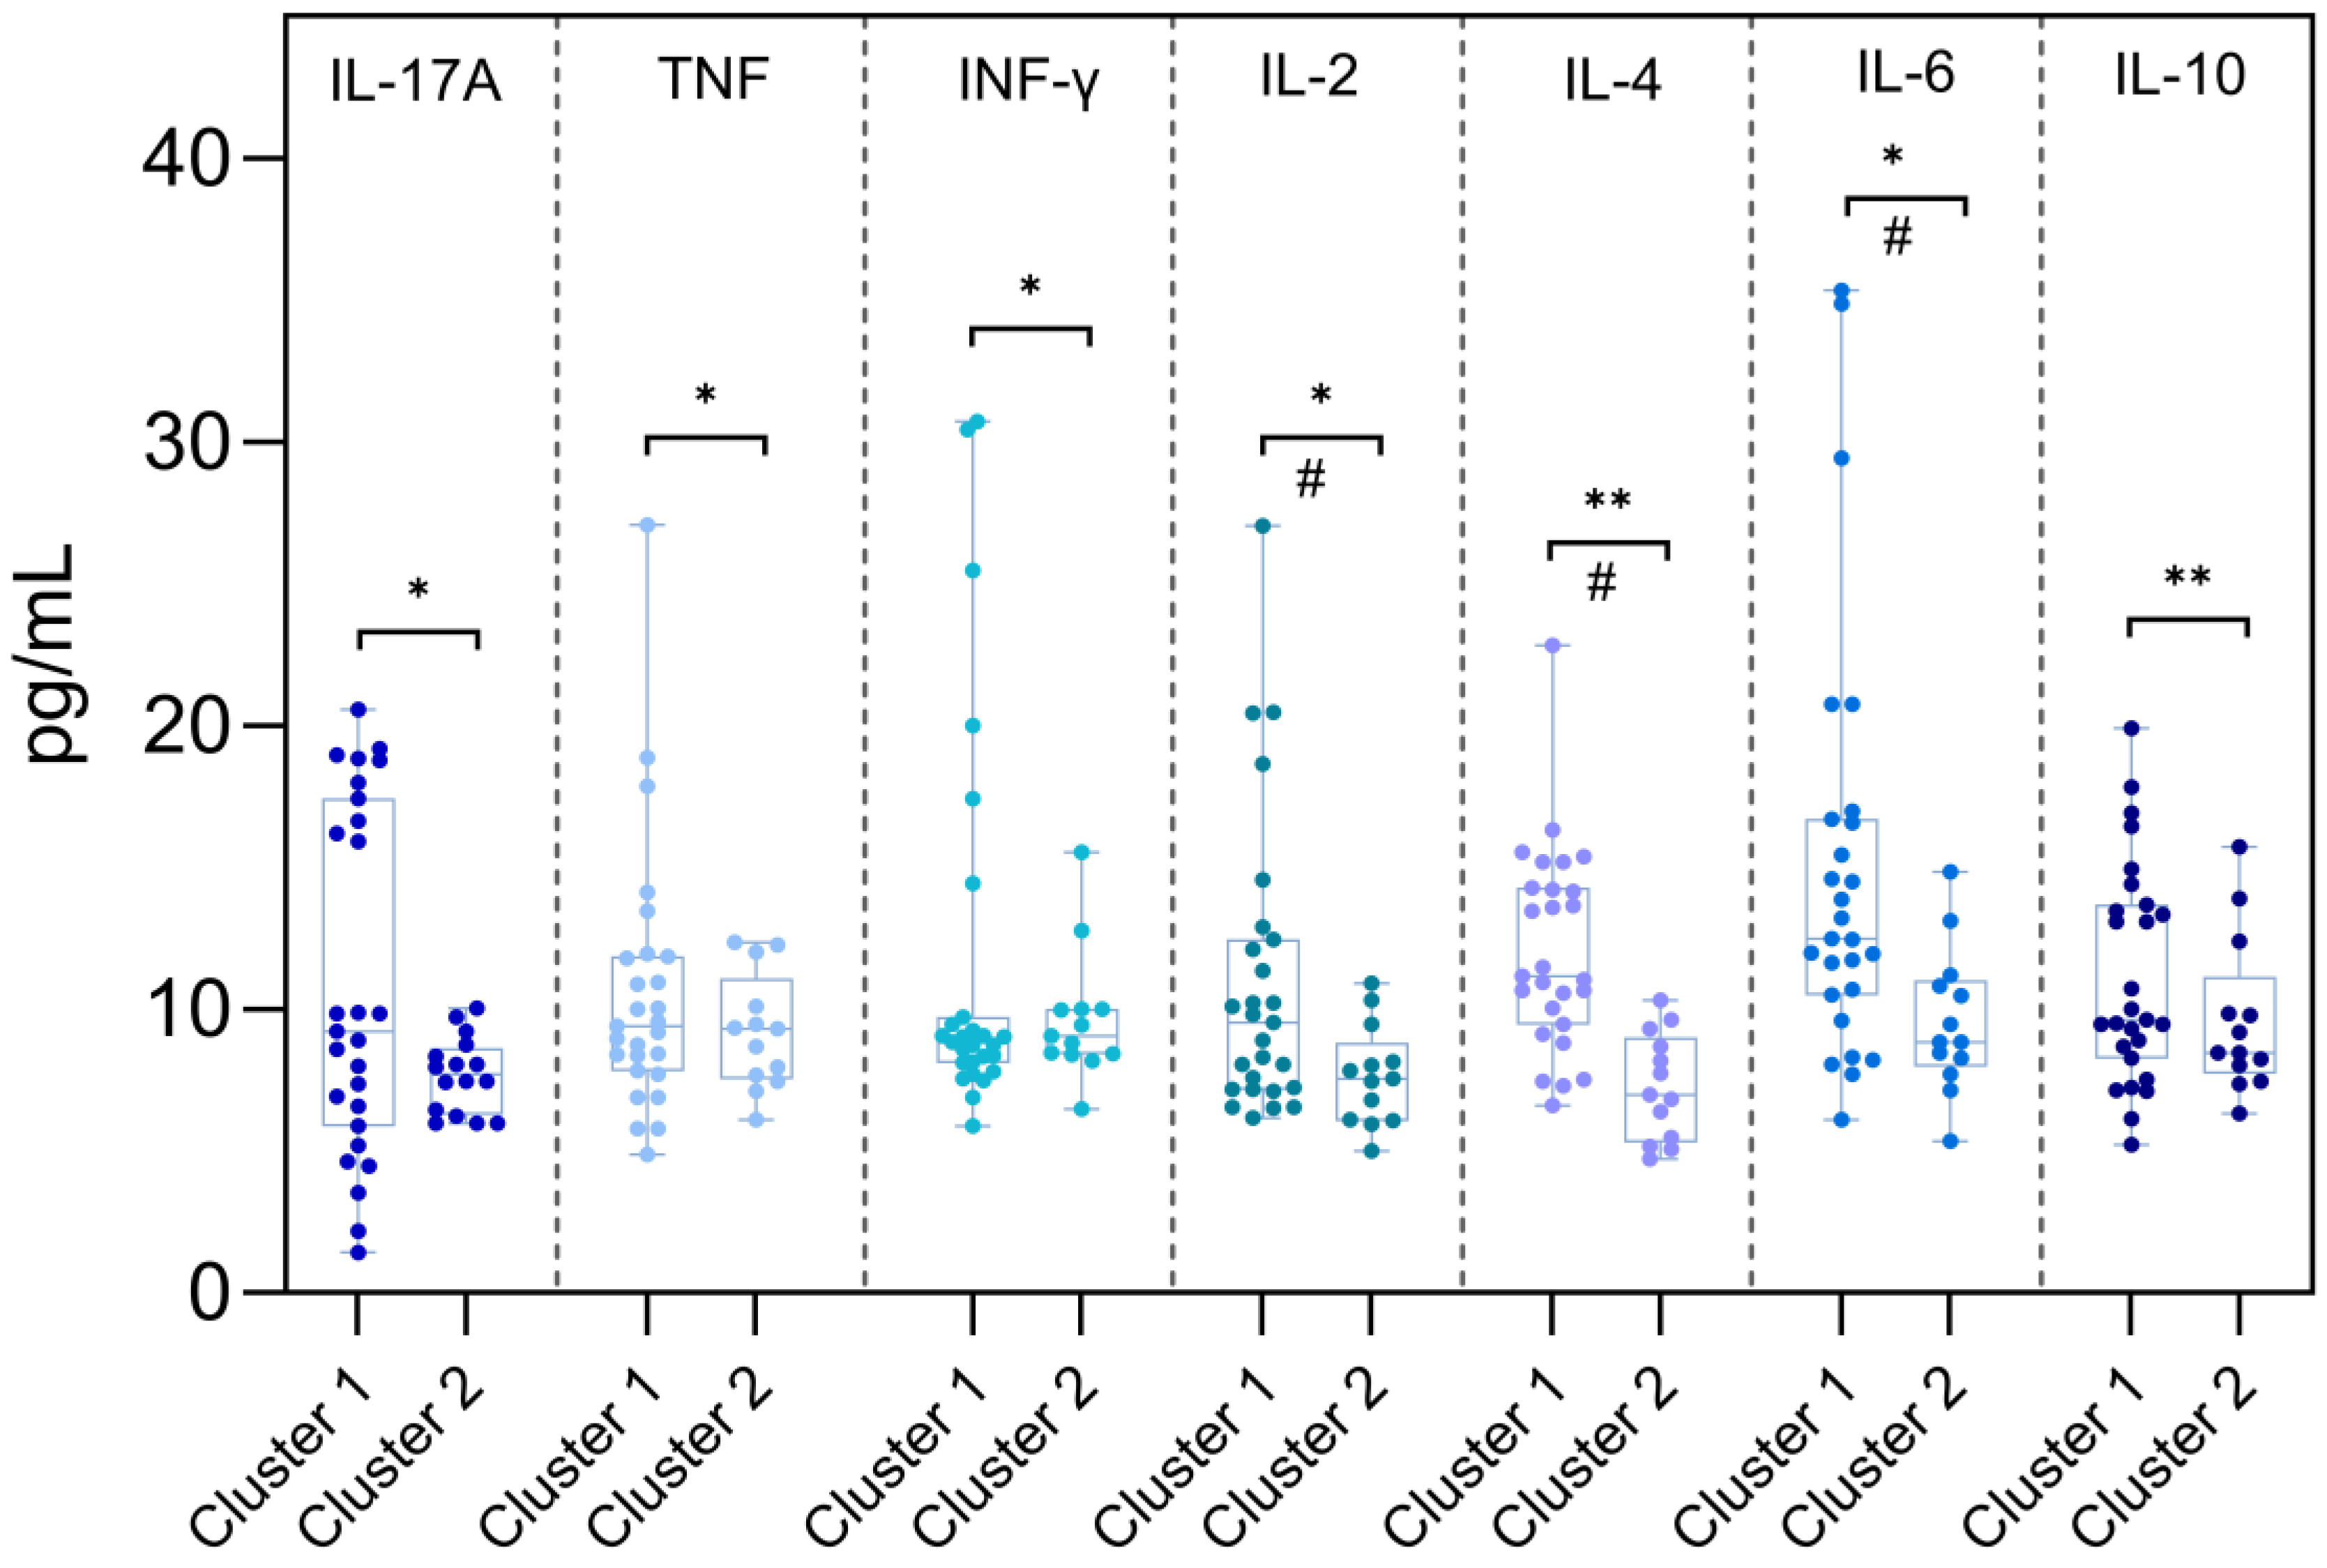
Figure 5.
Spearman correlation matrix of serum cytokine levels in patients with acute COVID-19. The heatmap displays pairwise Spearman’s correlation coefficients (ρ) between the concentrations of IL-17A, IFN-γ, TNF, IL-10, IL-6, IL-4, and IL-2. The color gradient represents the strength and direction of correlation, ranging from -1 (perfect negative correlation) to +1 (perfect positive correlation), as indicated by the color scale on the right. Only statistically significant correlations (p < 0.05) were considered relevant in the interpretation.
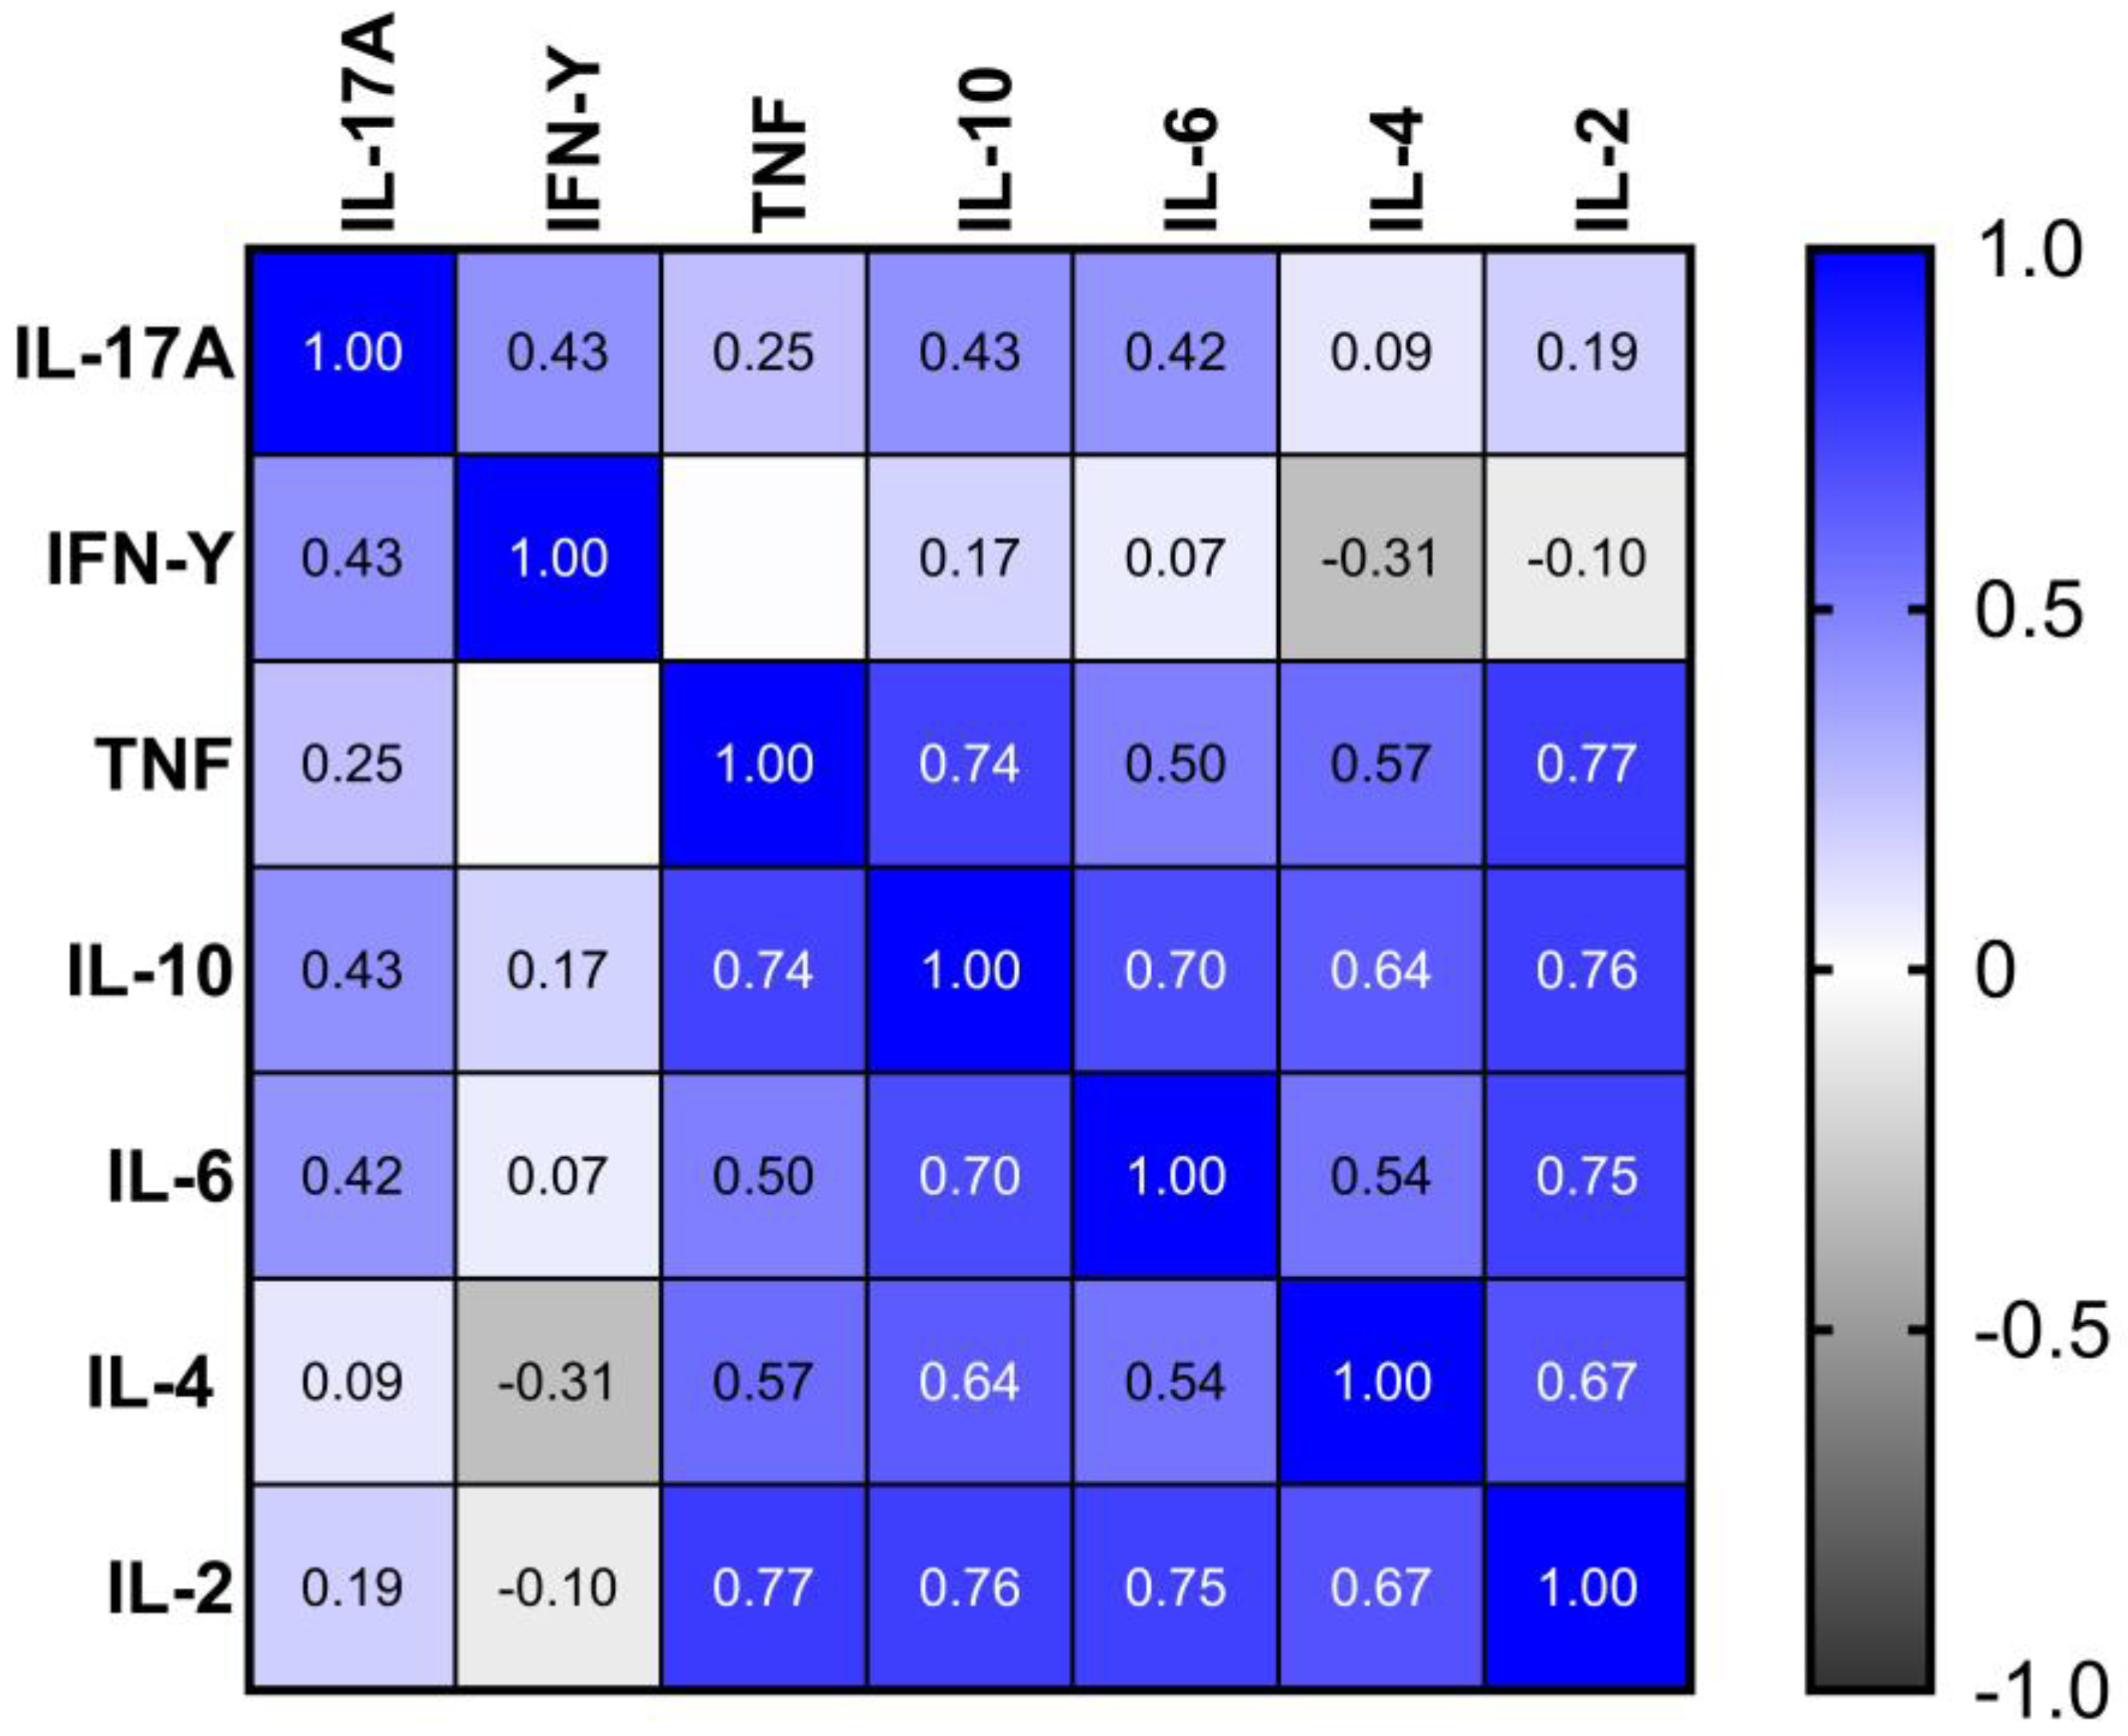
Figure 7.
Association between the number of COVID-19 vaccine doses received and clustered symptom frequencies. Participants were grouped based on the number of vaccine doses received (2 or 3) and stratified according to the total number of reported symptoms (< 8 or ≥ 8). The bar graph represents the absolute number of individuals in each category. A statistically significant difference between groups was identified using the chi-square test (p = 0.049). (#) denotes p < 0.05.
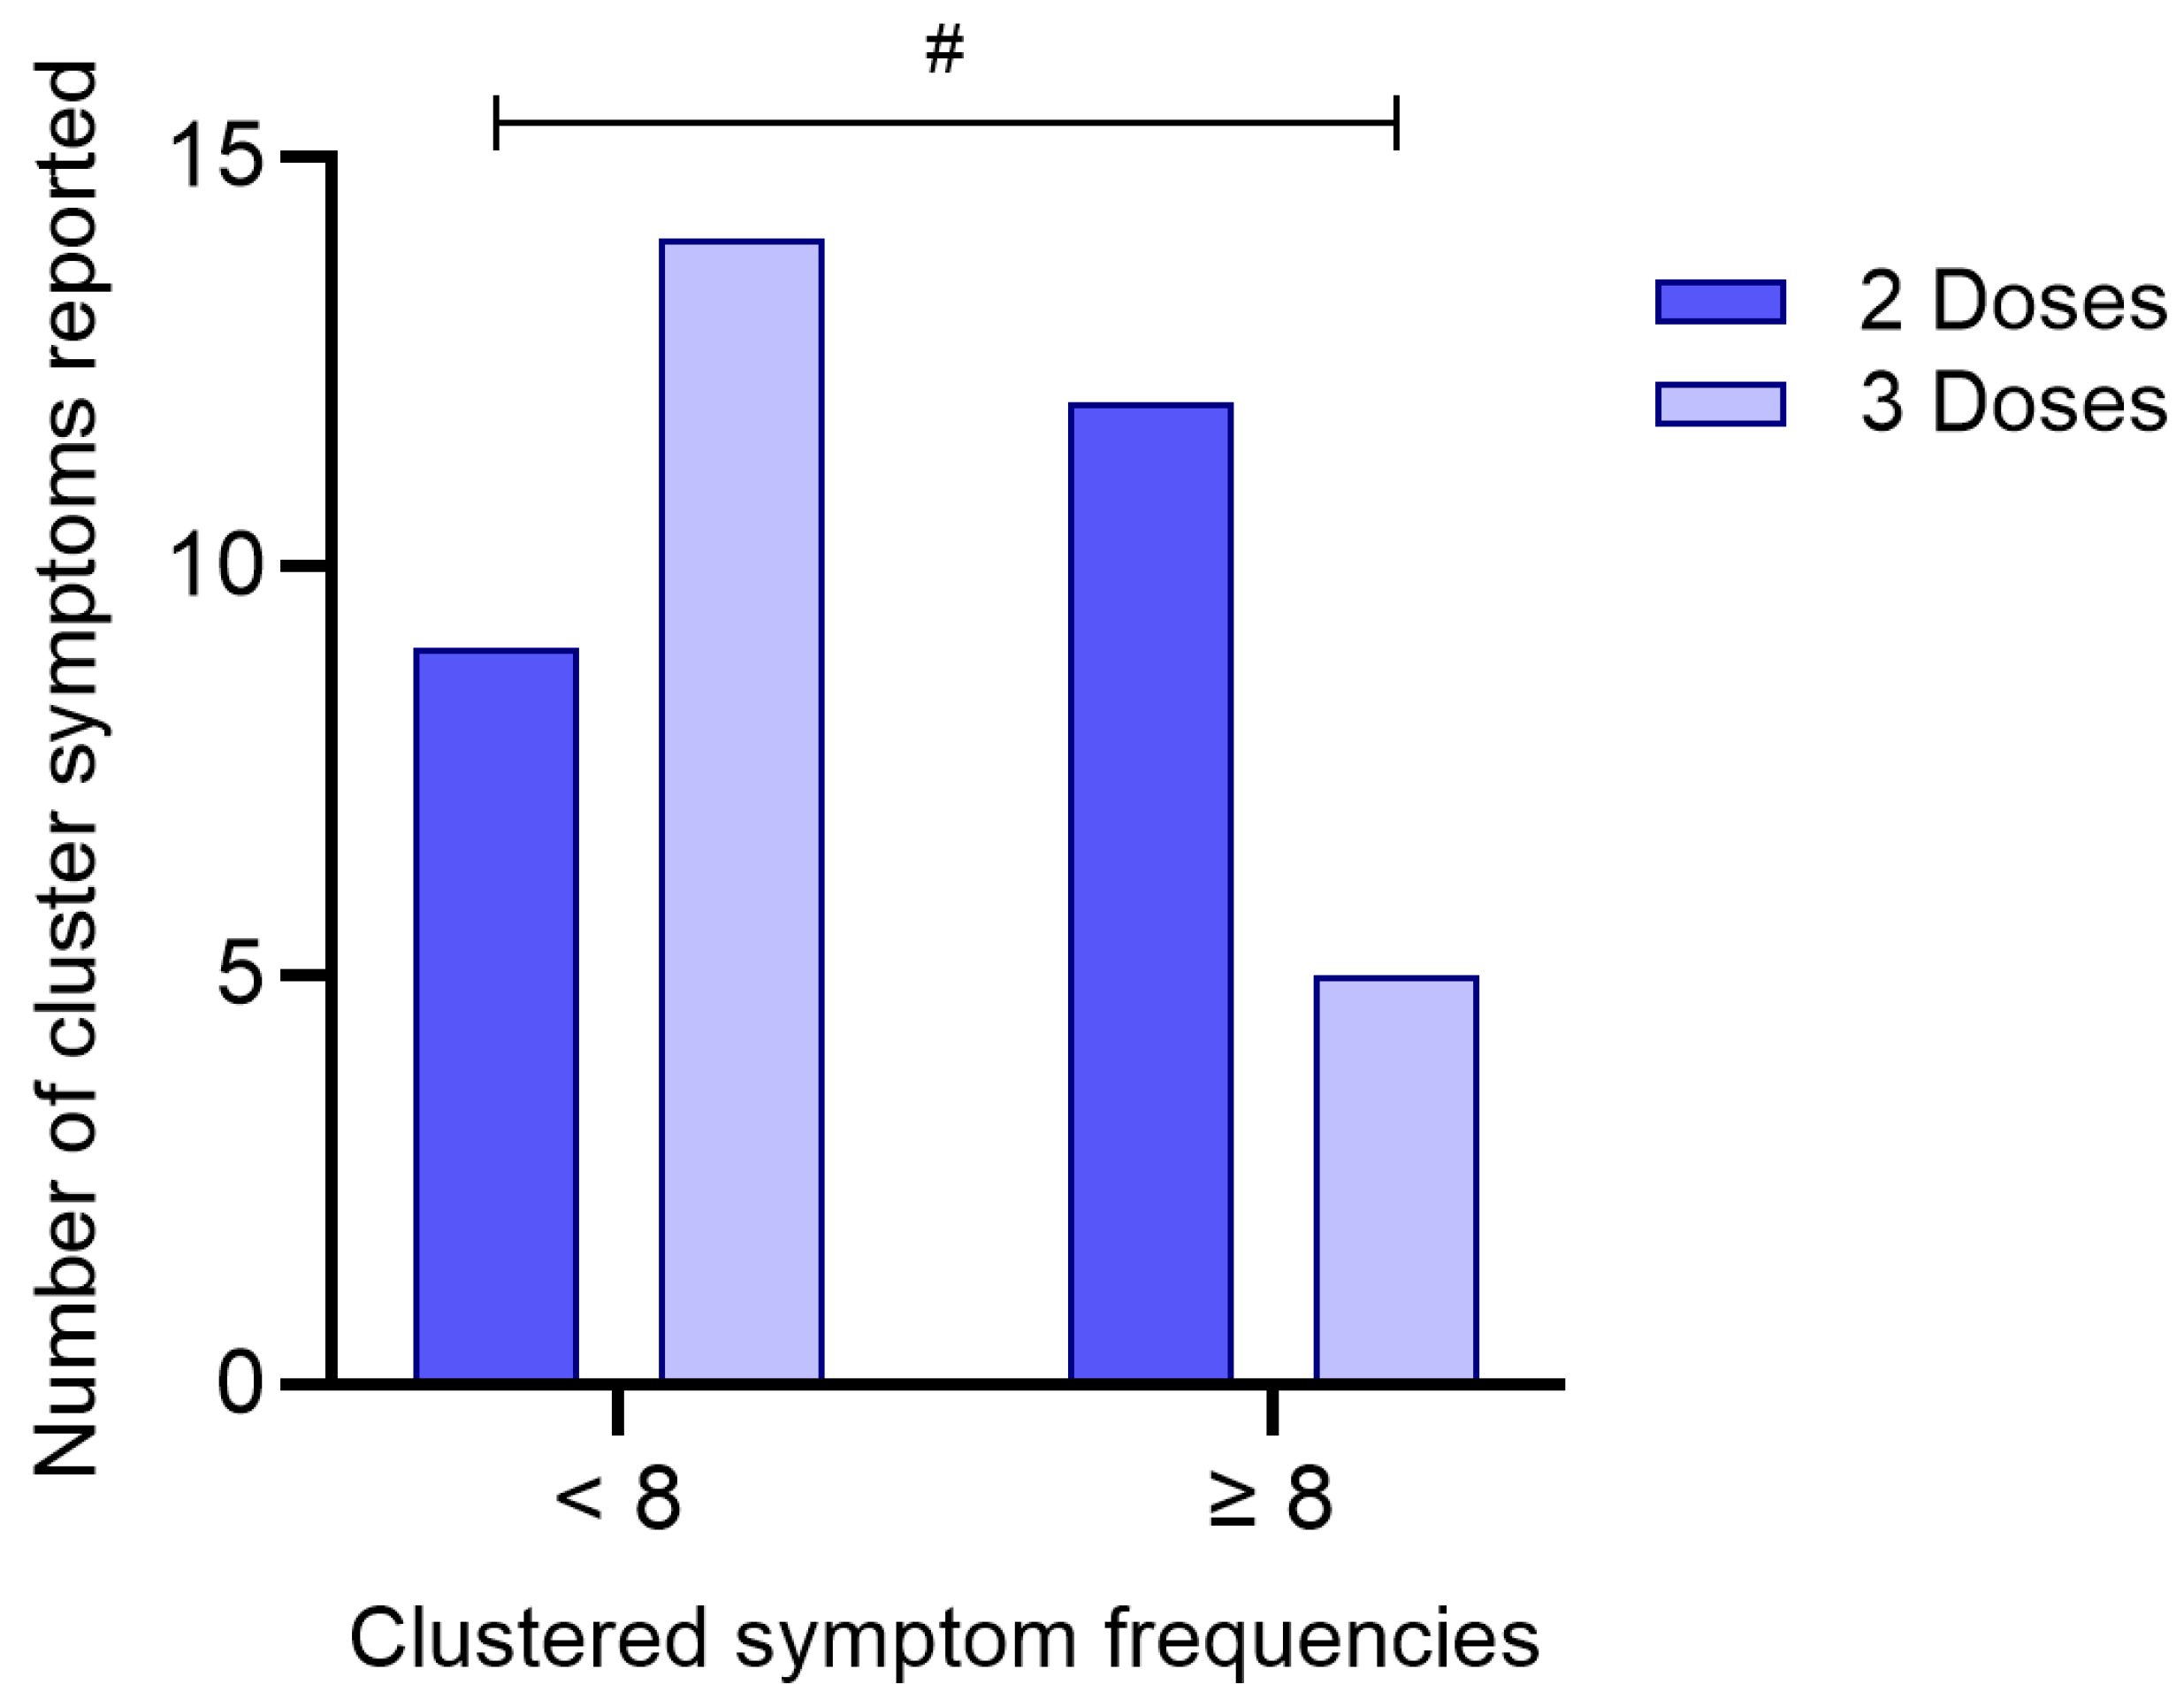
Table 1.
Sociodemographic, Clinical and Symptom Characteristics of the Study Population According to SARS-CoV-2 RT-qPCR results.
Table 1.
Sociodemographic, Clinical and Symptom Characteristics of the Study Population According to SARS-CoV-2 RT-qPCR results.
| Characteristics (n = 115) | RT-qPCR | p value | |
|---|---|---|---|
| Positive n = 40 (%) | Negative n = 75 (%) | ||
| Age Range (years) | 0.707 | ||
| < 25 | 2 (22.2) | 7 (77.8) | |
| 25-50 | 30 (36.1) | 53 (63.9) | |
| >50 | 8 (34.8) | 15 (65.2) | |
| Sex | 0.624 | ||
| Male | 9 (31.0) | 20 (69.0) | |
| Female | 31 (36.0) | 55 (64.0) | |
| Co-morbidity | 0.029 | ||
| Yes | 16 (40.0) | 21 (28.0) | |
| No | 24 (60.0) | 54 (72.0) | |
| Symptoms | |||
| Pharyngitis | 33 (82.5) | 36 (60.0) | 0.017 |
| Cough | 29 (72.5) | 11 (27.5) | 0.431 |
| Fever | 22 (55.0) | 28 (46.7) | 0.414 |
| Nasal discharge | 32 (80.0) | 42 (70.0) | 0.264 |
| Fatigue | 23 (57.5) | 27 (45.0) | 0.221 |
| Headache | 31 (77.5) | 40 (66.7) | 0.242 |
| Joint pain | 15 (37.5) | 12 (20.0) | 0.053 |
| Muscle pain | 21 (52.5) | 29 (48.3) | 0.683 |
| Painful breathing | 7 (17.5) | 3 (5.0) | 0.041 |
| Dyspnea | 6 (15.0) | 10 (16.7) | 0.824 |
| Diarrhea | 7 (17.5) | 10 (16.7) | 0.913 |
| Chills | 23 (57.5) | 12 (20.0) | < .001 |
| Abdominal pain | 8 (20.0) | 9 (15.0) | 0.514 |
| Loss of taste | 10 (25.0) | 9 (15.0) | 0.212 |
| Loss of smell | 5 (12.5) | 7 (11.7) | 0.900 |
| Emesis | 3 (7.5) | 8 (13.3) | 0.361 |
n = number of individuals.
Table 2.
Statistical Associations between Reported Symptoms and Cytokine Concentrations in COVID-19 Positive Patients.
Table 2.
Statistical Associations between Reported Symptoms and Cytokine Concentrations in COVID-19 Positive Patients.
| Symptoms (n = 40) |
Cytokines (p value a) | ||||||
|---|---|---|---|---|---|---|---|
| IL-17A | IFN-γ | TNF | IL-10 | IL-6 | IL-2 | IL-4 | |
| Pharyngitis | 0.590 | 0.143 | 0.200 | 0.292 | 0.334 | 0.158 | 0.326 |
| Cough | 0.219 | 0.468 | 0.558 | 0.876 | 0.651 | 0.100 | 0.975 |
| Fever | 0.797 | 0.349 | 0.785 | 0.290 | 0.471 | 0.365 | 0.645 |
| Nasal discharge | 0.995 | 0.992 | 0.990 | 1.000 | 0.990 | 0.990 | 0.990 |
| Fatigue | 0.514 | 0.278 | 0.121 | 0.643 | 0.680 | 0.093 | 0.677 |
| Headache | 0.130 | 0.961 | 0.679 | 0.690 | 0.098 | 0.447 | 0.401 |
| Joint pain | 0.372 | 0.684 | 0.845 | 0.693 | 0.285 | 0.908 | 0.882 |
| Muscle pain | 0.712 | 0.767 | 0.243 | 0.314 | 0.372 | 0.996 | 0.402 |
| Painful breathing | 0.275 | 0.104 | 0.915 | 0.226 | 0.759 | 1.000 | 0.258 |
| Dyspnea | 0.684 | 0.312 | 0.480 | 0.545 | 0.660 | 0.300 | 0.625 |
| Diarrhea | 0.856 | 0.378 | 0.870 | 0.686 | 0.590 | 0.978 | 0.755 |
| Chills | 0.626 | 0.467 | 0.154 | 0.184 | 0.270 | 0.446 | 0.378 |
| Abdominal pain | 0.634 | 0.377 | 0.026 | 0.254 | 0.324 | 0.670 | 0.936 |
| Loss of taste | 0.915 | 0.038 | 0.997 | 0.165 | 0.156 | 0.332 | 0.723 |
| Loss of smell | 0.853 | 0.255 | 0.904 | 0.726 | 0.747 | 0.687 | 0.631 |
| Emesis | 0.579 | 0.854 | 0.176 | 0.734 | 0.227 | 0.209 | 0.729 |
n = number of individuals; a Binomial logistic regression test.
Disclaimer/Publisher’s Note: The statements, opinions and data contained in all publications are solely those of the individual author(s) and contributor(s) and not of MDPI and/or the editor(s). MDPI and/or the editor(s) disclaim responsibility for any injury to people or property resulting from any ideas, methods, instructions or products referred to in the content. |
© 2025 by the authors. Licensee MDPI, Basel, Switzerland. This article is an open access article distributed under the terms and conditions of the Creative Commons Attribution (CC BY) license (http://creativecommons.org/licenses/by/4.0/).
Copyright: This open access article is published under a Creative Commons CC BY 4.0 license, which permit the free download, distribution, and reuse, provided that the author and preprint are cited in any reuse.


