
Submitted:
16 June 2023
Posted:
19 June 2023
You are already at the latest version
Preprints on COVID-19 and SARS-CoV-2
Abstract
Objectives: The aim of this study is to evaluate some mechanisms of the immune response of people infected with SARS-CoV-2 in both acute infection and early and late convalescence phases. Methods: This is a cohort study of 70 cases of COVID-19, confirmed by RT-PCR, followed up to 60 days. Plasma Samples and clinical data were. Viral load, blood count, indicators inflammation were the parameters evaluated. Cellular immune response was evaluated by flow cytometry and Luminex immunoassays. Results: In the severe group, hypertension was the only reported comorbidity. Non severe patients have activated memory naive CD4+ T cells. Critically ill patients have central memory CD4+ T cell activation. Severe COVIS-19 patients have both central memory TCD8+ T cells and activated effector TCD8+ cells. Non-severe COVID-19 cases showed an increase in IL1β, IL-6, IL-10 and TNF and severely ill patients had higher levels of the cytokines IL-6, IL-10 and CXCL8.Conclusion: The present work showed that different cellular responses are observed according to the COVID-19 severity in patients from Brazil an epicenter the pandemic in South America. Also, we notice that some cytokines can be used as predictive markers for the disease outcome, possibility implementation of strategies effective by health managers.
Keywords:
Sars-Cov-2
; COVID-19
; Immune response
; Cytokine storm
; acute infection
1. Introduction
In last years the world has been living a pandemic that started in December 2019, with several severe respiratory distress syndrome cases of unknown cause in Wuhan Province, China [1]. Through genetic sequencing of lung lavage, the pathological agent identified was a new coronavirus type, later named SARS-CoV-2, an enveloped single-stranded RNA betacoronavirus, whose main invasion mechanism is the binding of its structural protein S (spike) with angiotensin-converting enzyme 2 (ACE-2) on cell’s surface [1,2,3,4,5]. The virus rapid spreaded worldwide and led World Health Organization (WHO) to declare the occurrence of this pandemic on March 11, 2020 [6].
COVID-19 understanding is evolving over time. The range of symptoms varies, from fever, dry cough, sore throat, dyspnea, fatigue, myalgia and diarrhea to severe form, with pulmonary involvement, in 20% of the patients. Different variants of SARS-CoV-2 have been associated with different risks and illness’ severity [7,8,9,10]. The increased risk of death can be associated with some risk factors such as cardiovascular disease, diabetes mellitus, arterial hypertension, chronic obstructive pulmonary disease, neoplasms, chronic renal failure, obesity, smoking, male gender and advanced age [3].
Regarding the mechanisms of the immune response against this virus, it is important to mention that higher concentrations of cytokines as granulocyte-colony stimulating factor (G-CSF), interferon gamma-induced protein 10 (IP10), monocyte chemoattractant protein 1 (MCP1), macrophage inflammatory protein 1alpha (MIP1A), tumor necrosis factor alpha (TNFα) interleukin-2 (IL-2) receptor, nterleukin-6 (IL-6), interleukin-8 (IL-8), interleukin-10 (IL-10), were reported in patients with COVID-19 [11,12]. These reactions characterize the cytokine storm, a disordered systemic response that leads to a hyperinflammation condition in the host and culminates in an untoward clinicopathological consequences [11]. Furthermore, extreme lymphopenia with reduced CD4 and CD8 T populations has been shown to be a consistent prognostic factor in patients with severe forms [13,14].
Some questions, as the individual's genetic variability role in the immune response against SARS-CoV-2 remain unanswered. So, such. it is important to evaluate the relationship between genetic variability of the three main class I histocompatibility complexes (human leukocyte antigen A [HLA-A], -B and -C genes) and the susceptibility/ severity of COVID-19 [15].
2. Materials and Methods
2.1. Study design and participants
This is a cohort study of 70 cases of COVID-19, confirmed by RT-PCR, followed up to 60 days. A convenience sample of 70 COVID-19 cases was stratified into severe (30) and non-severe (40). The non-serious group was defined with a greater number of participants due to the possibility of group migration throughout the study, depending on the disease evolution. In addition, 20 healthy participants were included for laboratory method control.
The clinical study protocol was approved by Research Ethics Committee at Pedro Ernesto University Hospital/UERJ n°. 4.,160.,423, of 07/17/2020 and by Research Ethics Committee of SMS/RJ, approved n°. 4.,322.297, of 10/06/2020. According to the Declaration of Helsinki (2008) and Resolution n°. 466 of National Health Council (2012), confidentiality of patient information is guaranteed.
2.2. Data collection of COVID-19 patients
Plasma Samples and clinical data were collected at four time points from the date of symptom onset: 4-6, 8-10, 15-20, and 45-60 days. Cellular immunity, viral load, blood count, indicators of liver and kidney function and inflammation were the parameters evaluated. Non-serious cases were captured among symptomatic patients, considered suspects, who contacted the Research Center, or who sought care at the Pedro Ernesto University Hospital or the Piquet Carneiro Polyclinic. Severe cases were captured among patients hospitalized at the Hospital Universitário Pedro Ernesto/UERJ and in Municipal Health Department of Rio de Janeiro (SMS-RJ) health units. The group of participants hospitalized in units of SMS-RJ had the visits carried out by the study central team and the samples collected at the place of hospitalization. The other collections were scheduled according to the symptoms onset day. Not all critically ill patients had the initial samples collected, as they were included after the collection period.
2.3. Inclusion and exclusion criteria
Inclusion and Exclusion criteria are described in Supplementary table S1. Briefly, after selecting the 70 participants, 20 healthy participants were also included, with a proportional sex and age distribution, like the participants with COVID-19 included in the study, without a diagnosis of COVID-19 (with undetectable RT-PCR and IgM and IgG non-reactive), which constituted a laboratory method control group for the cellular and immunogenetic immunity evaluation. These participants were included in the same research center and only one swab and blood collection were performed on the inclusion date.
2.4. Immunophenotyping
Peripheral blood mononuclear cells (PBMC) were obtained from whole blood using Histopaque® and Ficoll (Sigma-Aldrich - Missouri, EUA) different density gradients. These cells were cryopreserved, and then thawed at the time of each assay. Then, was used a concentration of 2 x 10⁵ viable cells/mL, and submitted to immunophenotyping assay with surface antibodies for 20 minutes at 2 - 8 °C. After, the cells were washed with phosphate buffer plus fetal bovine serum (FBS) (PBS pH 7.4 at 2% FBS), and centrifuged at 400x g for 5 minutes. After centrifugation, cells were fixed with 1% paraformaldehyde solution and subsequently acquired in a flow cytometer (LSR FortessaTM, BD Biosciences, New Jersey, USA). The analysis was performed using Flow Jo software v10.6 (BD Biosciences).
The anti-human antibodies used in the immunophenotyping assay were: panel I (activation) - CD3-FITC, CD4-APCH7, CD8-BV605, CD38-PECy7, OX40- BV711 and panel II (memory) – CD3-APC-Cy7, CD4-BV421, CD8-BV605, CD45RA-APC, CCR7-BV510 (BD Biosciences).
2.5. Cytokine detection
2.5.1. Immunospot assay
The frequency of interferon gamma (IFN-γ) and IL-10 secreting cells in patients' PBMCs were analyzed using the FluoroSpotplus kit human assay (Mabtech – Stockholm, Sweden) as recommended by the manufacturer. Cell suspensions were plated (2 x 10⁵ cells/well) on pre-coated plates and cultured for 20 hours in the presence or absence of SARS-CoV-2 Antigen Peptide NCAP - 2mcg/ml (nucleocapsid peptides, JPT peptides – Berlin, GE). As a positive control, cells were incubated with 2 µg/well of Concanavalin A (Sigma-Aldrich). After incubation and development, the “spots” of the cells secreting the said mediators were quantified using the ImmunoSpot® (CTL) image analyzer. The number of “spots” generated by cells stimulated with the antigen was subtracted from the non-specific spots generated in non-stimulated cells, generating the number of specific spots for SARS-CoV-2 per million cells.
2.5.2. Multiplex micro array
To quantify the cytokine levels in the plasma of the patients, were used the multiplex liquid microarray assay with magnetic beads - Human Magnetic Luminex Assay (R&D Systems – Massachusetts, USA) which allowed to quantify inflammatory and regulatory cytokines, IL-1b, IL-6, IL-10, IL-8/CXCL8, TNF-α. The test was performed according to the manufacturer’s recommendations. The result was performed in a MAGPIX® system equipped with xPONENT v3.2 and the data were analyzed in SoftMax Pro software version 5.4, applying the five-parameter regression formula to calculate the sample concentrations from the standard curves.
2.6. Statistical Analysis
The results were expressed as mean and its standard deviation. Clinical characteristics of participants were compared using Mann Whitney, Kruskal Wallis, ANOVA and Spearman correlation tests. Trial results with qualitative results were presented in absolute and relative frequency, and evaluated with participants’ clinical characteristics using Mann Whitney, Kruskal Wallis, ANOVA, Chi-square and Fisher's exact tests. Statistical analyzes with cytokine detection results were performed using the GraphPad Prism 5 software, applying one-way ANOVA, two-way Kruskal-Wallis test and Dunn's Multiple Comparison Test to compare specific production levels of the analyzed cytokines stratified by clinical and compared to control samples. The results provided quantitative data regarding the cytokines production from specific cellular response to SARS-CoV-2.
3. Results
3.1. Investigation
The first patient was included on 08/12/2020, from UERJ, and on 10/22/2020 in RJ centers. The last research participant was included on 03/31/2021 and fieldwork also ended. Briefly, UERJ included 68 participants, and RJ centers, 28 participants. All participants had detectable PCR for SARS-CoV-2 at enrollment.
Most of the patients were male (52.1%), white (68.5%), married (47.9%) and with high level education (24.7%). The median age was 49 years, ranging from 19 to 93 years. The main symptoms among participants were fatigue, cough, headache, myalgia or arthralgia, and anosmia. Among participants with severe conditions, the most common symptoms were fatigue and dyspnea, and for non-severe ones, headache and fatigue. Regarding the presence of comorbidities in the severe group, hypertension was reported in 51,6% of the patients and this condition was also reported by 21,4% of the patients of the no-severe group (Table 1).
3.2. Laboratory assays:
Table 2 summarizes the laboratory analysis of the patients. We highlight that hemoglobin values were lower in severe cases and in the second week of the disease (visit 2) with a median of 10.1g/dl in critically ill patients. Critically ill patients at visit 1 also had lower lymphocyte counts with a median of 1093 cells compared to 1434 of the non-severe cases.
Laboratory analyzes are shown in table 2.
3.3. Immunophenotyping
Figure 1 shows the gate strategy to set T lymphocytes. The evaluation of TCD4+ cells demonstrated that severe patients had lower percentages of central and effector memory cells than naïve cells, also observed in non-severe patients. In addition, it was also possible to identify terminally differentiated cells in this group of patients. Regarding the immunophenotyping of TCD8+cells, similarly to what was observed in TCD4+, severe patients had higher percentages of central memory cells compared to control group. Effector memory cells were identified in both groups of patients, severe and non-severe, and contrary to what was observed in TCD4+ lymphocytes, only in the non-severe group it was possible to identify naïve T cells. Finally, terminally differentiated lymphocytes were observed in the severe and non-severe groups, the former being like the control group (Figure 2).Table 2 summarizes the laboratory analysis of the patients. We highlight that hemoglobin.
3.4. Cytokine detection:
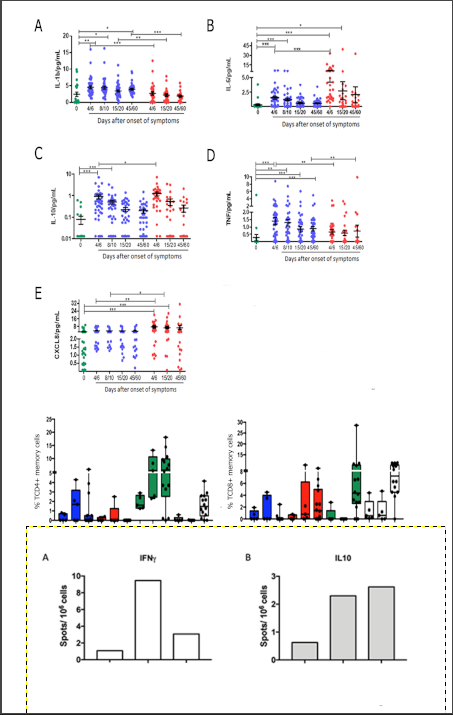
Cytokine detection: Comparing cytokine levels quantification in laboratory controls and patients in the 4/6-day collection after study admission, it was seen that non-severe COVID-19 cases showed an increase in IL1β, IL-6, IL-10 and TNF (Figure 3A-D). Severely ill patients had higher levels of the cytokines IL-6, IL-10 and CXCL8 in the first days of SARS-CoV-2 infection (Figure 2B, C and E) and, in contrast, lower levels of IL-1β and TNF (Figure 3A, D) than controls and non-severe patients. At the later time of collection, 45/60 days after admission, non-critical patients still had increased levels of IL-1β and TNF (Figure 3A, D).
According to severity, it was seen that COVID-19 severe cases have lower production of IL1β at all times analyzed (Figure 3A) and of TNF at times 4/6 and 45/60 days (Figure 3D). Concomitantly, in severe COVID-19, an increase in the initial production of IL6 and IL10 (4/6 days) was seen (Figure 3B, C) and maintenance of high levels of CXCL8 at times 4/6 and 15/20 days (Figure 3E).
After stimulation with nucleocapsid peptides (NCAP – 2mcg/mL, JPT peptides), it was possible to detect IFNγ and IL10-secreting cells by the FluoroSpot technique both in the severe group and in the non-severe group (Figure 4).
The FluoroSpot data demonstrated that 22,8% were found to have more than 10 detectable spots after stimulation with SARS-CoV-2 peptides. Therefore, the following were selected for immunophenotyping evaluation: a) samples from 15 participants in the non-severe group who presented more than 5 spots; b) samples of 5 serious participants who presented 2 to 3 spots; c) samples from 5 healthy participants/controls. A difference in interferon-gamma secretion can be observed between severe and non-severe, which can be explained by the high cellular activation observed in the periphery found in the cytometry data, which can lead to cellular exhaustion and compromise the quality of interferon production.
4. Discussion
In this study, we set out to draw a clinical and a panel of the some mechanisms of the immune response of people infected with SARS-CoV-2 in the phases of acute infection and early and late convalescence. In this sense, we noted that the most common symptoms for severe and non-severe cases (fatigue, dyspnea, muscle pain, among others), besides comorbidities, including cardiovascular disease, diabetes, chronic respiratory disease, hypertension, frequently present in severe cases with COVID-19, were also observed by some authors that described the same profile in their patients [11,12,15]. The authors associate the COVID-19 pathogenesis with the host immune responses against the SARS-CoV-2.
CRP (C-reactive protein) was higher in critically ill patients, and in the first visits (1 and 2). This observation is as expected, since this protein is synthesized by the liver in times of stress, especially in acute phase, such as when there is a relevant infection in progress and its function is to help the immune system, through anti-inflammatory activity [20].
D-dimer is a biological marker present in blood when there is degradation of fibrin, a protein involved in clot formation. Thus, a greater amount of circulating D-dimer is associated with changes in clotting process and mainly related to an increased risk of deep vein thrombosis (DVT) and/or pulmonary thromboembolism [21]. Some authors described the increase of D-dimer was considered a infection indicator and suggest greater severity of COVID-19, since a large amount of immune response of these patients [21,22], it is important to say that were observed a decrease in the percentage of natural killer cells as well as lymphocytes cytokines is released (Cytokine storm). The mechanisms that lead to lymphopenia in COVID-19 are still not fully understood, however, the cytokine storm and, consequently, lymphocytes recruitment to inflammatory sites, apoptosis, pyroptosis and exhaustion are some hypothesis [2,16].
Regarding some mechanisms involved in the cellular immune response in critically ill individuals in acute phase of the disease, the appearance of memory lymphocytes and antiviral cytokines after 15-20 days of viral clearance at the time of discharge of hospitalized patients [9]. In this study, the emergence of memory T lymphocytes was also observed in the recovery period, as well as IFNg and IL10 production. The group evaluated in the present study had a small sample size, not allowing extrapolations of results to a population scale, requiring evaluations in groups that are more representative of general population.
Cytokynes play a fundamental role in COVID-19 since the severity of the disease has been associated with an exuberant production of proinflammatory cytokines, such as IL-1, IL-2, IL-6, IL-10, IL-12, IFN-γ, TNF-α, and, consequently, an excessive activation of the immune system, which may cause tissue injury, mainly on the lungs [26]. So, in the present study, were observed high levels of cytokynes, as interleukin (IL)-6, IP-10 (CXCL10), and TNFα, and proteins as C-reactive protein, ferritin, in the severe cases when compared with non-severe ones, in in accordance with the description by Cao and Li [27].
According to an study, serum IL-6 levels are far lower in COVID-19 infections [9]. In this study, the circulating cytokines quantification showed that patients with COVID-19 have increased levels of IL6 and IL10 in the collections 4-6 days regardless of severity [9,10]. Comparing the initial cytokine levels (4-6 days) of patients according to the severity, it was seen that the non-severe were characterized by higher levels of IL1β and TNF, as showed by Pompetchara E et al. [28], while the bass had an increased profile of IL6 and IL10. These data, therefore, highlighted the role of these cytokines as predictive biomarkers in disease outcome, that corroborates with Henry BM et al. [29].
Severe cases also showed increased nitric oxide response and acute inflammatory response, data compatible with the quantification of circulating cytokines in these individuals, in addition to potential responses to opportunistic pathogens such as bacteria and fungi. Macrophages constitute a source of nitric oxide in the body and a high serum nitric oxide is directly related to high macrophages. However, these analyses of opportunistic pathogens not included in this present study and we considerate a limitation this study.
In conclusion, the present work showed that different cellular responses are observed according to the COVID-19 severity in patients from Brazil an epicenter the pandemic in South America. Also, we notice that some cytokines can be used as predictive markers for the disease outcome, possibility implementation of strategies effective by health managers. But it is also important to evaluate the humoral response, since COVID-19 has different outcomes.
Supplementary Materials
The following supporting information can be downloaded at the website of this paper posted on Preprints.org.
Author Contributions
Conceptualization, R.C.G., M.M.E.O.; methodology, V.S.S.P, D.C-M., C.E.V.G.; validation, L.A.B.C.,; formal analysis, P.P.G., G.F.T., A.M.V.S., J.R.X., T.A.C.B., T.M.C.., V.C.G.; investigation, D.C.-M., C.E.V.G., A.P.D.A.B., C.L.V.F., D.F.A., L.K.L., M.L.B.S., P.M.N.O., P.R.G.T., R.S.P., R.L.S.C., S.M.B.L.; resources, M.M.E.O. X.X.; writing—original draft preparation, V.S.S.P..; writing—review and editing, D.C.-M., R.C.G., C.E.V.G., D.P.F., M.M.E.O.; supervision, R.C.G., M.M.E.O.; project administration, M.M.E.O.; funding acquisition, M.M.E.O. All authors have read and agreed to the published version of the manuscript.”
Funding
This work was supported by Fundação Carlos Chagas Filho de Amparo à Pesquisa do Estado do Rio de Janeiro (FAPERJ – Grant: JCNE E-26/201.433/2021– M.M.E.O.), INOVA IOC (IOC-026-FIO-21 - D.C.-M fellowship), Conselho Nacional de Desenvolvimento Científico e Tecnológico (CNPq - Grant Proc. 307007/2022– M.M.E.O.), Emenda Gustavo Freut and MP COVID 1083.
Conflicts of Interest
The authors declare that they have no known competing financial interests or personal relationships that could have appeared to influence the work reported in this paper.
Ethical Approval Statement
This work was approved by the Research Ethics Committee (CEP) Fiocruz, CAAE:28063114.2.0000.5262. The patient has signed the consent form for publication.
References
- Sanders, J.M.; Monogue, M.L.; Jodlowski, T.Z.; Cutrell, J.B. Pharmacologic Treatments for Coronavirus Disease 2019 (COVID-19): A Review. JAMA [Internet]. 13 de abril de 2020 [17 of June of 2020]; Acessed in: https://jamanetwork.com/journals/jama/fullarticle/2764727.
- Jamilloux, Y.; Henry, T.; Belot, A.; Viel, S.; Fauter, M.; El Jammal, T.; et al. Should we stimulate or suppress immune responses in COVID-19? Cytokine and anti-cytokine interventions. Autoimmunity Reviews. May of 2020;102567.
- Huang, C.; Wang, Y.; Li, X.; Ren, L.; Zhao, J.; Hu, Y.; et al. Clinical features of patients infected with 2019 novel coronavirus in Wuhan, China. The Lancet. February of 2020, 395, 497–506. [Google Scholar] [CrossRef] [PubMed]
- Zhu, N.; Zhang, D.; Wang, W.; Li, X.; Yang, B.; Song, J.; et al. A Novel Coronavirus from Patients with Pneumonia in China, 2019. N Engl J Med. 20 of february of 2020, 382, 727–733. [Google Scholar] [CrossRef] [PubMed]
- Asselta, R.; Paraboschi, E.M.; Mantovani, A.; Duga, S. ACE2 and TMPRSS2 Variants and Expression as Candidates to Sex and Country Differences in COVID-19 Severity in Italy. SSRN Journal [Internet]. 2020 [23 of june of 2020]; Disponível em: https://www.ssrn.com/abstract=3559608.
- World Health Organization. WHO announces COVID-19 outbreak a pandemic [Internet]. 2020 [18 of June of 2020]. Acessed in: https://www.euro.who.int/en/health-topics/health-emergencies/coronavirus-covid-19/news/news/2020/3/who-announces-covid-19-outbreak-a-pandemic.
- Fernandes, Q.; Inchakalodya, V.P.; Merhia, M.; Mestiria, S.; Taiba, N. ; et. al. Emerging COVID-19 variants and their impact on SARS-CoV-2 diagnosis, therapeutics and vacines. ANNALS OF MEDICINE 2022, VOL. 54, NO. 1, 524–540.
- Ackermann, M.; Verleden, S.E.; Kuehnel, M.; Haverich, A.; Welte, T.; Laenger, F.; et al. Pulmonary Vascular Endothelialitis, Thrombosis, and Angiogenesis in Covid-19. N Engl J Med. 2020. [Google Scholar] [CrossRef]
- Vardhana, S.A.; Wolchok, J.D. The many faces of the anti-COVID immune response. Journal of Experimental Medicine. 1st of june of 2020, 217, e20200678. [Google Scholar] [CrossRef] [PubMed]
- Saghazadeh, A.; Rezaei, N. Immune-epidemiological parameters of the novel coronavirus – a perspective. Expert Review of Clinical Immunology. 3 of may of 2020, 16, 465–470. [Google Scholar] [CrossRef] [PubMed]
- Mahmudpour, M.; Roozbeh, J.; Keshavarz, M.; Farrokhi, S.; Nabipour, I. COVID-19 cytokine storm: The anger of inflammation. Cytokine, 2020; 133, 155151. [Google Scholar] [CrossRef]
- Melgaço, J.G.; Brito, E.; Cunha, D.; Azamor, T.; da Silva, A.M.V.; Tubarão, L.N.; Gonçalves, R.B.; et al. Cellular and Molecular Immunology Approaches for the Development of Immunotherapies against the New Coronavirus (SARS-cov-2): Challenges to Near-Future Breakthroughs. J Immunol Res, 2020; 2020, 8827670. [Google Scholar]
- Chen, J.; Qi, T.; Liu, L.; Ling, Y.; Qian, Z.; Li, T.; et al. Clinical progression of patients with COVID-19 in Shanghai, China. Journal of Infection. May of 2020, 80, e1–6. [Google Scholar] [CrossRef] [PubMed]
- Vabret, N.; Britton, G.J.; Gruber, C.; Hegde, S.; Kim, J.; Kuksin, M.; et al. Immunology of COVID-19: Current State of the Science. Immunity. June of 2020, 52, 910–941. [Google Scholar] [CrossRef] [PubMed]
- Lin, M., Tseng, H.-K.; Trejaut, J.A.; Lee, H.-L.; Loo, J.-H.; Chu, C.-C.; et al. Association of HLA class I with severe acute respiratory syndrome coronavirus infection. BMC Med Genet. December of 2003, 4, 9.
- Love, M.I.; Huber, W.; Anders, S. Moderated estimation of fold change and dispersion for RNA-seq data with deseq2. Genome Biology, 2014; 15, 1–21. [Google Scholar]
- R Core Team (2017) R: A Language and Environment for Statistical Computing. https://www.R-project.org/.
- Campi-Azevedo, A.C.; Peruhype-Magalhāes, V.; Coelho-dos-Reis, J.G.; Antonelli, L.R.; Costa-Pereira, C.; Speziali, E.; et al. 17DD Yellow Fever Revaccination and Heightened Long-Term Immunity in Populations of Disease-Endemic Areas, Brazil. Emerg Infect Dis. August of 2019, 25, 1511–21. [Google Scholar] [CrossRef] [PubMed]
- Liu, Y.; Yan, L.-M.; Wan, L.; Xiang, T.-X.; Le, A.; Liu, J.-M.; et al. Viral dynamics in mild and severe cases of COVID-19. Lancet Infect Dis. June of 2020, 20, 656–657. [Google Scholar] [CrossRef] [PubMed]
- Stringer, D.; Braude, P.; Myint, P.K.; Evans, L.; Collins, J.T.; Verduri, A.; Quinn, T.J.; Vilches-Moraga, A.; Stechman, M.J.; Pearce, L.; Moug, S.; McCarthy, K.; Hewitt, J.; Carter, B. The role of C-reactive protein as a prognostic marker in COVID-19. International Journal of Epidemiology, 2021; 50, 420–429. [Google Scholar]
- Zhang, L.; Yan, X.; Fan, Q.; Liu, H.; Liu, X.; Liu, Z.; et al. D-dimer levels on admission to predict in-hospital mortality in patients with Covid-19. J Thromb Haemost. Junho de 2020, 18, 1324–9. [Google Scholar] [CrossRef] [PubMed]
- Tang, N.; Li, D.; Wang, X.; Sun, Z. Abnormal coagulation parameters are associated with poor prognosis in patients with novel coronavirus pneumonia. J Thromb Haemost. April of 2020, 18, 844–847. [Google Scholar] [CrossRef] [PubMed]
- Wang, D.; Hu, B.; Hu, C.; Zhu, F.; Liu, X.; Zhang, J.; et al. Clinical Characteristics of 138 Hospitalized Patients With 2019 Novel Coronavirus–Infected Pneumonia in Wuhan, China. JAMA. 17 of March of 2020, 323, 1061. [Google Scholar] [CrossRef] [PubMed]
- Zhao, J.; Yang, Y.; Huang, H.; Li, D.; Gu, D.; Lu, X.; et al. Relationship between the ABO Blood Group and the COVID-19 Susceptibility [Internet]. Epidemiology; 2020 mar [22 of june of 2020]. [CrossRef]
- Grifoni, A.; Weiskopf, D.; Ramirez, S.I.; Mateus, J.; Dan, J.M.; Moderbacher, C.R.; et al. Targets of T Cell Responses to SARS-cov-2 Coronavirus in Humans with COVID-19 Disease and Unexposed Individuals. Cell, 2020; 181, 1489–1501.e1. [Google Scholar]
- del Valle-Mendoza, J.; Tarazona-Castro, Y.; Merino-Luna, A. Comparison of cytokines levels among COVID-19 patients living at sea level and high altitude. BMC Infect Dis, 2022; 22, 96. [Google Scholar] [CrossRef]
- Cao, W.; Li, T. COVID-19: towards understanding of pathogenesis. Cell Res. May of 2020, 30, 367–369. [Google Scholar]
- Prompetchara, E.; Ketloy, C.; Palaga, T. Immune responses in COVID-19 and potential vaccines: Lessons learned from SARS and MERS epidemic. Asian Pac J Allergy Immunol [Internet]. 2020 [13 of may of 2020]; Acessed in: http://apjai-journal.org/wp-content/uploads/2020/02/Covid_AP-200220-0772.pdf.
- Henry, B.M.; de Oliveira, M.H.S.; Benoit, S.; Plebani, M.; Lippi, G. Hematologic, biochemical and immune biomarker abnormalities associated with severe illness and mortality in coronavirus disease 2019 (COVID-19): a meta-analysis. Clin Chem Lab Med. 25 of June of 2020, 58, 1021–1028. [Google Scholar] [CrossRef] [PubMed]
Figure 1.
Gate strategy to set T lymphocytes by flow cytometry. (a) Gate strategy to set T (CD3+) from peripheral blood mononuclear cells. (b) Subsets of TCD4+/TCD8+ according CD3+ and CD4+ or CD8+ expression (c) Gating of activated TCD4+/TCD8+ (Ox40+ CD38+); (d) Percentage of TEMRA (CD45RA+CCR7-), naïve (CD45RA+CCR7+), EM (CD45RA-CCR7-) and CM (CD45RA-CCR7+) TCD4+/TCD8+.
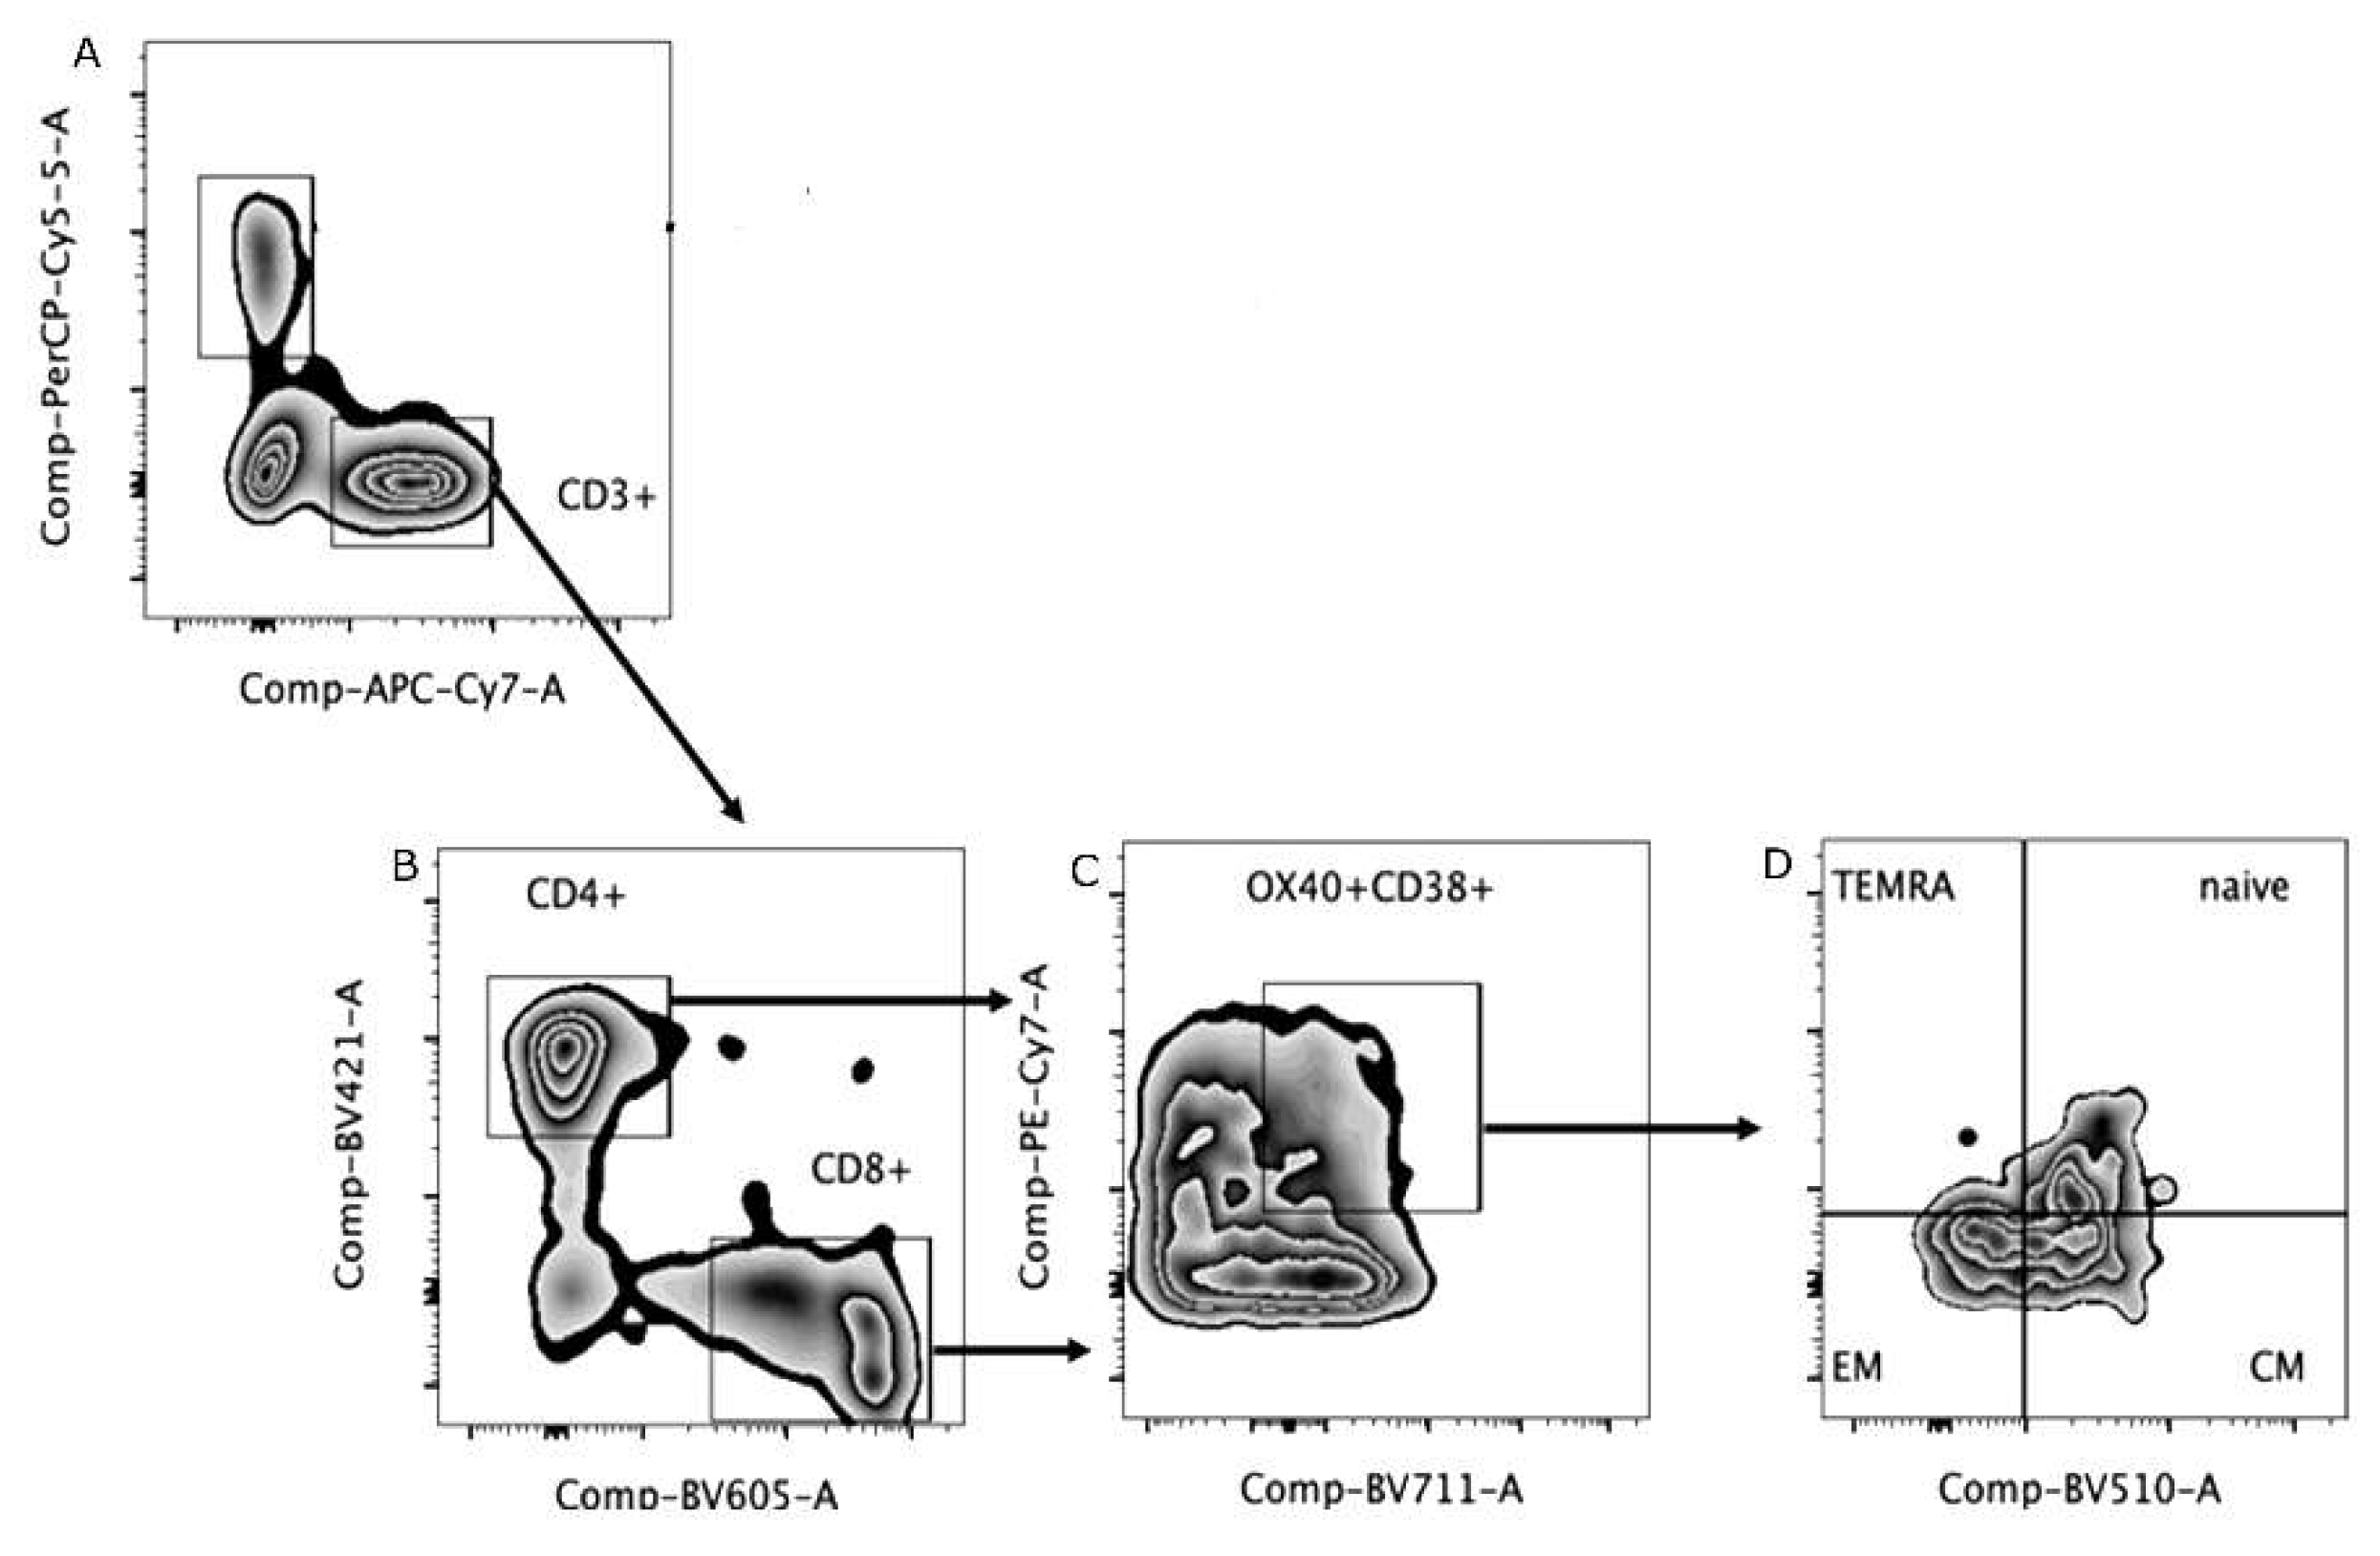
Figure 2.
Percentage of T cells subsets: Central memory T cells TCM CCR7+CD45RA- (blue); Effector memory T cells CCR7-CD45RA- (red); naive T cells CCR7+CD45RA+ (green) and terminally differentiated cells TEMRA CD45RA+CCR7- (white). ANOVA, two-way Kruskal-Wallis test and Dunn's Multiple Comparison Test was used to perform the comparisons among groups. *P-value <0.05.
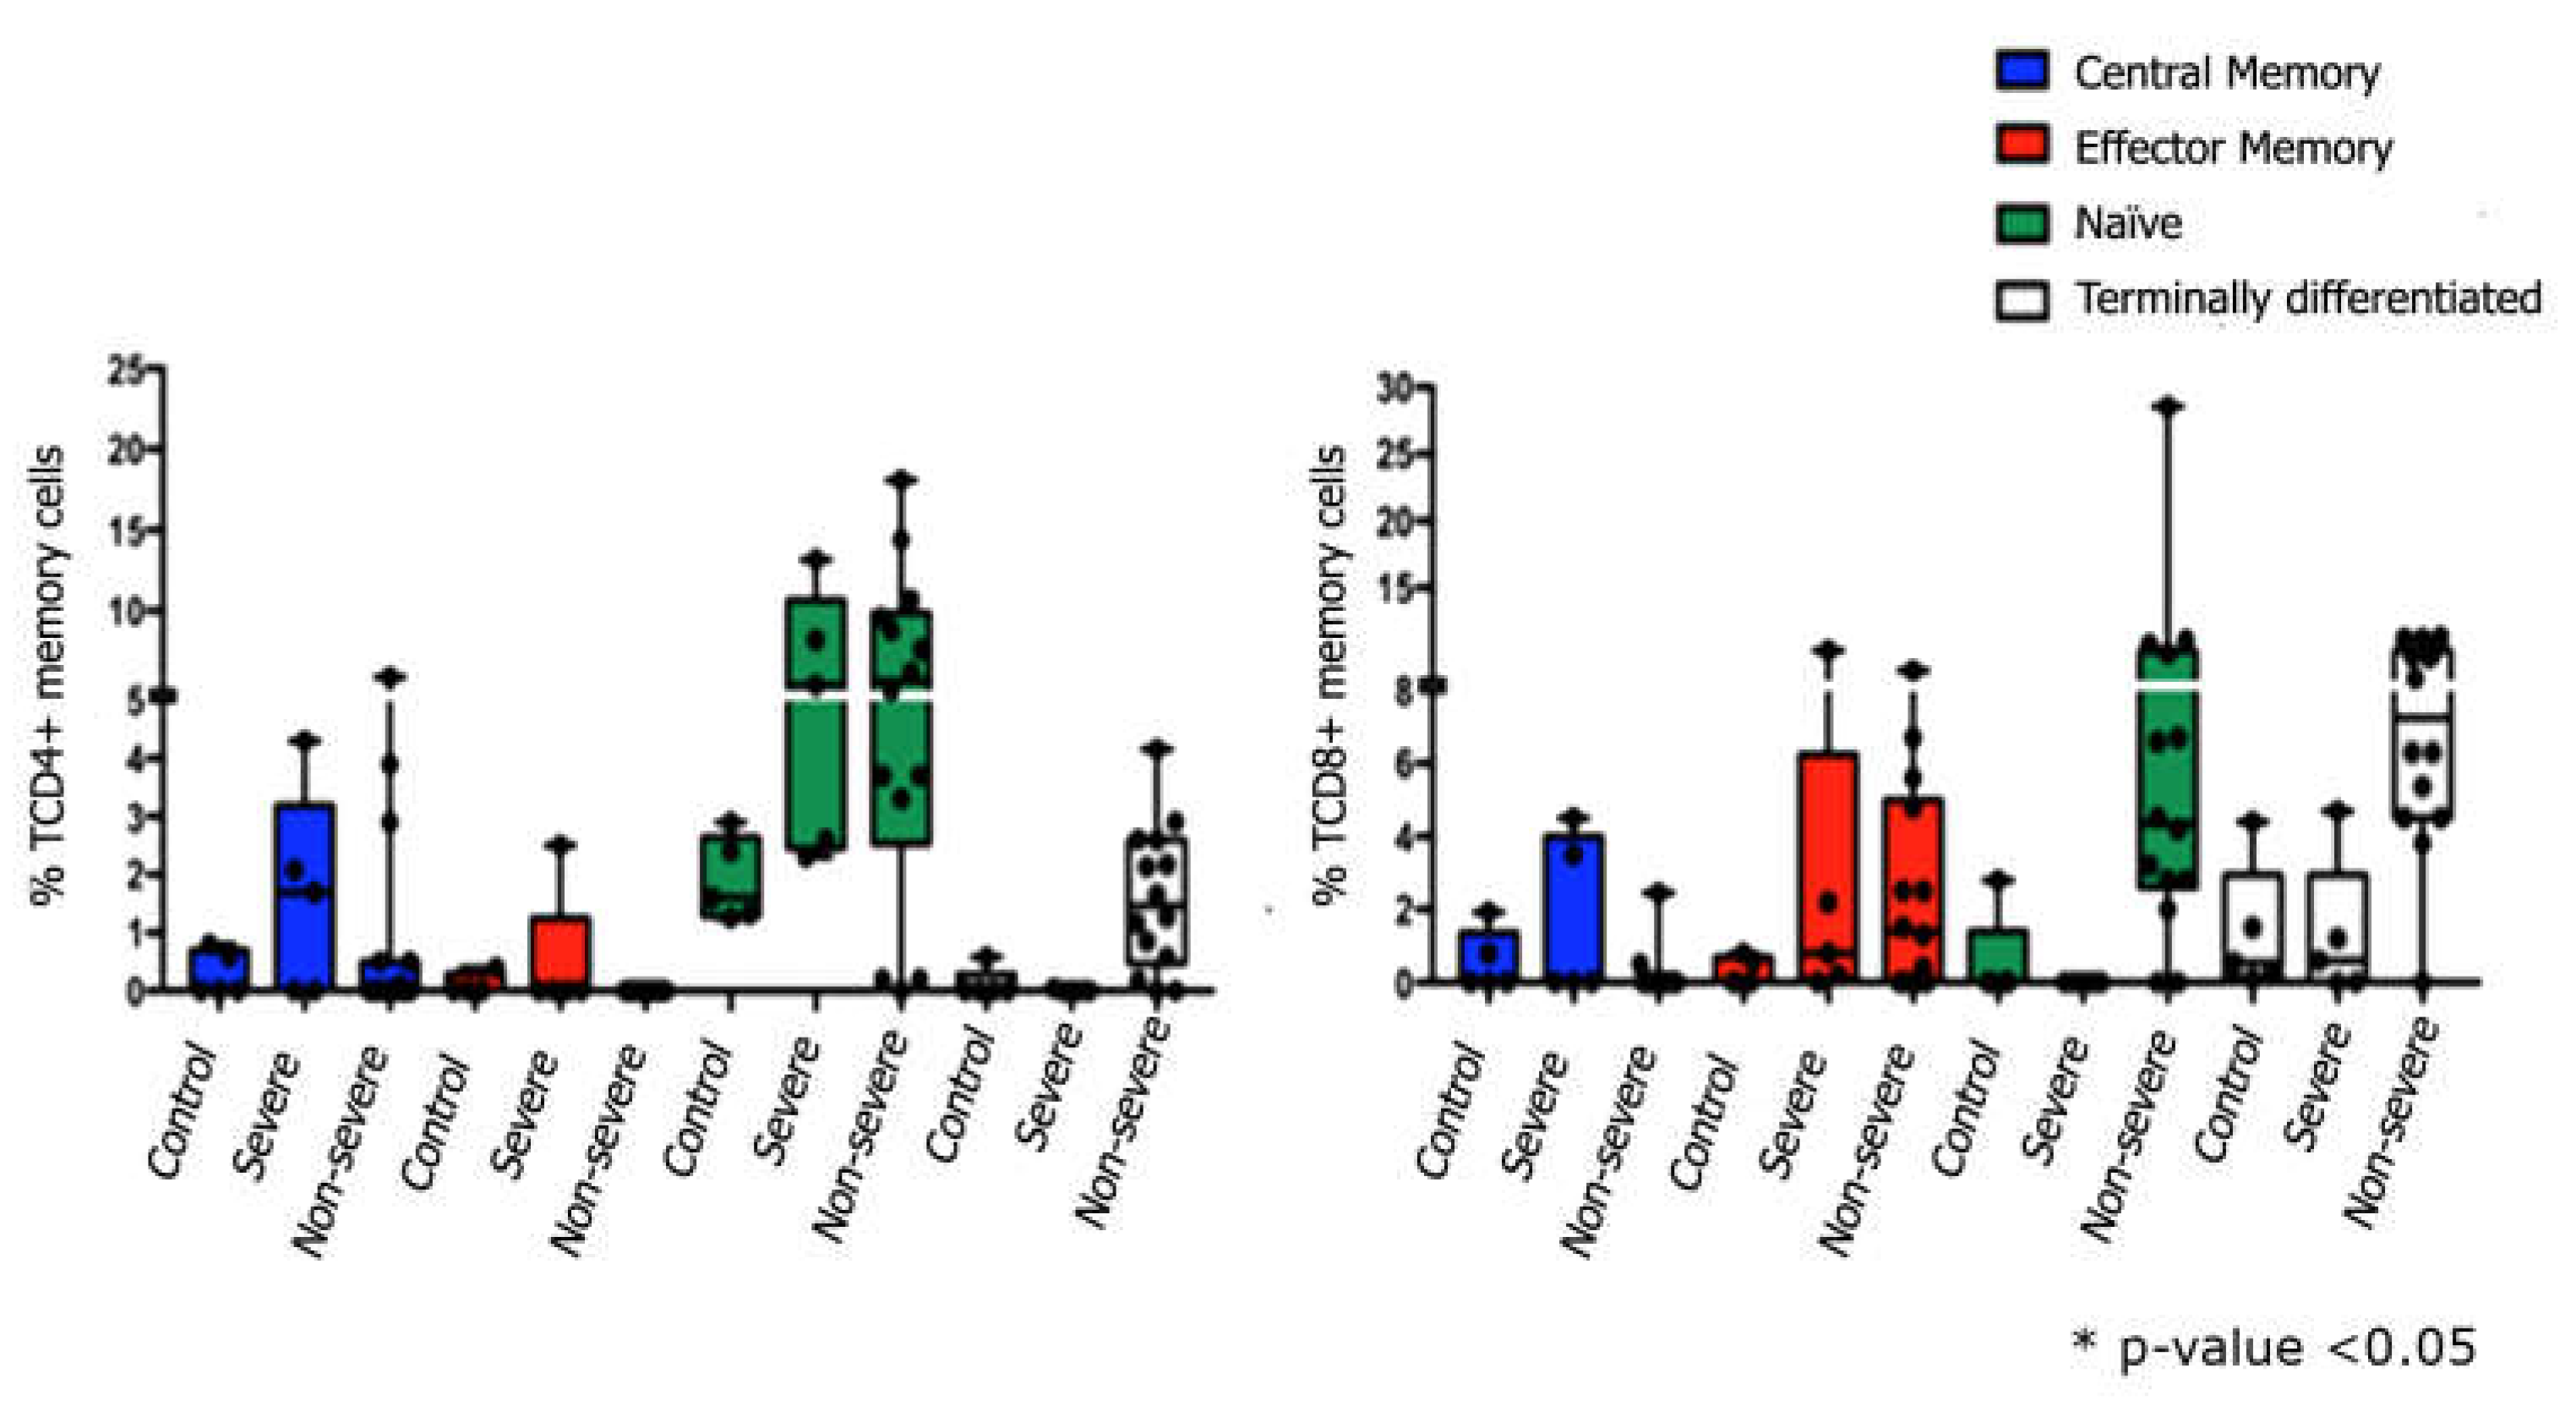
Figure 3.
Cytokine levels in participants infected with SARS-CoV-2 and control group non-infected: Comparing control group (Blue) with the Severe (red) and non-Severe (green) groups. A) IL1β; B) IL-6; C) IL-10; D) TNF-α and E) CXCL8 chemokine.). ANOVA, two-way Kruskal-Wallis test and Dunn's Multiple Comparison Test was used to perform the comparisons among groups. P-values ***<0.0001, **<0.001 and *<0.05.
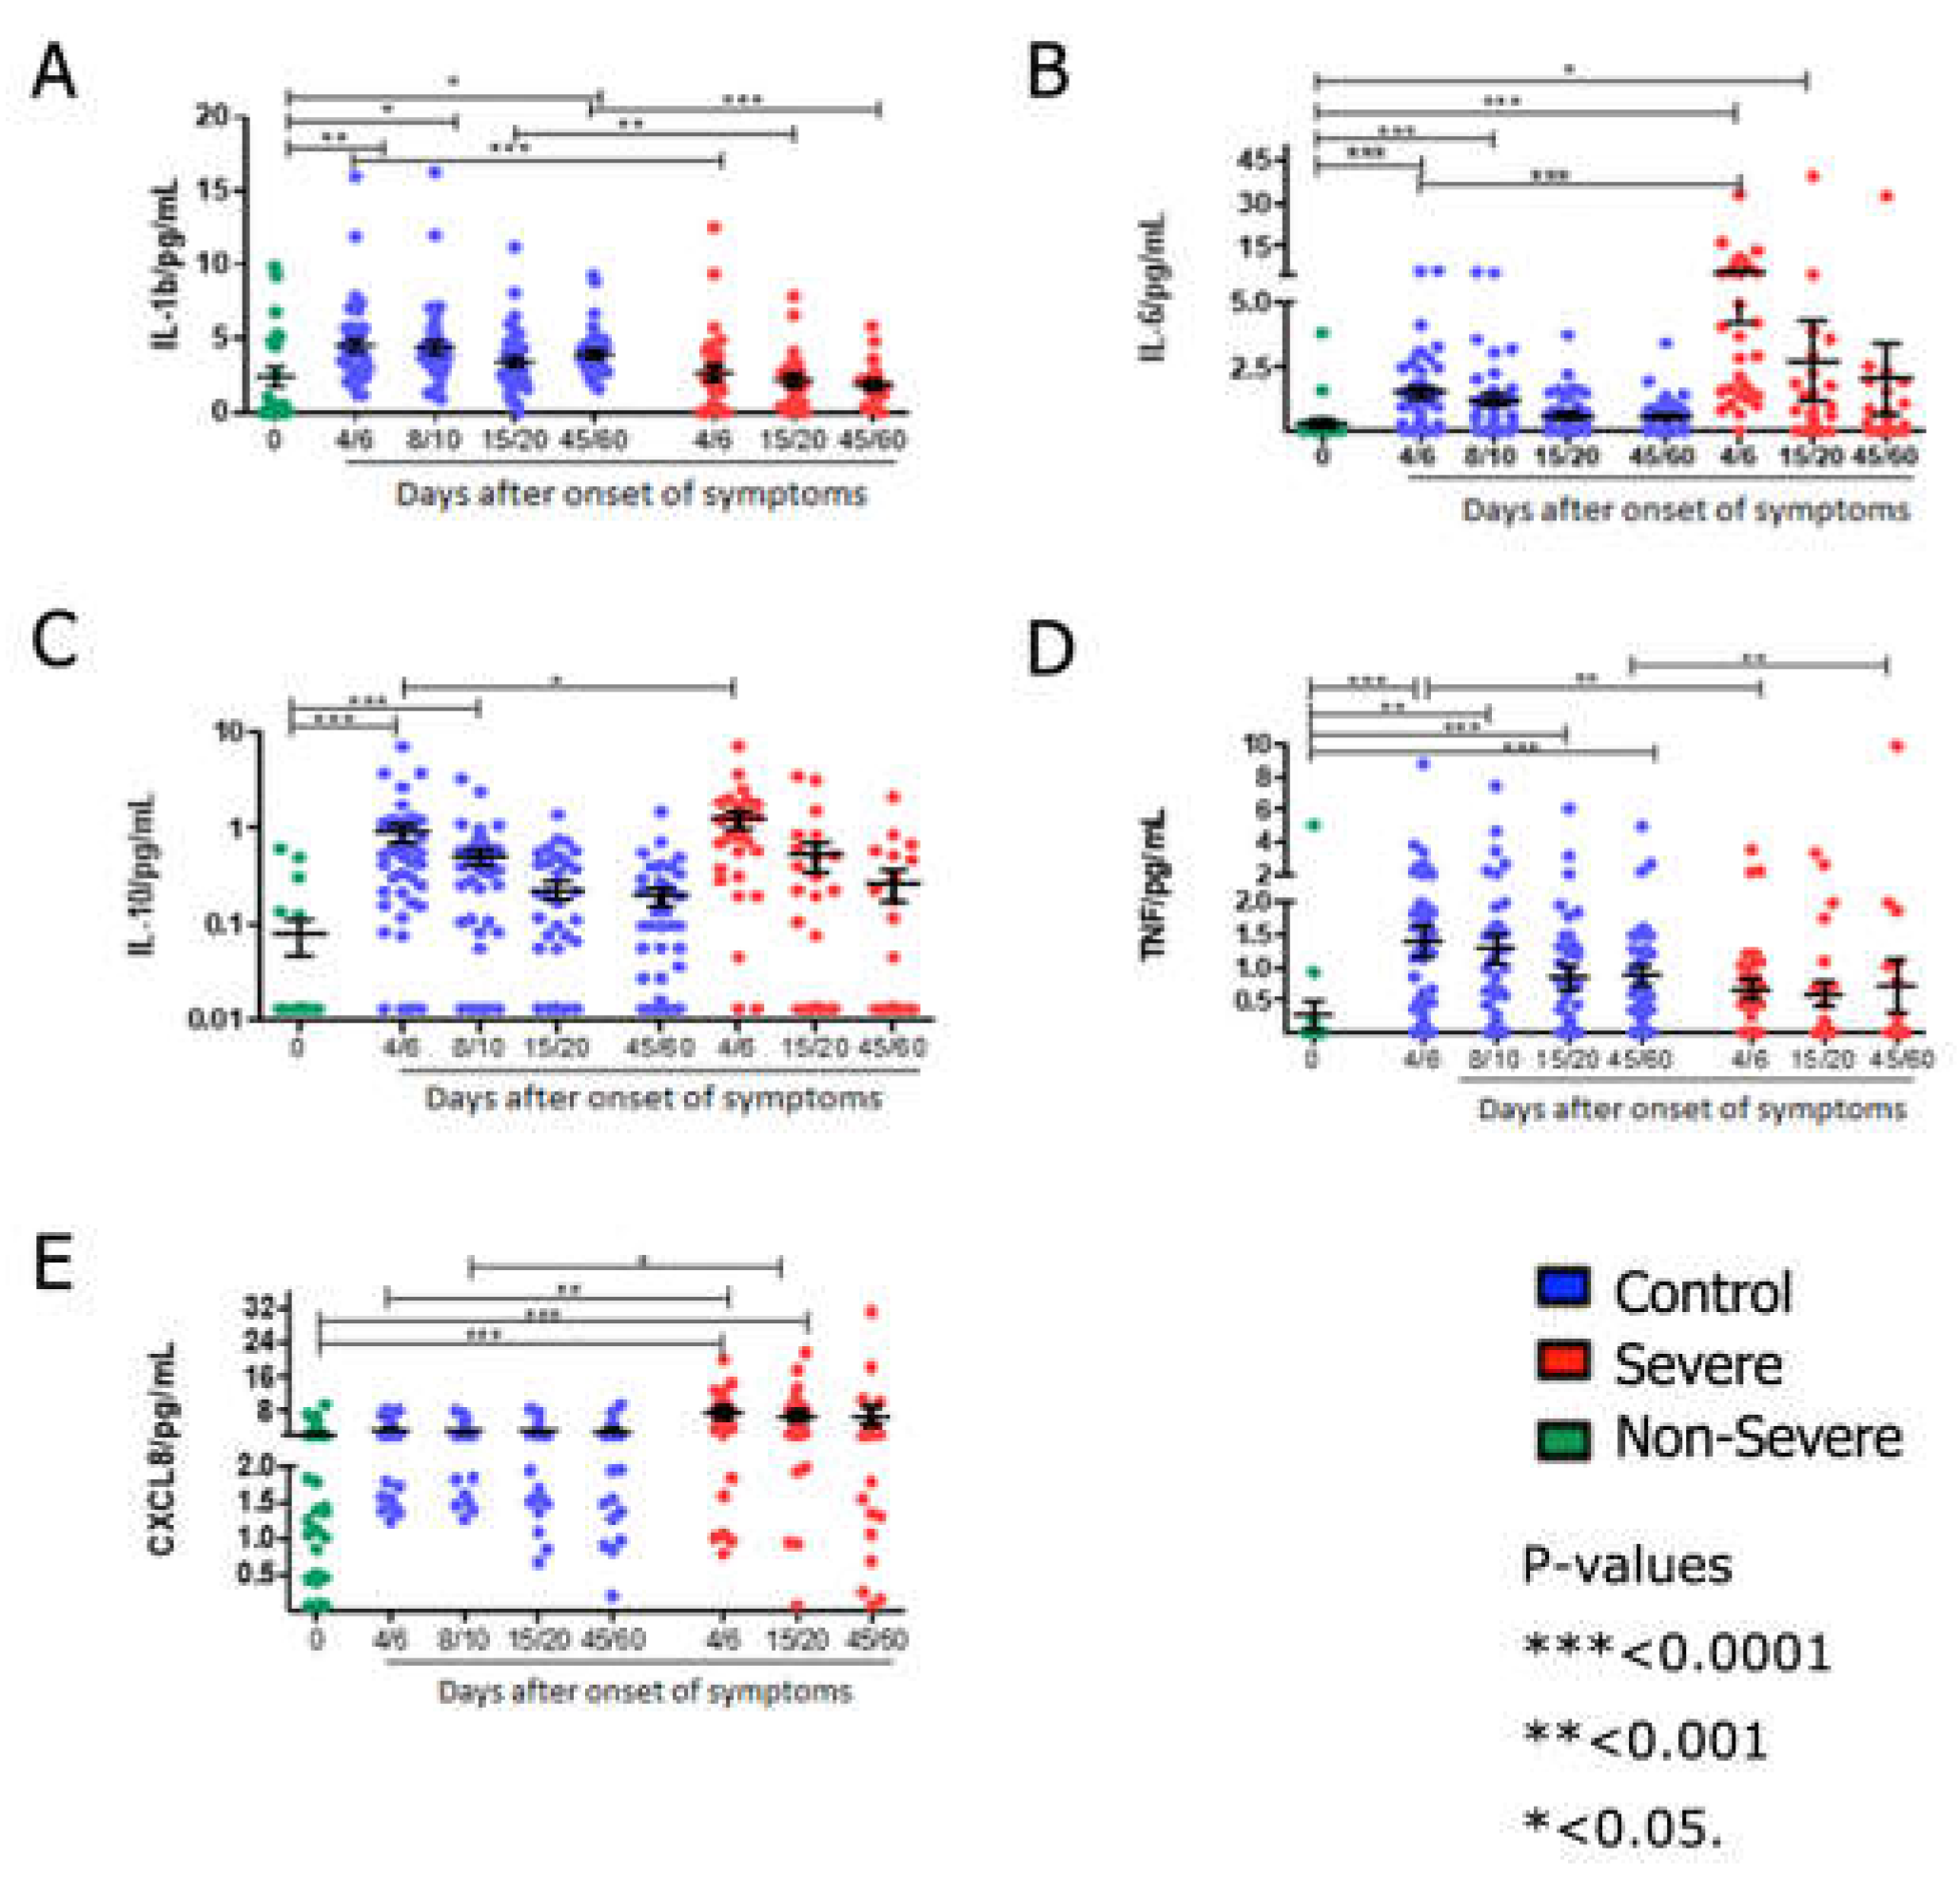
Figure 4.
Percentage of cytokine secreting cells from severe and non-severe patients and no infected control group by FluoroSpot data: A) IFN-γ; B) IL10.
Figure 4.
Percentage of cytokine secreting cells from severe and non-severe patients and no infected control group by FluoroSpot data: A) IFN-γ; B) IL10.
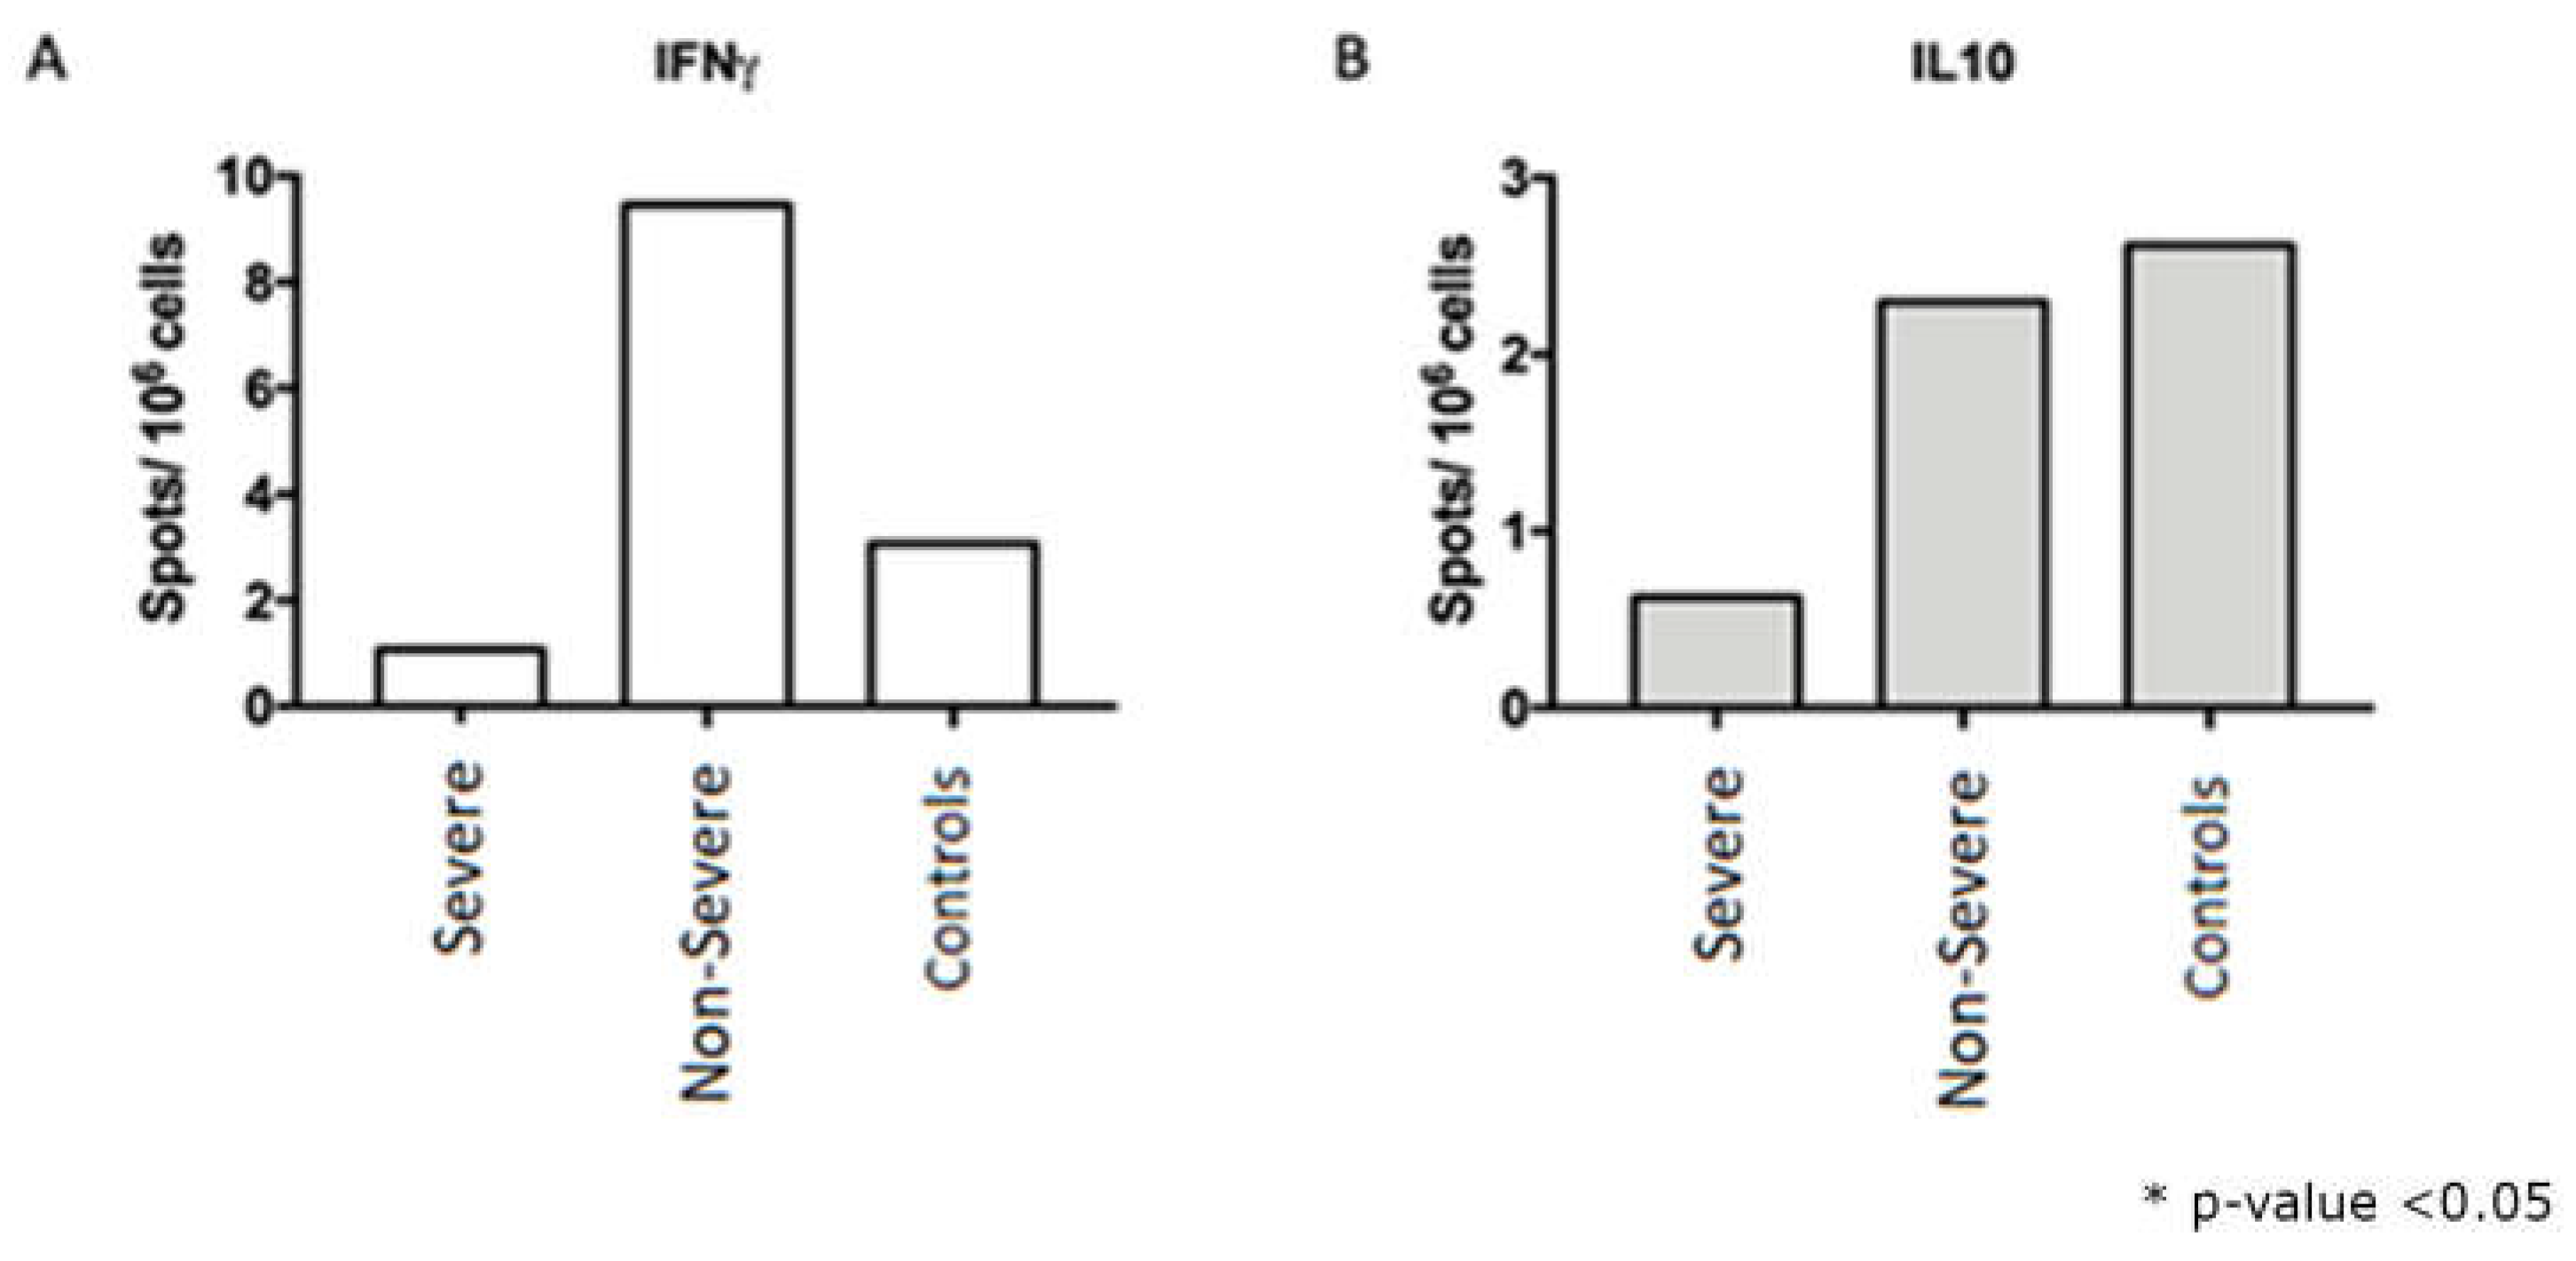

Table 1.
Distribution of participants according to medical conditions *Fisher’s exact test.
| Medical Conditions | Severe | Non-Severe | Total | ||||
|---|---|---|---|---|---|---|---|
| (N=31) | (N=42) | (N=73) | |||||
| n | % | N | % | n | % | p-value* | |
| Diabetes Mellitus | 0,016 | ||||||
| Yes | 11 | 35,5 | 4 | 9,5 | 15 | 20,5 | |
| No | 20 | 64,5 | 38 | 90,5 | 58 | 79,5 | |
| Hipertension | 0,015 | ||||||
| Yes | 16 | 51,6 | 9 | 21,4 | 25 | 34,2 | |
| No | 15 | 48,4 | 33 | 78,6 | 48 | 65,8 | |
| Obesity | 0,8524 | ||||||
| Yes | 5 | 16,1 | 5 | 11,9 | 10 | 13,7 | |
| No | 26 | 83,9 | 37 | 88,1 | 63 | 86,3 | |
| Smoking (currently) | - | ||||||
| Yes | 0 | 0,0 | 0 | 0,0 | 0 | 0,0 | |
| No | 30 | 96,8 | 42 | 100,0 | 72 | 98,6 | |
| Unknown | 1 | 3,2 | 0 | 0,0 | 1 | 1,4 | |
| Ex-smoking | 0,3358 | ||||||
| Yes | 7 | 22,6 | 5 | 11,9 | 12 | 16,4 | |
| No | 23 | 74,2 | 37 | 88,1 | 60 | 82,2 | |
| Unknown | 1 | 3,2 | 0 | 0,0 | 1 | 1,4 | |
| Substance abuse ou misuse | - | ||||||
| Yes | 1 | 3,2 | 0 | 0,0 | 1 | 1,4 | |
| No | 30 | 96,8 | 42 | 100,0 | 72 | 98,6 | |
| Special Needs / Deficiency | - | ||||||
| Yes | 0 | 0,0 | 0 | 0,0 | 0 | 0,0 | |
| No | 31 | 100,0 | 42 | 100,0 | 73 | 100,0 | |
| Cardiovascular Disease | 0,7726 | ||||||
| Yes | 2 | 6,5 | 1 | 2,4 | 3 | 4,1 | |
| No | 29 | 93,5 | 41 | 97,6 | 70 | 95,9 | |
| Chronic Kidney Disease | - | ||||||
| Yes | 0 | 0,0 | 0 | 0,0 | 0 | 0,0 | |
| No | 31 | 100,0 | 42 | 100,0 | 73 | 100,0 | |
| Chronic Liver Disease | - | ||||||
| Yes | 0 | 0,0 | 0 | 0,0 | 0 | 0,0 | |
| No | 31 | 100,0 | 42 | 100,0 | 73 | 100,0 | |
| Chronic Lung Disease | 1000 | ||||||
| Yes | 1 | 3,2 | 1 | 2,4 | 2 | 2,7 | |
| No | 30 | 96,8 | 41 | 97,6 | 71 | 97,3 | |
| Pulmonary tuberculosis being treated | - | ||||||
| Yes | 0 | 0,0 | 0 | 0,0 | 0 | 0,0 | |
| No | 31 | 100,0 | 42 | 100,0 | 73 | 100,0 | |
| Psicologic condiction | 0,7726 | ||||||
| Yes | 2 | 6,5 | 1 | 2,4 | 3 | 4,1 | |
| No | 29 | 93,5 | 41 | 97,6 | 70 | 95,9 | |
| Other chronic disease | 0,7183 | ||||||
| Yes | 2 | 6,5 | 5 | 11,9 | 7 | 9,6 | |
| No | 29 | 93,5 | 37 | 88,1 | 66 | 90,4 | |
| Other condiction | - | ||||||
| Yes | 0 | 0,0 | 0 | 0,0 | 0 | 0,0 | |
| No | 31 | 100,0 | 42 | 100,0 | 73 | 100,0 | |
Table 2.
Laboratory analysis.
| Laboratory analysis | Visit 1 | Visit 2 | Visit 3 | Visit 4 | ||||
|---|---|---|---|---|---|---|---|---|
| Severe | Non Severe | Severe | Non Severe | Severe | Non Severe | Severe | Non Severe | |
| Hemoglobin (g/dL) | ||||||||
| Minimum | 8,4 | 11,3 | 7,7 | 12 | 7,9 | 11,3 | 7,4 | 11,1 |
| Maximum | 16,7 | 16,6 | 12,4 | 16,2 | 15,3 | 15,9 | 15,7 | 16,1 |
| median | 13,5 | 14 | 10,1 | 13,9 | 12,5 | 13,4 | 13,1 | 13,7 |
| Average | 13,2 | 14,3 | 10,1 | 14 | 12,5 | 13,5 | 12,8 | 13,6 |
| Standard deviation | 1,9 | 1,3 | 3,3 | 1,1 | 1,9 | 1,2 | 1,7 | 1,3 |
| Hematocrit (%) | ||||||||
| Minimum | 26,6 | 34,7 | 25,6 | 37 | 26,2 | 34,6 | 22,6 | 34,9 |
| Maximum | 49,7 | 49,9 | 37,4 | 48,5 | 45,8 | 46,8 | 45,8 | 47,2 |
| median | 40,2 | 42,6 | 31,5 | 41,7 | 37,3 | 40,1 | 39,4 | 41,1 |
| Average | 40,1 | 42,8 | 31,5 | 41,9 | 37,8 | 40,5 | 38,7 | 41,1 |
| Standard deviation | 5,3 | 3,7 | 8,3 | 3,1 | 5,2 | 3,3 | 5,1 | 3,2 |
| Global leukocytes (/μL) | ||||||||
| Minimum | 3920 | 2560 | 6730 | 3240 | 5040 | 3400 | 5100 | 3030 |
| Maximum | 18500 | 9920 | 11920 | 10740 | 19040 | 12910 | 16860 | 10720 |
| median | 9070 | 4270 | 9325 | 5240 | 10250 | 5440 | 7115 | 5695 |
| Average | 9596,1 | 4576,1 | 9325 | 5739,3 | 10326 | 5805,6 | 7567,7 | 5758,3 |
| Standard deviation | 3198,4 | 1468,1 | 3669,9 | 1915,6 | 3752,1 | 1868,1 | 2553,6 | 1539,2 |
| Lymphocytes (/μL) | ||||||||
| Minimum | 396 | 726 | 740,3 | 907,4 | 617 | 1145,5 | 1180,2 | 1080 |
| Maximum | 3045 | 2171,5 | 2264 | 3494,4 | 3590 | 3526,4 | 3787 | 3541 |
| median | 1093,3 | 1434,5 | 1502,2 | 1785 | 1663,5 | 1796 | 1983 | 1846,5 |
| Average | 1204 | 1486,2 | 1502,2 | 1788,3 | 1718,6 | 1864,3 | 2119 | 1996,3 |
| Standard deviation | 591,4 | 375,1 | 1077,4 | 536,1 | 665,9 | 493 | 659,5 | 548,2 |
| Platelets (thousand//μL) | ||||||||
| Minimum | 142 | 110 | 162 | 135 | 138 | 165 | 44 | 143 |
| Maximum | 603 | 379 | 464 | 494 | 640 | 480 | 413 | 353 |
| median | 270 | 220 | 313 | 254 | 335 | 268 | 268 | 250,5 |
| Average | 304,4 | 219,2 | 313 | 266,8 | 339,8 | 282,5 | 257,5 | 242,1 |
| Standard deviation | 105,2 | 65,2 | 213,5 | 76,7 | 122,1 | 66 | 91,4 | 51,9 |
| LDH (IU/L) | ||||||||
| Minimum | 374,9 | 138,2 | 571,8 | 135,6 | 243 | 157,2 | 238,9 | 226,6 |
| Maximum | 2460,4 | 632,7 | 830,5 | 825 | 775,9 | 557,9 | 684,9 | 449,2 |
| median | 673,2 | 344,8 | 701,2 | 348,3 | 445,3 | 321,2 | 365,7 | 310,7 |
| Average | 777,1 | 366,7 | 701,2 | 358,4 | 462 | 335,4 | 373,7 | 326,6 |
| Standard deviation | 424,7 | 95,8 | 182,9 | 118,5 | 139,7 | 71,9 | 102,3 | 57,1 |
| Alkaline Phosphatase (IU/L) | ||||||||
| Minimum | 113 | 51,7 | 134 | 91 | 113 | 88 | 127 | 86 |
| Maximum | 418 | 90 | 245 | 357 | 505 | 361 | 351 | 287 |
| median | 195 | 170,5 | 189,5 | 182 | 166 | 175 | 170 | 168 |
| Average | 206,3 | 179 | 189,5 | 183,6 | 195,4 | 189,2 | 195,6 | 175 |
| Standard deviation | 75,9 | 51,7 | 78,5 | 54,5 | 85,3 | 65 | 57,3 | 50,6 |
| TGO/AST (UI/L) | ||||||||
| Minimum | 17 | 12 | 52 | 11 | 10 | 11 | 9 | 11 |
| Maximum | 219 | 116 | 55 | 110 | 65 | 62 | 33 | 63 |
| median | 52 | 24,5 | 53,5 | 21 | 21 | 20 | 17,5 | 18 |
| Average | 63,1 | 28,9 | 53,5 | 24,8 | 27,7 | 21,8 | 18,5 | 20,5 |
| Standard deviation | 52,6 | 16,5 | 2,1 | 15,8 | 16,2 | 9,3 | 6,1 | 9,2 |
| TGP/ALT (UI/L) | ||||||||
| Minimum | 11 | 12 | 47 | 9 | 13 | 10 | 9 | 10 |
| Maximum | 691 | 271 | 113 | 355 | 254 | 272 | 97 | 60 |
| median | 72 | 34,5 | 80 | 31 | 53 | 25 | 19 | 20,5 |
| Average | 91,8 | 39,7 | 80 | 41,2 | 64,4 | 37,6 | 24,2 | 23,8 |
| Standard deviation | 121,9 | 40,2 | 46,7 | 52,7 | 56,2 | 44,6 | 17,9 | 13,1 |
| Ultrasensitive C-reactive protein (mg/L) | ||||||||
| Minimum | 2,7 | 0,4 | 17,5 | 0,4 | 1,5 | 0,1 | 0,6 | 0,1 |
| Maximum | 228,4 | 127,8 | 142,2 | 200,9 | 169,9 | 18,4 | 253,2 | 15,1 |
| median | 61 | 3,8 | 79,8 | 1,6 | 7,6 | 1,4 | 3,8 | 1,3 |
| Average | 77,2 | 12 | 79,8 | 14,3 | 20,8 | 3,1 | 16 | 2,5 |
| Standard deviation | 67,2 | 23,4 | 88,2 | 36,9 | 35,2 | 4 | 53,2 | 2,8 |
| D-dimer (ng/mL) | ||||||||
| Minimum | 30 | 1,7 | 1325 | 25 | 25 | 25 | 25 | 25 |
| Maximum | 12968 | 1244 | 6360 | 1981 | 10636 | 3671 | 3040 | 25000 |
| median | 465 | 31 | 3842,5 | 56 | 420 | 30 | 401 | 30 |
| Average | 1451,7 | 178,3 | 3842,5 | 205,2 | 1441,8 | 270,3 | 719,1 | 744,8 |
| Standard deviation | 2734 | 236,3 | 3560,3 | 328 | 2401 | 575 | 903,3 | 3936 |
| Ferritin (ng/mL) | ||||||||
| Minimum | 88,2 | 24,3 | 1062,1 | 4,2 | 80,2 | 16,7 | 25,6 | 12,3 |
| Maximum | 4225 | 1137 | 1788 | 1620,5 | 1290 | 910,3 | 2864,2 | 365,4 |
| median | 1030,5 | 169,1 | 1425,1 | 151,8 | 598,1 | 160,2 | 213 | 103,6 |
| Average | 1300,6 | 270 | 1425,1 | 292,1 | 593,1 | 262,9 | 326,2 | 130,2 |
| Standard deviation | 1115,7 | 272,2 | 513,3 | 336,8 | 346 | 247,6 | 579,2 | 102,1 |
| Creatinine (mg/dL) | ||||||||
| Minimum | 0,5 | 0,5 | 1,1 | 0,5 | 0,4 | 0,5 | 0,5 | 0,6 |
| Maximum | 2,6 | 1,6 | 1,2 | 1,6 | 6 | 1,6 | 2,2 | 1,7 |
| median | 1,1 | 0,8 | 1,2 | 0,8 | 0,9 | 0,9 | 0,8 | 0,8 |
| Average | 1,1 | 0,8 | 1,2 | 0,8 | 1,2 | 0,9 | 0,9 | 0,9 |
| Standard deviation | 0,4 | 0,2 | 0,1 | 0,2 | 1 | 0,2 | 0,3 | 0,2 |
Disclaimer/Publisher’s Note: The statements, opinions and data contained in all publications are solely those of the individual author(s) and contributor(s) and not of MDPI and/or the editor(s). MDPI and/or the editor(s) disclaim responsibility for any injury to people or property resulting from any ideas, methods, instructions or products referred to in the content. |
© 2023 by the authors. Licensee MDPI, Basel, Switzerland. This article is an open access article distributed under the terms and conditions of the Creative Commons Attribution (CC BY) license (http://creativecommons.org/licenses/by/4.0/).
Copyright: This open access article is published under a Creative Commons CC BY 4.0 license, which permit the free download, distribution, and reuse, provided that the author and preprint are cited in any reuse.


