
Submitted:
14 May 2025
Posted:
15 May 2025
You are already at the latest version
Preprints on COVID-19 and SARS-CoV-2
Abstract
Innate immune cells appear to have an important implication in the resolution and/or the aggravation of COVID-19 pathogenesis after infection with SARS-CoV-2. To better appreciate the role of these cells during COVID-19, changes in blood eosinophil, neutrophil and monocyte count, and levels of surface protein markers have been reported. However, analyses at several timepoints of multiple surface markers on granulocytes and monocytes over a period of one month after SARS-CoV-2 infection, are missing. Therefore, in this study, we performed blood eosinophil, neutrophil and monocyte phenotyping using a list of surface proteins and flow cytometry during a period of 30 days after hospitalization of patients with severe SARS-CoV-2 infection. Blood cell counts were reported at seven different timepoints over the 30 day-period as well as measures of multiple mediators in serum using a targeted multiplex assay approach. Our results indicate rapid and important recruitment of blood eosinophils to tissue and a phenotype defined as CD69/CD63/CD125high and CCR3/CD44low during the early phases of hospitalization. Conversely, neutrophil count increased during later timepoints when also neutrophils displayed an immature, activated and immunosuppressive phenotype (i.e., elevated percentage of CD10/CD16low, CD10lowCD177high, CD11bhighCD62Llow, CD16highCD62Llow), corroborated by enhanced serum proteins that are markers of neutrophil activation. Finally, our results suggest a rapid recruitment of non-classical monocytes leaving CD163/CD64/CD32high monocytes in circulation during the very early phase. In conclusion, our study reveals potential very early roles for eosinophils and monocytes in the pathogenesis of COVID-19 with likely reprogramming of eosinophils in the bone marrow. The exact roles of the pro-inflammatory neutrophils, and the functions of the eosinophils and the monocytes as well as these innate immune cell-types interplays need to be further investigated.
Keywords:
eosinophils
; neutrophils
; monocytes
; SARS-CoV-2
; COVID-19
; phenotype
; flow cytometry
; blood
; serum
; cytokines
; multiplex assay
1. Introduction
SARS-CoV-2 infection is accompanied by changes in blood innate immune cell numbers and phenotypes, suggesting a possible implication of these immune cells into the severity or resolution of coronavirus disease-2019 (COVID-19). Eosinopenia is a common characteristic of patients with COVID-19 although a subset of patients with severe COVID-19 displayed blood eosinophil numbers equal to eosinophil numbers in the healthy population [1,2,3,4,5]. Phenotypically, during COVID-19, blood eosinophils display increased CD11b (integrin alpha-M) and decreased CD62L (L-selectin), two surface proteins involved in attachment and rolling on endothelial cells, respectively (5, 6). This eosinophil phenotype (CD11bhighCD62Llow) along with eosinopenia in COVID-19 are associated with refractoriness in response to a formyl peptide, which suggests that eosinophils have an activated phenotype, and eosinophils with full capacity to migrate have already moved from blood to tissue [6]. However, conversely, another study found increased amounts of surface CD62L on blood eosinophils from patients with moderate or severe COVID-19 compared to healthy individuals [4]. In that same study, most patients with COVID-19 also present enhanced surface CD69 amounts on eosinophils, a marker of eosinophil activation, while CD11b was only increased on eosinophils from patients with moderate but not severe COVID-19 (4). Although the number of blood eosinophils decreases in COVID-19, the absolute number of CD69high eosinophils does not change. Thus, the percentage of CD69high or activated blood eosinophils is higher in COVID-19 [4]. Interestingly, CD69high blood eosinophils have decreased amounts of CD62L in healthy individuals but not in COVID-19 patients who had also more CD24 and CD147 on their CD69high eosinophils [4]. Surface CRTH2 (prostaglandin DP2 receptor), a pro-migratory marker is also reduced in COVID-19, particularly severe COVID-19 [3], suggesting again that eosinopenia was due to migration to tissue.
Although controversial [7], conversely to eosinopenia, increased blood neutrophil numbers are observed in patients with COVID-19 and increased absolute neutrophil counts has been associated with more severe presentations of COVID-19 [3,4,8,9]. In COVID-19, circulating neutrophil subsets varying in their maturity and expression of surface markers have been reported, including increased numbers of immature neutrophils released from bone marrow, which correlate with increased IL-6 and COVID-19 disease severity [10]. These immature neutrophils were characterized by elevated CD66b and CD24, and lower CD11b, CD177, CXCR1/2 and CD62L compared to mature neutrophils [4]. In another study, severe COVID-19 patients displayed blood neutrophils with reduced surface CD10 and CD62L and increased CD11b compared to healthy participants, indicating enhanced immaturity and activation state [5]. Of note, a specific neutrophil subset of CD62Llow neutrophils is more prone to form NET-like structures [11,12], which have been found in severe COVID-19 patients and correlates with disease severity and thrombosis. Furthermore, it has been proposed that CD62Llow neutrophils have lowered capacity to adhere and to roll through the endothelial wall leading to increased dwelling time, cell death, and neutrophil extracellular traps formation (NETosis) that can facilitate the development of pulmonary embolism in COVID-19 [13].
Recruitment of monocytes into lung tissue in COVID-19 is associated with increased blood non-classical (NC) (CD14dimCD16high) and decreased classical (CL) (CD14highCD16low) monocytes [14]. In another study, however, patients with a more serious disease trajectory displayed reduced number of blood NC and transitory (T) monocytes, and augmented IL-6 and CX3CL1 [15], a chemokine attracting CX3CR1+ NC monocytes. In addition, in COVID-19, blood monocytes display an activated phenotype (i.e., CD11b/CD16/CD66bhigh) [16] and blood CD169high NC monocytes associate with pro-inflammatory cytokines and eotaxin while CD169high T monocytes associate with impaired lung function [17]. In early COVID-19 infection with pneumonia, patients who died had lower expression of HLA-DR on CL monocyte subsets than survivors and healthy individuals [18] and less of both HLA-DR and CD86 are observed on circulating myeloid cells in moderate versus mild COVID-19 and healthy individuals [19]. Finally, CD163/CD206low monocytes are decreased in severe compared to mild COVID-19, suggesting a more activated phenotype, although females in the severe group display reduced CD11b on CD14dim monocytes [20].
These previous studies mostly focused on a single timepoint lacking longitudinal determination of cell phenotypes that would help to better comprehend changes in the inflammatory innate blood cell populations and their possible role during COVID-19. To address this gap of knowledge, we conducted a longitudinal study with hospitalized patients infected by SARS-Cov-2 to follow their blood cell counts, and phenotypes of granulocytes and monocytes over a period of 30 days. Our hypothesis is that these immune cells present different kinetics vis-à-vis recruitment and activation status during the progression of the disease. To help with the interpretation of the data, we also measured cytokines, chemokines and markers of activation of these cells in the serum of patients and compared their levels with levels in sera from healthy individuals. This integrated approach aimed to provide a more complete view of the innate immune response in COVID-19.
2. Materials and Methods
2.1. Description of the Study and Participants
Forty adults with a diagnosis of COVID-19 documented by SARS-CoV-2 polymerase chain reaction (PCR) and 18 healthy individuals were enrolled in this study for the phenotyping of innate immune cells (Table 1). All patients were hospitalized for respiratory symptoms, including cough and/or breathing difficulties (Table 1). Blood samples were collected at the University Hospital of Lille prospectively over a 30-day period starting from the first day (D1) of the hospitalization. Samples were obtained from August 2020 until November 2020. This study was performed in accordance with the Declaration of Helsinki principles for ethical research. All data were anonymized before analysis. The study was approved by the French data protection agency (CNIL: Commission Nationale de l’informatique et des libertés, registration # DEC20-086) and by the local ethics committee (ID-CRB 2020-A00763-36). Participants were provided with an informed consent form that they signed before enrollment. Control data from healthy subjects were taken from another study looking at the immunogenicity of SARS-CoV-2 vaccine in elderly subjects (NCT04760704). Each healthy subject had signed an informed consent form allowing the reuse of their data for other research purposes.
2.2. Cell Enumeration
Blood cells count and leukocyte subset quantification were performed on the indicated days using a Sysmex XN hematology analyzer (Sysmex, Germany).
2.3. Flow Cytometry
Eosinophil surface markers (CD69, HLA-DR, CCR3, CD125, CRTH2, CD44, CD63), neutrophil surface markers (CD11b, CD62L, CXCR1, CXCR2, CD10, CD16, CD32) and monocyte surface markers (CD68, CD206, CD80, CD163, IFNAR1, IFNAR2, HLA-DR, CD16, CD32, CD64) were analysed using distinct panels (Supplementary Table A1). Details regarding the analyses of eosinophil phenotyping has been previously reported [21]. Briefly, each panel was incubated separately with 100 µL of whole blood for 10 minutes in the dark at room temperature. Red blood cells were lysed using the TQ-Prep system (Beckman-Coulter), followed by two consecutive washes at 1800 rpm for 5 minutes with 3 mL of phosphate-buffered saline (PBS). The cell pellet was resuspended in 300 µL of PBS before acquisition on a standardized CytoFLEX S Flow Cytometer (Beckman Coulter). Data analysis was performed using Kaluza 2.1 software (Beckman Coulter). Detailed gating strategies for identification of each cell-type are provided in Supplementary Figures S1, S2 and S3.
2.4. Luminex
Serum was collected after centrifugation of whole blood and stored at -80°C until analyses. In addition to 18 healthy individuals used for cell phenotyping, 13 sera from healthy participants were added for measurements by Luminex (Table 2). Targeted inflammatory mediators were quantified using the Luminex® Discovery Assay (R&D Systems), following the manufacturer's instructions. Briefly, analyte-specific microbeads coated with capture antibodies were incubated with serum samples diluted 1:2 in the recommended buffer. Bound analytes were detected using biotinylated detection antibodies and a streptavidin-phycoerythrin conjugate. Fluorescence intensity was measured on a Bioplex 200 System (Bio-Rad), ensuring precise and specific quantification of the markers of interest.
2.5. Statistics
All data were analyzed using GraphPad Prism (version 10.4.0). For blood cell counts across different time points, comparisons were performed using a one-way analysis of variance (ANOVA) followed by a Holm-Sidak post-hoc test to correct for multiple comparisons. Non-parametric statistical methods were applied for the analysis of flow cytometry and serum mediator data. Specifically, median fluorescence intensities (MFI) of activation markers at each time point were compared to the corresponding MFI of healthy controls using a Kruskal-Wallis test followed by Dunn’s post-hoc test. Similarly, the concentrations of inflammatory mediators at each time point were compared to those measured in healthy subjects using the same statistical approach. To explore global patterns of variation across time points, Principal Component Analyses (PCA) were performed separately for each immune cell subset. Pairwise correlations between activation markers within each cell type were assessed using Spearman’s rank correlation coefficient. For all statistical tests, a p-value < 0.05 was considered significant.
3. Results
3.1. Participants
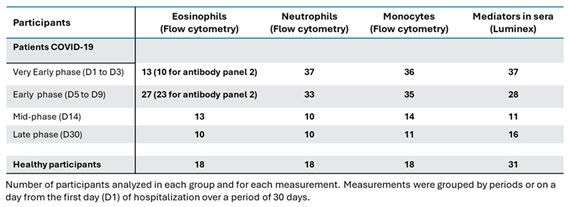
The majority of both patients and healthy individuals were males (Table 1). Patients were mostly in their sixties and experienced dyspnea, cough and/or fever, and were treated with corticosteroids, antibiotics and/or antivirals (Table 1). Of the 40 patients, five died after their hospitalization. Blood cell phenotypic determinations were categorized into four timeframes: “Very Early” (D1 to D3 of hospitalization); “Early” (D5 to D9); “Mid-point” (D14); and “Late” (D30 from D1 of hospitalization) (Table 2). For eosinophil phenotyping by flow cytometry, 13 (antibody panel 1) and 10 (antibody panel 2) patients were analyzed in the “Very Early” (D1 to D3) phase. The reduction of patients from the analysis was due to lack of sufficient number of eosinophils (flow chart in Supplementary Figure S4), which also led to further reduce the numbers of patients included in panel 2 of the antibodies due to technical constraints of the flow cytometry analysis. In addition to the important eosinopenia, some patients either died, were discharged from the hospital, did not come back for blood draw in the following phases, or blood draws were missed at the hospital (Supplementary Figure S4 and Table 2). Neutropenia and monocytopenia were rare in the early phases and thus the numbers of patients analyzed were higher than for the eosinophils (Table 2). Reasons for the reduction in the number of patients at the following visits for neutrophil and monocyte phenotyping were identical to the ones indicated above for eosinophils (Supplementary Figure S4), including hospital discharge, missing blood draws and death. Eosinophil, neutrophil and monocyte phenotypes were determined in 18 healthy participants at one timepoint (Table 2).
3.2. Blood Cell Count During the Hospitalization
Blood eosinophil numbers were very low in the first 5 days of hospitalization and gradually increased at D7 to reach normal counts (~200/mm3) on day-30 after hospitalization (Figure 1). Conversely to eosinophils, the number of blood neutrophils did not change significantly in the first 5 days of hospitalization, but an augmentation occurred starting on D7 until D14 (Figure 1). Monocyte counts were lower at D1 than at D30 and then, progressively increased overtime, quickly reaching levels observed at D30 (Figure 1).
3.3. Blood Eosinophil Phenotype
The major marker of eosinophil activation, CD69, along with CD125 (IL-5 receptor) and CD63 (a marker of secretory activity and degranulation, [22]) were significantly increased for most patients in the very early and early phases after hospitalization compared to healthy individuals (Figure 2). These increases were then followed by normalization at mid-phase (Figure 2). CCR3 expression was reduced during most of the course of the disease (Figure 2) suggesting possible interactions with chemokines [23]. CD44 expression was strongly decreased whereas HLA-DR and CRTH2 levels did not change (Figure 2). Supporting these results, principal component analysis (PCA) of eosinophil surface markers confirmed a clear distinction between COVID-19 patients in the early phases and healthy participants (Figure 3A), reenforcing the distinct eosinophil phenotype during acute COVID-19. PC1 was mainly driven by CD69 (loading=0.860), CD125 (0.803) and CD63 (0.773) whereas PC2 was mainly driven by CCR3 (0.754) and CRTH2 (-0.757) (Figure 3A) and correlation analysis demonstrated strong positive associations between CD69, CD63 and CD125 surface expression (Figure 3B), while CD44 exhibited an inverse correlation with these three markers. Additionally, in agreement with PCA, an association was observed between CCR3 and CRTH2 (Figure 3B).
3.4. Blood Neutrophil Phenotype
Surface level of CD11b and CD62L, two markers of activated or primed neutrophils [24] did not change at any timepoints during hospitalization compared to healthy participants (Figure 4A). However, reductions of CXCR1 and CXCR2 on the neutrophil surface, particularly in the early phases (Figure 4A) may be an indication of interactions with their ligands and chemotaxis toward the tissue [25]. Analyses of neutrophil maturity markers showed increased proportion of blood immature neutrophils characterized by lower CD10 expression and enhanced percentage of CD10/CD16low and CD10lowCD177high neutrophils (Figure 4). Furthermore, activated (CD11bhighCD62Llow) and immunosuppressive (CD16highCD62Llow) neutrophils subpopulations were significantly increased (Figure 4B). Notably, the changes in neutrophil populations were mainly observed during the early phase and mid-phase rather than during the very early and late phases (Figure 4B) suggesting a temporal evolution of neutrophil responses during COVID-19 progression. Note that PCA (Figure 5A) of the seven surface markers shown in Figure 5B did not differentiate COVID-19 patients from healthy individuals as distinctively as for the eosinophils on Figure 3A (Figure 5A). In agreement with data in Figure 4, and the immature neutrophil profile during COVID-19, CD10 correlated with CD16 as well as CXCR2 (Figure 5B). In addition, CD10 strongly correlated with both CD11b and CD32, another marker of activation, strengthening enrichment of an immature and activated blood neutrophil subpopulation in COVID-19 (Figure 5B).
3.5. Blood Monocyte Phenotype
Surface monocyte CD64, CD16 and IFNAR2 were all higher in the very early phase of COVID-19 (Figure 6) and did correlate with each other (Figure 7A). During both early phases, monocytes displayed high levels of CD163 and CD32, while HLA-DR was decreased in early phases and mid-phase (Figure 6). CD32 and IFNRA2 correlated with HLA-DR and CD206, respectively, but neither CD206, CD80, CD68 or IFNAR1 showed changes at any timepoints during hospitalization (Figure 7, Figure 6 and supplementary Figure S5). As for the neutrophils, PCA using all surface markers at all timepoints did not differentiate COVID-19 patients from healthy individuals as distinctively as for the eosinophils (Figure 7B).
3.6. Measurement of Cytokines, Growth Factors and Markers of Cell Activation in Serum
We used the serum from 37 and 28 patients in the very early and early period, respectively (Table 2). The number of sera was then reduced from mid-phase for the same reasons as indicated above when describing flow cytometry (Flow chart in Figure S4). To the 18 healthy individuals used for flow cytometry, sera from 13 other healthy participants were added for the measurement of mediators by Luminex (Table 2). Among the type-2 (T2) and eosinophilic mediators, eotaxin-2 (CCL24) was augmented on both early (D5-D9) and mid-phase (D14) compared to controls, while eotaxin-1 (CCL11) was elevated in the late phase only (Figure 8A). IL-13 increased in both very early and mid-phase while TARC was lower, particularly at the very early phase, before returning to a normal level in the late phase (Figure 8A). This pattern indicates chronological regulation of different chemotactic signals for eosinophils and cells of the type-2 (T2) immune response during COVID-19 progression. None of the other measured mediators related to eosinophils and the T2 response (CCL26, IL-3, IL-4, IL-5, CD44, TSLP or GM-CSF) displayed any significant differences between the different timepoints and between COVID-19 versus controls (Supplementary Figure S6).
Regarding mediators related to neutrophilic activity, MMP8, lactoferrin, lipocalin-2 and MPO (all proteins potentially released by activated neutrophils) were augmented in the serum at all timepoints during COVID-19 (Figure 8B). CXCL1 and CXCL2 were also enhanced at most timepoints suggesting increased neutrophil activation and recruitment (Figure 8B). Proteinase 3 was also increased but displayed very high heterogeneity among patients. Although statistically significant at the early phase, only small changes were seen for IL-8 (Supplementary Figure S6).
Among the other chemokines measured in the serum, CX3CL1 was elevated in the early phases, and the mid-phase suggesting possible rapid enhanced recruitment of non-classical monocytes. In contrast, CCL2, a chemoattractant for classical monocytes, was augmented only at later timepoints (Figure 9A) indicating sequential recruitment of different monocyte subpopulations.
4. Discussion
This study followed the evolution of blood innate immune cells count and phenotype overtime during COVID-19, particularly in the most severely affected patients that required hospitalization. Distinctly from previous studies that had used one or two timepoints during the disease, the present kinetics allow us to better comprehend changes during the disease. We found that while blood eosinophil counts quickly and dramatically dropped after infection with SARS-Cov-2, their phenotype changed into CD69/CD125/CD63high, and CD44/CCR3low. Blood monocytes count was also lower on the first day of hospitalization when their phenotype was CD64/CD16/IFNAR2high. Unlike eosinophils and monocytes, the number of neutrophils did not change significantly during the very early days but rather after 5 days of hospitalization, when also the proportion of immature (CD10/CD16low and CD10lowCD177high) and activated (CD11bhighCD62Llow) blood neutrophils augmented the most significantly.
4.1. Eosinopenia and Change of Phenotype
Our data agrees with previous observations showing eosinopenia during COVID-19 [1,2,3,4,5]. Surprisingly, the quick suppression of blood eosinophil numbers was not concomitant to significant augmentation of blood eotaxins nor any striking changes in T2 markers, suggesting neither eotaxins-driven eosinophil chemotaxis to the tissue nor lack of eosinophil differentiation due to reduced IL-5, may be the causes of eosinopenia. In fact, concerning the latter, previous studies have shown that IL-5, the major cytokine acting on eosinophil differentiation, was rather increased in COVID-19 compared to healthy individuals [26,27]. In addition, our group has previously shown that PBMC from patients with COVID-19 activated with mixed antigens from SARS-CoV-2 produce more IL-5 in the severe COVID-19 population [28]. Regarding eosinophil chemotaxis, other studies have demonstrated migration of eosinophils toward the infected tissue during COVID-19, particularly enhanced numbers of eosinophils in bronchoalveolar lavage (BAL), likely and partially due to an increase of BAL CCL11 (eotaxin-1) [29]. Also, analyses of post-mortem RNA-sequencing with lungs from infected COVID-19 lungs versus normal controls show significant expression upregulation of genes related to eosinophilia such as CLC (Galectin-10), RNASE2 (EDN) and CCL11 (eotaxin-1) [30]. Therefore, although we did not observe major early increases in blood eotaxins, eotaxins and/or other chemokine receptor ligands must be produced in tissues to trigger important recruitment of eosinophils into the lung explaining the occurrence of a “’very early” important eosinopenia in COVID-19.
Augmentation of surface CD69 and reduction of CCR3 are markers of activated mature eosinophils by the beta-chain ligands (IL-3, IL-5 and GM-CSF), in vitro [31,32]. However, unlike what is typically seen with activated mature blood eosinophils, we found here increased CD125 and CD63, reduction of CD44, and lack of change for HLA-DR and CRTH2 in COVID-19. In addition, the blood eosinophil phenotype in COVID-19 did not correspond either to a tissue eosinophil phenotype such as in allergic asthma where activated airway eosinophils displayed a very low amount of surface CD125 and high amounts of CD44 [33]. This suggests that in our hospitalized patients with COVID-19, eosinophils have not been activated after maturation when present in circulating blood, but blood eosinophils rather leave the bone marrow differentially differentiated and matured during COVID-19. Besides, although receptors involved in chemotaxis such as CRTH2 or CCR3 were not changed or were only slightly reduced, we, however, cannot totally rule out that blood eosinophils during COVID-19 represent a small and unique population that have not been recruited into the tissue. Notably, in a T2 disease such as atopic dermatitis, we recently identified a very different blood eosinophil phenotype compared to COVID-19. In fact, in atopic dermatitis, eosinophils displayed no change of surface CD125, which also did not correlate with CD69, but associated instead with CD44 and HLA-DR [21]. The origins and the differential functions of eosinophils with a phenotype characterized as CD69/CD125/CD63high and CD44/CCR3low could be subjects of further investigations, particularly in other viral respiratory diseases such as influenza or respiratory syncytial virus infection.
4.2. Neutrophilia and Change of Phenotype
We observed a slight increase in neutrophil count starting at D7 after hospitalization. This observation supports previously reported changes in neutrophil count during COVID-19 [3,4,8,9], but the lack of concomitance with eosinopenia does not support that eosinopenia was due to reprogramming of the granulocyte precursor toward neutrophils in the bone marrow. However, elevated neutrophils count occurred following a slight augmentation of blood IL-8, a key chemokine for neutrophils, associated with recruitment of immunosuppressive cells [34] and NETosis prone neutrophils. This agrees with the enrichment in the immunosuppressive neutrophil population (i.e. CD16highCD62Llow) found in our study. Besides, early increased serum CXCL1 and CXCL2 in most timepoints, and reduced amounts of surface C-X-C chemokine receptor type 1 (CXCR1) and CXCR2 suggest that a subset of neutrophils migrates to the tissue.
Interestingly, we did not find any significant change of surface CD62L or CD11b on the neutrophil population as reported during acute COVID-19 [10]. Yet, we identified clear changes in neutrophil subpopulations when using two surface markers. Therefore, from the 5th day of hospitalization, blood neutrophils start displaying a clear immature, immunosuppressive and activated phenotype, i.e., CD10/CD16low and CD10lowCD177high, CD16highCD62Llow, CD11bhighCD62Llow, respectively. These neutrophil populations may limit the spread of infection [35] but may also be more prone to NETosis with a possible role in pulmonary embolism [13]. The activated state of blood neutrophils as defined by the enhanced CD11bhighCD62Llow neutrophil population was supported by elevated serum MMP8, MPO, lipocalin-2 and lactoferrin at almost all timepoints after hospitalization, including the late phase of hospitalization. Thus, although these data do not rule out a very early recruitment of neutrophils during COVID-19, it suggests a more delayed and prolonged implication of neutrophils compared to eosinophils, with potential longer damaging effects of immature and immunosuppressive neutrophils.
4.3. Monocytes
Although the decrease of blood monocyte number was only seen at the earlier timepoint, our study agrees with a previous report where monocytes decreased in peripheral blood within a week after the onset of the disease, signifying the efflux of monocytes from blood to pulmonary site [36]. Furthermore, it has been previously proposed that there is an important migration of both inflammatory transitional and non-classical monocytes to the lung during severe COVID-19 leading to lung damage [7,14]. This corroborates with our data where, contrary to CCL2, serum CX3CL1 was quicky augmented suggesting that nonclassical monocytes (NC; CD14+/-CD16++/CX3CR1+) rather than classic monocytes (CL; CD14++CD16−/CCR2+) are the first actors during COVID-19. Supporting a role for NC monocytes, patients with a serious COVID-19 trajectory displayed decreased number of blood NC [15]. Of note, in severe COVID-19 patients, lung tissue monocyte-derived macrophages may recruit neutrophils via the production of ligands for CXCR2 [37]. Therefore, the diminution of blood monocytes was likely the consequence of monocyte migration into tissue and possibly a prelude to recruitment and activation of neutrophils.
In accord with a previous study that reported dysregulated and immature CD163high and HLA-DRlow blood monocytes in severe COVID-19 but not in healthy controls [38], we found elevated CD163 and lower HLA-DR on the surface of monocytes in our study. Further, the high-affinity receptor for IgG (CD64) as well as the interferon-α/β receptor (IFNAR2) were both enhanced at the very early phase after hospitalization, and they were globally strongly correlated overtime. We may speculate that engagement of CD64 with IgG immune complexes can lead to monocyte infection causing cell death and systemic inflammation contributing to COVID-19 pathogenesis [39] whereas type I interferons can activate inflammatory monocytes to develop an early natural killer antiviral response [40].
4.4. Limitations
Our study has several limitations, including the lack of analyses in the lung tissue. Also, the number of patients was unfortunately reduced at some timeframes due to the reasons indicated above in the manuscript. This reduction in the number of patients did not allow us to examine the immune cell phenotypes in relation to characteristics of the disease, which could have been ineffective anyway due to the overall severity of the enrolled patients. In addition, we did not compare SARS-CoV-2 infection with other respiratory viral infections to determine if our results are specific to COVID-19.
5. Conclusions
Our present study examined the evolution of blood innate cells number and phenotype over a relatively long period during hospitalization of patients with COVID-19. We found a dramatic and rapid reduction of blood eosinophil count accompanied by a noticeable change in blood eosinophil phenotype, including enhanced surface CD69, the main marker of eosinophil activation, and CD125 the receptor for IL-5. The phenotypic profile does not match a profile defining an activated mature blood eosinophil and thus suggests a differential programming in the bone marrow. Conversely, the increase in neutrophil number was settled and delayed as were the changes in surface markers. Yet, the presence of immature, immunosuppressive and activated blood neutrophils remained elevated for at least 14 days and up to 30 days after hospitalization with the potential of damaging lung tissues. Our data also point out that non-classical monocytes may have a very early role to control the infection. The role of monocytes/macrophages on neutrophil activation during COVID-19 has already been depicted, but the role of eosinophils in this process remains unknown. Finally, the mediators responsible for the changes in innate immune cell phenotypes during COVID-19 remain unidentified.
Supplementary Materials
The following supporting information can be downloaded at the website of this paper posted on Preprints.org, Figure S1: title; Table S1: title; Video S1: title.
Author Contributions
Conceptualization, J.D. and G.L.; methodology, A.D., J.T., M.J., E.D., J.D. and G.L.; investigation, S.E., A.D. and M.J.; writing—original draft preparation, S.E., A.D., M.J. and J.D.; writing—review and editing, E.D., T.G., F.V., K.F., J.P., M.L., and G.L.; funding acquisition, J.D., and G.L.; All authors have read and agreed to the published version of the manuscript.
Funding
This study was supported by the French government through the Programme Investissement d’Avenir (I-SITE ULNE/ANR-16-IDEX-0004 ULNE).
Institutional Review Board Statement
This study was performed in accordance with the Declaration of Helsinki principles for ethical research. All data were anonymized before analysis. The study was approved by the French data protection agency (CNIL: Commission Nationale de l’informatique et des libertés, registration # DEC20-086) and by the local ethics committee (ID-CRB 2020-A00763-36). Participants were provided with an informed consent form that they signed before enrollment. Control data from healthy subjects were taken from another study looking at the immunogenicity of SARS-Cov-2 vaccine in elderly subjects (NCT04760704). Each healthy subject had signed an informed consent form allowing the reuse of their data for other research purposes.
Informed Consent Statement
Study samples were provided with written informed consent under institutional Human Research Ethics Committee approval.
Data Availability Statement
The datasets generated and/or analyzed during the current study are available from the corresponding author on reasonable request.
Acknowledgments
We would like to thank Séverine Duflos, Marie Broyez, Peggy Bouquet, Clémentine Rolland, Marion Lecorche, Abeer Shaikh Al Arab, Isabelle Tonnerre, Japhete Elenga Koanga, Laurent Schwarb, Emilie Rambaut, and all the nurses implicated in patients’ sampling. In addition, the authors thank all physicians and medical staff involved in patient care. Also, we thank Dr Amali E. Samarasinghe for reading the manuscript.
Conflicts of Interest
The authors declare that they have no relevant conflicts of interest.
Abbreviations
The following abbreviations are used in this manuscript:
| COVID-19 | coronavirus disease 2019 |
| D1 | day 1 |
| MFI | median fluorescence intensity |
| NETosis | neutrophil extracellular traps formation |
| PCA | principal component analysis |
| SARS | severe acute respiratory syndrome |
| T2 | type-2 |
References
- Du, Y.; Tu, L.; Zhu, P.; Mu, M.; Wang, R.; Yang, P.; Wang, X.; Hu, C.; Ping, R.; Hu, P.; et al. Clinical Features of 85 Fatal Cases of COVID-19 from Wuhan. A Retrospective Observational Study. Am. J. Respir. Crit. Care Med. 2020, 201, 1372–1379. [Google Scholar] [CrossRef] [PubMed]
- Zhang JJ, Dong X, Cao YY, Yuan YD, Yang YB, Yan YQ, et al. Clinical characteristics of 140 patients infected with SARS-CoV-2 in Wuhan, China. Allergy. 2020;75(7):1730-41.
- Vitte, J.; Diallo, A.B.; Boumaza, A.; Lopez, A.; Michel, M.; Allardet-Servent, J.; Mezouar, S.; Sereme, Y.; Busnel, J.-M.; Miloud, T.; et al. A Granulocytic Signature Identifies COVID-19 and Its Severity. J. Infect. Dis. 2020, 222, 1985–1996. [Google Scholar] [CrossRef] [PubMed]
- Lourda, M.; Dzidic, M.; Hertwig, L.; Bergsten, H.; Medina, L.M.P.; Sinha, I.; Kvedaraite, E.; Chen, P.; Muvva, J.R.; Gorin, J.-B.; et al. High-dimensional profiling reveals phenotypic heterogeneity and disease-specific alterations of granulocytes in COVID-19. Proc. Natl. Acad. Sci. 2021, 118. [Google Scholar] [CrossRef]
- Jukema, B.N.; Smit, K.; Hopman, M.T.E.; Bongers, C.C.W.G.; Pelgrim, T.C.; Rijk, M.H.; Platteel, T.N.; Venekamp, R.P.; Zwart, D.L.M.; Rutten, F.H.; et al. Neutrophil and Eosinophil Responses Remain Abnormal for Several Months in Primary Care Patients With COVID-19 Disease. Front. Allergy 2022, 3, 942699. [Google Scholar] [CrossRef] [PubMed]
- Koenderman, L.; Siemers, M.J.; van Aalst, C.; Bongers, S.H.; Spijkerman, R.; Bindels, B.J.J.; Giustarini, G.; van Goor, H.M.R.; Kaasjager, K.A.H.; Vrisekoop, N. The Systemic Immune Response in COVID-19 Is Associated with a Shift to Formyl-Peptide Unresponsive Eosinophils. Cells 2021, 10, 1109. [Google Scholar] [CrossRef]
- Sánchez-Cerrillo, I.; Landete, P.; Aldave, B.; Sánchez-Alonso, S.; Sánchez-Azofra, A.; Marcos-Jiménez, A.; Ávalos, E.; Alcaraz-Serna, A.; Santos, I.d.L.; Mateu-Albero, T.; et al. COVID-19 severity associates with pulmonary redistribution of CD1c+ DCs and inflammatory transitional and nonclassical monocytes. J. Clin. Investig. 2020, 130, 6290–6300. [Google Scholar] [CrossRef]
- Lindsley, A.W.; Schwartz, J.T.; Rothenberg, M.E. Eosinophil responses during COVID-19 infections and coronavirus vaccination. J. Allergy Clin. Immunol. 2020, 146, 1–7. [Google Scholar] [CrossRef]
- McKenna, E.; Wubben, R.; Isaza-Correa, J.M.; Melo, A.M.; Mhaonaigh, A.U.; Conlon, N.; O’donnell, J.S.; Cheallaigh, C.N.; Hurley, T.; Stevenson, N.J.; et al. Neutrophils in COVID-19: Not Innocent Bystanders. Front. Immunol. 2022, 13, 864387. [Google Scholar] [CrossRef]
- Carissimo, G.; Xu, W.; Kwok, I.; Abdad, M.Y.; Chan, Y.-H.; Fong, S.-W.; Puan, K.J.; Lee, C.Y.-P.; Yeo, N.K.-W.; Amrun, S.N.; et al. Whole blood immunophenotyping uncovers immature neutrophil-to-VD2 T-cell ratio as an early marker for severe COVID-19. Nat. Commun. 2020, 11, 5243. [Google Scholar] [CrossRef]
- Millrud CR, Kagedal A, Kumlien Georen S, Winqvist O, Uddman R, Razavi R, et al. NET-producing CD16(high) CD62L(dim) neutrophils migrate to tumor sites and predict improved survival in patients with HNSCC. Int J Cancer. 2017;140(11):2557-67.
- Nicolás-Ávila, J.Á.; Adrover, J.M.; Hidalgo, A. Neutrophils in Homeostasis, Immunity, and Cancer. Immunity 2017, 46, 15–28. [Google Scholar] [CrossRef]
- Spijkerman, R.; Jorritsma, N.K.N.; Bongers, S.H.; Bindels, B.J.J.; Jukema, B.N.; Hesselink, L.; Hietbrink, F.; Leenen, L.P.H.; van Goor, H.M.R.; Vrisekoop, N.; et al. An increase in CD62Ldim neutrophils precedes the development of pulmonary embolisms in COVID-19 patients. Scand. J. Immunol. 2021, 93, e13023. [Google Scholar] [CrossRef] [PubMed]
- Zhou, D.; Jin, Y.; Jin, Y.; Shen, Y.; Qu, Q.; Chen, C. The imbalance of circulating PD-L1-expressing non-classical/ classical monocytes is involved in immunocompromised host related pulmonary opportunistic infection. J. Endotoxin Res. 2025, 31. [Google Scholar] [CrossRef]
- Drake, K.A.; Talantov, D.; Tong, G.J.; Lin, J.T.; Verheijden, S.; Katz, S.; Leung, J.M.; Yuen, B.; Krishna, V.; Wu, M.J.; et al. Multi-omic profiling reveals early immunological indicators for identifying COVID-19 Progressors. Clin. Immunol. 2023, 256, 109808. [Google Scholar] [CrossRef] [PubMed]
- Hisamune, R.; Yamakawa, K.; Kayano, K.; Ushio, N.; Wada, T.; Taniguchi, K.; Takasu, A. Phenotypic changes in immune cells induced by granulocyte and monocyte adsorptive apheresis in patients with severe COVID-19: An ex vivo study. Acute Med. Surg. 2024, 11, e70003. [Google Scholar] [CrossRef]
- Park, J.; Dean, L.S.; Jiyarom, B.; Gangcuangco, L.M.; Shah, P.; Awamura, T.; Ching, L.L.; Nerurkar, V.R.; Chow, D.C.; Igno, F.; et al. Elevated circulating monocytes and monocyte activation in COVID-19 convalescent individuals. Front. Immunol. 2023, 14, 1151780. [Google Scholar] [CrossRef] [PubMed]
- Henao-Agudelo, J.S.; Ayala, S.; Badiel, M.; Zea-Vera, A.F.; Cortes, L.M. Classical monocytes-low expressing HLA-DR is associated with higher mortality rate in SARS-CoV-2+ young patients with severe pneumonia. Heliyon 2024, 10, e24099. [Google Scholar] [CrossRef]
- Maher, A.K.; Burnham, K.L.; Jones, E.M.; Tan, M.M.H.; Saputil, R.C.; Baillon, L.; Selck, C.; Giang, N.; Argüello, R.; Pillay, C.; et al. Transcriptional reprogramming from innate immune functions to a pro-thrombotic signature by monocytes in COVID-19. Nat. Commun. 2022, 13, 7947. [Google Scholar] [CrossRef]
- Martínez-Diz, S.; Marín-Benesiu, F.; López-Torres, G.; Santiago, O.; Díaz-Cuéllar, J.F.; Martín-Esteban, S.; Cortés-Valverde, A.I.; Arenas-Rodríguez, V.; Cuenca-López, S.; Porras-Quesada, P.; et al. Relevance of TMPRSS2, CD163/CD206, and CD33 in clinical severity stratification of COVID-19. Front. Immunol. 2022, 13, 1094644. [Google Scholar] [CrossRef]
- Dezoteux, F.; Marcant, P.; Dendooven, A.; Delaunay, É.; Esnault, S.; Trauet, J.; Lefèvre, G.; Staumont-Sallé, D. Enhanced Siglec-8 and HLA-DR and reduced CRTH2 surface expression highlight a distinct phenotypic signature of circulating eosinophils in atopic dermatitis. J. Leukoc. Biol. 2025, 117. [Google Scholar] [CrossRef]
- Carmo, L.A.S.; Bonjour, K.; Ueki, S.; Neves, J.S.; Liu, L.; A Spencer, L.; Dvorak, A.M.; Weller, P.F.; Melo, R.C.N. CD63 is tightly associated with intracellular, secretory events chaperoning piecemeal degranulation and compound exocytosis in human eosinophils. J. Leukoc. Biol. 2016, 100, 391–401. [Google Scholar] [CrossRef]
- Rosenwasser, L.J.; Zimmermann, N.; Hershey, G.K.; Foster, P.S.; Rothenberg, M.E. Chemokines in asthma: Cooperative interaction between chemokines and IL-13. J. Allergy Clin. Immunol. 2003, 111, 227–242. [Google Scholar] [CrossRef] [PubMed]
- Stockfelt, M.; Christenson, K.; Andersson, A.; Björkman, L.; Padra, M.; Brundin, B.; Ganguly, K.; Asgeirsdottir, H.; Lindén, S.; Qvarfordt, I.; et al. Increased CD11b and Decreased CD62L in Blood and Airway Neutrophils from Long-Term Smokers with and without COPD. J. Innate Immun. 2020, 12, 480–489. [Google Scholar] [CrossRef] [PubMed]
- Khandaker, M.H.; Xu, L.; Rahimpour, R.; Mitchell, G.; DeVries, M.E.; Pickering, J.G.; Singhal, S.K.; Feldman, R.D.; Kelvin, D.J. CXCR1 and CXCR2 Are Rapidly Down-Modulated by Bacterial Endotoxin Through a Unique Agonist-Independent, Tyrosine Kinase-Dependent Mechanism. J. Immunol. 1998, 161, 1930–1938. [Google Scholar] [CrossRef]
- Bi, Q.; Zhu, J.; Zheng, J.; Xu, Q.; Chen, J.; Zhang, L.; Mu, X. Blood Inflammatory Markers and Cytokines in COVID-19 Patients With Bacterial Coinfections. Immunity, Inflamm. Dis. 2024, 12, e70105. [Google Scholar] [CrossRef]
- Ju, X.; Son, K.; Jamil, R.; Culgin, S.; Salter, B.; Miyasaki, K.; Fard, N.E.; Xiao, M.; Patel, Z.; Zhang, K.; et al. Eosinophil-independent IL-5 levels are increased in critically ill COVID-19 patients who survive. Allergy, Asthma Clin. Immunol. 2023, 19, 58. [Google Scholar] [CrossRef] [PubMed]
- Demaret J, Lefevre G, Vuotto F, Trauet J, Duhamel A, Labreuche J, et al. Severe SARS-CoV-2 patients develop a higher specific T-cell response. Clinical & translational immunology. 2020;9(12):e1217.
- Zaid, Y.; Doré, É.; Dubuc, I.; Archambault, A.-S.; Flamand, O.; Laviolette, M.; Flamand, N.; Boilard. ; Flamand, L. Chemokines and eicosanoids fuel the hyperinflammation within the lungs of patients with severe COVID-19. J. Allergy Clin. Immunol. 2021, 148, 368–380.e3. [Google Scholar] [CrossRef]
- Gebremeskel, S.; Schanin, J.; Coyle, K.M.; Butuci, M.; Luu, T.; Brock, E.C.; Xu, A.; Wong, A.; Leung, J.; Korver, W.; et al. Mast Cell and Eosinophil Activation Are Associated With COVID-19 and TLR-Mediated Viral Inflammation: Implications for an Anti-Siglec-8 Antibody. Front. Immunol. 2021, 12, 650331. [Google Scholar] [CrossRef]
- Esnault, S.; Hebert, A.S.; Jarjour, N.N.; Coon, J.J.; Mosher, D.F. Proteomic and Phosphoproteomic Changes Induced by Prolonged Activation of Human Eosinophils with IL-3. J. Proteome Res. 2018, 17, 2102–2111. [Google Scholar] [CrossRef]
- Esnault S, Khosravi M, Kelly EA, Liu LY, Bochkov YA, Tattersall MC, et al. Increased IL-6 and Potential IL-6 trans-signalling in the airways after an allergen challenge. Clin Exp Allergy. 2021;51(4):564-73.
- Kelly, E.A.; Esnault, S.; Liu, L.Y.; Evans, M.D.; Johansson, M.W.; Mathur, S.; Mosher, D.F.; Denlinger, L.C.; Jarjour, N.N. Mepolizumab Attenuates Airway Eosinophil Numbers, but Not Their Functional Phenotype, in Asthma. Am. J. Respir. Crit. Care Med. 2017, 196, 1385–1395. [Google Scholar] [CrossRef]
- Alfaro C, Teijeira A, Onate C, Perez G, Sanmamed MF, Andueza MP, et al. Tumor-Produced Interleukin-8 Attracts Human Myeloid-Derived Suppressor Cells and Elicits Extrusion of Neutrophil Extracellular Traps (NETs). Clinical cancer research : an official journal of the American Association for Cancer Research. 2016;22(15):3924-36.
- Papayannopoulos, V. Neutrophil extracellular traps in immunity and disease. Nat. Rev. Immunol. 2018, 18, 134–147. [Google Scholar] [CrossRef]
- Meidaninikjeh, S.; Sabouni, N.; Marzouni, H.Z.; Bengar, S.; Khalili, A.; Jafari, R. Monocytes and macrophages in COVID-19: Friends and foes. Life Sci. 2021, 269, 119010–119010. [Google Scholar] [CrossRef] [PubMed]
- Liao, M.; Liu, Y.; Yuan, J.; Wen, Y.; Xu, G.; Zhao, J.; Cheng, L.; Li, J.; Wang, X.; Wang, F.; et al. Single-cell landscape of bronchoalveolar immune cells in patients with COVID-19. Nat. Med. 2020, 26, 842–844. [Google Scholar] [CrossRef] [PubMed]
- Szabo, P.A.; Dogra, P.; Gray, J.I.; Wells, S.B.; Connors, T.J.; Weisberg, S.P.; Krupska, I.; Matsumoto, R.; Poon, M.M.; Idzikowski, E.; et al. Longitudinal profiling of respiratory and systemic immune responses reveals myeloid cell-driven lung inflammation in severe COVID-19. Immunity 2021, 54, 797–814.e6. [Google Scholar] [CrossRef] [PubMed]
- Junqueira C, Crespo A, Ranjbar S, de Lacerda LB, Lewandrowski M, Ingber J, et al. FcgammaR-mediated SARS-CoV-2 infection of monocytes activates inflammation. Nature. 2022;606(7914):576-84.
- Lee, A.J.; Chen, B.; Chew, M.V.; Barra, N.G.; Shenouda, M.M.; Nham, T.; van Rooijen, N.; Jordana, M.; Mossman, K.L.; Schreiber, R.D.; et al. Inflammatory monocytes require type I interferon receptor signaling to activate NK cells via IL-18 during a mucosal viral infection. J. Exp. Med. 2017, 214, 1153–1167. [Google Scholar] [CrossRef]
Figure 1.
Blood cell count following hospitalization with SARS-CoV-2 infection. Cell count was performed on the indicated days from the first day of hospitalization (D1) until the 30th day (D30). Only the significant differences compared to D30 are shown for the eosinophils. All significant comparisons are shown for the neutrophils and monocytes. Each dot corresponds to one patient. ****p<0.0001 ***p<0.001, **p<0.01, *p<0.05. ANOVA followed by Holm-Sidak’s multiple comparison test.
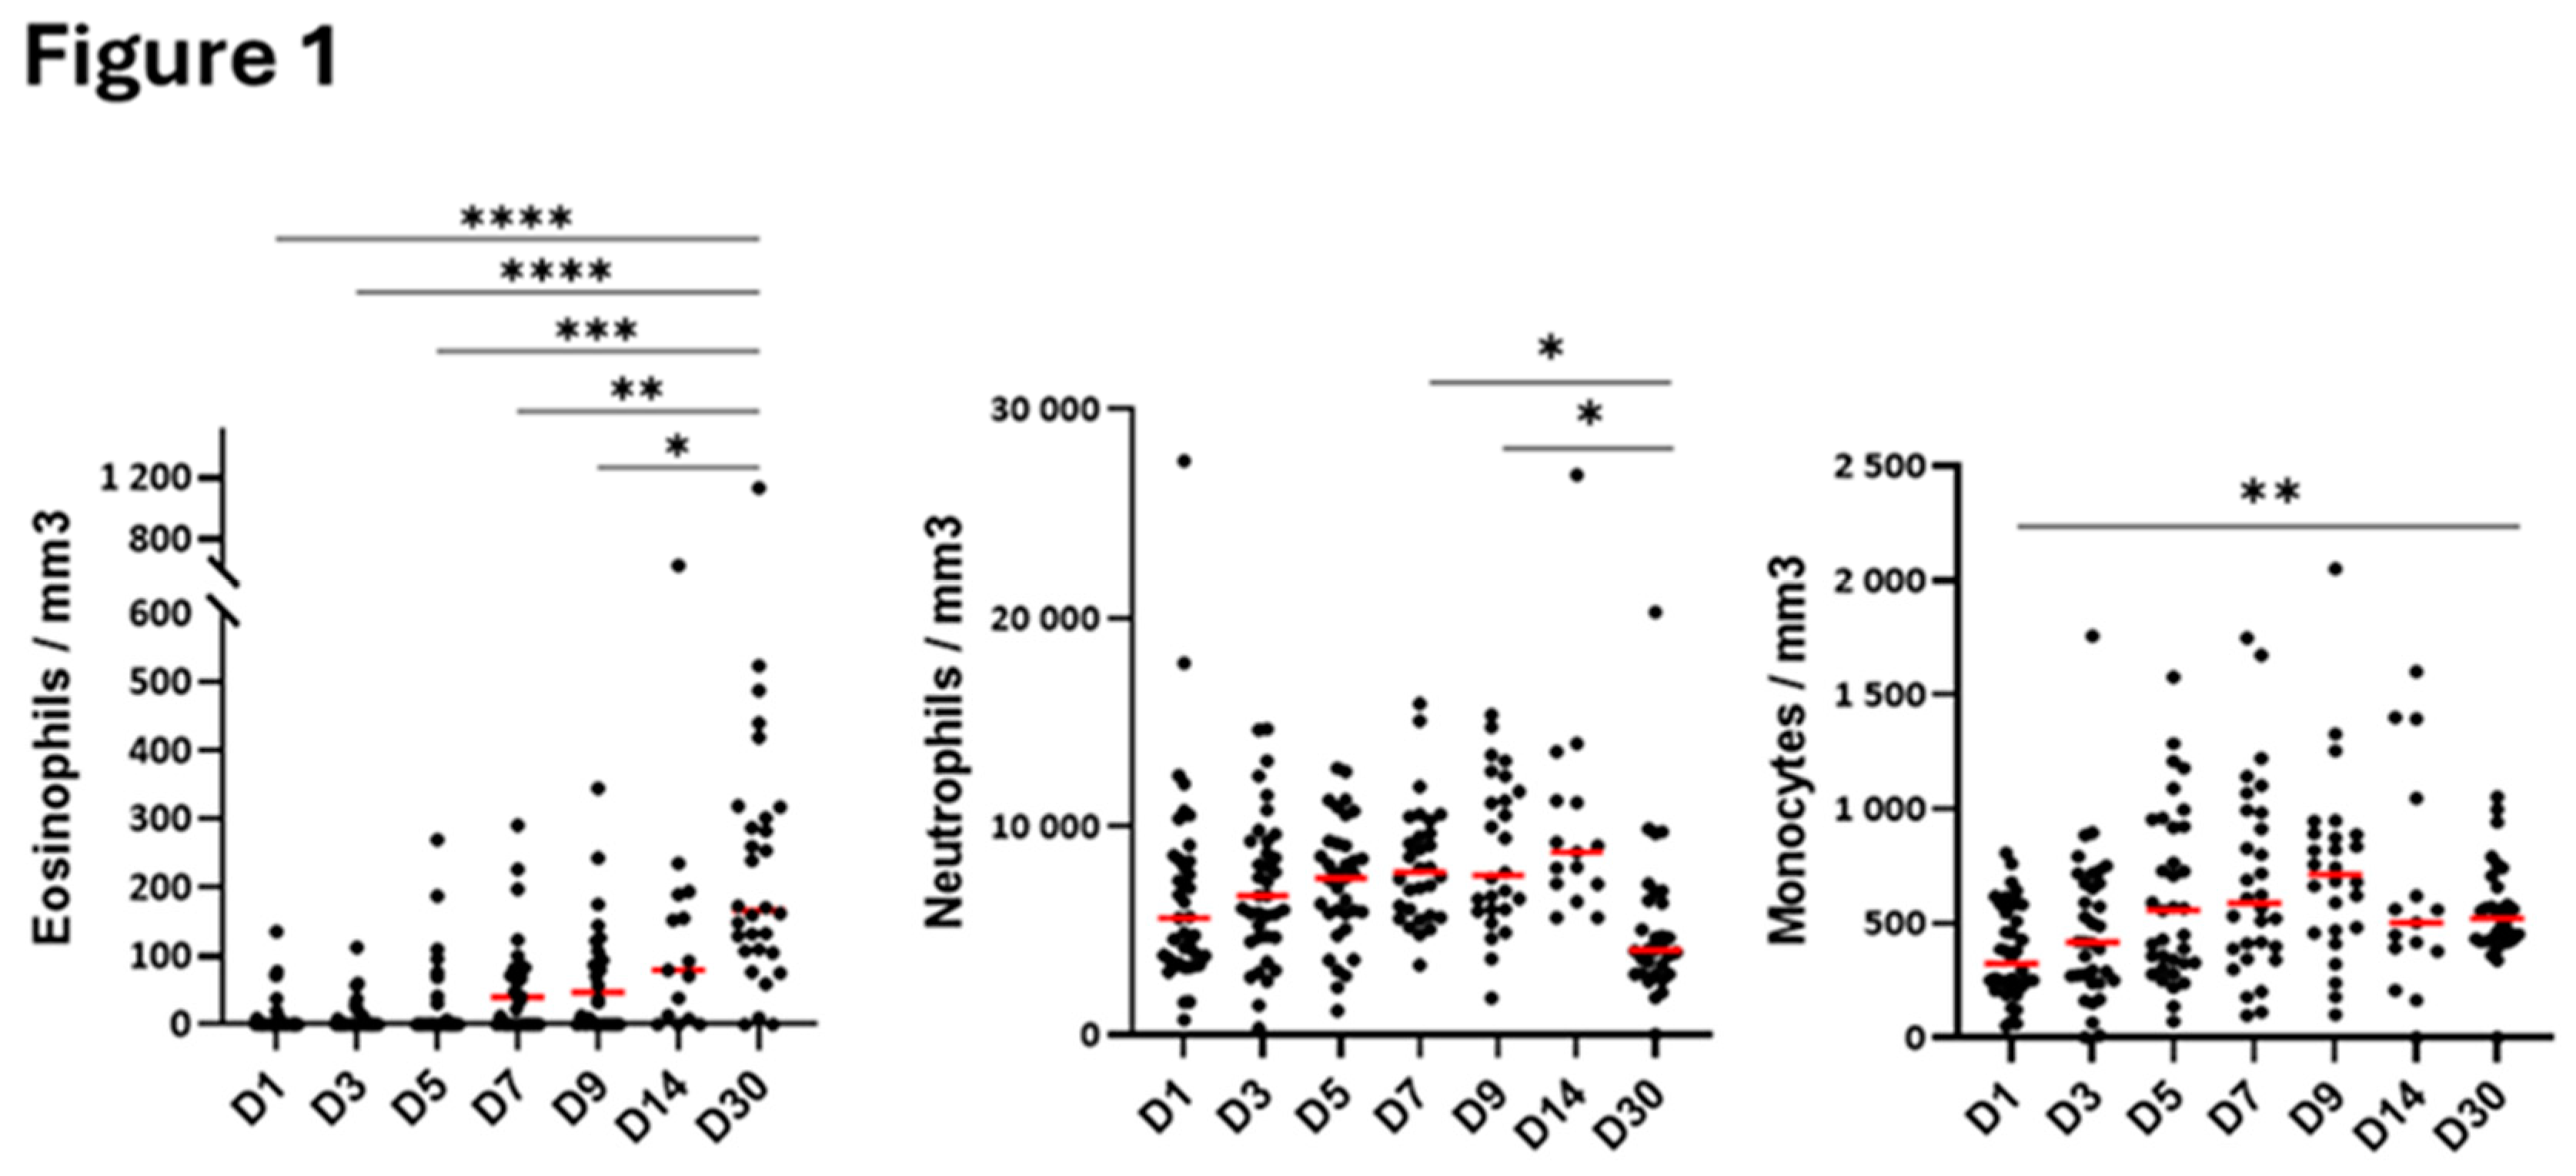
Figure 2.
Level of surface proteins on blood eosinophils overtime after hospitalization with SARS-CoV-2 infection and compared to healthy controls. As shown in Table 2, timepoints were grouped as “Very Early” phase (D1 to D3 from hospitalization), “Early” phase (D5 to D9), “Mid” phase (D14), and “Late” phase (D30). MFI (median fluorescence intensity) for each participant and means are shown. ***p<0.001, **p<0.01, *p<0.05. Kruskal-Wallis test with Dunn’s multiple comparisons test.
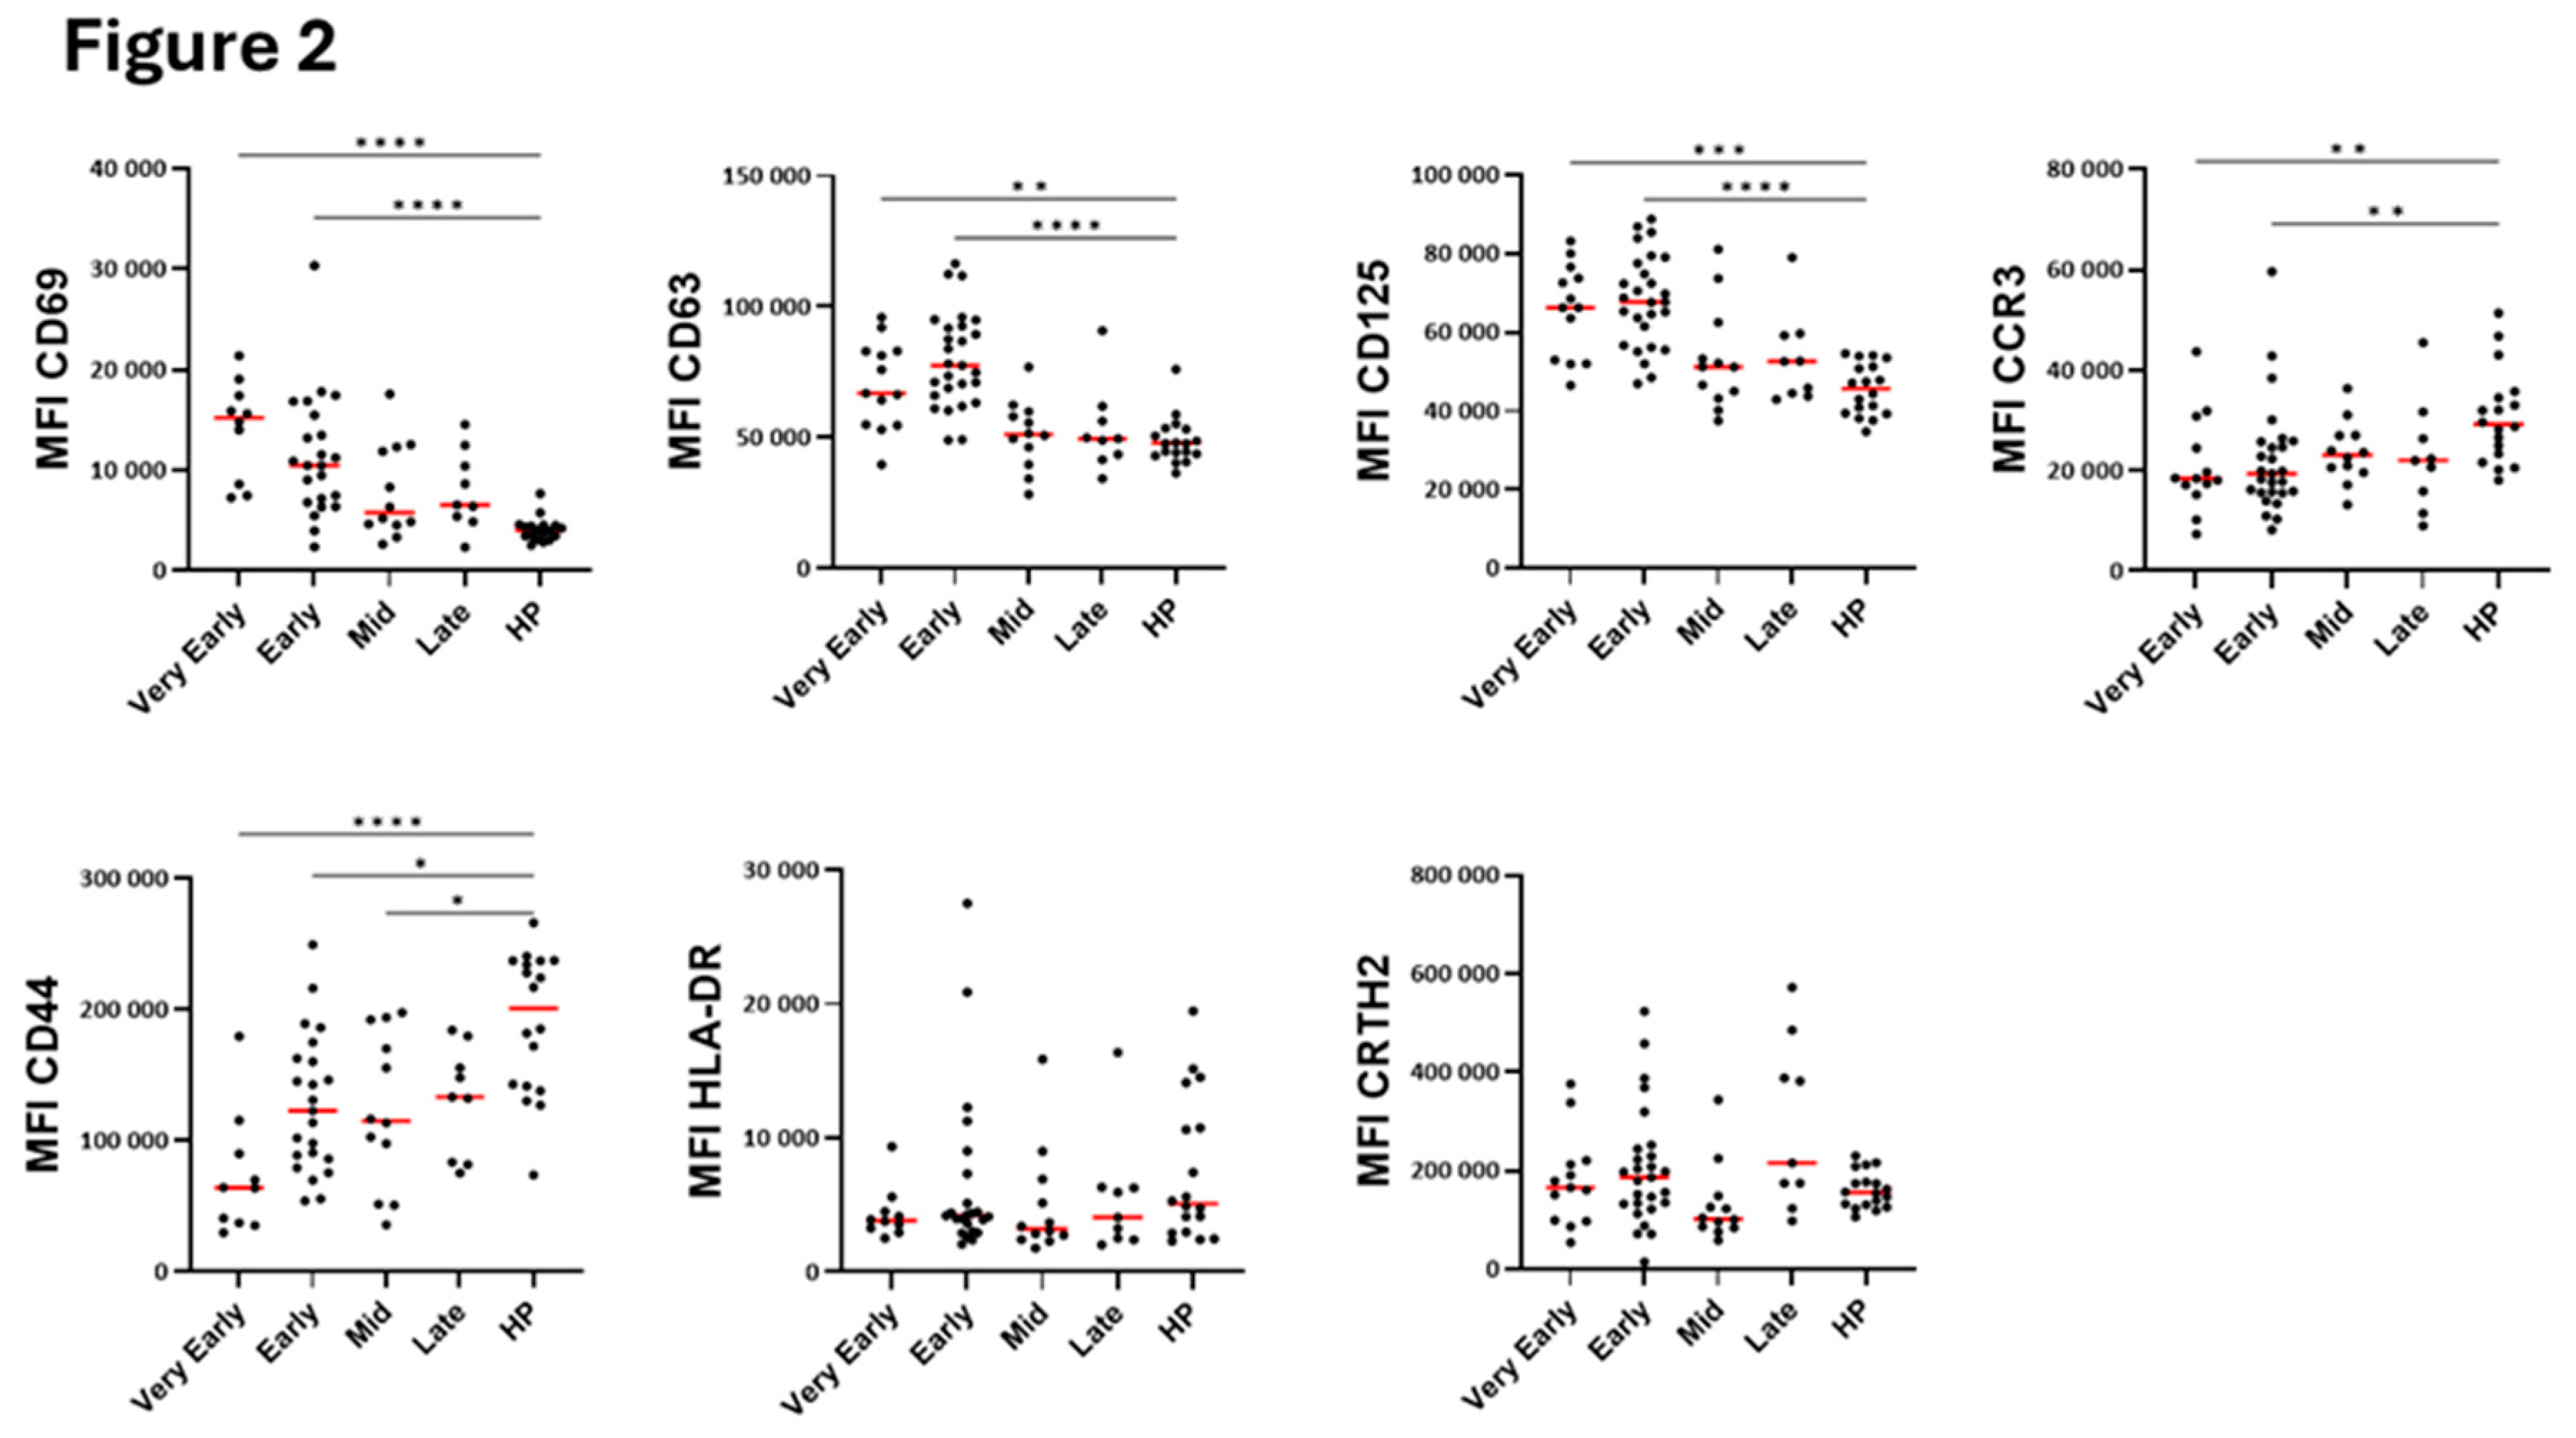
Figure 3.
Principle component and correlative analyses of the level of surface membrane proteins on blood eosinophils. A/ Principal component analysis of the participants divided as healthy participants (HP), very early phase, early phase, mid-phase and late phase COVID-19. PC1 was mostly driven by CD69, CD125 and CD63 and PC2 was mostly driven by CCR3 and CRTH2. B/ Correlative analysis (Spearman) of all surface markers for all timepoints in COVID-19 (n=65 to 75). r values are indicated, ***p<0.001, **p<0.01, *p<0.05.
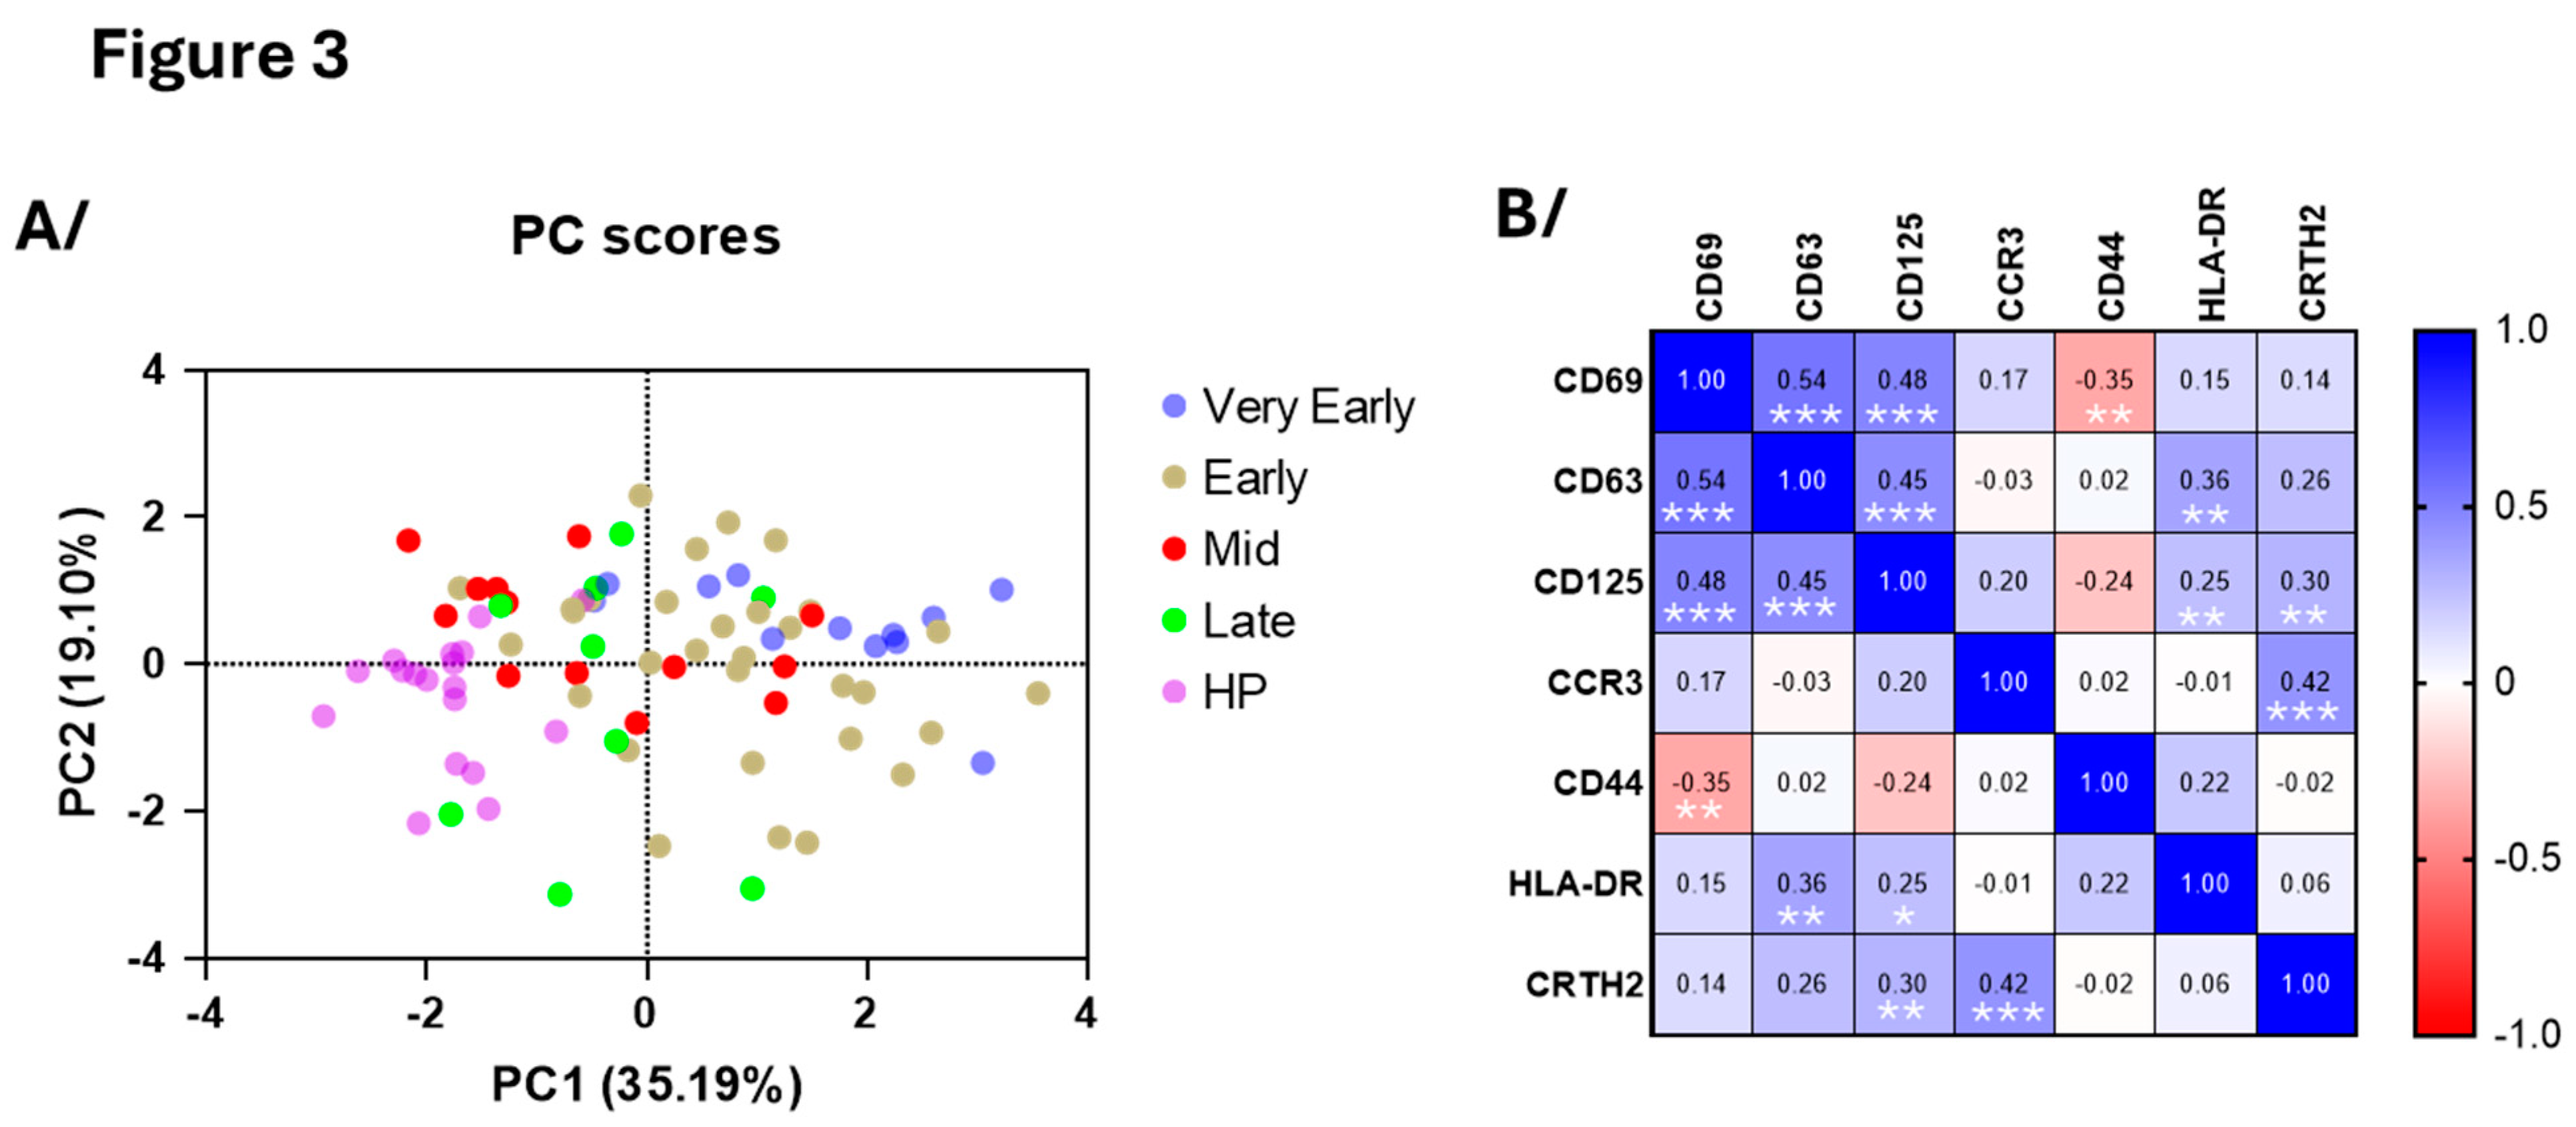
Figure 4.
Level of surface proteins on blood neutrophils overtime after hospitalization with SARS-CoV-2 infection and compared to healthy controls. As shown in Table 2, timepoints were grouped as “Very Early” phase (D1 to D3), “Early” phase (D5 to D9), “Mid” phase (D14), and “Late” phase (D30). A/ Analysis of one surface marker. B/ Analysis of subpopulations using two surface markers. MFI (median fluorescence intensity). ****p<0,0001, ***p<0.001, **p<0.01, *p<0.05.
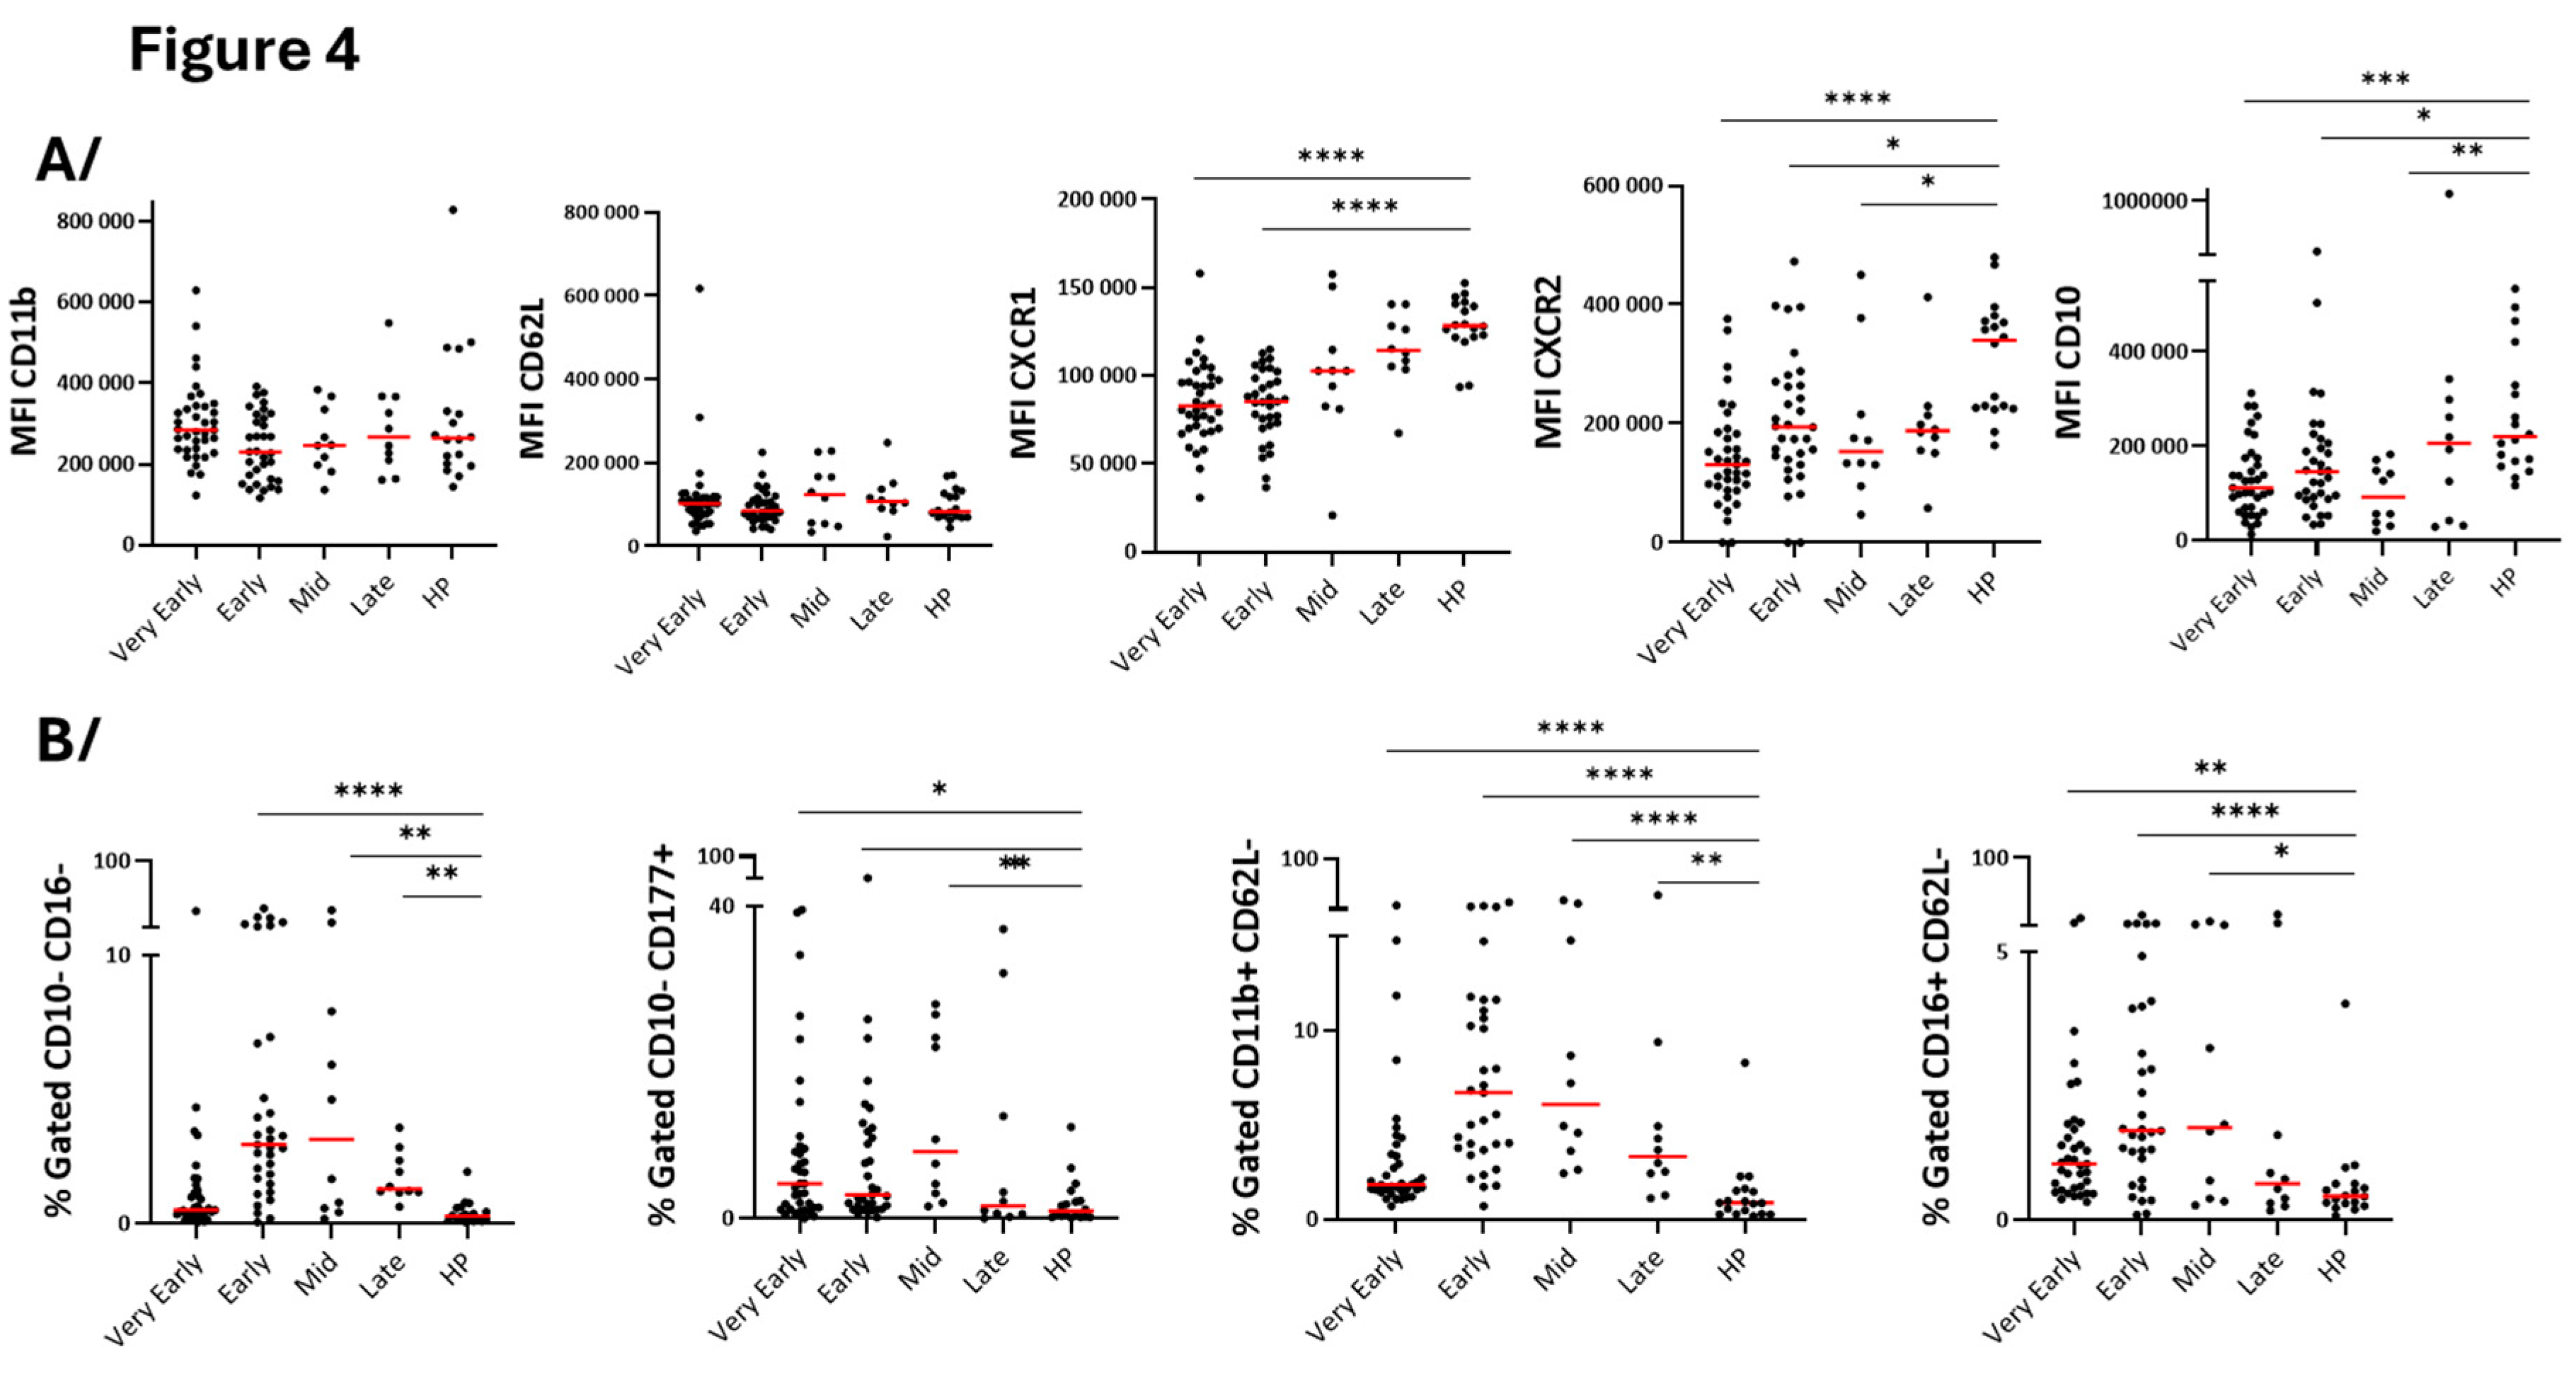
Figure 5.
Principle component and correlative analyses of the level of surface membrane proteins on blood neutrophils. A/ Principal component analysis of the participants divided as healthy participants (HP), very early phase, early phase, mid-phase and late phase COVID-19. B/ Correlative analysis (Spearman) of all surface markers and timepoints in COVID-19 (n= 90). r values are shown, ***p<0.001, **p<0.01, *p<0.05.
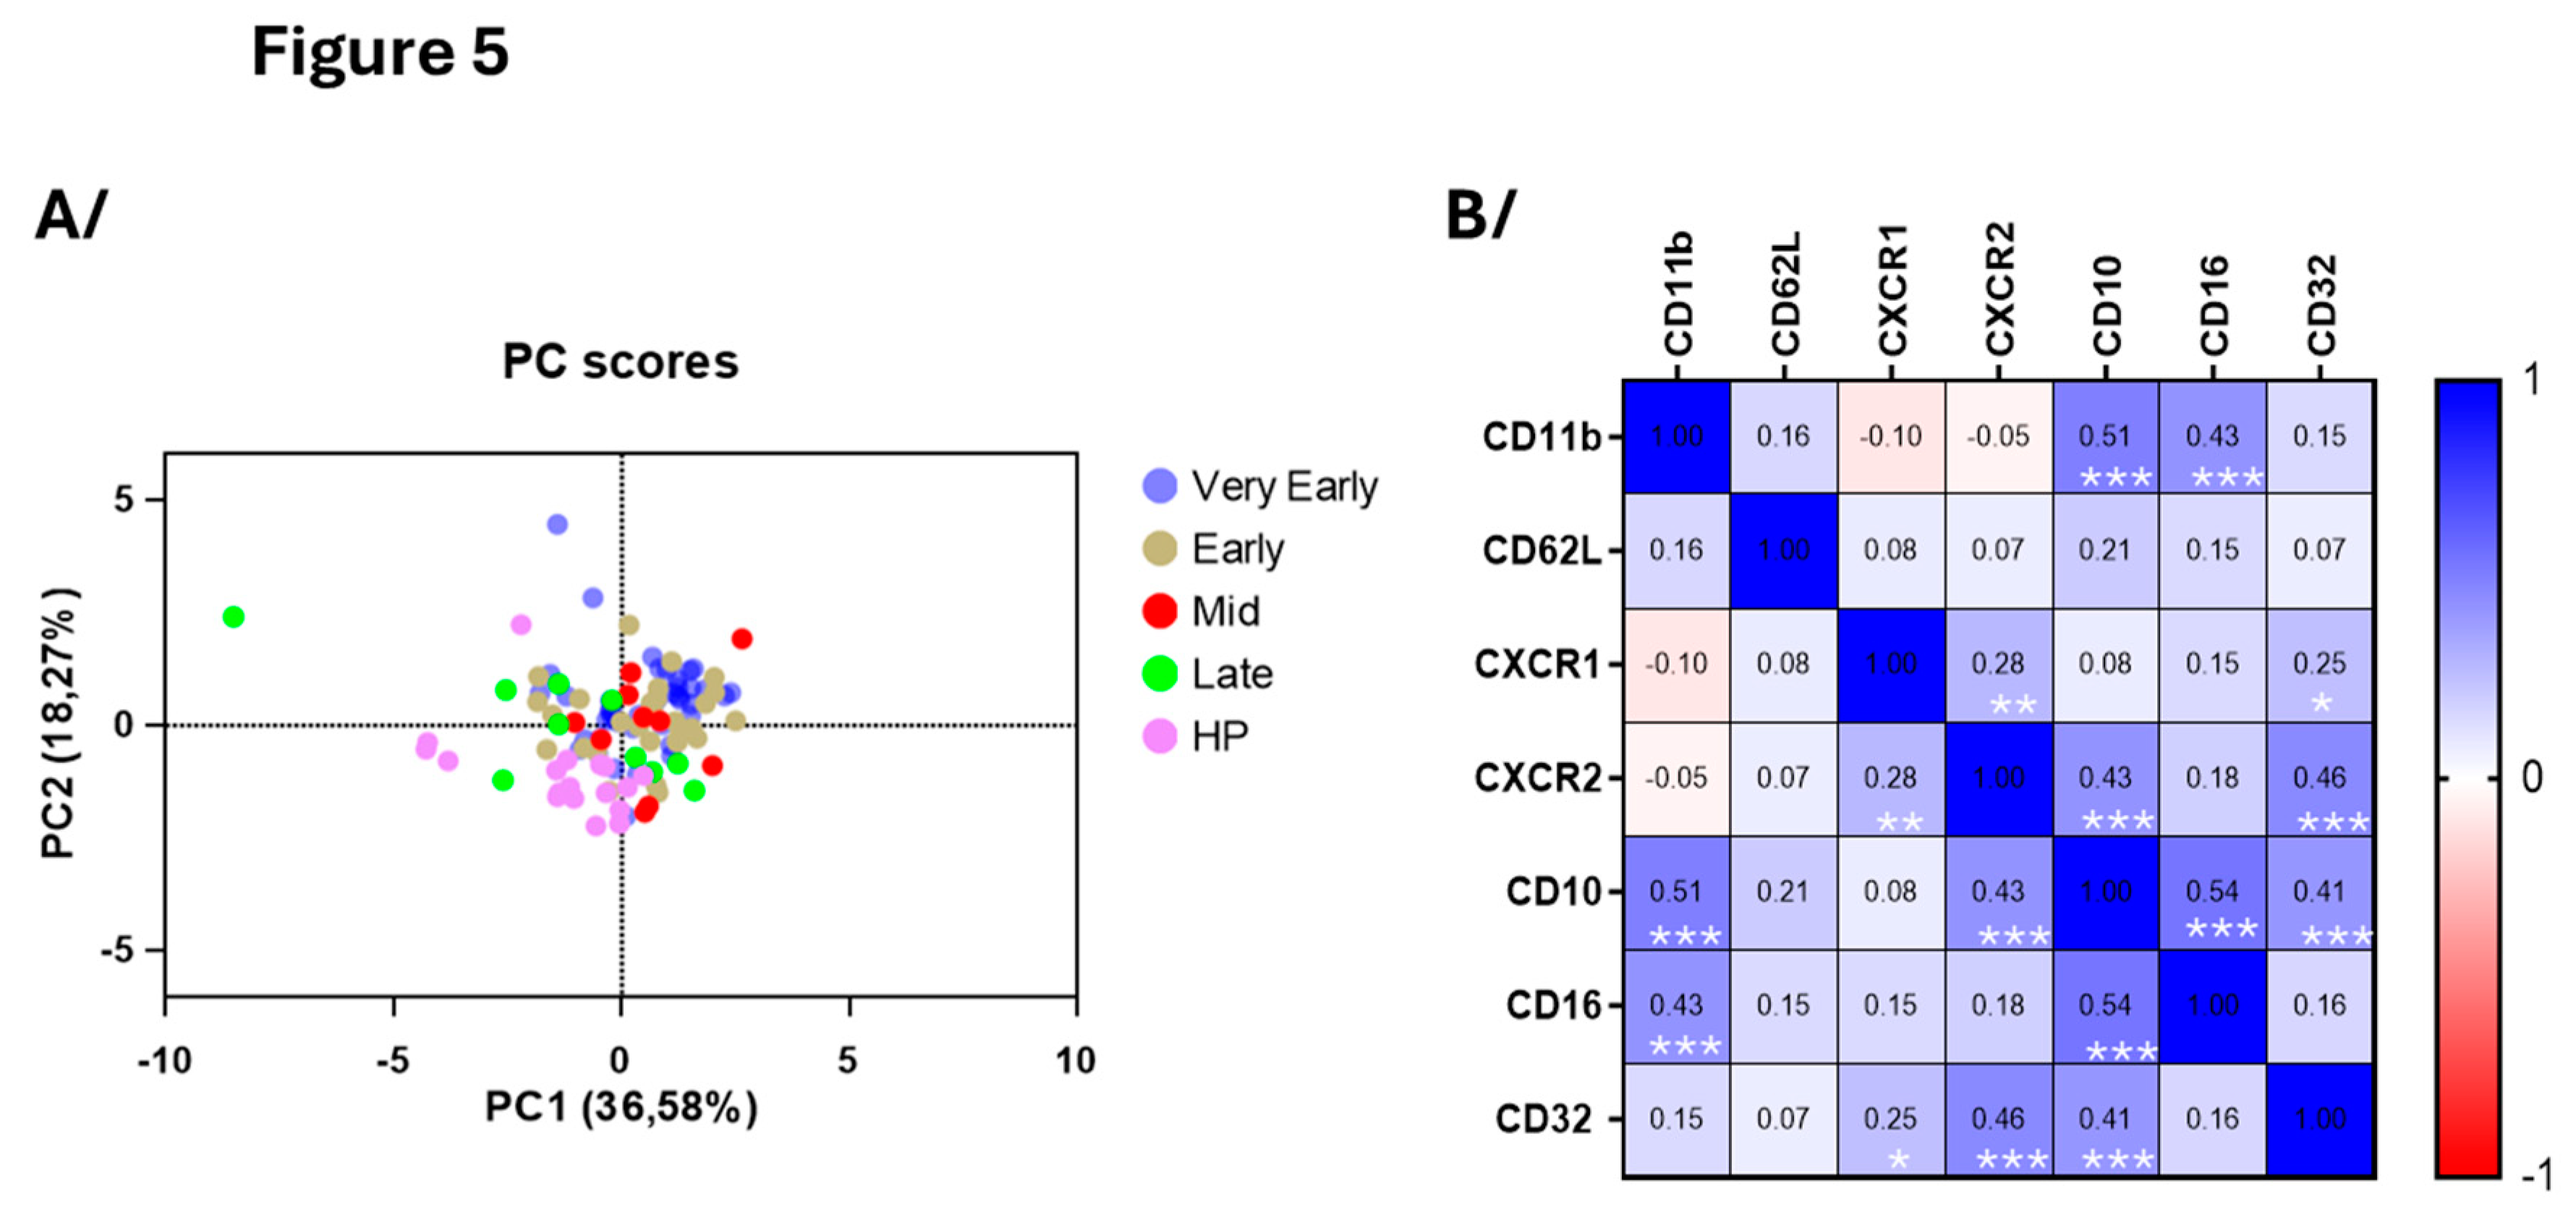
Figure 6.
Level of surface proteins on blood monocytes overtime after hospitalization with SARS-CoV-2 infection and compared to healthy controls. As shown in Table 2, timepoints were grouped as “Very Early” phase (D1 to D3), “Early” phase (D5 to D9), “Mid” phase (D14), and “Late” phase (D30). MFI (median fluorescence intensity). ****p<0,0001, ***p<0.001, **p<0.01, *p<0.05.
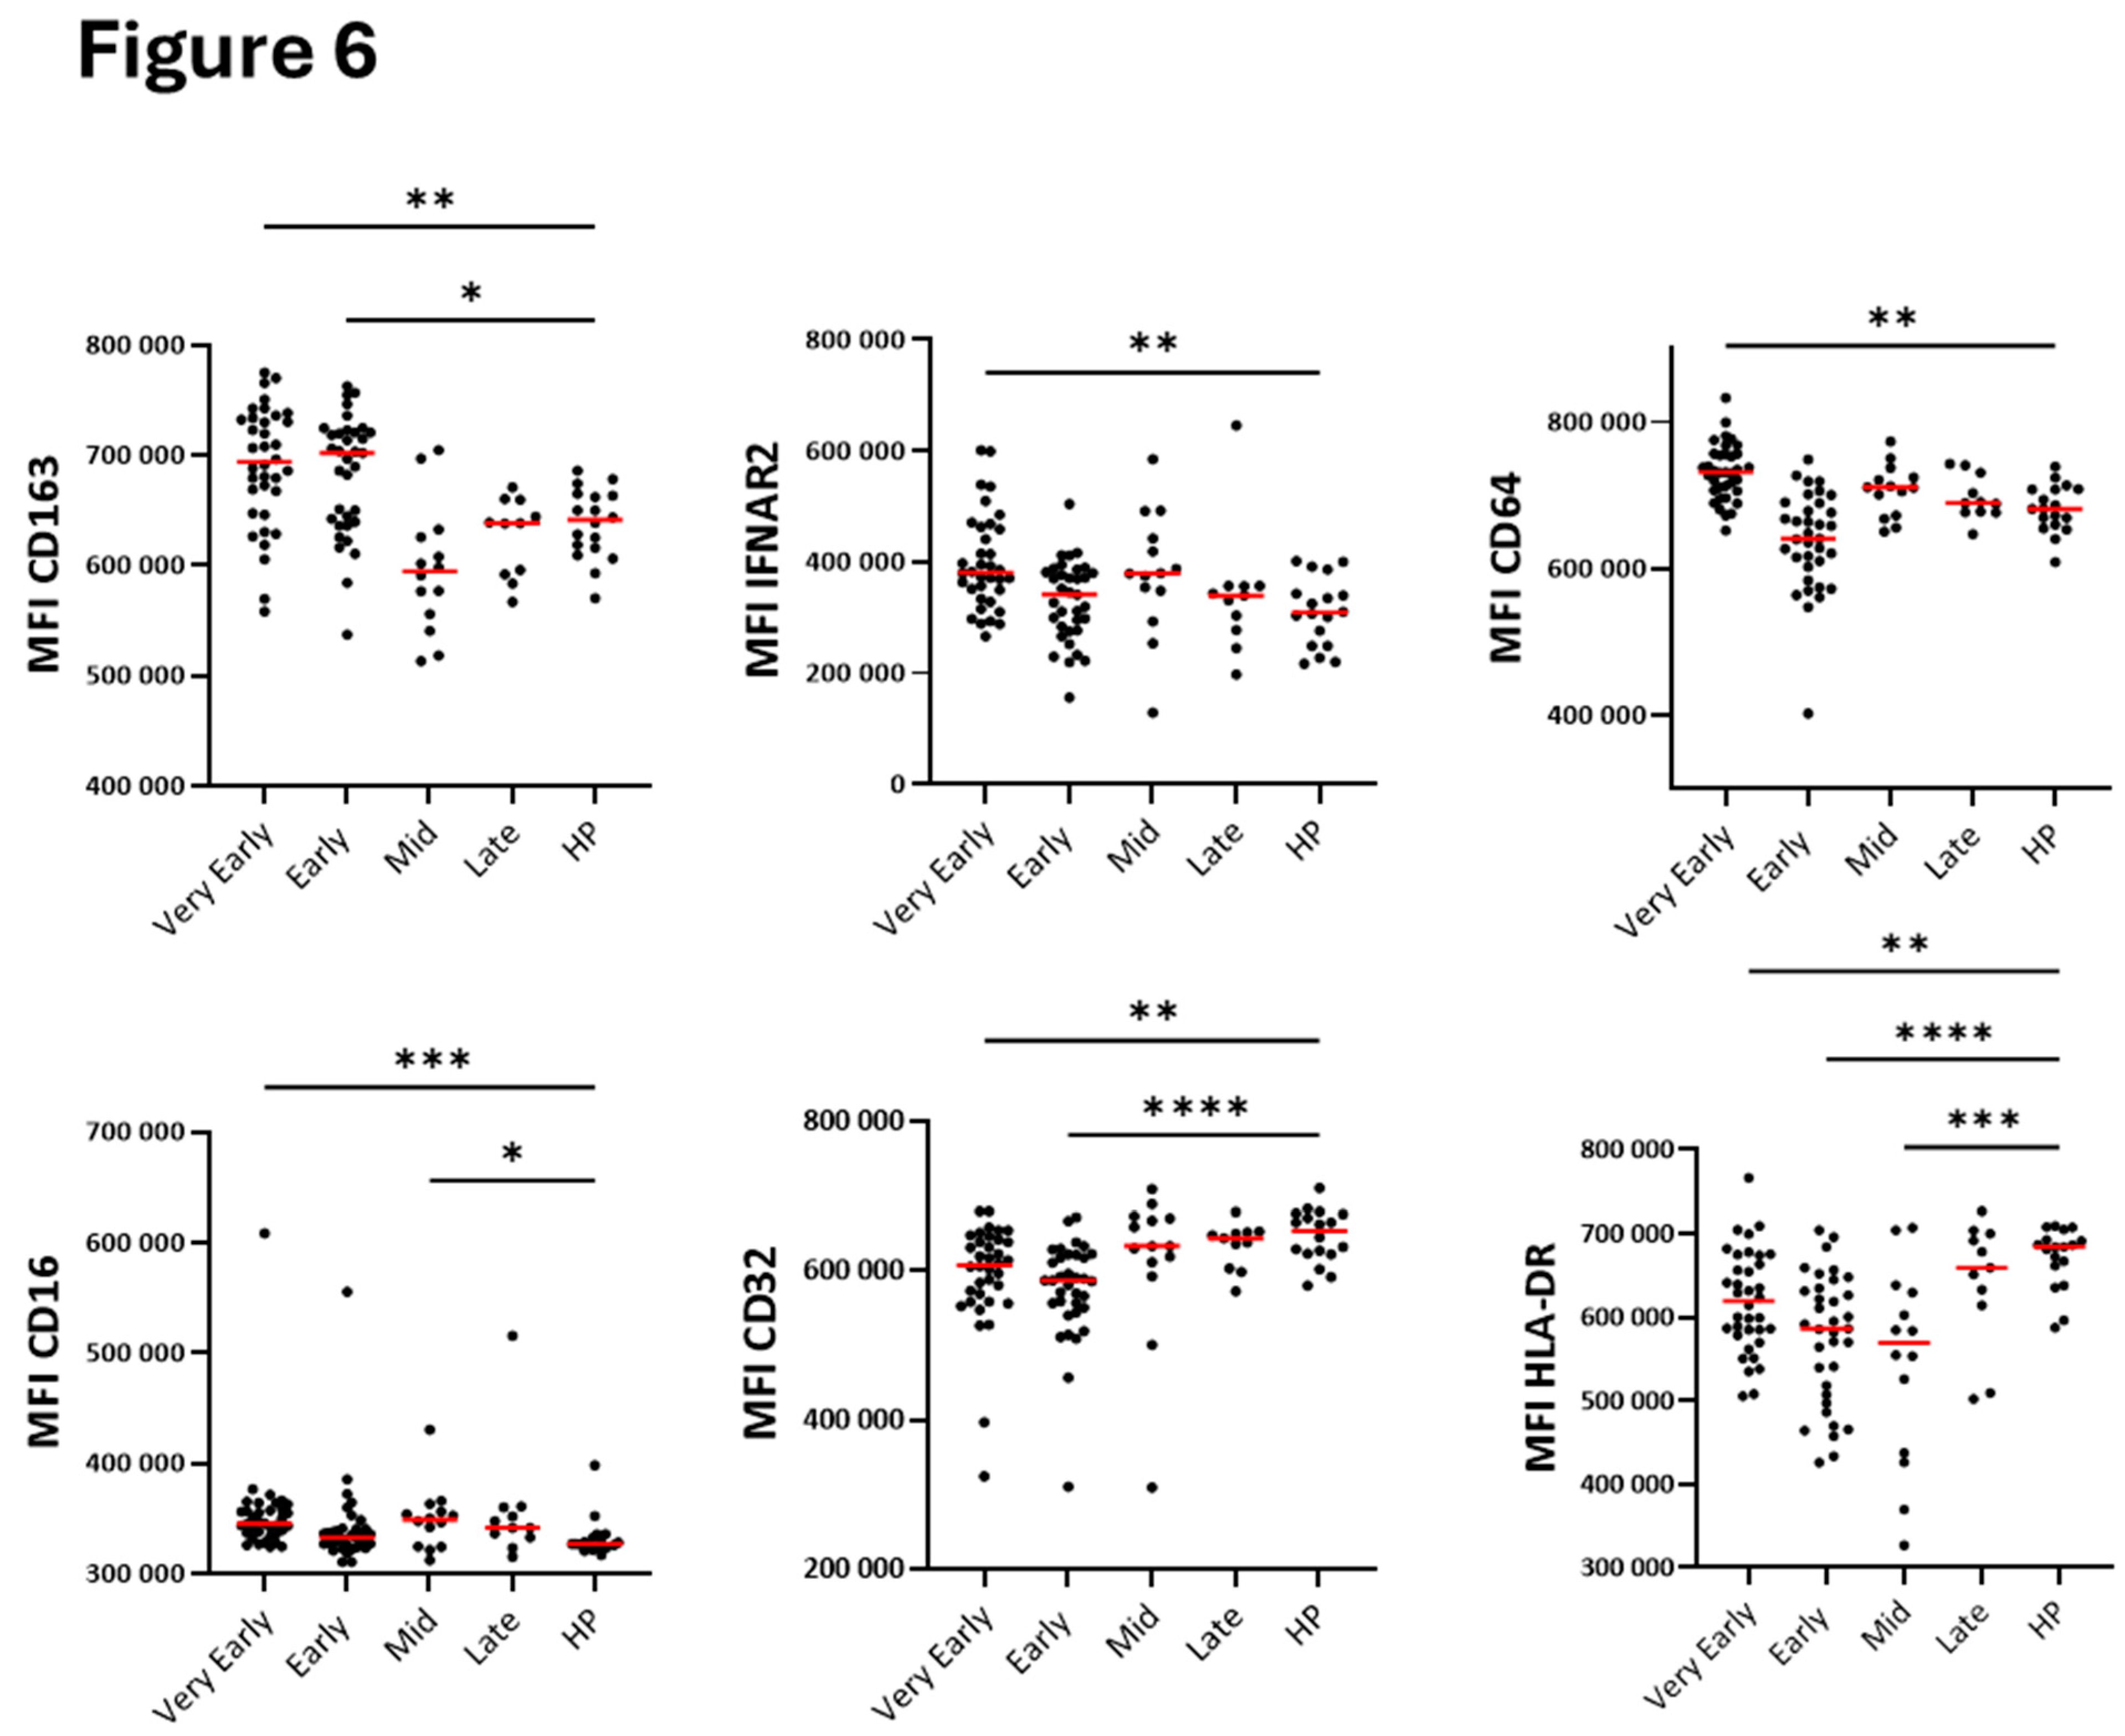
Figure 7.
Principle component and correlative analyses of the level of surface membrane proteins on blood monocytes. A/ Correlative analysis (Spearman) of all surface markers and timepoints in COVID-19 (n=96). r values are shown, ***p<0.001, **p<0.01, *p<0.05. B/ Principal component analysis of the participants divided as healthy participants (HP), very early phase, early phase, mid-phase and late phase COVID-19.
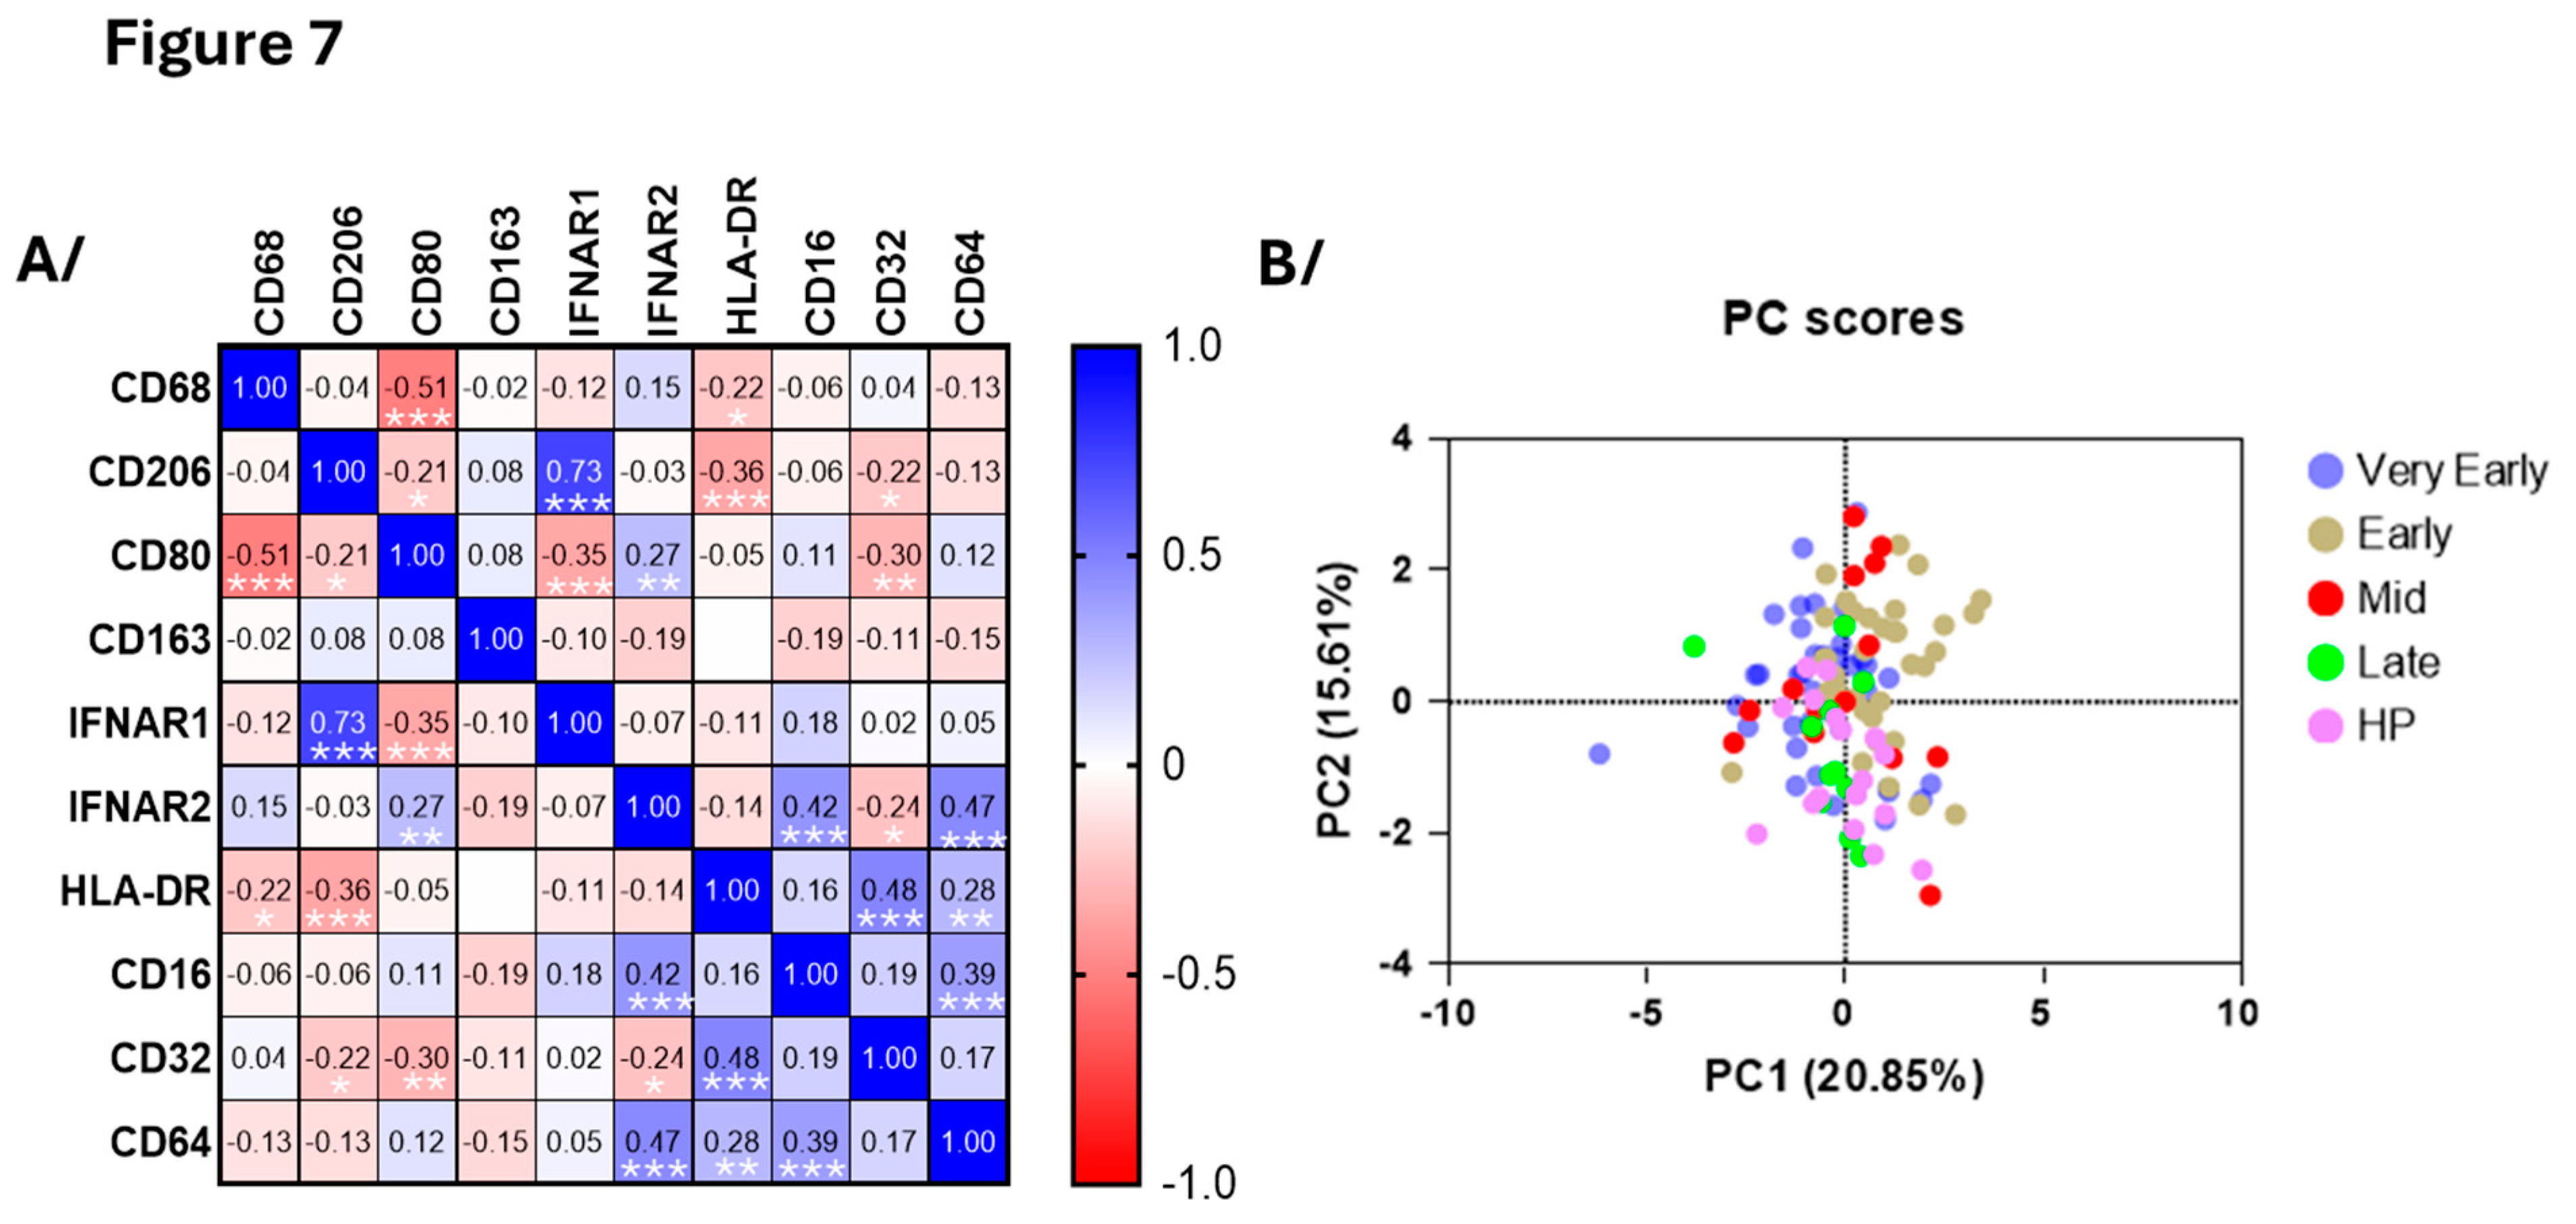
Figure 8.
Quantification of serum cytokines, chemokines and growth factors related to eosinophils and neutrophils. Mediators were quantified by multiplex assays at different periods (phases) after hospitalization of COVID-19 patients and at one timepoint in a total of 31 healthy individuals. A/ Type-2 (T2) immune response and pro-eosinophilic mediators. B/ Mediators related to neutrophil activation and chemotaxis. ***p<0.001, **p<0.01, *p<0.05. Kruskal-Wallis test with Dunn’s multiple comparisons test.
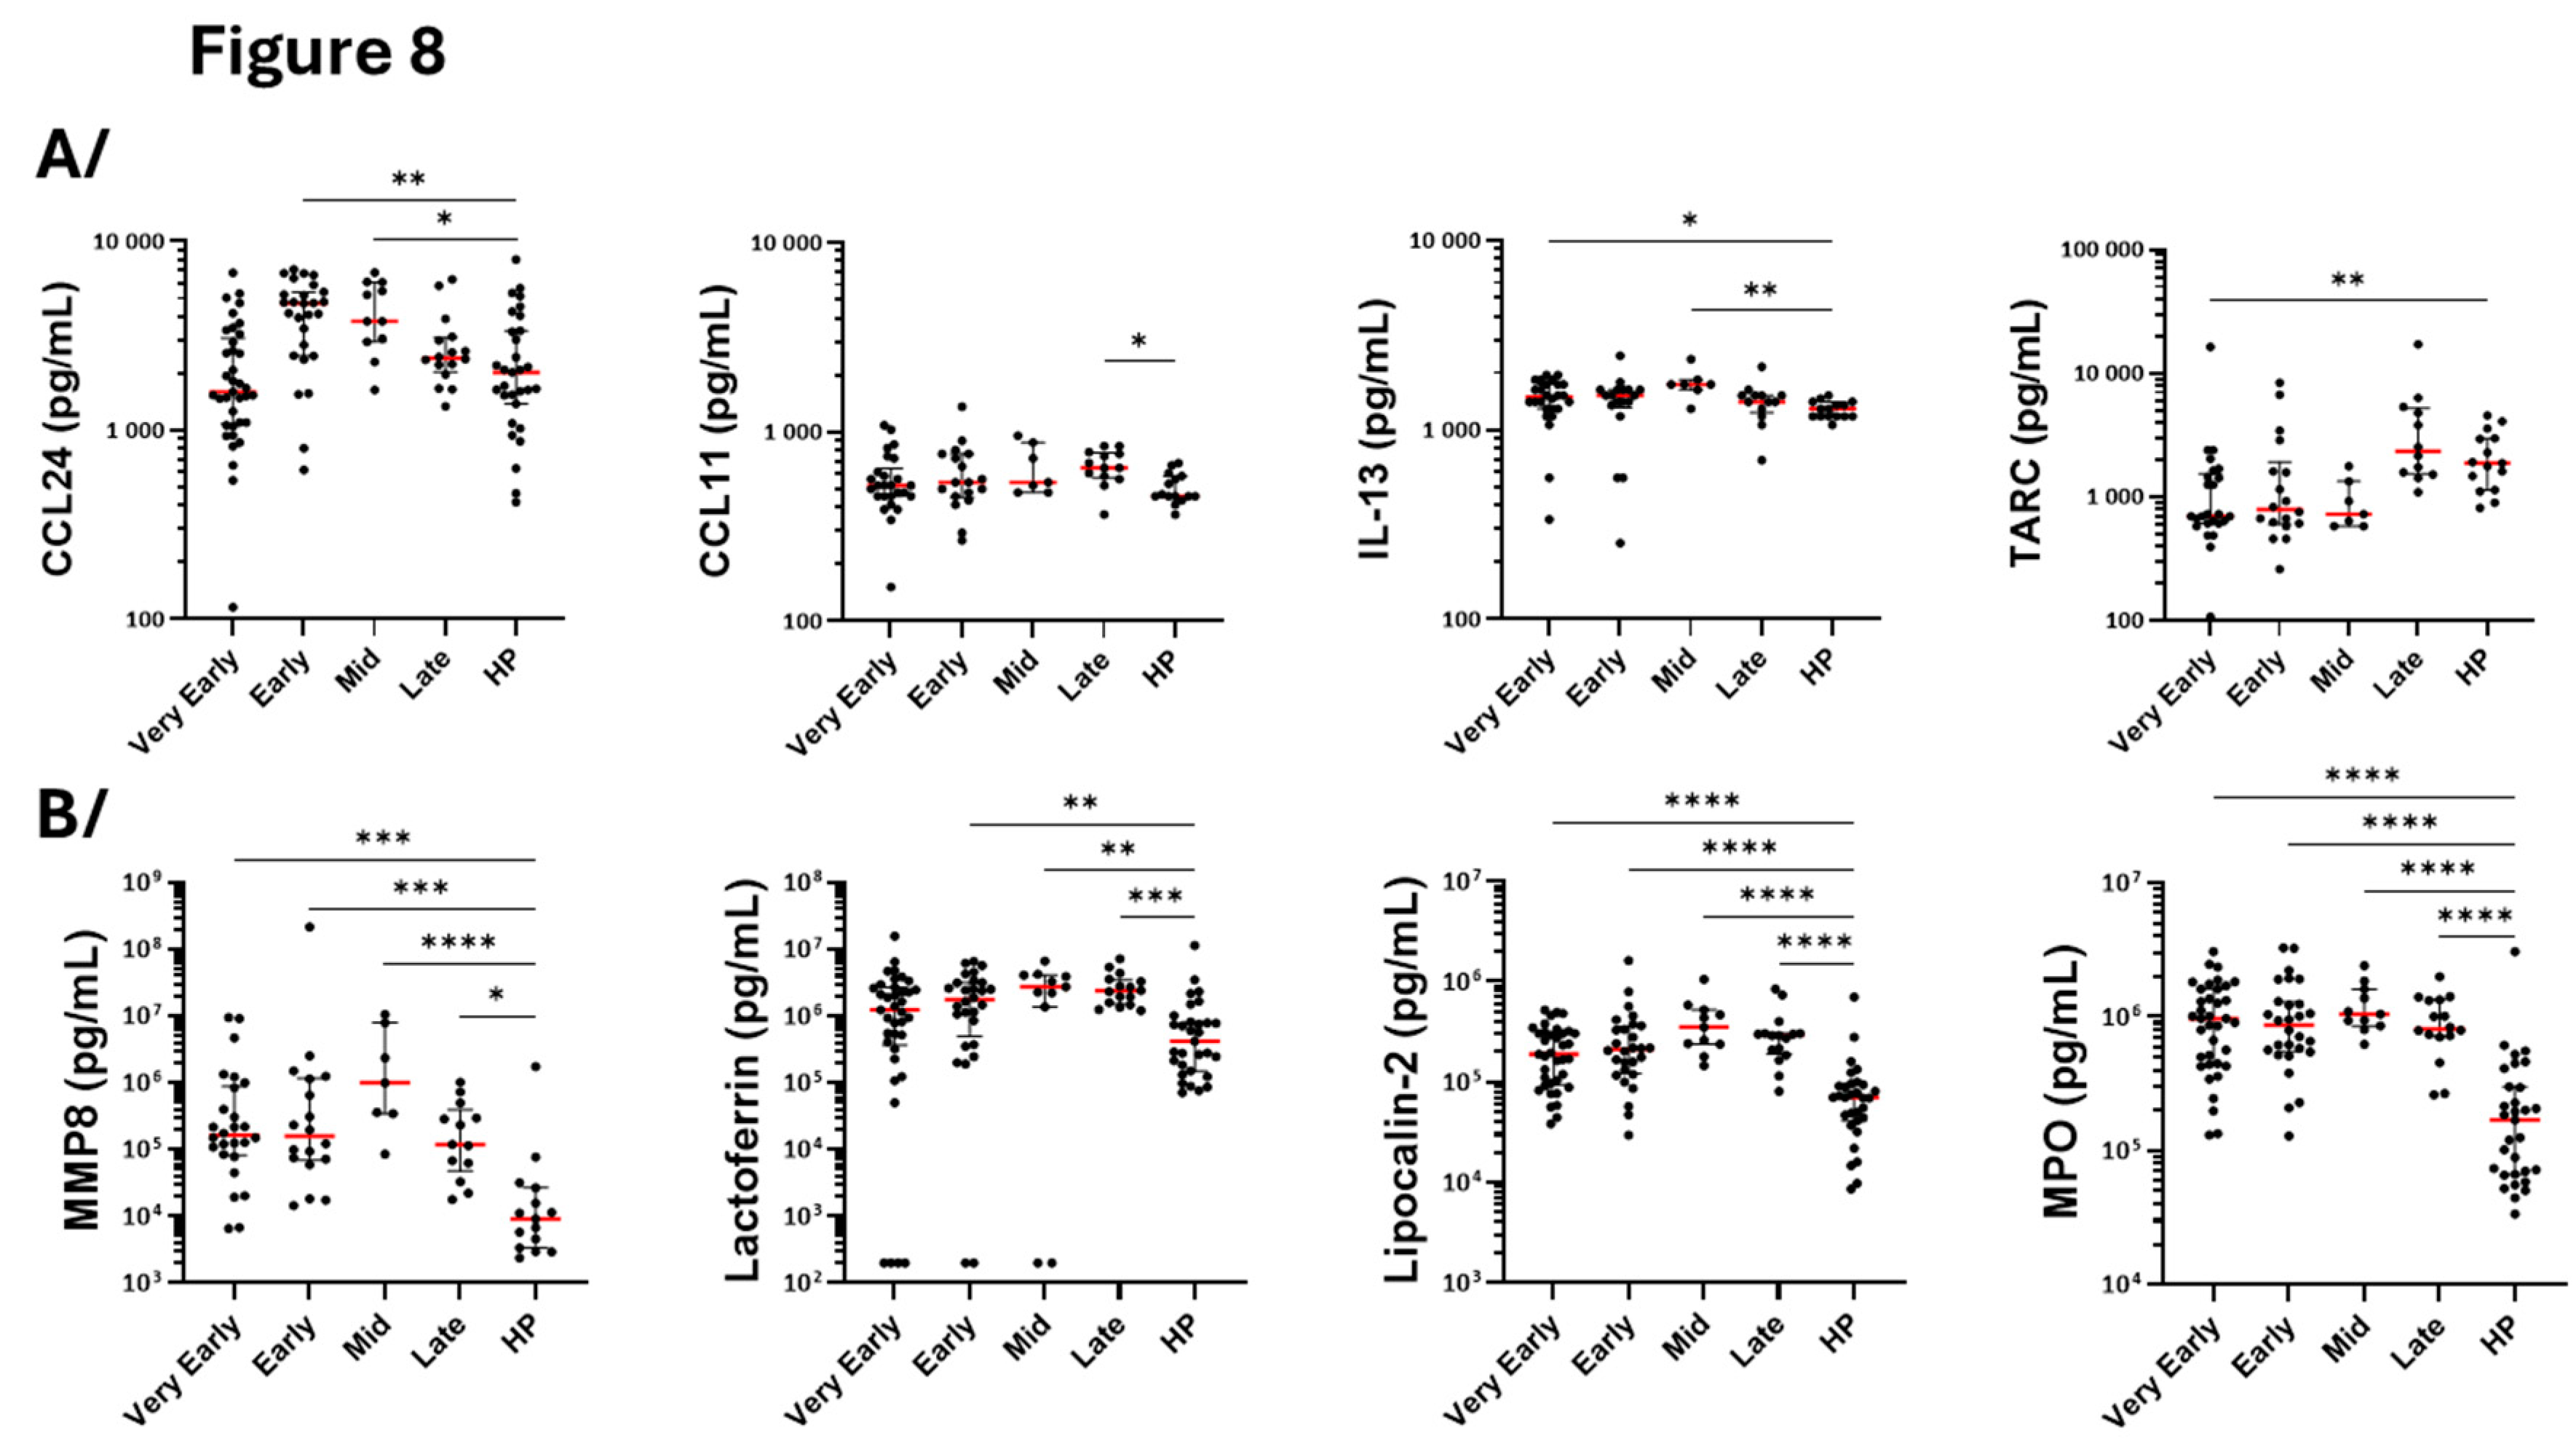
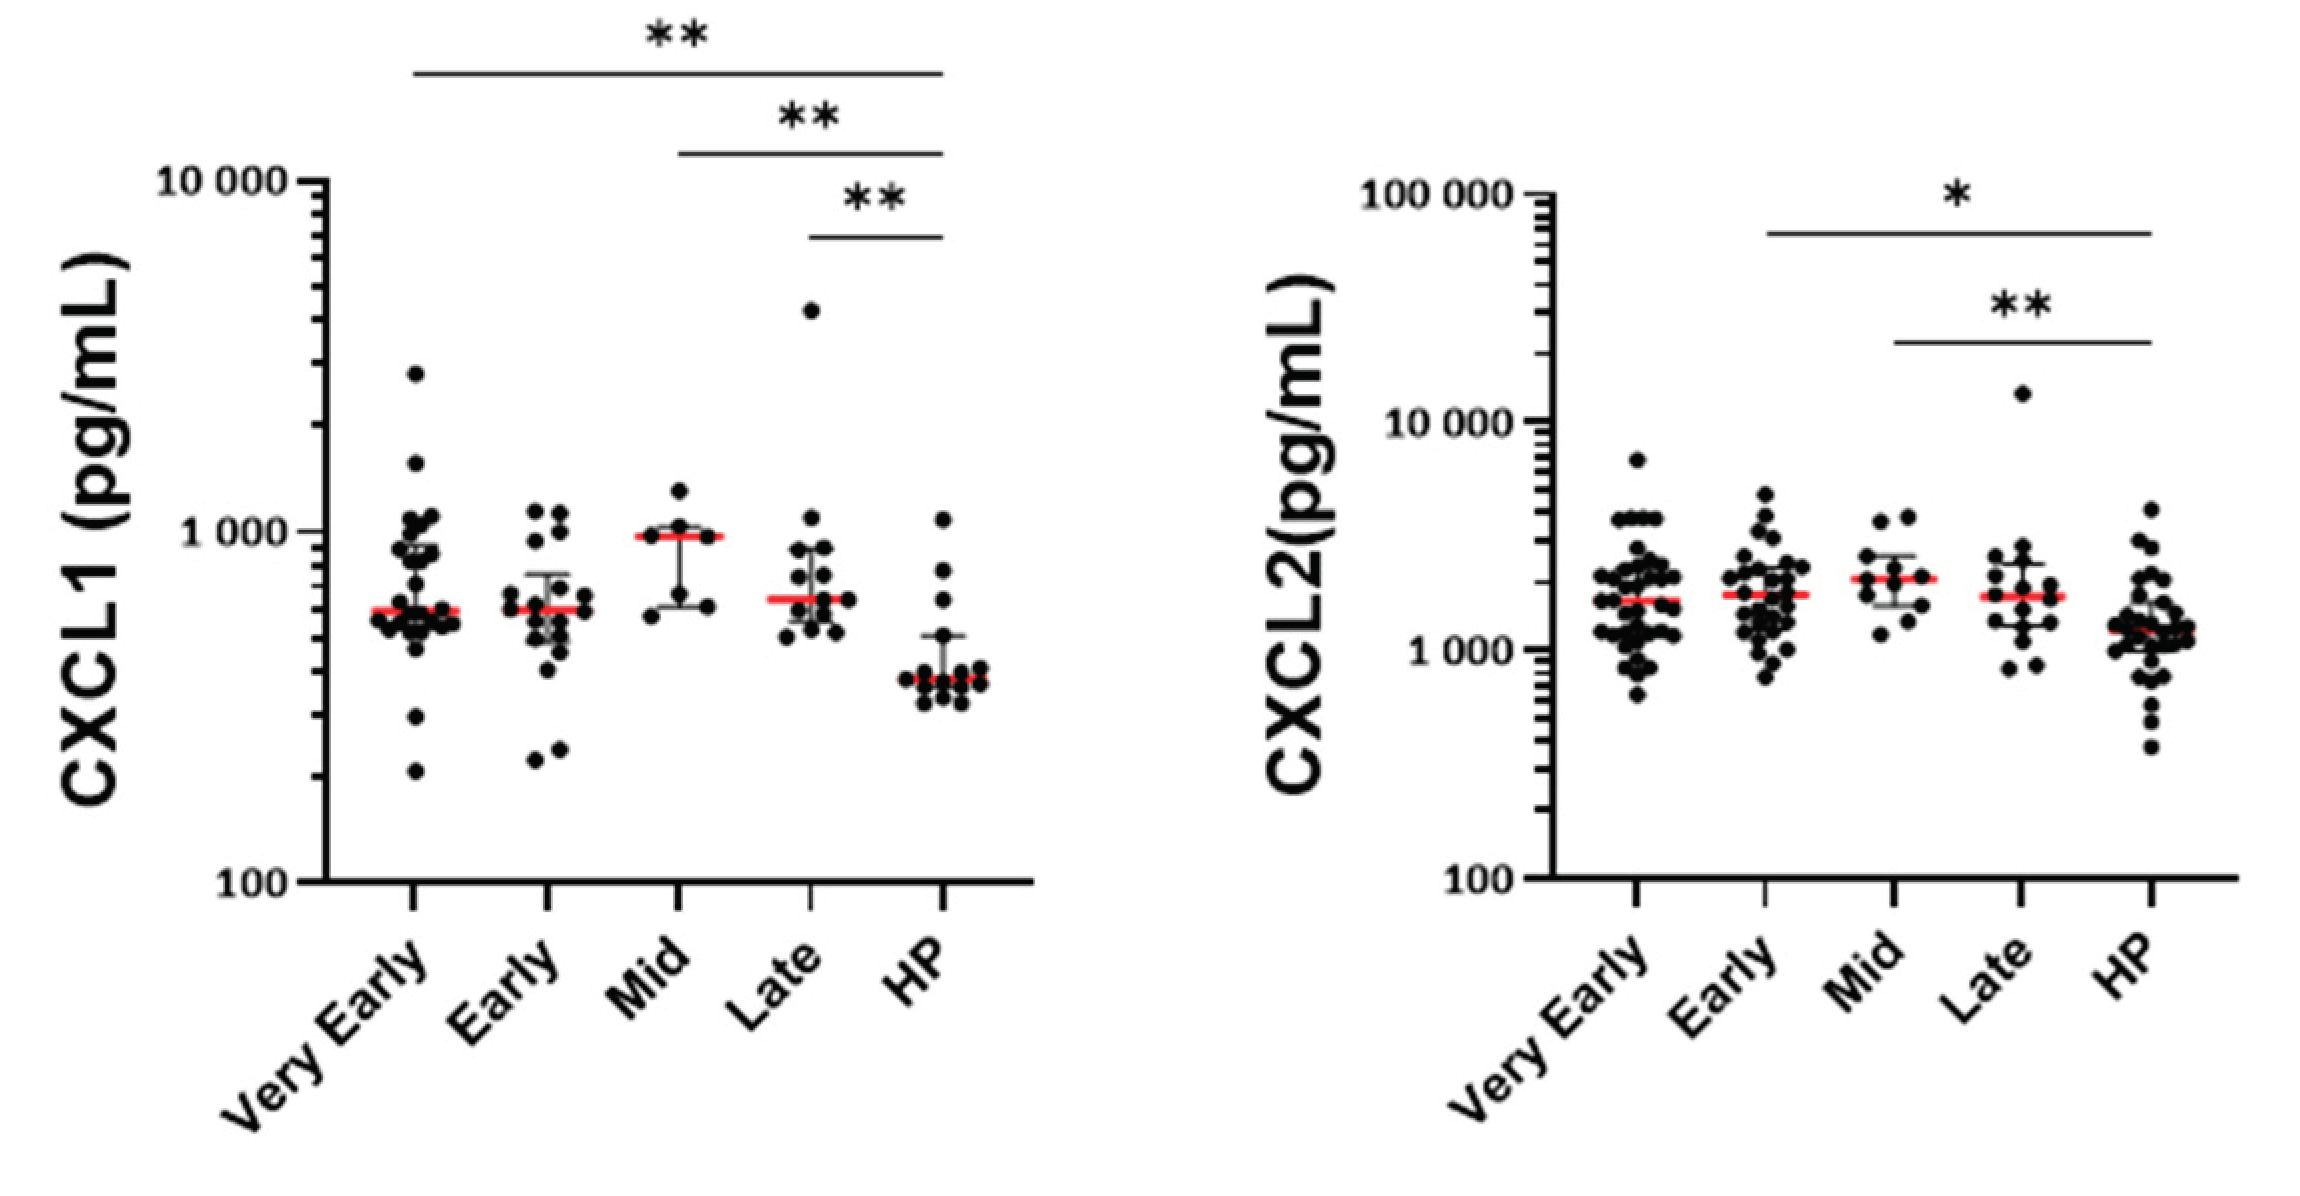
Figure 9.
Quantification of serum chemokines related to monocytes. Mediators were quantified by multiplex assays at different periods (phases) after hospitalization of COVID-19 patients and at one timepoint in a total of 31 healthy individuals (HP). ***p<0.001, **p<0.01, *p<0.05. Kruskal-Wallis test and Dunn’s multiple comparisons test.
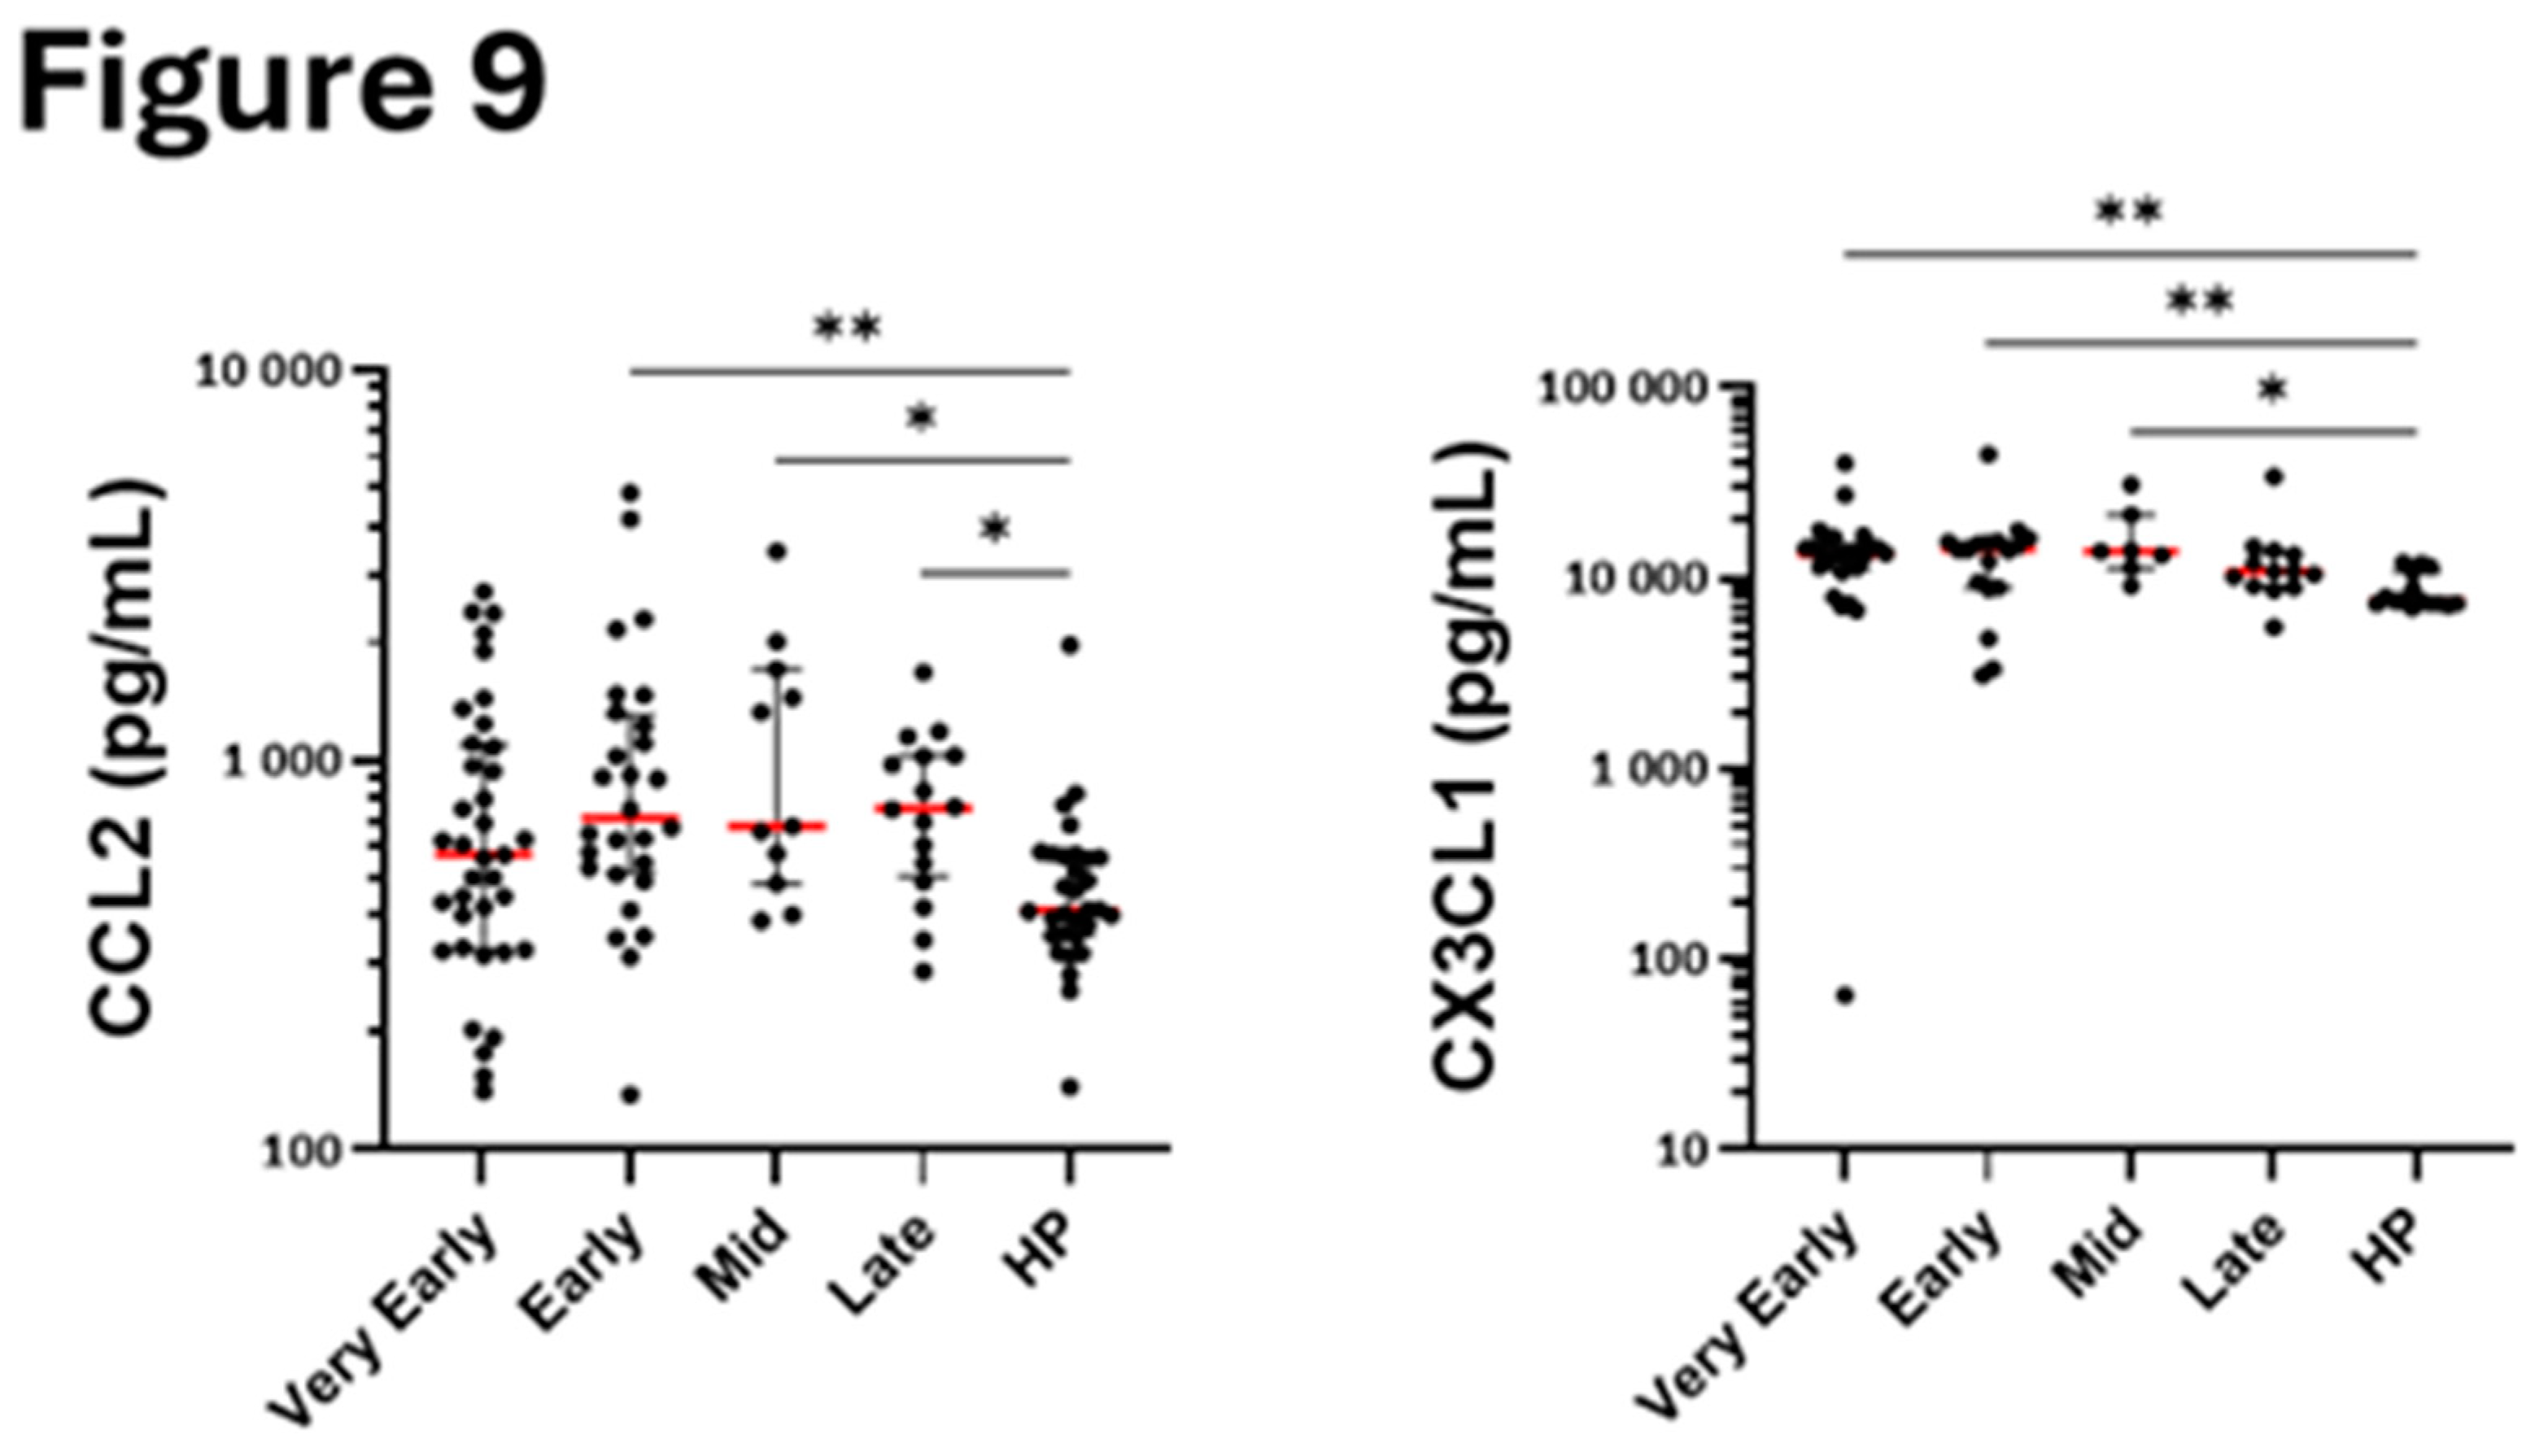

Table 2.
Number of participants of each analysis and at each timeframe.
 |
Disclaimer/Publisher’s Note: The statements, opinions and data contained in all publications are solely those of the individual author(s) and contributor(s) and not of MDPI and/or the editor(s). MDPI and/or the editor(s) disclaim responsibility for any injury to people or property resulting from any ideas, methods, instructions or products referred to in the content. |
© 2025 by the authors. Licensee MDPI, Basel, Switzerland. This article is an open access article distributed under the terms and conditions of the Creative Commons Attribution (CC BY) license (http://creativecommons.org/licenses/by/4.0/).
Copyright: This open access article is published under a Creative Commons CC BY 4.0 license, which permit the free download, distribution, and reuse, provided that the author and preprint are cited in any reuse.


