Submitted:
16 July 2025
Posted:
17 July 2025
You are already at the latest version
Abstract
(1) Background: Staphylococcus aureus is a common human respiratory pathogen. Its widespread antimicrobial resistance often leads to severe infections. However, the high genomic diversity among strains frequently causes false negatives in conventional PCR assays. (2) Methods: To address this limitation, we developed a highly sensitive and specific duplex fluorescent quantitative PCR (qPCR) method for S. aureus detection based on pangenome analysis. Conserved core genome sequences of S. aureus were identified using a pangenomic approach. Two highly conserved and species-specific genes—isdA and recQ—were selected as target loci for the duplex qPCR assay. A TaqMan probe-based duplex fluorescent qPCR assay was established, enabling simultaneous detection of both isdA and recQ genes in a single reaction. (3) Results: The assay demonstrated detection sensitivities of 1.335 × 10³ copies/μL for isdA and 7.265 × 10² copies/μL for recQ. The intra-assay and inter-assay coefficients of variation (CV) for Ct values were below 1.86% and 2.87%, respectively, indicating excellent reproducibility. Specificity analysis revealed no cross-reactivity with genomic DNA from 14 common respiratory pathogens, including Pseudomonas aeruginosa and Streptococcus pneumoniae. (4) Conclusions: Due to its high specificity and sensitivity, this duplex qPCR assay effectively overcomes limitations of single-target PCR methods, such as missed detections and prolonged turnaround times, and holds significant potential for practical diagnostic applications.
Keywords:
Staphylococcus aureus
; pangenome analysis
; isdA gene
; recQ gene
; duplex qPCR
1. Introduction
Staphylococcus aureus is a common, widely distributed human respiratory pathogen capable of causing gastrointestinal and pyogenic infections [1], including pneumonia, pericarditis, pseudomembranous colitis, septicemia [2,3], toxemia, and bacterial endocarditis [4,5]. Consequently, early detection of S. aureus infection is critical for effective treatment [6,7].
Current methods for detecting S. aureus include microbial culture, immunoassays [8], and molecular biology technique [9]. Microbial culture is time-consuming, potentially delaying clinical diagnosis. Immunoassays based on antibodies often incur high costs related to antibody production. Although molecular biology techniques offer high sensitivity, they require sophisticated instrumentation and skilled personnel [10]. With the advancement of molecular diagnostics, traditional PCR is increasingly being replaced by real-time quantitative PCR (qPCR) due to limitations such as contamination risks [11]. While qPCR has been applied for rapid S. aureus diagnosis, single-target assays are vulnerable to false-positive or false-negative results caused by residual nucleic acids or bacterial genome mutations [12].
In this study, a pangenome-based approach identified conserved and specific core genomic targets of S. aureus. Two highly conserved genes, isdA and recQ, were selected as dual targets for a real-time duplex fluorescent qPCR assay. This dual-target strategy addresses the limitations of existing methods, such as false results and prolonged detection times, improving diagnostic accuracy compared to conventional single-target qPCR.
2. Materials and Methods
Bacterial Strains and DNA Extraction
Two S. aureus strains (ATCC 12600 and ATCC 25923) served as positive controls. S. aureus strains were cultured in broth medium at 37 °C for 18~24 hours. Bacterial concentrations (CFU/mL) were determined using standard plate counts. After dilution to working concentrations, genomic DNA was extracted using the Bacteria Genomic DNA Kit (CW0552S, Kangwei Century Biotechnology, Jiangsu, China) according to the manufacturer’s instructions. Extracted DNA was stored at -20 °C.
For specificity evaluation, genomic DNA was also extracted from 14 common respiratory pathogens: Pseudomonas aeruginosa (ATCC 10145), Klebsiella pneumoniae (ATCC 13883), Acinetobacter baumannii (ATCC 19606), Streptococcus pyogenes (ATCC 12344), Proteus mirabilis (ATCC 29906), Neisseria meningitidis (ATCC 13077), Stenotrophomonas maltophilia (ATCC 13637), Streptococcus salivarius (ATCC 7073), Klebsiella oxytoca (ATCC 49131), Moraxella catarrhalis (ATCC 25238), Haemophilus influenzae (ATCC 49247), Citrobacter freundii (ATCC 13316), Streptococcus pneumoniae (ATCC 49619), and Mycoplasma pneumoniae (ATCC 15531). DNA extraction used the same kit (CW0552S). DNA concentrations were quantified using a NanoDrop 2000 spectrophotometer (Thermo Fisher Scientific, China), and all samples were stored at -20 °C.
2.1. Pangenome Analysis
The pan-genome, representing the complete genomic repertoire of a species, comprises the core genome (genes shared by all strains) and the variable genome (strain-specific genes or sequence variations). The core genome is associated with essential biological functions and conserved phenotypic traits, reflecting genetic stability. The variable genome contributes to environmental adaptation and diversification.
The Bacterial Pan Genome Analysis tool (BPGA) is a high-efficiency platform for microbial pangenomic studies, suitable for large-scale analyses to assess gene content variation, delineate core and variable genomes, and trace horizontal gene transfer.
Complete S. aureus genome sequences were obtained from NCBI. A local genomic database was constructed using 200 downloaded S. aureus genomes and analyzed using BPGA. Candidate core gene specificity was evaluated using NCBI Protein BLAST [13]. Conserved core genes with high specificity were further analyzed for sequence conservation using local BLAST against the database.
2.1. Primer and Probe Design
S. aureus isdA and recQ gene sequences were retrieved from NCBI Gene. Multiple sequence alignments assessed conservation, and primers were designed within conserved regions. Criteria included[14]: GC content 45~55%; amplicon length 80~300 bp; primer length 17~25 nucleotides; ≤3 bases self-complementarity; ≤3 consecutive G or C nucleotides; melting temperature (Tm) 50~65 °C (forward/reverse Tm difference ≤1 °C). Specificity was evaluated using Primer BLAST to eliminate non-specific amplification.
TaqMan probes were designed between primer pairs using Primer Express 3.0. The isdA-qP probe was labeled with VIC (5') and BHQ1 (3'). The recQ-qP probe was labeled with 6-FAM (5') and BHQ1 (3').
2.1. Validation of Primer Specificity Using Conventional PCR and SYBR Green qPCR
Genomic DNA from the 16 respiratory pathogens (Section 2.1) served as template to evaluate isdA and recQ primer specificity by conventional PCR, followed by SYBR Green qPCR [15].
The conventional PCR reaction mixture (50 μL) contained: 45 μL Gold Mix enzyme (Qingke Biotechnology, Wuhan, China), 2 μL forward primer, 2 μL reverse primer, 1 μL template DNA, nuclease-free water to 50 μL. Cycling conditions: 98 °C for 2 min; 40 cycles of 98 °C for 10 s, 60 °C for 10 s, 72 °C for 10 s; 72 °C for 5 min; hold at 4 °C.
The SYBR Green qPCR reaction mixture (25 μL) contained: 12.5 μL TB Green Premix Ex Taq II FAST qPCR (2×) (TaKaRa Biotechnology, Dalian, China), 1 μL forward primer, 1 μL reverse primer, 1 μL template DNA, nuclease-free water to 25 μL. Cycling conditions: 95 °C for 30 s; 40 cycles of 95 °C for 5 s, 60 °C for 10 s; melt curve: 60 °C to 95 °C at 0.5 °C/s.
2.1. Preparation of Standard Plasmids
isdA and recQ gene fragments were amplified from S. aureus genomic DNA by conventional PCR and cloned into the pMD-18T vector. Recombinant plasmids (pMD-18T-isdA and pMD-18T-recQ) were purified and quantified.
Plasmid copy numbers were calculated using the formula:
Equal volumes of pMD-18T-isdA and pMD-18T-recQ were mixed and serially diluted 10-fold using EASY Dilution II buffer. These dilutions served as templates for generating standard curves in the duplex qPCR assay [16].
2.1. Optimization of Duplex Fluorescent Quantitative PCR Assay
To enhance stability, sensitivity, and efficiency, annealing temperature, primer concentration, and probe concentration were optimized using S. aureus genomic DNA as template and sterile water as negative control.
A matrix approach optimized annealing temperature (56~63 °C), primer concentrations (0.2~1.0 μmol/L), and probe concentrations (0.2~1.0 μmol/L). Optimal conditions were defined by the strongest fluorescence signal and lowest Cq value.
Ten-fold serial dilutions of the standard plasmid mixture (10-1 to 10-10) were amplified under optimized conditions, with sterile water as negative control.
2.1. Evaluation of Specificity, Repeatability, and Sensitivity
Specificity: Genomic DNA from 15 respiratory pathogens (including S. aureus) was tested under optimized duplex qPCR conditions [17].
Repeatability: Recombinant plasmid mixtures at 10-1, 10-2, and 10-3 dilutions served as templates. Intra-assay repeatability was assessed with three technical replicates per run. Inter-assay repeatability was assessed across three independent runs [18].
Sensitivity: Serial dilutions of the plasmid mixture (100 to 10-10) were amplified. Standard curves were generated; amplification efficiency (E) and correlation coefficient (R2) were calculated [19]. Genomic DNA was extracted from 1 mL S. aureus suspension (3.59×10⁹ CFU/mL), serially diluted 10-fold, and tested by single-gene qPCR to determine the limit of detection (LOD) for cultured cells.
3. Results
3.1. Pan-Genome Analysis
Pan-genome analysis of 200 S. aureus strains using BPGA (Figure 1) showed the number of core genes decreased gradually as more genomes were added, though the rate of decrease slowed. This indicates an open pan-genome with a tendency towards convergence, supporting the adequacy of our genome sample size. 11409 core gene sequences were identified.
Specificity analysis (NCBI-BLAST) identified two species-specific proteins: IsdA (WP_180821735.1) and RecQ (WP_194085592.1) (Table 1). Both genes were exclusive to S. aureus and absent in other common pathogens.
Iron-regulated surface determinant A (IsdA) facilitates bacterial iron acquisition by binding host iron-containing molecules (e.g., hemoglobin, heme), playing a crucial role in S. aureus survival and pathogenicity [20].
The S. aureus recQ gene encodes a helicase essential for genome stability, involved in DNA replication, recombination, and repair [21]. RecQ helicase recognizes single-stranded DNA during homologous recombination repair, helping maintain genomic stability under stress [22].
Local BLAST conservation analysis (Table 1) showed both isdA and recQ genes exhibited >90% sequence similarity across the database, confirming wide distribution and high conservation in S. aureus.
3.2. Primer and Probe Design Results
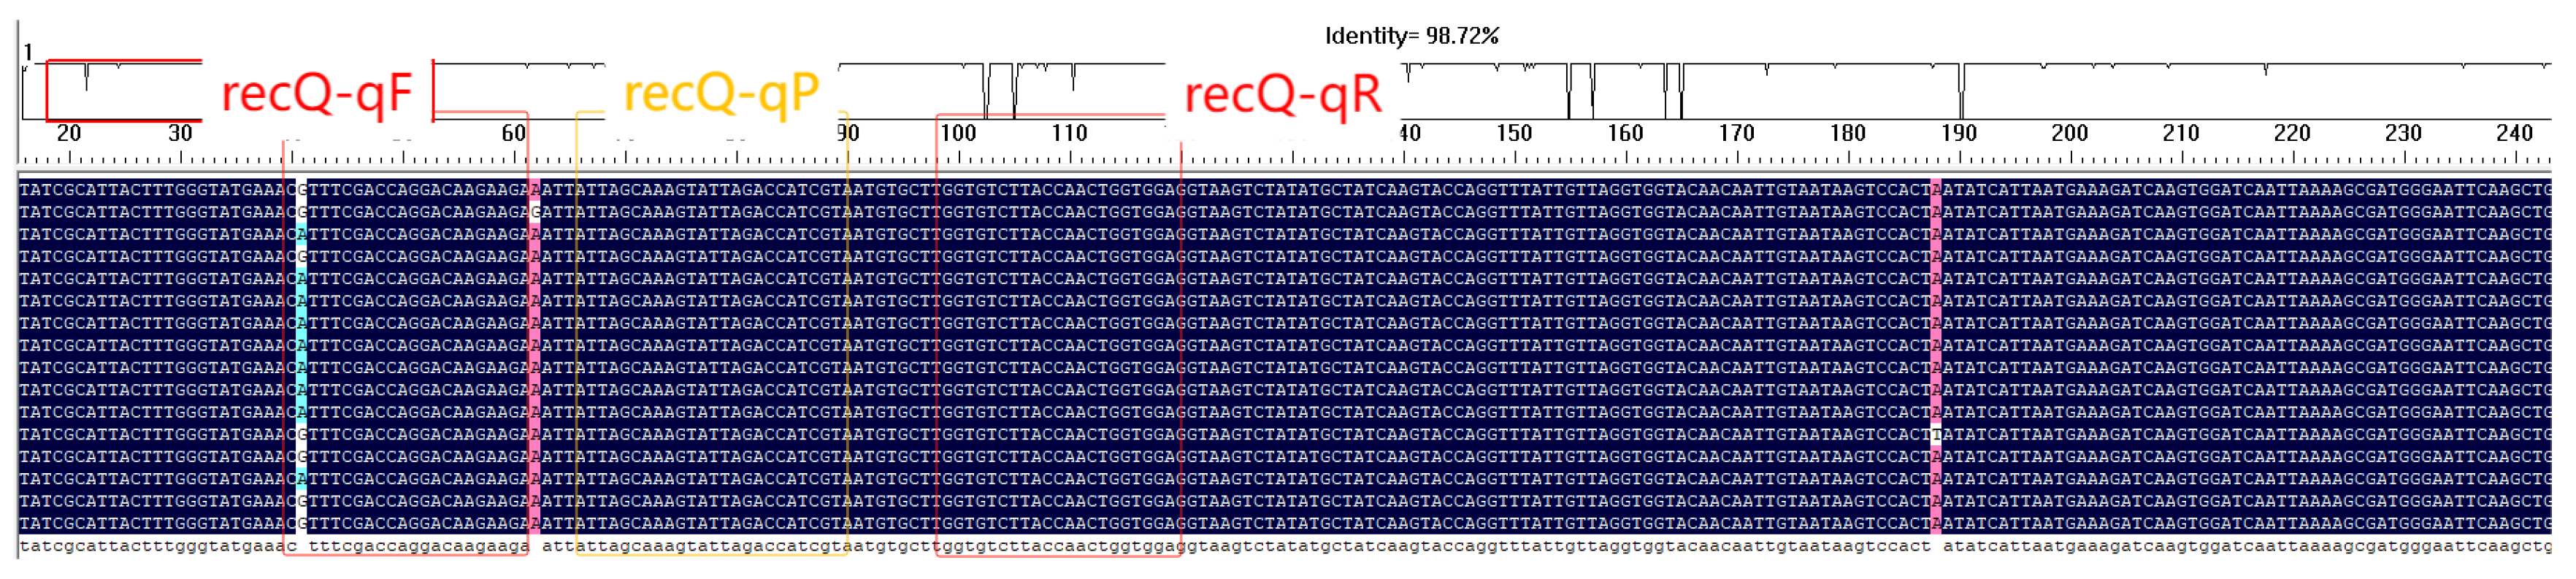
The specific primers and probes were designed using NCBI-BLAST and Primer Express 3.0 software (Table 2). Multiple sequence alignments confirmed primers and probes were located within conserved regions of the target genes (Figures 2.1, 2.2).
Figure 2.1.
Analysis of the conservation of isdA gene and primers.
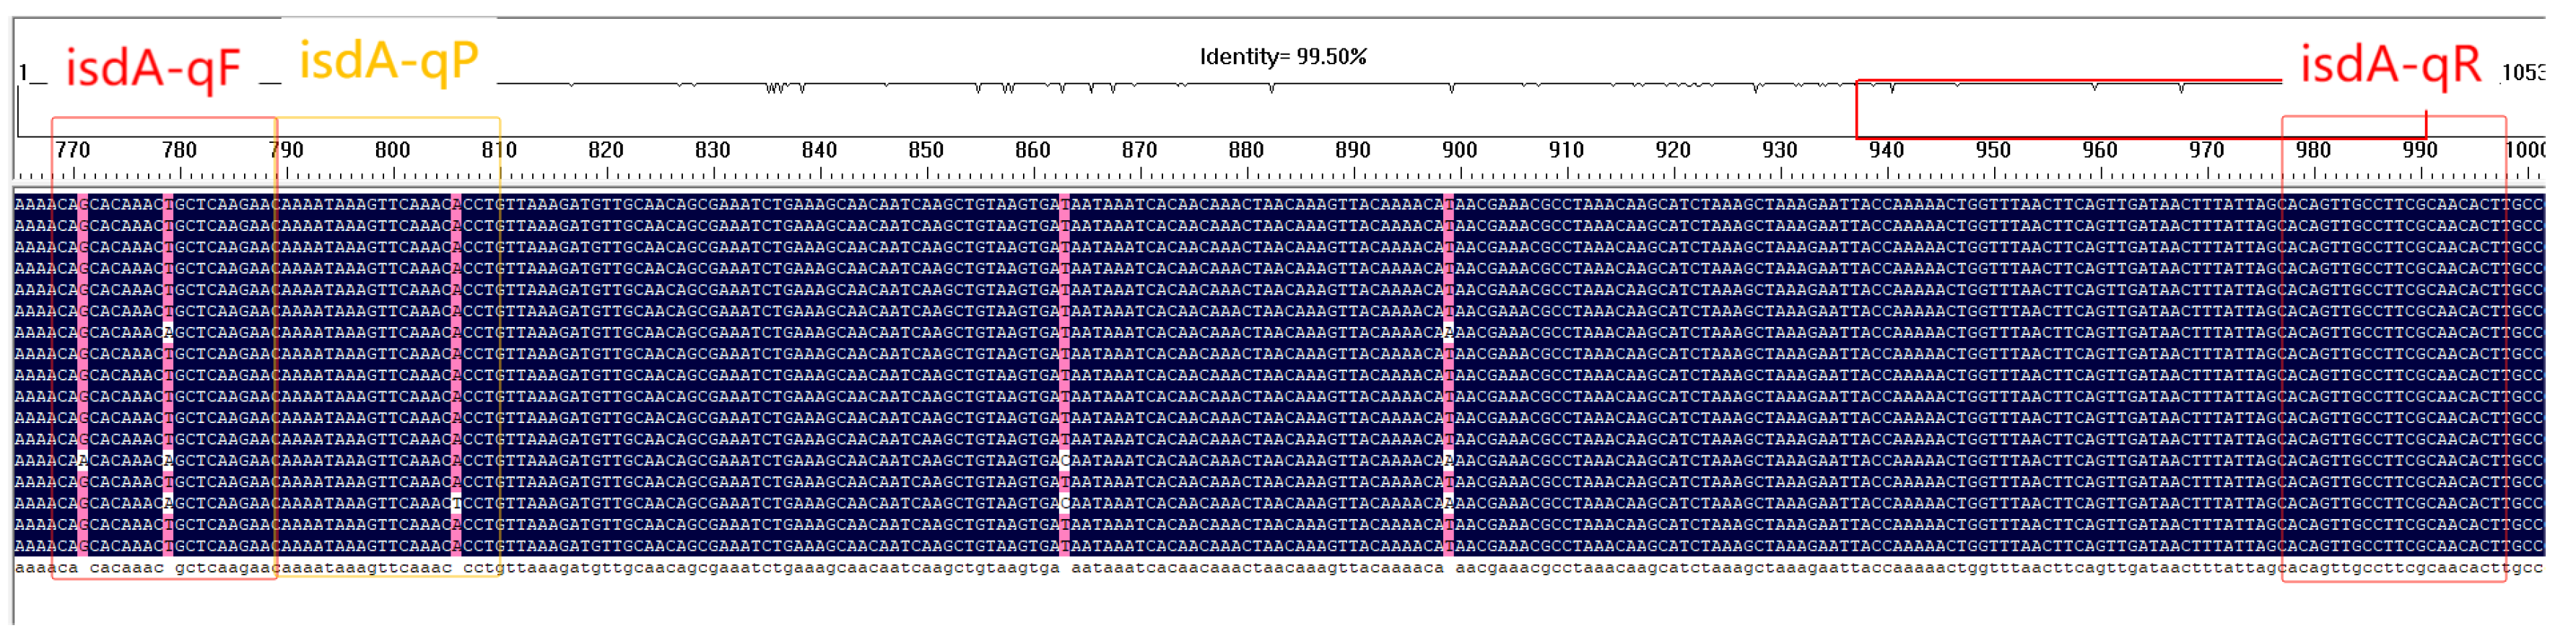
Figure 2.2.
Analysis of the conservation of recQ gene and primers.
3.3. Specificity Validation of Primers by Conventional PCR and SYBR Green Assay
Genomic DNA from 16 respiratory pathogens was tested.
isdA Gene: Conventional PCR (Figure 3.1) showed a band around 250bp only for S. aureus-1 and S. aureus-2. SYBR Green qPCR (Figure 3.2) showed amplification curves only for these strains.
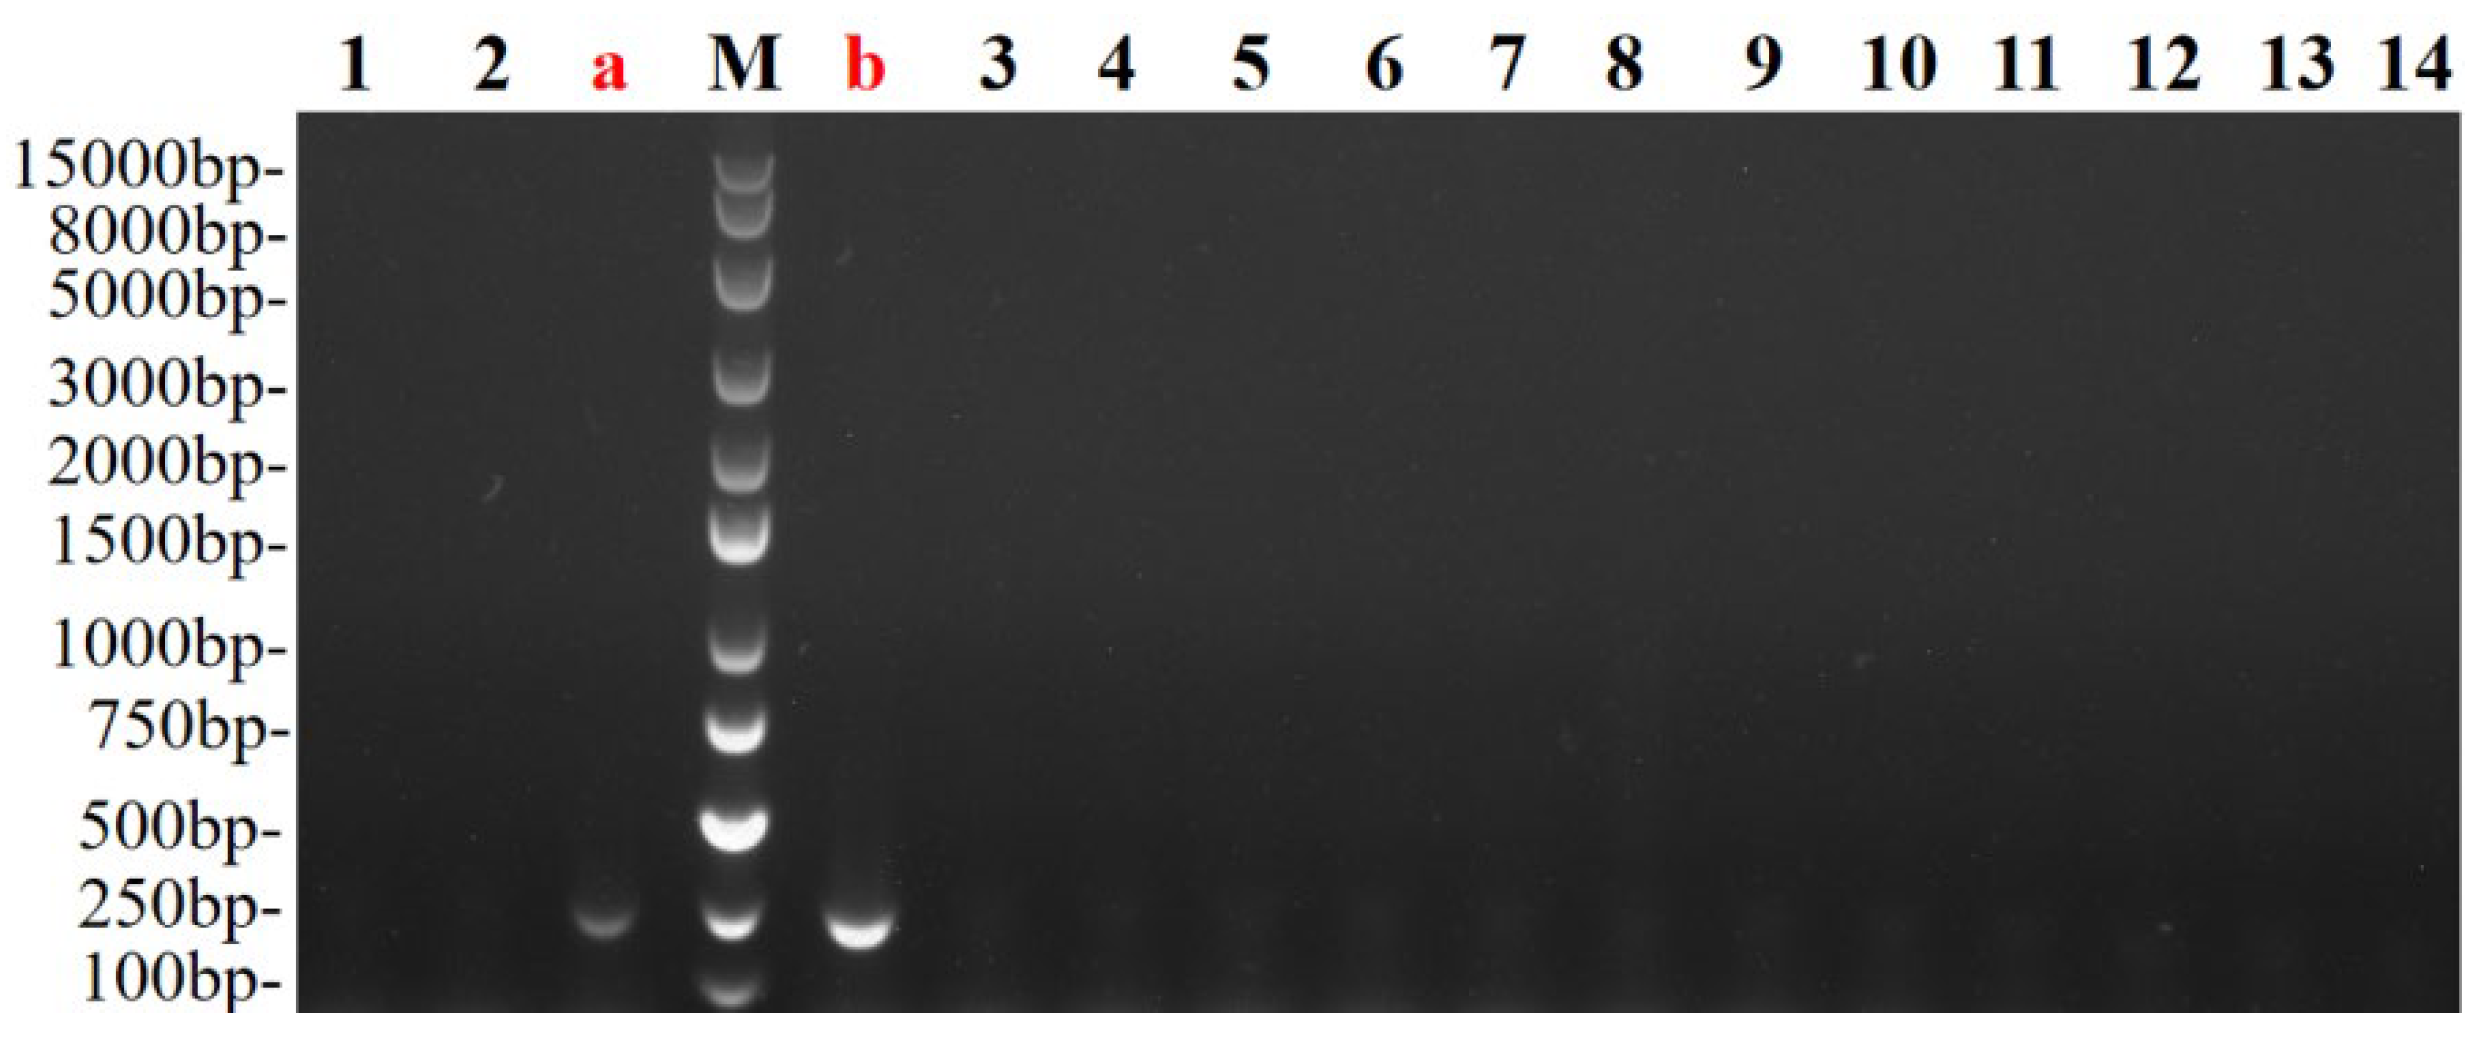
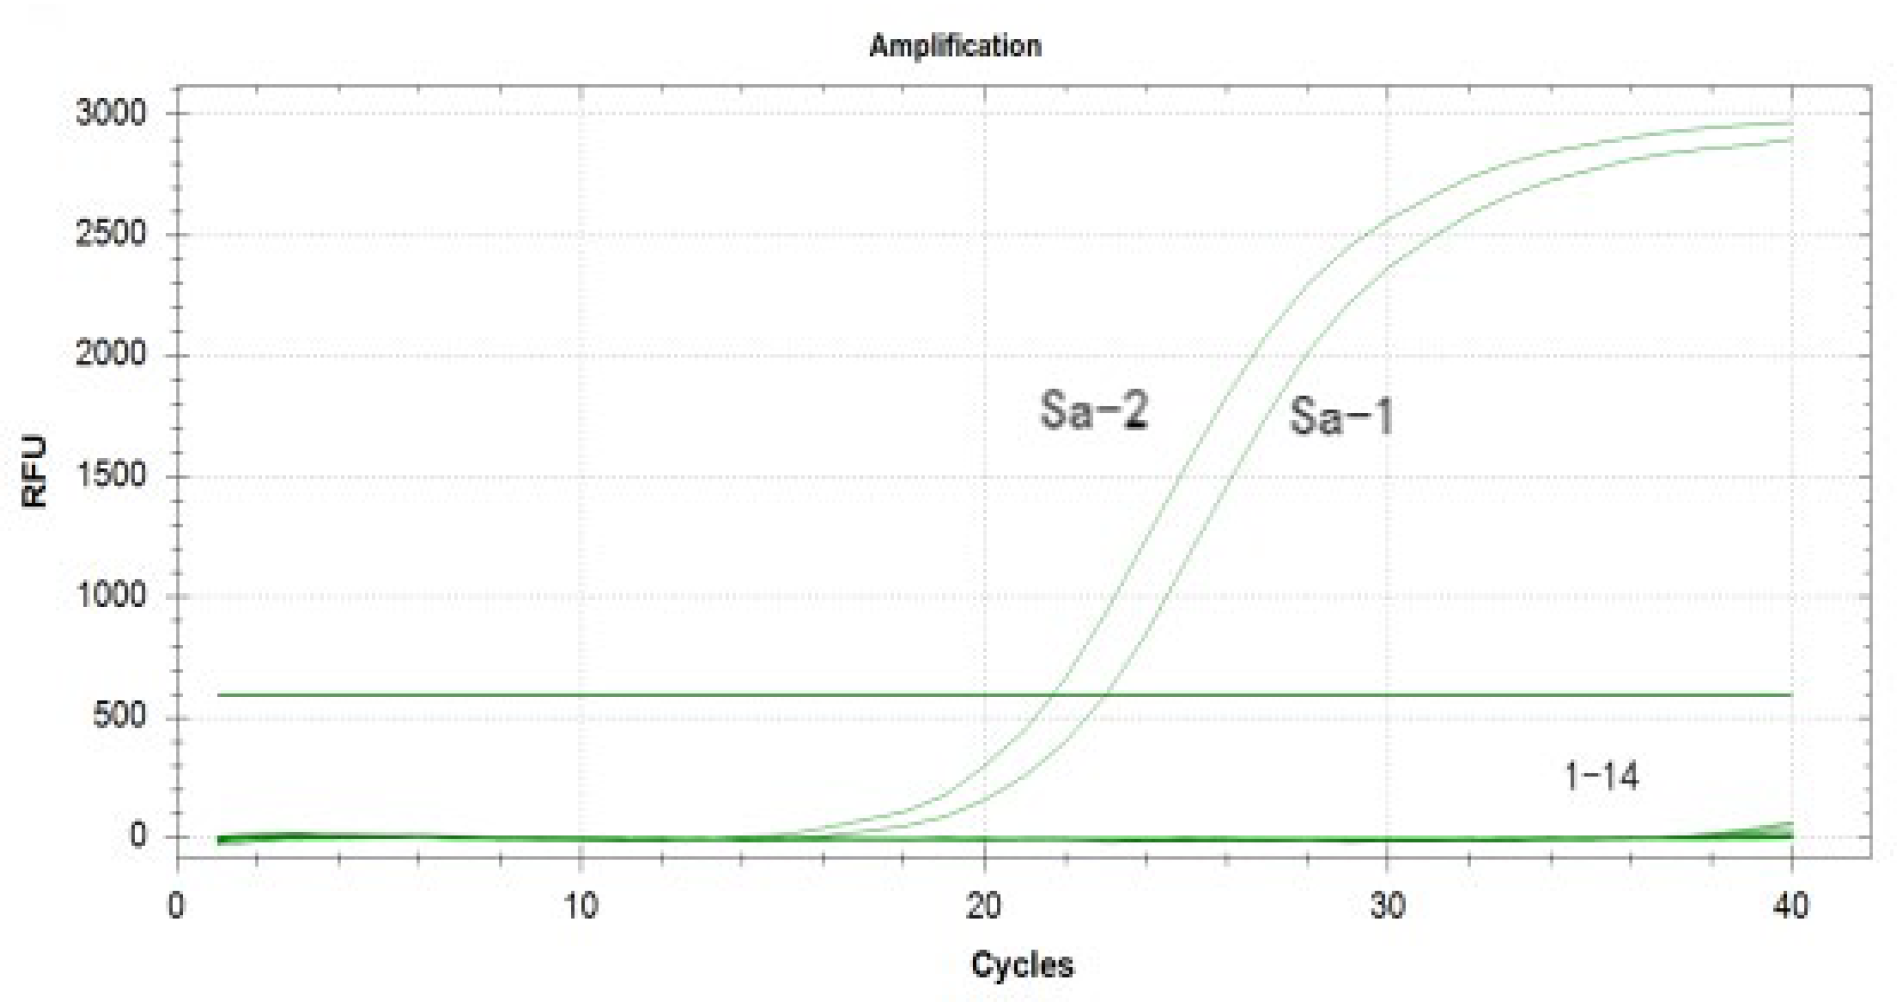
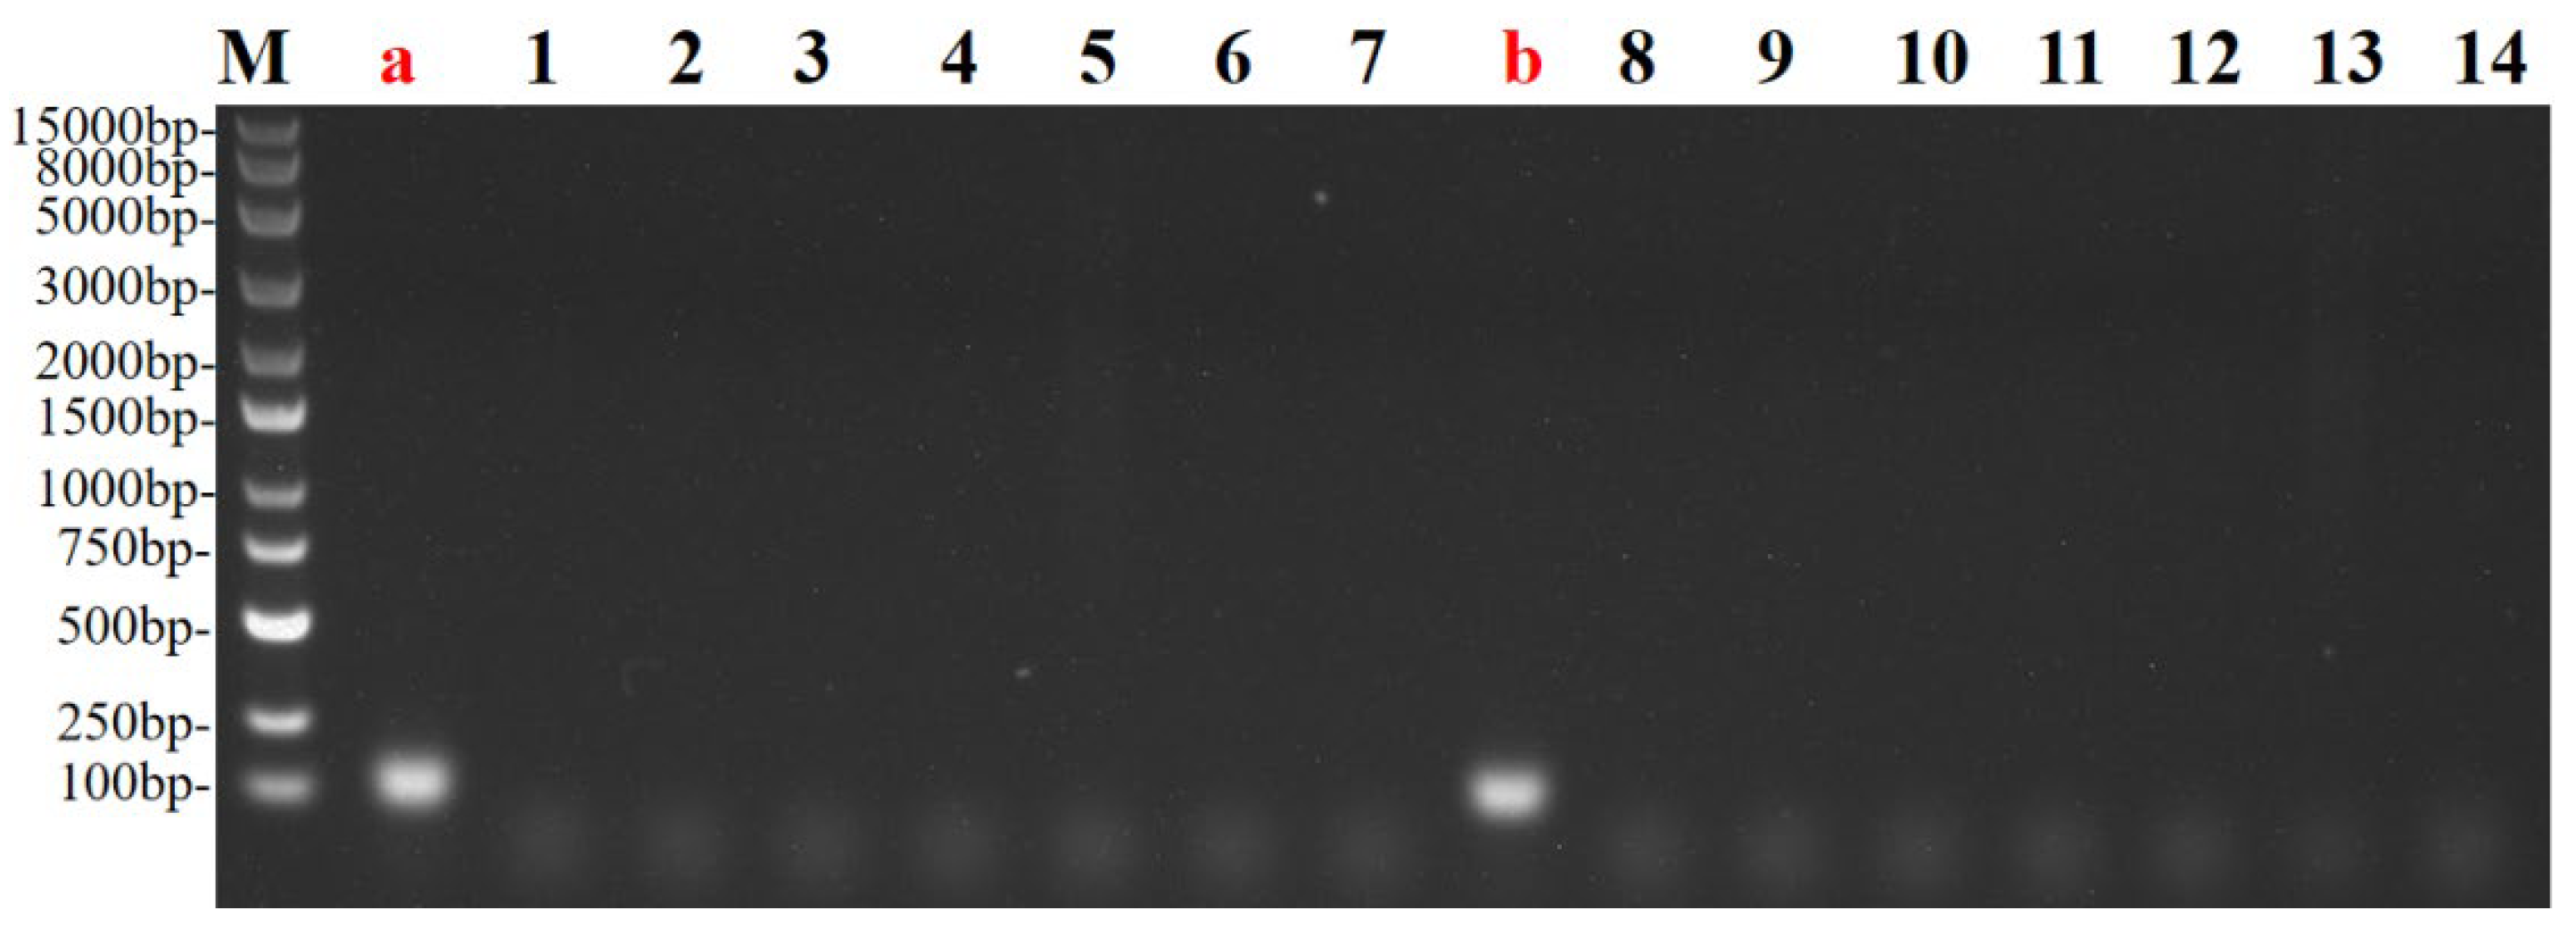
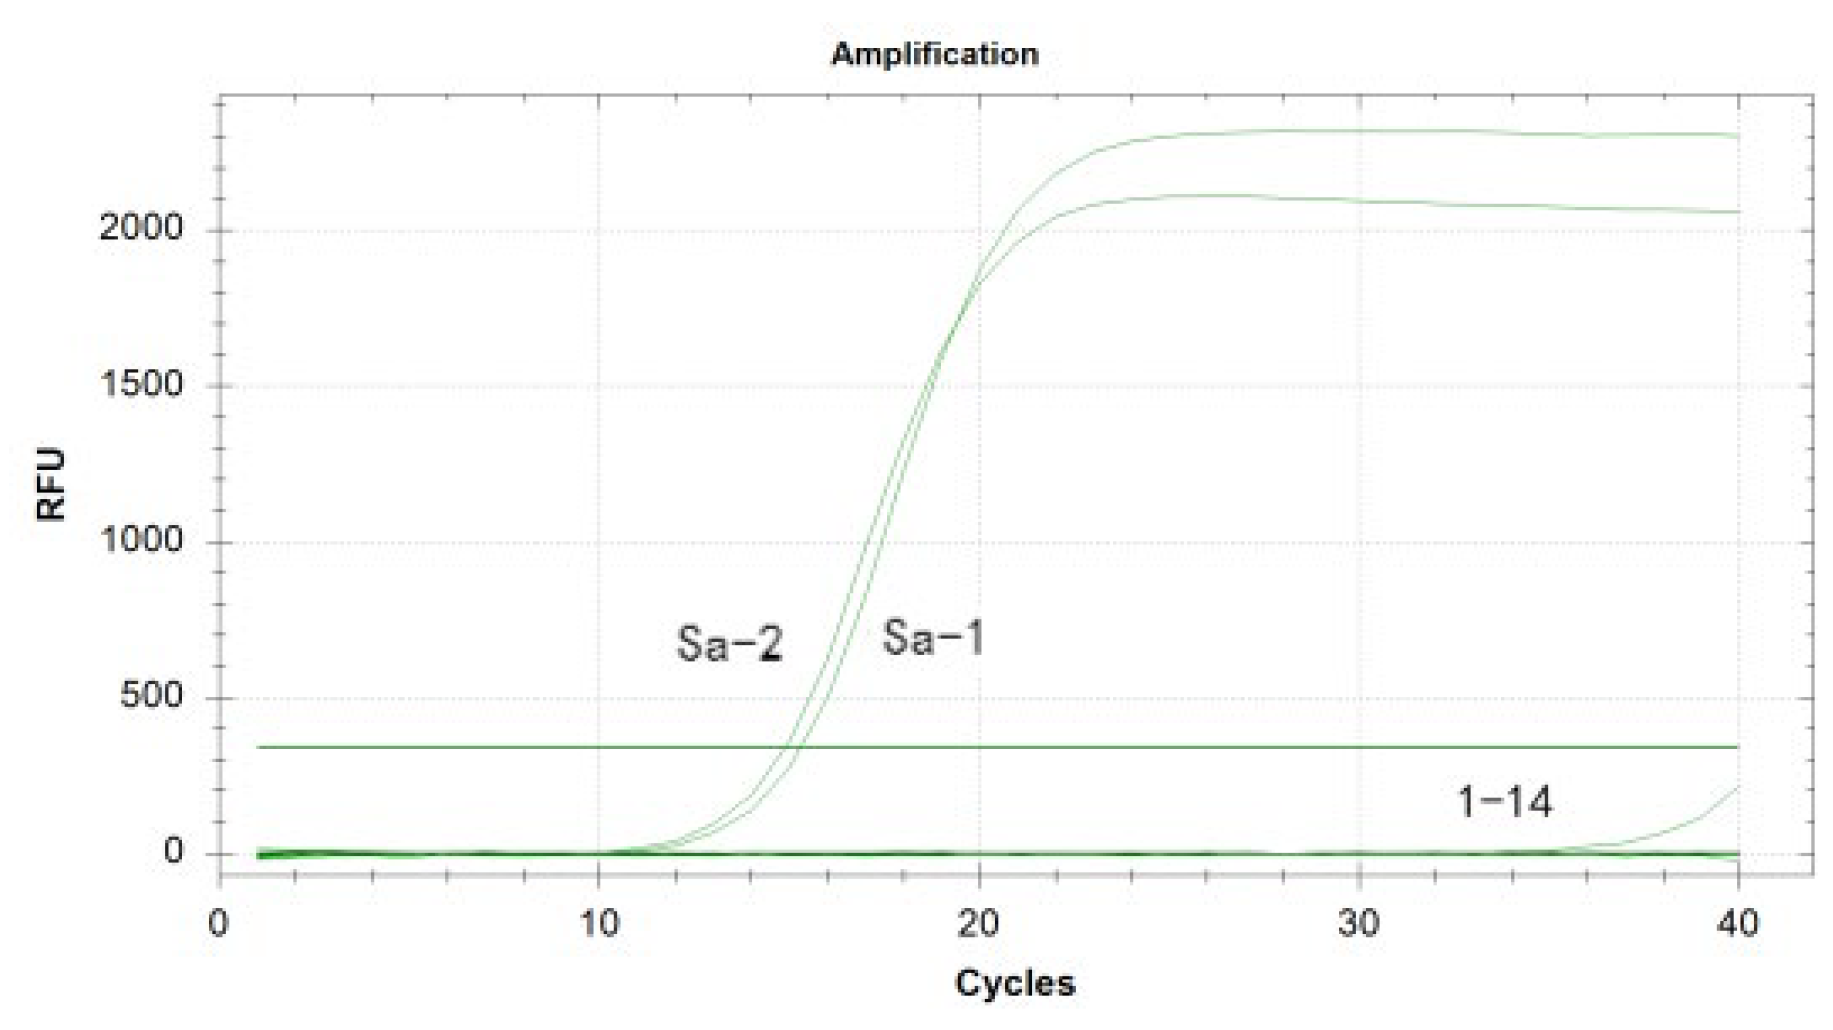
Figure 3.1.
Conventional PCR results of isdA gene. "M" lane represents DNA marker, "a" lane represents S. aureu-1, "b" lane represents S. aureu-2, and "1~14" lanes represent respectively P. aeruginosa, K. Pneumoniae, A. baumannii, S. pyogenes, P. mirabilis, N. meningitidis, S. salivarius, K. oxytoca, M. catarrhalis, L. pneumophila, H. influenzae, C. freundii, S. pneumoniae, M. pneumoniae.
Figure 3.2.
Results of isdA gene qPCR (SYBR Green). The curve "Sa-1" represents S. aureu-1, "Sa-2" represents S. aureu-2, and "1~14" respectively represent P. aeruginosa, K. Pneumoniae, A. baumannii, S. pyogenes, P. mirabilis, N. meningitidis, S. salivarius, K. oxytoca, M. catarrhalis, L. pneumophila, H. influenzae, C. freundii, S. pneumoniae, M. pneumoniae.
Figure 3.3.
Conventional PCR results of recQ gene."M" lane represents DNA marker, "a" lane represents S. aureu-1, "b" lane represents S. aureu-2, and "1~14" lanes represent respectively P. aeruginosa, K. Pneumoniae, A. baumannii, S. pyogenes, P. mirabilis, N. meningitidis, S. salivarius, K. oxytoca, M. catarrhalis, L. pneumophila, H. influenzae, C. freundii, S. pneumoniae, M. pneumoniae.
Figure 3.4.
recQ gene qPCR (SYBR Green) results.The curve "Sa-1" represents S. aureu-1, "Sa-2" represents S. aureu-2, and "1~14" respectively represent P. aeruginosa, K. Pneumoniae, A. baumannii, S. pyogenes, P. mirabilis, N. meningitidis, S. salivarius, K. oxytoca, M. catarrhalis, L. pneumophila, H. influenzae, C. freundii, S. pneumoniae, M. pneumoniae.
recQ Gene: Conventional PCR (Figure 3.3) showed a band around 100 bp only for S. aureus-1 and S. aureus-2. SYBR Green qPCR (Figure 3.4) showed amplification curves only for these strains.
These results confirm the high specificity of primer pairs isdA-F/R and recQ-F/R for S. aureus.
3.4. Optimization and Establishment of the Duplex Real-Time Fluorescence Quantitative PCR Method
The annealing temperature, primer concentration and probe concentration of the target gene were optimized.Optimal conditions were determined:
isdA Gene: Primer 0.9 μM, Probe 1 μM, Annealing 58 °C.
recQ Gene: Primer 12.5 μM, Probe 5 μM, Annealing 58 °C.
The optimized duplex PCR mixture (25 μL) contained: 12.5 μL Probe qPCR Mix MultiPlus (TaKaRa), 0.5 μL IsdA-qF (22.5 μM), 0.5 μL IsdA-qR (22.5 μM), 0.5 μL RecQ-qF (12.5 μM), 0.5 μL RecQ-qR (12.5 μM), 1 μL IsdA-qP (25 μM), 1 μL RecQ-qP (5 μM), 2 μL DNA template, sterile water to 25 μL.
Amplification used a CFX96 Real-Time PCR system (Bio-Rad): 95 °C for 20 s; 40 cycles of 95 °C for 1 s, 58 °C for 20 s (fluorescence collection).
3.5. Standard Curves for Duplex Real-Time Fluorescence Quantitative PCR
Standard plasmids pMD-18T-isdA (33.5 ng/μL) and pMD-18T-recQ (63.7 ng/μL) were constructed. Copy numbers were calculated as 1.335×10¹¹ copies/μL (isdA) and 7.265×10¹¹ copies/μL (recQ).
Equal volumes were mixed, serially diluted (100 to 10-10), and amplified under optimized conditions (Section 3.4). The standard curves (Figure 4) showed:
pMD-18T-isdA: y = -3.371x + 51.970, R² = 0.980, Efficiency = 98.0%.
pMD-18T-recQ: y = -3.139x + 46.098, R² = 0.991, Efficiency = 108.2%.
This demonstrates a strong linear relationship between Ct values and log copy number concentration, with high amplification efficiency, confirming assay robustness and stability.
3.6. Specificity Analysis of the Duplex Real-Time Fluorescence Quantitative PCR Assay
Testing genomic DNA from S. aureus and other pathogens under optimized conditions showed amplification curves only for S. aureus genomic DNA with all primer-probe sets (Figure 5). No amplification occurred with other pathogens or the negative control, confirming high specificity.
3.7. Reproducibility Analysis of the Duplex Real-Time Fluorescence Quantitative PCR Assay
Testing three mixed plasmid concentrations (10-1, 10-2, 10-3) yielded intra-assay and inter-assay CVs for Ct values below 1.86% and 2.87%, respectively (Table 3), demonstrating excellent accuracy and reproducibility.
3.8. Sensitivity Analysis of the Duplex Real-Time Fluorescence Quantitative PCR Assay
Plasmid Sensitivity: Serial dilutions of the mixed plasmids yielded limits of detection of 1.335 × 10³ copies/μL for isdA and 7.265 × 10² copies/μL for recQ (Figure 6).
Culture Sensitivity: Testing serial dilutions of genomic DNA from a S. aureus culture (3.59 × 10⁹ CFU/mL) by single-gene qPCR yielded limits of detection of 3.59 × 10² CFU/mL for isdA and 3.59 × 10³ CFU/mL for recQ (Figure 7).
4. Discussion
Significant genetic variation exists among strains of pathogenic bacteria. Pangenome analysis identifies core genes shared by all strains and accessory genes present in subsets, providing a comprehensive view of genetic diversity. Core genes are typically associated with fundamental biological functions and pathogenesis. Identifying highly conserved core genes through this analysis enables the development of diagnostic assays targeting multiple genes, enhancing accuracy and reliability.
This study performed pan-genome analysis on 200 S. aureus genomes. BLAST analysis identified isdA and recQ as candidate target genes. Both genes were present in all 200 genomes with intraspecies sequence similarity exceeding 90%, indicating high conservation and species specificity. These characteristics make them suitable molecular diagnostic targets. Targeting both genes reduces the risk of false negatives due to sequence variability among strains.
This study selected the highly specific and conserved core genes isdA and recQ as detection targets. We systematically investigated the effects of primer concentration, probe concentration, and annealing temperature on duplex qPCR performance[23], determined optimal reaction conditions, and successfully established a duplex qPCR assay[24]. The method demonstrated excellent specificity, reproducibility, and sensitivity. Simultaneous detection of two targets in a single reaction significantly reduces the risk of false positives and false negatives during S. aureus detection, eliminates the need for repeated testing, and saves time and cost[25].
Wang Yan et al. (2024) employed traditional culture methods as the gold standard for S. aureus detection, improving accuracy but requiring 3~5 days, making it unsuitable for rapid diagnosis[26]. Sun Xiuxiu (2024) and Wang Xuerong (2025) applied qPCR targeting single S. aureus-specific genes, increasing the likelihood of false negatives and reducing accuracy[27,28]. Current qPCR studies for S. aureus mainly target genes like nuc, Sa442, and pvl, often without systematic evaluation of gene specificity and conservation. The duplex qPCR method developed here is the first to select two conserved genes as detection targets, effectively reducing false-positive and false-negative results. This provides new molecular targets for rapid S. aureus detection and supports early, accurate diagnosis, with significant potential for disease prevention and control[29].
Recently, global antibiotic resistance rates in S. aureus have risen, posing a serious challenge for clinical treatment. Resistance analysis reveals S. aureus employs multiple resistance mechanisms. The emergence of methicillin-resistant S. aureus (MRSA) has further complicated treatment[30]. Identified resistance genes include mecA (encoding penicillin-binding protein 2A, PBP2a, conferring β-lactam resistance)[31] and erm genes (conferring macrolide resistance via ribosomal methylation)[32]. Based on this study's findings, we aim to develop multiplex detection methods targeting S. aureus resistance genes to support precise antibiotic use and provide new strategies for effective treatment.
5. Conclusions
In this study, we conducted a pan-genome analysis of S. aureus and identified two highly conserved and specific core genes, isdA and recQ, as detection targets. Based on these targets, we developed a TaqMan probe-based duplex real-time PCR assay for the detection of S. aureus, enabling simultaneous detection of both genes in a single reaction.
The established method demonstrated a detection sensitivity of 1.335×10³ copies/μL for isdA and 7.265×10²copies/μL for recQ. The intra-assay and inter-assay coefficients of variation (CVs) for the amplification Ct values were below 1.86% and 2.87%, respectively, indicating high reproducibility. Specificity testing confirmed no cross-reactivity with common pathogenic bacteria, including Pseudomonas aeruginosa, Streptococcus pneumoniae, and 12 other respiratory pathogens.This assay provides a rapid, accurate, and highly specific diagnostic tool for the early detection of S. aureus infections.
References
- Cheung, G.Y.C.; Bae, J.S.; Otto, M. Pathogenicity and virulence of Staphylococcus aureus. Virulence. 2021, 12, 547–569. [Google Scholar] [CrossRef]
- David, H.; Sara, E.C.; Sarah, B.D.; et al. Ceftobiprole for Treatment of Complicated Staphylococcus aureus Bacteremia. The New England Journal of Medicine. 2023, 389, 1390–1401. [Google Scholar]
- Kwiecinski, J.M.; Horswill, A.R. Staphylococcus aureus bloodstream infections: Pathogenesis and regulatory mechanisms. Curr Opin Microbiol. 2020, 53, 51–60. [Google Scholar] [CrossRef]
- Gordon, Y.C.; Justin, S.B.; Michael, O. Pathogenicity and virulence of Staphylococcus aureus. Virulence. 2021, 12, 547–569. [Google Scholar]
- Peter, P.; Matthias, N.; José-Luiz, F.; et al. In vivo detection of Staphylococcus aureus endocarditis by targeting pathogen-specific prothrombin activation. Nature Medicine. 2011, 17, 1142–1146. [Google Scholar]
- Ahmad-Mansour, N.; Loubet, P.; Pouget, C.; et al. Staphylococcus aureus Toxins: An Update on Their Pathogenic Properties and Potential Treatments. Toxins 2021, 13, 677. [Google Scholar] [CrossRef] [PubMed]
- Ali, B.A. Isolation and Identification of Escherichia coli and Staphylococcus aureus from animal and detection of their antibiotics susceptibility pattern. University of Thi-Qar Journal of Science. 2022, 9, 3–8. [Google Scholar]
- Chan, R.; Buckley, P.T.; O'Malley, A.; et al. Identification of biologic agents to neutralize the bicomponent leukocidins of Staphylococcus aureus. Sci Transl Med. 2019, 11, eaat0882. [Google Scholar] [CrossRef]
- Jari, J.H. The use of molecular methods for the detection and identification of methicillin-resistant Staphylococcus aureus. Biomarkers in Medicine. 2014, 8, 1115–1125. [Google Scholar]
- Lai, J.; Huang, Z.; Xiao, Y.; et al. Development and Evaluation of Duplex MIRA-qPCR Assay for Simultaneous Detection of Staphylococcus aureus and non-aureus Staphylococci. Microorganisms. 2022, 10, 1734. [Google Scholar] [CrossRef]
- Jong-Min, K.; Hye-Ryung, K.; Gyu-Tae, J.; et al. Molecular Detection of Porcine Parainfluenza Viruses 1 and 5 Using a Newly Developed Duplex Real-Time RT-PCR in South Korea. Animals. 2023, 13, 598–598. [Google Scholar]
- Min, H.; Cai, H.; Sun, Y.; et al. Rapid and accurate detection for Staphylococcus aureus in drugs based on real-time fluorescent quantitative PCR. Natural Science Edition. 2024, 52, 113–121. [Google Scholar]
- Marjan, A. Proving similarity between MRJP1 and Yellow Protein with using blast and NCBI. Asian Journal of Pharmaceutical Technology and Innovation. 2021, 9, 1–4. [Google Scholar]
- Chen, Z.W.; Nigel, G.H.; Liu, C.H. Real-Time Quantitative PCR: Primer Design, Reference Gene Selection, Calculations and Statistics. Metabolites. 2023, 13, 806–806. [Google Scholar] [CrossRef]
- Li, Z.X.; Zhao, F.; Yu, X.L.; et al. Establishment of SYBR Green I real-time qPCR for the detection of bovine parvovirus. Chinese Veterinary Science. 2019, 49, 1136–1142. [Google Scholar]
- Joohwan, K.; Jin, H.K.; Pengbin, W.; et al. An Improved Quantitative Real-Time PCR Assay for the Enumeration of Heterosigma akashiwo (Raphidophyceae) Cysts Using a DNA Debris Removal Method and a Cyst-Based Standard Curve. PLoS ONE. 2016, 11, e0145712–e0145712. [Google Scholar]
- Hu, L.Y.; Han, B.; Tong, Q.; et al. Detection of Eight Respiratory Bacterial Pathogens Based on Multiplex Real-Time PCR with Fluorescence Melting Curve Analysis. Canadian Journal of Infectious Diseases & Medical Microbiology. 2020, 2020, 1–11. [Google Scholar]
- Erin, D.M.; Colleen, W.; Laura, T.; et al. Screening for Babesia microtiin the U. S. Blood Supply. The New England Journal of Medicine. 2016, 375, 2236–2245. [Google Scholar]
- Jiang, Y.; Zhang, S.; Qin, H.; et al. Establishment of a quantitative RT-PCR detection of SARS-CoV-2 virus. Eur J Med Res. 2021, 26, 147. [Google Scholar] [CrossRef]
- Bai, L.; Cheng, Y.; Cao, R.Z.; et al. Prediction and identification of linear B cell epitopes of Staphylococcus aureus IsdA protein. Chinese Journal of Pathogenic Biology, 2016, 11, 316–319. [Google Scholar]
- Ji Lei. Study on the enzymatic properties and structure of RecQ helicase WRN and RecQ1 [D]. Northwest A&F University, 2020.
- Ding, P.; Gao, Y.; Tan, X.L.; et al. Bioinformatics and Transcriptomic Expression Analysis of the BnaC. RECQ4B Gene in Brassica napus. Jiangsu Agricultural Sciences, 2023, 51, 57–64. [Google Scholar]
- Peng, X.J.; Alex, N.; Debadyuti, G. Quantification of M13 and T7 bacteriophages by TaqMan and SYBR green qPCR. Journal of Virological Methods. 2018, 252, 100–107. [Google Scholar] [CrossRef]
- Meng, W.X.; Chen, Z.H.; Jiang, Q.F.; et al. A multiplex real-time fluorescence-based quantitative PCR assay for calf diarrhea viruses. Frontiers in Microbiology. 2024, 14, 0–0. [Google Scholar] [CrossRef]
- Jia, J.H.; Ao, L.J.; Luo, Y.X.; et al. Quantum dots assembly enhanced and dual-antigen sandwich structured lateral flow immunoassay of SARS-CoV-2 antibody with simultaneously high sensitivity and specificity. Biosensors and Bioelectronics. 2022, 198, 113810–113810. [Google Scholar] [CrossRef]
- Wang, Y.; Li, J.Q. The Application Effect of Real-time Fluorescent Quantitative PCR in the Detection of Foodborne Pathogenic Bacteria. Medical Equipment. 2024, 37, 58–60. [Google Scholar]
- Sun, X.X.; Xu, Y.M.; Zhou, Y.X.; et al. Establishment and Validation of Multiplex Fluorescence Quantitative PCR Detection Methods for Bacteria and Fungi in Cell Culture Media. Chinese Journal of Biological Products. 2024, 37, 335–342. [Google Scholar]
- Wang, X.R.; Zhang, Y.; Zhang, H.S.; et al. Establishment and Application of Multiplex PCR Detection Methods for Five Pathogenic Bacteria of Mastitis in Cattle. Advances in Animal Medicine. 2025, 46, 48–55. [Google Scholar]
- Huang, C.X.; Zheng, R.J.; Ding, Y.F.; et al. Dual phage amplification-mediated multiplex detection strategies for the simultaneous detection of Salmonella enterica and Staphylococcus aureus. Talanta. 2023, 253, 124095–124095. [Google Scholar] [CrossRef]
- Wang, M.; Li, R.; Sheng, S.; et al. MOF nanozyme mediated bacterial metabolic regulation to intervene MRSA antibiotic tolerance for enhanced antimicrobial efficacy. Nano Today. 2025, 63102753–102753. [Google Scholar] [CrossRef]
- Rachmawati, F.; Ariyanti, T.; Noor, S.; et al. Exploring nuc A and mecA genes in Staphylococcus aureus isolates from dairy cow milk through molecular characterization. IOP Conference Series: Earth and Environmental Science, 2025, 1471, 012061–012061. [Google Scholar] [CrossRef]
- André, C.; Wu, Y.J.K.; Myers, G.A.; et al. Synthetic lincosamides iboxamycin and cresomycin are active against ocular multidrug-resistant methicillin-resistant S. aureus carrying erm genes. Journal of global antimicrobial resistance 2024, 39144–39148. [Google Scholar] [CrossRef]
Figure 1.
Pan-genome analysis results of S. aureus.
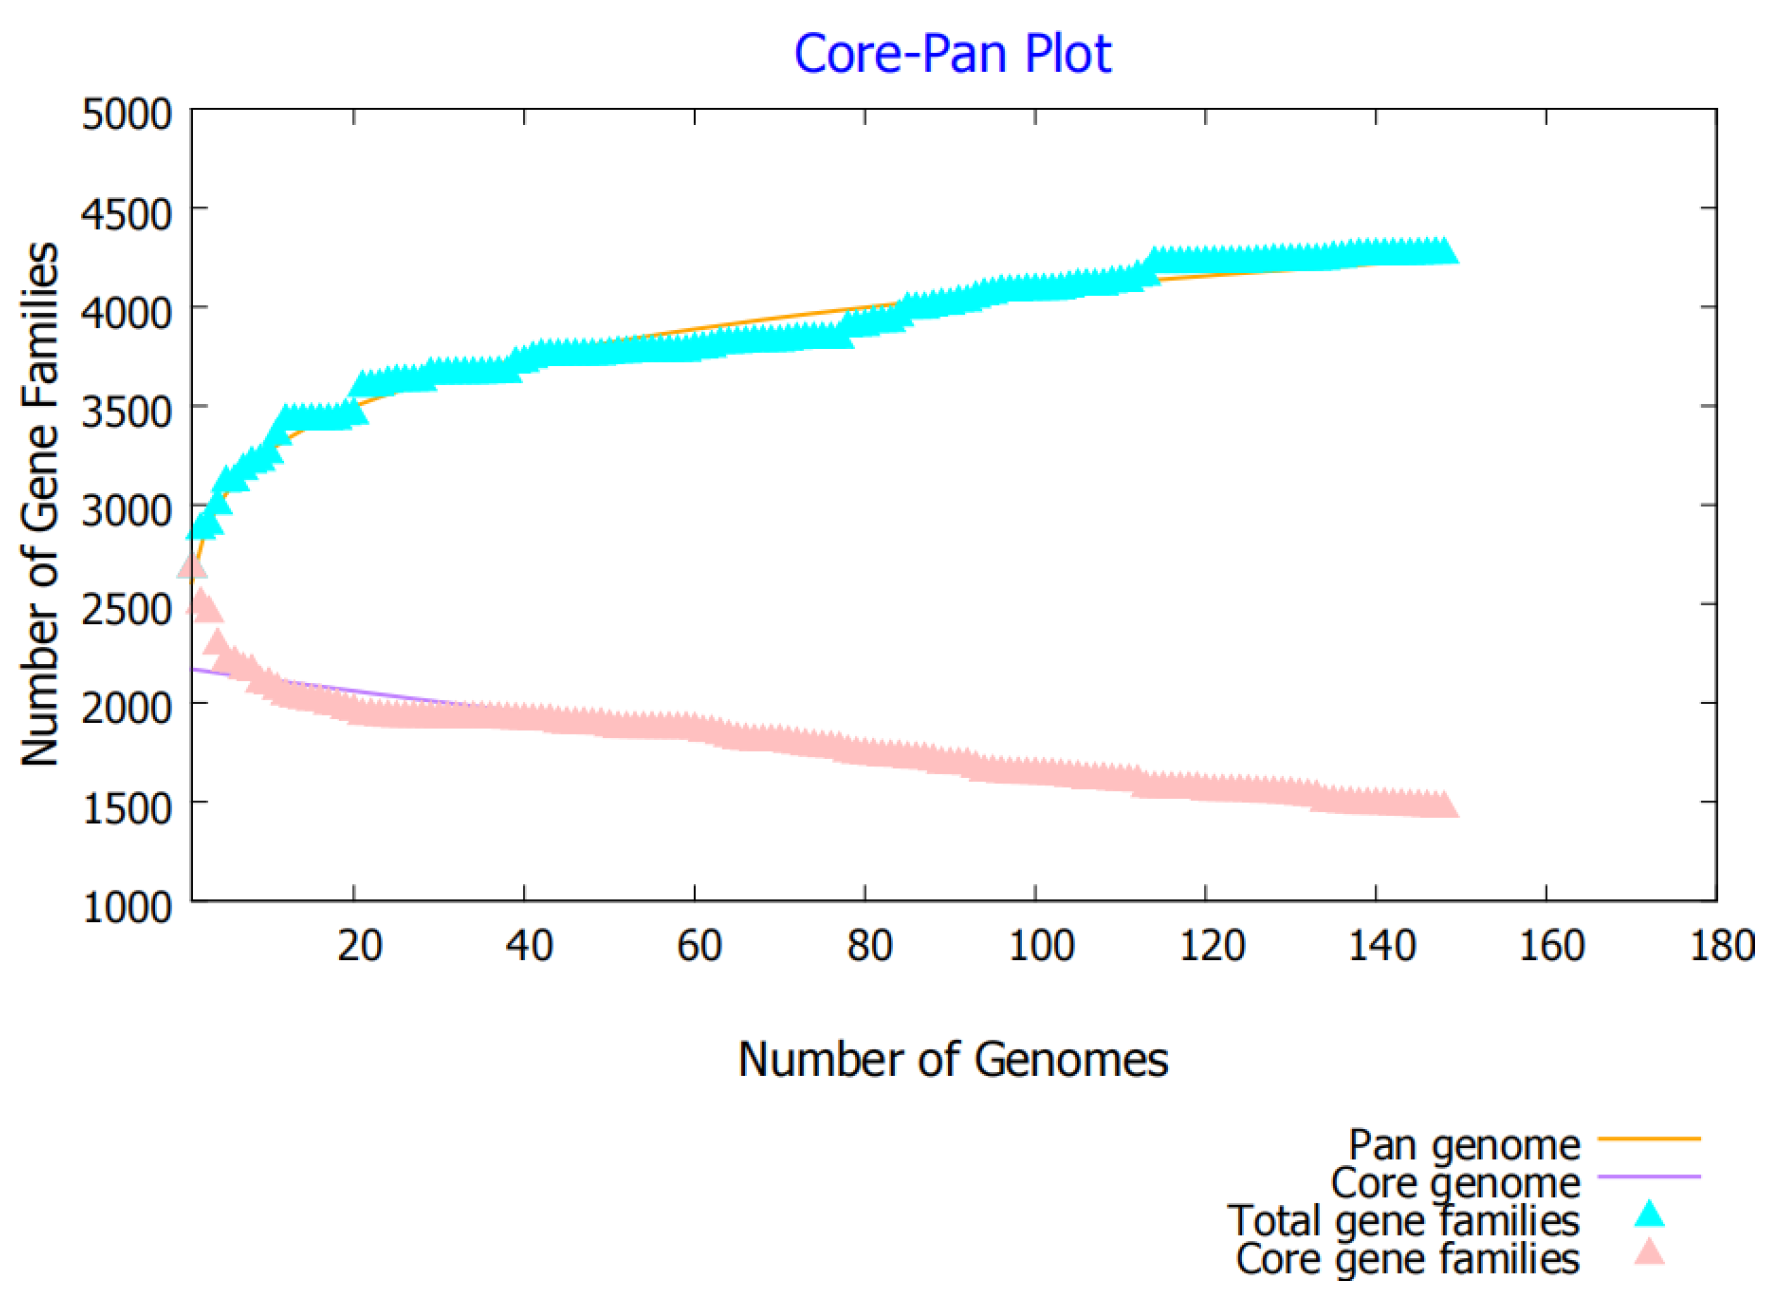
Figure 4.
Double fluorescence quantitative PCR standard curve.
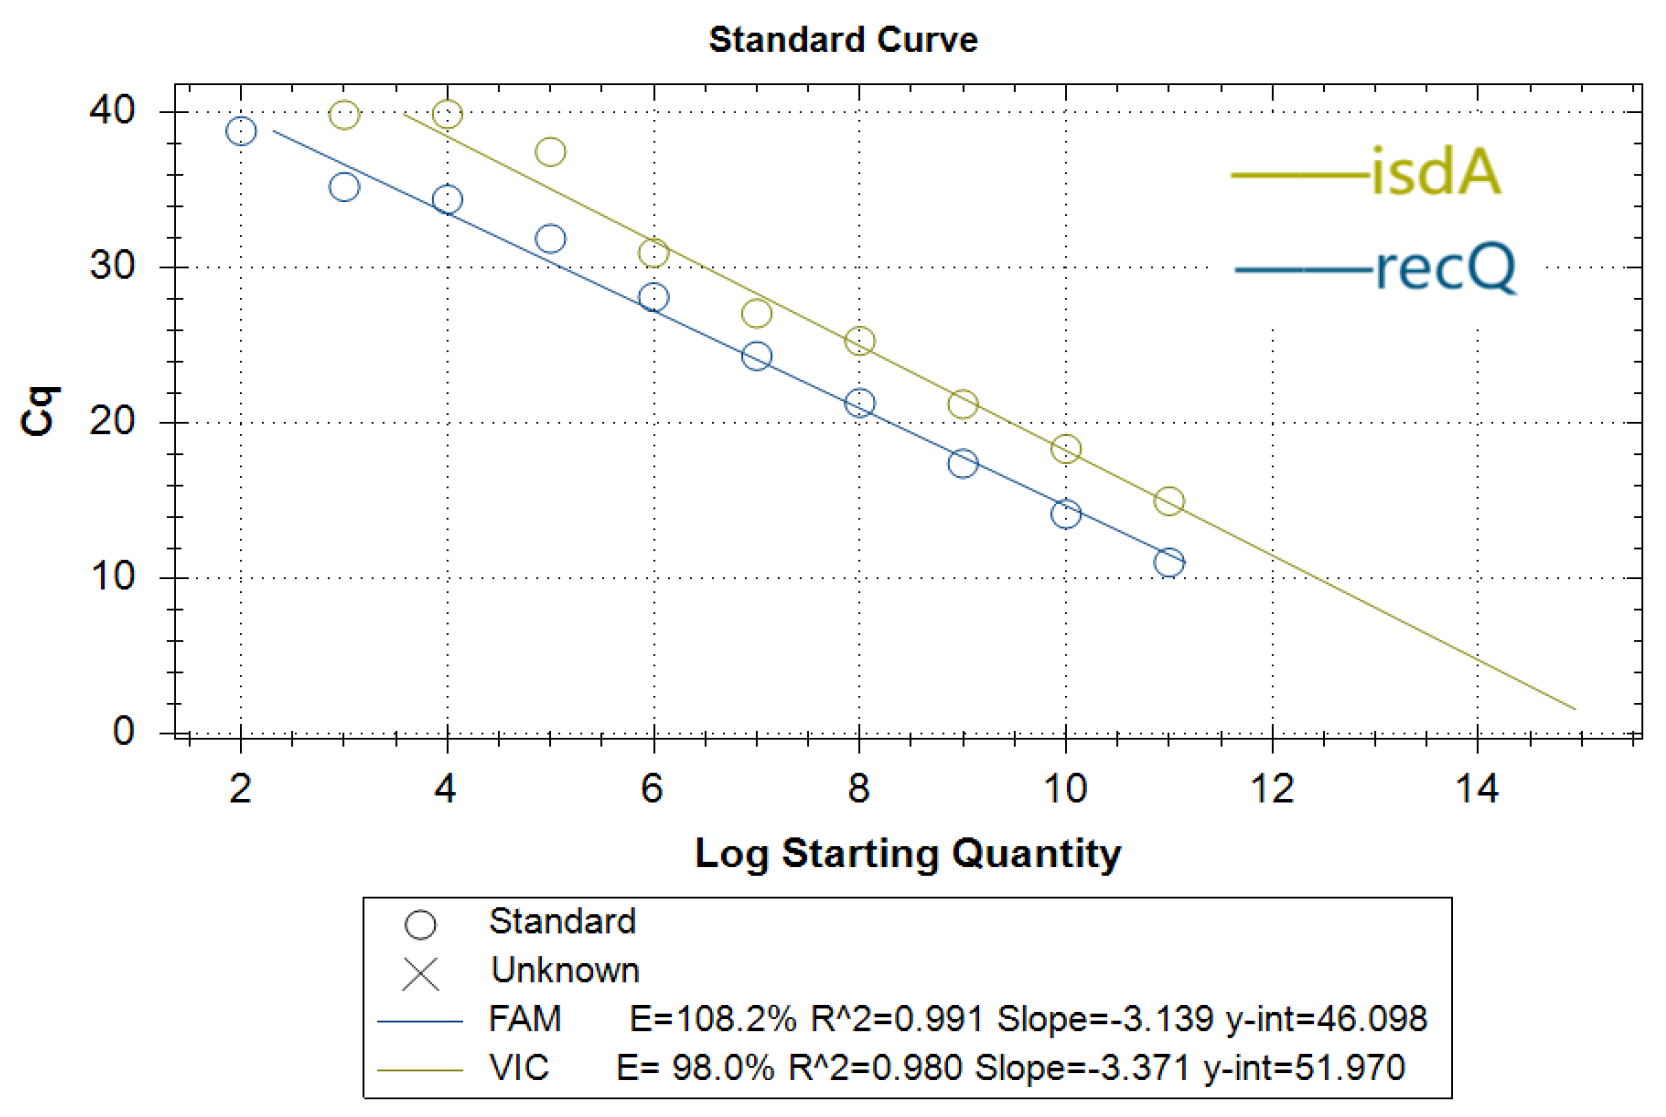
Figure 5.
Specificity analysis of double fluorescence quantitative PCR detection.Curve "1" represents S. aureus, and "2~15" respectively represent P. aeruginosa, K. Pneumoniae, A. baumannii, S. pyogenes, P. mirabilis, N. meningitidis, S. salivarius, K. oxytoca, M. catarrhalis, L. pneumophila, H. influenzae, C. freundii, S. pneumoniae, M. pneumoniae.
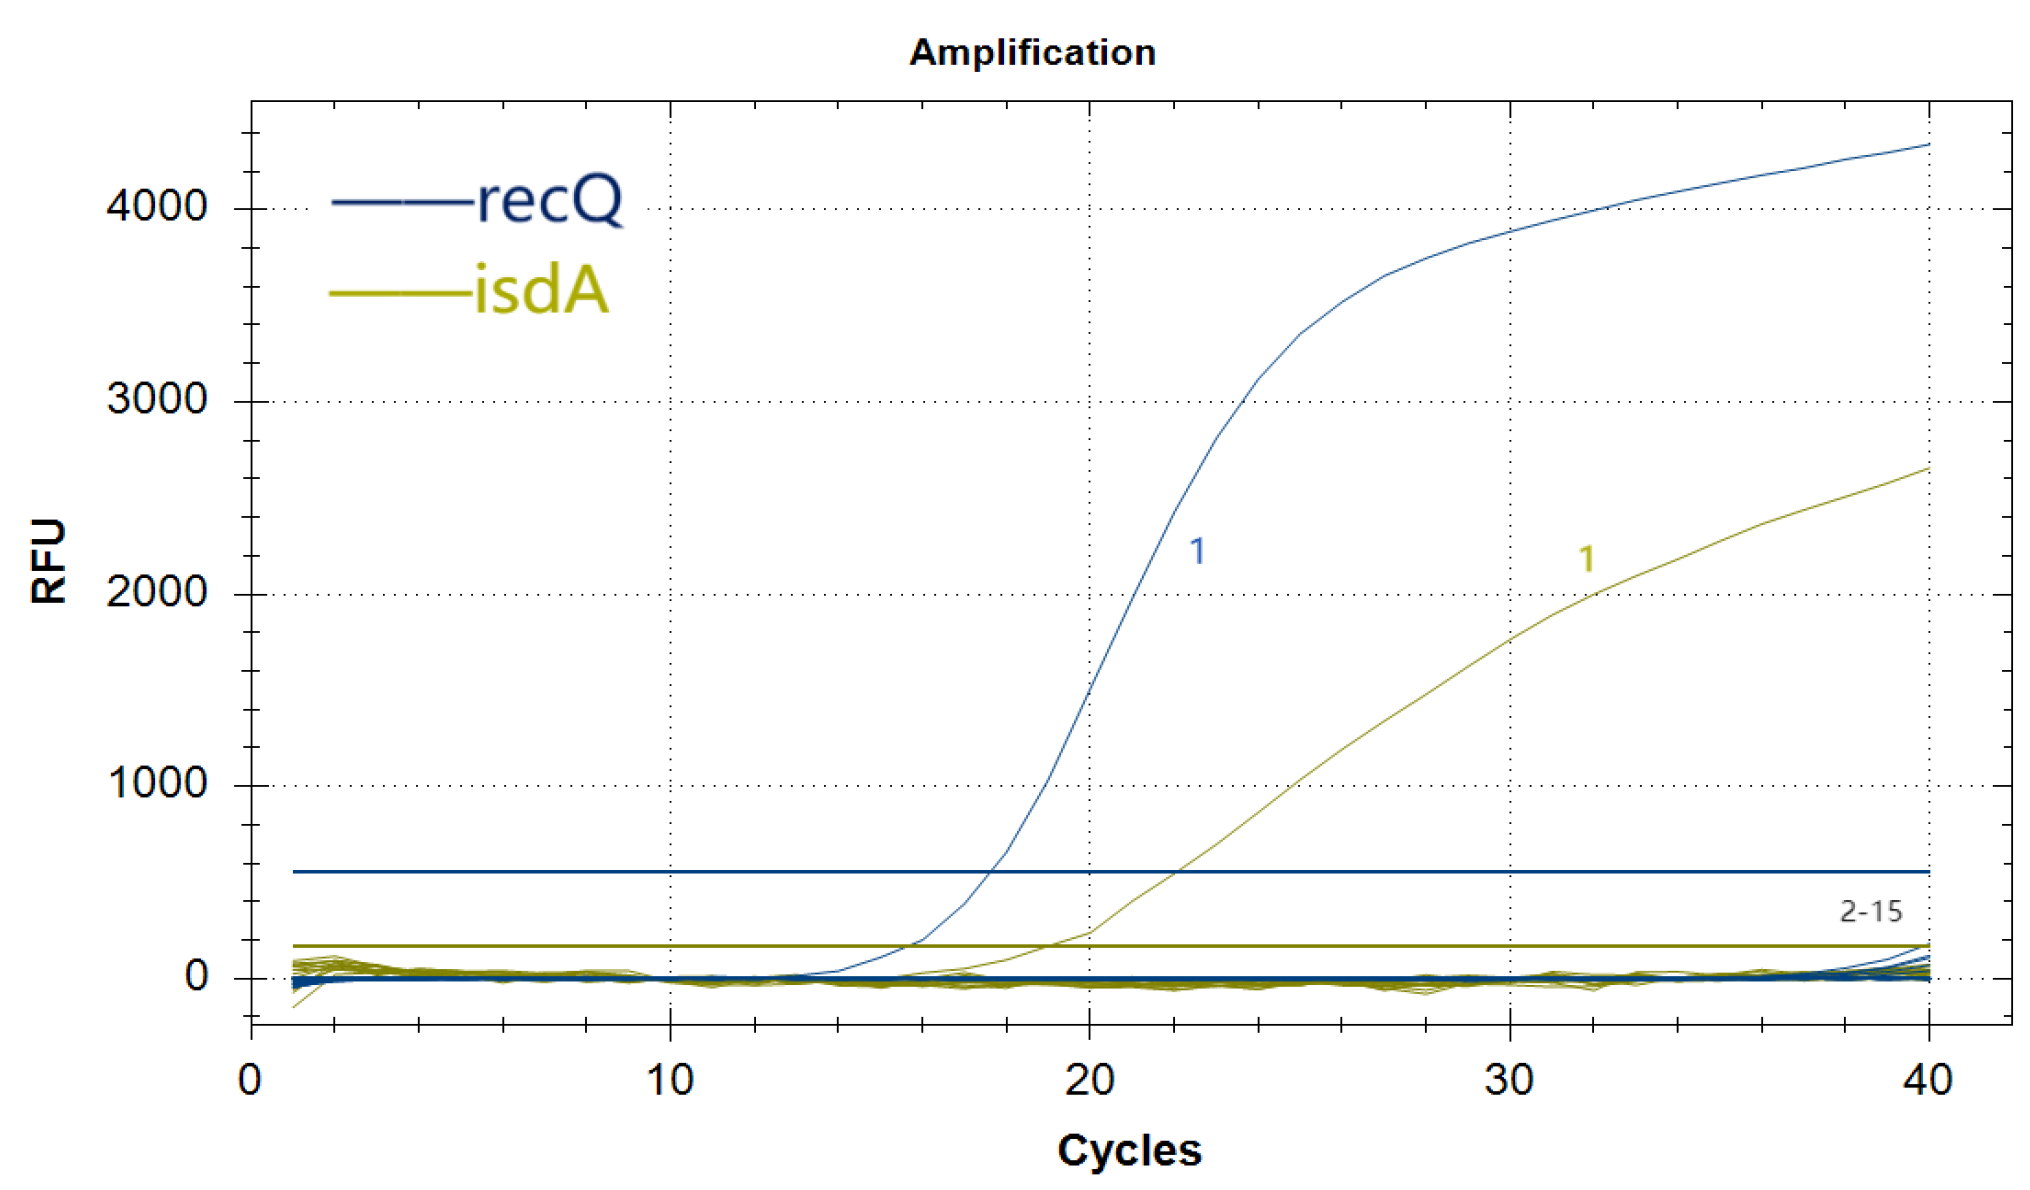
Figure 6.
Sensitivity analysis of double fluorescence quantitative PCR detection. The curves "1~11" represent the amplification curves of the template 2μL diluted by 1×100,1×10-1 to 1×10⁻¹⁰ of the mixed plasmids.
Figure 6.
Sensitivity analysis of double fluorescence quantitative PCR detection. The curves "1~11" represent the amplification curves of the template 2μL diluted by 1×100,1×10-1 to 1×10⁻¹⁰ of the mixed plasmids.
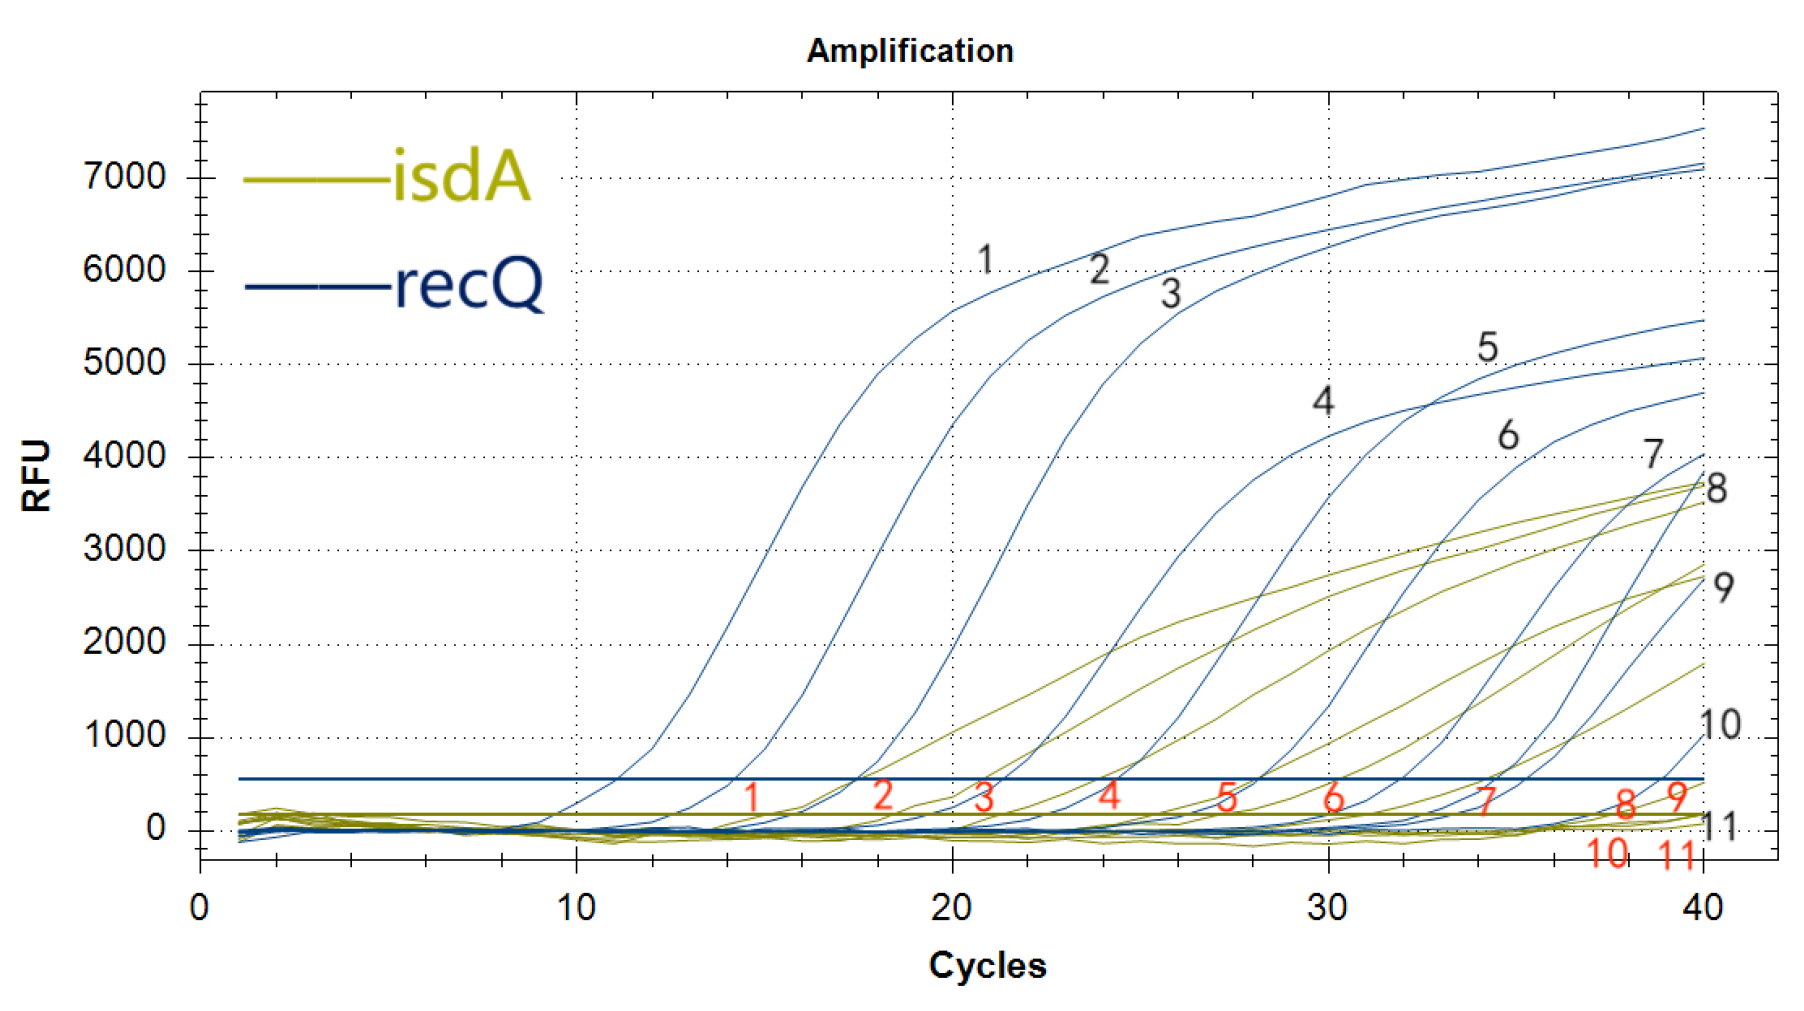
Figure 7.
(a) Sensitivity analysis of isdA gene to qPCR in S. aureus cultures. (b) Sensitivity analysis of recQ gene to qPCR in S. aureus cultures. Curves "1~7" represent the amplification curves of DNA from S. aureus cultures with templates of 2μL 3.59×10⁷, 3.59×10⁶ to 3.59×101CFU/mL, respectively; curve "8" represents the negative control.
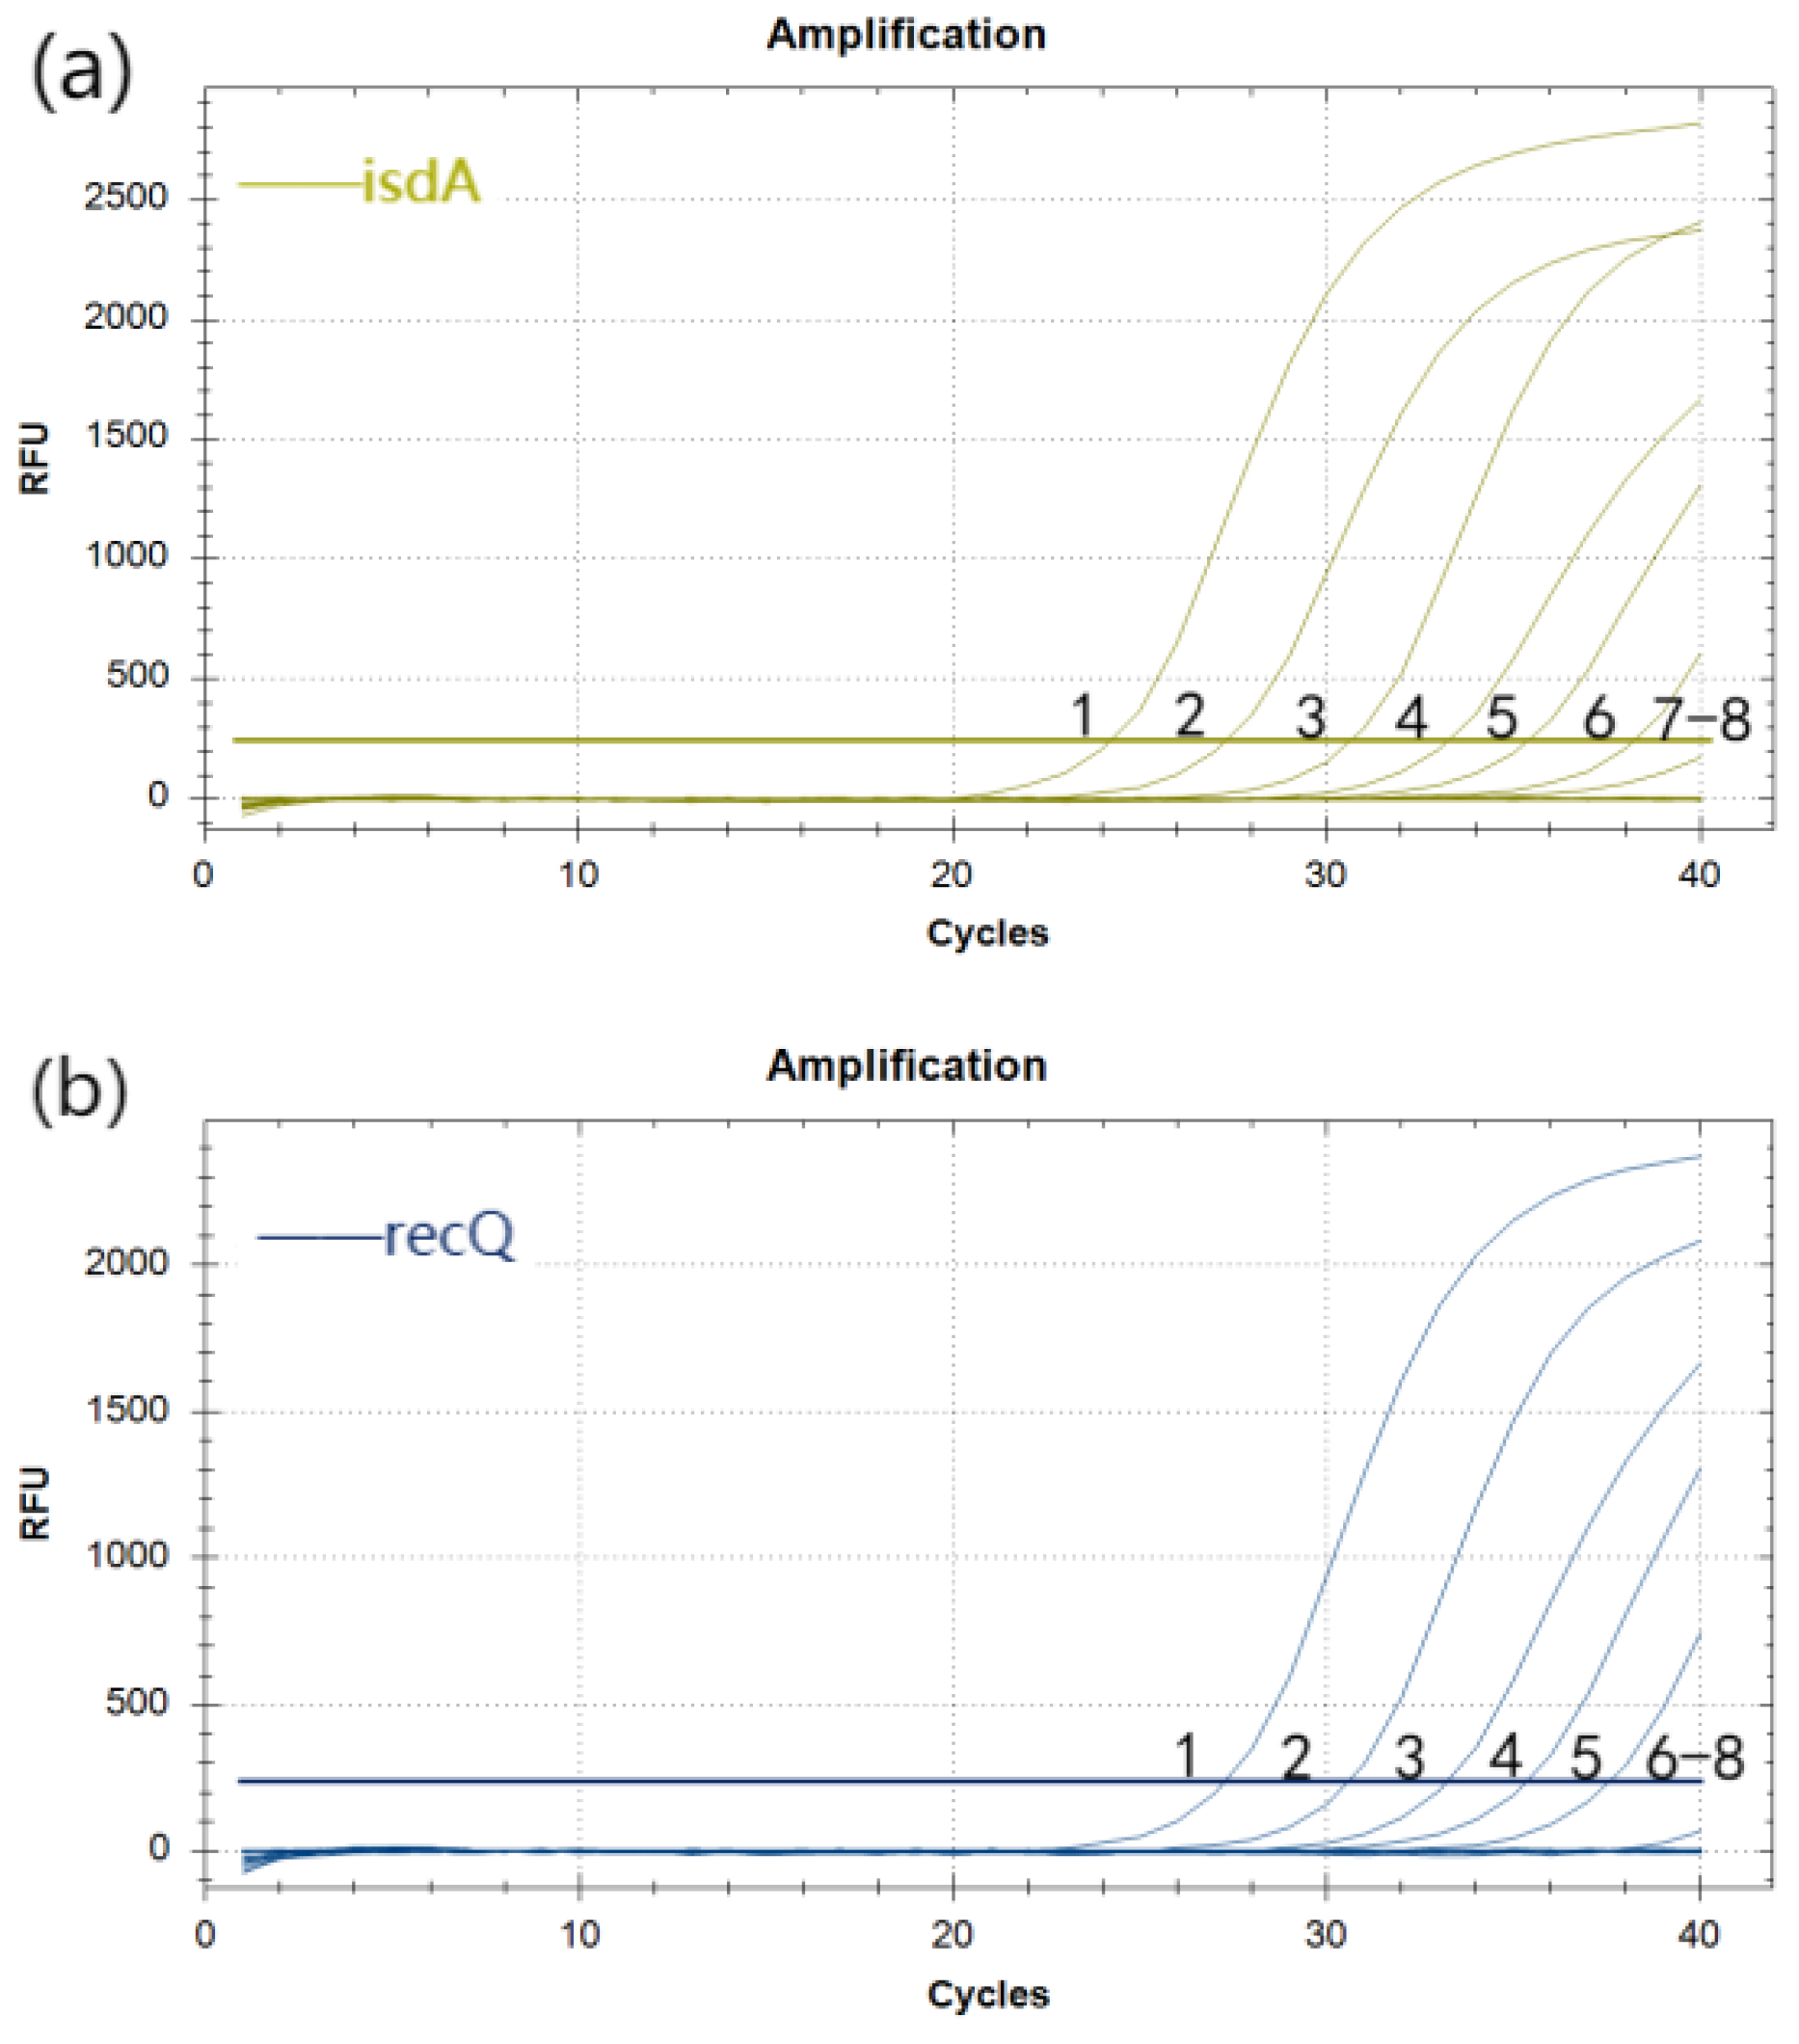

Table 1.
Analysis results of specificity and conservation of target genes.
| Fungus name | isdAgene | recQgene | ||
| highest score | similarity% | highest score | similarity% | |
| S. aureus | 1945 | 93~100 | 948 | 95~100 |
| P. aeruginosa | 0 | 0 | 0 | 0 |
| K. pneumoniae | 0 | 0 | 0 | 0 |
| A. baumannii | 0 | 0 | 0 | 0 |
| P. mirabilis | 0 | 0 | 0 | 0 |
| K. oxytoca | 0 | 0 | 0 | 0 |
| M. catarrhalis | 0 | 0 | 0 | 0 |
| L. pneumophila | 0 | 0 | 0 | 0 |
| H. influenzae | 0 | 0 | 0 | 0 |
| N. meningitidis | 0 | 0 | 0 | 0 |
| C. freundii | 0 | 0 | 0 | 0 |
| S. pneumoniae | 0 | 0 | 0 | 0 |
| M. pneumonia | 0 | 0 | 0 | 0 |
| S. pyogenes | 0 | 0 | 0 | 0 |
| S. salivarius | 0 | 0 | 0 | 0 |
Table 2.
Primer and probe sequences.
| Target gene | Primers/probes | sequences(5’→3’) | Fragment size(bp) |
| isdA | isdA-qF | ACAGCACAAACTGCTCAAGA | 229bp |
| isdA-qR | GTGTTGCGAAGGCAACTGTG | ||
| isdA-qP | VIC-CAAAATAAAGTTCAAACACC-BHQ1 | ||
| recQ | recQ-qF | ACGTTTCGACCAGGACAAGAA | 80bp |
| recQ-qR | CCACCAGTTGGTAAGACACCA | ||
| recQ-qP | 6-FAM-ATTAGCAAAGTATTAGACCATCG-BHQ1 |
Table 3.
Reproducibility analysis of double fluorescence quantitative PCR detection.
| Yang plasmid copy number/ (copies/μL) |
Intra-assay Ct values | Inter-assay Ct values | |||||
| average value | standard deviation | coefficient of variation/% | average value | standard deviation | coefficient of variation/% | ||
| isdA | 1.335×10⁸ | 24.55 | 0.325 | 1.32 | 24.62 | 0.330 | 1.34 |
| 1.335×10⁹ | 20.71 | 0.386 | 1.86 | 20.64 | 0.592 | 2.87 | |
| 1.335×10¹⁰ | 17.36 | 0.162 | 0.93 | 17.45 | 0.421 | 2.42 | |
| recQ | 7.265×10⁸ | 22.21 | 0.072 | 0.32 | 22.24 | 0.078 | 0.35 |
| 7.265×10⁹ | 18.62 | 0.232 | 1.24 | 18.66 | 0.290 | 1.55 | |
| 7.265×10¹⁰ | 15.08 | 0.220 | 1.46 | 15.10 | 0.428 | 2.83 | |
Disclaimer/Publisher’s Note: The statements, opinions and data contained in all publications are solely those of the individual author(s) and contributor(s) and not of MDPI and/or the editor(s). MDPI and/or the editor(s) disclaim responsibility for any injury to people or property resulting from any ideas, methods, instructions or products referred to in the content. |
© 2025 by the authors. Licensee MDPI, Basel, Switzerland. This article is an open access article distributed under the terms and conditions of the Creative Commons Attribution (CC BY) license (http://creativecommons.org/licenses/by/4.0/).
Copyright: This open access article is published under a Creative Commons CC BY 4.0 license, which permit the free download, distribution, and reuse, provided that the author and preprint are cited in any reuse.


