
Submitted:
03 September 2025
Posted:
03 September 2025
You are already at the latest version
Abstract
Infections of the skin, hair, and nails are frequently caused by dermatophytes, fungi that metabolize keratin, and present as tinea corporis, tinea capitis, tinea pedis, tinea ungui-um, and related conditions. In immunocompetent patients these infections are typically superficial, limited to the epidermis, but may still trigger immune reactions of variable severity. Diagnosis currently relies on culture, which is time-consuming, requiring up to four weeks and skilled microscopy. The Euroarray Dermatomycosis, a PCR-based biochip assay targeting 56 fungal species, offers a markedly shorter turnaround time of 48 hours. We conducted an analytical validation study assessing sensitivity, specificity, accuracy, reproducibility, limit of detection, and linearity. Hair, nail, and skin specimens from healthy donors were spiked with genomic DNA from dermatophytes and yeasts includ-ing Trichophyton, Microsporum, Epidermophyton, Fusarium, Candida, Scopulariopsis, and Nannizzia; plasmids were used for linearity and detection limit testing. The assay demonstrated high sensitivity (91.7–100%) and specificity (100%) across species, repro-ducibility ranging from 88.9–100%, and limits of detection as low as 10–100 copies/ml depending on specimen type and organism, with excellent linearity (R² 0.9677–0.9987). In conclusion, Euroarray Dermatomycosis shows strong analytical performance and has the potential to significantly improve accuracy, reliability, and speed of fungal diagnosis. Furthermore, adopting molecular techniques for dermatophyte detection may facilitate future exploration of resistance mechanisms in fungi, providing earlier insights into emerging antifungal resistance patterns and supporting the development of targeted therapies.
Keywords:
dermatophytes
; array technology
; diagnosis
; dermatophytosis
; tinea corporis
; tinea capitis
; tinea cruris
; tinea pedis
1. Introduction
Dermatophytes are a group of fungi that hydrolyze keratin, and therefore can infect keratinized structures such as skin, hair, and nails, causing dermatophytoses. In immunocompetent hosts, these infections are generally restricted to the epidermis, yet they may still elicit immune responses of varying severity (1). Major forms include tinea corporis (body, excluding feet, groin, face, scalp, or beard hair), tinea pedis (feet), tinea cruris (groin and upper thighs), tinea faciei (face), and tinea manuum (hands) [2]. Tinea capitis and tinea barbae affect scalp and beard hair, respectively, while tinea unguium (onychomycosis) is the most common nail infection [2]. Although superficial, dermatophytoses require careful clinical and laboratory evaluation. Diagnosis depends on clinical presentation, which varies by infection type. For instance, tinea pedis often presents as pruritic erosions between toes or a “moccasin” distribution on feet, while tinea cruris typically appears as erythematous lesions on the inner thigh. Because patients may harbor multiple infections simultaneously, thorough examination of skin, hair, and nails is essential [2].
Dermatophytes are classified into three main genera: Epidermophyton, Microsporum, and Trichophyton [3]. Their prevalence varies worldwide [4], with higher burdens in warm climates. For example, >70% of children in northern Brazil with dermatophytosis present with tinea capitis [5], while tinea pedis affects over 50% of adults in parts of Europe. Tinea cruris is more common in adults, whereas other types often predominate in children [6]. Globally, 10–15% of the population is expected to experience a dermatophyte infection. Females are more commonly affected, with peak incidence between ages 51–60 [4]. Onychomycosis shows a prevalence of 14% in the United States [7] and 8% in Canada [8].
Traditional diagnosis relies on culture and phenotypic identification. Methods include assessing colony morphology, pigmentation, texture, growth rate, microscopic features, temperature tolerance, and biochemical reactions [9,10]. Culture requires 3–4 weeks of incubation and is prone to contamination and external variability [9,10,11]. This process is time-consuming and demands specialized expertise, potentially delaying reliable identification and treatment [12]. Diagnosis is further complicated in immunocompromised patients, whose presentations may deviate from typical patterns [15]. Recent molecular advances have introduced new approaches, with PCR demonstrating high sensitivity and reproducibility compared to morphology-based methods [11,13].
PCR can generate characteristic DNA polymorphisms using repetitive sequences and gel banding patterns [10,14]. The GACA sequence has proven useful for dermatophyte identification [14], while the chitin synthase 1 [CHS1] gene of Microsporum canis has also shown strong diagnostic potential (13,16). Although PCR improves turnaround time, sensitivity, and specificity, designing primers for each species remains challenging. Multiplex PCR, which amplifies multiple DNA targets simultaneously, enables detection of several organisms from one sample [11]. When combined with microarray technology, this allows identification of numerous dermatophytes within hours. After PCR amplification, microarray hybridization provides a comprehensive profile of detected species [12]. This study will evaluate the clinical application of combined PCR and microarray techniques for the rapid identification of dermatophytoses.
This work highlights how molecular platforms like PCR and microarray, beyond enabling rapid dermatophyte identification, can also be adapted for the detection of antifungal resistance genes. Incorporating resistance gene markers into diagnostic panels would allow earlier recognition of mutations that compromise therapy, ensuring more accurate treatment decisions. Such integration positions dermatophyte testing as a model for broader fungal diagnostics, where simultaneous detection of pathogens and resistance determinants is essential for addressing emerging antifungal resistance.
2. Results
A PCR and microarray-based diagnostic test was evaluated for dermatophyte detection in nail, skin, and hair samples. Each specimen type was tested with dermatophytes typically pathogenic to that source. For nail samples (Table 1), eight dermatophyte species were assessed, and all showed 100% correct detection except for Fusarium oxysporum, which demonstrated only 33.3% accuracy. The overall sensitivity across all species was 96.0%, and 100% when the outlier species was excluded. Skin samples were tested for ten different species; six were detected with 100% accuracy, Trichophyton mentagrophytes quinkeanum at 96.0%, T. mentagrophytes interdigitale and T. equinum at 91.3%, and T. concentricum at only 30.8%. Overall sensitivity for skin was 94.3%, increasing to 97.9% when T. concentricum was excluded. Hair samples were tested for five species; three had 100% detection, T. violaceum had 96.0%, and M. audouinii had 85.7%, giving an overall sensitivity of 96.0%.
Certain species tested should be categorized as yeasts or molds rather than dermatophytes. To test specificity, each sample type was analyzed for classification as either dermatophyte or yeast/mold (Table 2). In nail samples (Table 2A), 15 species were identified as dermatophytes and five as yeasts/molds (Candida spp., F. oxysporum, and S. brevicaulis), with 100% correct detection in both categories. Hair samples (Table 2B) and skin samples (Table 2C) showed similar results, with all dermatophytes and all yeasts/molds detected with 100% specificity.
Reproducibility was assessed for each species (Table 3). Nail organisms showed 100% reproducibility except F. oxysporum. In skin, six species were 100% reproducible, T. mentagrophytes quinkeanum was 88.9%, T. equinum and T. mentagrophytes interdigitale were 77.8%, and T. concentricum showed 0%. In hair, three species were 100% reproducible, while T. violaceum and M. audouinii were 88.9% and 66.7%, respectively.
For limit of detection testing, the lowest gDNA concentration detected was recorded. In nail samples (Table 4), all species had 100% detection at all concentrations except C. albicans and C. parapsilosis. C. albicans showed 33.3% detection at 1.00E+02 copies/µl and no detection at 1.00E+01, while C. parapsilosis showed 33.3% detection at 1.00E+01. In skin samples (Table 5), N. persicolor and T. interdigitale had 100% detection at all concentrations, whereas others showed partial or no detection at lower concentrations, with T. concentricum showing 0% across all. In hair (Table 6), all species except M. canis had 100% detection. M. canis was detected at 75.0% in the highest concentration, 50% in the next, and 0% at lower levels. T. violaceum and M. audouinii were detectable across all concentrations but demonstrated 0 average intensity.
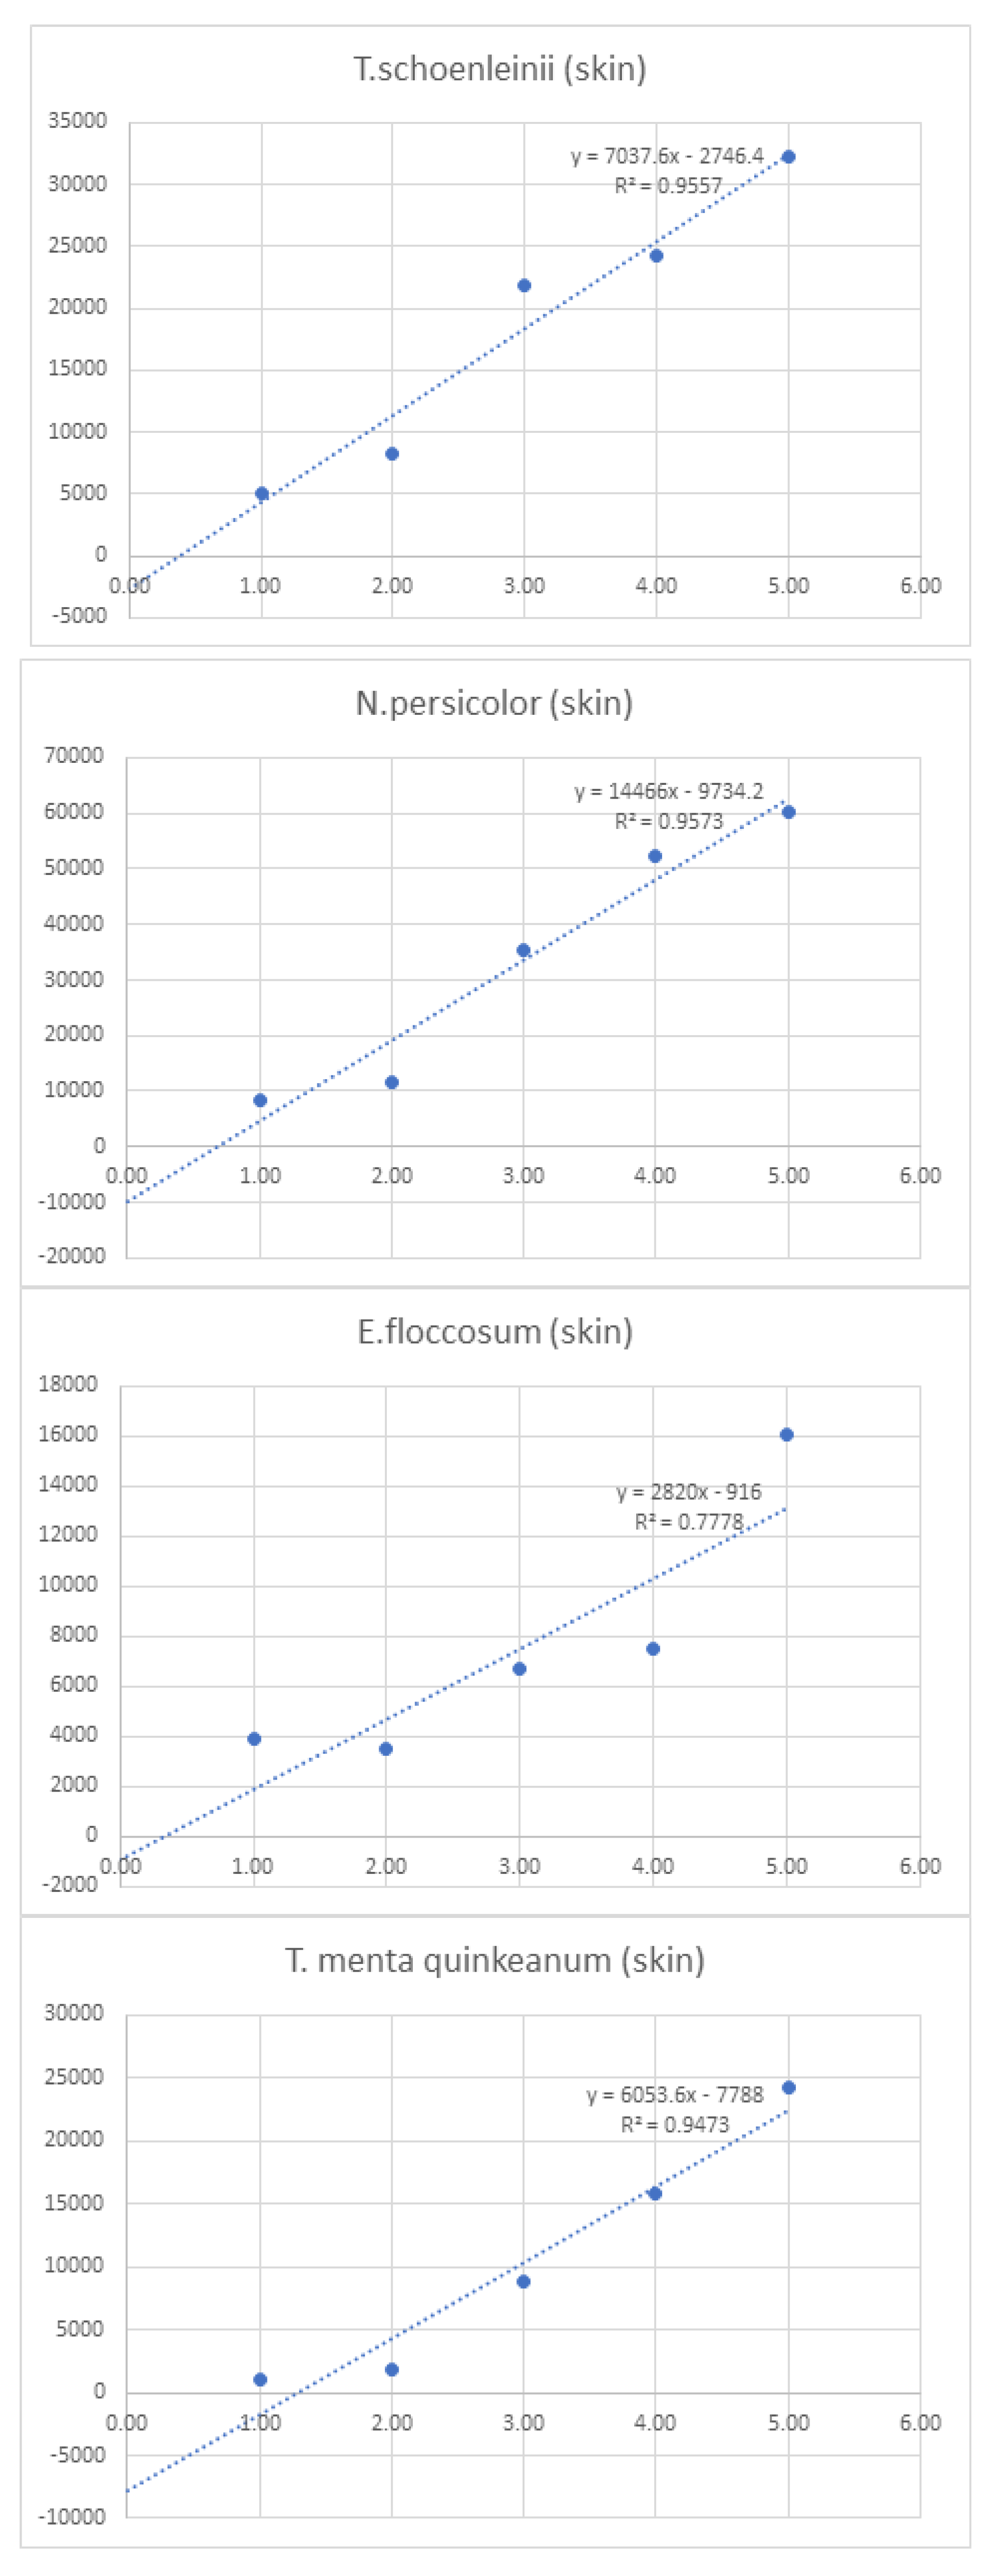
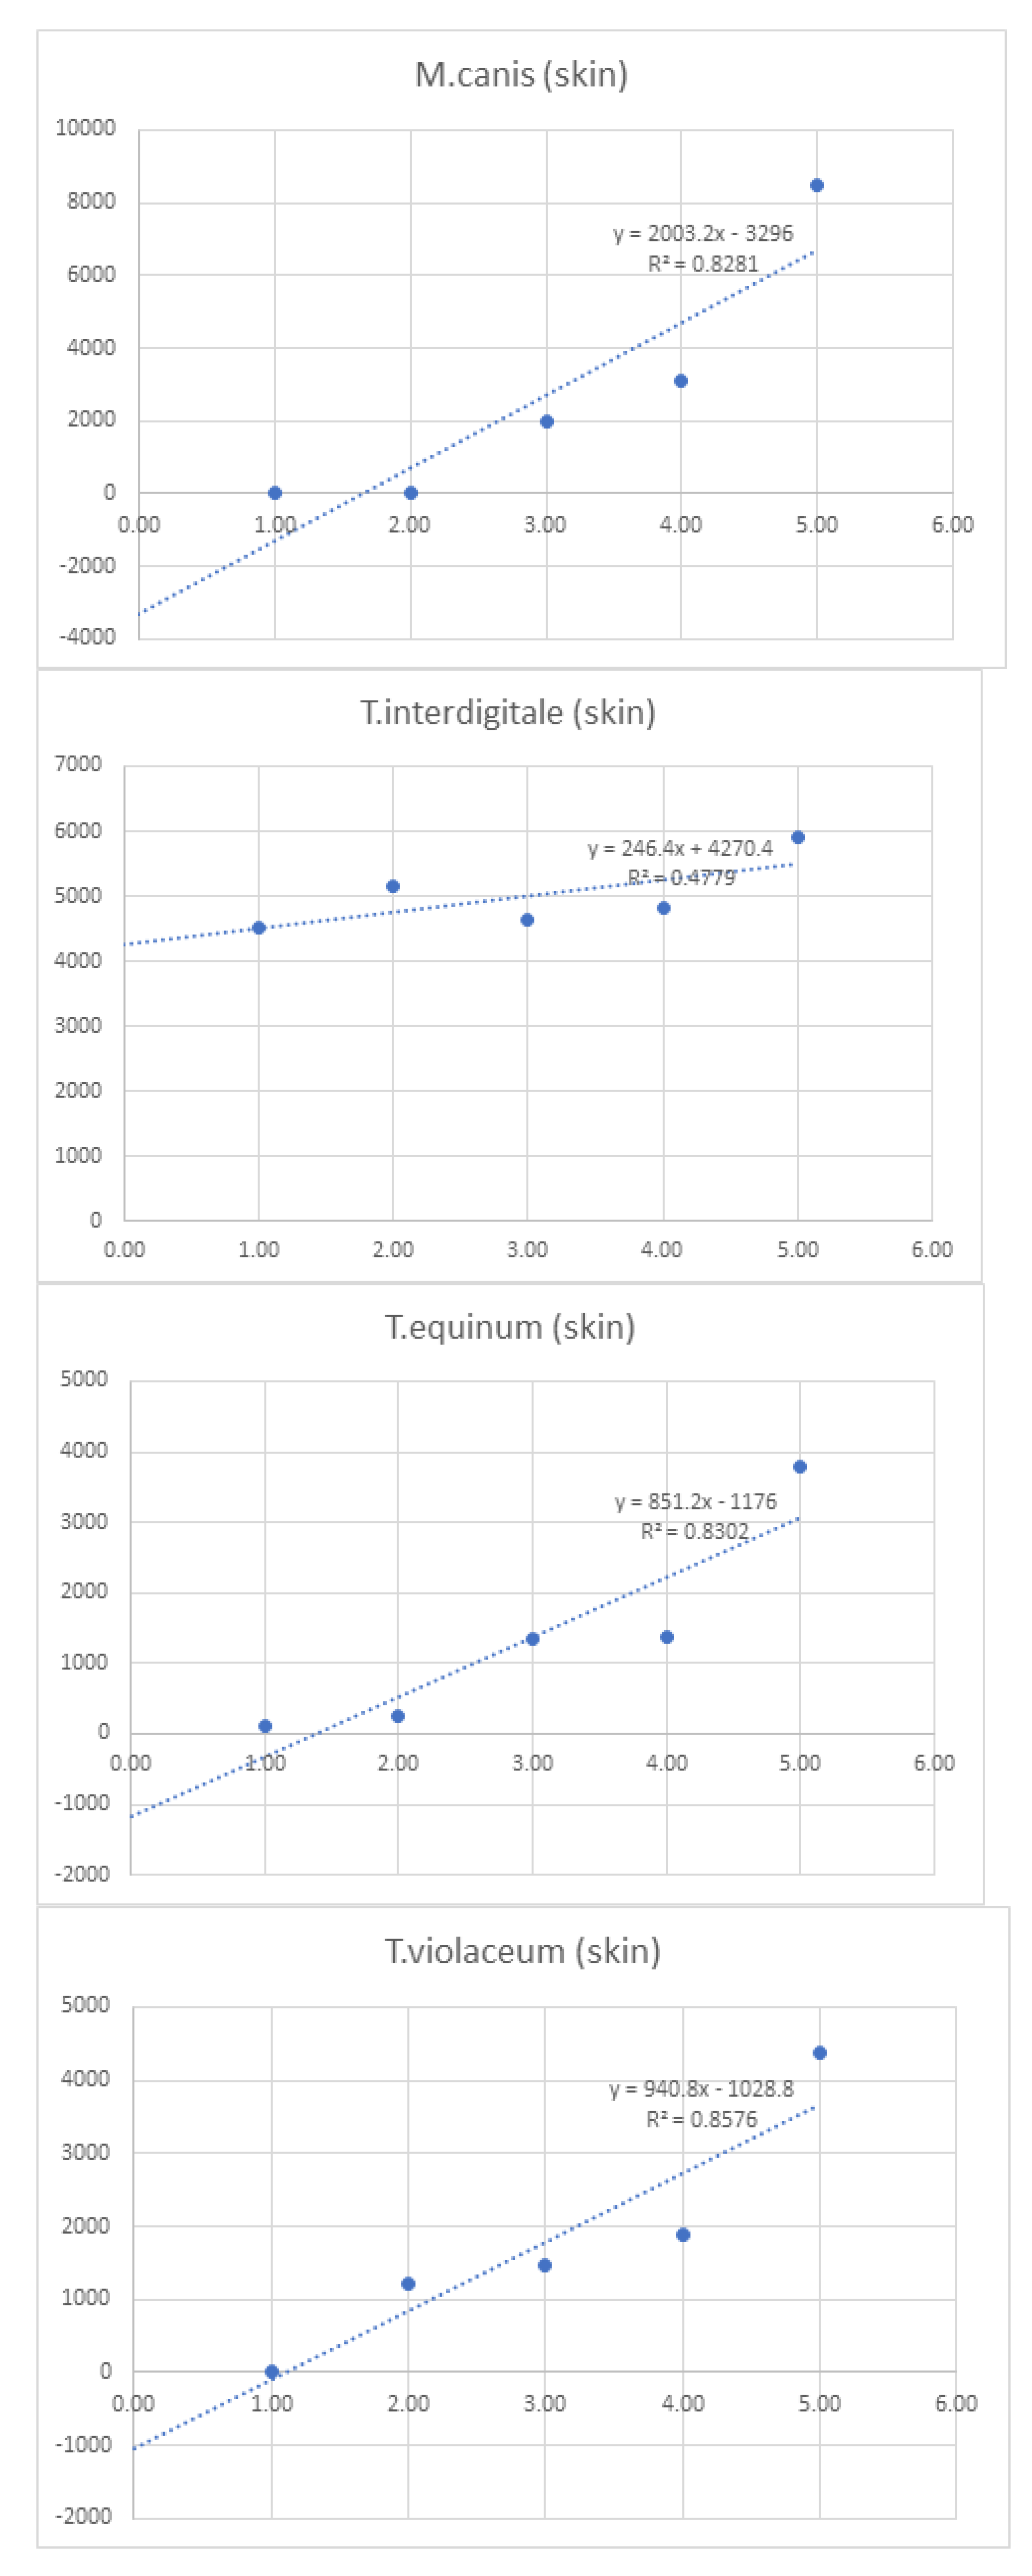
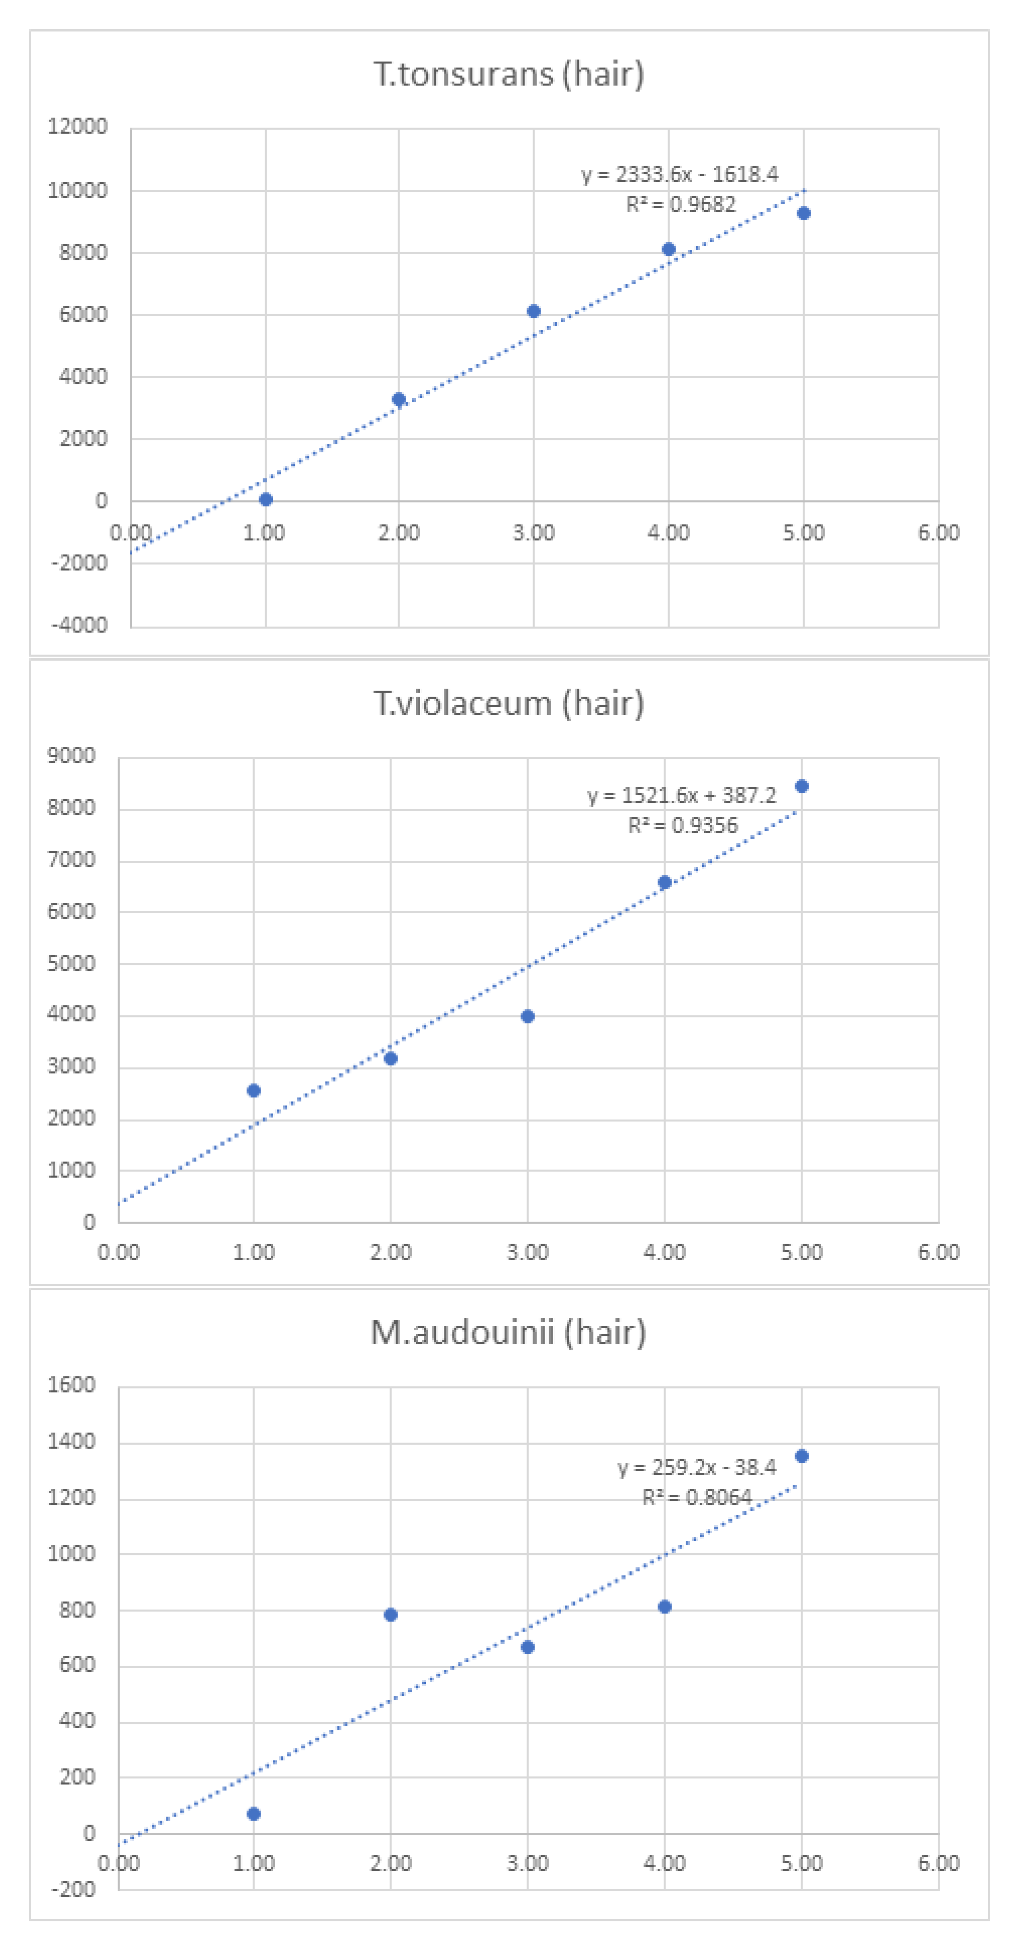
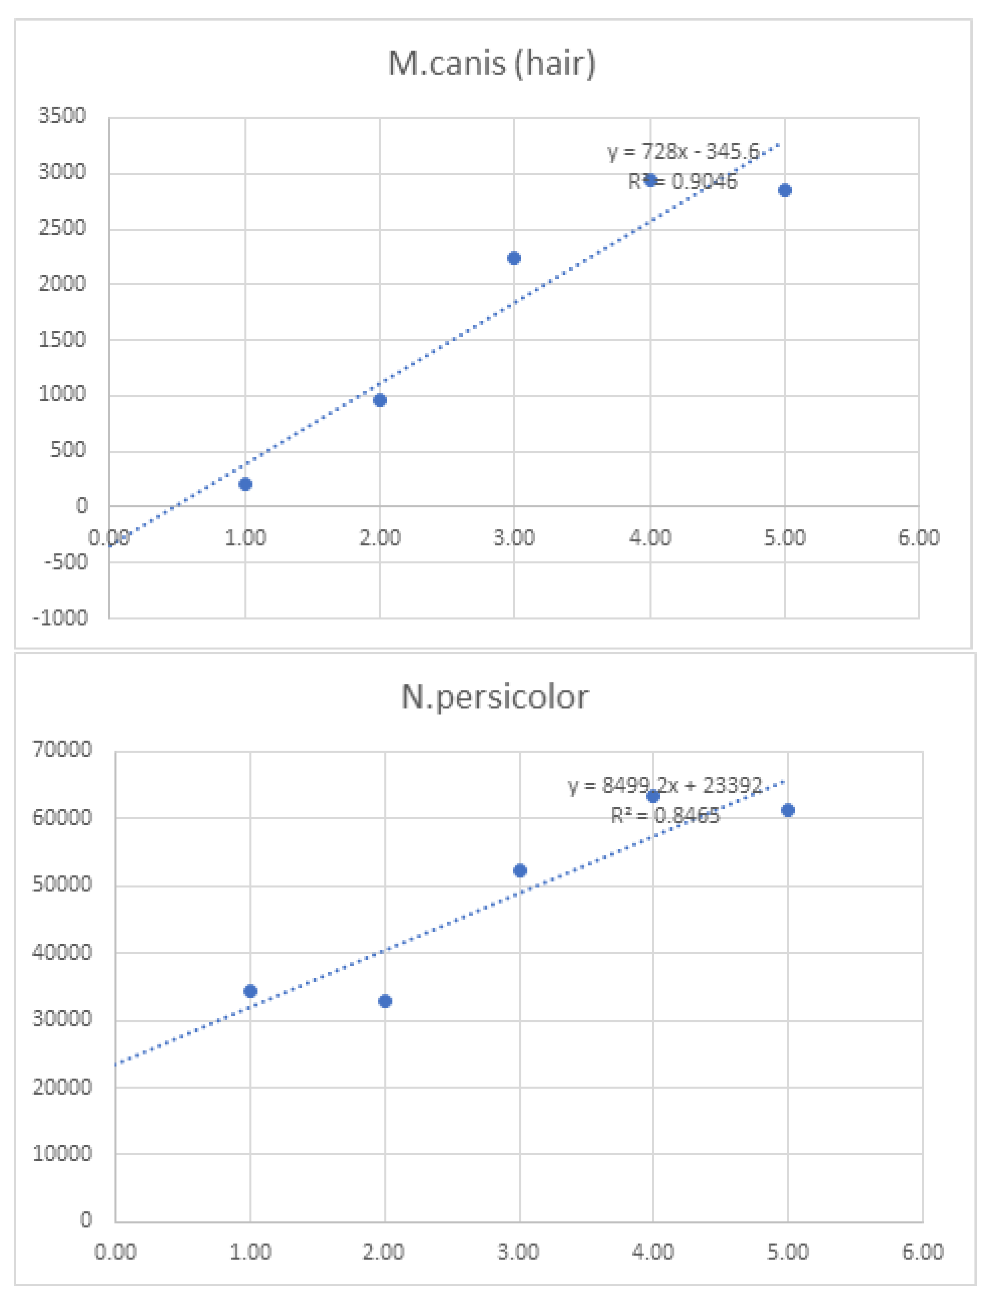
Linearity was assessed by comparing average signal intensities across concentration levels (Table 7). Graphs and R² values were generated for each species, with R² serving as the measure of linearity. For example, T. interdigitale in nail samples (Figure 1) demonstrated 97.9% linearity.
2.2. Figures, Tables and Schemes

Table 1.
Accuracy of detection of tested dermatophytes in nail, skin, and hair samples.
| Accuracy Dermatophyte detection in Nail samples | Accuracy Dermatophyte detection in Skin samples | Accuracy Dermatophyte detection in Hair samples | ||||
| Spike | Count of Correct | Percent of Correct | Count of Correct | Percent of Correct | Count of Correct | Percent of Correct |
| T. interdigitale | 27 | 100.0% | 27 | 100% | - | - |
| T. rubrum | 27 | 100.0% | - | - | - | - |
| C.albicans | 27 | 100.0% | - | - | - | - |
| C.parapsilosis | 27 | 100.0% | - | - | - | - |
| C.guillermondii | 27 | 100.0% | - | - | - | - |
| E.floccosum | 27 | 100.0% | 27 | 100% | - | - |
| S.brevicaulis | 27 | 100.0% | - | - | - | - |
| T.menta inter | - | - | 21 | 91.3% | - | - |
| T.equinum | - | - | 21 | 91.3% | - | - |
| T.violaceum | - | - | 27 | 100.0% | 24 | 96.0% |
| T. menta quinkeanum | - | - | 24 | 96.0% | - | - |
| M.canis | - | - | 27 | 100.0% | 18 | 100.0% |
| N.persicolor | - | - | 27 | 100.0% | 9 | 100.0% |
| T.schoenleinii | - | - | 27 | 100.0% | - | - |
| T.tonsurans | - | - | - | - | 27 | 100.0% |
| M.audouinii | - | - | - | - | 18 | 85.7% |
| Sensitivity | 189 | 100% | 228 | 97.9% | 96 | 96.3% |
Table 2.
Detection of organisms as either dermatophytes or yeast/mold in nail (A), hair (B.), and skin (C) samples. Y/M indicates yeast and mold, other than those that are also considered dermatophytes.
Table 2.
Detection of organisms as either dermatophytes or yeast/mold in nail (A), hair (B.), and skin (C) samples. Y/M indicates yeast and mold, other than those that are also considered dermatophytes.
| Sample Name | Hair | |||
| Expected | Detected with Dermatophytes | |||
| Not detetced with Y/M | ||||
| Accuracy UDA/YM detection in Nail, Hair, Skin samples | ||||
| Detected Derm, Not detected YM | Not delected Derm, Detected YM | |||
| Spike | Count of detetced | % of Detected | Count of ND | % of Non detected |
| T. interdigitale | 54 | 100.0% | 0 | 0.0% |
| T. rubrum | 54 | 100.0% | 0 | 0.0% |
| C.albicans | 0 | 0.0% | 27 | 100.0% |
| C.parapsilosis | 0 | 0.0% | 27 | 100.0% |
| C.guillermondii | 0 | 0.0% | 27 | 100.0% |
| E.floccosum | 27 | 100.0% | 0 | 0.0% |
| F.oxisporum | 0 | 0.0% | 27 | 100.0% |
| S.brevicaulis | 0 | 0.0% | 27 | 100.0% |
| T.menta inter | 27 | 100.0% | 0 | 0.0% |
| T.concentricum | 27 | 100.0% | 0 | 0.0% |
| T.equinum | 27 | 100.0% | 0 | 0.0% |
| T.violaceum | 54 | 100.0% | 0 | 0.0% |
| E.floccosum | 27 | 100.0% | 0 | 0.0% |
| T. menta quinkeanum | 27 | 100.0% | 0 | 0.0% |
| M.canis | 54 | 100.0% | 0 | 0.0% |
| N.persicolor | 54 | 100.0% | 0 | 0.0% |
| T.schoenleinii | 27 | 100.0% | 0 | 0.0% |
| T.tonsurans | 27 | 100.0% | 0 | 0.0% |
| M.audouinii | 27 | 100.0% | 0 | 0.0% |
| N.persicolor | 27 | 100.0% | 0 | 0.0% |
| 540 | 100.0% | 135 | 100.0% | |
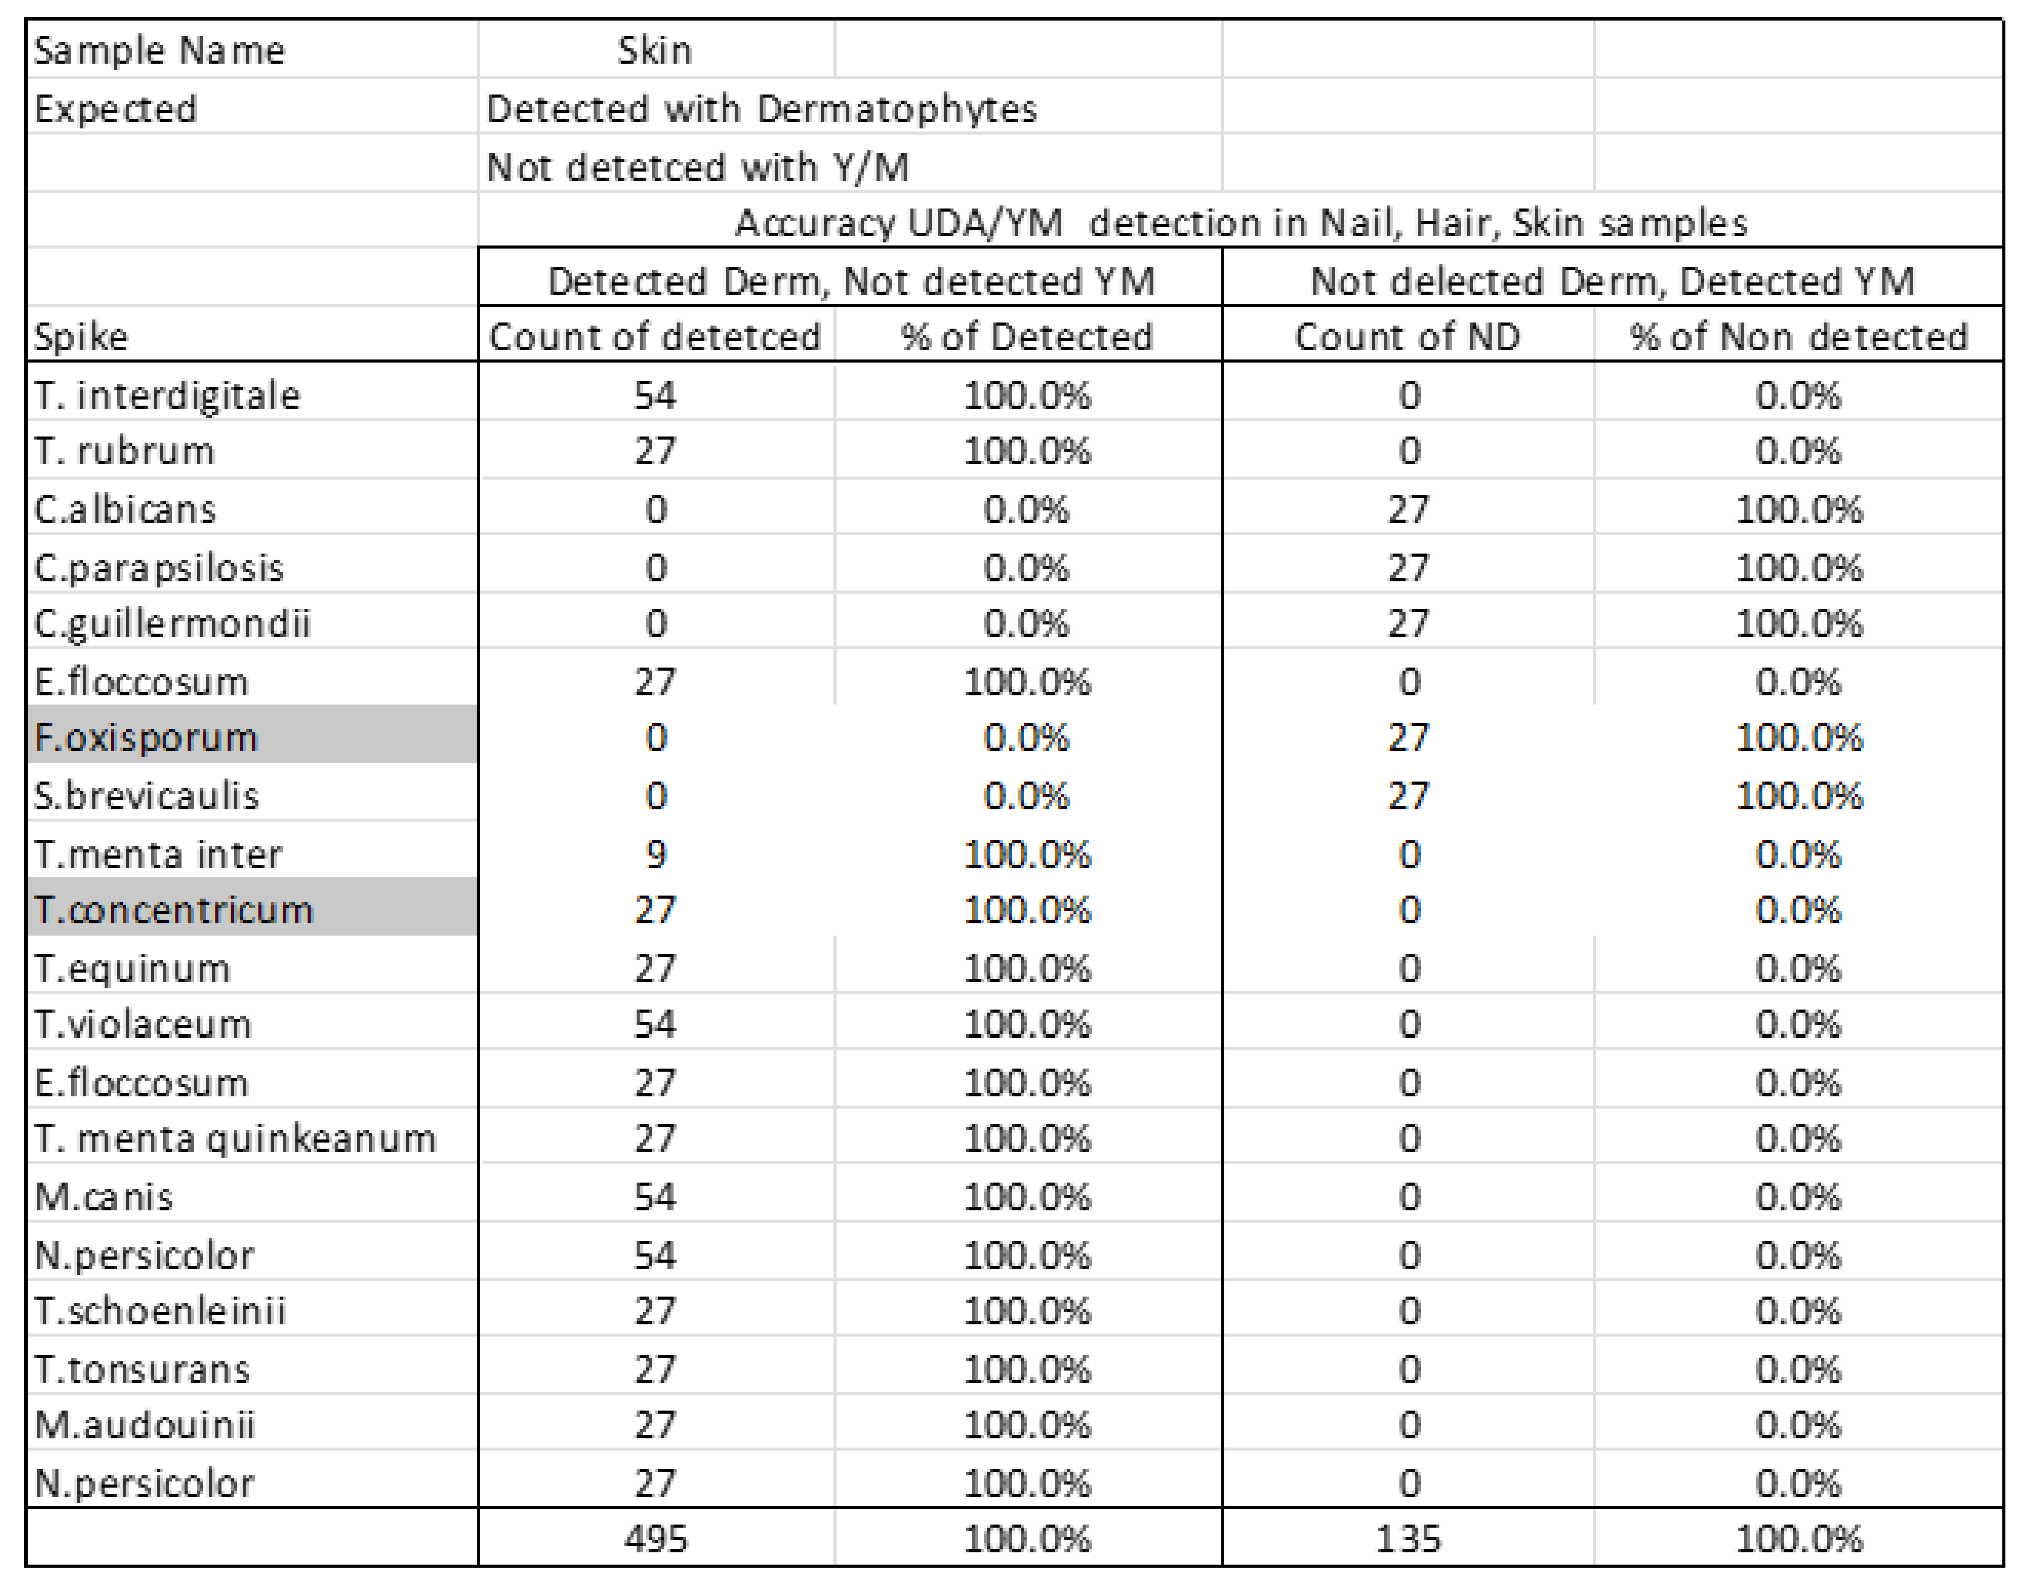
Table 3.
Reproducibility rates for the detection of different organisms in nail, skin, and hair samples. Total concordant refers to instances of no change and when the organisms were constantly detected. .
Table 3.
Reproducibility rates for the detection of different organisms in nail, skin, and hair samples. Total concordant refers to instances of no change and when the organisms were constantly detected. .
| Target Organism | Total Concordant | Total Discordant | Reproducibility | |
| Nail | T. interdigitale | 207 | 0 | 100.0% |
| T. rubrum | 207 | 0 | 100.0% | |
| C.albicans | 207 | 0 | 100.0% | |
| C.parapsilosis | 207 | 0 | 100.0% | |
| C.guillermondii | 207 | 0 | 100.0% | |
| E.floccosum | 207 | 0 | 100.0% | |
| F.oxisporum | 23 | 184 | 11.1% | |
| S.brevicaulis | 207 | 0 | 100.0% | |
| Skin | T.interdigitale | 207 | 0 | 100.0% |
| T.menta inter | 161 | 46 | 77.8% | |
| T.concentricum | 0 | 207 | 0.0% | |
| T.equinum | 161 | 46 | 77.8% | |
| T.violaceum | 207 | 0 | 100.0% | |
| E.floccosum | 207 | 0 | 100.0% | |
| T. menta quinkeanum | 184 | 23 | 88.9% | |
| M.canis | 207 | 0 | 100.0% | |
| N.persicolor | 207 | 0 | 100.0% | |
| T.schoenleinii | 207 | 0 | 100.0% | |
| Hair | T.tonsurans | 207 | 0 | 100.0% |
| T.violaceum | 184 | 23 | 88.9% | |
| M.audouinii | 138 | 69 | 66.7% | |
| M.canis | 207 | 0 | 100.0% | |
| N.persicolor | 207 | 0 | 100.0% |
Table 4.
Detection levels at different concentrations of organisms in nail samples. Units are copy per micrometer (cp/mcl). When there is a detection, the light given off is quantified as average intensity. Higher means good detection, and is directly related to higher amount of copies .
Table 4.
Detection levels at different concentrations of organisms in nail samples. Units are copy per micrometer (cp/mcl). When there is a detection, the light given off is quantified as average intensity. Higher means good detection, and is directly related to higher amount of copies .
| LOD Dermatophyte detection in Nail samples | ||||||||||
| 1,000 | 750 | 100 | 10 | 1 | 1,000 | 750 | 100 | 10 | ||
| 1.00E+03 | 7.50E+02 | 1.00E+02 | 1.00E+01 | 1.00E+00 | Average Intensity |
1.00E+03 | 7.50E+02 | 1.00E+02 | 1.00E+01 | |
| Spike | Count of Detected | Percent of Detected | ||||||||
| T. interdigitale | 3 | 3 | 3 | 3 | 3 | 9,482 | 100.0% | 100.0% | 100.0% | 100.0% |
| T. rubrum | 3 | 3 | 3 | 3 | 3 | 57,330 | 100.0% | 100.0% | 100.0% | 100.0% |
| C.albicans | 3 | 3 | 1 | 0 | 0 | 3,690 | 100.0% | 100.0% | 33.3% | 0.0% |
| C.parapsilosis | 3 | 3 | 3 | 1 | 1 | 48,884 | 100.0% | 100.0% | 100.0% | 33.3% |
| C.guillermondii | 3 | 3 | 3 | 3 | 3 | 14,915 | 100.0% | 100.0% | 100.0% | 100.0% |
| E.floccosum | 3 | 3 | 3 | 3 | 3 | 29,880 | 100.0% | 100.0% | 100.0% | 100.0% |
| F.oxisporum | 3 | 3 | 3 | 3 | 3 | 6,471 | 100.0% | 100.0% | 100.0% | 100.0% |
| S.brevicaulis | 3 | 3 | 3 | 3 | 3 | 28,481 | 100.0% | 100.0% | 100.0% | 100.0% |
| Universal Dermatophyte | 3 | 3 | 3 | 3 | 3 | 100.0% | 100.0% | 100.0% | 100.0% | |
Table 5.
Detection levels at different concentrations of organisms in skin samples. Units are copy per micrometer. .
Table 5.
Detection levels at different concentrations of organisms in skin samples. Units are copy per micrometer. .
| LOD Dermatophyte detection in Skin samples | ||||||||||
| 1,000 | 750 | 100 | 10 | 1 | 1,000 | 750 | 100 | 10 | ||
| 1.00E+03 | 7.50E+02 | 1.00E+02 | 1.00E+01 | 1.00E+00 | Average Intensity |
1.00E+03 | 7.50E+02 | 1.00E+02 | 1.00E+01 | |
| Spike | Count of Detected | Percent of Detected | ||||||||
| T.interdigitale | 4 | 4 | 4 | 4 | 2 | 5,010 | 100.0% | 100.0% | 100.0% | 100.0% |
| T.menta inter | 1 | 1 | 1 | 1 | 1 | 0 | 25.0% | 25.0% | 25.0% | 25.0% |
| T.concentricum | 0 | 0 | 0 | 0 | 0 | 0 | 0.0% | 0.0% | 0.0% | 0.0% |
| T.equinum | 2 | 1 | 0 | 0 | 0 | 1,378 | 50.0% | 25.0% | 0.0% | 0.0% |
| T.violaceum | 4 | 4 | 3 | 0 | 0 | 1,794 | 100.0% | 100.0% | 75.0% | 0.0% |
| E.floccosum | 4 | 4 | 4 | 3 | 3 | 7,544 | 100.0% | 100.0% | 100.0% | 75.0% |
| T. menta quinkeanum | 4 | 4 | 4 | 1 | 0 | 10,373 | 100.0% | 100.0% | 100.0% | 25.0% |
| M.canis | 3 | 2 | 2 | 2 | 0 | 2,714 | 75.0% | 50.0% | 50.0% | 50.0% |
| N.persicolor | 4 | 4 | 4 | 4 | 4 | 33,662 | 100.0% | 100.0% | 100.0% | 100.0% |
| T.schoenleinii | 4 | 4 | 4 | 3 | 0 | 18,366 | 100.0% | 100.0% | 100.0% | 75.0% |
| Universal Dermatophyte | 4 | 4 | 4 | 4 | 4 | 100.0% | 100.0% | 100.0% | 100.0% | |
Table 6.
Detection levels at different concentrations of organisms in skin samples. Units are copy per micrometer. .
Table 6.
Detection levels at different concentrations of organisms in skin samples. Units are copy per micrometer. .
| LOD Dermatophyte detection in Hair samples | ||||||||||
| 1,000 | 750 | 100 | 10 | 1 | 1,000 | 750 | 100 | 10 | ||
| 1.00E+03 | 7.50E+02 | 1.00E+02 | 1.00E+01 | 1.00E+00 | Average Intensity |
1.00E+03 | 7.50E+02 | 1.00E+02 | 1.00E+01 | |
| Spike | Count of Detected | Percent of Detected | ||||||||
| T.tonsurans | 4 | 4 | 4 | 4 | 0 | 5,010 | 100.0% | 100.0% | 100.0% | 100.0% |
| T.violaceum | 4 | 4 | 4 | 4 | 2 | 0 | 100.0% | 100.0% | 100.0% | 100.0% |
| M.audouinii | 4 | 4 | 4 | 4 | 0 | 0 | 100.0% | 100.0% | 100.0% | 100.0% |
| M.canis | 3 | 2 | 0 | 0 | 0 | 1,378 | 75.0% | 50.0% | 0.0% | 0.0% |
| N.persicolor | 4 | 4 | 4 | 4 | 4 | 1,794 | 100.0% | 100.0% | 100.0% | 100.0% |
| Universal Dermatophyte | 4 | 4 | 4 | 4 | 4 | 100.0% | 100.0% | 100.0% | 100.0% | |
Table 7.
Linearity measurements for organism detected at different concentrations in nail, skin, and hair samples .
Table 7.
Linearity measurements for organism detected at different concentrations in nail, skin, and hair samples .
| Linearity | |||||||||
| 1 | 10 | 100 | 750 | 1,000 | 10,000 | ||||
| Log10 Concentration | 0.00 | 1.00 | 2.00 | 3.00 | 4.00 | 5.00 | Sum | ||
| Mean of Intensity | Nail | T. interdigitale (nail) | - | 3988 | 7383.75 | 9200 | 12804 | 14032 | 47,407.8 |
| T. rubrum (nail) | - | 42030 | 54028 | 59848 | 64319 | 66423 | 286,648.0 | ||
| C.albicans (nail) | - | 2096 | 3184 | 3876 | 4628 | 4668 | 18,452.0 | ||
| C.parapsilosis (nail) | - | 19520 | 38668 | 55579.75 | 64255 | 66399 | 244,421.8 | ||
| C.guillermondii (nail) | - | 3308 | 7600 | 17052 | 22216 | 24400 | 74,576.0 | ||
| E.floccosum (nail) | - | 9272 | 18776 | 29388 | 35512 | 56450 | 149,398.0 | ||
| F.oxisporum (nail) | - | 2136 | 2508 | 6084 | 9716 | 11912 | 32,356.0 | ||
| S.brevicaulis (nail) | - | 6048 | 16340 | 26732 | 44676 | 48608 | 142,404.0 | ||
| Skin | T.interdigitale (skin) | - | 4512 | 5160 | 4648 | 4808 | 5920 | 25,048.0 | |
| T.menta inter (skin) | - | 0 | 0 | 0 | 0 | 0 | 0.0 | ||
| T.concentricum (skin) | - | 0 | 0 | 0 | 0 | 0 | 0.0 | ||
| T.equinum (skin) | - | 104 | 248 | 1360 | 1384 | 3792 | 6,888.0 | ||
| T.violaceum (skin) | - | 16 | 1216 | 1464 | 1888 | 4384 | 8,968.0 | ||
| E.floccosum (skin) | - | 3944 | 3536 | 6672 | 7512 | 16056 | 37,720.0 | ||
| T. menta quinkeanum (skin) | - | 1080 | 1776 | 8848 | 15848 | 24312 | 51,864.0 | ||
| M.canis (skin) | - | 8 | 0 | 1976 | 3120 | 8464 | 13,568.0 | ||
| N.persicolor (skin) | - | 8344 | 11768 | 35520 | 52248 | 60431.5 | 168,311.5 | ||
| T.schoenleinii (skin) | - | 5104 | 8304 | 21824 | 24312 | 32288 | 91,832.0 | ||
| Hair | T.tonsurans (hair) | - | 56 | 3280 | 6160 | 8104 | 9312 | 26,912.0 | |
| T.violaceum (hair) | - | 2544 | 3184 | 4000 | 6576 | 8456 | 24,760.0 | ||
| M.audouinii (hair) | - | 72 | 784 | 672 | 816 | 1352 | 3,696.0 | ||
| M.canis (hair) | - | 200 | 960 | 2240 | 2944 | 2848 | 9,192.0 | ||
| N.persicolor (hair) | - | 17128 | 16448 | 26168 | 31760 | 30720 | 122,224.0 | ||
Figure 1.
Graphs of linearity for organisms detected in nail samples.
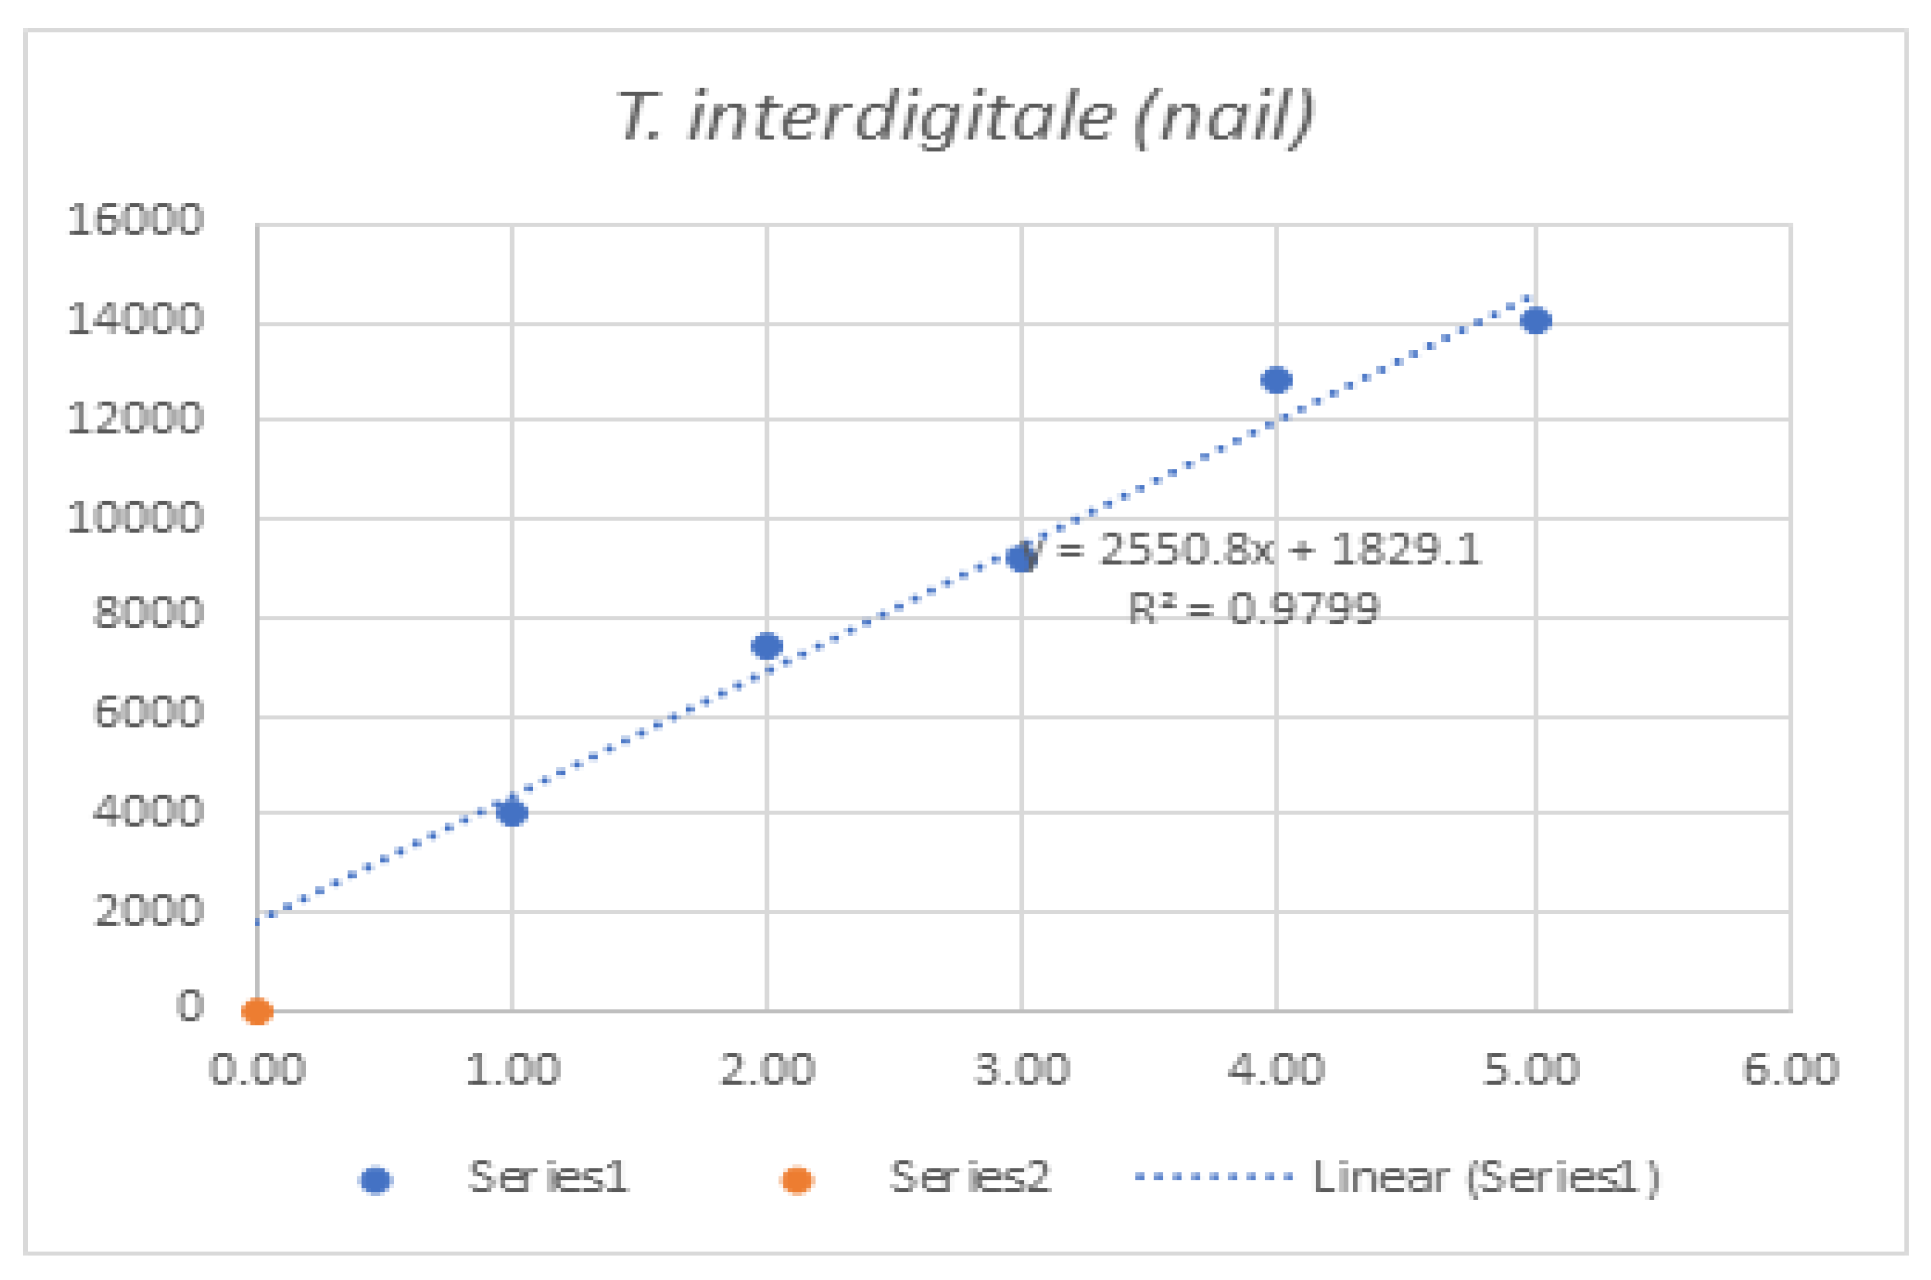
Figure 2.
Graphs of linearity for organisms detected in skin samples .
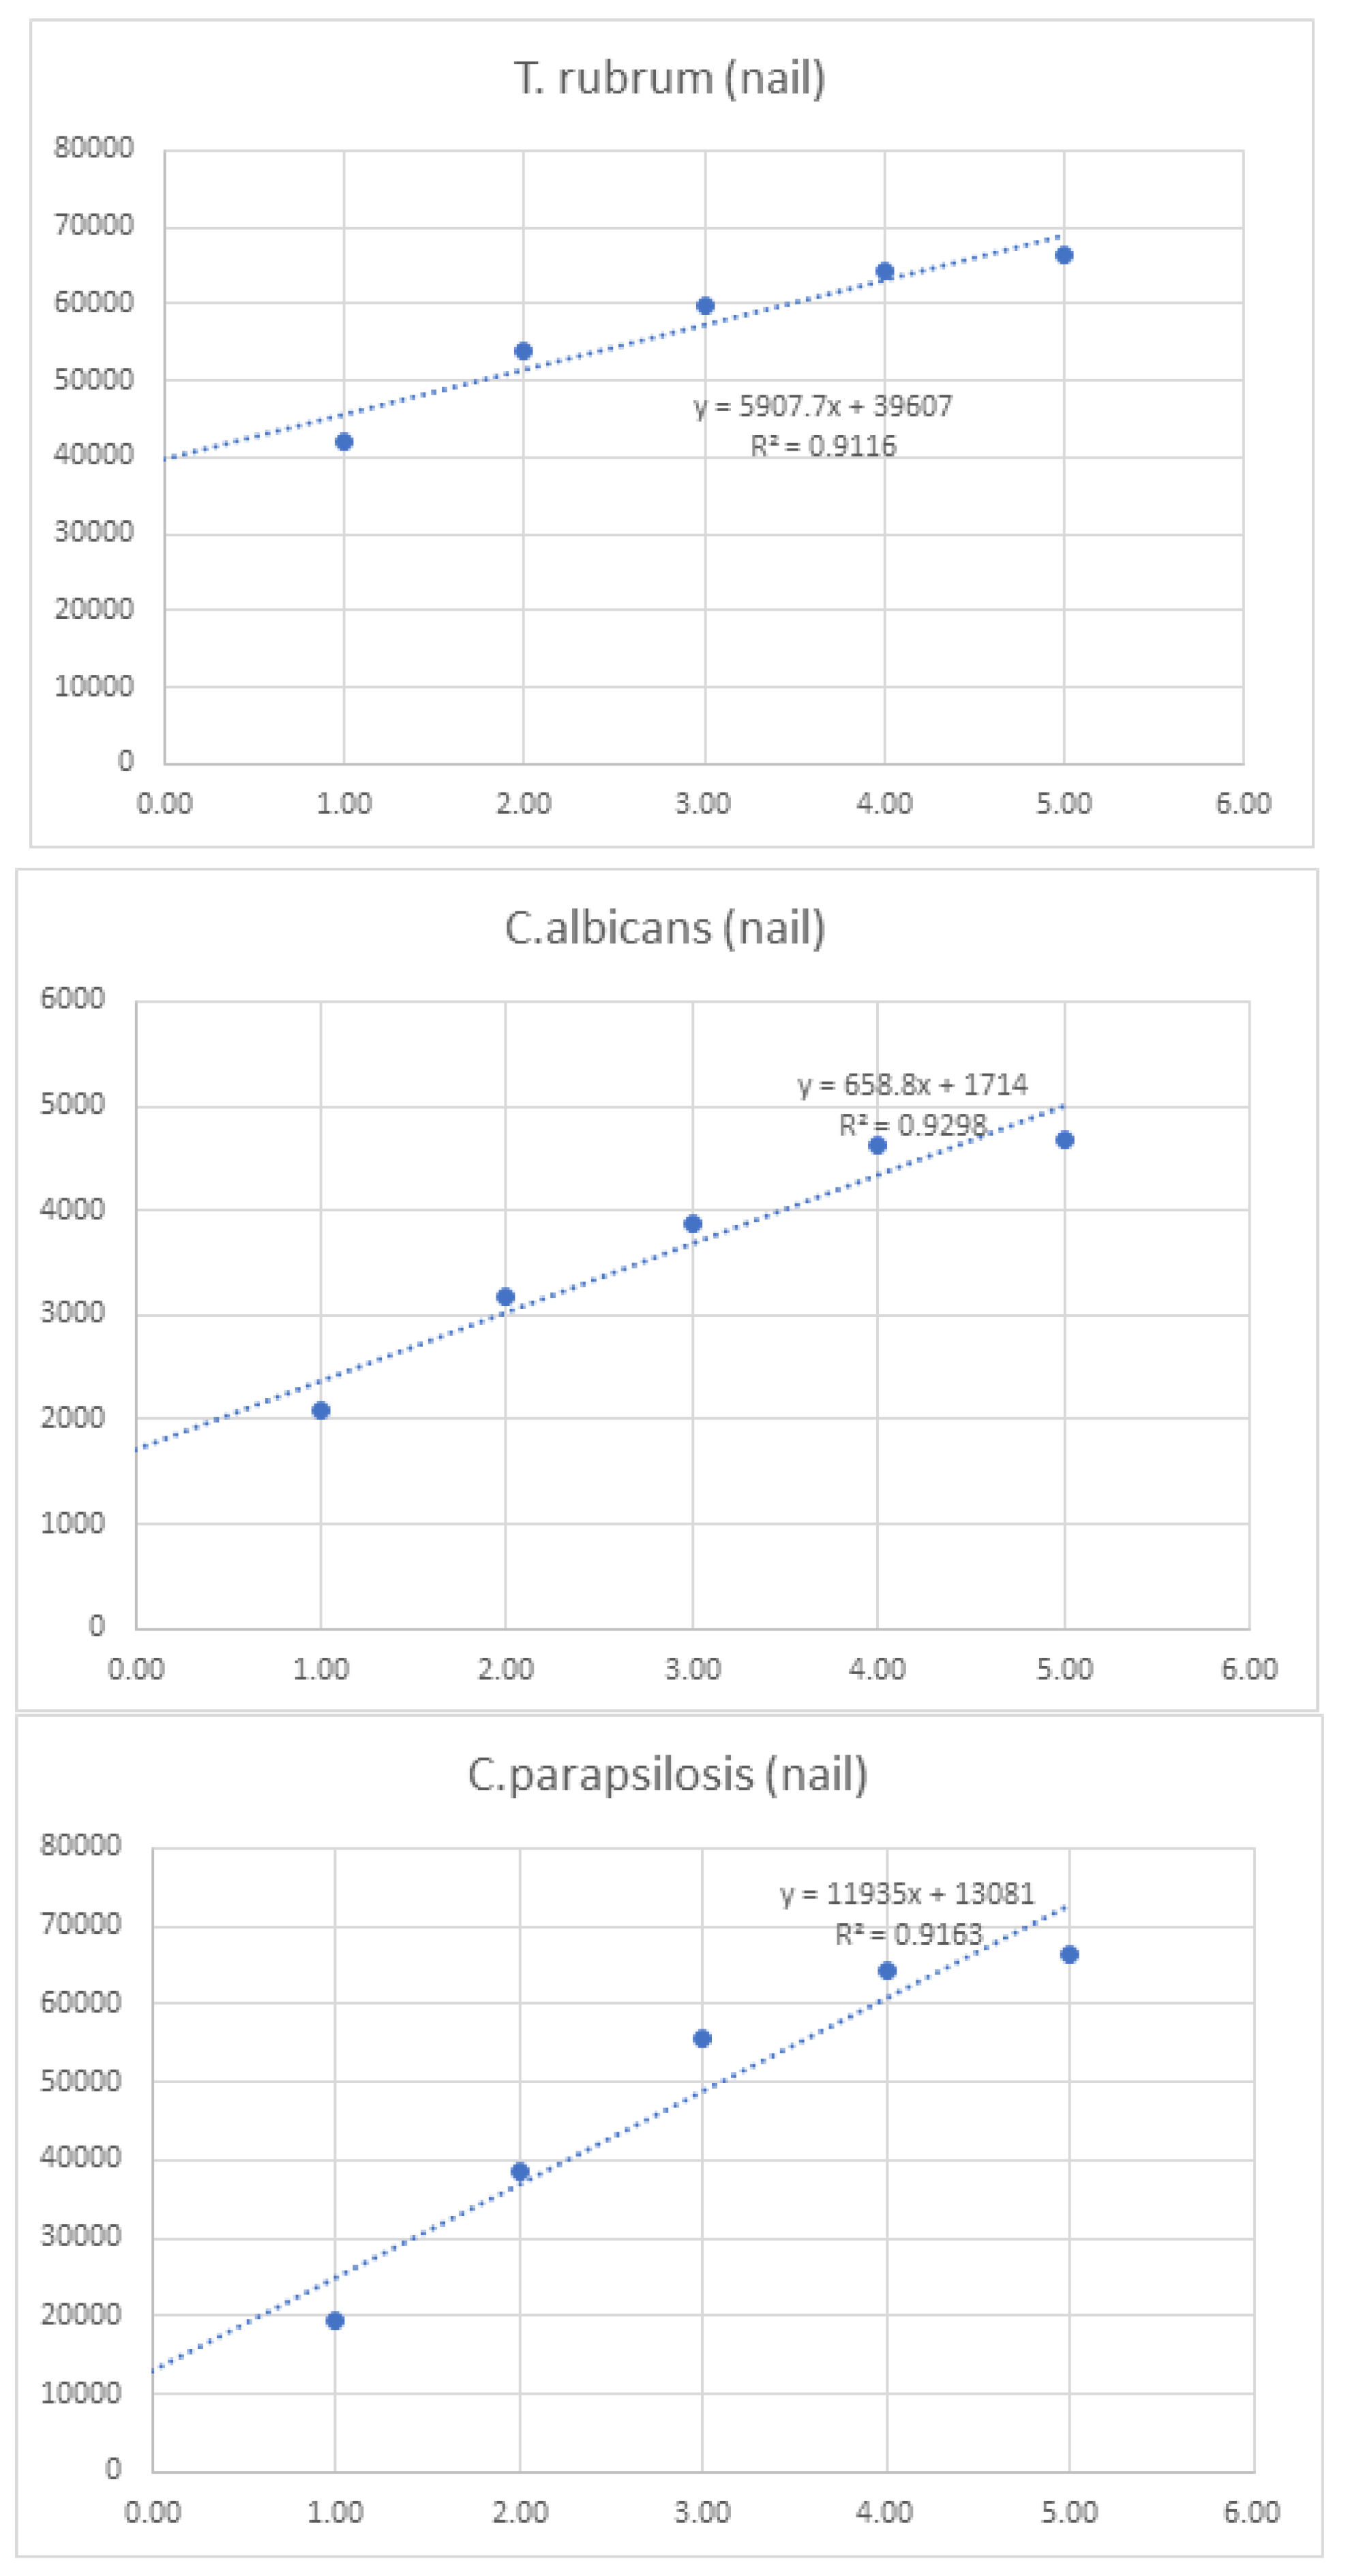
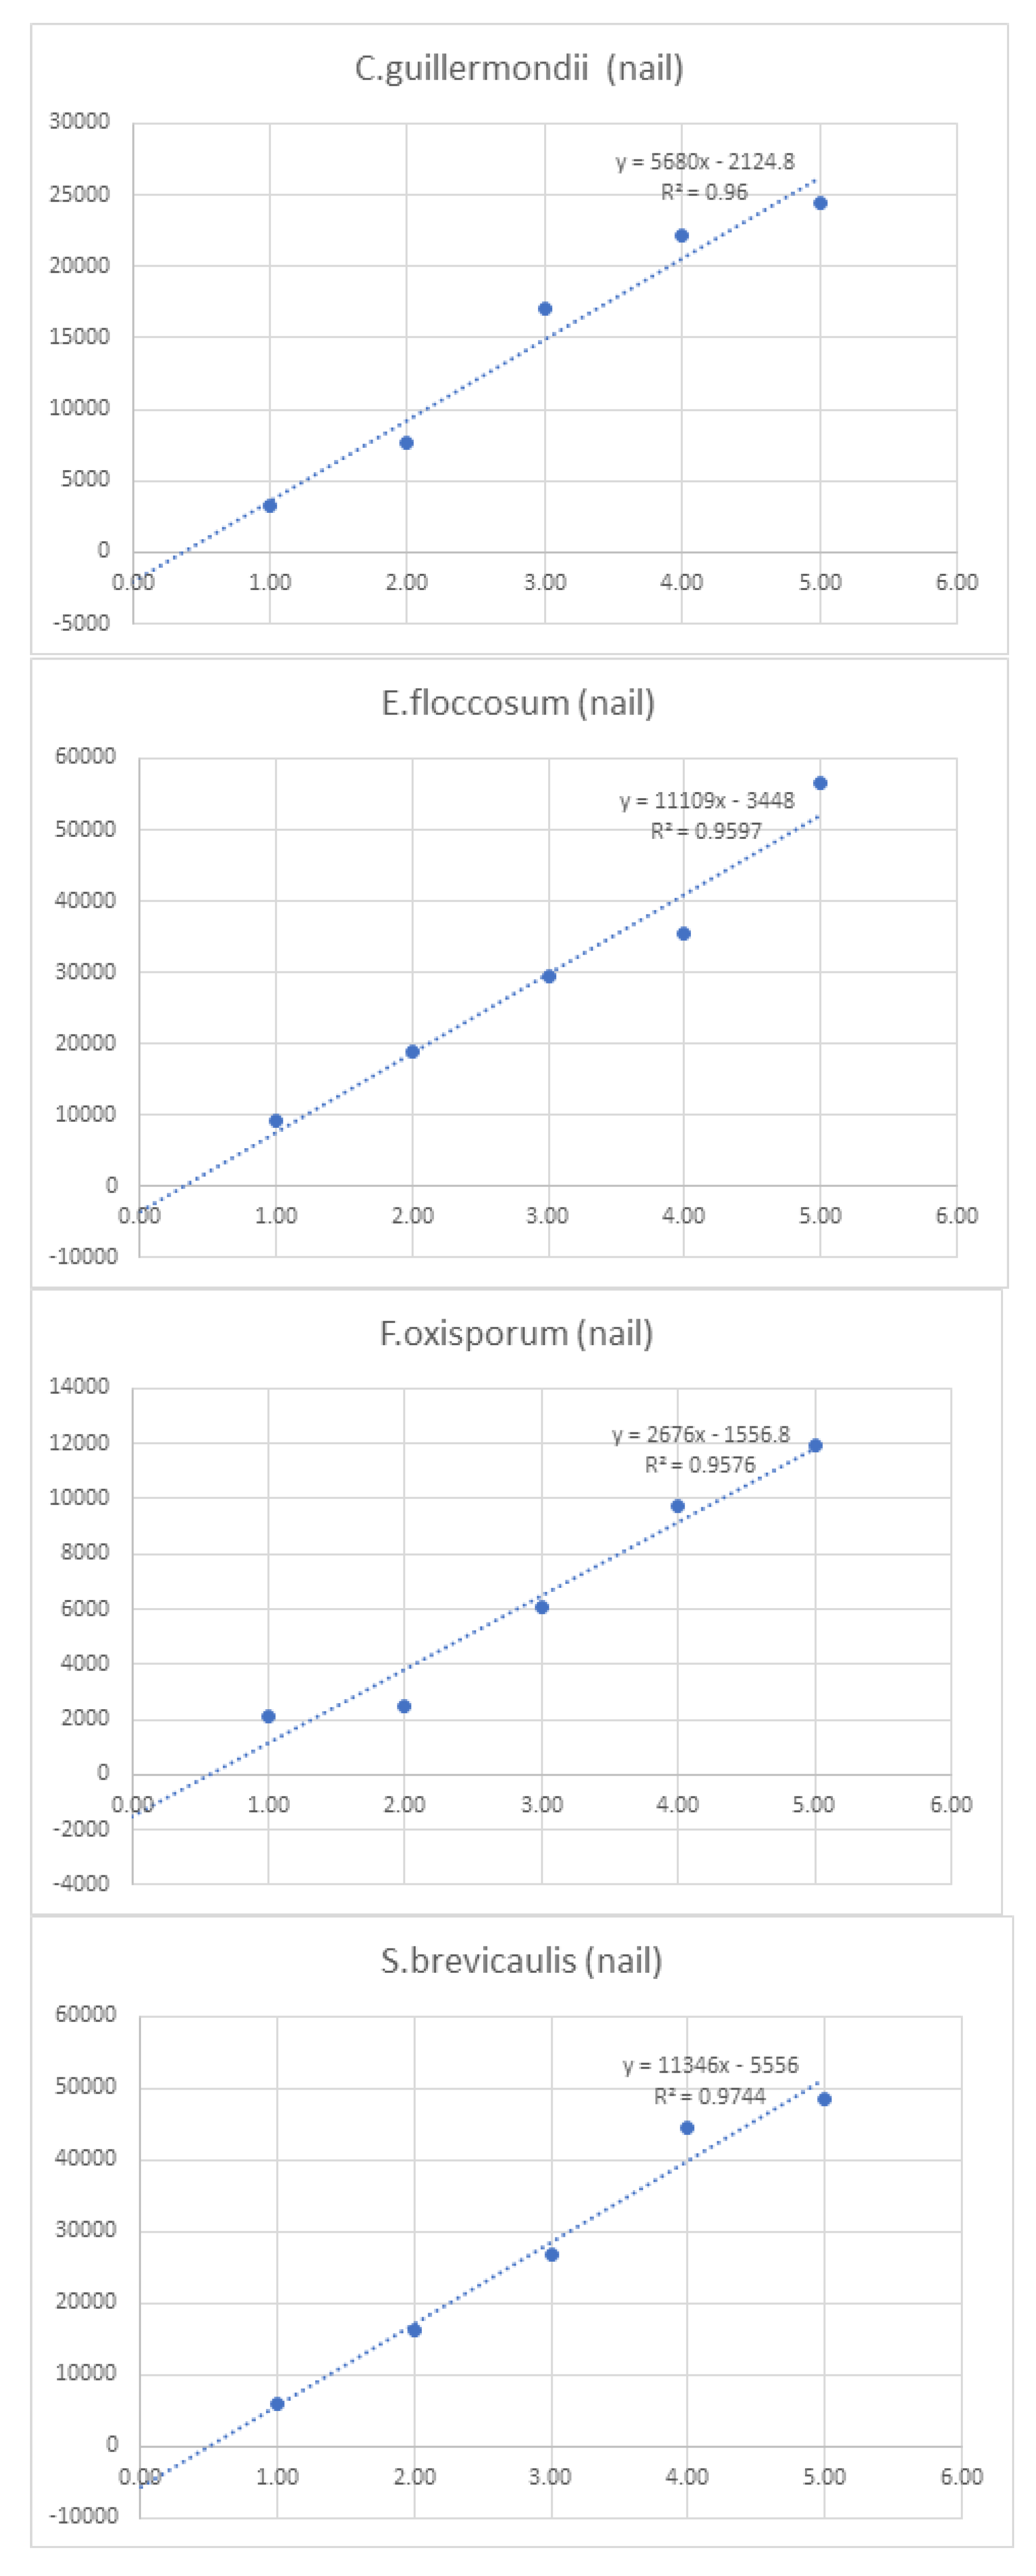
Figure 3.
Graphs of linearity for organisms detected in hair samples .
3. Discussion
Conventional dermatophyte detection methods include direct microscopic examination and culture. Direct microscopy with potassium hydroxide (KOH) is rapid but has limited sensitivity (17). The current gold standard remains culture on species-specific media, which can take up to 4 weeks (18). Periodic acid-Schiff (PAS) staining provides high sensitivity for histological detection but cannot precisely identify the pathogen [19]
The validation results presented here confirm the high sensitivity and specificity of the Euroarray Dermatomycosis PCR-based assay. Compared to culture, it provides accurate species-level identification of dermatophytes and other fungi within 48 hours. Faster turnaround facilitates timelier initiation of targeted therapy, which improves outcomes and helps prevent further spread of infection. The assay consistently achieved sensitivities above 94% across sample types, and 100% when outliers (Fusarium oxysporum in nails, T. concentricum in skin) were excluded. These outliers likely reflect limitations in probe hybridization or strain-specific genomic variability.
Specificity was strong, with reliable discrimination between dermatophytes and non-dermatophyte yeasts or molds, a critical advantage in mixed infections or atypical presentations. This ability reduces the risk of inappropriate antifungal use, contributing to antimicrobial stewardship. Reproducibility was high overall, though F. oxysporum in nails and T. concentricum in skin highlighted areas requiring probe refinement. Limit of detection testing confirmed assay reliability for low-burden infections, particularly in nail and hair samples, though probe optimization is needed for some skin species. Linearity was excellent for nails and hair (R² >0.90), with greater variability in skin specimens, suggesting further optimization.
The clinical importance of this work extends to antifungal resistance. Rising terbinafine resistance in T. rubrum, T. mentagrophytes, and T. indotineae is driven by mutations in the squalene epoxidase (SQLE) gene [20], while efflux pump overexpression and ergosterol alterations confer resistance to azoles [21]. Although the Euroarray does not yet target resistance markers, its molecular design and demonstrated performance provide a foundation for integrating resistance genotyping. Expanding probe sets to include known resistance mutations would enable early recognition of resistant strains, real-time monitoring of therapeutic effectiveness, and more precise tailoring of antifungal regimens.
In summary, this study demonstrates that the Euroarray Dermatomycosis assay is a highly sensitive, specific, and time-efficient diagnostic platform. With further integration of resistance detection, this technology has the potential to become a comprehensive clinical tool for both accurate dermatophyte identification and surveillance of antifungal resistance mechanisms.
4. Materials and Methods
4.1. Sample Collection and DNA Extraction
Clinical materials consisted of hair stubs, nail clippings, and skin scales collected under sterile conditions to minimize contamination. Non-viable cells such as crusts were also acceptable for testing. Samples were disinfected prior to collection. DNA extraction was performed using the EUROArray SwiftX-traction kit following the manufacturer’s instructions. In some runs, automated extraction was performed on the EUROArray Workstation to ensure consistency and reproducibility.
4.2. PCR Amplification
Extracted DNA was subjected to multiplex PCR with pre-formulated, ready-to-use reagents supplied by EUROIMMUN. This step amplified pathogen-specific gene segments while simultaneously incorporating fluorescent labels. Internal amplification controls were included in each reaction to verify the success of PCR and to rule out inhibition.
4.3. Microarray Hybridization and Detection
Amplified products were hybridized to the EUROArray Dermatomycosis BIOCHIP, a glass microarray slide with immobilized oligonucleotide probes specific to dermatophytes and common non-dermatophyte fungi. Hybridization was performed at 55 °C under controlled conditions. Slides were then washed to remove unbound DNA and scanned using the EUROArrayScanner.
4.4. Data Analysis
Fluorescent signals from hybridized probes were automatically analyzed using EUROArrayScan software. Results were interpreted against internal positive and negative controls, with each probe corresponding to a specific fungal species. Reports were automatically generated and archived for traceability.
4.5. gDNA
gDNA for all the tested fungi were provided by Euroimmune- Germany
5. Conclusions
In conclusion, the Euroarray Dermatomycosis PCR-based assay showed high sensitivity, specificity, and reproducibility for the detection of dermatophytes and related fungi in nail, skin, and hair samples, while reducing turnaround time significantly compared to conventional culture. A few species such as Fusarium oxysporum and T. concentricum demonstrated lower performance, but overall the validation confirmed the strength and reliability of this molecular approach. By allowing rapid and accurate species identification, this technique provides clear advantages in supporting timely clinical management, reducing diagnostic uncertainty, and preventing inappropriate antifungal use. Furthermore, the molecular design of the assay creates an opportunity to integrate resistance genotyping in the future, enabling early recognition of antifungal resistance mechanisms and supporting more precise treatment strategies against emerging resistant strains.
Author Contributions
Conceptualization, Z.D.; methodology, Z.D. and S.C.; validation, Z.D. and S.C.; resources, A.D. and S.C.; data curation, Z.D. and S.C.; writing—original draft preparation, S.C. and A.D.; writing—review and editing,Z.D., S.C., and A.D.; visualization,S.C. and A.D.; supervision, Z.D.; project administration, Z.D.; funding acquisition, Z.D. All authors have read and agreed to the published version of the manuscript.”.
Funding
“This research received no external funding”.
Conflicts of Interest
“The authors declare no conflicts of interest.”.
References
- Weitzman, I., & Summerbell, R. C. (1995). The dermatophytes. Clinical microbiology reviews, 8(2), 240-259.
- Goldstein, A. O., & Goldstein, B. G. (2017). Dermatophyte (tinea) infections. Walthman, MA: UpToDate.
- Li, H. C., Bouchara, J. P., Hsu, M. M. L., Barton, R., Su, S., & Chang, T. C. (2008). Identification of dermatophytes by sequence analysis of the rRNA gene internal transcribed spacer regions. Journal of medical microbiology, 57(5), 592-600. [CrossRef]
- Pires, C. A. A., Cruz, N. F. S. D., Lobato, A. M., Sousa, P. O. D., Carneiro, F. R. O., & Mendes, A. M. D. (2014). Clinical, epidemiological, and therapeutic profile of dermatophytosis. Anais brasileiros de dermatologia, 89, 259-264. [CrossRef]
- Cortez, A. C. A., de Souza, J. V. B., Sadahiro, A., & de Oliveira, J. A. A. (2012). Frequency and aetiology of dermatophytosis in children age 12 and under in the state of Amazonas, Brazil. Revista iberoamericana de micologia, 29(4), 223-226.
- Microsporum, T. (2004). Ringworm, Tinea.
- Ghannoum, M. A., Hajjeh, R. A., Scher, R., Konnikov, N., Gupta, A. K., Summerbell, R., ... & Elewski, B. (2000). A large-scale North American study of fungal isolates from nails: the frequency of onychomycosis, fungal distribution, and antifungal susceptibility patterns. Journal of the American Academy of Dermatology, 43(4), 641-648. [CrossRef]
- Gupta, A. K., Jain, H. C., Lynde, C. W., MacDonald, P., Cooper, E. A., & Summerbell, R. C. (2000). Prevalence and epidemiology of onychomycosis in patients visiting physicians’ offices: a multicenter Canadian survey of 15,000 patients. Journal of the American Academy of Dermatology, 43(2), 244-248. [CrossRef]
- Liu, G., He, C., & Zhang, H. (2014). Identification and characterization of dermatophyte species and strains with PCR amplification. Experimental and therapeutic medicine, 8(2), 545-550. [CrossRef]
- Faggi, E., Pini, G., Campisi, E., Bertellini, C., Difonzo, E., & Mancianti, F. (2001). Application of PCR to distinguish common species of dermatophytes. Journal of clinical microbiology, 39(9), 3382-3385. [CrossRef]
- Kim, J. Y., Choe, Y. B., Ahn, K. J., & Lee, Y. W. (2011). Identification of dermatophytes using multiplex polymerase chain reaction. Annals of dermatology, 23(3), 304-312. [CrossRef]
- [EUROIMMUN Medizinische Labordiagnostika AG]. (2021, August 4). EUROArray Dermatomycosis: Multiplex PCR combined with a microarray [Video]. Youtube. https://www.youtube.com/watch?v=k5xoIuR7AgQ.
- Nasrin, S., Saeed, Z. B., Sina, M., & Sahar, N. (2017). Genotyping and molecular characterization of dermatophytes isolates collected from clinical samples. Archives of Pulmonology and Respiratory Care, 3(1), 052-057. [CrossRef]
- Shehata, A. S., Mukherjee, P. K., Aboulatta, H. N., El Akhras, A. I., Abbadi, S. H., & Ghannoum, M. A. (2008). Single-step PCR using (GACA) 4 primer: utility for rapid identification of dermatophyte species and strains. Journal of clinical microbiology, 46(8), 2641-2645. [CrossRef]
- Garg, J., Tilak, R., Garg, A., Prakash, P., Gulati, A. K., & Nath, G. (2009). Rapid detection of dermatophytes from skin and hair. BMC research notes, 2, 1-6. [CrossRef]
- Kano, R., Hirai, A., Muramatsu, M., Watari, T., & Hasegawa, A. (2003). Direct detection of dermatophytes in skin samples based on sequences of the chitin synthase 1 (CHS1) gene. Journal of veterinary medical science, 65(2), 267-270. [CrossRef]
- Robert, R., & Pihet, M. (2008). Conventional methods for the diagnosis of dermatophytosis. Mycopathologia, 166, 295-306. [CrossRef]
- Pihet, M., & Le Govic, Y. (2017). Reappraisal of conventional diagnosis for dermatophytes. Mycopathologia, 182(1), 169-180. [CrossRef]
- Nenoff, P., Krüger, C., Schaller, J., Ginter-Hanselmayer, G., Schulte-Beerbühl, R., & Tietz, H. J. (2014). Mycology–an update part 2: dermatomycoses: clinical picture and diagnostics. JDDG: Journal der Deutschen Dermatologischen Gesellschaft, 12(9), 749-777. [CrossRef]
- Lockhart, S. R., Smith, D. J., & Gold, J. A. (2023). Trichophyton indotineae and other terbinafine-resistant dermatophytes in North America. Journal of Clinical Microbiology, 61(12), e00903-23. [CrossRef]
- Gupta, A. K., Wang, T., Mann, A., Piguet, V., Chowdhary, A., & Bakotic, W. L. (2025). Mechanisms of resistance against allylamine and azole antifungals in Trichophyton: A renewed call for innovative molecular diagnostics in susceptibility testing. PLoS pathogens, 21(2), e1012913. [CrossRef]
Disclaimer/Publisher’s Note: The statements, opinions and data contained in all publications are solely those of the individual author(s) and contributor(s) and not of MDPI and/or the editor(s). MDPI and/or the editor(s) disclaim responsibility for any injury to people or property resulting from any ideas, methods, instructions or products referred to in the content. |
© 2025 by the authors. Licensee MDPI, Basel, Switzerland. This article is an open access article distributed under the terms and conditions of the Creative Commons Attribution (CC BY) license (http://creativecommons.org/licenses/by/4.0/).
Copyright: This open access article is published under a Creative Commons CC BY 4.0 license, which permit the free download, distribution, and reuse, provided that the author and preprint are cited in any reuse.


