Submitted:
15 July 2025
Posted:
16 July 2025
You are already at the latest version
Abstract
High-throughput chemical genomics uses phenotypic profiling of strain libraries under defined chemical and environmental conditions to identify gene functions. This approach enables the mapping of biological pathways and can potentially highlight drug targets. Chemical genomic datasets have been springboards for numerous hypothesis-driven research projects, with direct implications for antimicrobial resistance and clinical outcomes. High-throughput phenotypic profiles are valuable tools for enriching microbial sequence data with functional annotations and benefiting the broader scientific community. This work provides a step-by-step guide for conducting chemical genomics screens from start to finish.
Keywords:
chemical genomics
; high-throughput screening
; phenotypic profiling
; bacterial mutant libraries
; functional genomics
; antimicrobial resistance
; biofilm analysis
; image-based screening
; microbial fitness profiling
; systems microbiology
Introduction
The rapid expansion of sequenced microbial genomes over recent decades has transformed our understanding of microbial diversity but also highlighted a major gap: the challenge of assigning functional annotation to genes.
Chemical genomic screens provide a systematic approach to evaluate the phenotypic impact of chemical or environmental perturbations on single-gene mutant libraries. Using diverse phenotypes as measurable outputs, chemical genomics screens systematically map colony size as a proxy for fitness, colour uptake to quantify biofilm formation, and alterations in colony topology to assess biofilm morphology (Kritikos et al., 2017).
While individual observations can be analysed independently to establish a functional link between a specific condition and a corresponding genetic perturbation, the true utility of chemical genomic screens lies in their ability to generate phenotypic profiles. Hierarchical clustering of all phenotypic profiles constructs a genome-wide epistasis map, identifying similarity patterns and facilitating the functional grouping of genes and stress conditions (Doherty et al., 2023). Chemical genomic screens have led to many important biological discoveries which include but are not limited to Saccharomyces cerevisiae (Tong et al., 2001; Schuldiner et al., 2005), Acinetobacter baylyi (Gomez and Neyfakh 2006), Pseudomanas aeruginosa (Fajardo et al., 2008), Escherichia coli (Tamae et al., 2008; Typas et al., 2010; Nichols et al., 2011; Ezraty et al., 2013; Alodaini et al., 2024), Bacillus subtilis (Koo et al., 2017) and Salmonella enterica (Bobonis et al., 2022). However, there is currently no dedicated protocol that assists research groups in establishing their chemical genomic studies. This guide outlines a step-by-step workflow to help scientists establish chemical genomics screens.
Foreword
The protocol outlined in this paper serves as a comprehensive, step-by-step guide to conduct chemical genomic screens in bacteria on solid medium. The methodology presented is designed to be broadly applicable to all bacterial species with limited changes to the protocol ensuring high reproducibility. We have highlighted some species-specific observations based on our previous experiences (section 4.4) and addressed common troubleshooting challenges (section 4.1).
Content
- (1)
- Plate pouring (section 1.1). Consistency in plate pouring is essential for chemical genomic screens as it ensures uniform colony growth, accurate phenotypic observations, and reproducibility by providing consistent surface conditions and even distribution of stress conditions. Proper techniques also minimise contamination and variability, improving the reliability of screening results.
- (2)
- Source plate production (section 1.2). Source plates serve as templates, ensuring consistent and reproducible sample distribution. They enable high-throughput screening by allowing transfer of strains to condition plates, reducing contamination and variability while preserving genetic diversity.
- (3)
- Pre-testing (section 1.3). Pre-testing helps validate assay conditions, optimise protocols, and identify potential issues before large-scale screening. This reduces errors, ensures reproducibility, and improves the reliability of results by confirming that the screen functions as intended.
- (4)
- Screening methodology (section 2). This section describes the methodology used for stamping source plates to condition plates. It is designed specifically for the image analysis software, Iris (Kritikos et al., 2017). Additionally, the protocol includes guidance on biofilm-specific screens (section 4.3), a research area of growing importance given the role of biofilms in bacterial persistence and resistance.
- (5)
- Computational analysis (section 3). Iris (section 3.1) and phenotypic analysis software, ChemGAPP (section 3.2) (Doherty et al., 2023) to ensure that phenotypic data is accurately quantified and interpreted.
1. Pre-screening
1.1. Plate Pouring
Purpose
Plate quality affects the accuracy and reproducibility of the generated data. Plates need to be equally poured (without contamination) and dried to avoid introducing systematic pinning biases caused by agar bubbles, over-dried plates, wet plates, etc. Therefore, we recommend taking great care when pouring agar plates.
Materials
- VWR Single Well Plates (Cat no: 734-2977) or any other single-well plate.
-
Suitably sized stripette for drawing up media to correct volumes.
- o
- Alternatively, a suitably sized vessel can be used instead for directly pouring into plates.
- Glass bottles (autoclavable).
- Base growth medium appropriate for your bacterial species.
- Agar – to achieve 2% (w/v) plates.
- Distilled (type 2) water.
- The experimenter's choice of stress conditions e.g. antibiotics (section 1.3).
Method
- (1)
- Prepare Growth Media: Use 2% agar and ensure all components are fully dissolved and mixed with a magnetic stirrer. Adjust pH as needed (Plate Pouring Challenges and Solutions). Autoclave the media before use.
- (2)
- Add Stress Conditions: Add stresses once the agar reaches an appropriate temperature. Mix thoroughly to ensure even distribution.
- (3)
- Pour Plates Aseptically: Pour agar into pre-labelled plates using sterile technique (e.g., Bunsen burner or safety cabinet). Use a consistent volume suited to the plate type e.g., 40 mL for VWR one-well plates (~2/3 full) to reduce dehydration.
- (4)
- Dry Plates Before Use: Allow plates to fully solidify. Do not use immediately; instead, invert and dry at room temperature for 16 hours to remove excess moisture.
Plate Pouring Challenges and Tips
| Section 1.1 Plate Pouring Challenges and Solutions | ||
| Challenge | Issues | Solution |
| Plate Labelling | Plate naming inconsistency can impact the ease of tracking screening progress and labels on the bottom of plates can impact the image analysis. | Label all plates with a consistent system throughout the screen on the plate's side |
| Reducing Variation | Plate batch can have an impact on the observed colonies. | Plate batches should be recorded and accounted for in the results. |
| Consideration of Growth Medium Agar Temperature | Keeping the growth medium agar at room temperature for an extended period will make it begin to solidify unevenly, which results in clumps of agar forming in newly poured plates. | Place autoclaved agar immediately into a 55-65°c water bath or incubator. (Note that some condition additives may be temperature sensitive and may need to be added at a different temperature.) |
| Plate drying | Good plate drying can be time-consuming at room temperature. | The drying process can be sped up by drying plates under a steady flow of air within a laminar flow hood. Be mindful, as drying the plates out too much often introduces pinning artefacts. |
| Plate storage | Plates may dry out if not stored correctly when longer-term storage is required. | Plates can be stored safely in a fridge (4-8°C) for up to 4 weeks. However, this depends on the condition (e.g. some additives may precipitate at 4°C). |
| Setting plates | Biased plate surfaces will lead to inconsistencies in colony transfer during pinning. | Ensure the surface that you pour plates on is level. |
| Plate drying during incubation | Plates can dry out during incubation based on agar thickness and the organism on the plates growth time. | For faster-growing organisms, agar volumes of 40 mL are appropriate (if using VWR one-well plates). For slower-growing organisms, such as Mycobacterium bovis BCG, thicker plates are recommended (45-50 mL agar volumes) to prevent plates from completely drying during incubation. Incubators with humidity are also recommended for slower growing organisms to reduce the rate of evaporation. |
1.2. Source Plates
Purpose
Plates are split into:
- (1)
- Library plates: These plates are the original stocks of bacteria and are typically stored as liquid culture. Usually, for long-term storage of the bacteria they are mixed with glycerol or DMSO to act as cryoprotectant and stored at -80 °C.
- (2)
- Source plates: These plates contain growth medium that are either in solid or liquid format depending on the strains of interest. They are generated from liquid culture (library plates) and are the principal plates to be pinned/stamped out onto condition plates (solid or liquid plates).
In chemical genomics screens, source plates are replicated onto condition plates to study microbial strains (Figure 1A). As all transfers originate from source plates, their quality is crucial. Strains must be well-grown and accurately transferred, as issues will affect all condition plates (Source Plates and Pretesting Challenges and Tips).
Avoid under- or overgrown colonies when culturing bacteria, as both can affect replication quality. Undergrowth may limit transfers, while overgrowth can cause uneven pinning and downstream artefacts. An example of an acceptable source plate is shown in Figure 1B; (For troubleshooting: section 4.1 and Table 1). To select optimal source plates, we recommend pinning extra copies to then choose the best.
Materials
- Prepared growth media plates from section 1.1, containing no stressor.
- Library plates.
- Pinning robot
- 70% ethanol for cleaning the robot (section 4.5).
Method
- (1)
- Thaw and Prepare Library Plates: Fully thaw library plates before transfer. Centrifuge at low speed (~250 x g for 1 minute) to collect contents before removing the seal.
- (2)
- Create Source Plates: Use a pinning robot or hand-pinning tool to transfer glycerol-stored strains from library plates onto growth media, generating new source plates. Multiple library plates can be combined into various screening formats (Figure 2). Additional information related to creating and storing source plates can be found in Source Plate Challenges and Tips.
- (3)
- Maintain Sterility and Optimise Growth: Ensure sterile technique during transfers and use sealing films suited to the plate type. During media transfer (section 2.1), aspirate any residual media from pipette tips. Adjust growth time and temperature based on the organism and plate format, for example, 1536-format plates typically require shorter incubation than 96-format plates due to tighter colony spacing.
Source Plates Challenges and Tips
| Section 1.2 Source Plates Challenges and Solutions | ||
| Challenge | Issues | Solution |
| Defrosting | Insufficient defrosting of plates and centrifugation of plates prior to plate pinning. This process ensures that a sufficient amount of bacteria is pinned onto the source plates, and reduces the risk of cross-contamination upon removal of plate seals. | Ensure that any original frozen libraries in library plates stored at -80 °C are thoroughly defrosted at room temperature and then centrifuged prior to being pinned. |
| Viability of Source Plates | Ensure that species are still viable before commencing the screen. Once prepared, they can remain viable for up to four weeks when stored at 4–7°C. | Generally, source plates can remain viable for up to four weeks when stored at 4–7°C. After this period, re-pinning is required; however, this is species-dependent. |
| Replicate Plate Copies | Ensure to create sufficient replicate plate copies to avoid having to undertake unnecessary repeats. | For all stored library plates, it is strongly advised to create at least two identical copies of these plates and store these appropriately. This step can be undertaken manually or using an automated liquid handler. |
1.3. Pre-Testing
Purpose
Pre-testing ensures that chemical genomic screens are cost and time efficient. It reduces the need for repeat experiments by optimising the condition concentrations and incubation times to obtain the dynamic growth range.
The dynamic growth range allows for the accurate assessment of how a condition influences phenotype, describing an endpoint which enables clear differentiation in colony size between sensitive and resistant strains, helping determine MICs and partial inhibition. The optimal range for each condition can vary depending on the incubation time and the conditions' effect on growth, as both factors together determine the end point colony size (Figure 3; Plate Pouring and Source Plate Challenges and Tips).
After pinning, plates are incubated based on the organism and stress conditions. As chemical genomic screens use a single imaging endpoint, users must determine the optimal time by evaluating key parameters to ensure data can be captured (e.g., via Iris). These include:
Materials
- All produced condition plates (section 1.1).
- Source plates (section 1.2).
- Incubator.
Method
- (1)
- Optimise Pre-testing: Determine stress concentrations that allow sufficient growth with visible phenotypic differences (See Plate Pouring and Pretesting and Tips). If unclear, use MIC broth microdilution for guidance (see Pretesting Challenges and Tips).
- (2)
- Standardise Format: Use consistent plate formats and growth media across the screen to ensure comparability.
- (3)
- Refine Incubation: Adjust incubation time based on organism and stress level. Use control plates (no stress) to benchmark growth rates and compare with condition plates to define a dynamic range. For example, if control growth occurs at 9 hours, low and high stress may delay growth to 10 or 12 hours respectively. Ensure colonies remain resolvable for Iris analysis.
- (4)
- Prevent Artefacts: Control for issues like colony overlap, edge effects, and contamination to improve data quality (Figure 4; section 4.1).
Pre-testing Challenges and Tips
| Section 1.3 Pre-testing Challenges and Solutions | ||
| Challenge | Issues | Solution |
| Determining Stress Concentrations | The optimum concentration needs to be investigated to determine a suitable concentration for the entire microbial library present on the condition plates. | Consult literature data for conditions, examples such as (Brochado et al., 2018) and (Nichols et al., 2011). Websites such as EUCAST (Kahlmeter G et al., The European Committee on Antimicrobial Susceptibility Testing - EUCAST. 2025 https://www.eucast.org/) can be used to help with identifying appropriate antimicrobial concentrations. |
| Serial Dilutions | The MIC must be determined either by literature consultation or through serial dilutions. | For further MIC determination, prepare a serial dilution of the chemical using a 10-fold or 2-fold dilution series on 3-4 conditions to stimulate the dynamic range. The final concentrations must span across a range expected to include the MIC for the species you're testing. Use pre-testing plates for this purpose. |
| Determining Incubation Time | Ensure that incubation time is optimised for specific species being screened. | If this is the first time performing the procedure on a screening plate, check the plates hourly to determine the optimal incubation time for the strains. This will establish a baseline incubation period, which can then be applied consistently for all strains in the screen. |
| Stamping Source Plates to Condition Plates | Over-stamping a source plate can dilute the transferred cell mass, leading to inaccurate results. | Determining the number of condition plates per source plate is important as the source plate serves as a biological replicate. An initial test screen using one source plate and multiple condition plates is recommended. Typically, 10–15 plates can be stamped from a single source plate (section 4.4, Table 2). |
| Plate Format for Biofilms | Growth media plates may not be suitable for strains forming biofilms (section 4.3). | Typically, solid source plate to solid screening plate stamping is conducted to ensure a consistent amount of cell mass is transferred for each strain. In cases where growth media plates are not suitable for specific species, liquid culture can be used instead as a source plate: thaw glycerol stocks, inoculate a fresh liquid culture plate to saturation, and then stamp directly onto condition plates to maintain uniform cell transfer. |
2. Screening
Purpose
This section outlines a general screening design for chemical genomic screens and describes the process of pinning from source plates onto condition plates (Figure 5). We recommend using a minimum of 3-4 replicates per condition, with each replicate coming from an independent source plate (biological replicate). Several tools are available to perform screens, this is discussed further in section 4.5.
Materials
- A pinning head (a tool used to replicate plates typically in 96, 384, or 1536 configurations) (section 4.5).
- 70% ethanol for sterilising.
- Condition plates containing conditions (section 1.3 for choices).
- Source plates (section 1.2).
- Static incubator.
Method
- (1)
- Prepare condition and Source plates: Inspect all plates for defects (e.g., bubbles, uneven surfaces) and if they have been contaminated. Discard all plates that fail this final quality control. To avoid pinning artefacts, we recommend bringing source plates to room temperature (Source Plates Challenges and Tips).
- (2)
- Ensure Sterility: In a sterile environment, ensure that pinning components are clean (Screening Challenges and Tips).
- (3)
-
Pinning Procedure: Select an appropriate pinning protocol (section 4.4, Table 2 for replication limits per source plate). A single source plate can be used to stamp multiple condition plates (Source Plates Challenges and Tips). Pinning involves:
- a.
- Aligning the pinning head over each strain on the source plate.
- b.
- Gently lowering it to pick up a small, consistent amount of material.
- c.
- Transferring material by lightly touching the pins to the condition plate without piercing the agar.
- (4)
- Sterilise Between Source Plates: When switching source plates, sterilise the pinning head with 70% ethanol and allow to air dry before repeating the pinning process (Screening Challenges and Tips).
- (5)
- Incubation: Place condition plates in a static incubator at the appropriate temperature and duration for the organism used (section 1.3).
- (6)
- Imaging: Once colonies reach an appropriate size for image analysis (e.g., via Iris), remove plates from the incubator and proceed with imaging.
Screening Challenges and Tips
| Section 2 Screening Challenges and Solutions | ||
| Challenge | Issues | Solution |
| Condensation | Plates develop condensation on the lid after bringing the plates up to room temperature. | Remove all condensation by wiping the plates with a tissue that has been pre-wet with 70% ethanol for sterility. |
| Importance of Sterilisation | Potential for cross- contamination when using a reusable pinning tool. | Ensure thorough sterilisation between sources. Debris can be removed using a brush and water and the pins can be sterilised by submerging the head in 70% ethanol for 10 seconds and allowing it to air-dry. Alternative methods, such as autoclaving or using Virkon solutions, may be used depending on the tool, as well as disposable pinning heads (section 4.5). Refer to the manufacturers' protocols for this purpose. |
| Order of Plate Stamping | When stamping condition plates from source plates, the order of conditions matters. The initial stamping from a source plate transfers more cell mass, potentially affecting results. | It is recommended to assign the first condition plate containing a stress which is expected to elicit a strong effect to minimise the impact of the higher cell mass. |
3. Imaging & Data Analysis
3.1. Taking Images & Iris
Purpose
This section outlines best practices for imaging plates and analysing phenotypic changes such as colony size and opacity with Iris, ensuring plates are suitable for downstream phenotypic analysis (Kritikos et al., 2017). Figure 6 highlights this process.
Materials
- Camera: A built-in fixed 18-megapixel Canon EOS Rebel T3i camera (Canon) is used within our group; however, generally any suitable camera to take plate images can be used. Refer to the robot manufacturers' protocols for guidance on specific types of cameras that are suitable for the robot type.
- Ensure to maintain a fixed distance between the camera and plates as well as consistent lighting, preferably with a lightbox. This minimises variability across images.
- Software: S&P Imager (S&P Robotics, version 2.0.1.0) and EOS Utility (Canon, version 2.10.0.0) is used within our group.
Download and install Iris (v0.9.7, https://github.com/critichu/Iris) for image analysis. Iris is a scalable and flexible platform capable of quantifying multiple features of high-density arrayed microbial colonies. This open-source software supports a wide range of microbial species and includes add-on features for compatibility with both low-throughput and kinetic data (Kritikos et al., 2017). Alternative image analysis software programs are also available such as ScreenMill (Dittmar et al., 2010) and gitter (Wagih et al., 2014); however these programs would need to be validated to ensure that they can be used with specific screen setups.
Method
- (1)
- Capture Images: We recommend using an automated plate imaging system that is able to capture pictures of condition plates with consistent lighting and focus (Imaging & Data Analysis Challenges and Tips).
- (2)
- File Naming and Analysis: Name image files using the format: Condition_Concentration_SourcePlate_Replicate. This format is optimised for Iris but works with other analysis tools as well. For full Iris method details, see Kritikos et al., (2017) (Imaging & Data Analysis Challenges and Tips).
Imaging & Data Analysis Challenges and Tips
| Section 3.1 Imaging & Data Analysis Challenges and Solutions | ||
| Challenge | Issues | Solution |
| Image Lighting | Avoid using flash to prevent glare from the agar. | If additional lighting is needed, position the light source to the side of the plate. |
| Quality of Camera | Capturing good-quality images. | Use a high-quality camera capable of producing images with a minimum resolution of 18 megapixels. |
| Naming System | Avoiding confusion during analysis. | Establish a logical and coherent naming system for plates. |
3.2. Phenotypic Analysis (ChemGAPP & Data Visualisation)
Purpose
This section outlines the use of ChemGAPP, an open-source platform designed to analyse microbial fitness data from chemical genomic screens (Doherty et al., 2023). ChemGAPP includes two distinct pipelines tailored to different experiment scales:
- (1)
- ChemGAPP Big: for large-scale, genome-wide screens.
- (2)
- ChemGAPP Small: for targeted hypothesis testing or small-scale mutant analyses.
Users can generate fitness scores by uploading `.iris` files (from image analysis software such as IRIS) into ChemGAPP, which automatically processes the data through quality control, normalisation, and scoring steps (Phenotypic Analysis Challenges and Tips). The software and documentation are available at https://github.com/HannahMDoherty/ChemGAPP.
Materials
Install ChemGAPP via the GitHub repository above. This tool will process IRIS image data and calculate strain fitness scores. An alternative tool for processing growth curve data is the Kinetic Data Companion in R (Kritikos et al., 2017).
Method
- (1)
-
Large-Scale Screens – ChemGAPP Big: ChemGAPP Big (Figure 7) is designed for full-genome chemical-genomic screens. The pipeline begins with optional quality control (QC) checks to flag poor-quality replicates or plates. It then performs two stages of normalisation:
- Edge effect correction: A Wilcoxon rank-sum test compares colony sizes at the plate centre vs. edge to correct for border artefacts.
- Scaling: All plates are adjusted so their medians match the average colony size at the plate centre, standardising across conditions.
Replicate reproducibility can be evaluated to assess data quality, and QC thresholds can be adjusted accordingly. After normalisation, ChemGAPP Big computes S-scores, which quantify the fitness of each mutant in each condition based on the deviation from expected colony size. The scored dataset can be further analysed externally by applying a False Discovery Rate (FDR) threshold, commonly set at 5%, to identify statistically significant hits prior to downstream analyses such as clustering or enrichment.
- (2)
- Small-Scale Screens – ChemGAPP Small: ChemGAPP Small is suitable for focused experiments involving a limited number of strains or conditions. Unlike ChemGAPP Big, it does not assume a defined fitness distribution.
Fitness is calculated either as:
- a.
- Mutant vs. Wildtype: using the ratio of mean colony sizes.
- b.
- Mutant vs. Control Condition: allowing inference of fitness under treatment vs. baseline.
Fitness scores can be visualised using heatmaps, bar plots, or swarm plots. Bar plots and heatmaps are generated by dividing the mean fitness score for each strain by the mean wildtype fitness score or under the control condition and are displayed with 95% confidence intervals. Swarm plots show the fitness ratio of each individual colony, calculated by dividing each fitness score, such as colony size by the mean colony size of the wildtype or under the control condition. Statistical significance in swarm plots is assessed using one-way Analysis of Variance (ANOVA).
- (3)
- To run ChemGAPP:
- a.
- Export data from your plate reader or image analyser in `.iris` format.
- b.
- Upload the files to ChemGAPP via the web interface or command-line.
See the GitHub repository for full instructions and walkthroughs. ChemGAPP may require modification of the requirements.txt file when run on newer systems, as some package versions listed in the original configuration may be outdated. Adjusting these dependencies can help ensure compatibility during installation and execution.
Phenotypic Analysis Challenges and Tips
| Section 3.2 Phenotypic Analysis Challenges and Solutions | ||
| Challenge | Issues | Solution |
| File format | ChemGAPP only accepts `.iris` files. | If using other analysis software, the output may need to be converted. |
| File naming | Proper naming is essential to avoid analysis errors. | ChemGAPP includes a file renaming tool to standardise filenames and avoid analysis errors. |
4. Additional Considerations
4.1. Troubleshooting
4.2. Recycling
All plates used in the screen can be sterilised and re-used, thereby cutting costs. To do this, the following method of cleaning the plates is advised:
- (1)
- Clean Used Plates: Remove old agar with a spatula, taking care not to scratch the plates. Place empty plates in an airtight box and soak overnight in 5% (w/v) Virkon or an appropriate laboratory disinfectant.
- (2)
- Rinse and Dry: Rinse thoroughly with water to remove disinfectant residue. Dry plates in a 60 °C incubator for at least 24 hours. To reduce excess moisture, place a salt desiccant in the incubator.
- (3)
- Inspect and Store: Discard any damaged plates. Store clean, undamaged plates in a sealed container for future use.
4.3. Biofilm Screening
Biofilm formation occurs when bacterial cells encase themselves in a protective extracellular matrix (ECM) made of secreted polysaccharides and proteins, improving their survival under stress (Flemming et al., 2016). This complex process is driven by multiple genes and influenced by environmental factors. Chemical genomics using single-gene knockout libraries enables efficient analysis of genes involved in biofilm production, reducing the effort of traditional assays.
Biofilm quantification can be achieved by incorporating dyes into growth media that bind ECM components. Congo Red and Coomassie Blue have been used to stain E. coli and P. aeruginosa colonies, with increased Congo Red intensity serving as a proxy for biofilm production (Kritikos et al., 2017).
Pre-testing biofilm conditions: Begin pre-testing with Congo red alone. If mutant visibility or Iris quantification is poor, add Coomassie blue in varying ratios. An effective starting ratio, as seen in P. aeruginosa, is 2:1 Congo red to Coomassie blue (e.g. 40:20 μg/mL). Once optimised, plates should show clear background and distinct colouration - red-stained mutants indicate biofilm production, while white mutants are non-producers. In species with strong biofilm formation, dye use enhances mutant detection, as shown in Figure 8: (a) no dye, (b) with dye, (c) enhanced biofilm visibility.
4.4. Species-Specific Considerations
Below is a non-exhaustive list of the media requirements for various bacterial species. Note that in all options listed, the type/amount of agar remains the same.
- Escherichia coli, Vibrio cholerae, Pseudomonas aeruginosa and Klebsiella pneumoniae can be grown on agar made by combining LB Lennox Broth (Tryptone 10 g/L, NaCl 5 g/L, Yeast Extract 5 g/L) and Agar 15g/L.
- Salmonella enterica on LB Miller Broth (Tryptone 10 g/L, NaCl 10 g/L, Yeast Extract 5 g/L) and Agar 15g/L.
- Mycobacterium bovis Bacillus Calmette-Guérin (BCG) and Mycobacteroides abscessus can be grown using an enriched 7H9 media supplemented with 1% (w/v) glycerol, 10% (w/v) ADC, 0.2% (w/v) BactoTM cas amino acids, 50 μg/ml L-Tryptophan and 50 μg/mL Natures Aid multivitamins and then plated onto 7H9 agar using 2% (w/v) BD Difco™ agar and 7H9 media. Optionally, add 25 μg/mL of amphotericin B to inhibit fungal contamination. To prevent from drying out during the incubation period, ensure to monitor the humidity using a hygrometer if possible or by using a water reservoir and mimising the air flow. The liquid BCG culture that is being pinned should be shaken at 25 rpm before use in the pinning operation.
When performing chemical screening using bacteria, it is crucial to consider how different bacterial species appear on the plates, as the morphology of bacterial colonies can provide valuable information about growth patterns, behaviour, and potential antimicrobial effects. The appearance of bacterial colonies can vary significantly based on species-specific characteristics such as colony shape, colour, size, texture, and growth pattern, all of which can influence the interpretation of chemical screening results. Certain species (e.g., P. aeruginosa, E. coli, or S. enterica) may have either intrinsic or acquired resistance to multiple antibiotics. Therefore, it's important to consider the strain's resistance profile when interpreting the results of chemical screening for antimicrobial activity.
Our research group has undertaken screening analysis on several species as listed in this section. Highlighted below in Table 2 are species-specific observations taken from the experiences of our group. Further detailed observations are provided after the species-specific characteristics in Table 2.
4.5. Screening Design
Screen format: Screens are typically run in 96, 384, or 1536-well formats. Higher-density formats reduce plate use, saving time and cost. However, if swarming strains are present, they may spread into adjacent colonies. In such cases, a lower-density format may be needed to provide more space and reduce interference.
Pinning platform: This protocol uses the S&P Robotics BM series platform, which features a reusable pinning head, plate stacker, wash station, and UV sterilisation to prevent cross-contamination. Alternatives include the Singer ROTOR HDA, which uses disposable plastic pinning heads. For low-throughput screens, manual pinning is also an option.
Robot cleaning: Ensure that robot is cleaned thoroughly before commencing any screen to avoid introducing contamination and/or inconsistencies in data generation. Robot cleaning is best achieved using both 70% ethanol and in-built features of the robot such as UV sterilisation and water/ethanol reservoirs. Check the robot manufacturers' guidelines for further details.
5. Conclusions
The potential applications of chemical genomics screens extend beyond basic microbiology research into drug discovery, environmental microbiology, and synthetic biology. As new bacterial species and stress conditions are incorporated into screening workflows, the insights gained will continue to expand our understanding of microbial function and adaptation. By following this structured protocol, researchers can generate high-quality, reproducible datasets that contribute to the broader goal of functional genomics and microbial systems biology.
To conclude, this protocol provides a comprehensive framework for performing high-throughput chemical genomic screens to uncover gene functions in bacterial strains under varying stress conditions. If you have additional questions, don’t hesitate to contact us.
Author Contributions
M.B., G.W, M.T.M., H.A. and S.S. wrote and edited the manuscript. G.W., M.B., M.T.M and D.M. conceptulised the project. J.H., S.B. A.J.H. H.M.D., R.S., M.A., X.M., Q.X., J.B., M.G., P.B., P.M, contributed resources and contributed towards the reviewing process. All authors have read and approved the manuscript.
Funding
This work was supported by the Biotechnology and Biological Sciences Research Council (BBSRC) and University of Birmingham funded Midlands Integrative Biosciences Training Partnership (MIBTP) [BB/T00746X/1]. In addition, support was received from the Darwin Trust of Edinburgh Charity. This work was supported by a UKRI Future Leaders Fellowship [MR/V027204/1] to Manuel Banzhaf. KAUST authors were supported by KAUST faculty baseline fund (BAS/1/1108-01-01). They were also supported by FCC/1/5932-01-03 from KAUST Center of Excellence for Smart Health.
Acknowledgements
This work was funded by the BBSRC funded Doctoral Training Centre. We thank members of the Banzhaf and Moradigaravand laboratories for thoughtful discussions and feedback.
Conflicts of interest: The authors declare no conflict of interest.
Conflicts of Interest
The authors declare no conflict of interest.
References
- Alodaini D, Hernandez-Rocamora V, Boelter G, Ma X, Alao MB, Doherty HM, et al. Reduced peptidoglycan synthesis capacity impairs growth of E. coli at high salt concentration. mBio. 2024 Apr 1;15(4):1–19. [CrossRef]
- Bobonis J, Mitosch K, Mateus A, Karcher N, Kritikos G, Selkrig J, et al. Bacterial retrons encode phage-defending tripartite toxin–antitoxin systems. Nature. 2022 Sep 1;609(7925):144–50. [CrossRef]
- Brochado AR, Telzerow A, Bobonis J, Banzhaf M, Mateus A, Selkrig J, et al. Species-specific activity of antibacterial drug combinations. Nature. 2018 Jul 12;559(7713):259–63. [CrossRef]
- Cacace E, Kritikos G, Typas A. Chemical genetics in drug discovery. Current Opinion in Systems Biology. 2017 Aug 1;4:35–42. [CrossRef]
- Dittmar JC, Reid RJ, Rothstein R. Open Access SOFTWARE ScreenMill: A freely available software suite for growth measurement, analysis and visualization of high-throughput screen data. BMC Bioinformatics. 2010;11:353. [CrossRef]
- Doherty HM, Kritikos G, Galardini M, Banzhaf M, Moradigaravand D. ChemGAPP: a tool for chemical genomics analysis and phenotypic profiling. Bioinformatics. 2023 Apr 1;39(4):1–7. [CrossRef]
- Ezraty B, Vergnes A, Banzhaf M, Yohann D, Huguenot A, Brochado A, et al. Fe-S Cluster Biosynthesis Controls Uptake of Aminoglycosides in a ROS-Less Death Pathway. Science. 2013 Jun 28;340(6140):1580–3. [CrossRef]
- Fajardo A, Martínez-Martín N, Mercadillo M, Galán JC, Ghysels B, Matthijs S, et al. The neglected intrinsic resistome of bacterial pathogens. PLoS ONE. 2008 Feb 20;3(2). [CrossRef]
- Flemming HC, Wingender J, Szewzyk U, Steinberg P, Rice SA, Kjelleberg S. Biofilms: An emergent form of bacterial life. Vol. 14, Nature Reviews Microbiology. Nature Publishing Group; 2016. p. 563–75. [CrossRef]
- Gomez MJ, Neyfakh AA. Genes involved in intrinsic antibiotic resistance of Acinetobacter baylyi. Antimicrobial Agents and Chemotherapy. 2006 Nov;50(11):3562–7. [CrossRef]
- Koo BM, Kritikos G, Farelli JD, Todor H, Tong K, Kimsey H, et al. Construction and Analysis of Two Genome-Scale Deletion Libraries for Bacillus subtilis. Cell Systems. 2017 Mar 22;4(3):291-305.e7. [CrossRef]
- Kritikos G, Banzhaf M, Herrera-Dominguez L, Koumoutsi A, Wartel M, Zietek M, et al. A tool named Iris for versatile high-throughput phenotyping in microorganisms. Nature Microbiology. 2017 Feb 17;2(1):1–24. [CrossRef]
- Nichols RJ, Sen S, Choo YJ, Beltrao P, Zietek M, Chaba R, et al. Phenotypic landscape of a bacterial cell. Cell. 2011 Jan 7;144(1):143–56. [CrossRef]
- Schuldiner M, Collins SR, Thompson NJ, Denic V, Bhamidipati A, Punna T, et al. Exploration of the function and organization of the yeast early secretory pathway through an epistatic miniarray profile. Cell. 2005 Nov 4;123(3):507–19. [CrossRef]
- Tamae C, Liu A, Kim K, Sitz D, Hong J, Becket E, et al. Determination of antibiotic hypersensitivity among 4,000 single-gene-knockout mutants of Escherichia coli. Journal of Bacteriology. 2008 Sep;190(17):5981–8. [CrossRef]
- Tong AHY, Evangelista M, Parsons AB, Xu H, Bader GD, Pagé N, et al. Systematic Genetic Analysis with Ordered Arrays of Yeast Deletion Mutants. Science. 2001 Dec 14;294(5550):2364–8. [CrossRef]
- Typas A, Banzhaf M, van den Berg Van Saparoea B, Verheul J, Biboy J, Nichols RJ, et al. Regulation of peptidoglycan synthesis by outer-membrane proteins. Cell. 2010 Dec 23;143(7):1097–109. [CrossRef]
- Wagih O, Parts L. Gitter: A robust and accurate method for quantification of colony sizes from plate images. G3: Genes, Genomes, Genetics. 2014;4(3):547–52. [CrossRef]
Figure 1.
Source plate preparation. (A) Library plates with strains can be arranged in a varied format, the figure shown shows four 96 well plates that are pinned into source plates and arrayed in a 384-source plate format. (B) Image taken to show an example of a good quality source plate. Good quality source plates can be successfully replicated to make reliable copies of condition plates.
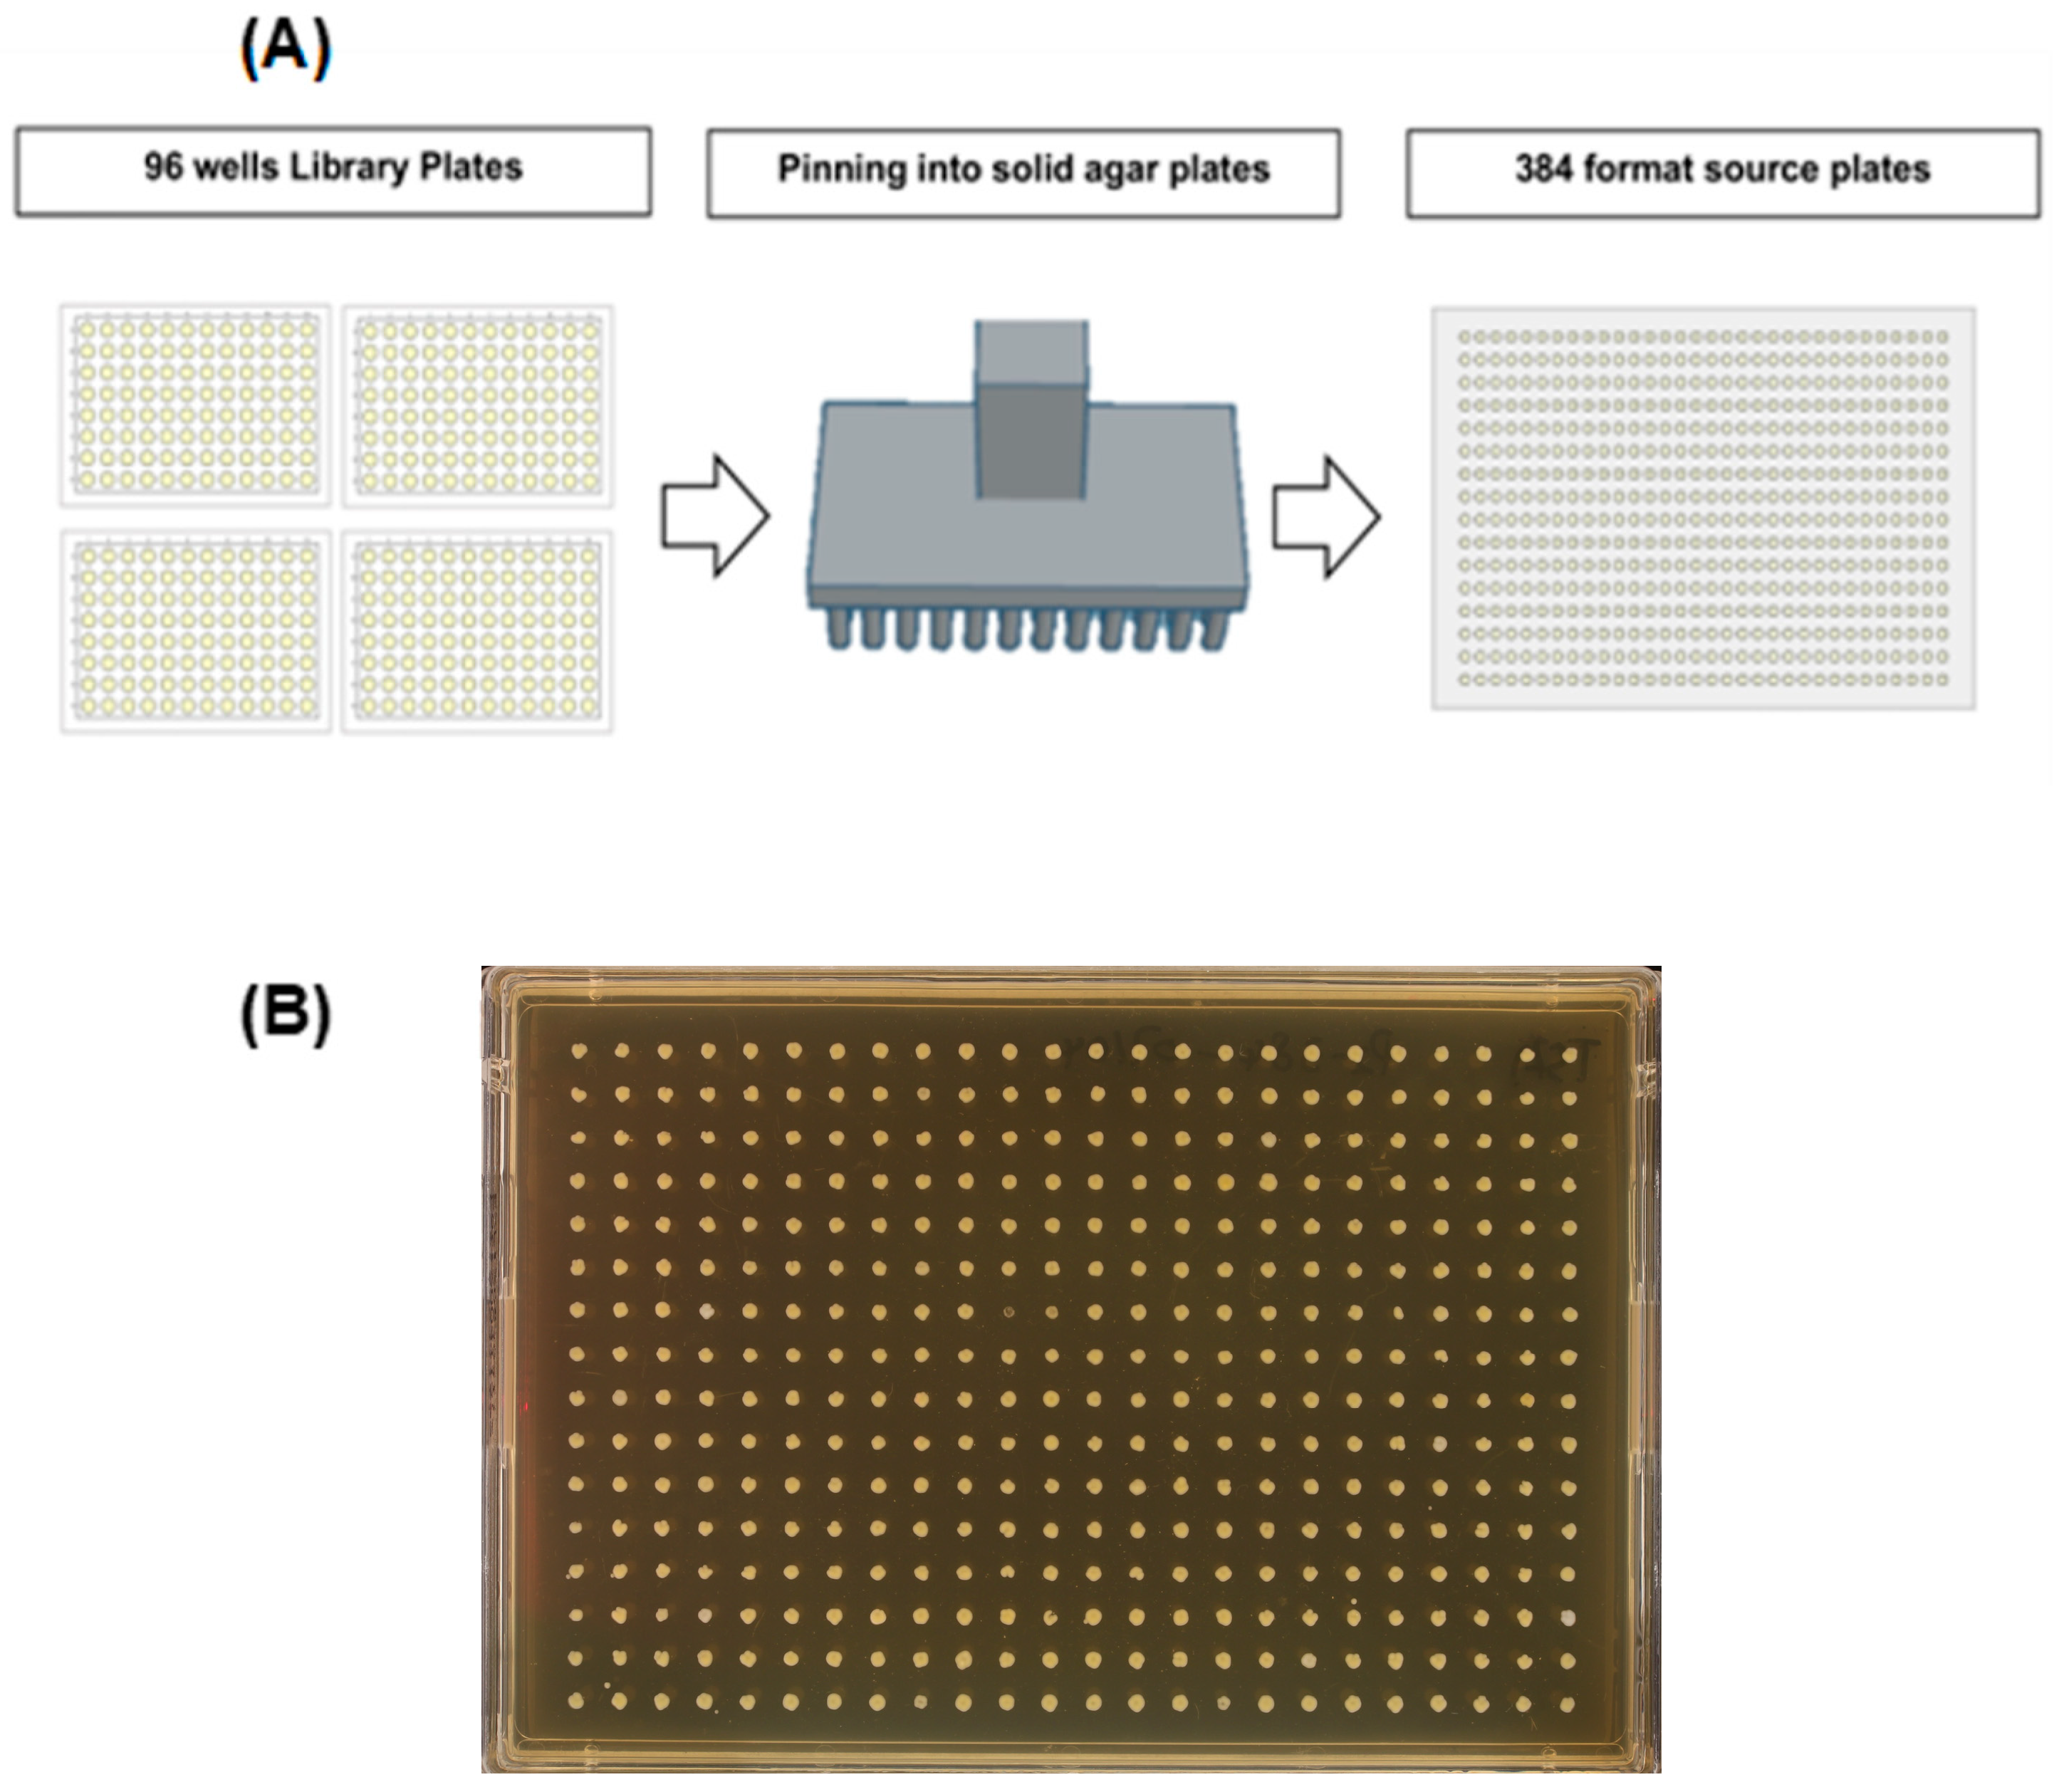
Figure 2.
Illustration of a 384 constructed source plate from four 96 well library plates. Colours represent strains from each of the 96 well plates and subsequent layout on a 384 well plate.
Figure 2.
Illustration of a 384 constructed source plate from four 96 well library plates. Colours represent strains from each of the 96 well plates and subsequent layout on a 384 well plate.
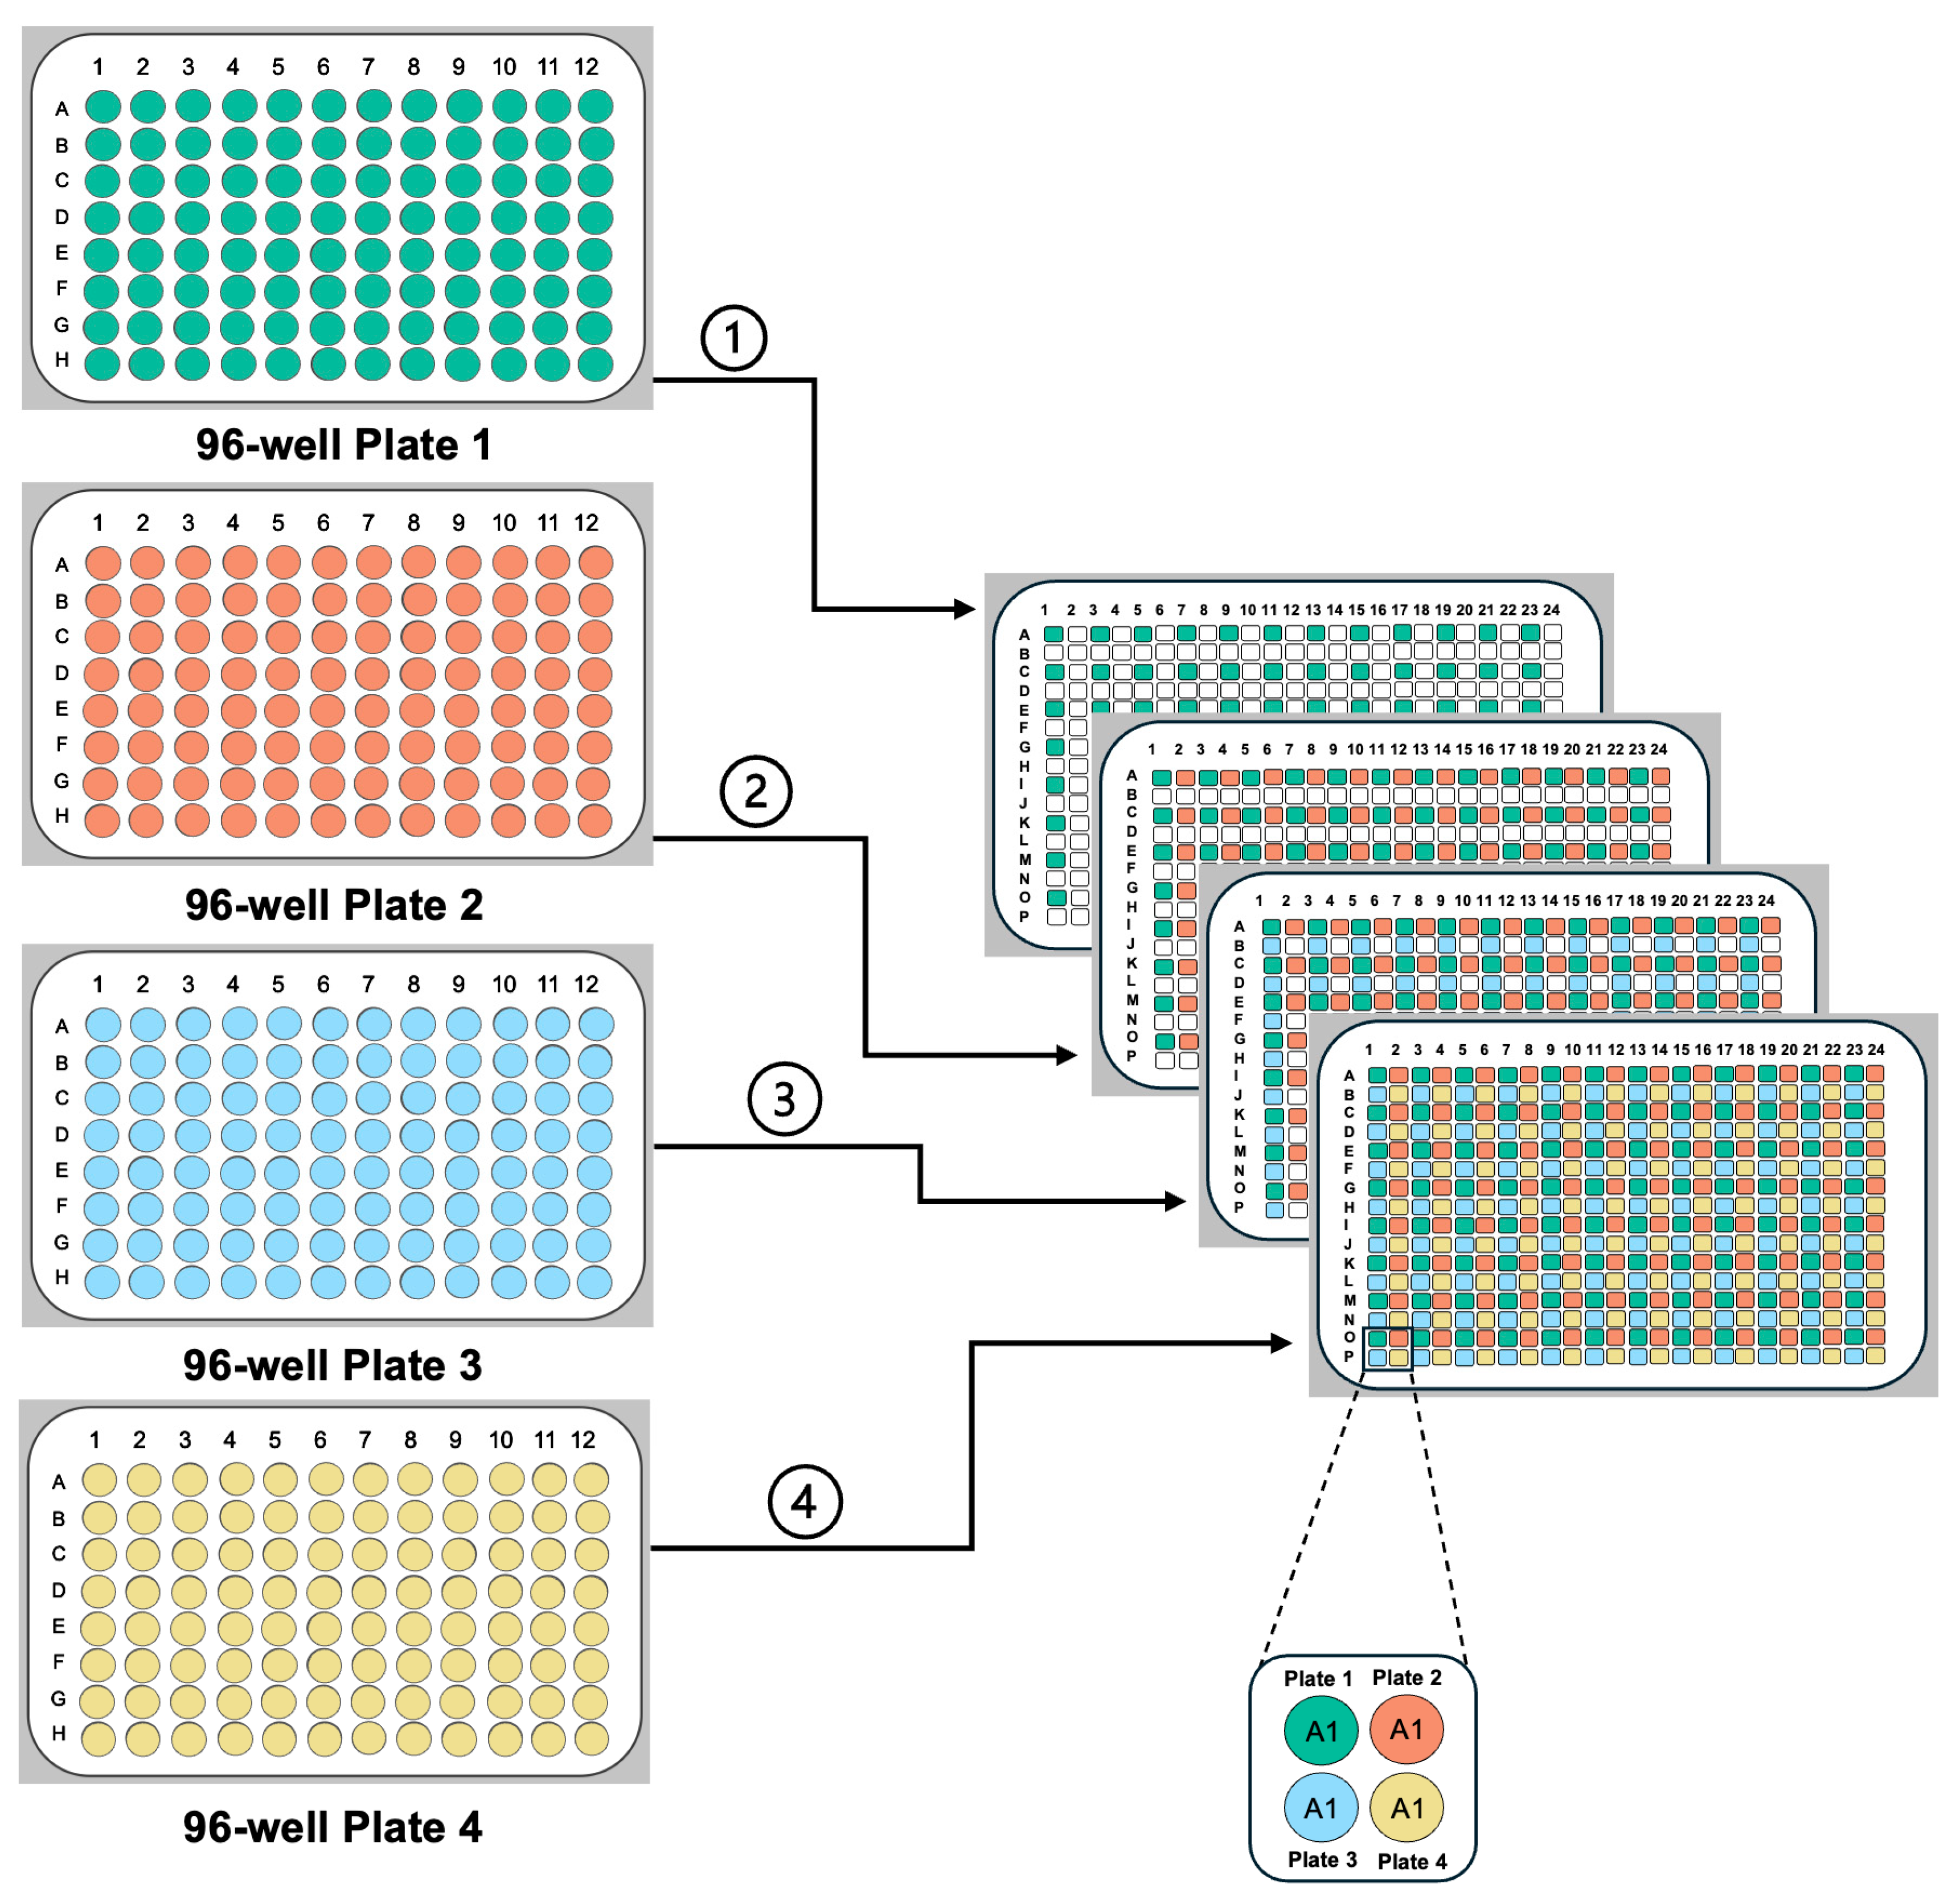
Figure 3.
Comparison of colony growth. (A) Colonies on plates containing ideal stress conditions and (B) high stress conditions. Colonies grown on plates with ideal stress conditions will have the suitability to be analysed via Iris (section 3.1) otherwise if the concentrations are too high Iris analysis will not work. (C) depicts the relationship between incubation time and stress concentration both of which are key determinants of colony growth. The control plate demonstrates that colony growth increases with time; however, excessive incubation can ultimately lead to overgrowth, making colonies unsuitable for precise detection using tools like Iris. At a relatively low MIC stress of 0.2x, colony size is initially inhibited, and 9 hours of incubation is insufficient for colony detection. However, colony size progressively improves with extended incubation, reaching optimal size at 12 hours before becoming overgrown with further incubation. In contrast, at a higher MIC stress of 0.5x, colonies reach optimal size at longer incubation times. This highlights the interplay between incubation time and stress levels relative to MIC, emphasising how these factors should be considered when optimising experimental conditions to ensure robust phenotypic assessments (see also: Pre-testing Challenges and Tips).
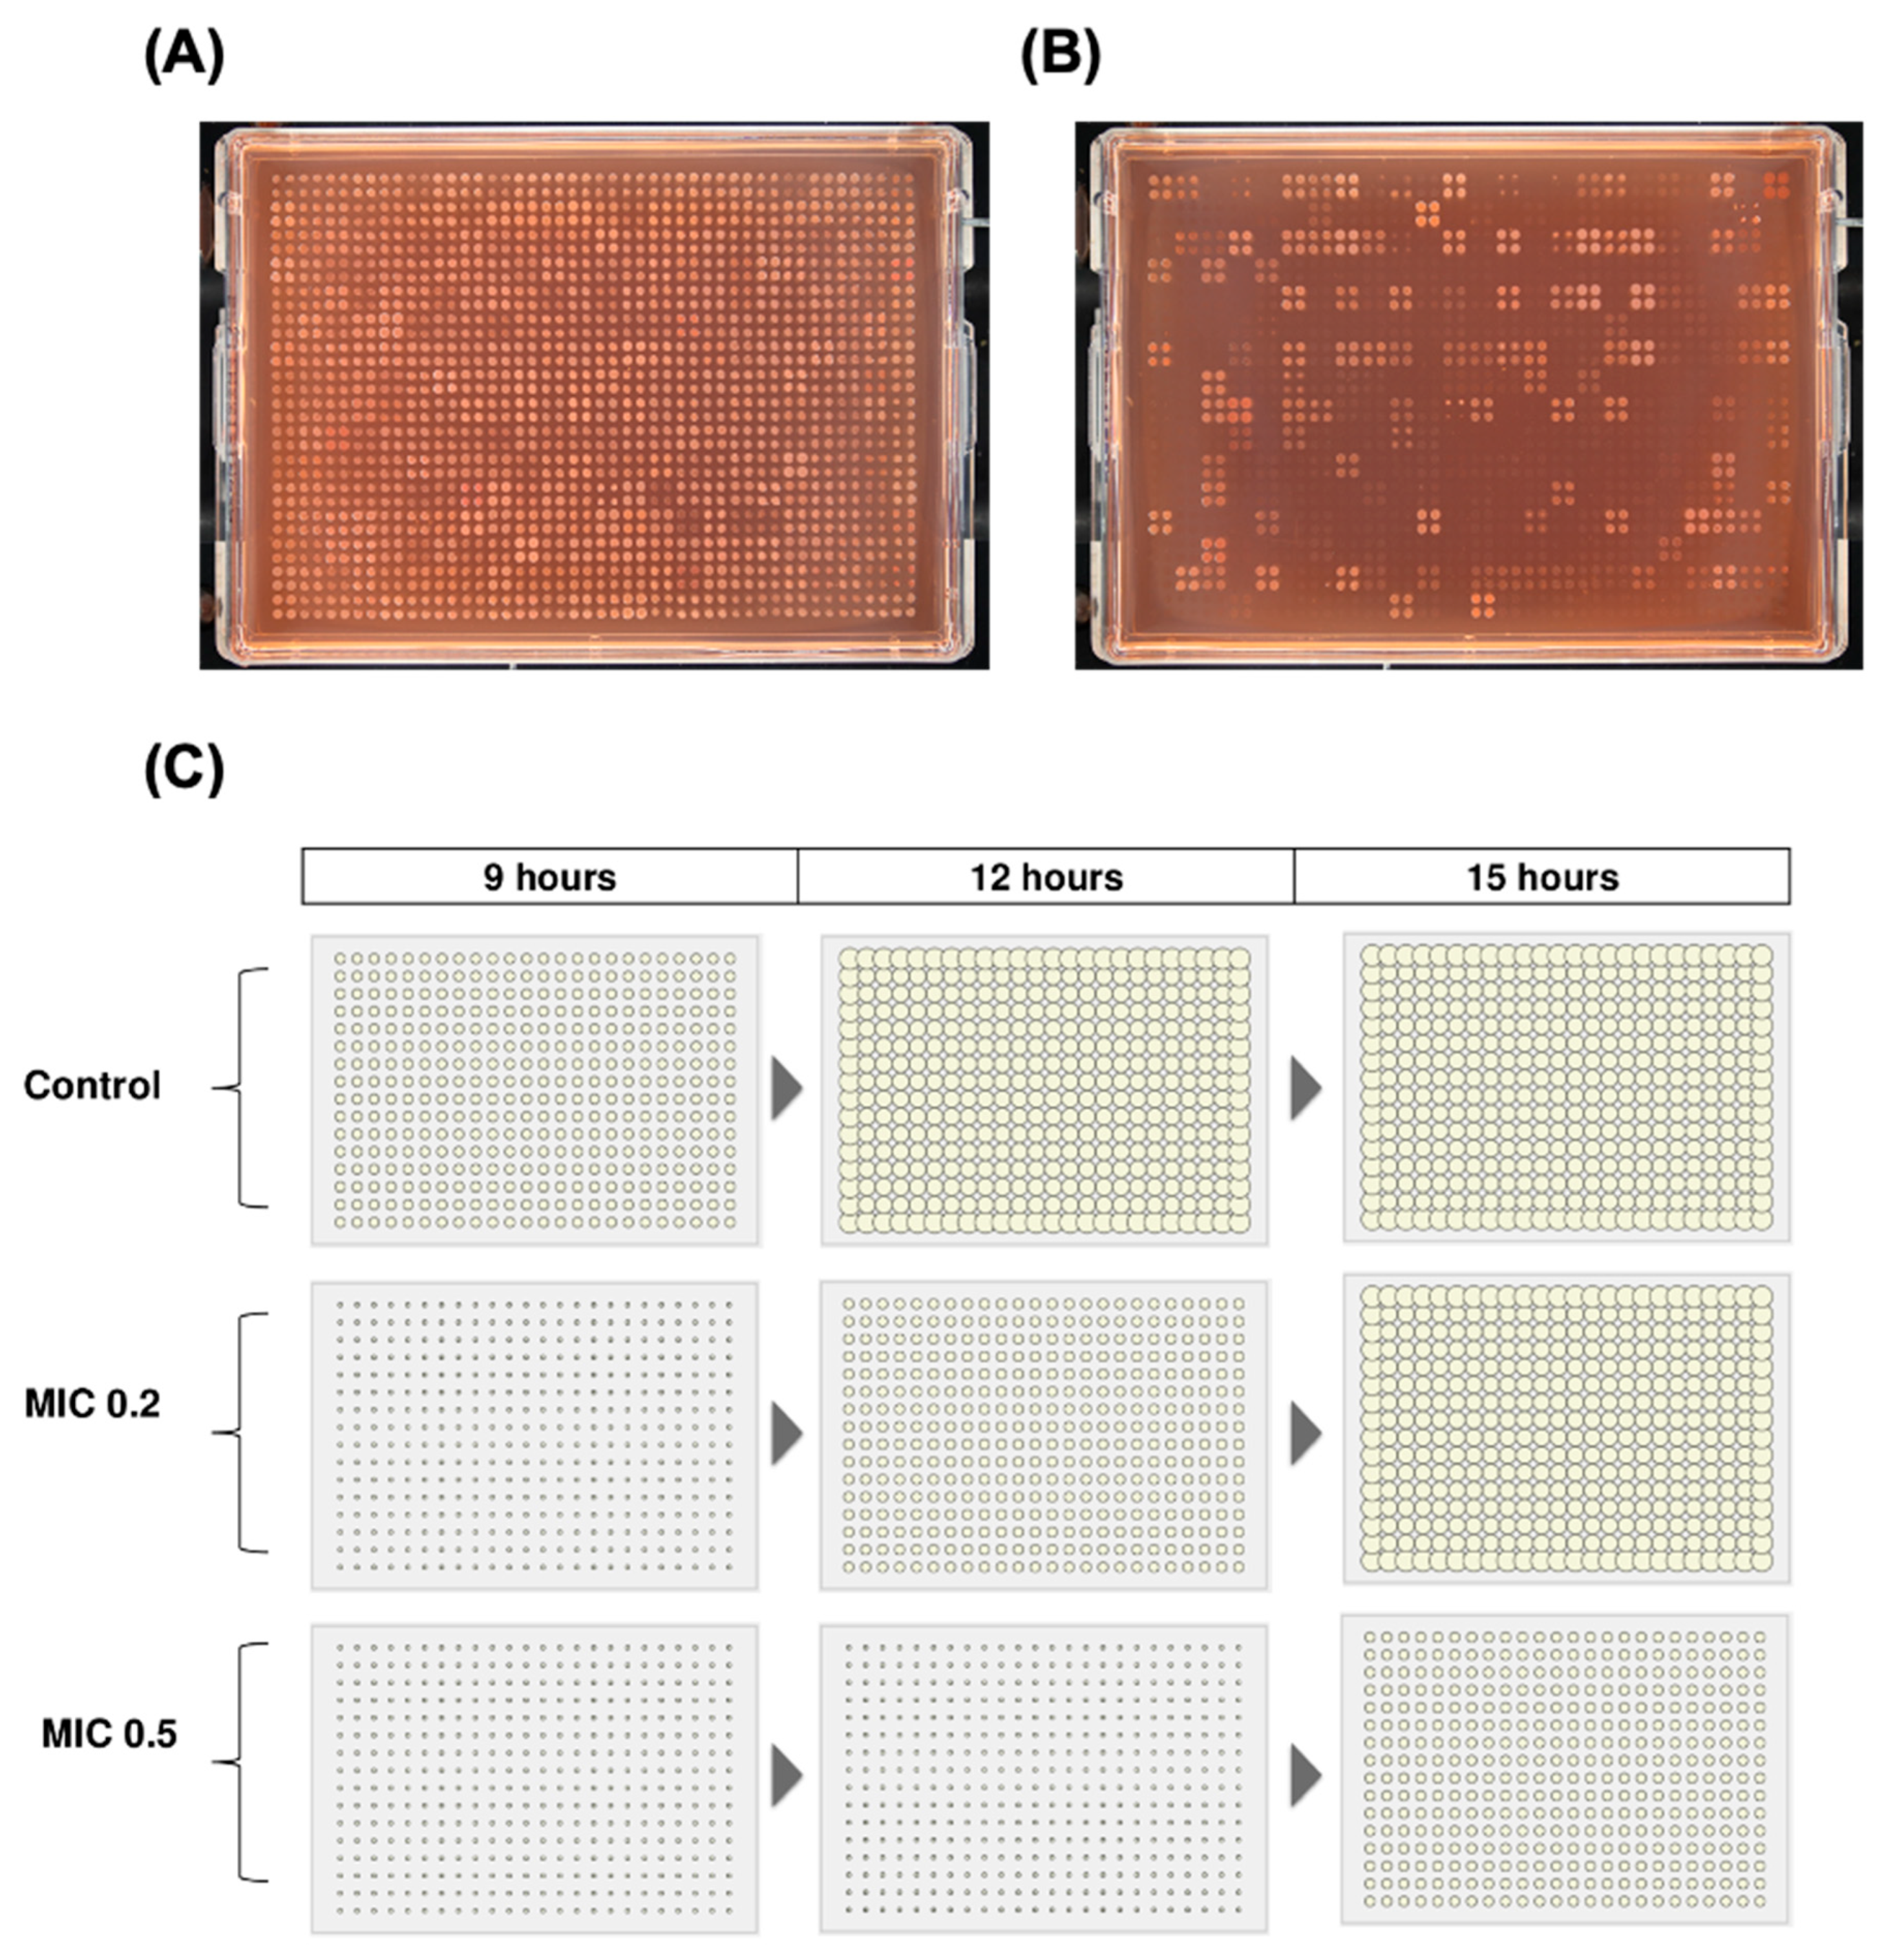
Figure 4.
Common plate effect and contamination issues encountered during chemical screening. Control plate - colonies are easily distinguishable with no observable bias; Outer Edge effects - colonies at the plate's periphery grow larger compared to those in the center; Cross-contamination - bacteria from one site contaminating other locations, often forming string-like patterns due to biofilm formation; Contamination - other microbial species appears as distinct foreign colonies; Streaked plates - missing colonies due to uneven surfaces and incomplete stamping; Absent colonies - strains are entirely missing from the plate; Swarming colonies - certain strains spread actively, contaminating neighboring strains; Wet plates - inadequate drying of a plate, causing stamped strains to spread within residual water droplets affecting adjacent colony growth.
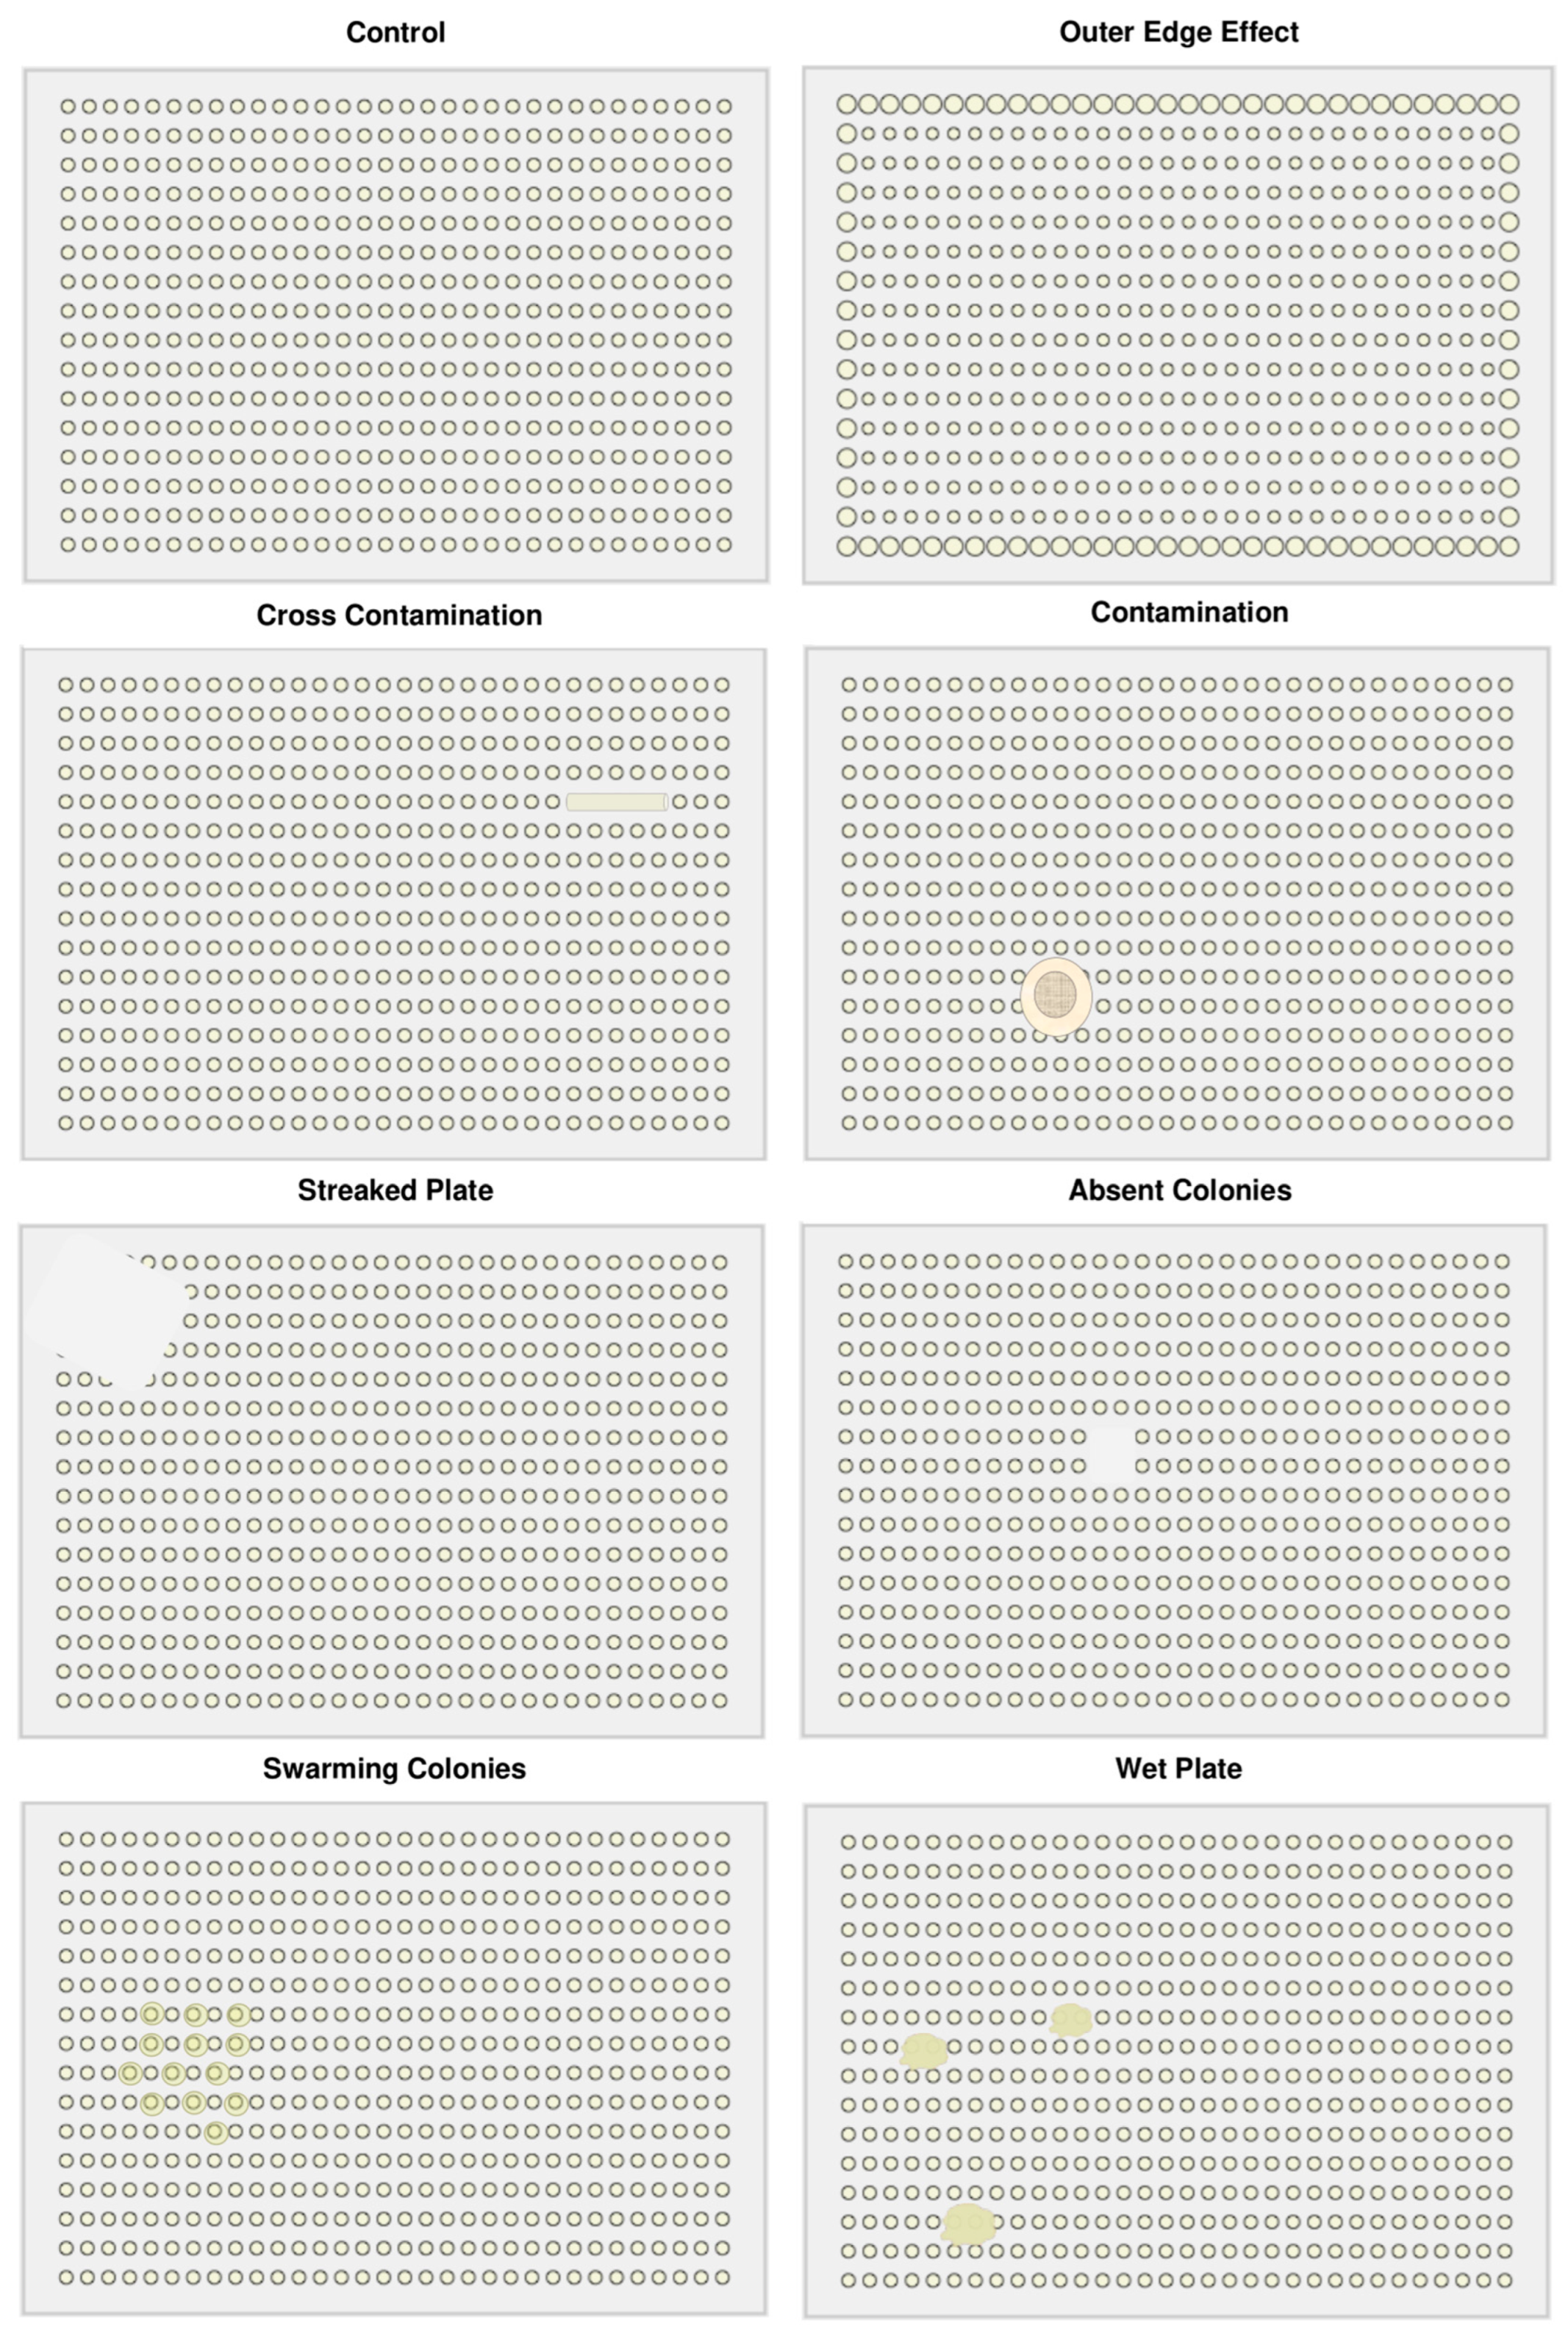
Figure 5.
Screening process. Colonies from source plates are pinned into condition plates containing the stress conditions and then incubated for a selected period. The plates are then imaged to assess to study the effects of the conditions on the mutant colonies of bacteria.
Figure 5.
Screening process. Colonies from source plates are pinned into condition plates containing the stress conditions and then incubated for a selected period. The plates are then imaged to assess to study the effects of the conditions on the mutant colonies of bacteria.
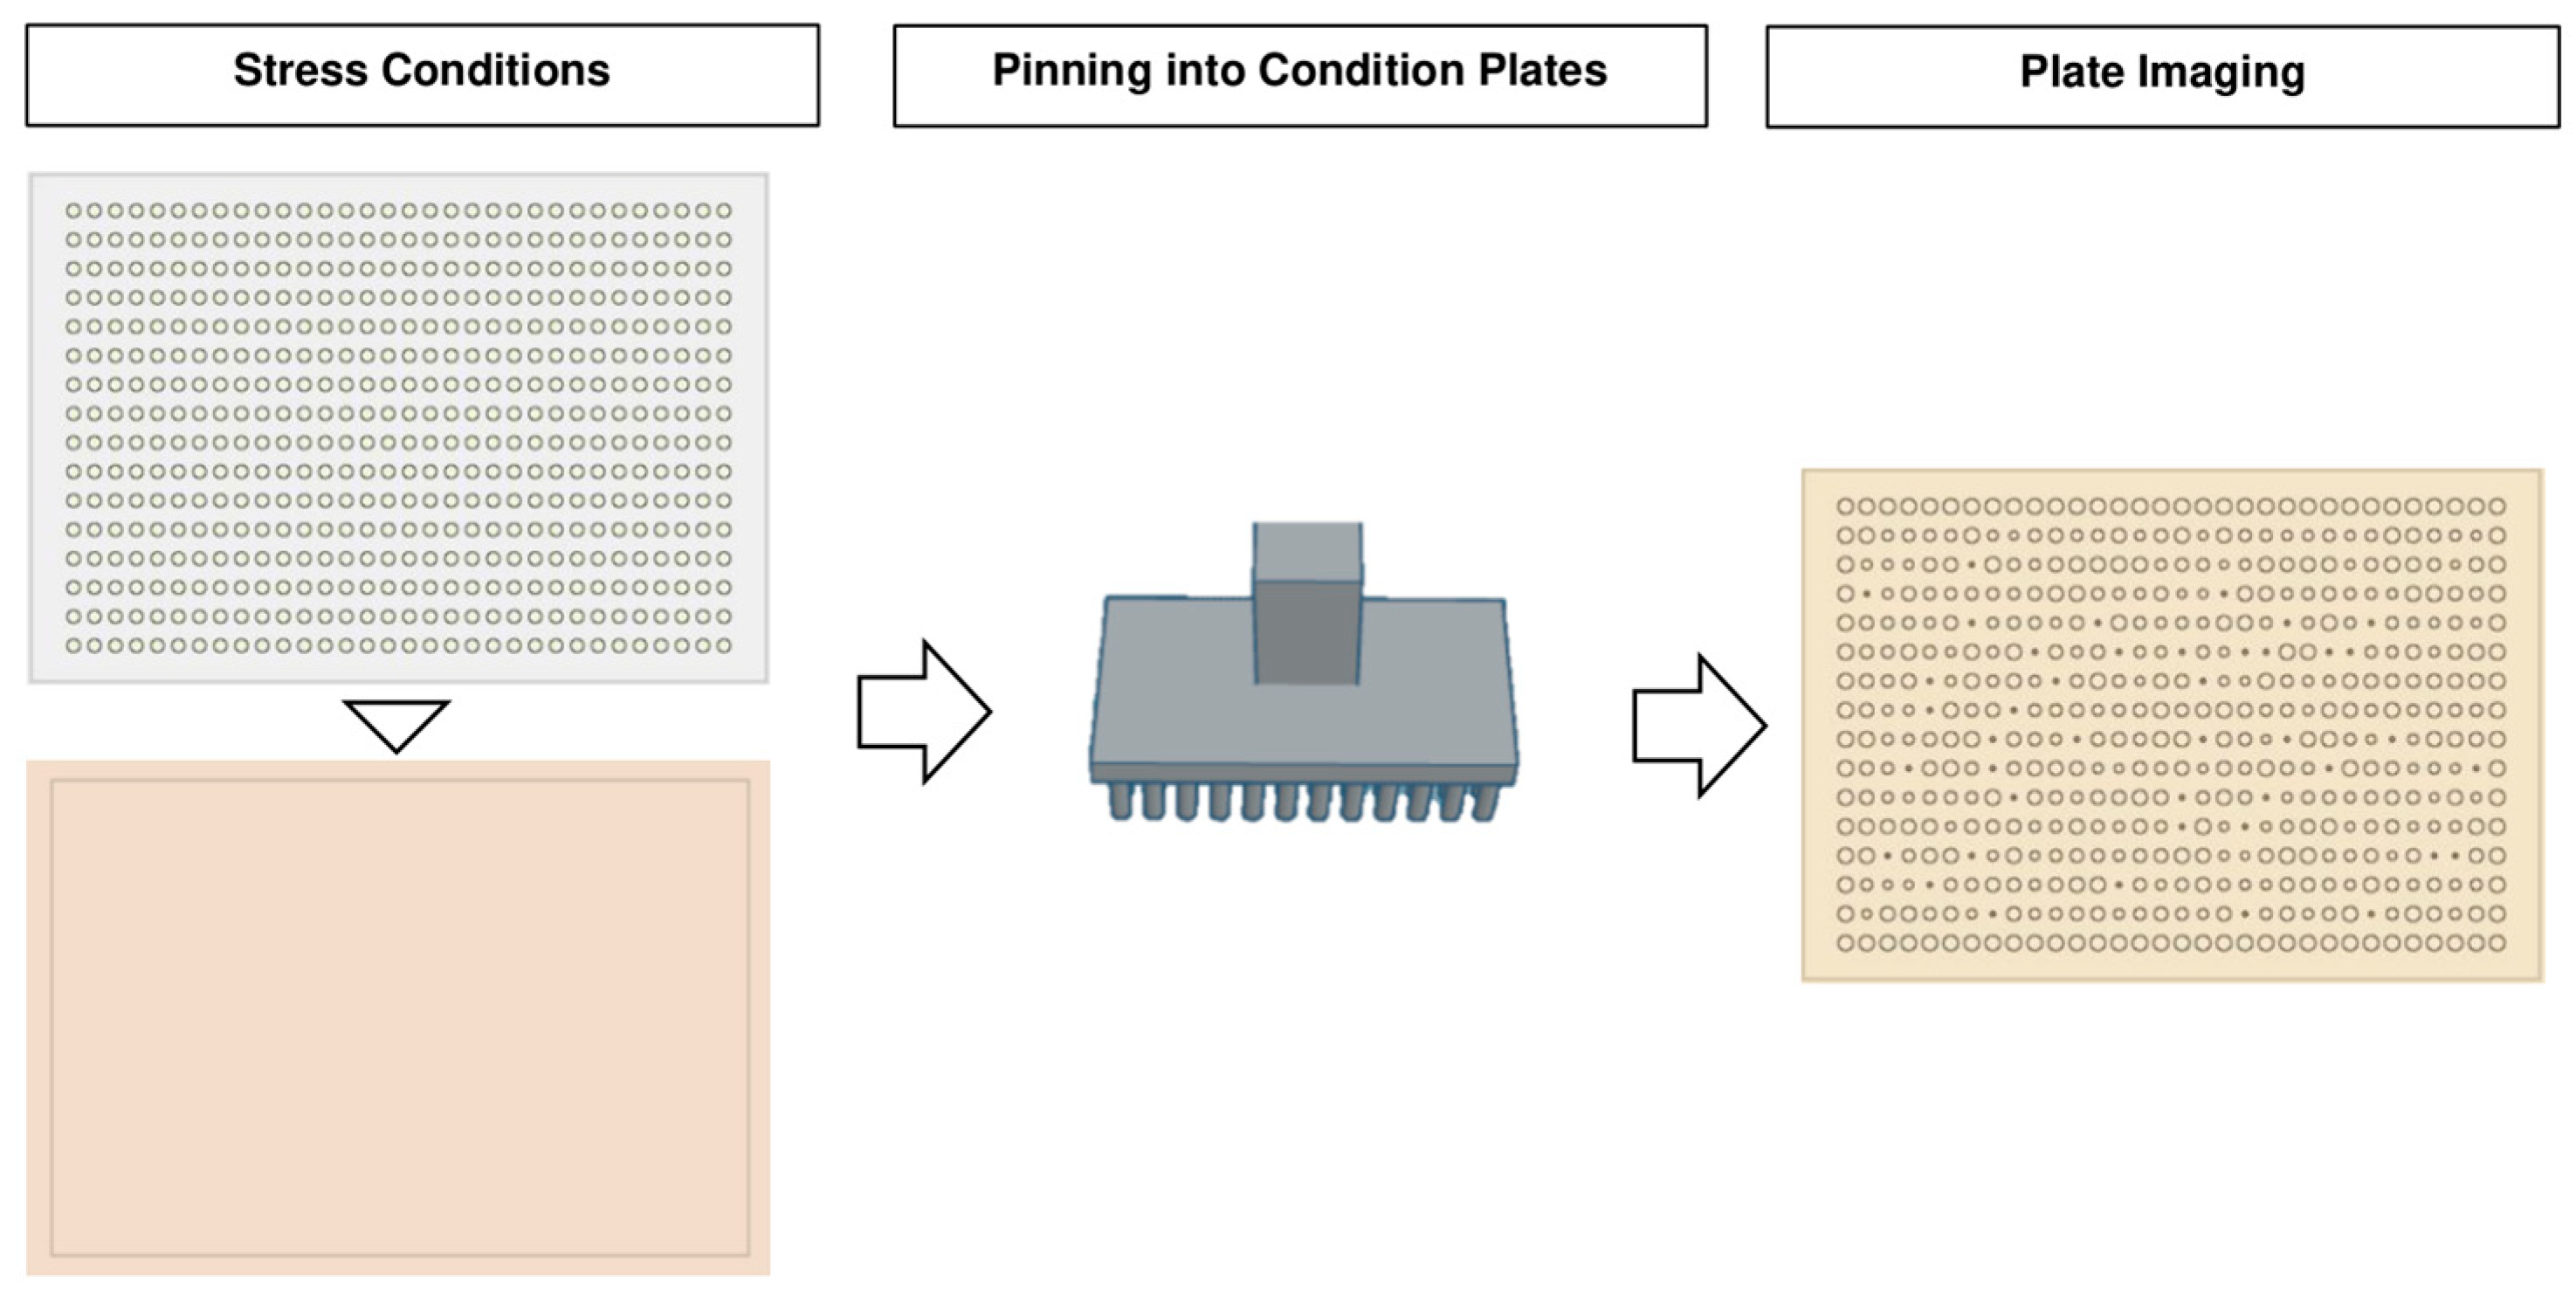
Figure 6.
Process of image analysis using Iris. The imaged plates are then processed via Iris software which analyses the image and generates phenotypic scores such as colony size, biofilm, morphology, etc.
Figure 6.
Process of image analysis using Iris. The imaged plates are then processed via Iris software which analyses the image and generates phenotypic scores such as colony size, biofilm, morphology, etc.
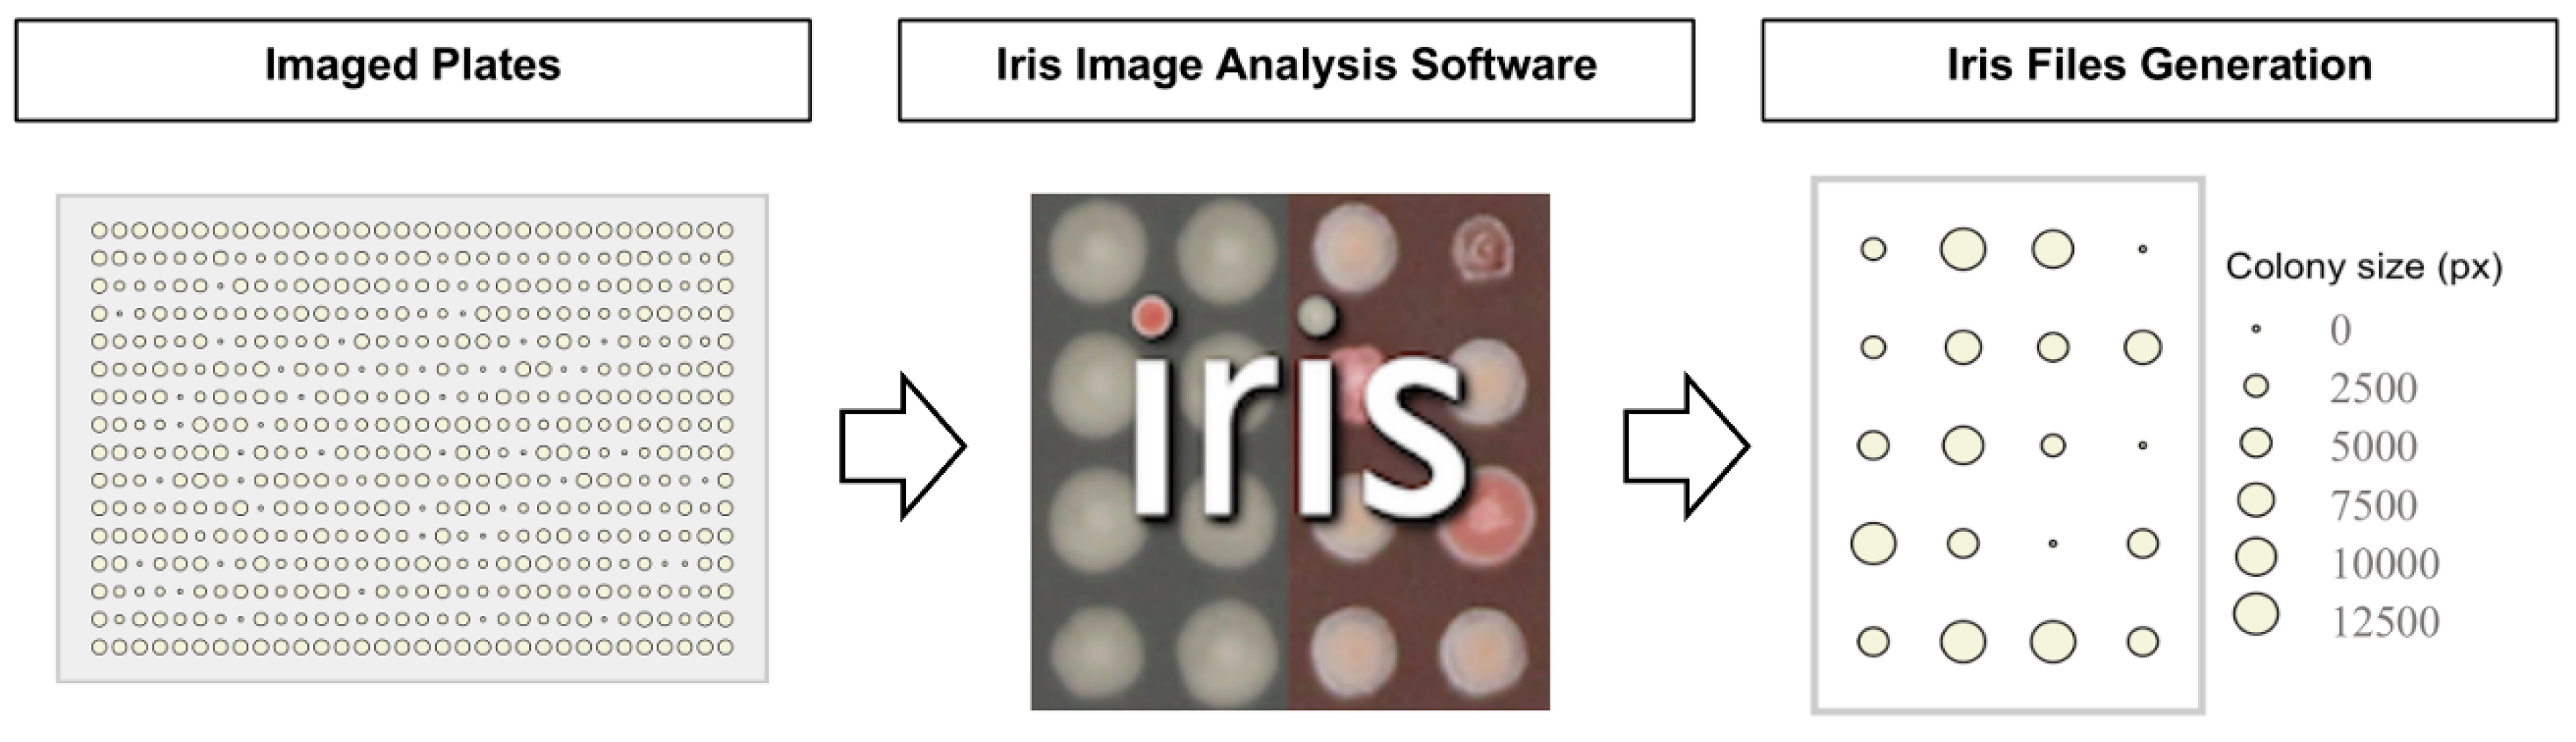
Figure 7.
Phenotypic Analysis Process. The ChemGAPP workflow begins with an optional quality control step to prepare the dataset for scoring. Following quality control, ChemGAPP generates a reproducibility plot to assess data consistency. Subsequent analysis, performed outside of ChemGAPP, involves conducting a False Discovery Rate (FDR) analysis to identify statistically significant phenotypes. Clustering analysis is used to find patterns across different strains or mutants under various conditions.
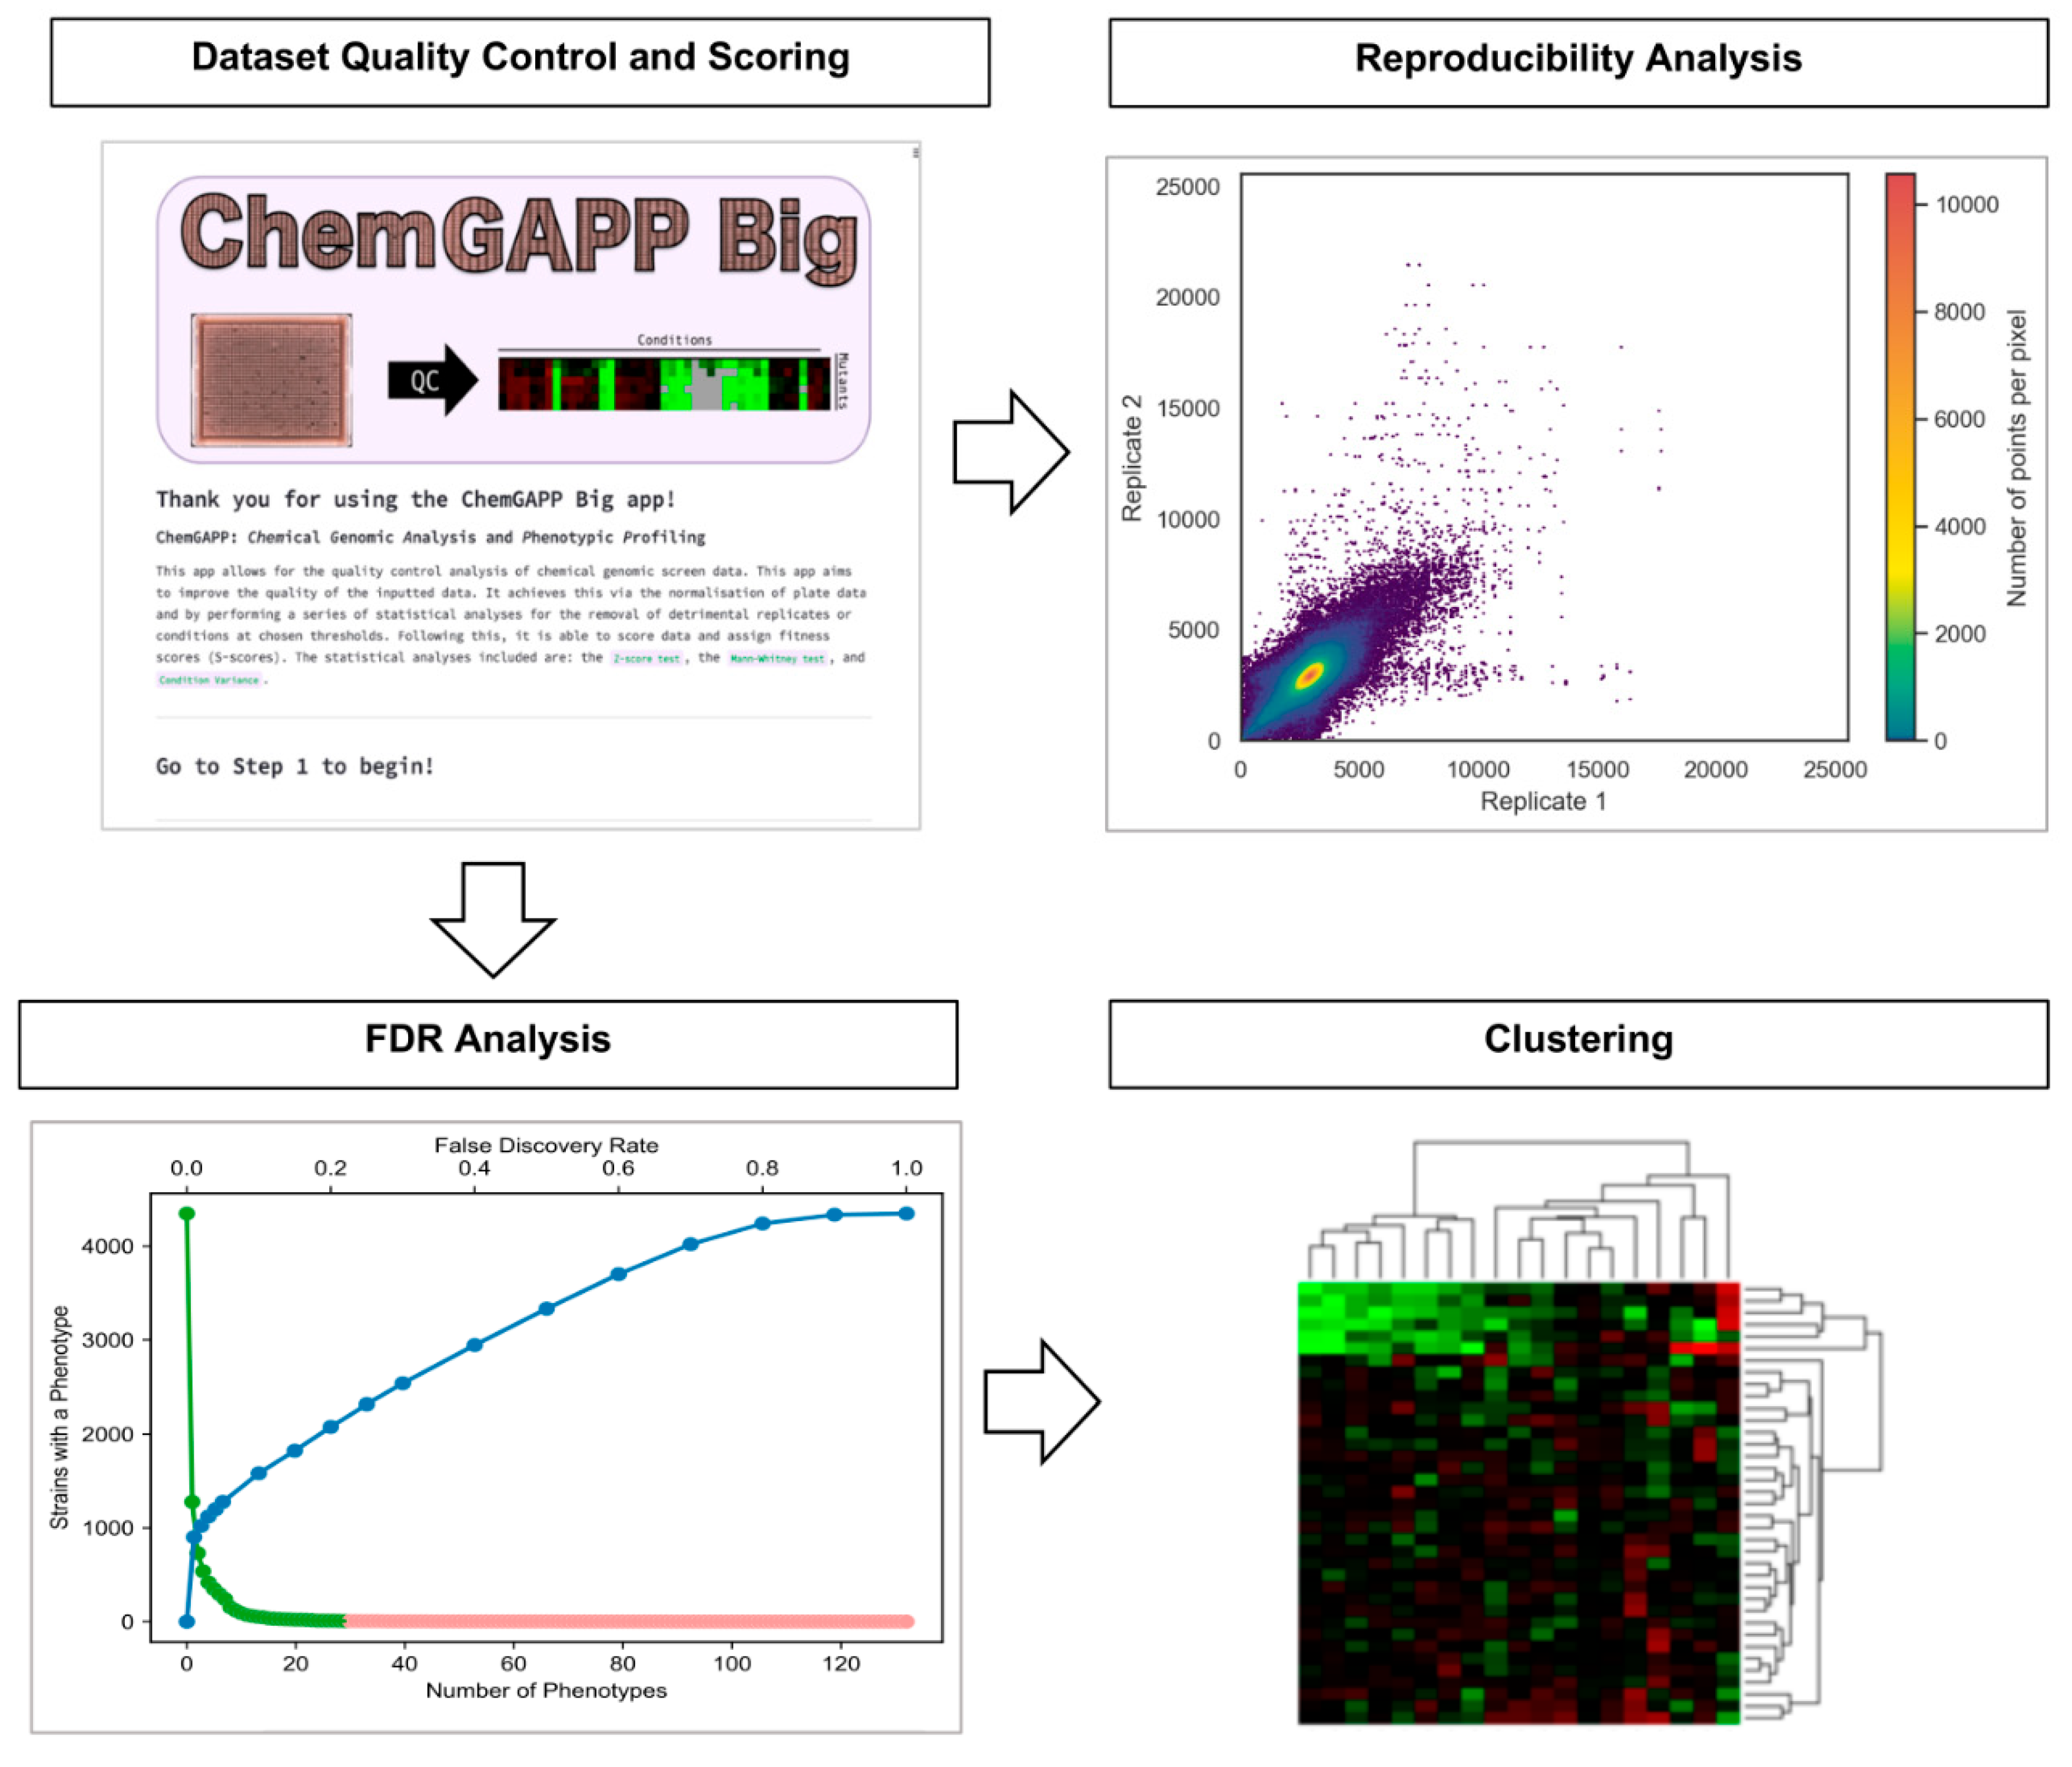
Figure 8.
Impact of bacterial colony detection when grown on unstained vs. stained plates for Iris quantification. (A) Unstained plates and limited colony detection via Iris vs. (B) stained plates (2:1 congo red and coomassie blue) and effective Iris detection. (C) Prominent noticeability of biofilm formation within certain mutants in stained plates.
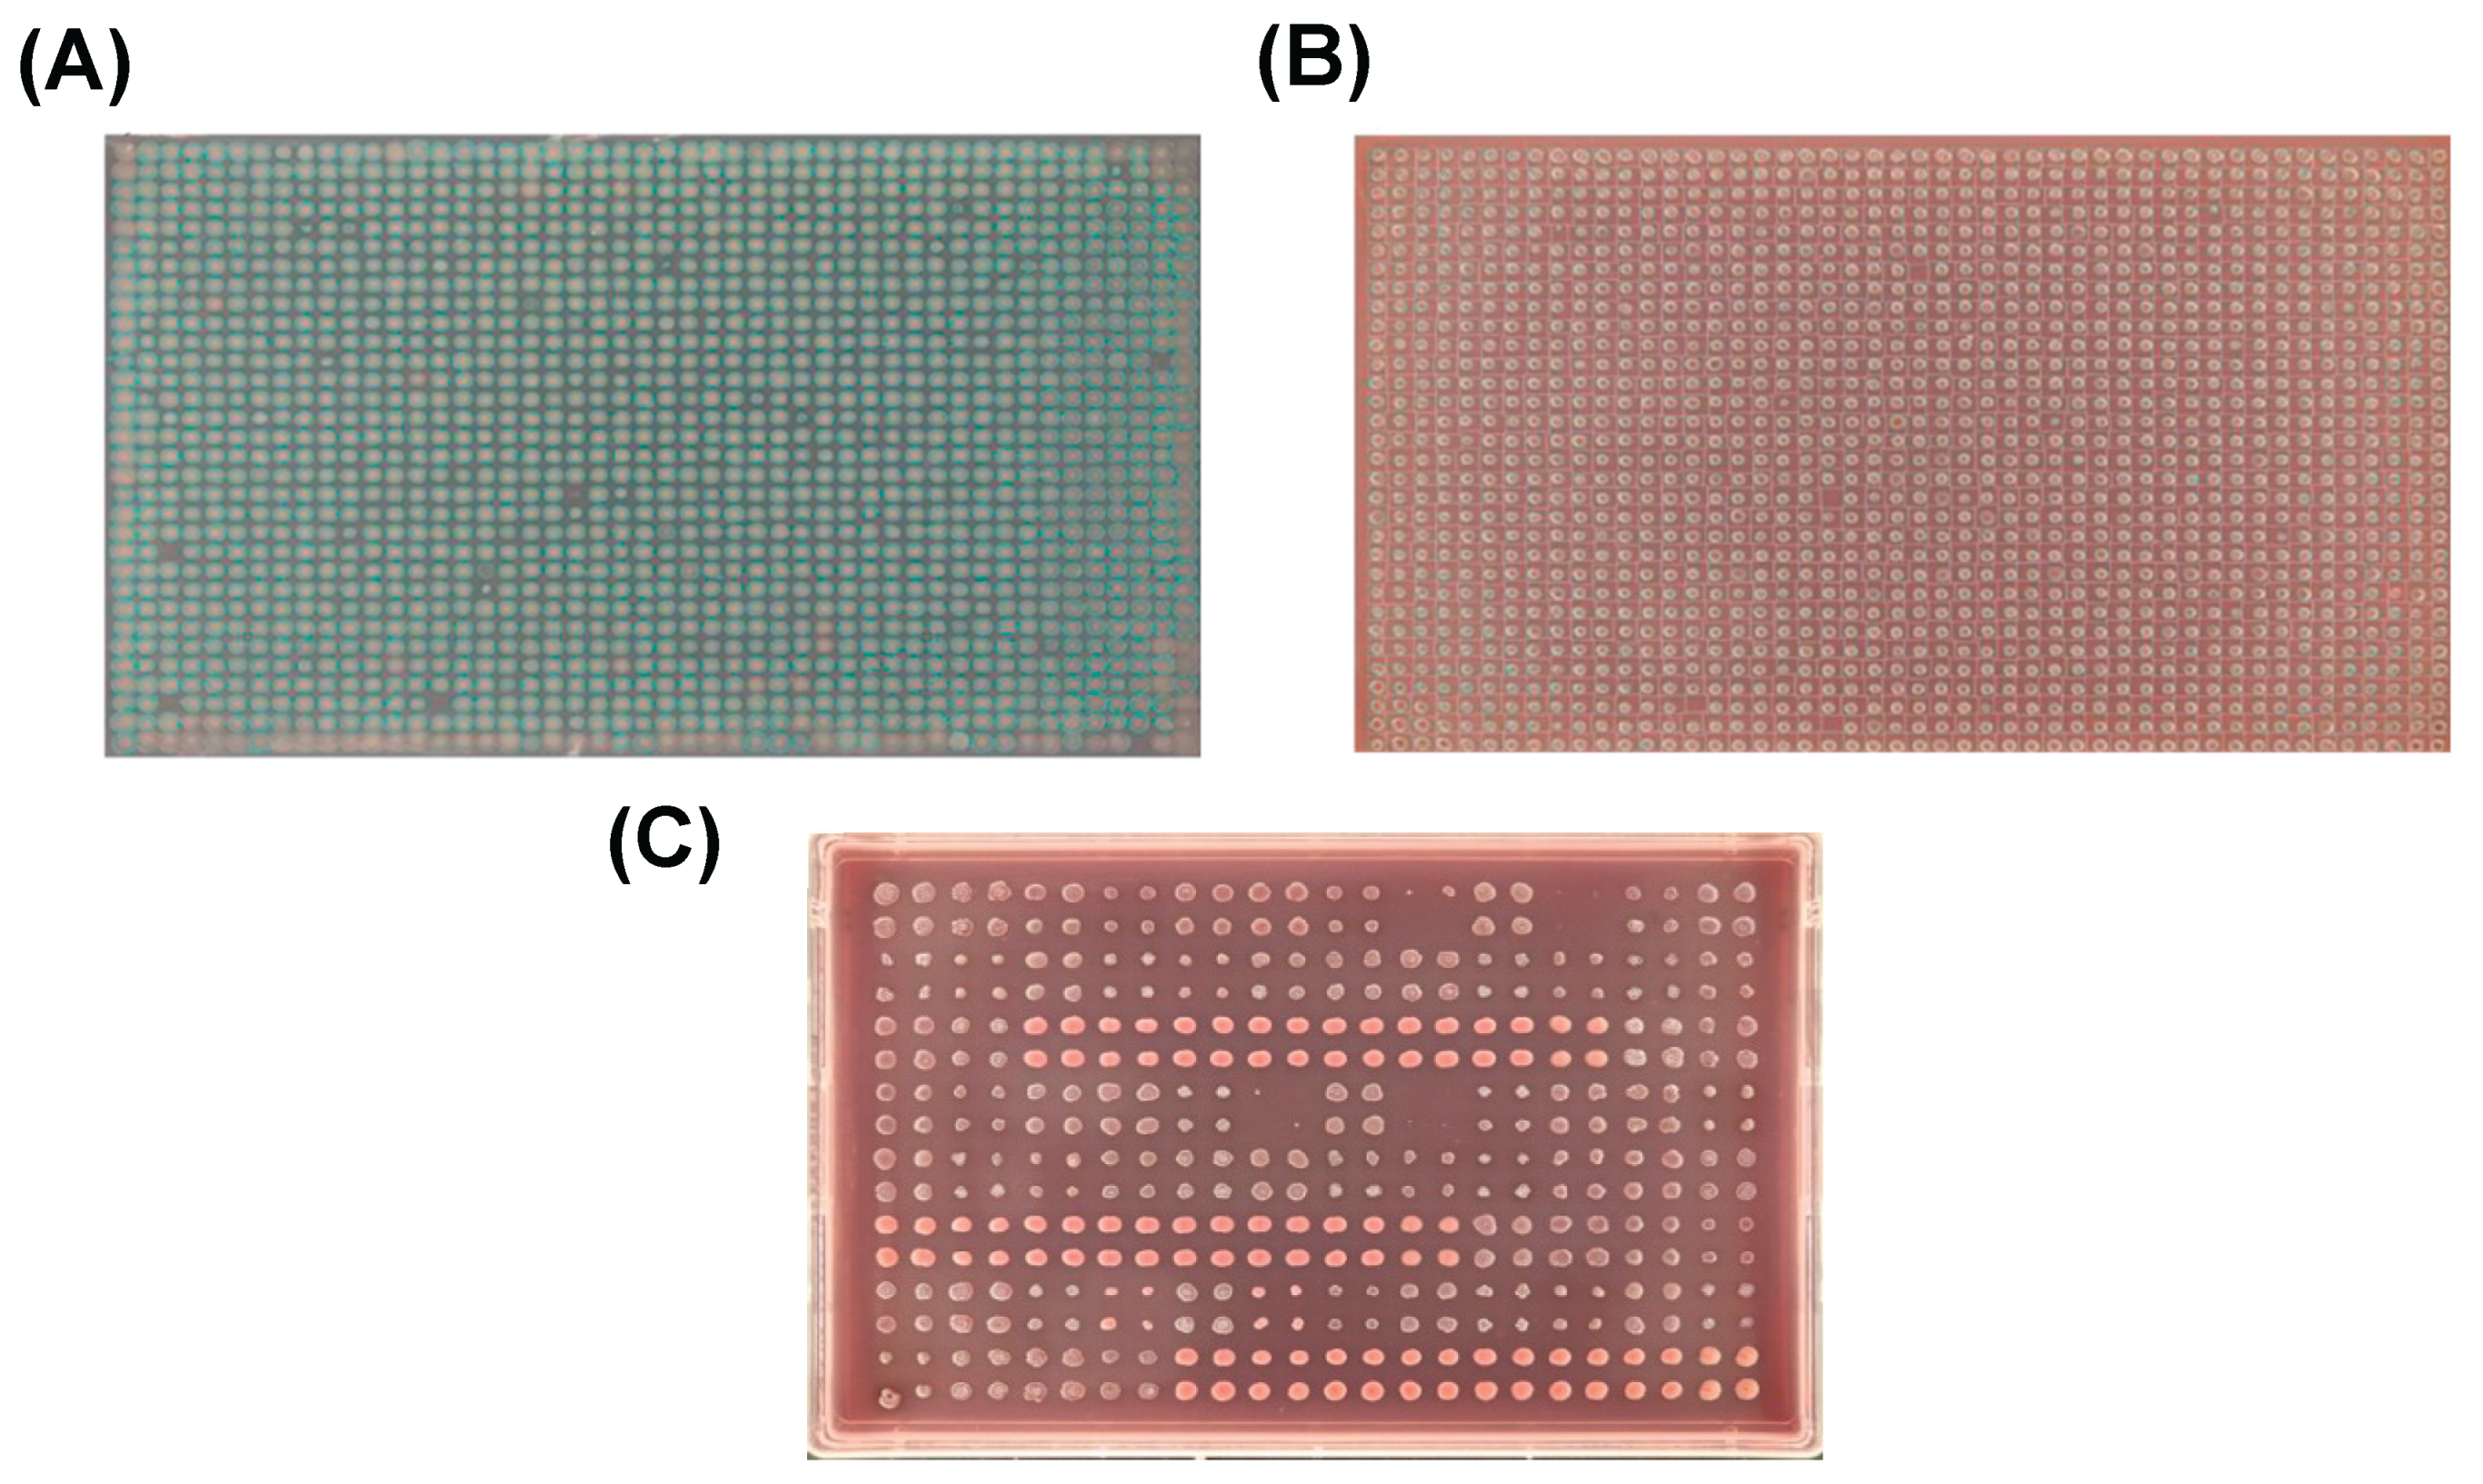

Table 1.
Troubleshooting table.
| Issue | Possible reason | Solution |
|---|---|---|
| Uneven shading across the plate. | Insufficient mixing of LB media before plate pouring. | Ensure thorough mixing of agar. It is recommended to use a magnetic stirrer. |
| Unstable agar under certain conditions. | Insufficient mixing of the condition and/or the condition is not stable within the media. Conditions can prevent the agar from solidifying such as pH and Sodium dodecyl sulphate (SDS). |
Use a magnetic stirrer and/or check and optimise the suitability of condition concentration such as adjusting the pH to ensure agar solidifies. |
| Bubbles in the agar. | Some detergents, such as SDS, have a greater tendency to form bubbles within the agar. | A flaming technique can be used to resolve this issue. |
| Fungal contamination after incubation. | High humidity in the incubator. | Use humidity-controlled incubators (max 20% humidity). Place a water tray in incubators with low humidity. Consider the use of an antifungal to decontaminate. |
| Outer edge effects of colonies & distortion. |
Increased growth at the edge of solid agar due to reduced nutrient competition. This problem is exacerbated if present on source plates. | Ensure adequate mixing of media & chemicals/dyes before plate pouring. Reduce incubation time. |
| Biofilm formation (sticky/thin glossy covering on plate). | Plates are left too long in the incubator. Species are prone to biofilm formation. Unsuitable conditions can enhance biofilm formation. Plates are too cold, affecting colony attachment. |
Reduce incubation time and/or temperature. Use broth media with higher salt content and avoid no salt conditions. Allow plates to adjust fully to room temperature before use. |
| Colonies are fusing with each other. | Plates are overgrown plates leading to cross-contamination. Incubation time is too long. |
Reduce incubation time and/or temperature. Store plates in the fridge after incubation. Ensure agar is uniformly distributed. |
| No colonies observed on plates. | Poor transfer of bacterial strains or poor pre-testing conditions. | Check library plates for growth on normal media. Verify pre-testing conditions or perform broth microdilution assays to obtain MIC values. |
| Reduced colony size. | Plates have not been incubated long enough. Condition concentrations may be too high. |
Incubate the plate for a longer time. Reduce the condition plate concentrations. |
| Colonies show swarming effects/motility. | Media is not ideal for bacteria or plates incubated for too long. | Alter the salt composition of media, shorten incubation time, or use a smaller plate format. |
Table 2.
Species-Specific Growth Characteristics and Considerations. This table summarises key growth characteristics of various bacterial species based on our group’s experience. It includes optimal growth temperature, biofilm formation tendency, growth duration, swarming motility, and storage stability of source plates. Symbols (*) indicate relative levels, with more asterisks representing a higher degree of the characteristic (e.g., stronger biofilm formation or longer growth time). The + and - symbols denote the presence or absence of a specific trait, respectively. S indicates solid and L liquid from source plate to condition plate i.e. S-L represents solid source plate to liquid condition plate replication. TBD -To Be Determined.
| Species | Biofilm Formation |
Growth Time | Motility (swarming effect) | Consistent growth on solid agar | Storage Stability of Source Plates | Plate replication | No. condition plates from source plate |
| Escherichia coli | * | ~6 hours | * | + | ** | S-S | ~11 |
| Vibrio cholerae† | ** | ~24 hours | * | + | * | S-S | ~11 |
| Pseudomonas aeruginosa | *** | ~6 hours | ** | + | *** | S-S | TBD |
| Staphylococcus aureus | TBD | ~16 hours | * | + | *** | S-S | ~10 |
| Salmonella enterica | * | ~6 hours | *** | + | *** | S-S | ~11 |
| Mycobacterium bovis BCG†† | * | ~2 weeks | * | - | ** | L-S | TBD |
| Acinetobacter baumannii | **** | **** | * | + | ** | S-S | TBD |
| Klebsiella pneumoniae | * | ~6 hours | * | - | *** | S-S L-S |
~22 |
† When imaging Vibrio cholerae, it may be difficult to visualise the colonies when grown on agar alone. It is recommended to use the biofilm assay procedure (section 4.3) to improve colony image acquisition. †† The BCG is a challenging species to work with due to its low colony replication and high doubling time. Colony replication is only possible from liquid to solid growth medium which when grown at 37 °C degrees incubation time takes approximately 9 days to grow to confluency. As a result of these long growing times, there is potential for contamination to occur. One possible solution to this is to wrap the plates in parafilm during the static incubation period.
Disclaimer/Publisher’s Note: The statements, opinions and data contained in all publications are solely those of the individual author(s) and contributor(s) and not of MDPI and/or the editor(s). MDPI and/or the editor(s) disclaim responsibility for any injury to people or property resulting from any ideas, methods, instructions or products referred to in the content. |
© 2025 by the authors. Licensee MDPI, Basel, Switzerland. This article is an open access article distributed under the terms and conditions of the Creative Commons Attribution (CC BY) license (http://creativecommons.org/licenses/by/4.0/).
Copyright: This open access article is published under a Creative Commons CC BY 4.0 license, which permit the free download, distribution, and reuse, provided that the author and preprint are cited in any reuse.


