Submitted:
14 July 2025
Posted:
16 July 2025
You are already at the latest version
Abstract
Using an intermittent SBR process with sodium acetate as additional carbon source, the combined effects of influent carbon-to-nitrogen ratio (C/N=0.8, 1.5, 2.5, 3.5, 4.5) and nitrate (NO3--N) concentration (40 and 80 mg/L labeled R40 and R80) on the nitrite (NO2--N) accumulation during the partial denitrification (PD) process were investigated at low temperatures (4 - 12 ℃), where the microbial diversity and functional bacteria evolution were also explored by high-throughput sequencing. The results showed that the 3.5-R40 and 2.5-R80 systems both presented the optimal NO2--N accumulation at temperature of 10 ℃, with the NO2--N transformation rate (NTR) of 66.89% and 76.79%, respectively. In addition, as the temperature reduced from 10 ℃ to 5 ℃, the NO2--N accumulation performance was significantly suppressed, where the average effluent NO2--N of 3.5-R40 (20.00 → 11.00 mg/L) and 2.5-R80 (43.00 → 18.90 mg/L) systems reduced by nearly half. It's worth noting that there was almost no NO2--N accumulation at C/N of 0.8, although higher NO3--N concentration promoted NTR under the same C/N ratio. The high-throughput sequencing showed that Proteobacteria and Bacteroides increased significantly from 35.31%, 18.34% to 51.69% - 60.35% and 18.08% - 35.21% as compared with the seeding sludge. Thauera and Flavobacterium as the main contributors to NO2--N accumulation accounted for 31.83% and 20.30% at the C/N ratio of 2.5 under low temperature of 5 ℃. The above discussion suggested that higher temperature (10 ℃), lower C/N ratio (2.5 - 3.5), and higher NO3--N concentration (80 mg/L) were more favorable for the stable PD formation.
Keywords:
partial denitrification
; temperature
; C/N ratio
; NO3--N concentration
; NO2--N accumulation
; functional bacteria
1. Introduction
In recent years, environmental issues have garnered increasing attention from all sectors of society, among which water resources are closely related to human survival, as such, how to treat sewage productively and energy-efficiently has become the hot issues. Biological nitrogen removal (BNR) processes effectively degrades nitrogenous compounds from wastewater and facilitates compliance with the discharge standards outlined by national policy (Thakur & Medhi 2019). Particularly, the anaerobic ammonia oxidation (Anammox) process reacts ammonia (NH4+-N, electron donor) with nitrite (NO2--N, electron acceptor) to generate nitrogen gas (N2) and nitrate (NO3--N) (Hu et al., 2024, Li et al., 2024), which manifests huge advantages such as reduced aeration, low sludge production and less carbon source addition (Wang and Yang 2022). Consequently, partial denitrification (PD, NO3--N → NO2--N) has gained considerable attention due to its role in promoting stable nitrite accumulation, which is essential for enhancing the real application of Anammox process. Studies have shown that there are a number of factors that affect PD performance, including temperature, carbon-to-nitrogen (C/N) ratio, carbon source, dissolved oxygen (DO), and pH values (Di Capua et al., 2022, Lu et al., 2023, Wu et al., 2024), etc. In these studies, all the findings indicated that PD could be utilized to enhance the traditional BNR efficiency for the upgrading and reconstruction of wastewater treatment plants (WWTPs).
Regarding the effects of temperature on PD, most scholars have focused on ambient temperatures ranging from 15 to 30 °C, revealing that this range of temperature exerts a positive impact on the NO2--N accumulation. According to Li et al., extending the hydraulic retention time (HRT) can also improve the NO3--N removal although low temperatures may impede it (Li et al., 2020), which pointed out that the denitrification rate increased gradually with the elevation in temperature. In particular, lower temperatures (15 - 17 °C) could result in oversaturated DO conditions and suppress the microbial activity associated with denitrification rates, thereby restricting the occurrence of anoxic denitrification throughout the entire operational period (Yao et al., 2013). Extreme temperature variations can induce alterations in the structural integrity of cell membranes, including lipids and proteins (Strous et al., 2006). However, few scholars have explored the NO2--N accumulation characteristics of PD at lower temperatures (Hoover et al., 2016), highlighting the importance of enhancing nitrogen removal in winter. Additionally, many scholars have investigated the impact of C/N ratio on PD performance. It was shown that for a given nitrate concentration, the peak NO2--N productions increased with higher C/N ratios (Ge et al., 2012). Moreover, the experimental data suggested an increase in both the maximum NO2--N amount and the NO2--N accumulation rate with rising NO3--N concentrations (Mohan et al., 2016). In the combined partial denitrification-anammox (PD/A) process, the nitrate removal efficiency (NRE) maintained around 89% - 90% with a mean nitrate-to-nitrite transformation ratio (NTR) of 84.43% at a C/N ratio of 2.5 (Fan et al., 2024). Hence, the factors of temperature, C/N ratio, and influent NO3--N concentration are all critical for starting the PD process and maintaining stable operation, especially in cold regions.
This study established a sequencing batch reactor (SBR) process with intermittent aeration by utilizing sodium acetate as the external carbon source, and the combined effects of C/N ratio and NO3--N concentration on PD performance under low-temperature conditions were investigated by analyzing substrate variations during both long-term operation and typical cycles. The microbial community structure was assessed through high-throughput sequencing analysis to reveal the NO2--N accumulation characteristics under different conditions, with the aim of providing theoretical foundations for the popularization and application of the PD/A process.
2. Materials and Methods
2.1. Experimental Device and Operational Mode
As shown in Figure 1a, the cylindrical PD - SBR reactor (working volume: 10 L) was operated at room temperature, and the running time stretched across November to December with the ambient temperature changing from 10 ± 2℃ to 5 ± 2℃. The reactor was fitted with a mechanical stirrer (IKA REO basic C type), while the microporous aeration was adopted at the bottom through a gas flow meter (LZB-4) combining with an air pump (ACO-6603). The experimental process, operated in an anoxic/aerobic alternating mode (Figure 1b), consisting of four cycles per day. Each operational cycle lasted 270 min, with the following duration for each stage: influent stage (15 min), anoxic stage (180 min), aerobic stage (30 min), sedimentation stage (30 min), and drainage stage (15 min). At the beginning of each cycle, 5 L of synthetic wastewater, along with appropriate amounts of NO3--N and COD were pumped into the reactor, followed by agitation under anoxic conditions for the production of NO2--N accumulation. To maintain better biological activity of sludge (Du et al., 2017a), a brief aeration period of 30 min was conducted and approximately 50 mL sludge was discharged before sedimentation to ensure that the sludge retention time (SRT) sustained around 25 days (Table 1).
2.2. Seeding Sludge and Synthetic Wastewater
The seeding sludge (SS) used in the test was obtained from the biological pond of Tangwang WWTP (China, Yangzhou), known for its effective denitrification performance. The initial mixed volatile suspended solids (VSS) of the PD - SBR reactor was kept at about 2500 mg/L (Zhang et al., 2022). The test water was artificially simulated with the carbon and nitrogen sources provided by sodium acetate (CH3COONa) and sodium nitrate (NaNO3), respectively. The reactors were categorized into two groups based on the initial NO3--N concentration: R40 (NO3--N: ~ 40 mg/L) and R80 (NO3--N: ~ 80 mg/L), and the COD concentration fluctuated within the range of 32 mg/L to 360 mg/L, giving the initial C/N ratios of 0.8, 1.5, 2.5, 3.5, and 4.5, respectively.
Moving on to the C/N ratio, R40 and R80 were further subdivided into five sorts: 0.8-R40 and 0.8-R80 (C/N=0.8), 1.5-R40 and 1.5-R80 (C/N=1.5), 2.5-R40 and 2.5-R80 (C/N=2.5), 3.5-R40 and 3.5-R80 (C/N=3.5), 4.5-R40 and 4.5-R80 (C/N=4.5), and each system was operated for 120 cycles (Table 1). Meanwhile, in order to maintain good microbial growth and metabolism, 1 mL trace element solution (per liter: 0.03 g CuSO4⋅5H2O, 0.06 g Na2MoO4⋅2H2O, 0.12 g MnCl2⋅4H2O, 0.12 g ZnSO4⋅7H2O, 0.15 g H3BO3, 0.15 g CoCl2⋅6H2O, 0.18 g KI, 1.5 g FeCl3⋅6H2O, and 10 g ethylene diamine tetraacetic acid (EDTA)) (Zhang et al., 2022) was fed into the reactor during each cycle.
2.3. Analytical Methods
All wastewater samples were filtrated through 0.45 μm filters before analysis. COD was monitored by a COD quick-analysis apparatus (LH-3C, Lanzhou, China), NO2--N was determined by N-(1-naphthyl)-ethylenediamine spectrophotometry, NO3--N was analyzed by UV spectrophotometry (U-T6), and the above determinations were made by the standard methods (AWWA 2005). The temperature was monitored by the WTW meters (WTW Multi 3420, Germany).
The removal efficiency of total nitrogen (ReTN) was calculated:
ReTN (%)= [1-(NO2--Neff+ NO3--Neff)/ (NO2--N)inf+ NO3--Ninf)]×100%
NTR and NRE were expressed by the following equations (Fan et al., 2024):
where NO3--Ninf, NO2--Ninf, NO3--Neff and NO2--Neff were the influent and effluent concentrations of NO3--N and NO2--N in the PD - SBRs, respectively, mg/L.
NTR (%)= (NO2--Neff- NO2--Ninf)/ (NO3--Ninf- NO3--Neff) ×100%
NRE (%)= (NO3--Ninf- NO3--Neff)/ NO3--Ninf×100%
2.4. High-Throughput Sequencing
The SS and five PD - SBR samples of the R80 group after the steady operation were collected for high-throughput sequencing analysis. Following the manufacturer’s instructions, DNA was extracted using the E.Z.N.A. ® Soil DNA Kit (Omega Bio-tek, Norcross, GA, USA). The NanoDrop1000 spectrophotometer was used to determine the qualitative and quantitative analysis at optical densities (OD) of 260 and 280 nm. In a sequential manner, the polymerase chain reaction (PCR) amplification was performed on an ABI GeneAmp® 9700 PCR System using primers 338F (5′-ACTCCTACGGGGAGGCAGCA-3′) and 806R (5′-GGACTACHVGGGTWTCTAAT-3′). Thereafter, the PCR products were implemented on the Illumina MiSeq PE300 platform (Personalbio Biotechnology Co., Ltd., Shanghai, China) (Zhang et al., 2022), and all the raw data were provided by Shanghai Meiji BioCloud (SRP057140).
3. Results and Discussion
3.1. Substrate Variation and Nitrite Accumulation in the Long-Term Operation
The evolutions of NO3--Ninf, NO3--Neff and NO2--Neff, NTR, and NRE at different temperatures in R40 and R80 groups were revealed and compared at given C/N ratios (0.5, 1.5, 2.5, 3.5, and 4.5) (Figure 2). All 10 PD-SBR reactors were operated for 120 cycles at room temperature, which can be categorized into two phases based on the temperature change trends: Phase Ⅰ (1 - 56 cycles) with the temperature fluctuating around 10 ± 2℃, and Phase Ⅱ (57 - 120 cycles), with the temperature maintaining at approximately 5 ± 2℃.
For the R40 systems, the average NO2--Neff values were 0.056, 4.63, 9.35, 17.07, and 13.88 mg/L in Phase I, while the concentrations were reduced to 0, 3.30, 6.28, 12.70, and 9.75 mg/L in Phase Ⅱ, respectively. Due to the sensitivity of denitrifying bacteria to temperature changes and the greater impact of temperature on PD (Du et al., 2016d), the average NO2--Neff in Phase I was higher than that in Phase Ⅱ of both R40 and R80 groups. Thereinto, the peak NTR occurred at the temperature of 9 - 10℃ in the R80 systems under all C/N ratio conditions (0.8-R80 (34.24%), 1.5-R80 (63.51%), 2.5-R80 (76.79%), 3.5-R80 (75.57%), 4.5-R80 (68.15%)), presenting the same rules with the R40 systems (0.8-R40 (4.00%), 1.5-R40 (36.17%), 2.5-R40 (44.31%), 3.5-R40 (66.89%), 4.5-R40 (66.16%)). According to previous studies, lower temperatures (<10°C) inhibited microbial activity associated with denitrification rates, thereby disrupting anoxic environment and limiting NO2--N accumulation (Yao et al., 2013). Similarly, in this study, when the temperature was lowered from 10 ℃ to 5 ℃, the NTR decreased significantly in the R40 (0.8-R40 (4.00% → 0.00%), 1.5-R40 (36.17% → 21.21%), 2.5-R40 (44.31% → 17.32%), 3.5-R40 (66.89% → 42.15%), 4.5-R40 (66.16% → 29.03%)) and R80 (0.8-R80 (34.24% → 12.94%), 1.5-R80 (63.51% → 38.19%), 2.5-R80 (76.79% → 40.21%), 3.5-R80 (76.57% → 45.76%), 4.5-R80 (68.15% → 38.07%)) groups (Figure 2). It was noteworthy that the average effluent NO2--N of the 3.5-R40 (20.00 → 11.00 mg/L) and 2.5-R80 (43.00 → 18.90 mg/L) systems was reduced by nearly half.
In addition, a positive correlation between NRE and NTR was observed, for example, in the 3.5-R40 system, NRE peaked to 66.69% at 10 ℃ but decreased to 54.99%, 47.86%, and 43.59% as the temperature dropped to 5℃, 4℃, and 3 ℃, respectively (Figure 2f), showing that the nitrogen removal efficiency was depressed with decreasing ambient temperature (Wu et al., 2024). Actually, the rate of PD denitrification was related to enzyme activities, specifically nitrate reductase (Nar) and nitrite reductase (Nir). Studies have shown that Nir was more sensitive to temperature than Nar, and Nir inhibition under high temperatures led to more NO2--N accumulation (Li et al., 2014). However, it was reported that lowering the temperature from 22°C to 14°C resulted in enhanced NO2--N accumulation along with an increase in NRE from 72.2% to 77.2% (Li et al., 2023). It was also found that the nitrite accumulation was facilitated from 60% to 75% as temperature reducing from 30°C to 20°C (Liu et al., 2022), and the PD performance could be enhanced under low temperature of 15℃ (Gao et al., 2022). Combined with the results of this experiment, it can be inferred that the PD performance was free from the negative influences of lower temperature at 10℃, but the deterioration of NO2--N accumulation and NTR occurred by lowering temperature to a certain level (<5℃).
Specifically, the average NTR values of the R40 group at the five conditions (C/N=0.5, 1.5, 2.5, 3.5, and 4.5) were much lower than those of the R80 group. Under the same influent C/N of 0.8 (Figure 2a), the average NTR and NRE were only 0.5% and 8.63% in the R40 systems, while the corresponding values reached to 19.5% and 9.16% in the R80 systems, respectively. The peak NTR was 44.31% in the 2.5-R40 system and 76.79% in the 2.5-R80 system, which was consistent with previous findings that higher NO3--N concentrations promoted nitrite accumulation at the same C/N ratio (e.g., 0.8-R40: 0.5 %; 0.8-R80: 19.16 % (Zhang et al., 2023d)). Similarly, NTR increased from 87.76% to 89.31% when NO3--N concentration climbed from 20 mg/L to 150 mg/L (Du et al., 2016d), and the possible reason has been speculated to the inhibited NO2--N reduction triggered by the unbalanced activities between Nar and Nir under higher NO3--N environment (Zhang et al., 2022). Because more NO3--N concentration will significantly increase the Nar activity and accelerate the reduction of NO3--N to NO2--N.
Moving on to the influence of C/N ratio, the mean NTR increased from 46% to 60.42% in the R80 systems, while NRE fluctuated from 24.68% to 55.75% as the C/N ratio increased from 1.5 to 3.5 (Figure 2b-d). However, when the C/N ratio continued to soar up to 4.5 (Figure 2e), the mean values of NTR and NRE exhibited a decreasing trend, measuring 56.98% and 40.55%, respectively. The above trends of NTR and NRE changed aligned with those in the R40 systems, displaying an optimal C/N range around 2.5 - 3.5. The optimal C/N ratio range of 1.5 - 3.0 was also previously proposed (Zhang et al., 2021b), and numerous scholars have shown similarly NO2--N accumulation and NTR in excess of 80% when the C/N ratio was set between 2.5 and 3.0 using sodium acetate as carbon source (Cao et al., 2016). The optimal NTR value of 45.28% - 47.50% at C/N ratios of 2.5 - 3 was also reported with a significant decline in NTR when C/N exceeded 3.5 (Li et al., 2014). These findings indicated that both excessively high and low C/N ratios were unfavorable for NTR and NRE. However, different from these conclusions, it was worth noting that it had been argued that the key factor affecting denitrification was the residual NO3--N concentration rather than C/N ratio (Le et al., 2019), which implied that stable NO2--N accumulation was virtually independent of the C/N ratio (Du et al., 2016d). In fact, except NO3--N concentration, both temperature and C/N ratio were the essential factors influencing NO2--N accumulation in PD systems. On the one hand, the low temperatures resulted in decreased microbial activity and lower reaction rates, so NO3--N and COD concentrations were more demanded than high-temperature environment (Park et al., 2017). On the other hand, better NO2--N accumulation also achieved at a relatively low temperature with higher C/N ratios of surpassing 4 (Shen et al., 2020), because the low temperature prompted an increase in the optimal C/N ratio.
3.2. Substrate Variation and Nitrite Accumulation in the Typical Cycle
The variation profiles of NO3--N, NO2--N and COD in the typical cycle at the test temperature of 10 ± 2℃ was exhibited, and the mechanism of NO2--N accumulation during the stable operation was further elaborated (Figure 3). Based on the observed changes in substrate concentration over reaction time, the denitrification process can be divided into three distinct phases: Phase i (0 - 60 min), Phase ii (60 - 180 min), and Phase iii (180 - 210 min).
On the one hand, in the R80 group, the COD utilization amounts increased from 54 mg/L to 196 mg/L when the C/N ratio varied from 0.8 to 4.5, which were much higher than the COD consumption in the R40 systems under the same C/N condition (Fig. 3a-b). This implied that the high influent NO3--N could promote the high-efficient utilization of carbon sources. Furthermore, the COD degradation rate was positively correlated with the C/N ratio in all systems (y4.5(1.30) > y3.5(1.09) > y2.5(0.91) > y1.5(0.52) > y0.8(0.05) in the R40 group (Figure 3a); y4.5(3.27) > y3.5(2.53) > y2.5 (1.96) > y1.5(1.37) > y0.8(0.89) in the R80 group (Figure 3b)). It was worth noting that 4.5-R40 (70.00 mg/L), 3.5-R80 (60.00 mg/L) and 4.5-R80 (81.00 mg/L)) showed higher COD residuals, probably due to the “carbon breakthrough “ phenomenon (Ge et al., 2012), implying that the denitrifying bacteria no longer conducted the excess COD in the denitrification stage, consequently, not all COD was utilized for NO3--N removal. As well, the theoretical and actual COD consumptions were further calculated based on the operating data (Figure 3k), in which 1.14 and 1.72 mg COD was utilized to reduce 1 mg of NO3--N to NO2--N and 1 mg of NO2--N to N2 (Zhang et al., 2023c). It was found that the actual COD consumption was generally higher than the theoretical values for all C/N ratios, especially for 4.5-R40 and 4.5-R80. It was speculated that the low temperature led to inhibited enzyme activity and reduced electron transfer, and higher C/N ratio facilitated the replenishment of energy loss for microorganisms to maintain cellular activity through endogenous respiration (Zhang et al., 2023d). However, under the lower C/N ratios (e.g., 0.8-R80 and 1.5-R80 systems), the effluent COD at 180 min (5 - 27 mg/L) was much lower with continued degradation of NO3--N, presumably owing to the possibility of sludge adsorption (Ji et al., 2025, Kotrba et al., 2001). Hence, the COD concentration exhibited a slight increasing trend (5 → 8 mg/L; 27 → 32 mg/L) after aeration (180 - 210 min) due to the secondary release of carbon adsorbed on the sludge flocs (Figure 3b).
On the other hand, obvious NO2--N accumulation (Figure 3c-d) was observed as well as significant NO3--N reduction (Figure 3e-f). During Phase i, with the addition of carbon and nitrogen sources, NO3--N concentration decreased rapidly (slopes: 0.10 - 0.47 in the R40 group; 0.14 - 0.99 in the R80 group), accompanied by the rapid NO2--N generation. The peaks of NO2--N accumulation appeared at 60 min (19.20 mg/L (3.5-R40)>16.96 mg/L (4.5-R40)>11.20 mg/L (2.5-R40)>4.14 mg/L(1.5-R40); 46.6 mg/L (2.5-R80)>39.20 mg/L( 3.5-R80)>25.20 mg/L (4.5-R80)>17.71 mg/L (1.5-R80)) in addition to 0.8-R40. Correspondingly, the highest NO2--N accumulation rates of the two groups were also found at C/N ratios between 2.5 (y2.5 = 0.17x; y2.5 = 0.83x) and 3.5 (y3.5 = 0.29x; y3.5 = 0.66x), respectively. The results were consistent with previous studies that C/N ratios of 2.5 - 3.5 favored nitrite accumulation, while increasing C/N to 3.5 or higher may result in suppressive NO2--N transformation (Yuan et al., 2013). It suggested that limited carbon sources can facilitate greater enrichment of PD denitrifying bacteria (Takeda et al., 2024, Zhang et al., 2021a) although extreme low C/N ratio (e.g., 0.8) may inhibit microbial growth or colonization (Peng et al., 2021). At Phase ii, the two groups were accompanied by a significant decrease in NO2--N concentration with the slopes changing around 0.001 - 0.045 (R40) and 0.001 - 0.148 (R80), indicating that the excessive NO2--N was gradually denitrified to N2 as an electron acceptor (Park et al., 2017). Obviously, NO2--N was almost non-existent at the C/N ratio of 0.8, and studies have shown that insufficient carbon source led to bacterial lysis and death, which deteriorated the PD performance (Fu et al., 2022). As for Phase iii, the concentrations of NO3--N and NO2--N in all reactors were basically unchanged, confirming that the nitrifying bacteria (especially NO2--N-oxidizing bacteria, NOB) had been swept out during the short aeration (Zhang et al., 2022).
From the perspectives of TN (Figure 3g-h) and ReTN variations (Figure 3i-j), the denitrification patterns of the two groups were comparable, and TN removal mainly concentrated in Phases i and ii (0 - 180 min). In Phase iii (180 - 210 min), the TN concentrations were overall unchanged. For the R80 systems, the effluent TN concentrations were 71.73. 70.50, 44.90, 34.50, and 37.50 mg/L, corresponding to ReTN of 13.1%, 14.6%, 46.1%, 56.8%, and 53.8% with the comparisons of R40 systems (e.g., 13.3% (C/N=0.8), 39.9% (C/N=1.5), 56.3% (C/N=2.5), 51.1% (C/N=3.5), and 53.5% (C/N=4.5)). Generally, the denitrification performance was greatly enhanced when the influent C/N ratio increased from 0.8 to 3.5 - 4.5. It was supposed that the influent carbon source was relatively insufficient at C/N ratios of 1.5 - 2.5 especially in the R80 systems, contributing to lower ReTN but higher nitrite accumulation (Zhang et al., 2022). Conversely, under higher C/N ratios of 2.5 - 3.5, the overall performance was relatively remarkable, despite of slight differences in NO2--N accumulation and ReTN, which demonstrated that the effective denitrification system could be carried out only when the carbon source was sufficient (Xu et al., 2018). Besides, the correlation analysis (Figure 3l) revealed that the C/N ratio was positively with NO2--N concentration (r=0.50, p < 0.01), NTR (r=0.63, p < 0.01) and NRE (r=0.67, p < 0.01), conforming to the superior PD performance in the 3.5-R40 and 2.5-R80 systems (Figure 2 and Figure 3). Notably, temperature showed an unconspicuous correlation with NTR (r=0.31, p < 0.01) and NRE (r=0.25, p < 0.01), suggesting a strong shock resistance ability to environmental factors.
3.3. Species Diversity
The smoothest SS curve implied the highest microbial diversity (Figure 4a), while the steepest curve at the C/N ratio of 2.5 represented the lowest biodiversity (Zhang et al., 2022). Microbial diversity suggested that the sludge diversity in the PD - SBR reactors had been changed through the cultivation with different influent C/N ratios. The clustering analysis (Figure 4b) demonstrated that at a 0.97 similarity threshold (Zhang et al., 2021b), the species composition for C/N ratio of 2.5 - 3.5 was most similar, with similarity distance coefficients (SDC) of 0.22, equating to the similarity of 78%. In particular, data from the typical cycle (Figure 3) showed that NO2--N accumulation under these conditions were closely aligned. In contrast, when the C/N ratios were 0.8 and 1.5, the sludge samples exhibited the most similarity with SS species composition, with a distance coefficient of 0.43, corresponding to 57% similarity. The operational taxonomic units (OTUs) in the overlapping portions of the Venn diagrams (Figure 4c) represented the species number that were common to the different samples, while non-overlapping portions symbolized the species number that were unique to the corresponding samples (Ji et al., 2025, Zhang et al., 2024). The commom number of OTUs for the five samples was 514, which accounted for 27.35% (SS), 37.35% (C/N=0.8), 38.36 (C/N=1.5), 55.15% (C/N=2.5), 47.46% (C/N=3.5), and 53.65% (C/N=4.5) in the respective samples. However, the individual number of OTUs being unique to the samples, were 1275 (SS), 862 (C/N=0.8), 826 (C/N=1.5), 418 (C/N=2.5), 569 (C/N=3.5), and 444 (C/N=4.5), implying that the continuous enrichment of unique genera with higher microbial aggregation especially at C/N=2.5.
Combined with the microbial diversity index presented in Table 2, the sequence range of all samples fell between 44032 and 60472, with 932 - 1,879 OTUs obtained by clustering valid sequences at 97% similarity. Although the coverage of each sample exceeded 0.99, the abundance and diversity of sludge samples varied significantly compared to SS. Overall, the microbial diversity decreased across the five reactors, as confirmed by different diversity indices. Specifically, Chao and ACE for community richness declined from 2084 and 2052 to ranges of 1296 - 1752 and 1276 - 1727, respectively. Additionally, Shannon and Simpson for community diversity (Du et al., 2019) also shifted considerably, with the minimum Shannon value of 3.81 and the maximum Simpson value of 0.095 at C/N = 2.5, proving that the microbial richness was at its lowest. The above results also coincided with the changes of OTUs illustrated in Figure 4.
3.4. Dominant Microbial Community
The microbial distribution of functional bacteria in each sludge sample at temperature of 3 - 12 ℃ was compared at both phylum and genus levels (Figure 5). Compared to SS, the proportions of Proteobacteria and Bacteroidetes, the two dominant phyla, increased from 35.31%, 18.34% to 51.69% - 60.35% and 18.08% - 35.21%, respectively. This shift resulted in an enhancement of sludge denitrification performance and improved the conversion rates of NO3--N to NO2--N, while Chloroflexi capable of oxidizing NO2--N to NO3--N reduced from 8.42% to 1.47% - 3.95% (Figure 5a). Another phylum, Myxococcota, which is unfavorable for NO2--N accumulation (Zhang et al., 2023a), also decreased significantly with the increasing C/N ratio, dropping from 2.10% (SS) to 0.17% (C/N=4.5). Additionally, Patescibacteria (1.27% - 0.38%), Actinobacteria (2.95% - 0.53%), Firmicutes (3.97% - 0.15%), and Acidobacteria (14.70% - 1.74%) all of which play vital roles in degrading carbohydrates during heterotrophic metabolism (He et al., 2018), exhibited a significant decreasing trend under all working conditions compared to SS.
Significant differences were observed at genus level across the six samples (Figure 5b and Figure 5d), where Thauera known as denitrifying bacteria that stably maintain NO2--N accumulation (Du et al., 2017a), accounted for a relatively high percentage of 19.31% - 31.83% (C/N=0.8 - 4.5) than SS (0.87%). Thauera enrichment was associated with the inhibition of NO2--N reduction (Du et al., 2016d) due to denitrifying enzyme synthesis at different electron acceptors (NO3--N and NO2--N). The macro-genomic analyses showed that the abundance of NO3--N reductase (Nar: NO3--N → NO2--N) was higher than that of NO2--N reductase (Nir: NO2--N → NO) in Thauera (Qian et al., 2019). Moreover, Nar was more competitive than Nir for electron donors during denitrification, highlighting the strong influence of C/N ratio on the activities of Nar and Nir (Zhang et al., 2024). At lower C/N ratios, Nar preferentially utilized the carbon source to reduce NO3--N, which inhibited Nir due to insufficient carbon access and resulted in NO2--N accumulation. Conversely, at higher C/N ratios, where carbon sources were sufficient, Nir could also access adequate carbon capacity, reducing the likelihood of NO2--N accumulation. Flavobacterium exhibited similar denitrifying properties to Thauera (Chen et al., 2020, Králová 2017, Zhang et al., 2024) and also proliferated in the reactors, increasing from 0.31% (SS) to 0.42% - 20.85% (C/N=0.8 - 4.5). In particular, at C/N ratio of 2.5, the two genera accounted for 31.83% and 20.30%, respectively, confirming the earlier findings that better NO2--N accumulation was achieved (Figure 2 and Figure 3).
It was noteworthy that Flavobacterium showed better denitrification ability and strong adaptability to cold climates (Králová 2017), and its abundance reached to 20.30% and 20.85% at C/N ratios of 2.5 and 4.5, respectively, which significantly higher than the other reactors (ranged from 0.31% to 13.94%). It was also found that Flavobacterium was more effective to generate NO2--N in cold conditions, and its abundance increased to 16.6% when the temperature reduced from 32 °C to 5 °C (Chen et al., 2020). Considering the ambient temperature changes in this experiment, it was hypothesized that the low-temperature environment (5 - 10°C) accelerated the enrichment of Flavobacterium, which was the key factor in the enhanced PD performance observed at C/N ratio of 2.5 (Figure 2 and Figure 3). Besides, Saprospiraceae, Comamonadaceae and Terrimonas, which play key roles in the denitrification process, accounted for 3.03% - 5.01%, 3.07% - 8.20%, and 2.66% - 3.62%, respectively. The genera Ferruginibacter and Simplicispira, primarily involved in the degradation of organic matter (Chen et al., 2020), changed from 0.73%, 0.02% to 5.64% and 7.73%. Zoogloea, which is vital for bioconcentration and sludge granulation (Zhang et al., 2020), also showed better enrichment at C/N ratios of 0.8 and 1.5 with the abundances achieving at 5.66% and 3.66%, implying the COD release triggered by sludge adsorption (Figure 3b). Meanwhile, the results indicated that the genus of Zoogloea could also maintain a good biological activity at low C/N ratios.
3.5. Application Feasibility of PD Related Processes
Currently, PD is the most common method to achieve NO2--N accumulation in wastewater treatment, offering many advantages over conventional BNR processes. As shown in Figure 6a, PD often combined with the Anammox process, creating a new application prospect with outstanding advantages of higher economic value (e.g., stable NO2--N production, high NO3--N removal, low carbon consumption) and environmental benefit (e.g., reduced greenhouse gas, low sludge production) (Fan et al., 2024, Le et al., 2019). However, it still faces many technical challenges in terms of long start-up cycle, microbial activity inhibition, unstable NO2--N production, and low treatment efficiency. Typically, the transcription and translation levels were suppressed with reduced metabolism-related enzyme activities at low temperatures (Zhen et al., 2021).
In practical engineering, napA and narG genes were important factors for NO2--N accumulation in the PD process, and the relative abundance of narG gene decreased with increasing reaction temperature from 10 - 52 °C (Liao et al., 2018). Hence, at lower temperatures, denitrification was less competitive for NO2--N generation (Wang et al., 2018) and the nirS, nirK genes that further converting NO2--N to NO were hindered, except a substantial increase in functional genes of narG and napA (Peng et al., 2023). Taken together, it can be concluded that the essential reasons for the higher NTR and NO2--N accumulation at higher temperature were the stimulant functional genes of narG and napA accompanied by restrained abundances of nirS and nirK. However, it was also found that the repression degree of narG, nirS and nirK was unequal with the temperature decreasing from 30°C to 5°C although more severe inhibition of nirS and nirK promoted better NTR (Peng et al., 2023), which was not consistent with the observations of present experiments. Meanwhile, it has also been recently found that narG abundance decreased and napA abundance increased when the temperature decreased from 25°C to 15 °C, suggesting that napA genes gradually prevailed in low-temperature environments (Gong et al., 2025). However, the potential mechanism of temperature effect on transcribed gene needs to be further investigated.
Furthermore, a summary of how temperature, C/N ratio and NO3--N concentration affecting PD performance in relation to NO2--N buildup was provided (Table 3). It was found that NTR reached to 71.7% at a temperature of about 22 ℃ under the C/N ratio of 2.5 (Gong et al., 2013b), and the value rose to 83.3% when the temperature was increased to 23.6 - 28.8 °C (Du et al., 2017b). As a contrast, at the same C/N ratio (2.5), NTR at lower temperatures (3 - 12°C) was 76.79% in the present study (R80 system) but it changed to 68.15% - 75.57% as the C/N ration rose to 3.5 - 4.5. Consisting with the results of our study, the PD process presented a high NTR of 80% at the C/N ratio of 3.0 under temperatures between 16 - 28℃ (Du et al., 2016d), however, NTR declined to 57.5% when the temperature dropped to 10.6 - 18.3℃ (Du et al., 2016a). In addition to high temperature, suitable carbon source, lower C/N ratio and higher NO3--N concentration were also the key factors to obtain stable NO2--N production (Zhang et al., 2023d), and many studies have reached similar conclusions that NTR was around 80% when the C/N ratio was set between 2.5 and 3.0 using acetate as a carbon source (Du et al., 2016d, Du et al., 2017b, Gong et al., 2013b). In the case of glycerol, the peak NTR of 72.5% was attained at a C/N ratio of 2.6 (Matthew et al., 2017), showing the importance of carbon source type (Zhang et al., 2024). Even so, conventional denitrification processes required a higher C/N of 4.0 - 6.0 (Nancharaiah and Venugopalan 2011), which significantly increased the carbon demand and operating cost of low C/N ratio wastewater treatment. Moreover, the industrial products often generated significant amounts of high-strength NO3--N wastewater (Mohan et al., 2016), which typically relied on traditional BNR technologies that were costly with limited applicability. As shown in Figure 6b, one-stage and two-stage PD/A systems were regarded as the two important approaches to treat NO3--N rich and domestic wastewater simultaneously (Du et al., 2017a, Gao et al., 2022), where the oxygen demand, carbon source requirement and sludge production could be reduced by 31.07%, 89.86%, and 81.65% when compared with the traditional nitrification-denitrification (Zhang et al., 2023b). For real application, the two-stage PD/A process often showed prominent advantages under low-temperature operation (Du et al., 2016a), since the separate regulation of two reactors was more suitable to resist changes in environmental factors for low C/N ratio wastewater treatment.
In addition, systems treating wastewater with elevated influent NO3--N concentrations (30 - 400 mg/L) (Du et al., 2017b) exhibited significantly superior NTR compared to those with lower NO3--N levels. In this study, the PD performance of the R80 group also outperformed that of the R40 group (Figure 2 and Figure 3). Previous research corroborated that when influent NO3--N concentration was increased from 29.5 mg/L to 64.9 mg/L, the optimal NO2--N accumulation correspondingly rose from 18.9 mg/L to 37.8 mg/L (Sun et al., 2009). The reason may be attributed to the fact that the higher NO3--N concentration provided more sufficient electron acceptors (Zhang et al., 2023d) to promote the metabolic activity of PD denitrifying bacteria by inhibiting the degradation rate of NO3--N. To sum up, these results indicated that moderately elevating influent NO3--N concentration or nitrate loading rates (NLR) enhanced the stability of PD systems (Cao et al., 2019), which could effectively alleviate the inhibition effect of low temperature, providing a new operation strategy of PD processes for low temperature conditions. Even so, there is a pressing need to explore additional effective control strategies of PD/A process, as well as to investigate the impacts of heavy metals, antibiotics, and other substances on microbial activity.
4. Conclusions
The NO2--N accumulation and NTR performance were markedly suppressed as the temperature decreased from 10 °C to 5 °C, which may be due to the suppression of narG gene transcription at low temperatures. The 3.5-R40 and 2.5-R80 systems demonstrated the optimal PD efficiency, and elevated influent NO3--N concentration effectively alleviated the inhibition effect of low temperature. Notably, the PD performance of the R80 group surpassed that of the R40 group in both long-term operation and typical cycles, which was attributed to the preferential utilization of abundant electron acceptors by Nar, thereby accelerating the reduction of NO3--N to NO2--N. The optimal C/N ratio range of 2.5 - 3.5 promoted the enrichment of distinct bacterial taxa with higher aggregation levels (932 - 1083 OTUs), predominantly within the phyla of Proteobacteria and Bacteroidetes. Specifically, the enrichment of Thauera and Flavobacterium played a pivotal role in NO2--N accumulation, contributing to the enhanced PD performance especially under low-temperature conditions.
Acknowledgments
This research was financially supported by the Research and Development Project of Jiangsu Environmental Engineering Technology Co., Ltd. (Research and Application of Wetland Green Substrate Products Based on the Resource Utilization of Construction Waste, Grants No. JSEP-GJ20220011-RE-ZL) (China).
References
- AWWA. Standard Methods for the Examination of Water and Wastewater, 21st ed.; American Water Works Association, 2005. [Google Scholar]
- Cao, S.; Li, B.; Du, R.; Ren, N.; Peng, Y. Nitrite production in a partial denitrifying upflow sludge bed (USB) reactor equipped with gas automatic circulation (GAC). Water Research 2016, 90, 309–316. [Google Scholar] [CrossRef]
- Cao, S.; Peng, Y.; Du, R.; Zhang, H. Characterization of partial-denitrification (PD) granular sludge producing nitrite: Effect of loading rates and particle size. Science of The Total Environment 2019, 671, 510–518. [Google Scholar] [CrossRef] [PubMed]
- Chen, K.; Zhang, L.; Sun, S.; Li, J.; Jia, T.; Peng, Y. In situ enrichment of anammox bacteria in anoxic biofilms are possible due to the stable and long-term accumulation of nitrite during denitrification. Bioresource Technology 2020, 300, 122668. [Google Scholar] [CrossRef] [PubMed]
- Di Capua, F.; Iannacone, F.; Sabba, F.; Esposito, G. Simultaneous nitrification-denitrification in biofilm systems for wastewater treatment: Key factors, potential routes, and engineered applications. Bioresource Technology 2022, 361, 127702. [Google Scholar] [CrossRef]
- Du, R.; Cao, S.; Li, B.; Niu, M.; Wang, S.; Peng, Y. Performance and microbial community analysis of a novel DEAMOX based on partial-denitrification and anammox treating ammonia and nitrate wastewaters. Water Research 2017a, 108, 46–56. [Google Scholar] [CrossRef]
- Du, R.; Cao, S.; Niu, M.; Li, B.; Wang, S.; Peng, Y. Performance of partial-denitrification process providing nitrite for anammox in sequencing batch reactor (SBR) and upflow sludge blanket (USB) reactor. International Biodeterioration & Biodegradation 2017b, 122, 38–46. [Google Scholar]
- Du, R.; Cao, S.; Peng, Y.; Zhang, H.; Wang, S. Combined Partial Denitrification (PD)-Anammox: A method for high nitrate wastewater treatment. Environment International 2019, 126, 707–716. [Google Scholar] [CrossRef]
- Du, R.; Cao, S.; Wang, S.; Niu, M.; Peng, Y. Performance of partial denitrification (PD)-ANAMMOX process in simultaneously treating nitrate and low C/N domestic wastewater at low temperature. Bioresource Technology 2016a, 219, 420–429. [Google Scholar] [CrossRef]
- Du, R.; Peng, Y.; Cao, S.; Li, B.; Wang, S.; Niu, M. Mechanisms and microbial structure of partial denitrification with high nitrite accumulation. Applied Microbiology and Biotechnology 2016b, 100, 2011–2021. [Google Scholar] [CrossRef]
- Fan, Y.; Zhang, M.; Li, B.; Cheng, J.; Wu, J.; He, C. Nitrogen degradation performance and microbial dynamic analysis for the efficient combination of partial denitrification and anammox (PD/A) process. Journal of Environmental Chemical Engineering 2024, 12, 112002. [Google Scholar] [CrossRef]
- Fu, X.; Hou, R.; Yang, P.; Qian, S.; Feng, Z.; Chen, Z.; Wang, F.; Yuan, R.; Chen, H.; Zhou, B. Application of external carbon source in heterotrophic denitrification of domestic sewage: A review. Science of The Total Environment 2022, 817, 153061. [Google Scholar] [CrossRef]
- Gao, R.; Peng, Y.; Li, J.; Liu, Y.; Deng, L.; Li, W.; Kao, C. Mainstream partial denitrification-anammox (PD/A) for municipal sewage treatment from moderate to low temperature: Reactor performance and bacterial structure. Science of The Total Environment 2022, 806, 150267. [Google Scholar] [CrossRef] [PubMed]
- Ge, S.; Peng, Y.; Wang, S.; Lu, C.; Xu, C.; Zhu, Y. Nitrite accumulation under constant temperature in anoxic denitrification process: The effects of carbon sources and COD/NO3-N. Bioresource Technology 2012, 114, 137–143. [Google Scholar] [CrossRef] [PubMed]
- Gong, L.; Huo, M.; Yang, Q.; Li, J.; Ma, B.; Zhu, R.; Wang, S.; Peng, Y. Performance of heterotrophic partial denitrification under feast-famine condition of electron donor: A case study using acetate as external carbon source. Bioresource Technology 2013, 133, 263–269. [Google Scholar] [CrossRef] [PubMed]
- Gong, Q.; Zeng, W.; Hao, X.; Wang, Y.; Peng, Y. DNA stable isotope probing and metagenomics reveal temperature responses of sulfur-driven autotrophic partial denitrification coupled with anammox (SPDA) system. Water Research 2025, 280, 123494. [Google Scholar] [CrossRef]
- He, Q.L.; Song, Q.; Zhang, S.L.; Zhang, W.; Wang, H.Y. Simultaneous nitrification, denitrification and phosphorus removal in an aerobic granular sequencing batch reactor with mixed carbon sources: reactor performance, extracellular polymeric substances and microbial successions. Chemical Engineering Journal 2018, 331, 841–849. [Google Scholar] [CrossRef]
- Hoover, N.L.; Bhandari, A.; Soupir, M.L.; Moorman, T.B. Woodchip Denitrification Bioreactors: Impact of Temperature and Hydraulic Retention Time on Nitrate Removal. Journal of Environmental Quality 2016, 45, 803–812. [Google Scholar] [CrossRef]
- Hu, J.; Qian, F.; Li, X.; Tang, Y.; Zhu, C.; Fu, J.; Wang, J. Rapid start-up and operational characteristics of partial denitrification coupled with anammox driven by innovative strategies. Science of the Total Environment 2024, 927, 172442. [Google Scholar] [CrossRef]
- Ji, J.; Zhao, Y.; Wu, G.; Hu, F.; Yang, H.; Bai, Z.; Jin, B.; Yang, X. Responses of endogenous partial denitrification process to acetate and propionate as carbon sources: Nitrite accumulation performance, microbial community dynamic changes, and metagenomic insights. Water Research 2025, 268, 122680. [Google Scholar] [CrossRef]
- Kotrba, P.; Inui, M.; Yukawa, H. Bacterial phosphotransferase system (PTS) in carbohydrate uptake and control of carbon metabolism. Journal of Bioscience and Bioengineering 2001, 92, 502–517. [Google Scholar] [CrossRef]
- Králová, S. Role of fatty acids in cold adaptation of Antarctic psychrophilic Flavobacterium spp. Systematic and Applied Microbiology 2017, 40, 329–333. [Google Scholar] [CrossRef]
- Le, T.; Peng, B.; Su, C.; Massoudieh, A.; Torrents, A.; Al-Omari, A.; Murthy, S.; Wett, B.; Chandran, K.; DeBarbadillo, C. Impact of carbon source and COD/N on the concurrent operation of partial denitrification and anammox. Water Environment Research 2019, 91, 185–197. [Google Scholar] [CrossRef] [PubMed]
- Li, W.; Li, X.; Li, J.; Gao, R.; Kao, C.; Zhang, Q.; Hou, X.; Peng, Y. Improved nitrogen removal performance by enhanced denitratation/anammox as decreasing temperature for municipal wastewater treatment. Resources, Conservation and Recycling 2023, 190, 106869. [Google Scholar] [CrossRef]
- Li, W.; Li, X.; Zhang, Q.; Kao, C.; Hou, X.; Peng, Y. Recent advances of partial anammox by controlling nitrite supply in mainstream wastewater treatment through step-feed mode. Science of the Total Environment 2024, 912. [Google Scholar] [CrossRef]
- Li, W.; Zheng, P.; Guo, J.; Ji, J.Y.; Zhang, M.; Zhang, Z.H.; Zhan, E.C.; Abbas, G. Characteristics of self-alkalization in high-rate denitrifying automatic circulation (DAC) reactor fed with methanol and sodium acetate. Bioresource Technology 2014, 154, 44–50. [Google Scholar] [CrossRef]
- Li, Y.; Wang, Y.; Wan, D.; Li, B.; Zhang, P.; Wang, H. Pilot-scale application of sulfur-limestone autotrophic denitrification biofilter for municipal tailwater treatment: Performance and microbial community structure. Bioresource Technology 2020, 300, 122682. [Google Scholar] [CrossRef] [PubMed]
- Liao, R.; Miao, Y.; Li, J.; Li, Y.; Wang, Z.; Du, J.; Li, Y.; Li, A.; Shen, H. Temperature dependence of denitrification microbial communities and functional genes in an expanded granular sludge bed reactor treating nitrate-rich wastewater. Rsc Advances 2018, 8, 42087–42094. [Google Scholar] [CrossRef]
- Liu, Q.; Peng, Y.; Zhao, Y.; Zhao, Q.; Li, X.; Zhang, Q.; Sui, J.; Wang, C.; Li, J. Excellent anammox performance driven by stable partial denitrification when encountering seasonal decreasing temperature. Bioresource Technology 2022, 364, 128041. [Google Scholar] [CrossRef]
- Lu, X.; Oehmen, A.; Zhao, J.; Duan, H.; Yuan, Z.; Ye, L. Insights on biological phosphorus removal with partial nitrification in single sludge system via sidestream free ammonia and free nitrous acid dosing. Science of the Total Environment 2023, 895, 165174. [Google Scholar] [CrossRef]
- Matthew, B.; Chenghua, L.; Luke, P.; Jeffrey, S.; Michael, B.; Kartik, C. Optimization of partial denitrification to maximize nitrite production using glycerol as an external carbon source – impact of influent COD:N ratio. Proceedings of the Water Environment Federation 2017, 2017, 1356–1360. [Google Scholar] [CrossRef]
- Mohan, T.V.K.; Nancharaiah, Y.V.; Venugopalan, V.P.; Sai, P.M.S. Effect of C/N ratio on denitrification of high-strength nitrate wastewater in anoxic granular sludge sequencing batch reactors. Ecological Engineering 2016, 91, 441–448. [Google Scholar] [CrossRef]
- Nancharaiah, Y.V.; Venugopalan, V.P. Denitrification of synthetic concentrated nitrate wastes by aerobic granular sludge under anoxic conditions. Chemosphere 2011, 85, 683–688. [Google Scholar] [CrossRef]
- Park, G.; Takekawa, M.; Soda, S.; Ike, M.; Furukawa, K. Temperature dependence of nitrogen removal activity by anammox bacteria enriched at low temperatures. Journal of Bioscience and Bioengineering 2017, 123, 505–511. [Google Scholar] [CrossRef] [PubMed]
- Peng, Z.; Lou, T.; Jiang, K.; Niu, N.; Wang, J.; Liu, A. Characteristics of nutrients removal under partial denitrification initiated by different initial nitrate concentration. Bioprocess and Biosystems Engineering 2021, 44, 2051–2059. [Google Scholar] [CrossRef] [PubMed]
- Peng, Z.; Zhang, Q.; Li, X.; Wang, S.; Peng, Y. Exploring and comparing the impacts of low temperature to endogenous and exogenous partial denitrification: The nitrite supply, transcription mechanism, and microbial dynamics. Bioresource Technology 2023, 370, 128568. [Google Scholar] [CrossRef] [PubMed]
- Qian, W.; Ma, B.; Li, X.; Zhang, Q.; Peng, Y. Long-term effect of pH on denitrification: High pH benefits achieving partial-denitrification. Bioresource Technology 2019, 278, 444–449. [Google Scholar] [CrossRef]
- Shen, Q.; Ji, F.; Wei, J.; Fang, D.; Zhang, Q.; Jiang, L.; Cai, A.; Kuang, L. The influence mechanism of temperature on solid phase denitrification based on denitrification performance, carbon balance, and microbial analysis. Science of the Total Environment 2020, 732, 139333. [Google Scholar] [CrossRef]
- Strous, M.; Pelletier, E.; Mangenot, S.; Rattei, T.; Lehner, A.; Taylor, M.W.; Horn, M.; Daims, H.; Bartol-Mavel, D.; Wincker, P.; Barbe, V.; Fonknechten, N.; Vallenet, D.; Segurens, B.; Schenowitz-Truong, C.; Médigue, C.; Collingro, A.; Snel, B.; Dutilh, B.E.; Op den Camp, H.J.M.; van der Drift, C.; Cirpus, I.; van de Pas-Schoonen, K.T.; Harhangi, H.R.; van Niftrik, L.; Schmid, M.; Keltjens, J.; van de Vossenberg, J.; Kartal, B.; Meier, H.; Frishman, D.; Huynen, M.A.; Mewes, H.W.; Weissenbach, J.; Jetten, M.S.M.; Wagner, M.; Le Paslier, D. Deciphering the evolution and metabolism of an anammox bacterium from a community genome. Nature 2006, 440, 790–794. [Google Scholar] [CrossRef]
- Sun, H.; Yang, Q.; Peng, Y.; Shi, X.; Wang, S.; Zhang, S. Nitrite Accumulation during the Denitrification Process in SBR for the Treatment of Pre-treated Landfill Leachate. Chinese Journal of Chemical Engineering 2009, 17, 1027–1031. [Google Scholar] [CrossRef]
- Takeda, P.Y.; Paula, C.T.; Borges, A.d.V.; Shibata, A.E.; Grangeiro, L.C.; Damianovic, M.H.R.Z. A critical review of the mainstream anammox-based processes in warm climate regions: Potential, performance, and control strategies. Journal of Environmental Chemical Engineering 2024, 12, 113691. [Google Scholar] [CrossRef]
- Thakur, I.S.; Medhi, K. Nitrification and denitrification processes for mitigation of nitrous oxide from waste water treatment plants for biovalorization: Challenges and opportunities. Bioresource Technology 2019, 282, 502–513. [Google Scholar] [CrossRef] [PubMed]
- Wang, W.; Yan, Y.; Song, C.; Pan, M.; Wang, Y. The microbial community structure change of an anaerobic ammonia oxidation reactor in response to decreasing temperatures. Environmental science and pollution research international 2018, 25, 35330–35341. [Google Scholar] [CrossRef] [PubMed]
- Wang, X.; Yang, H. Nitrogen removal performance of anammox immobilized fillers in response to seasonal temperature variations and different operating modes: Substrate utilization and microbial community analysis. Science of The Total Environment 2022, 829, 154574. [Google Scholar] [CrossRef] [PubMed]
- Wu, H.; Bai, X.; Li, L.; Li, Z.; Wang, M.; Zhang, Z.; Zhu, C.; Xu, Y.; Xiong, H.; Xie, X.; Tian, X.; Li, J. Two-stage partial nitrification-denitrification and anammox process for nitrogen removal in vacuum collected toilet wastewater at ambient temperature. Environmental Research 2024, 262, 119917. [Google Scholar] [CrossRef]
- Xu, Z.S.; Dai, X.H.; Chai, X.L. Effect of different carbon sources on denitrification performance, microbial community structure and denitrification genes. Science of the Total Environment 2018, 634, 195–204. [Google Scholar] [CrossRef]
- Yao, S.; Ni, J.; Ma, T.; Li, C. Heterotrophic nitrification and aerobic denitrification at low temperature by a newly isolated bacterium, Acinetobacter sp. HA2. Bioresource Technology 2013, 139, 80–86. [Google Scholar] [CrossRef]
- Yuan, Y.; Huang, Y.; Deng, H.-p; Sheng, X.-m; Pan, Y.; Li, X. Effect of C/N Ratio on Nitrite Accumulation During Denitrification Process. Huanjing Kexue 2013, 34, 1416–1420. [Google Scholar]
- Zhang, L.; Hao, S.; Wang, Y.; Lan, S.; Dou, Q.; Peng, Y. Rapid start-up strategy of partial denitrification and microbially driven mechanism of nitrite accumulation mediated by dissolved organic matter. Bioresource Technology 2021a, 340, 125663. [Google Scholar] [CrossRef]
- Zhang, L.; Huang, X.Y.; Zhou, J.Z.; Ju, F. Active predation, phylogenetic diversity, and global prevalence of myxobacteria in wastewater treatment plants. Isme Journal 2023a, 17, 671–681. [Google Scholar] [CrossRef]
- Zhang, M.; Gao, J.; Liu, Q.; Fan, Y.; Zhu, C.; Liu, Y.; He, C.; Wu, J. Nitrite accumulation and microbial behavior by seeding denitrifying phosphorus removal sludge for partial denitrification (PD): The effect of COD/NO3− ratio. Bioresource Technology 2021b, 323, 124524. [Google Scholar] [CrossRef]
- Zhang, M.; Li, B.; Wang, D.; You, Y.; Fan, Y.; Wu, J.; Lv, X. Nitrite production mechanism and microbial evolution characteristic influenced by pH during partial denitrification (PD) process. Journal of Environmental Chemical Engineering 2023b, 11, 111451. [Google Scholar] [CrossRef]
- Zhang, M.; Liu, J.; Liang, J.; Fan, Y.; Gu, X.; Wu, J. Response of nitrite accumulation, sludge characteristic and microbial transition to carbon source during the partial denitrification (PD) process. Science of The Total Environment 2023c, 894, 165043. [Google Scholar] [CrossRef] [PubMed]
- Zhang, M.; Liu, J.; Wang, D.; Lu, M.; Fan, Y.; Ji, J.; Wu, J. Combined effects of carbon source and C/N ratio on the partial denitrification performance: Nitrite accumulation, denitrification kinetic and microbial transition. Journal of Environmental Chemical Engineering 2024, 12, 113343. [Google Scholar] [CrossRef]
- Zhang, M.; Tan, Y.; Fan, Y.; Gao, J.; Liu, Y.; Lv, X.; Ge, L.; Wu, J. Nitrite accumulation, denitrification kinetic and microbial evolution in the partial denitrification process: The combined effects of carbon source and nitrate concentration. Bioresource Technology 2022, 361, 127604. [Google Scholar] [CrossRef]
- Zhang, M.; Tan, Y.; Fan, Y.; Wu, J.; Yu, L. Insights into nitrite accumulation and microbial structure in partial denitrification (PD) process by the combining regulation of C/N ratio and nitrate concentration. Journal of Environmental Chemical Engineering 2023d, 11, 109891. [Google Scholar] [CrossRef]
- Zhang, M.; Wang, Y.; Fan, Y.; Liu, Y.; Yu, M.; He, C.; Wu, J. Bioaugmentation of low C/N ratio wastewater: Effect of acetate and propionate on nutrient removal, substrate transformation, and microbial community behavior. Bioresource Technology 2020, 306, 122465. [Google Scholar] [CrossRef]
- Zhen, X.; Luo, M.; Dong, H.; Fang, L.; Wang, W.; Feng, L.; Yu, Q. Analysis of enzyme activity and microbial community structure changes in the anaerobic digestion process of cattle manure at sub-mesophilic temperatures. Green Processing and Synthesis 2021, 10, 644–657. [Google Scholar] [CrossRef]
Figure 1.
Experimental device and operational mode of the PD - SBR system.
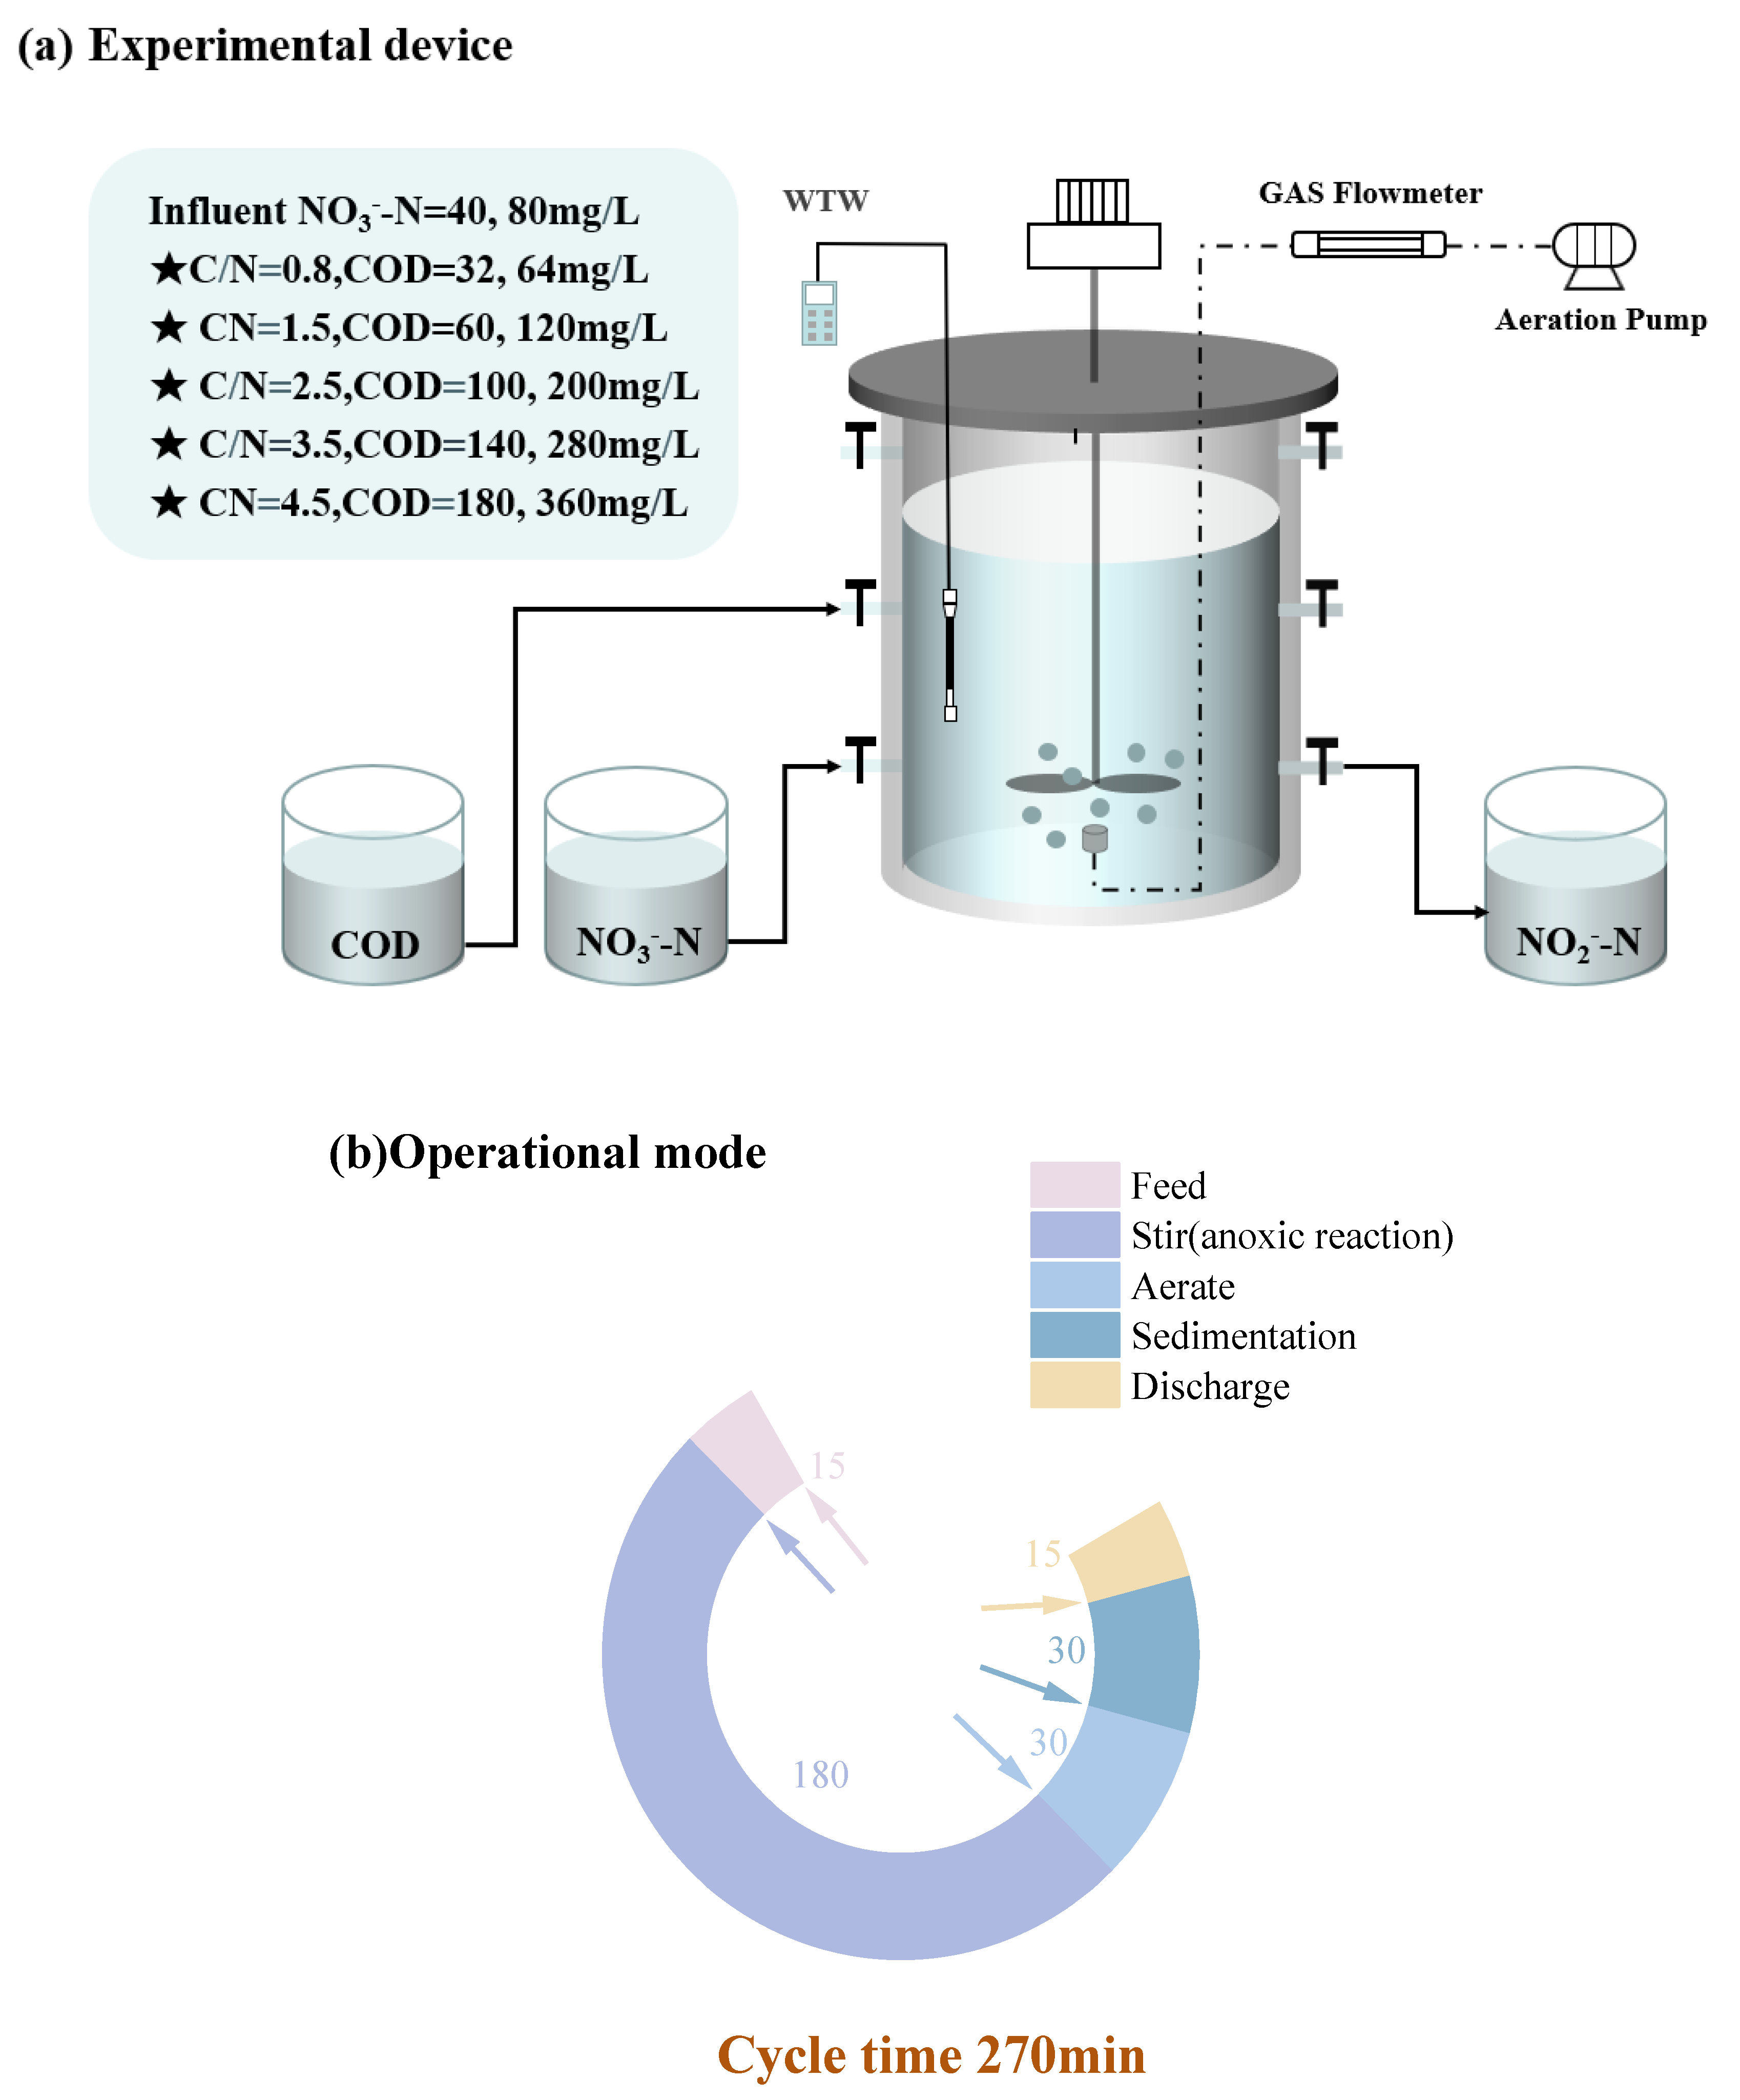
Figure 2.
Variations of substrate concentration, NTR, and NRE in different reactors.
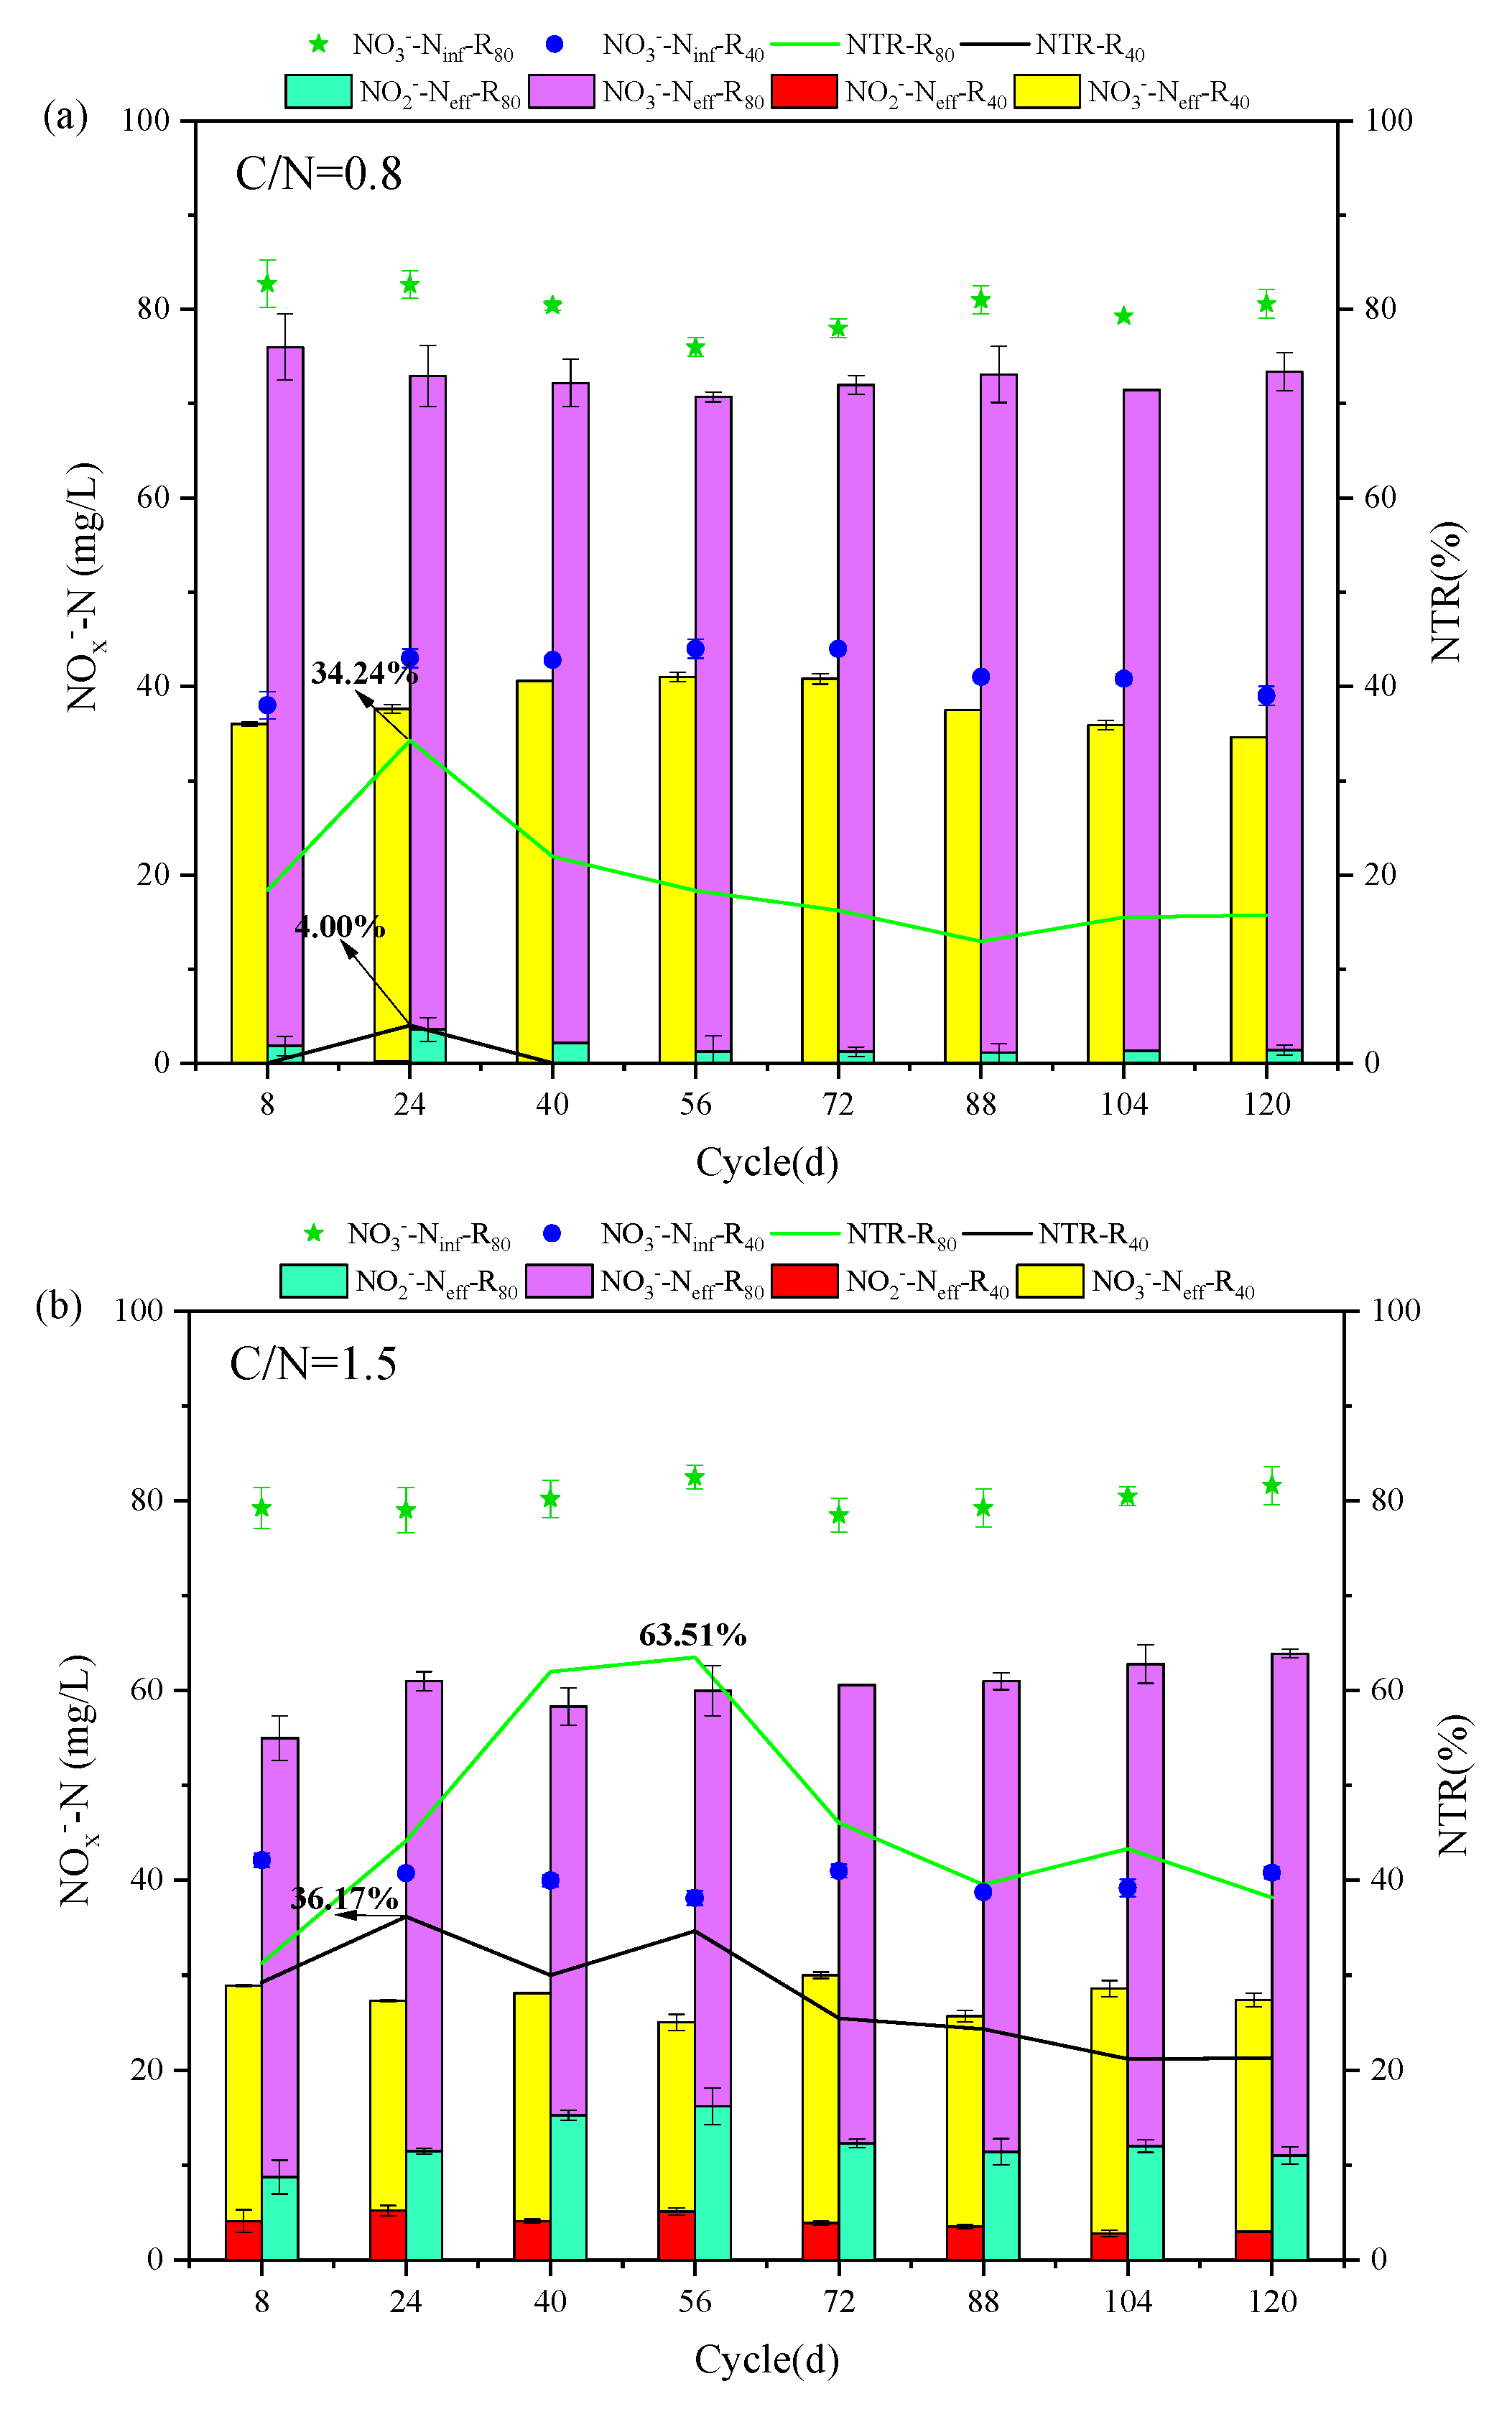
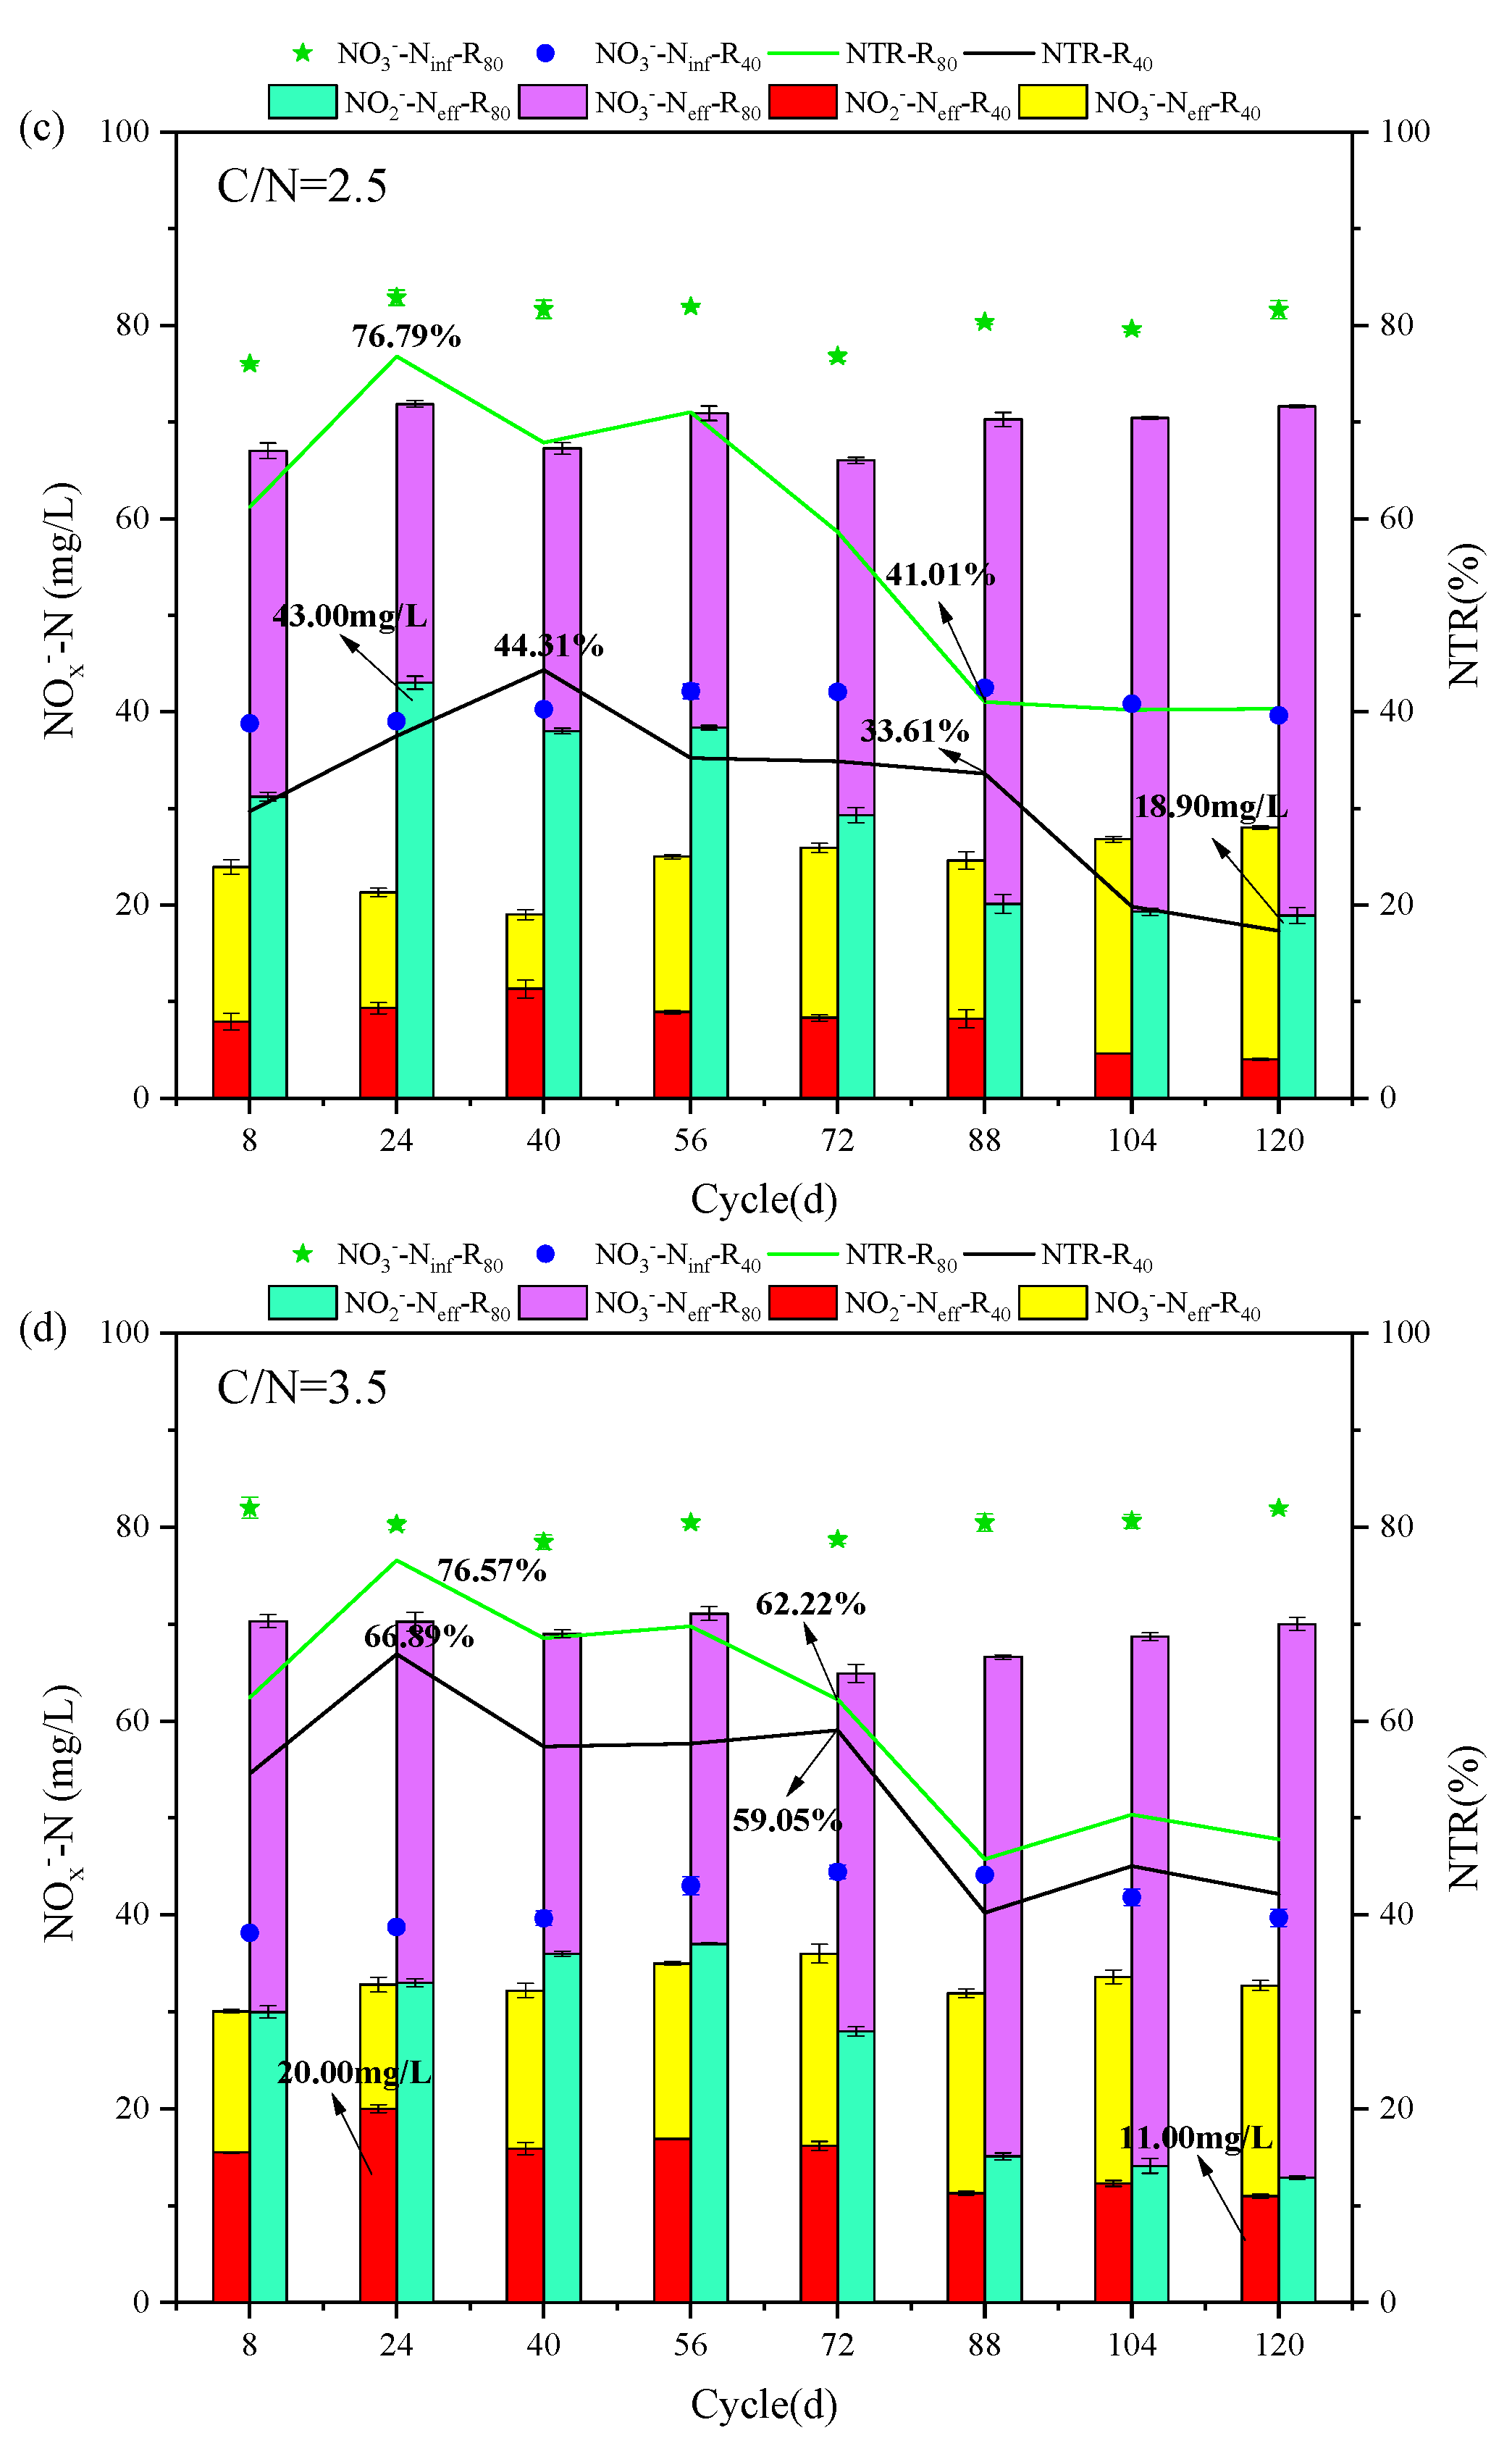
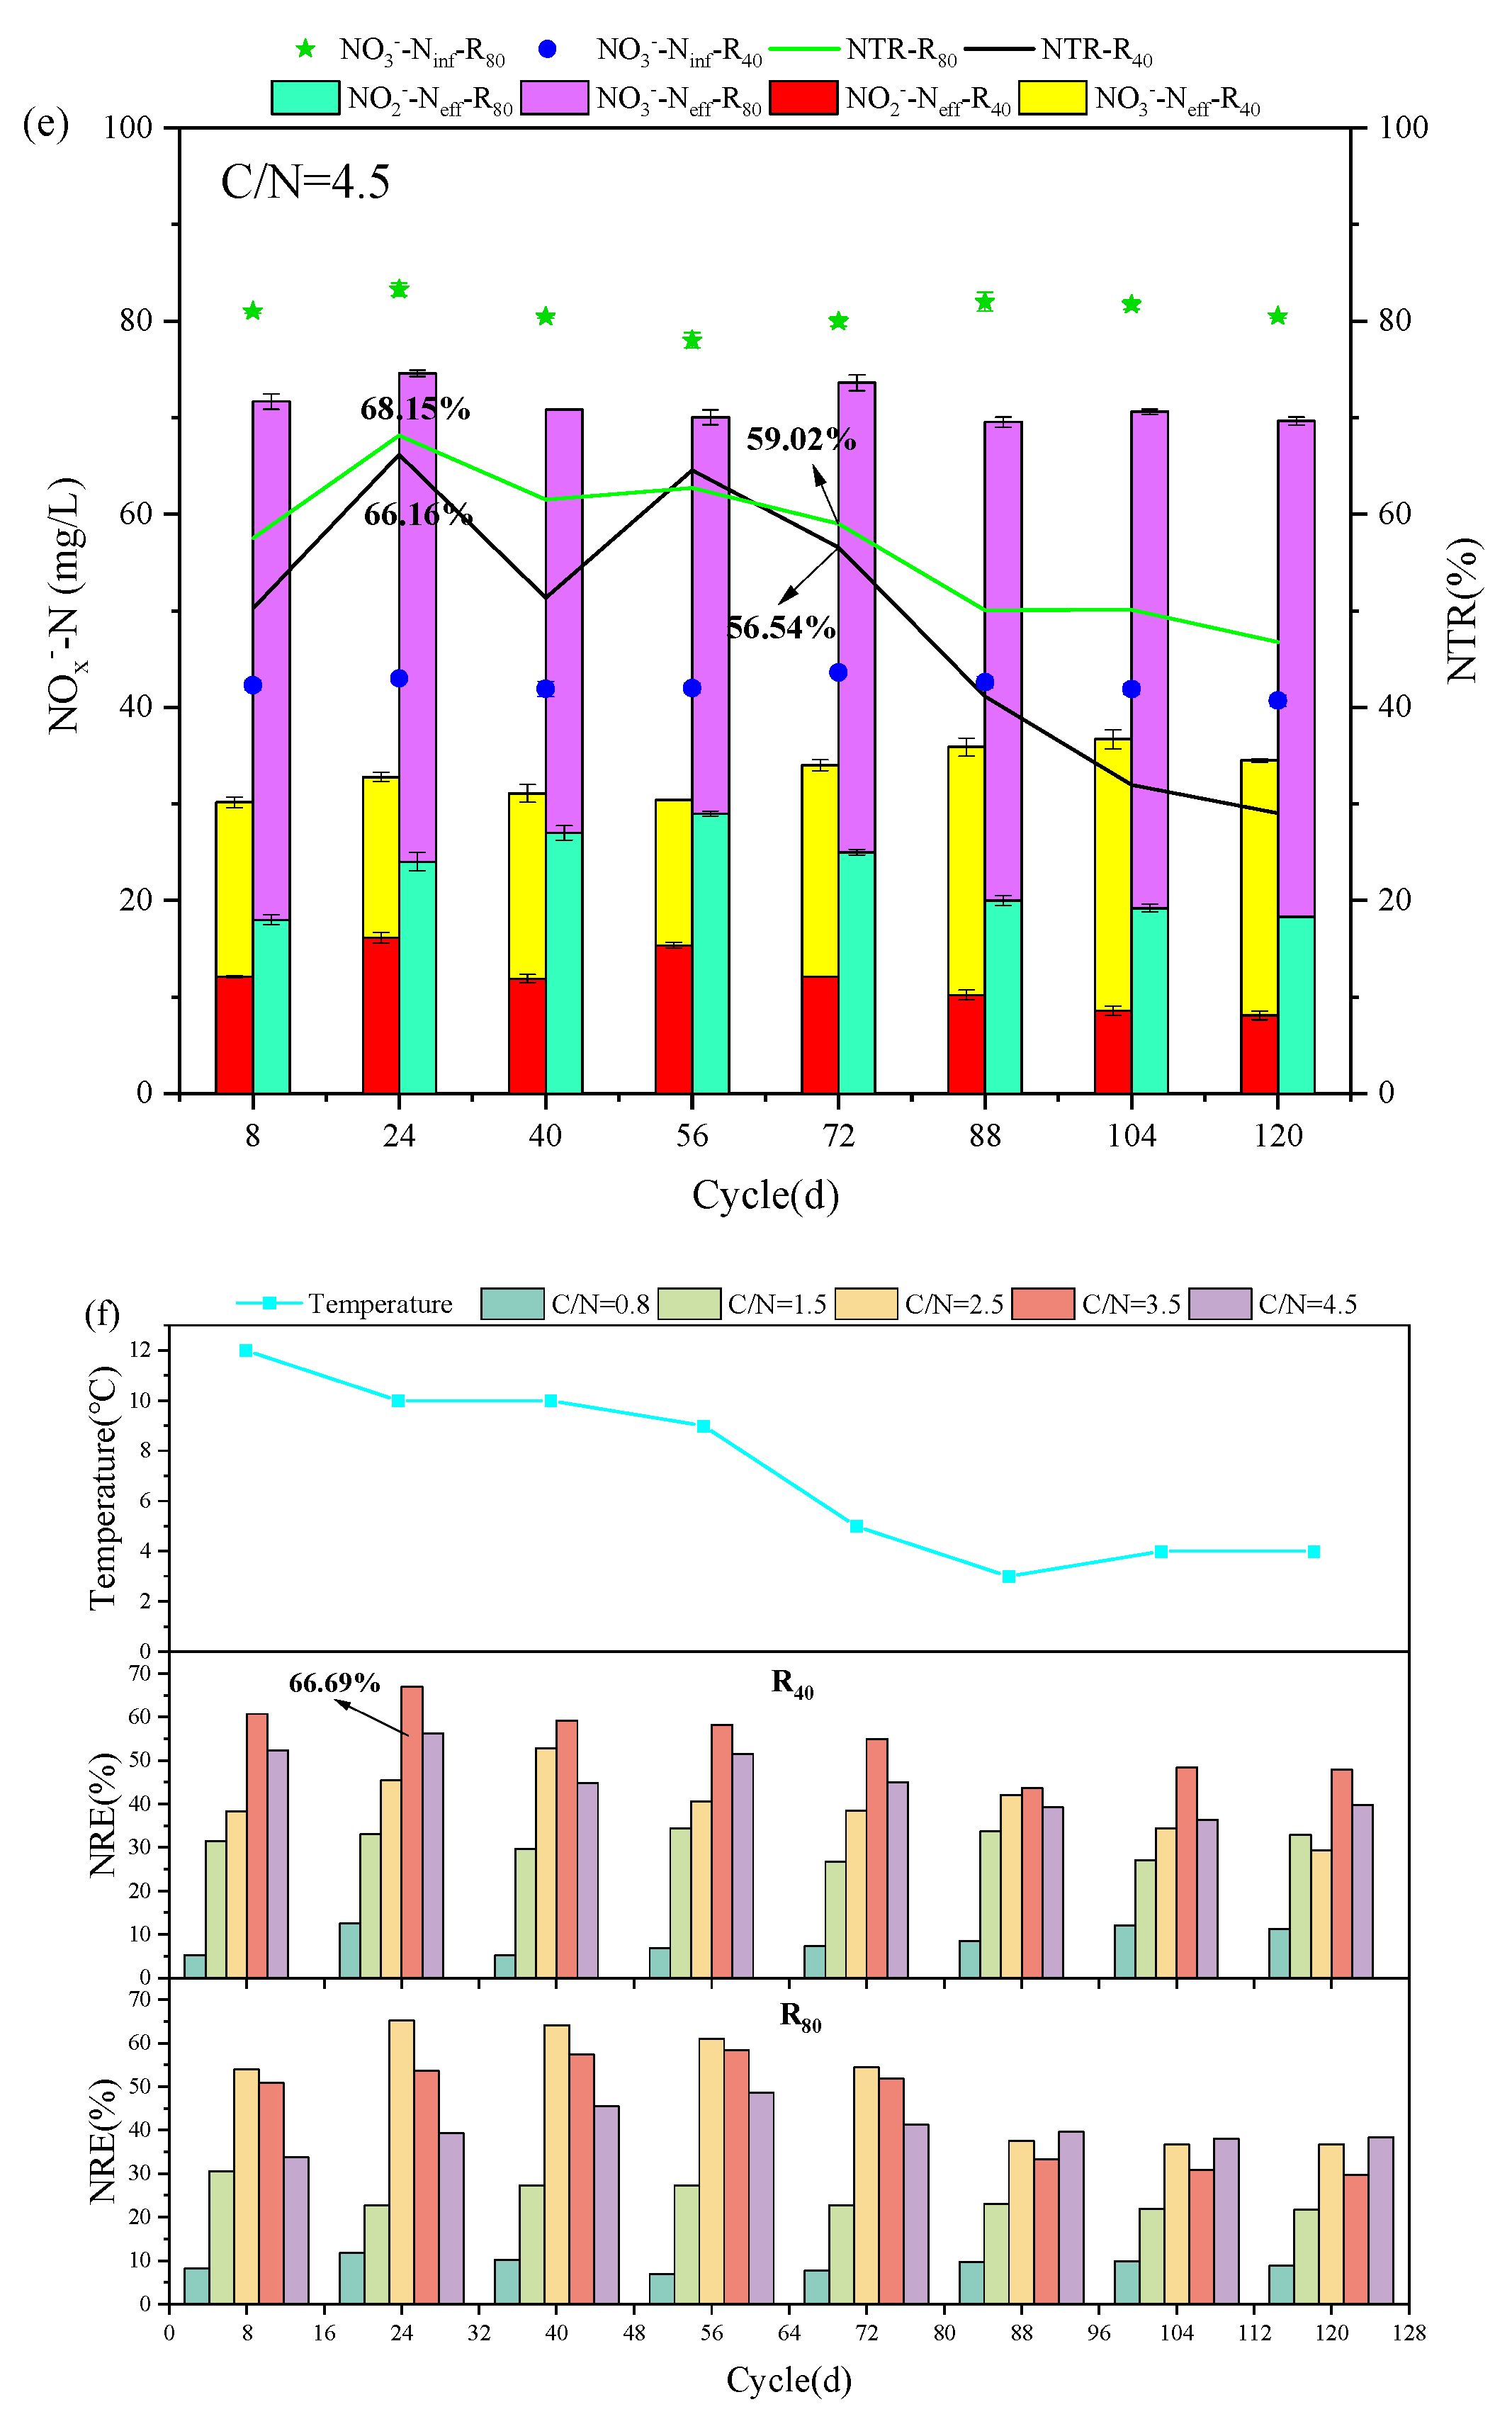
Figure 3.
Variations of COD (a-b), NO2--N (c-d), NO3--N (e-f), TN (g-h), ReTN (i-j) linked with carbon source consumption (k) and correlation analysis (l) in the typical cycles.
Figure 3.
Variations of COD (a-b), NO2--N (c-d), NO3--N (e-f), TN (g-h), ReTN (i-j) linked with carbon source consumption (k) and correlation analysis (l) in the typical cycles.
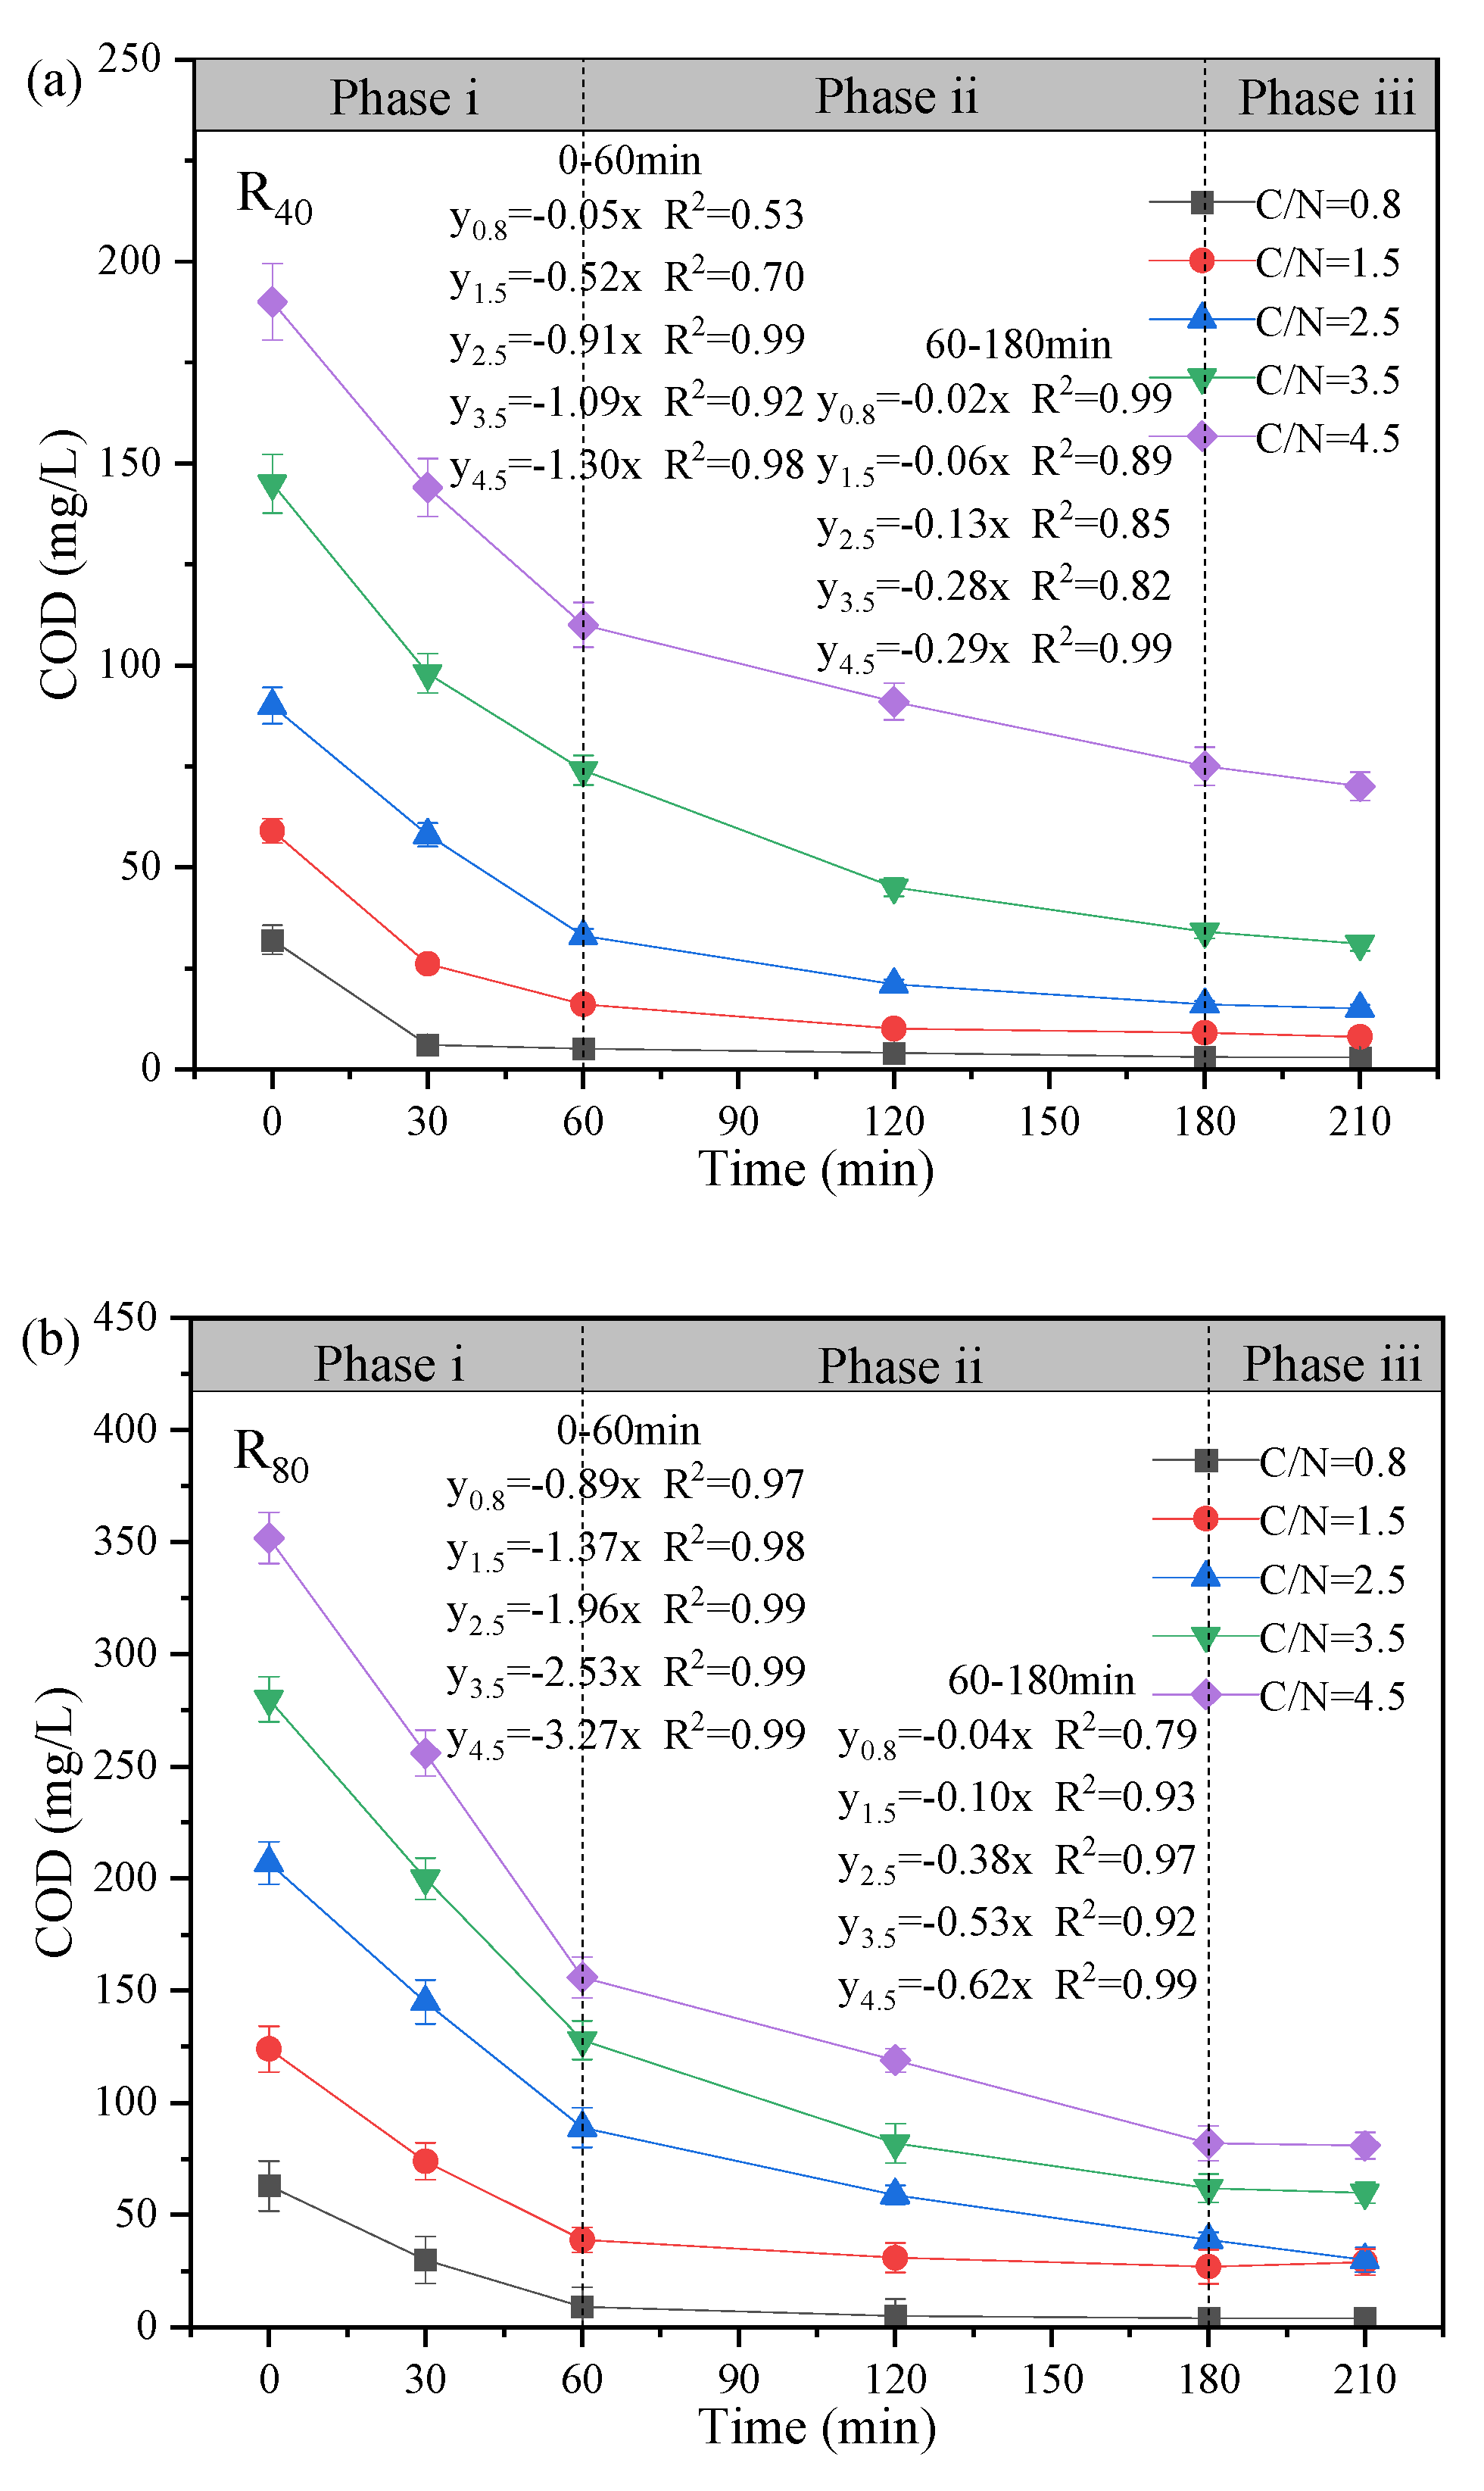
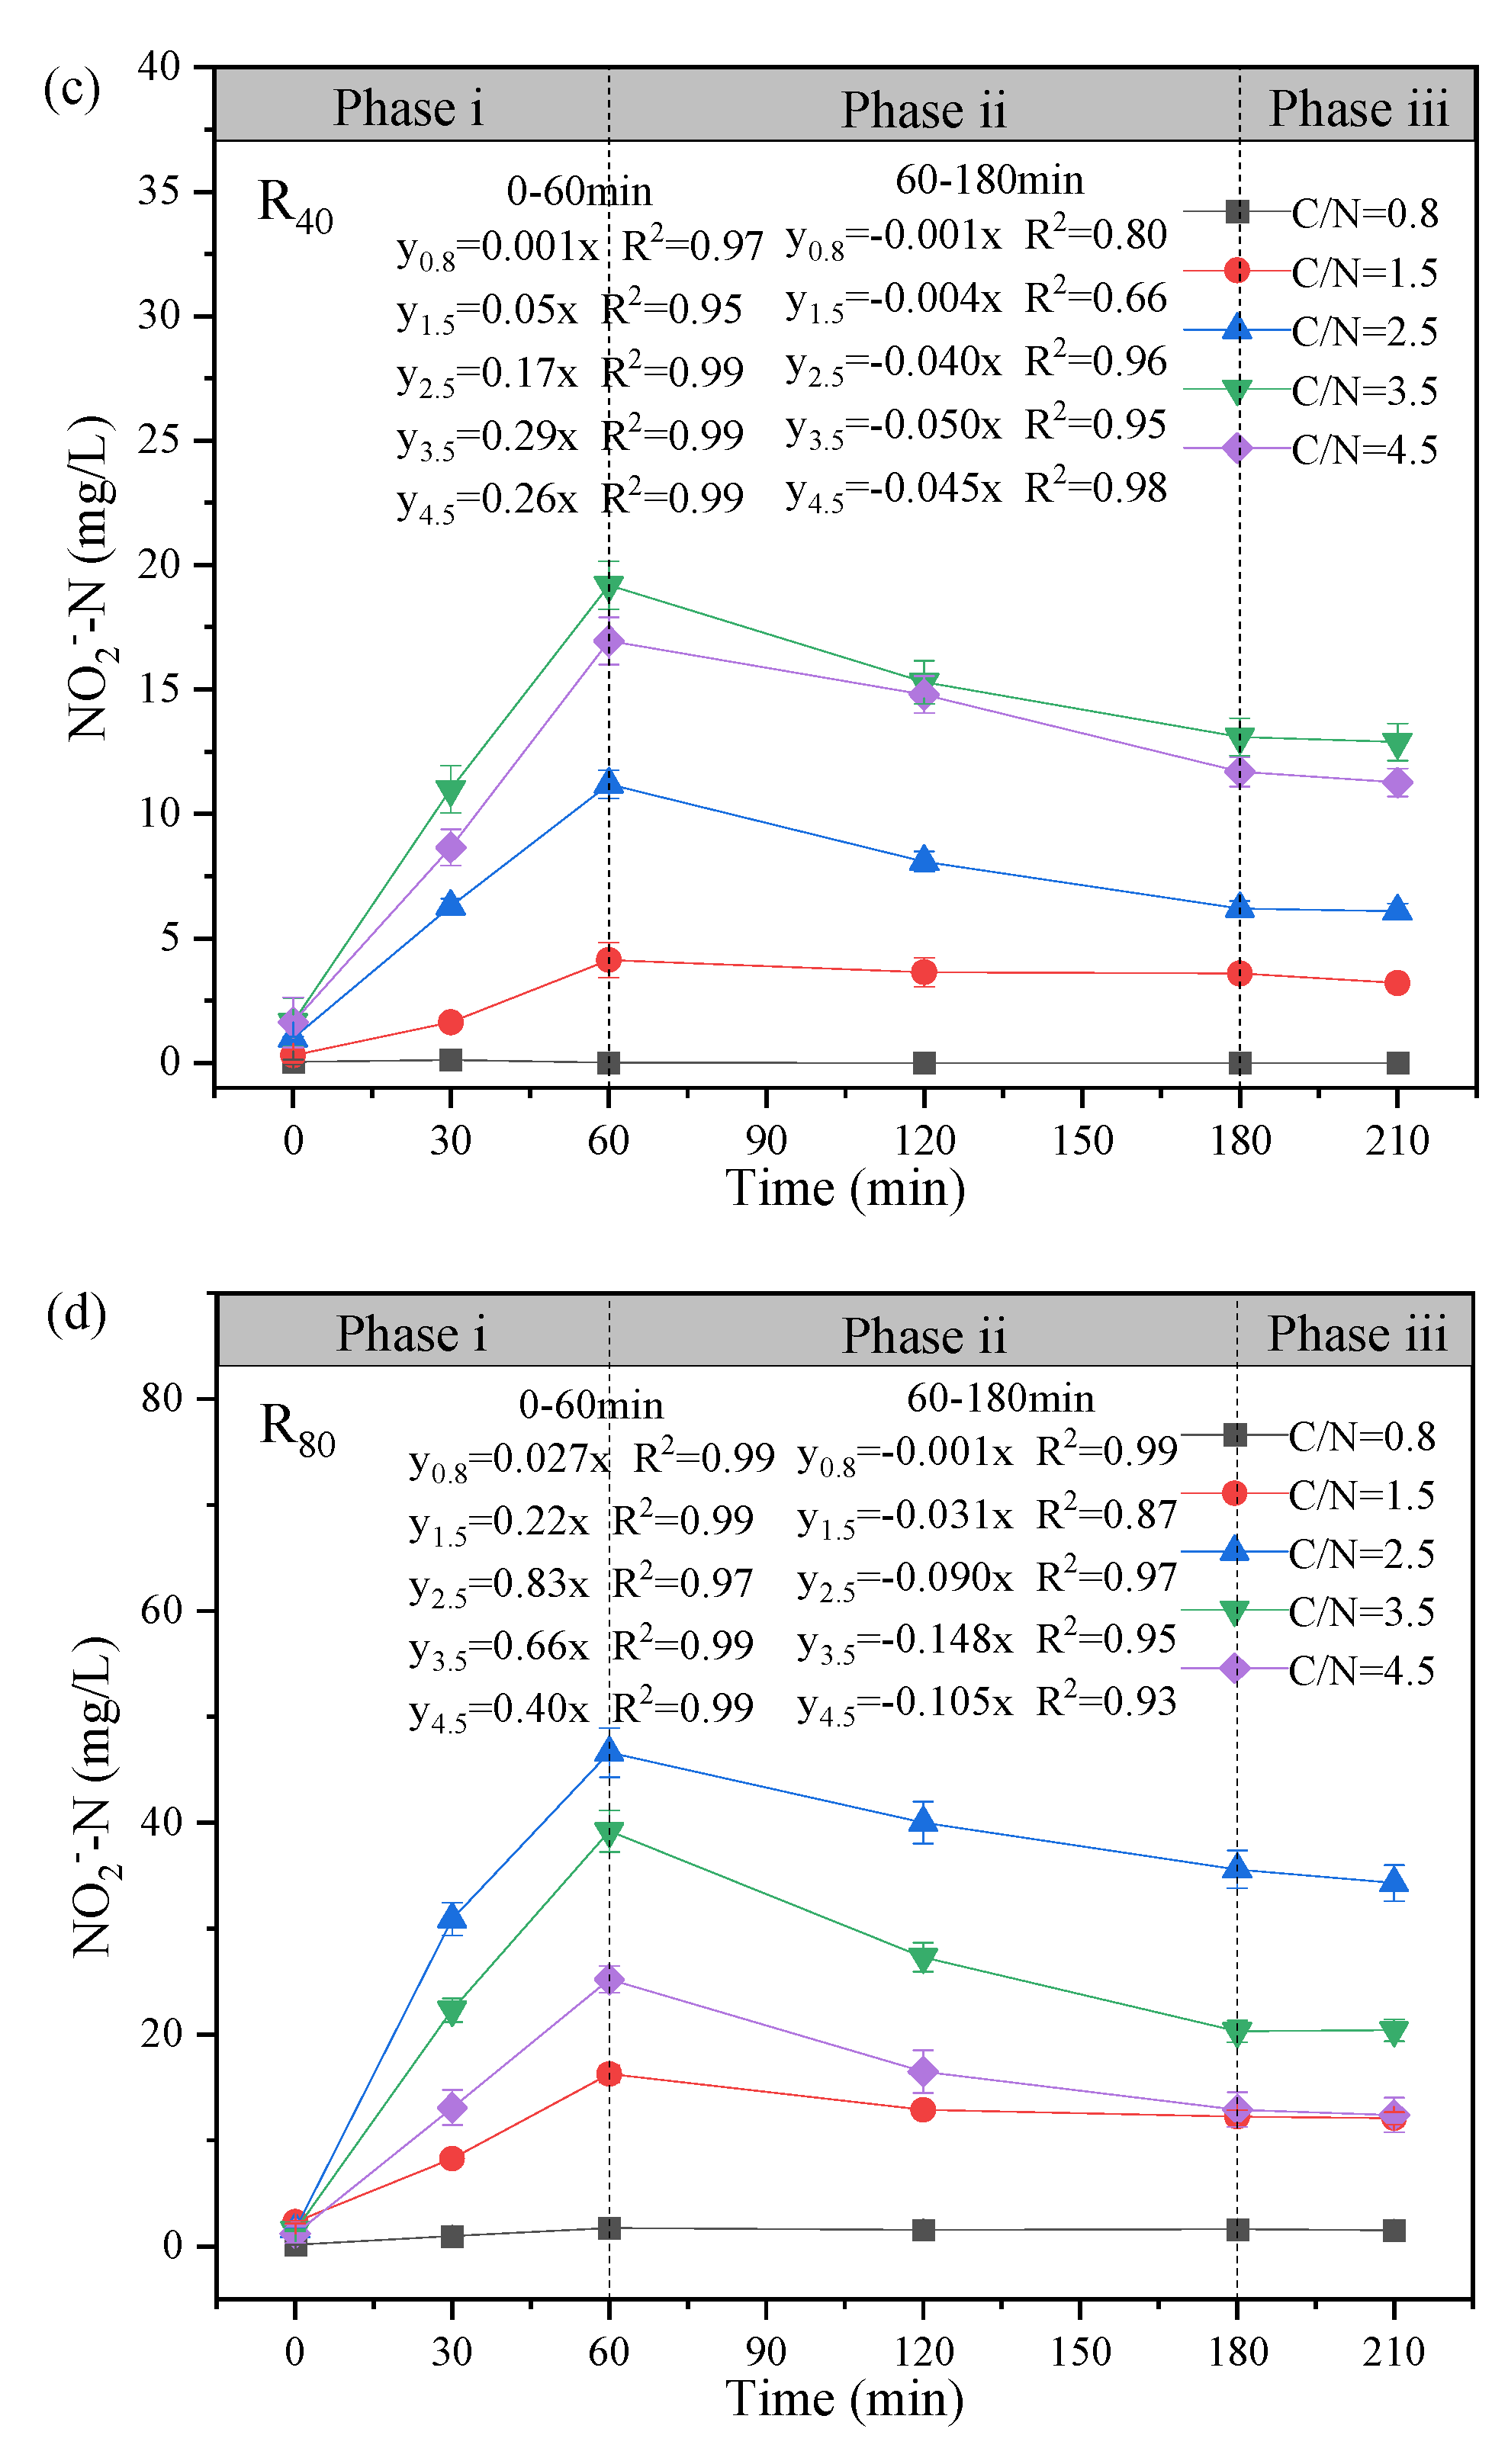
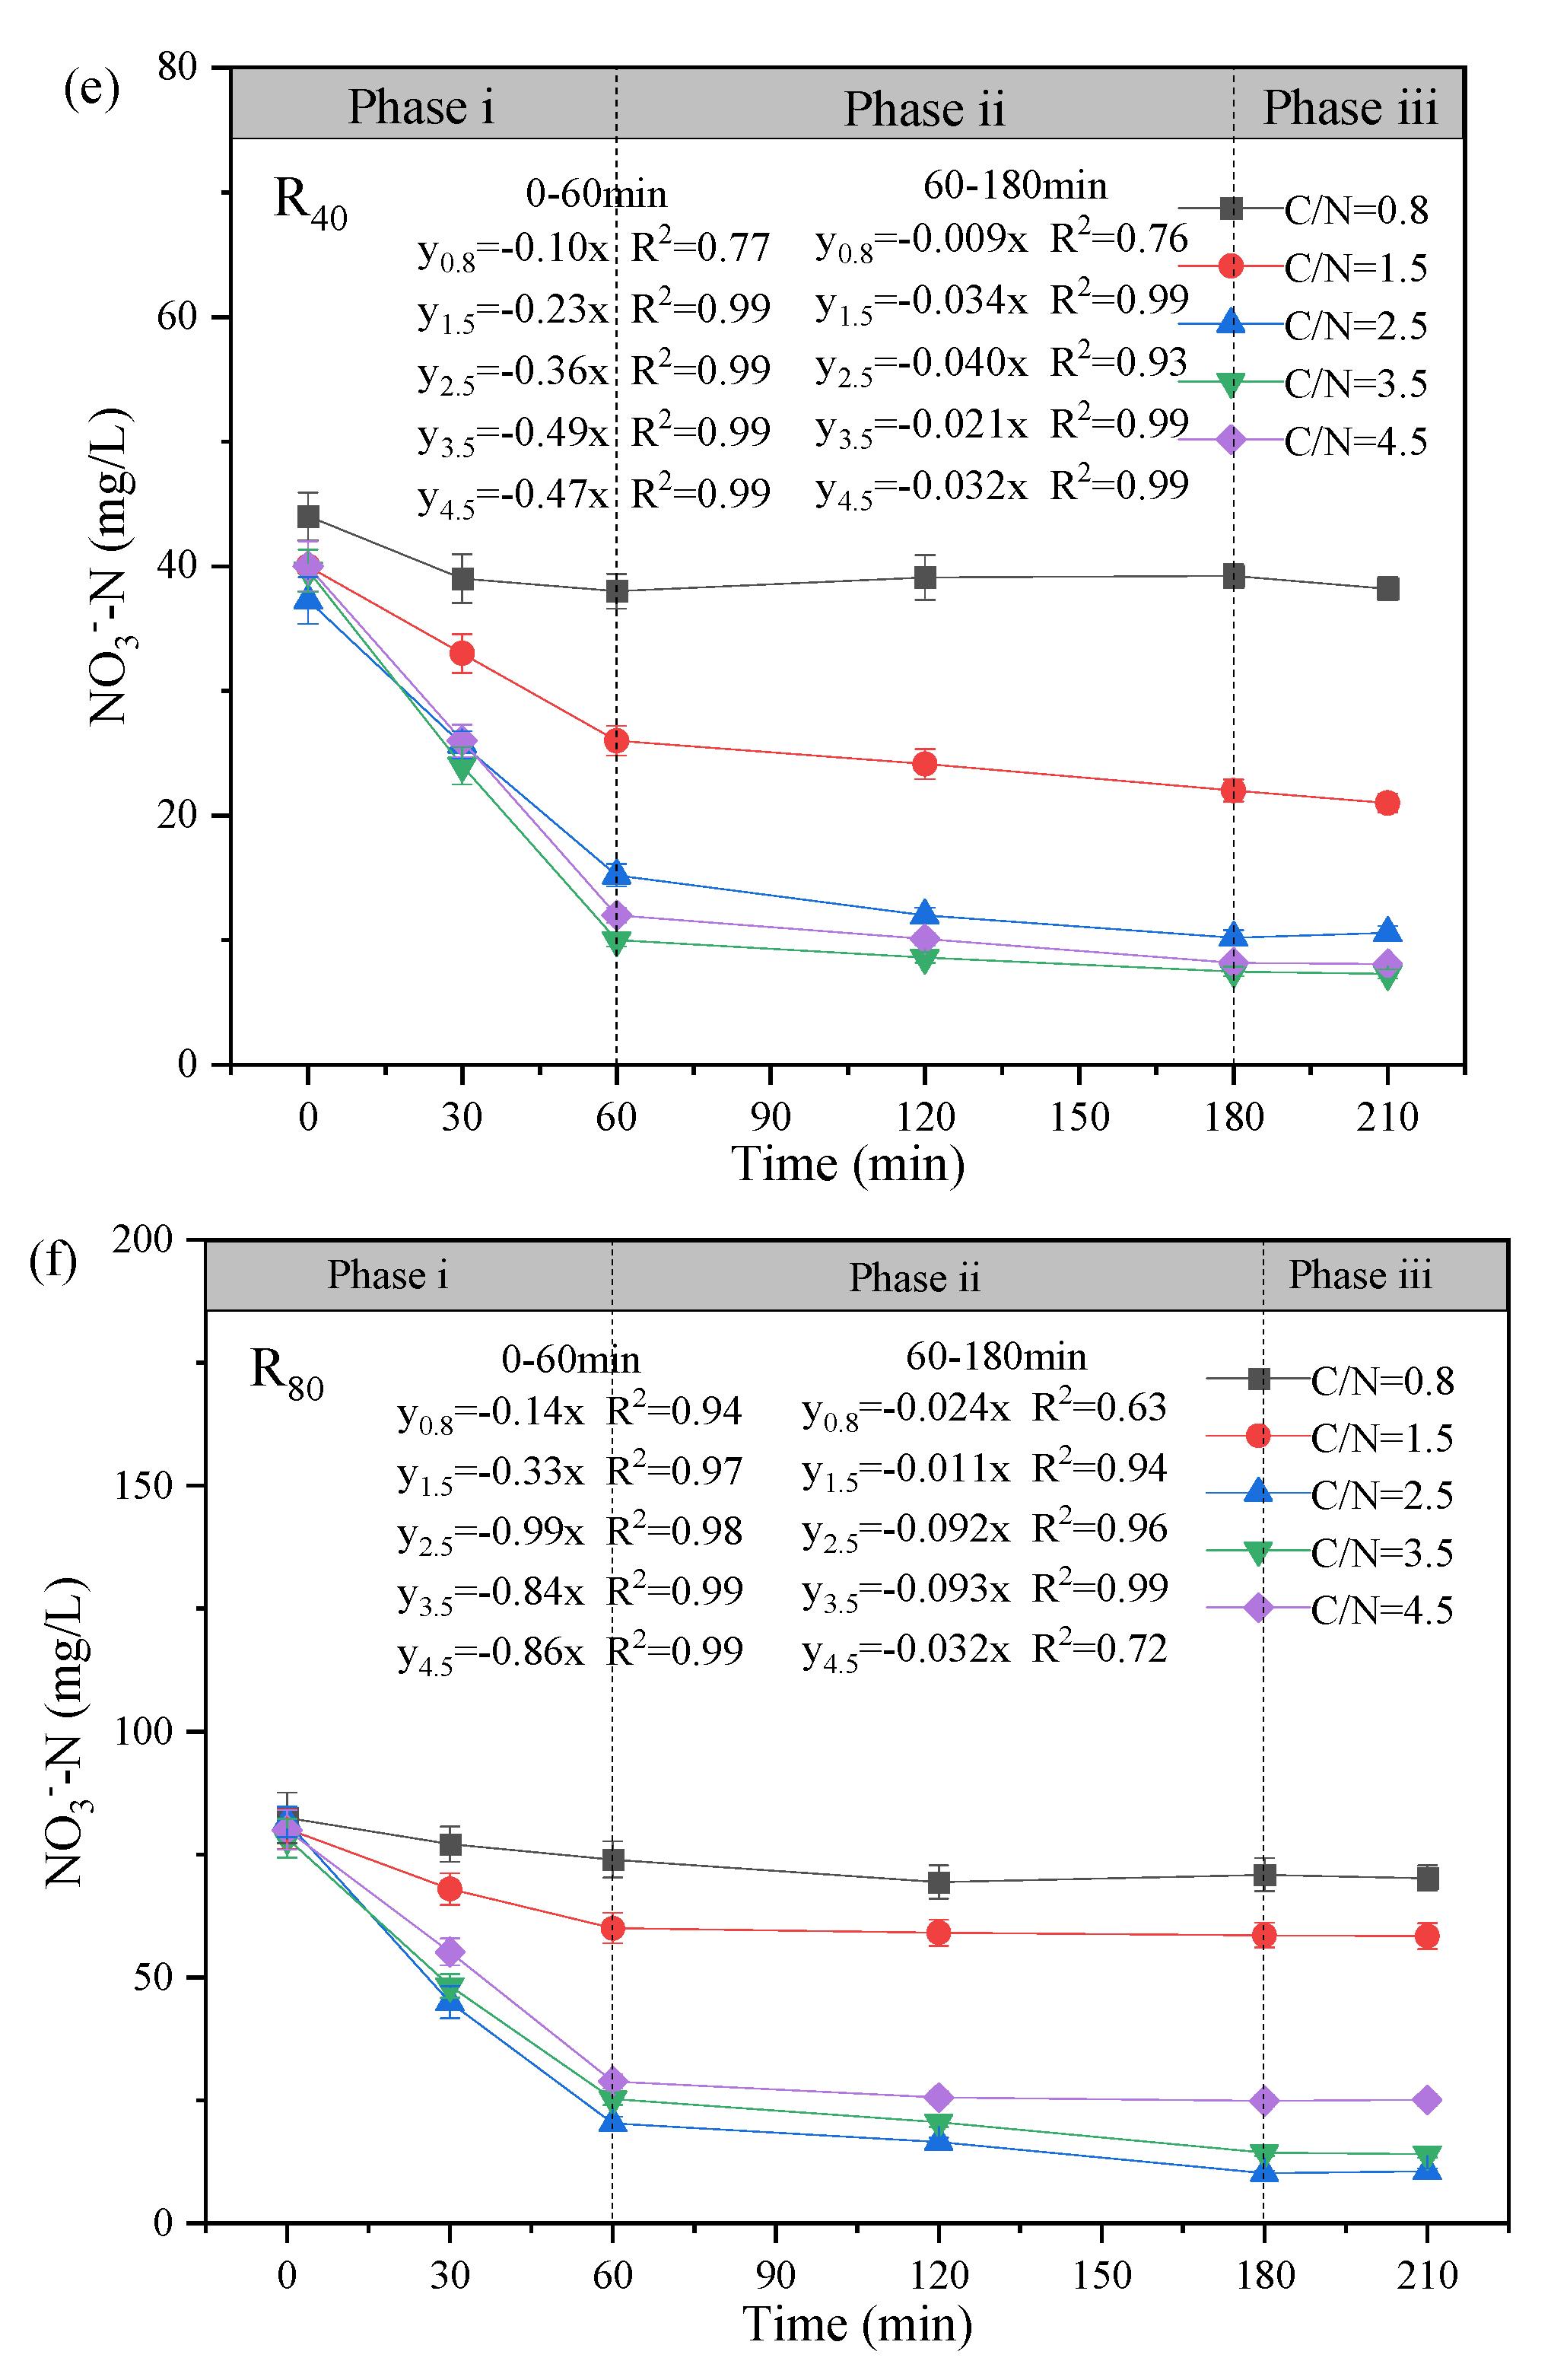
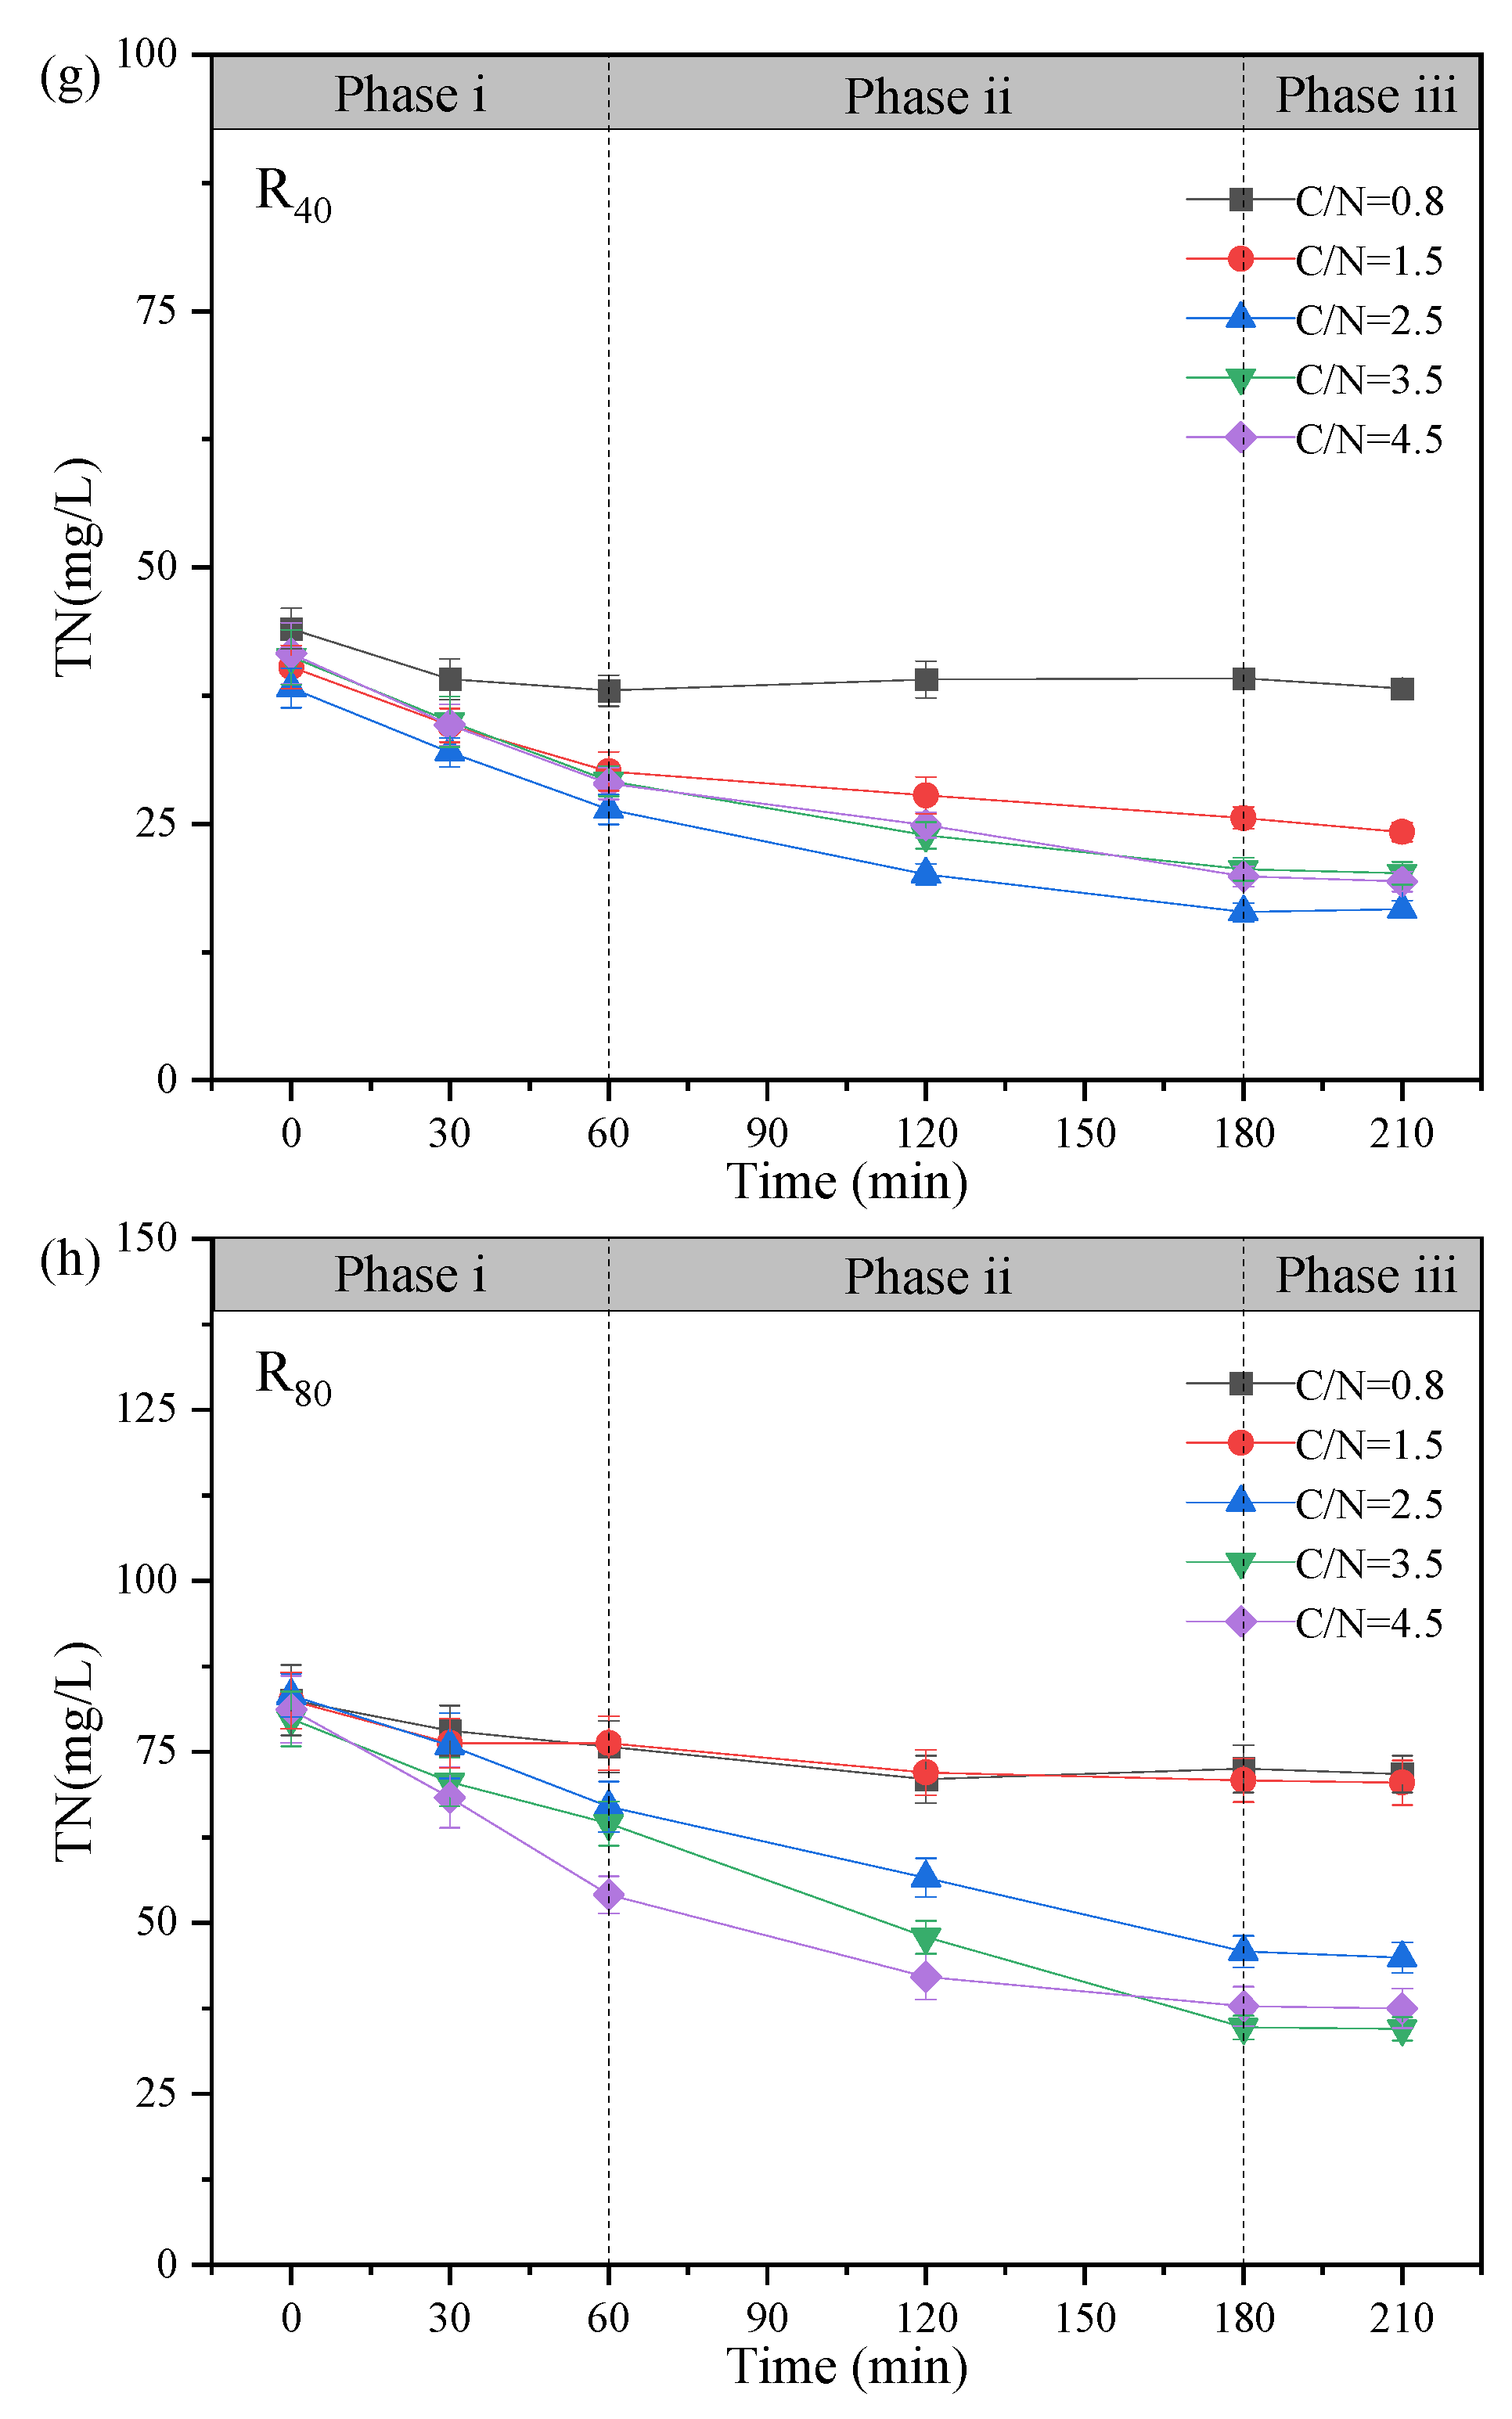
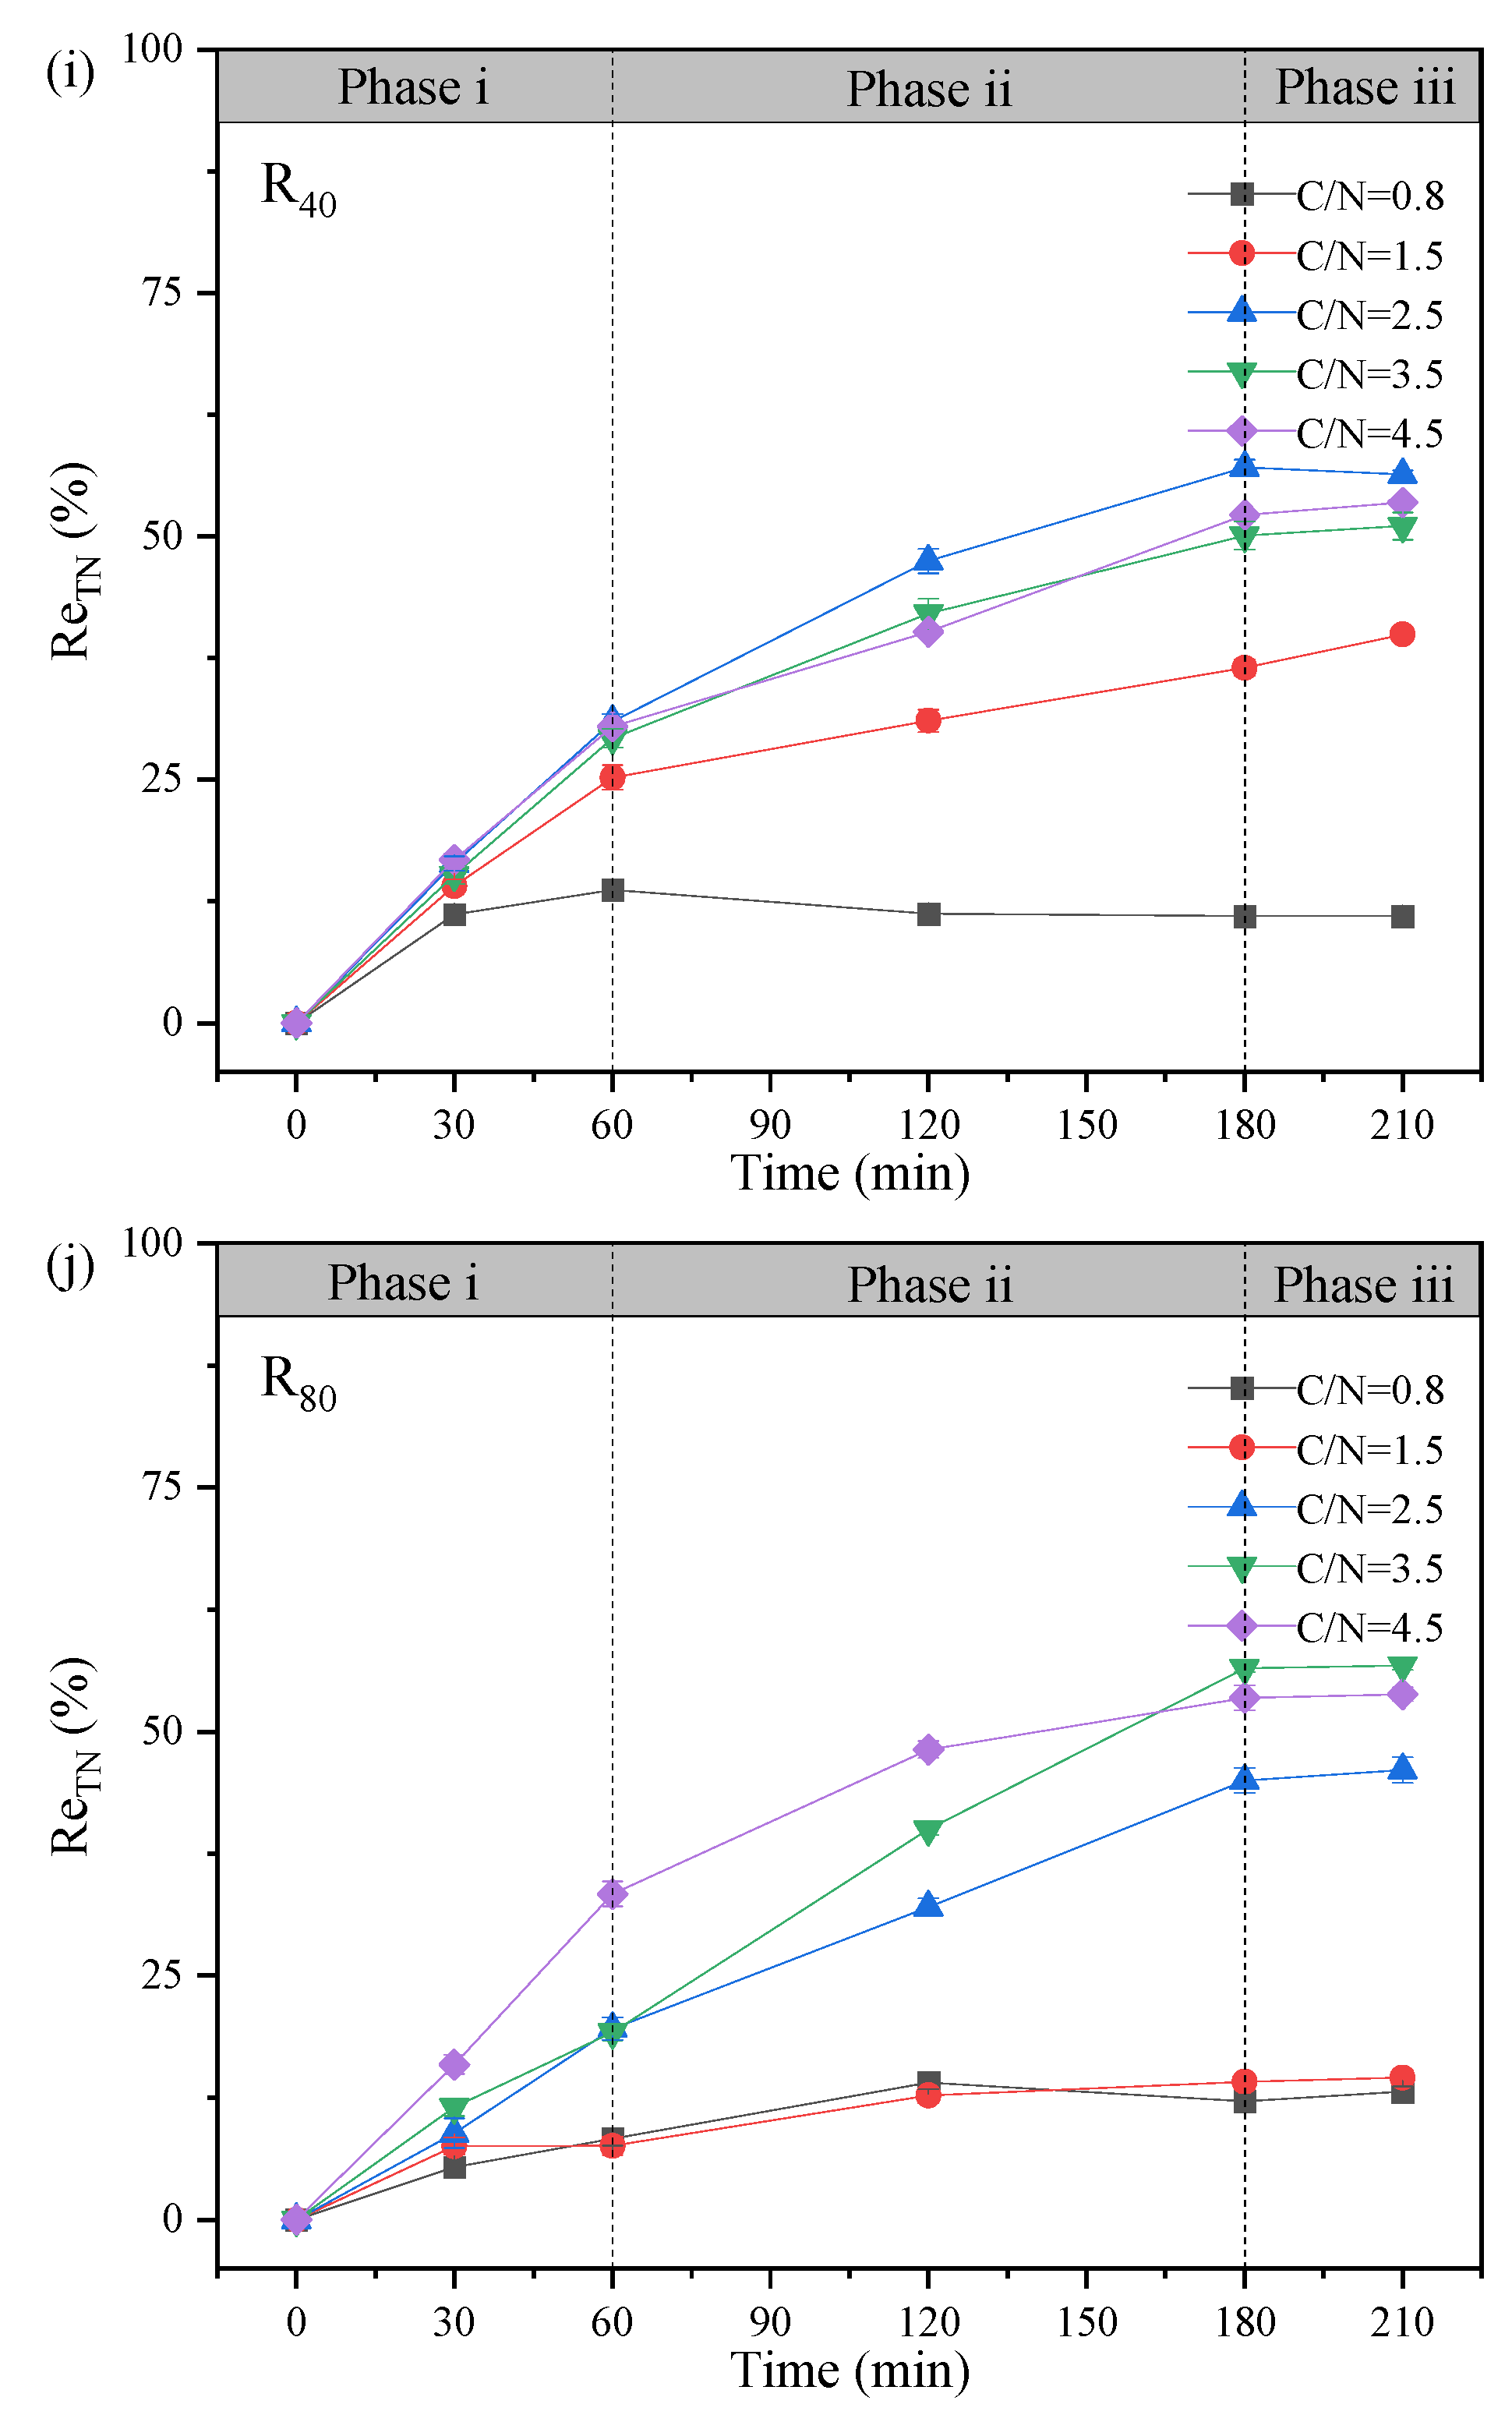
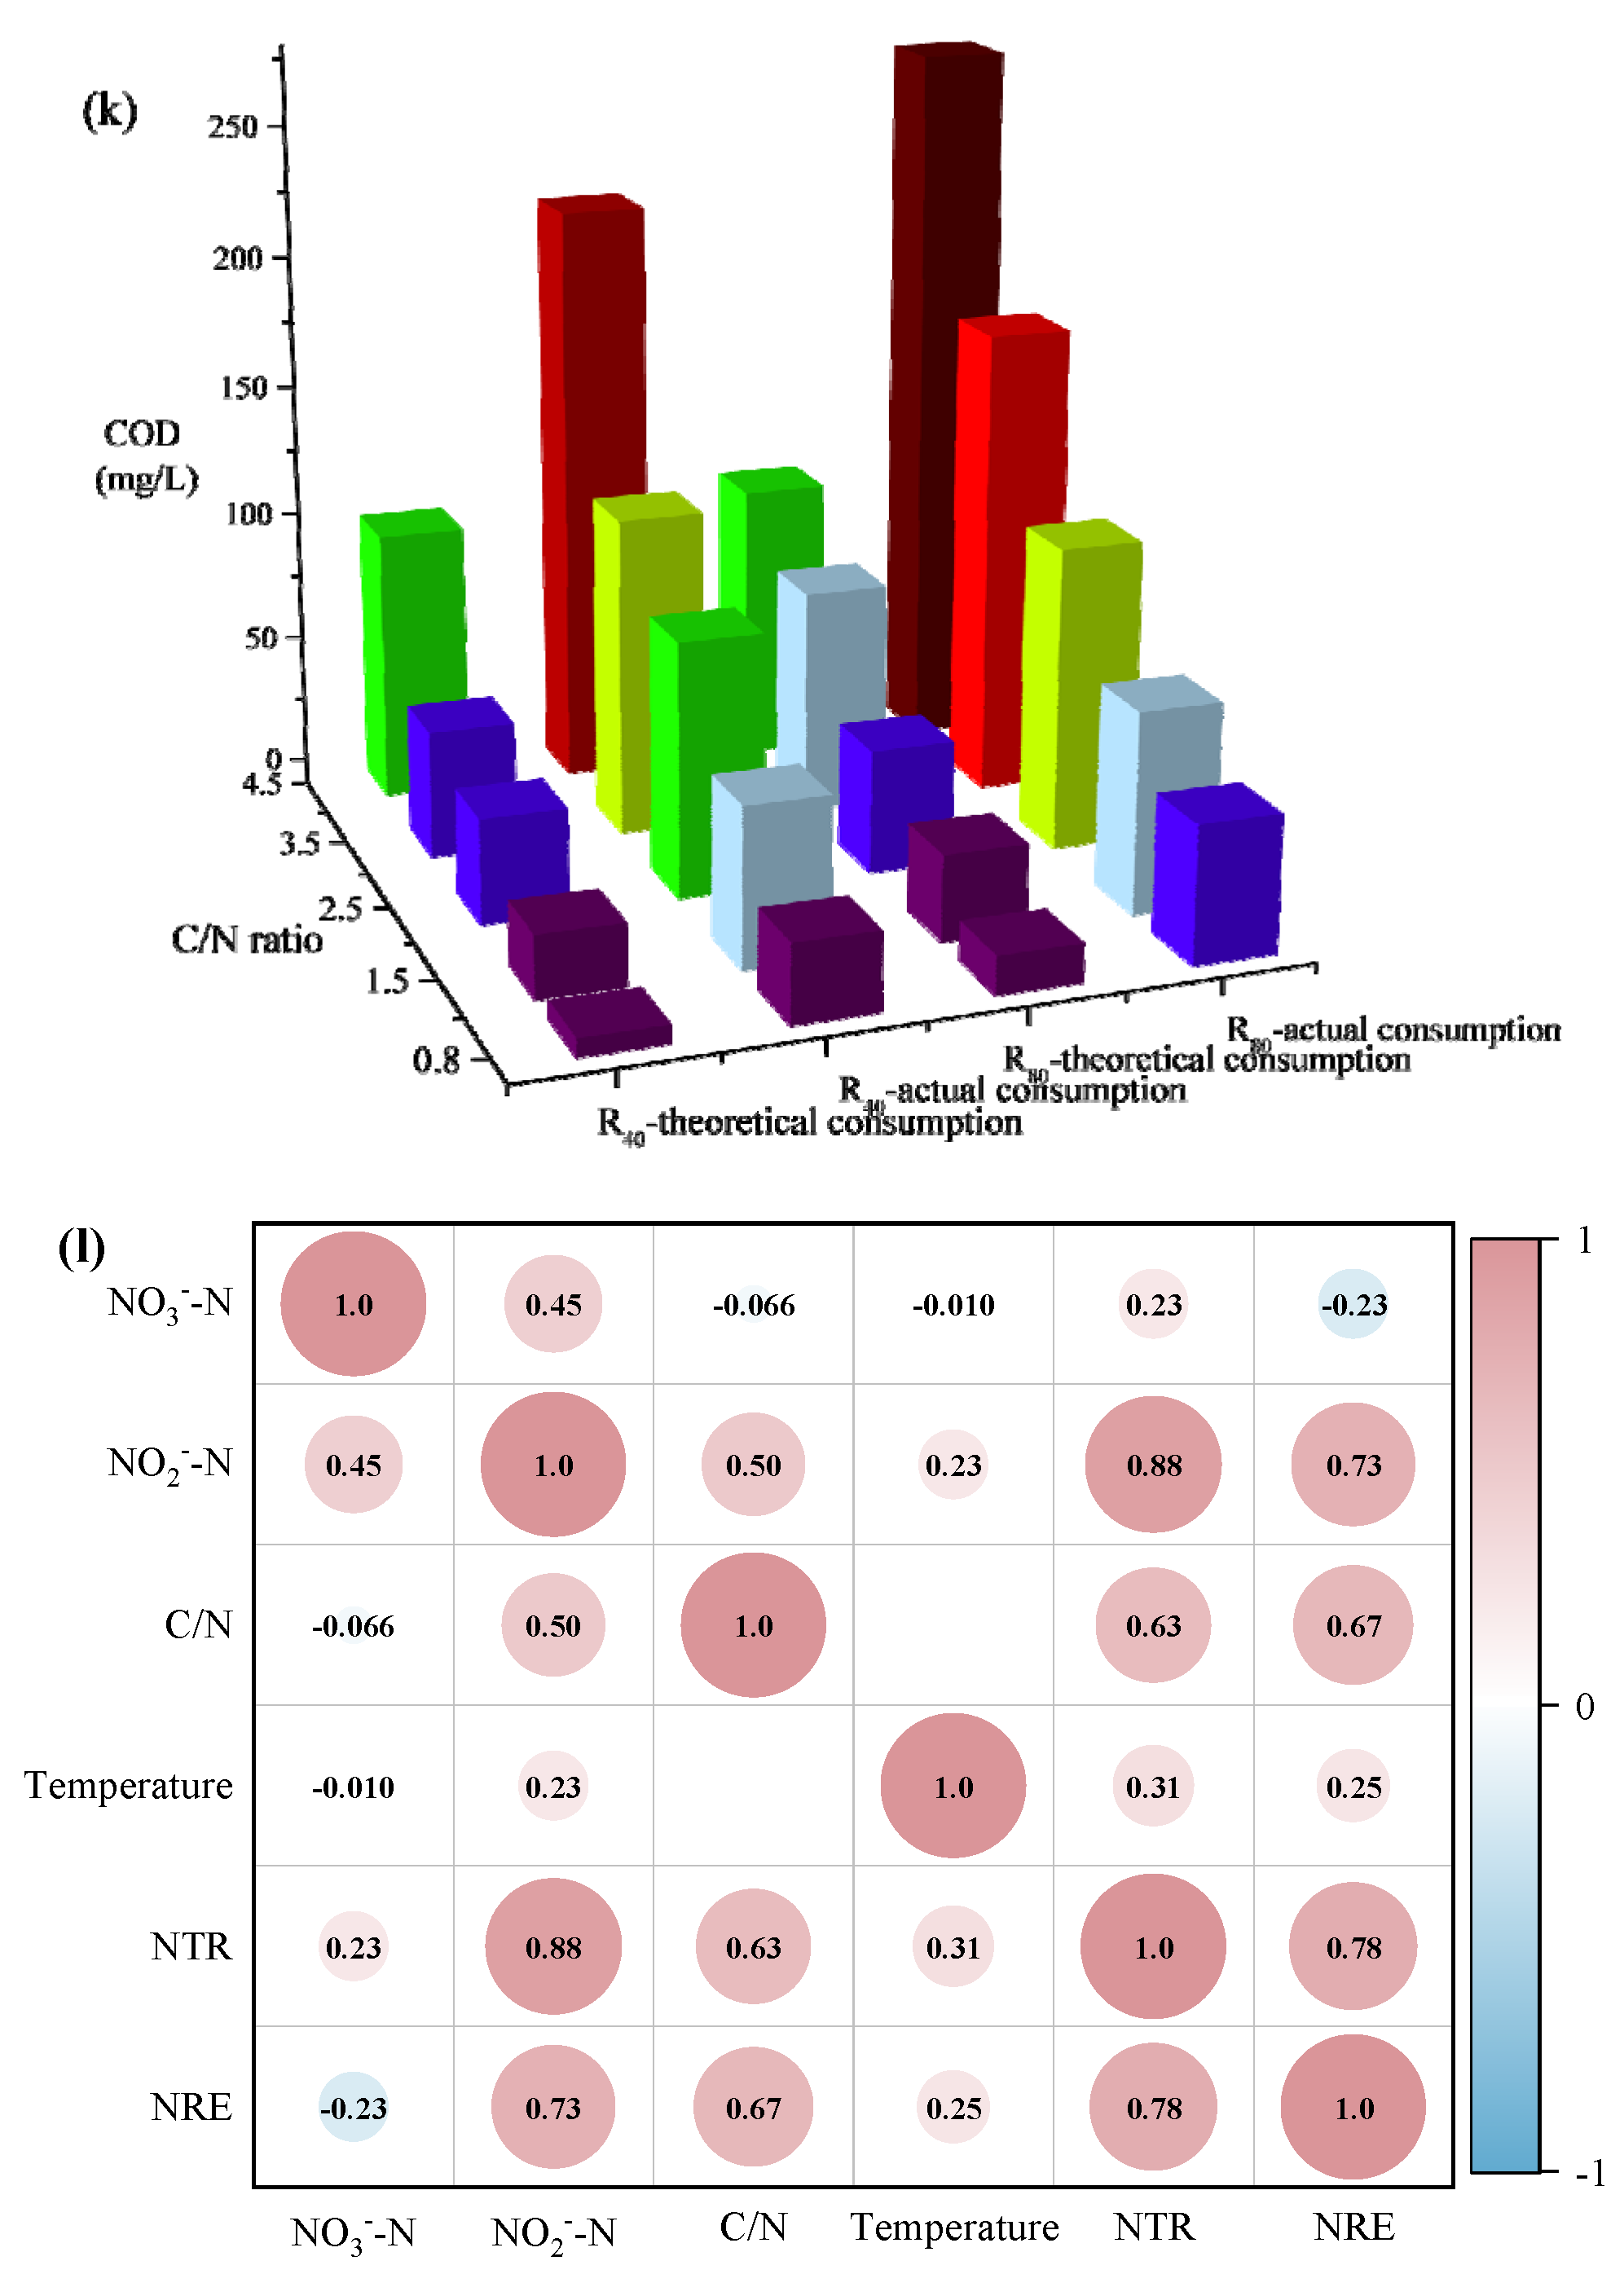
Figure 4.
Microbial diversity analysis based on OTUs (a: Rank-Abundance curves; b: Hierarchical clustering tree; c: Venn diagram).
Figure 4.
Microbial diversity analysis based on OTUs (a: Rank-Abundance curves; b: Hierarchical clustering tree; c: Venn diagram).
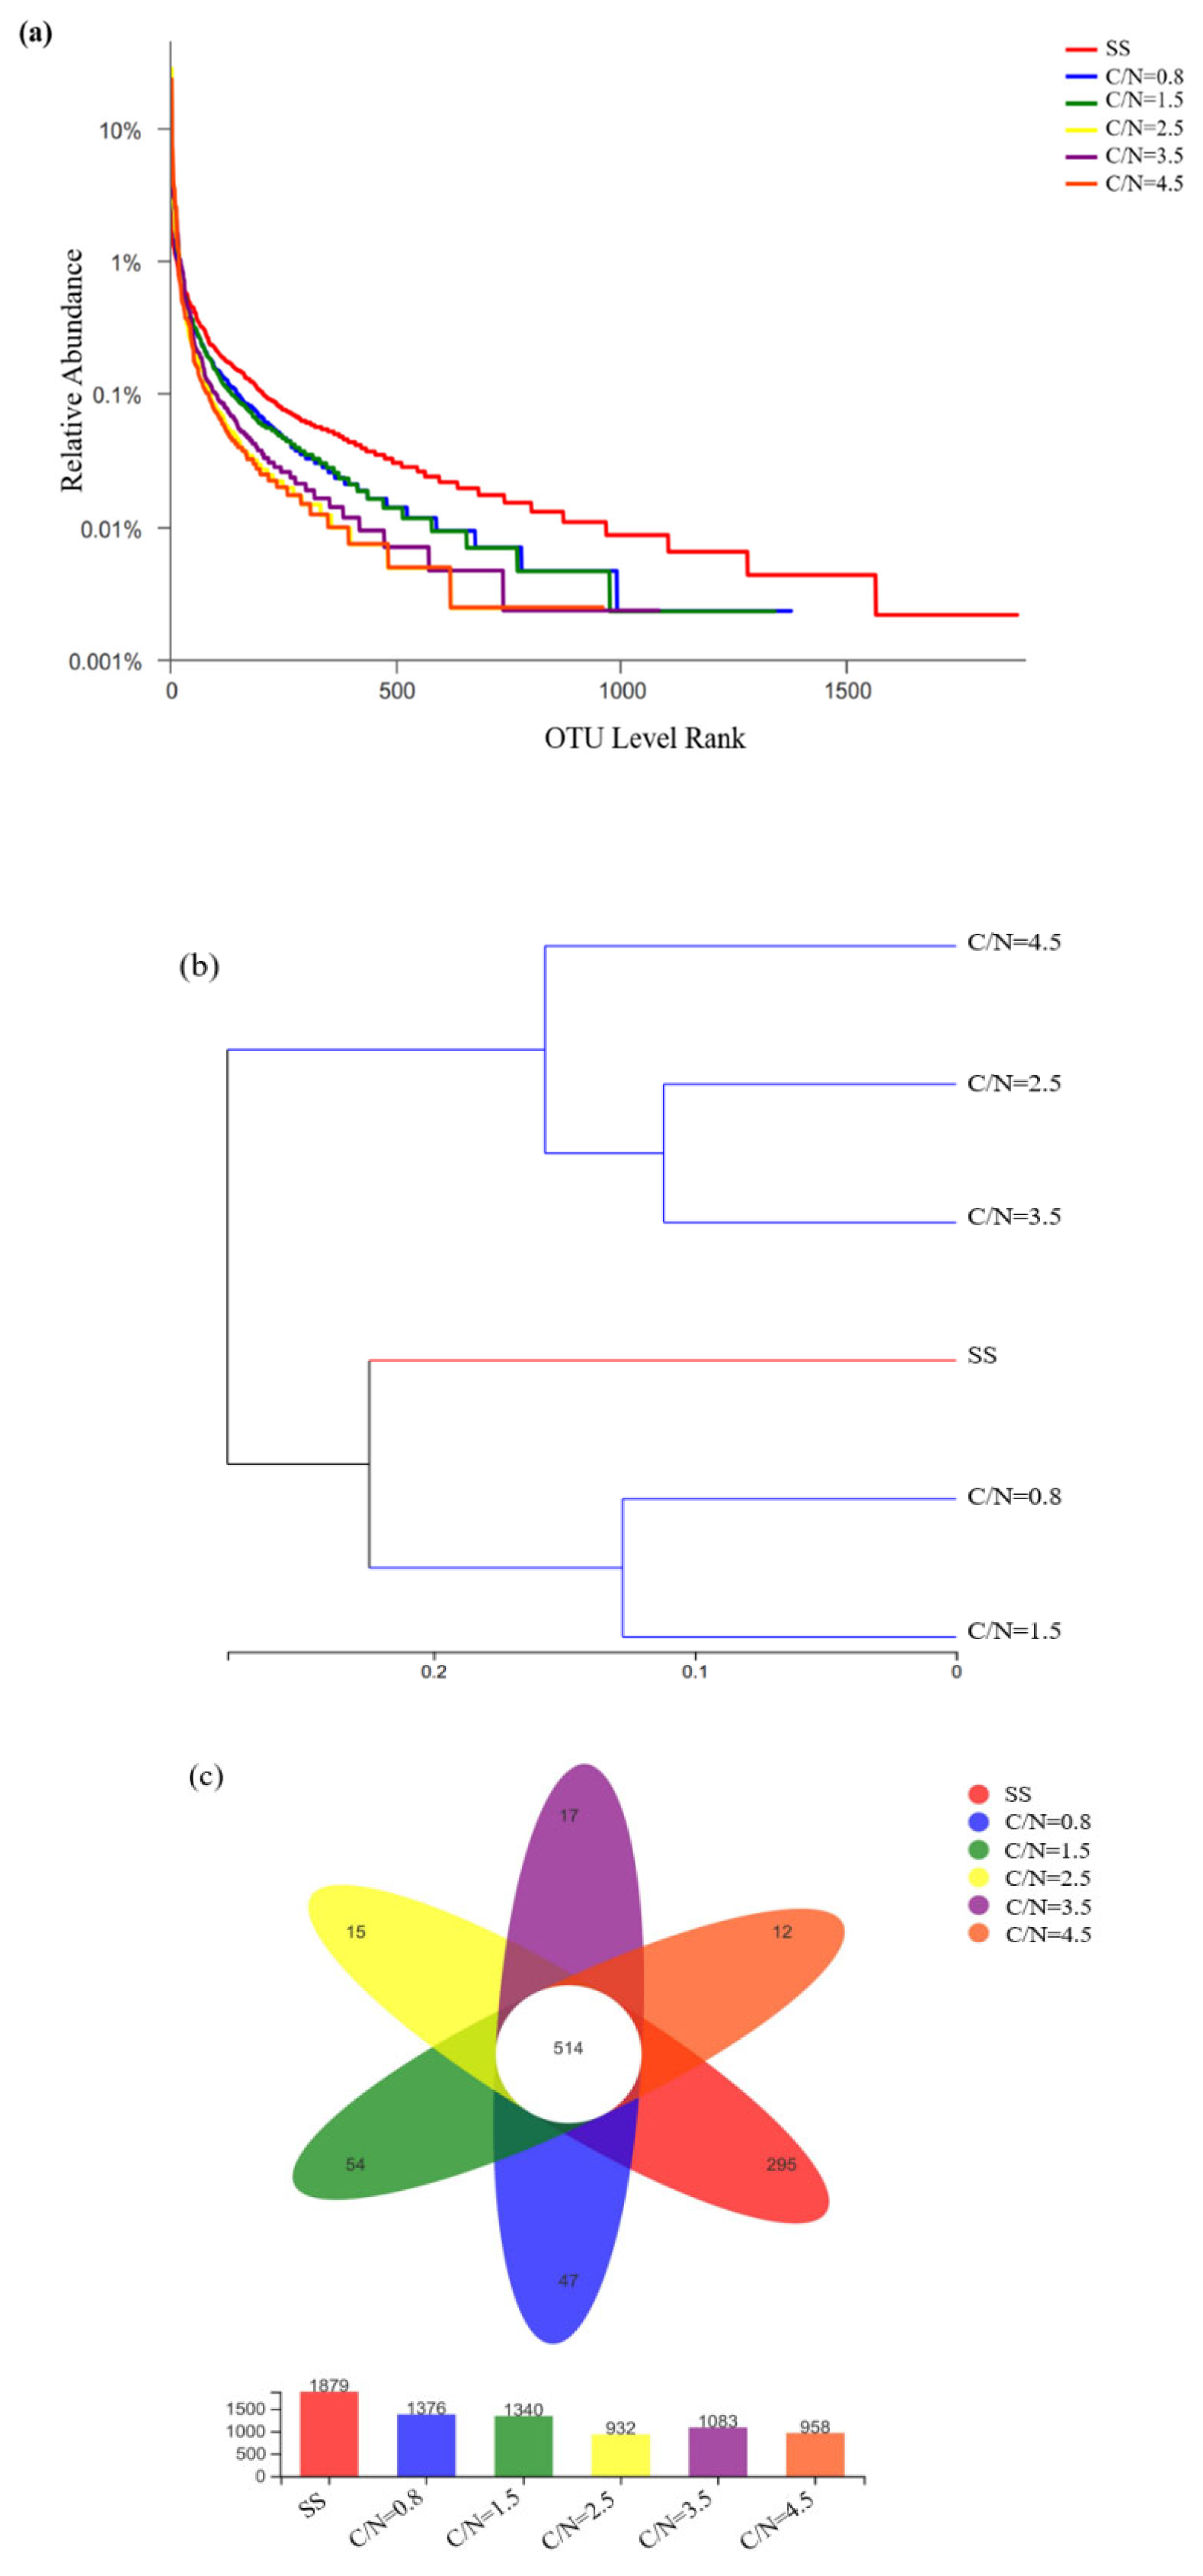
Figure 5.
Microbial taxonomic compositions at the phylum (a, c) and genus level (b, d).
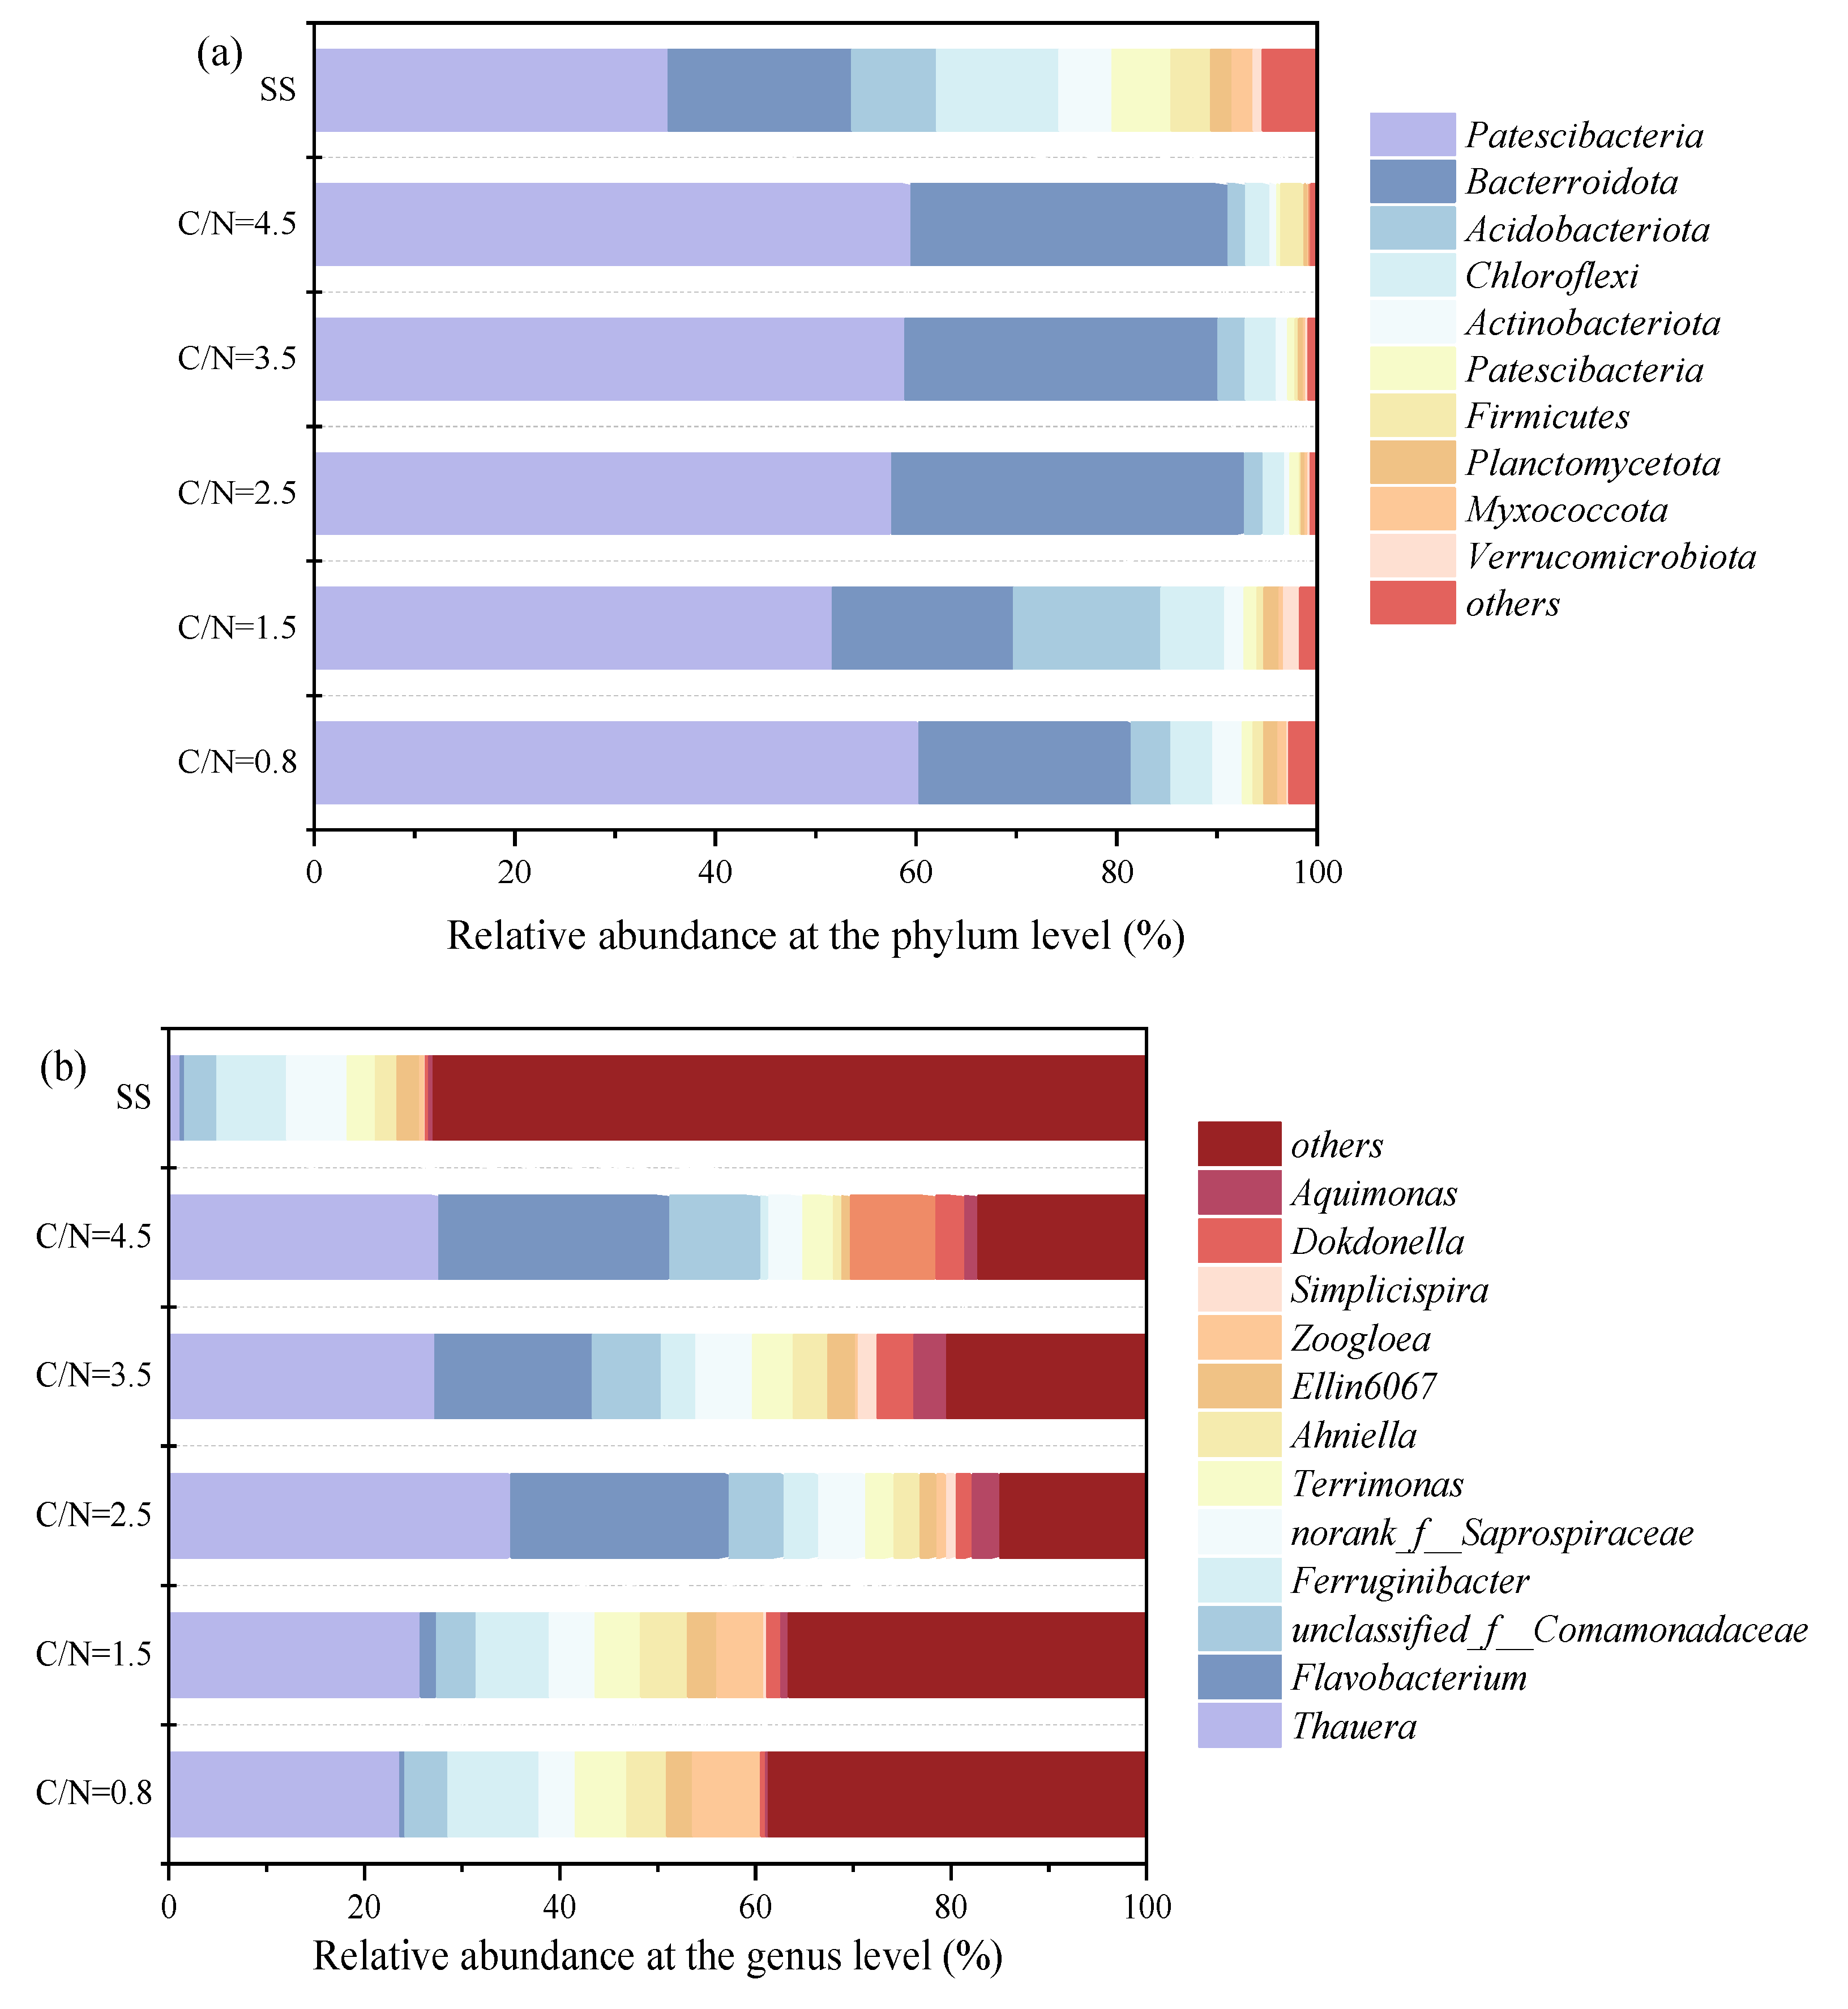
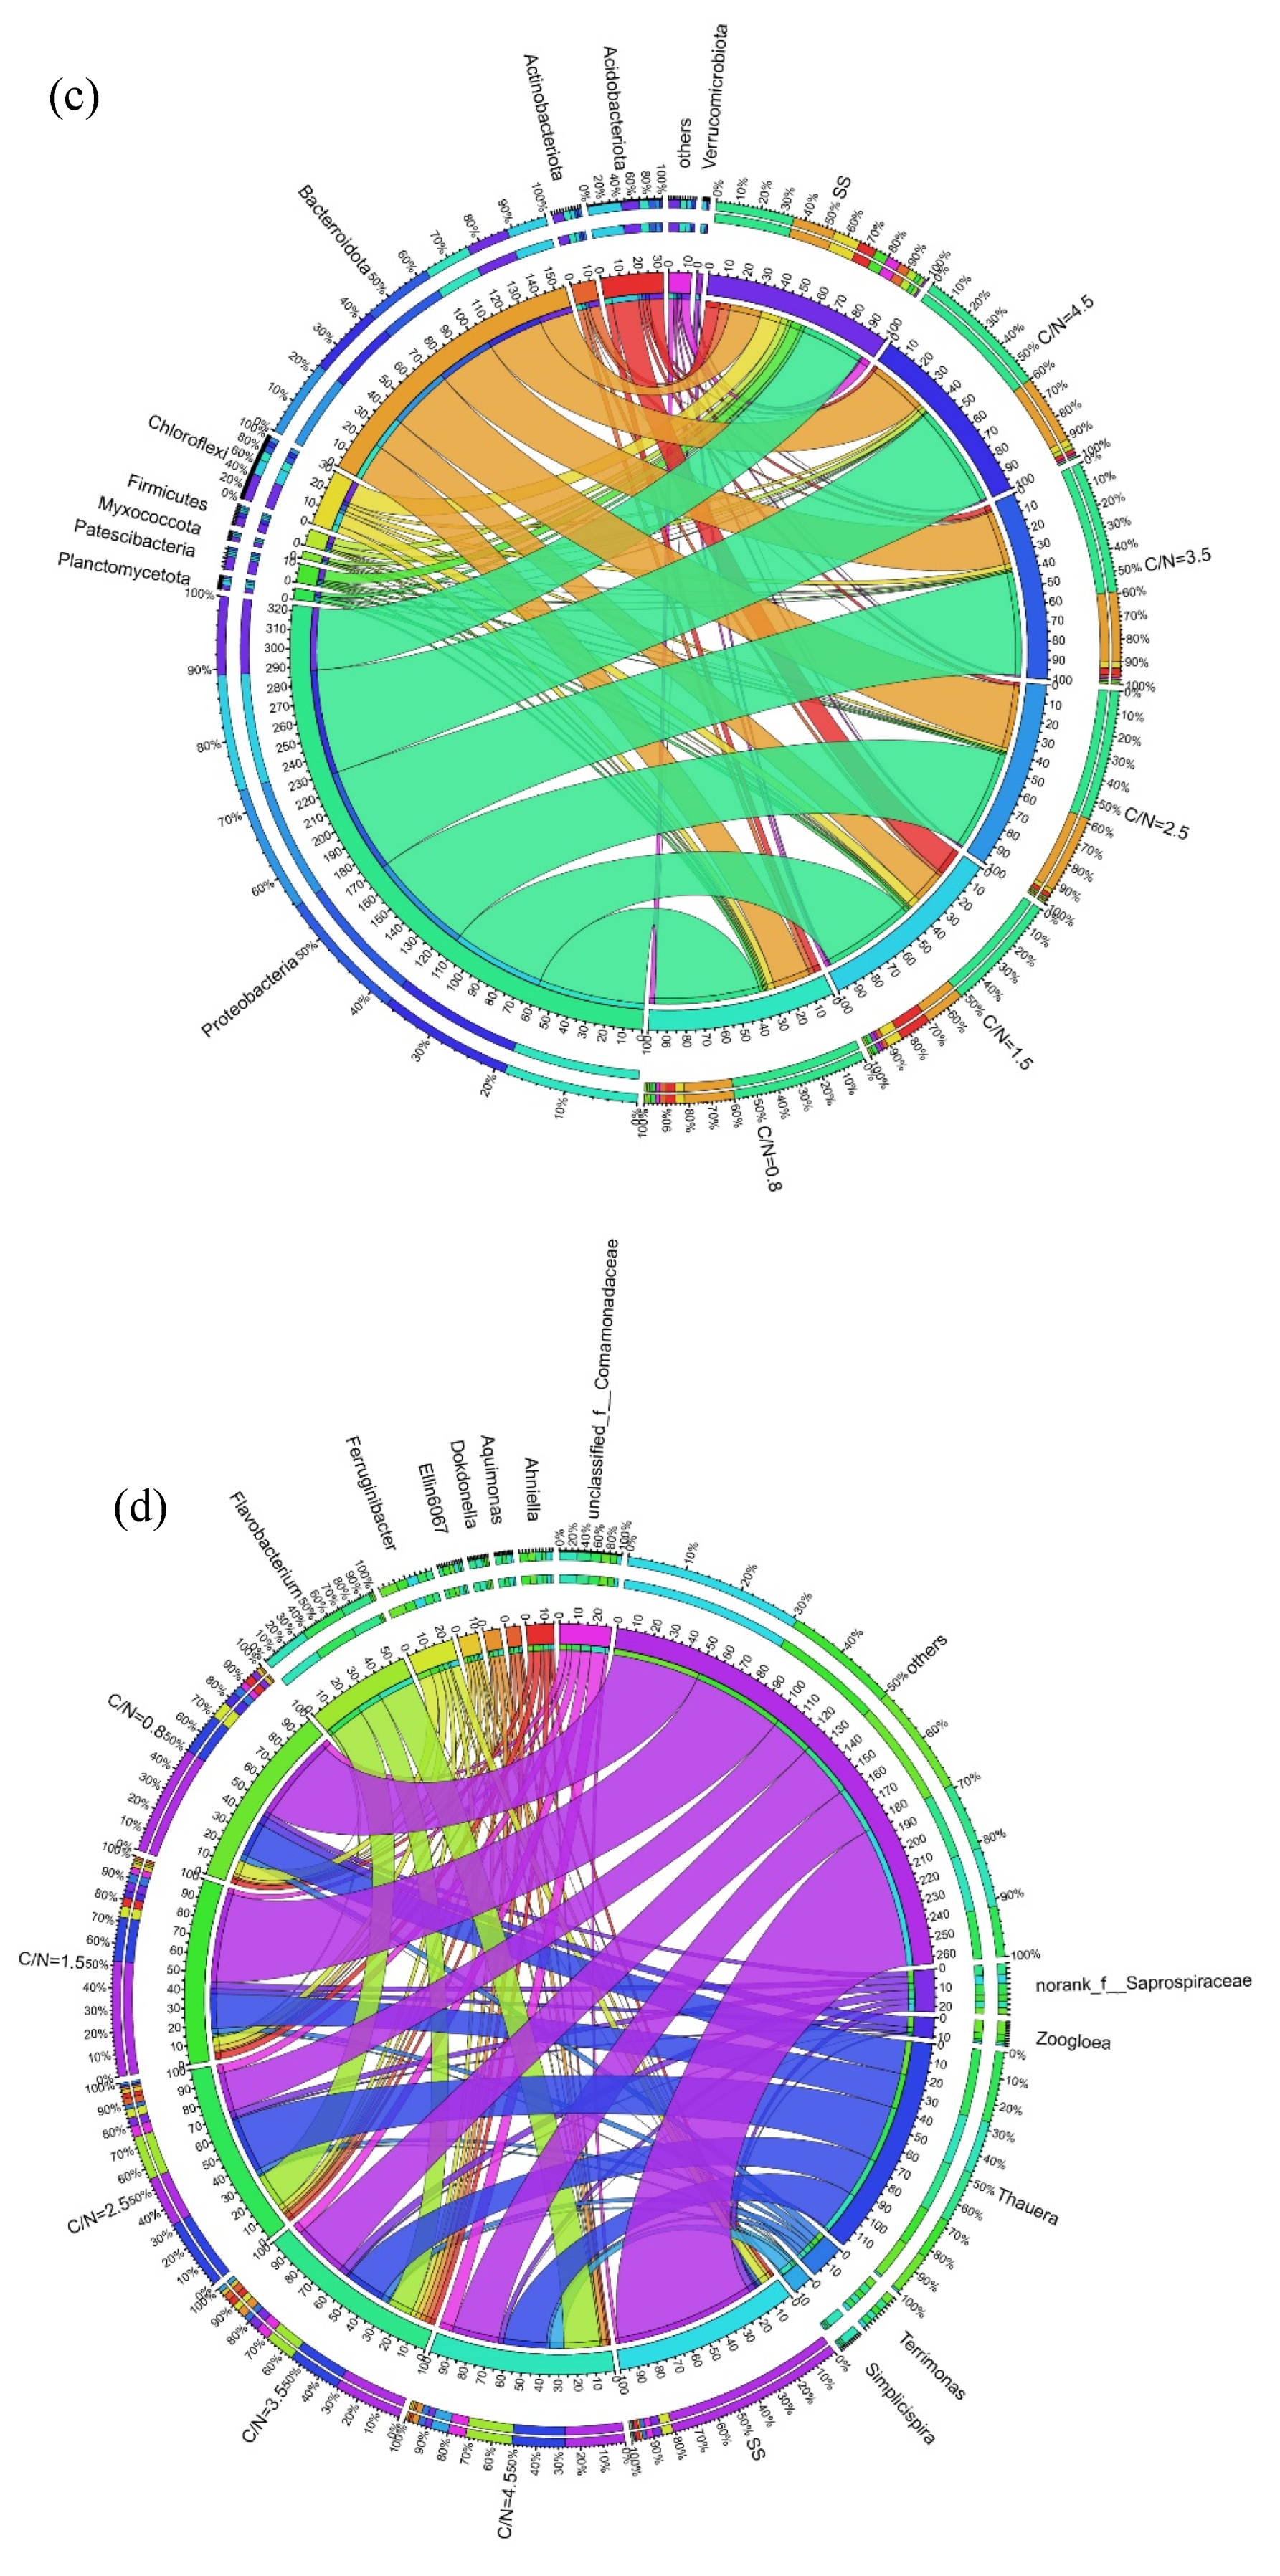
Figure 6.
Mechanism analysis linked with temperature (a) and potential application of PD/A process (b).
Figure 6.
Mechanism analysis linked with temperature (a) and potential application of PD/A process (b).
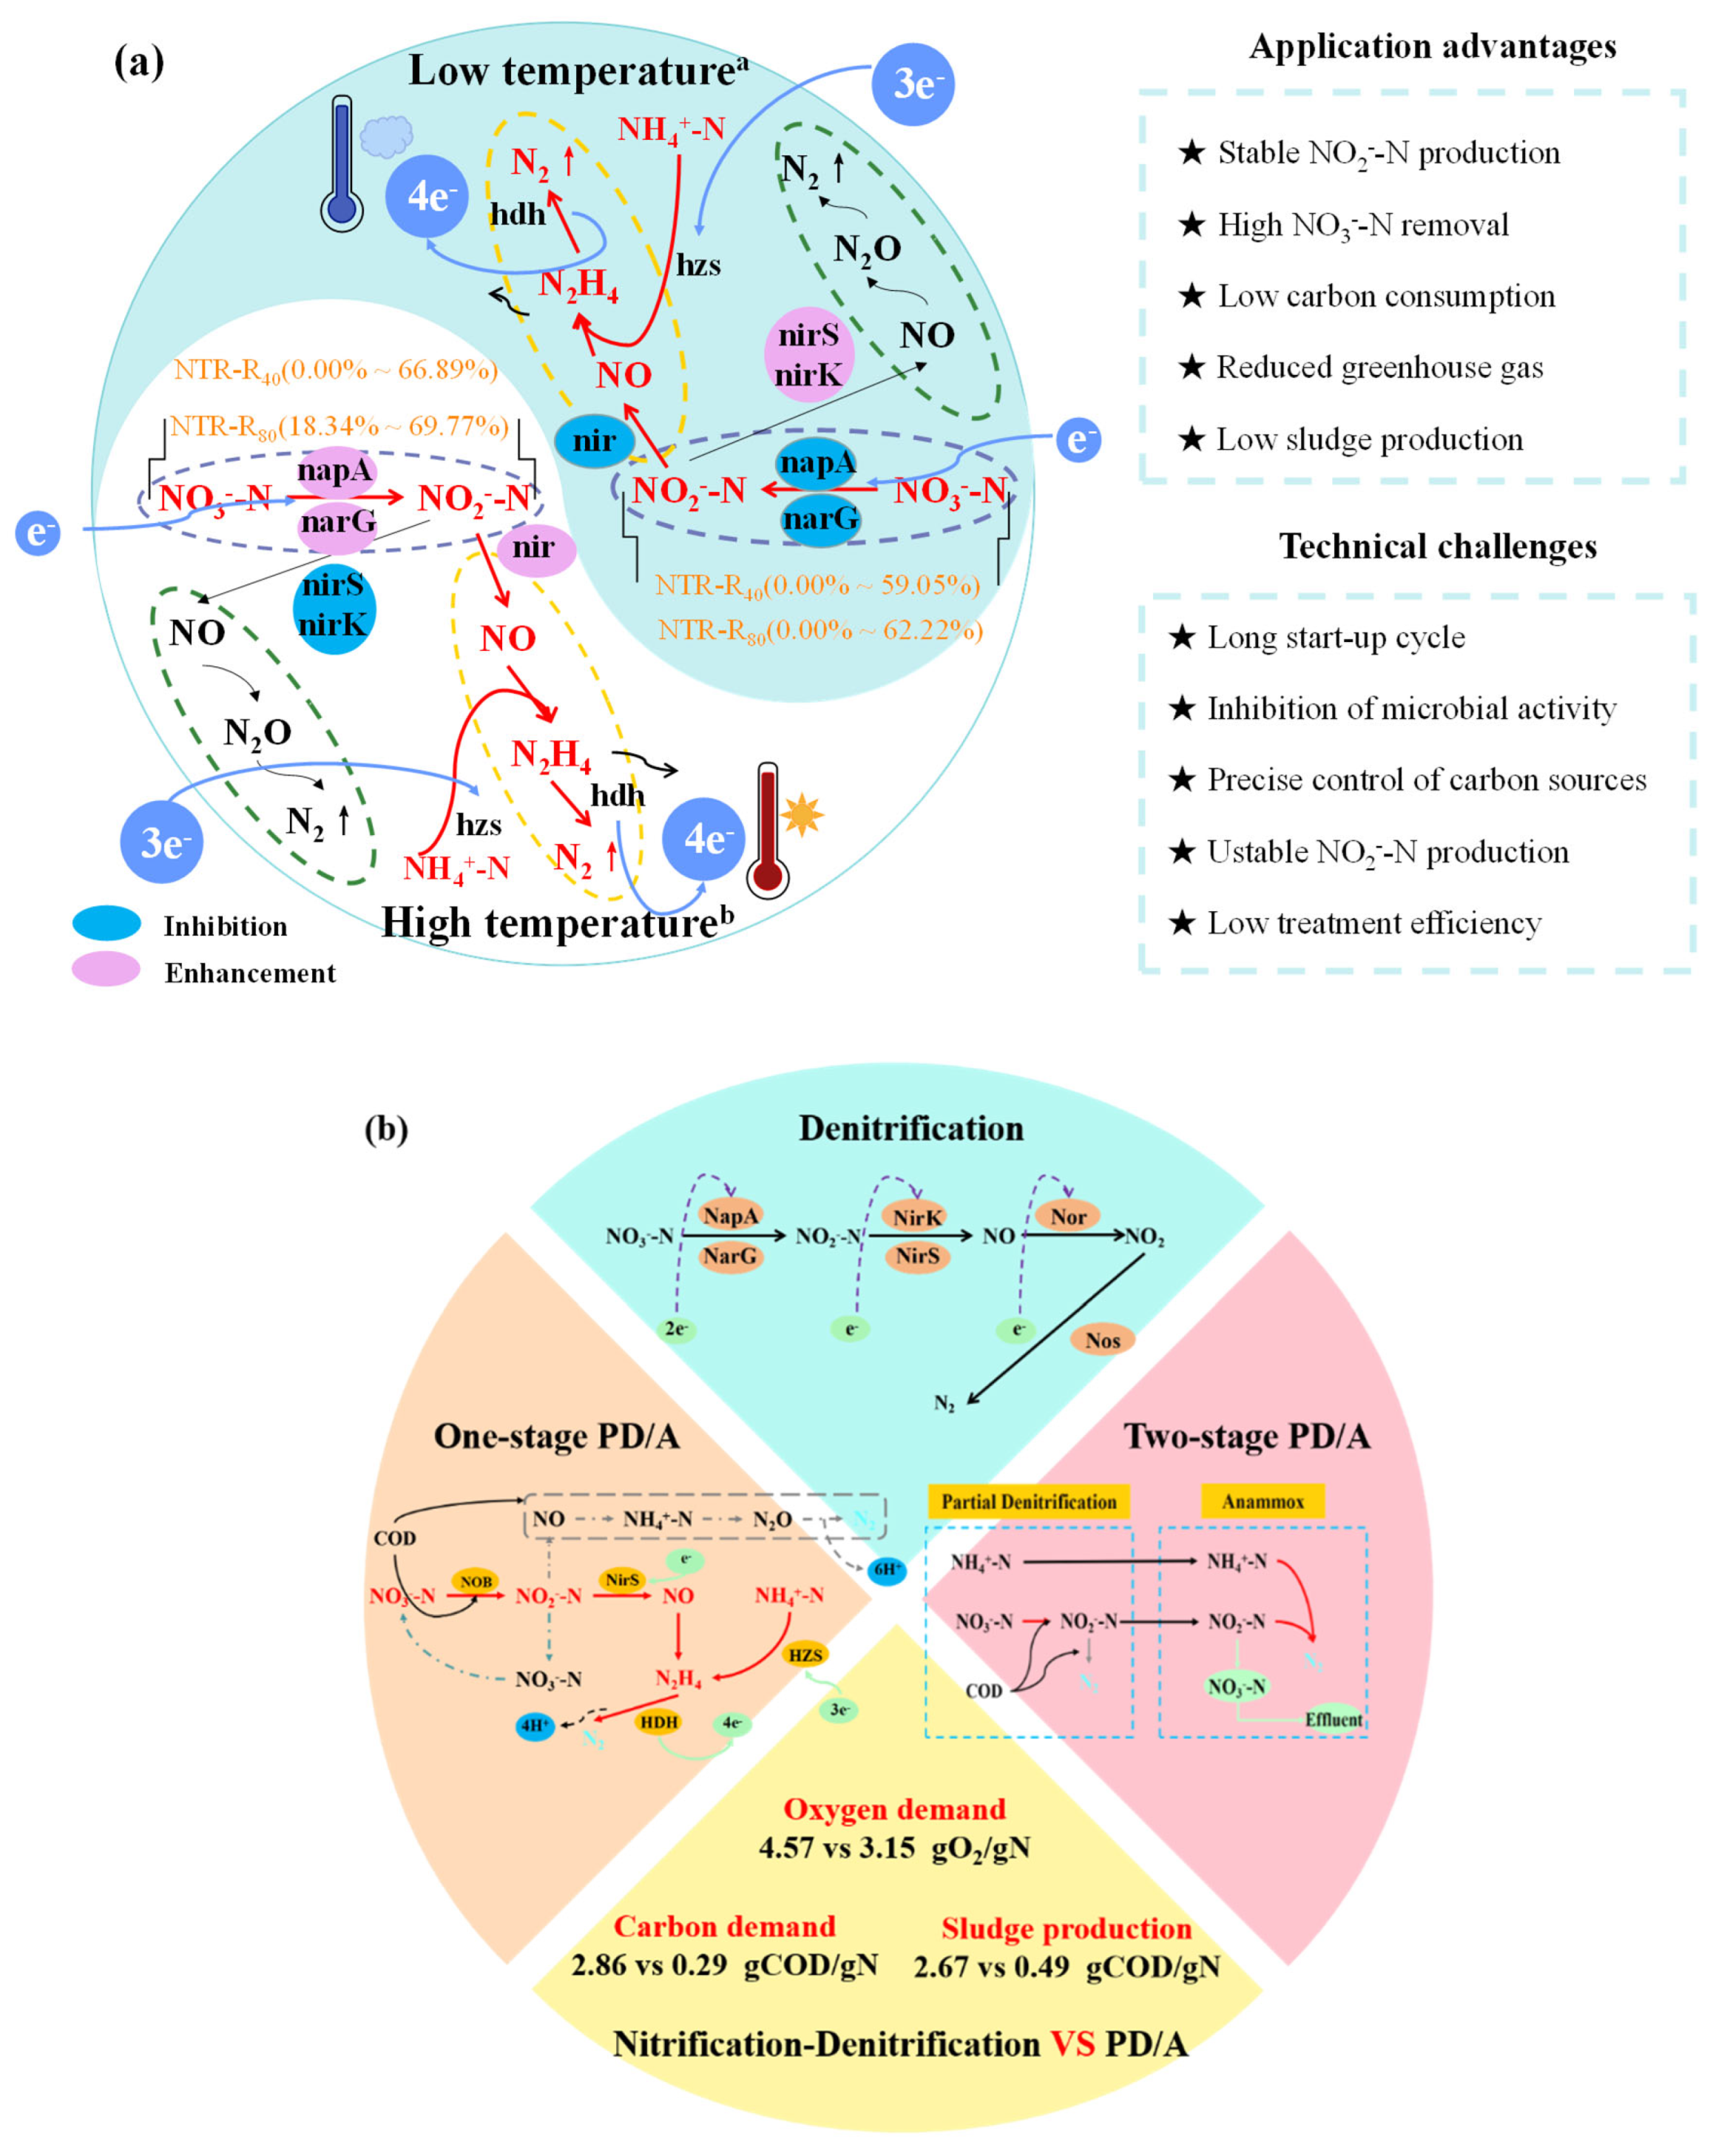

Table 1.
Influent quality characteristics.
| Systems | C/N | Influent NO3--N (mg/L) |
Influent COD (mg/L) |
NTRA (%) |
NREA (%) |
Other parameters |
|---|---|---|---|---|---|---|
| R40 | 0.8 | 40±1 | 32±8 | 0.50 | 8.63 | Operation cycle: 270 min Cycle: 120 VSS: 2500±100 mg/L SRT: 25 d Temperature: 10 - 5 ℃ |
| 1.5 | 40±2 | 60±7 | 27.79 | 31.10 | ||
| 2.5 | 40±1 | 100±5 | 31.54 | 40.15 | ||
| 3.5 | 40±1 | 140±9 | 52.87 | 54.96 | ||
| 4.5 | 40±2 | 180±8 | 48.87 | 45.67 | ||
| R80 | 0.8 | 80±1 | 64±6 | 19.15 | 9.16 | |
| 1.5 | 80±2 | 120±7 | 46.00 | 24.68 | ||
| 2.5 | 80±1 | 200±6 | 57.12 | 51.19 | ||
| 3.5 | 80±1 | 280±8 | 60.42 | 55.75 | ||
| 4.5 | 80±2 | 360±9 | 56.98 | 40.55 |
A: The average values during the stable operation.
Table 2.
Comparisons of microbial diversity index.
| Samples | Sequence | OTUs | ACE | Chao | Shannon | Simpson | Coverage |
|---|---|---|---|---|---|---|---|
| SS | 50347 | 1879 | 2084 | 2052 | 6.09 | 0.006 | 0.993 |
| C/N=0.8 | 60472 | 1376 | 1752 | 1727 | 4.88 | 0.040 | 0.991 |
| C/N=1.5 | 49551 | 1340 | 1693 | 1666 | 4.87 | 0.038 | 0.992 |
| C/N=2.5 | 46142 | 932 | 1296 | 1276 | 3.81 | 0.095 | 0.992 |
| C/N=3.5 | 50825 | 1083 | 1469 | 1445 | 4.29 | 0.057 | 0.992 |
| C/N=4.5 | 44032 | 958 | 1564 | 1370 | 3.84 | 0.076 | 0.992 |
Table 3.
Comparisons of PD performance under different C/N ratios, NO3--N concentrations and temperatures.
Table 3.
Comparisons of PD performance under different C/N ratios, NO3--N concentrations and temperatures.
| Reactors | Working volume (L) | Carbon source | C/N ratio | Influent NO3--N (mg/L) |
Temperature (℃) |
NTR (%) |
References |
|---|---|---|---|---|---|---|---|
| SBR | 10 | Acetate | 2.5 | 41.6 | 22±2 | 71.7 | (Gong et al., 2013a) |
| SBR | 5 | Acetate | 2.5 | 30 - 400 | 23.6 - 28.8 | 83.3 | (Du et al., 2017b) |
| SBR | 5 | Acetate | 3.0 | 25 | 16 - 28 | ~80 | (Du et al., 2016c) |
| SBR | 5 | Acetate | 3.0 | 50 | 10.6 - 18.3 | 57.5 | (Du et al., 2016b) |
| SBR | 12 | Glycerol | 2.5 - 2.8 | 100 | 20 - 23 | 72.5, C/N=2.6 | (Matthew et al., 2017) |
| SBR | 10 | Acetate | 2.5 - 4.5 | 80 | 3 - 12 | 76.79, C/N=2.5 75.57, C/N=3.5 68.15, C/N=4.5 |
This study |
Disclaimer/Publisher’s Note: The statements, opinions and data contained in all publications are solely those of the individual author(s) and contributor(s) and not of MDPI and/or the editor(s). MDPI and/or the editor(s) disclaim responsibility for any injury to people or property resulting from any ideas, methods, instructions or products referred to in the content. |
© 2025 by the authors. Licensee MDPI, Basel, Switzerland. This article is an open access article distributed under the terms and conditions of the Creative Commons Attribution (CC BY) license (http://creativecommons.org/licenses/by/4.0/).
Copyright: This open access article is published under a Creative Commons CC BY 4.0 license, which permit the free download, distribution, and reuse, provided that the author and preprint are cited in any reuse.


