
Submitted:
14 July 2025
Posted:
15 July 2025
You are already at the latest version
Abstract
Background: Pancreatic cancer ranks as the fourth leading cause of cancer-related deaths in the USA. The human aldehyde dehydrogenase (ALDH) family comprises 19 functional members and has been implicated in prognosis and therapy resistance. However, it remains unclear which specific ALDHs are associated with adverse prognoses in pancreatic cancer.
Methods: We obtained transcriptomic and clinical data for pancreatic adenocarcinoma (PAAD) from the TCGA, corresponding mutational data, and normal pancreatic tissue transcriptomic data from GTEx. Prognostic analysis was carried out using Kaplan-Meier. KEGG and GO analyses were used for biological signaling pathways, and ESTIMATE algorithms for tumor microenvironment (TME) assessment. CIBERSORT algorithm immune infiltration analysis and OncoPredict algorithms were employed for predicting chemotherapy sensitivity.
Results: Our study identified four of the 19 ALDH genes (ALDH1L1, ALDH3A1, ALDH3B1, ALDH5A1) that were significantly associated with pancreatic cancer prognosis. High expression of ALDH1L1, ALDH3A1, ALDH3B1 was associated with shorter overall survival, while ALDH5A1 expression was associated with longer overall survival of pancreatic cancer patients. Clinicopathological analysis revealed a significant association with KRAS mutational status and ALDH3A1 expression. Immune correlation analysis indicated that high expression of ALDH3A1 and ALDH3B1 were associated with lower expression of CD8+ T cell-associated gene expression. ESTIMATE analyses further revealed that high expression of ALDH3A1 and ALDH3B1 was associated with lower levels of immune cell infiltration. PAAD tumors with low ALDH3A1 expression were more sensitive to paclitaxel. Immunohistochemical analysis demonstrated high expression of ALDH3A1 in pancreatic cancer cells of human tumor tissues compared to normal pancreatic tissues.
Conclusions: This study unveils specific ALDHs family members relevant for prognosis and chemotherapy response in pancreatic cancer patients. These findings contribute valuable insights into prognostic biomarkers and their potential clinical utility in the treatment of pancreatic adenocarcinoma.
Keywords:
Pancreatic cancer
; ALDH family
; biomarkers
; chemoresistance
; immune infiltration
1. Introduction
Pancreatic adenocarcinoma (PAAD) is one of the most aggressive solid malignancies and it is the fourth leading cause of cancer-related deaths in the USA[1]. PAAD is projected to be the second leading cause of cancer-related deaths by 2030[2]. Unfortunately, most patients present with advanced disease because pancreatic cancer is difficult to diagnose. For patients with resected disease, adjuvant therapy e.g. with modified 5-fluorouracil (5-FU), irinotecan, oxaliplatin, or gemcitabine is recommended[3,4]. Moreover, advancements in neoadjuvant chemotherapy have played a pivotal role in improving the management of borderline resectable or locally advanced pancreatic cancer and have significantly improved the long-term outcomes for these patients[5]. However, pancreatic cancer is known for its resistance to conventional treatments, such as chemotherapy and targeted therapy[6]. Therefore, it is critical to identify new prognostic markers and therapeutic targets for patients with PAAD.
Human aldehyde dehydrogenases (ALDHs) are a multigene family with 19 functional members[7]. ALDHs belong to a superfamily of enzymes that are often upregulated in cancer cells and are associated with survival. ALDHs are versatile enzymes with multiple catalytic functions, including aldehyde oxidation, and ester hydrolysis, while also acting as indirect antioxidants through NAD(P)H generation[8]. The relationship between these proteins and chemotherapy resistance and drug targets is well established[9]. Notably, ALDH1A3 exhibits high expression in pancreatic cancer, impacting prognosis and facilitating metastasis[10,11]. ALDH3A1 can be used in combination with chemotherapy to overcome patient-specific drug resistance in non-small cell lung cancer[12]. ALDH2 is associated with the development and progression of multiple cancers and promotes drug resistance[13]. However, it is unknown whether all ALDHs are associated with poor pancreatic cancer prognosis. Here, we performed a comprehensive bioinformatic analysis to identify ALDHs with clinical and prognostic value in PAAD. We further delved into investigating the correlation between ALDHs and immune cell infiltration, as well as their interplay with chemotherapy. This comprehensive analysis aimed to enhance our understanding of how ALDHs influence the tumor microenvironment (TME) in pancreatic cancer and how targeting ALDHs can help to overcome patient-specific drug resistance.
2. Material and Methods:
2.1. Data Sources
Transcriptomic and clinical data for pancreatic adenocarcinoma (PAAD) were obtained from The Cancer Genome Atlas (TCGA; https://portal.gdc.cancer.gov/), including corresponding mutational data. Raw counts were converted to transcripts per million (TPM) and transformed to log2 (TPM + 1) when necessary for subsequent analysis.
2.2. Survival Analysis
The prognostic significance of ALDHs in PAAD was evaluated by comparing overall survival between the high and low ALDHs gene expression groups using Kaplan-Meier curves and the survival package (https://cran.r-project.org/web/packages/survival/). The samples were divided into high and low expression groups using the median expression value of each ALDHs.
2.3. Expression and Clinical Analysis
GEPIA (http://gepia.cancer-pku.cn/index.html) was used to analyze the expression of genes (ALDH1L1, ALDH3A1, ALDH3B1, ALDH5A1) in The Cancer Genome Atlas Program (TCGA) and The Genotype-Tissue Expression (GTEx) datasets[14]. The relative expression levels of genes in the high and low expression groups were further analyzed across different pathological stages.
2.4. Estimation of Tumor Mutational Burden (TMB)
The “maftools” R package was implemented to analyze and visualize the Mutation Annotation Format (MAF) of somatic variants[15]. The relative expression levels of genes (ALDH1L1, ALDH3A1, ALDH3B1, ALDH5A1) in the high and low expression groups were further analyzed in the context of KRAS mutation.
2.5. Functional Enrichment Analysis
The differentially expressed genes (DEGs) between high and low expression groups for ALDH1L1, ALDH3A1, ALDH3B1, ALDH5A1 were analyzed by using the R package “DESeq2”. The potential functions of these DEGs were then analyzed by Gene Ontology (GO) annotation and Kyoto Encyclopedia of Genes and Genomes (KEGG) enrichment pathway analysis by using the R-package “clusterProfiler”[16]. The DEG threshold was set at a |log2 fold change| ≥1 and padj< 0.05 was considered as significant.
2.6. Estimation of Stromal and Immune Scores and Immune Infiltration Analysis
2.7. Chemotherapy Response Prediction
As chemotherapy is commonly used to treat PAAD, the R package “oncoPredict” was used to estimate the chemotherapeutic response, determined by the half maximal inhibitory concentration (IC50) of each PAAD patient on the Genomics of Drug Sensitivity in Cancer (GDSC) database[19,20]. Five commonly used chemotherapeutic drugs were selected and their predicted therapeutic effects compared between the high and low expression groups for ALDH1L1, ALDH3A1, ALDH3B1, ALDH5A1.
2.8. scRNA-seq Analysis and Expression Levels of ALDH3A1 in Pancreatic Cancer Cell Lines
Pancreatic cancer single-cell data analysis was carried out using Tumor Immune Single-cell Hub 2 (TISCH2; http://tisch.comp-genomics.org/). In this study, the PAAD_CRA001160 dataset was used to analyze the expression of several genes, including ALDH1L1, ALDH3A1, ALDH3B1, and ALDH5A1. Additionally, the Human Protein Atlas (HPA; https://www.proteinatlas.org/) was utilized to evaluate ALDH3A1 expression in pancreatic cancer cell lines.
2.9. Cell Culture
Human PAAD cell lines (BxPC-3, Capan-1, AsPC-1, Su.86.86, MIA PaCa-2, PANC-1) were cultured in the incubator at 37 ºC and 5% CO2. Cell lines BxPC-3, AsPC-1, Su.86.86 were maintained in RPMI-1640 medium (Sigma-Aldrich, Germany) with 10% fetal bovine serum (FBS) (Sigma-Aldrich, Germany), penicillin (100 U/mL) and streptomycin (100 mg/mL) (Thermofisher, Germany) and Capan-1 were maintained in RPMI-1640 medium with 15% fetal bovine serum (FBS), penicillin (100 U/mL) and streptomycin (100 mg/mL). PANC-1 were maintained in high glucose Dulbecco’s Modified Eagle’s medium (DMEM) (Sigma-Aldrich, Germany) with 10% fetal bovine serum (FBS), penicillin (100 U/mL) and streptomycin (100 mg/mL) and MIA PaCa-2 were maintained in high glucose Dulbecco’s Modified Eagle’s Medium (DMEM) with 5% fetal bovine serum (FBS),5% horse serum, penicillin (100 U/mL) and streptomycin (100 mg/mL).
2.10. Human Samples
Human pancreatic cancer samples were obtained from the University Medical Center Halle, Martin-Luther-University Halle-Wittenberg, Germany. The use of human samples was conducted in accordance with the ethical principles outlined in the Declaration of Helsinki and was approved under protocol number 2019-037.
2.11. Immunohistochemistry
Consecutive paraffin-embedded tissue sections 4 m thick were deparaffinized and rehydrated using previously described methods[21]. Antigen retrieval was performed on the slides using citrate buffer (pH 6.0) in a microwave oven, and non-specific reactivity was then blocked with 1% BSA in PBS. The sections were incubated with the ALDH3A1 antibody (Santa Cruz Biotechnology, sc-376089,1:300) at 4°C overnight and then incubation with secondary biotinylated antibody (Dako, K0675) and system HRP (Dako, K0675). Color-reaction with Dako DAB+ chromogen kit (Dako K3468, 1:300) and counterstaining with hematoxylin.
2.12. qPCR
Total RNA was extracted from PDAC cell lines and isolated according to manufacturer’s protocol using direct-zol™ Mini-prep Kit (ZYMO RESEARCH EUROPE GMBH, Germany). qPCR was performed using HOT FIREPol® EvaGreen® qPCR Mix Plus (ROX) (Solis BioDyne, Estonia). Sequences for qPCR primers are as follows: ALDH3A1 (human): sense: CTC GTC ATT GGC ACC TGG AAC T, antisense: CTC GCC ATG TTC TCA CTC AGC T; β-Actin (human): sense: AGG CAC CAG GGC GTG AT, antisense: GCC CACA TA GGA ATC CTT CTG AC.
2.13. Western Blot
Proteins were separated by 12% SDS-PAGE and then transferred onto PVDF Blotting Membranes (GE Healtcare Life science, Great Britain). The Membranes incubated with primary ALDH3A1 antibody (1:500) (Santa Cruz Biotechnology, sc-376089) at 4 °C overnight and the secondary antibody at room temperature for 1 h.
2.14. Statistical Analysis
All bioinformatics analyses and visualization were performed using R software v4.2.3 (https://www.r-project.org/) and statistical analyses were performed using Prism v10 (GraphPad, San Diego, USA) .Wilcoxon test was applied for the comparisons between two groups. A P-value < 0.05 was considered statistically significant.
3. Results
3.1. Prognostic Value of ALDHs in PAAD
Kaplan-Meier analysis based on TCGA data was performed to assess the association between ALDHs expression and overall survival (OS) in PAAD patients. In the overall survival analysis, high expression of ALDH1L1 (P = 0.012), ALDH3A1 (P = 0.018), ALDH3B1 (P = 0.002) and low expression of ALDH5A1 (P = 0.030) was found to be significantly correlated with worse survival (Figure 1A–D). These findings indicate that ALDH1L1, ALDH3A1, ALDH3B1 and ALDH5A1 may be useful as prognostic biomarkers in PAAD.
3.2. Correlation Between ALDH Expression in PAAD and ALDH3A1 Levels in Pancreatic Cancer Tissues, Normal Tissues, and Cell Lines
Next, the expression of ALDH1L1, ALDH3A1, ALDH3B1 and ALDH5A1 in pancreatic adenocarcinoma (PAAD) samples was compared with that of matching TCGA and GTEx normal samples using GEPIA. Our findings revealed that ALDH3A1 and ALDH3B1 were significantly upregulated, while ALDH1L1 was significantly downregulated in pancreatic cancer tissues compared to normal tissues (Figure 2A–C). However, there was no significant difference in ALDH5A1 expression between pancreatic cancer and normal tissues (Figure 2D). Single-cell analysis shows that ALDH3A1 is mainly expressed in pancreatic cancer cells (Figure 2E,G,H). To investigate the relationship between ALDH3A1 expression in pancreatic cancer tissues and normal tissues, immunohistochemical staining was performed on human PAAD samples and normal pancreatic tissue samples. (Figure 3E–J). Immunohistochemical analysis demonstrated high expression of ALDH3A1 in pancreatic cancer cells of human tumor tissues compared to normal pancreatic tissues. Moreover, Protein Atlas data analysis revealed that ALDH3A1 is highly expressed in most pancreatic cancer cell lines (Figure 3A). This was further confirmed by qPCR analysis and Western blot of ALDH3A1 expression in pancreatic cancer cell lines (Figure 3B–D). Immunohistochemical staining and single-cell sequencing consistently revealed high ALDH3A1 expression in pancreatic cancer, with localization predominantly in cancer cells within the tumor microenvironment.
3.3. Correlation Between ALDHs Expression and Clinicopathological Parameters in PAAD
KRAS mutations play a critical role in the development and progression of PAAD. To further investigate how gene expression correlates with cancer progression, the association between KRAS mutation and the expression levels of ALDH1L1, ALDH3A1, ALDH3B1 and ALDH5A1 was analyzed. A significant correlation was observed between KRAS mutation and the high expression of ALDH1L1, ALDH3A1, and ALDH3B1 (Figure 4E–G). Further, Tumor Mutational Burden (TMB) is defined as the number of somatic mutations per megabase of interrogated genomic sequence, and TMB analysis was used to compare the mutation rates between above and below median expression groups of the respective genes. The results showed that the frequency of mutations was higher in the ALDH1L1 (86.42%), ALDH3A1 (96.39%), and ALDH3B1 (95.24%) above median group than in the below median group (Figure S2A,B and S3A). This is consistent with the KRAS mutation analysis, which shows that the above median groups of ALDH1L1, ALDH3A1 and ALDH3B1 have a higher mutation rate and KRAS mutation frequency, suggesting that they may play a role in the development and progression of pancreatic cancer. However, no significant differences in the expression levels of ALDH1L1, ALDH3A1, ALDH3B1 and ALDH5A1 were observed according to age, gender and tumor stage (Figure 4A–D, Table S1). The observed correlations with KRAS mutations and elevated TMB levels further support a potential role of ALDH3A1 in PAAD progression.
3.4. Enrichment Analysis on ALDHs
To gain further insight into the underlying biological function of PAAD, Gene Ontology (GO) annotation and Kyoto Encyclopedia of Genes and Genomes (KEGG) enrichment analyses were performed. The results of the GO functional enrichment analysis indicate that ALDH1L1 is involved in the modulation of chemical synaptic transmission (Figure 5A), while ALDH3A1 and ALDH3B1 are involved in the regulation of membrane potential (Figure 5B,C). ALDH5A1 is involved in the production of immunoglobulins (Figure 5D). ALDH1L1 is predominantly expressed in astrocytes, and astrocytes labelled with ALDH1L1 play a critical role in indirectly influencing chemical synaptic transmission and plasticity through their regulatory functions in the neurogenic environment[22,23].
The KEGG analysis revealed that ALDH1L1, ALDH3A1, and ALDH3B1 were significantly enriched in the neuroactive ligand-receptor interaction and pancreatic secretion pathways (Figure 6A-C). ALDH5A1 was identified as being enriched in the neuroactive ligand-receptor interaction and insulin secretion pathways (Figure 6D). Functional and enrichment analyses suggest a potential role for ALDH genes in pancreatic cancer progression through their involvement in neural signaling and secretory regulation within the tumor microenvironment.
3.5. Analysis of the Contribution of ALDHs to Drug Resistance
Based on the above, GO analysis results indicate that modulating chemical synaptic transmission can subsequently alter ROS levels, suggesting that ALDHs may be involved in drug resistance. Next, we evaluated the IC50 of selected compounds in each PAAD sample using the oncoPredict algorithm. PAAD tumors with high ALDH1L1 expression and low ALDH3A1 expression were more sensitive to paclitaxel (Figure 7E,J). Moreover, tumors with high ALDH3B1 expression showed increased sensitivity to irinotecan (Figure 7M). In addition, tumors with high ALDH3B1 and low ALDH5A1 expression were more responsive to oxaliplatin. (Figure 7N,S). This finding suggests that the levels of ALDH expression may serve as a predictive indicator of chemotherapy response in patients with PAAD.
3.6. Correlations Between ALDHs Expression of Immune Infiltration
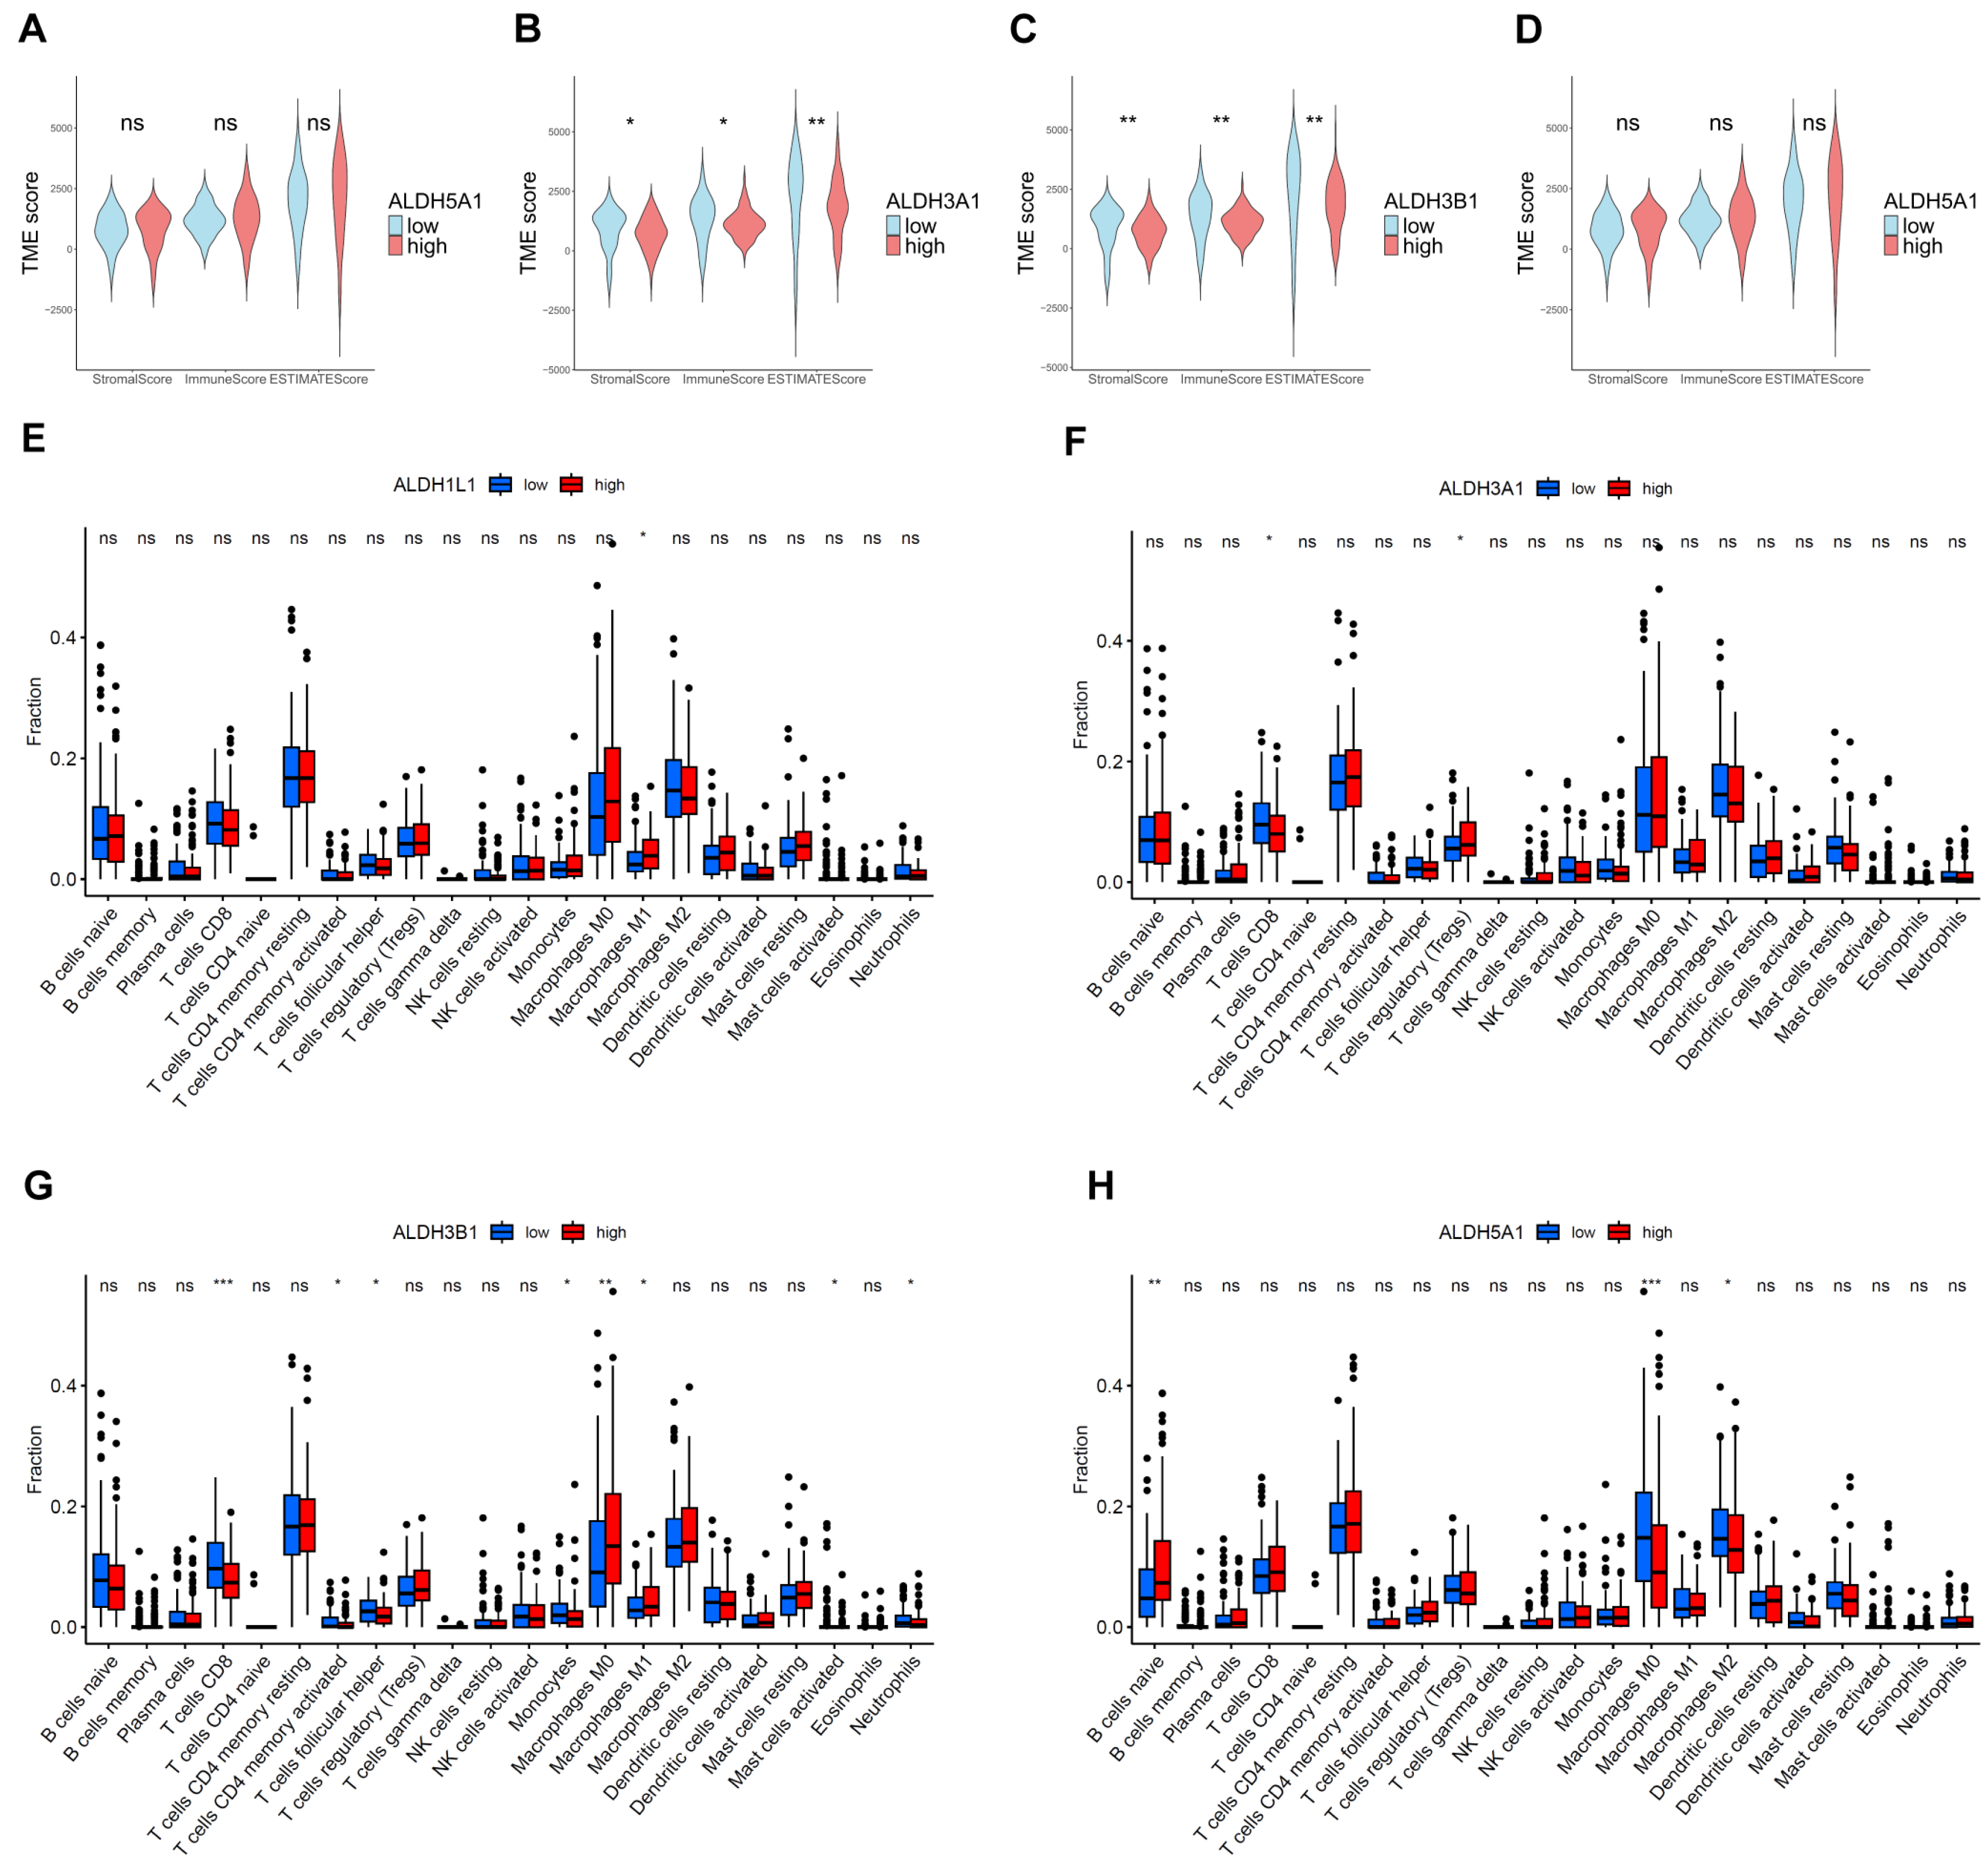
Immune cell infiltration in the tumor microenvironment is an important indicator of tumor immune evasion and the patient's immune response capacity and plays a key role in predicting tumor prognosis and treatment response. The results of the ESTIMATE analysis indicated that the TME scores in the ALDH3A1 and ALDH3B1 below median groups were higher than those in the ALDH3A1 and ALDH3B1 above median group (Figure 8A,B). Furthermore, the results of the immune infiltration analysis indicated that high expression of ALDH3A1 and ALDH3B1 was associated with a lower expression of CD8+ T cell-associated gene expression (Figure 8F,G).
4. Discussion
Pancreatic cancer is characterized by late diagnosis, a poor prognosis and high therapeutic resistance[24]. ALDHs are crucial detoxifying enzymes that protect cells from oxidative stress by converting toxic aldehydes into less harmful carboxylic acids, thereby playing essential roles in a variety of pathological conditions[25]. Several previous studies have investigated the association between ALDH family members and expression in cancer tissues, prognosis, as well as their involvement in drug resistance[26,27,28]. Among them, ALDH3 family members (ALDH3A1, ALDH3A2, ALDH3B1, and ALDH3B2) can either promote tumor progression by enhancing survival, chemoresistance, and stemness through metabolic reprogramming, or suppress it by inducing reductive stress and inhibiting tumor-supportive microenvironments[29]. ALDH activity is essential for maintaining a subpopulation of drug-resistant cancer cells by mitigating the toxicity of reactive oxygen species (ROS). Further, inhibiting ALDH sensitizes these cells to kinase inhibitors, providing a promising combination therapy strategy[28]. ALDH, particularly ALDH1 family members, plays a key role in maintaining cancer stem cells and mediating resistance to therapy[30,31]. Consistently, following chemotherapy treatment, the number of cells with high ALDH activity (ALDH⁺ cells) may increase, raising the possibility of resistance development[32]. ALDH family members have specific role in certain tumors. For example, ALDH1A3 is a key regulator of breast cancer stem cell plasticity, metabolic reprogramming and tumor progression[33]. In intrahepatic cholangiocellular carcinoma, ALDH1A1 overexpression is associated with improved overall survival, suggesting its potential as a prognostic biomarker[34]. In contrast, ALDH1L1 is significantly downregulated in hepatocellular carcinoma, and its low expression is associated with poor prognosis[35]. ALDH5A1 is downregulated in ovarian cancer, and its high expression is associated with improved prognosis, suggesting its potential as a favorable prognostic biomarker[36]. Moreover, ALDH1A1 and ALDH3A1 are highly expressed in non-small cell lung cancers, particularly squamous cell carcinoma and adenocarcinoma, and their upregulation may be associated with malignant transformation[37]. In this study comprehensively analyzed ALDHs in PAAD and identified four genes (ALDH1L1, ALDH3A1, ALDH3B1, ALDH5A1) as prognostic indicators for pancreatic cancer. Furthermore, we analyzed differences in terms of function, clinical parameters, immune microenvironment and drug sensitivity.
It is further shown that ALDH3A1 and ALDH3B1 are overexpressed in tumor tissues, which is associated with a worse prognosis. In line, a previous study indicated that ALDH3A1 could be used as a prognostic marker in pancreatic cancer and may play an important role in mitochondrial energy metabolism[38]. Furthermore, immunohistochemical analysis demonstrated high expression of ALDH3A1 of human tumor tissues compared to normal pancreatic tissues. Additionally, ALDH3A1 is highly expressed in most pancreatic cancer cell lines. The most frequent mutations of pancreatic cancer are KRAS, TP53, CDKN2A, and SMAD4, with a KRAS mutation rate of more than 90%6. The results of our study indicate that the expression of ALDH3A1 and ALDH3B1 is significantly up-regulated in patients with KRAS mutations compared to wild-type patients. Consistently, Tumor Mutational Burden (TMB) analysis showed KRAS mutations were higher in tumors with high ALDH3A1 and ALDH3B1 expression (76% and 81%, respectively) than in those with low expression (44% and 38%, respectively). KRAS plays a pivotal role in the initiation, growth, progression, local and distant invasion of pancreatic cancer[39]. The results of this study indicate that ALDH3A1 may be a key factor in the occurrence and development of PAAD.
The tumour microenvironment (TME) is a complex entity comprising the extracellular matrix (ECM), immune cells, fibroblasts, endothelial cells, and other cell types. At different stages of tumor progression, cancer cells interact with the TME and play an important role in tumor initiation, growth and metastasis[40]. The identification of factors that determine the extent of immune infiltration is significant, as increased immune cell infiltration into tumors can predict response to immune therapies[41].In our analysis, CD8+ T cells also showed higher infiltration in tumors with low ALDH3A1 and ALDH3B1 expression. Cytotoxic CD8+ T cells are the most prominent effector cell type in cancer immunotherapy and major killers of neoplastic cells[42]. The above findings suggest that ALDHs may be linked to immune cell infiltration and, consequently, with the tumor microenvironment in PAAD.
ALDHs play a pivotal role in the resistance to drug resistance observed in numerous cancers. Gene Ontology (GO) analysis reveals that ALDHs influence chemical synaptic transmission, a process that affects reactive oxygen species (ROS) production due to the metabolic demands of active synapses[43]. These demands ALDHs can influence ROS levels. As chemotherapeutics generate elevated levels of oxidative stress in cancer cells, ALDHs may serve to protect cancer cells against these therapeutic approaches by maintaining reactive oxygen species (ROS) at low levels[44]. Furthermore, by modulating chemical synaptic transmission and subsequently altering ROS levels, ALDHs may contribute to the development of drug resistance. Croker et al. reported that elevated levels of ALDH enzymes in breast cancer cells contribute to the development of resistance to chemotherapy[45]. In melanoma, ALDH1A1 mediates resistance to MAPK/ERK inhibitors by activating PI3K/AKT signaling[46]. ALDH1A1-positive ovarian cancer cells have been shown to contribute to resistance to paclitaxel and topotecan[47]. ALDHs have also been observed to display high activity in cancer stem cells (CSCs) and to function as a biomarker for cancer stem cells (CSCs) [48]. In addition, elevated ALDHs activity is associated with resistance of CSCs to chemotherapeutic drugs[49]. For instance, ALDH1A1-positive lung cancer stem cells are enriched in EGFR TKI–resistant tumors and contribute to resistance against gefitinib[50]. Our data showed that pancreatic cancer with low ALDH3A1 expression were predicted to be more sensitive to paclitaxel. Similarly, high ALDH3A1 expression has been linked to chemoresistance in albumin paclitaxel plus gemcitabine-resistant pancreatic cancer cells, possibly by modulating intracellular oxidative stress levels[51]. These results suggest that ALDH3A1 may play a role in mediating chemoresistance in pancreatic cancer.
5. Conclusions
ALDH1L1, ALDH3A1, ALDH3B1, and ALDH5A1 may serve as potential prognostic markers and predictors of chemotherapy response in pancreatic cancer patients. These findings contribute valuable insights into prognostic biomarkers and their potential clinical utility in the treatment of pancreatic adenocarcinoma.
Limitations of the Study
Although our prognostic and drug resistance analysis are of some significance, the analysis of drug resistance has to be validated through in vitro experimentation and corroborated by clinical data.
Supplementary Materials
The following supporting information can be downloaded at the website of this paper posted on Preprints.org.
Author Contributions
Conceptualization: Y.S., J.K. Methodology: X.W., B.Z., Y.C. Software: X.W. Validation: X.W., B.Z., Y.C. Data curation: X.W. Visualization: X.W. Writing – Original Draft: X.W. Writing – Review & Editing: Y.S., J.K. Supervision: B.T., Y.S., J.K. Funding Acquisition: Y.S., J.K. All authors have read and agreed to the published version of the manuscript.
Data Availability Statement
The datasets analyzed presented in the study are available from The Cancer Genome Atlas (TCGA) repository (https://portal.gdc.cancer.gov/).
Acknowledgments
This research was partially supported by the Deutsche Forschungsgemeinschaft (DFG, German Research Foundation) research training group grant (GRK 2751, InCuPanC, 449501615 awarded to JK), and research grant 534195368 awarded to YS. XW received support from the China Scholarship Council (CSC) No. 202208080312.
Conflicts of Interest
The authors declare no conflict of interest.
References
- Siegel, R.L.; Miller, K.D.; Fuchs, H.E.; Jemal, A. Cancer statistics. CA Cancer J. Clin. 2022, 72, 7–33. [Google Scholar] [CrossRef] [PubMed]
- Rahib, L.; Smith, B.D.; Aizenberg, R.; Rosenzweig, A.B.; Fleshman, J.M.; Matrisian, L.M. Projecting cancer incidence and deaths to 2030: The unexpected burden of thyroid, liver, and pancreas cancers in the United States. Cancer Res. 2014, 74, 2913–2921. [Google Scholar] [CrossRef] [PubMed]
- Conroy, T.; Hammel, P.; Hebbar, M.; Ben Abdelghani, M.; Wei, A.C.; Raoul, J.-L.; Choné, L.; Francois, E.; Artru, P.; Biagi, J.J.; et al. FOLFIRINOX or Gemcitabine as Adjuvant Therapy for Pancreatic Cancer. N. Engl. J. Med. 2018, 379, 2395–2406. [Google Scholar] [CrossRef] [PubMed]
- Neoptolemos, J.P.; Palmer, D.H.; Ghaneh, P.; Psarelli, E.E.; Valle, J.W.; Halloran, C.M.; Faluyi, O.; O’Reilly, D.A.; Cunningham, D.; Wadsley, J.; et al. Comparison of adjuvant gemcitabine and capecitabine with gemcitabine monotherapy in patients with resected pancreatic cancer (ESPAC-4): a multicentre, open-label, randomised, phase 3 trial. Lancet 2017, 389, 1011–1024. [Google Scholar] [CrossRef] [PubMed]
- Mizrahi, J.D.; Surana, R.; Valle, J.W.; Shroff, R.T. Pancreatic cancer. Lancet 2020, 395, 2008–2020. [Google Scholar] [CrossRef] [PubMed]
- Kleeff, J.; Korc, M.; Apte, M.; La Vecchia, C.; Johnson, C.D.; Biankin, A.V.; Neale, R.E.; Tempero, M.; Tuveson, D.A.; Hruban, R.H.; et al. Pancreatic cancer. Nat. Rev. Dis. Primers 2016, 2, 16022. [Google Scholar] [CrossRef] [PubMed]
- Black, W.J.; Stagos, D.; Marchitti, S.A.; Nebert, D.W.; Tipton, K.F.; Bairoch, A.; Vasiliou, V. Human aldehyde dehydrogenase genes: alternatively spliced transcriptional variants and their suggested nomenclature. Pharmacogenetics Genom. 2009, 19, 893–902. [Google Scholar] [CrossRef] [PubMed]
- Vasiliou, V.; Nebert, D.W.J.H.g. Analysis and update of the human aldehyde dehydrogenase (ALDH) gene family. 2005, 2, 1-6.
- Zanoni, M.; Bravaccini, S.; Fabbri, F.; Arienti, C. Emerging Roles of Aldehyde Dehydrogenase Isoforms in Anti-cancer Therapy Resistance. Front. Med. 2022, 9, 795762. [Google Scholar] [CrossRef] [PubMed]
- Kong, B.; Wu, W.; Cheng, T.; Schlitter, A.M.; Qian, C.; Bruns, P.; Jian, Z.; Jäger, C.; Regel, I.; Raulefs, S.; et al. A subset of metastatic pancreatic ductal adenocarcinomas depends quantitatively on oncogenic Kras/Mek/Erk-induced hyperactive mTOR signalling. Gut 2015, 65, 647–657. [Google Scholar] [CrossRef] [PubMed]
- Nie, S.; Qian, X.; Shi, M.; Li, H.; Peng, C.; Ding, X.; Zhang, S.; Zhang, B.; Xu, G.; Lv, Y.; et al. ALDH1A3 Accelerates Pancreatic Cancer Metastasis by Promoting Glucose Metabolism. Front. Oncol. 2020, 10, 915. [Google Scholar] [CrossRef] [PubMed]
- Rebollido-Rios, R.; Venton, G.; Sánchez-Redondo, S.; i Felip, C.I.; Fournet, G.; González, E.; Fernández, W.R.; Escuela, D.O.B.; Di Stefano, B.; Penarroche-Díaz, R.; et al. Dual disruption of aldehyde dehydrogenases 1 and 3 promotes functional changes in the glutathione redox system and enhances chemosensitivity in nonsmall cell lung cancer. Oncogene 2020, 39, 2756–2771. [Google Scholar] [CrossRef] [PubMed]
- Zhang, H.; Fu, L. The role of ALDH2 in tumorigenesis and tumor progression: Targeting ALDH2 as a potential cancer treatment. Acta Pharm. Sin. B 2021, 11, 1400–1411. [Google Scholar] [CrossRef] [PubMed]
- Tang, Z.; Li, C.; Kang, B.; Gao, G.; Li, C.; Zhang, Z. GEPIA: A web server for cancer and normal gene expression profiling and interactive analyses. Nucleic Acids Res. 2017, 45, W98–W102. [Google Scholar] [CrossRef] [PubMed]
- Mayakonda, A.; Lin, D.-C.; Assenov, Y.; Plass, C.; Koeffler, H.P. Maftools: efficient and comprehensive analysis of somatic variants in cancer. Genome Res. 2018, 28, 1747–1756. [Google Scholar] [CrossRef] [PubMed]
- Yu, G.; Wang, L.-G.; Han, Y.; He, Q.-Y. clusterProfiler: An R Package for Comparing Biological Themes Among Gene Clusters. OMICS J. Integr. Biol. 2012, 16, 284–287. [Google Scholar] [CrossRef] [PubMed]
- Yoshihara, K.; Shahmoradgoli, M.; Martínez, E.; Vegesna, R.; Kim, H.; Torres-Garcia, W.; Treviño, V.; Shen, H.; Laird, P.W.; Levine, D.A.; et al. Inferring tumour purity and stromal and immune cell admixture from expression data. Nat. Commun. 2013, 4, 2612. [Google Scholar] [CrossRef] [PubMed]
- Newman, A.M.; Liu, C.L.; Green, M.R.; Gentles, A.J.; Feng, W.; Xu, Y.; Hoang, C.D.; Diehn, M.; Alizadeh, A.A. Robust enumeration of cell subsets from tissue expression profiles. Nat. Methods 2015, 12, 453–457. [Google Scholar] [CrossRef] [PubMed]
- Maeser, D.; Gruener, R.F.; Huang, R.S. oncoPredict: an R package for predicting in vivo or cancer patient drug response and biomarkers from cell line screening data. Briefings Bioinform. 2021, 22. [Google Scholar] [CrossRef] [PubMed]
- Yang, W.; Soares, J.; Greninger, P.; Edelman, E.J.; Lightfoot, H.; Forbes, S.; Bindal, N.; Beare, D.; Smith, J.A.; Thompson, I.R.; et al. Genomics of Drug Sensitivity in Cancer (GDSC): a resource for therapeutic biomarker discovery in cancer cells. Nucleic Acids Res. 2012, 41, D955–D961. [Google Scholar] [CrossRef] [PubMed]
- Ohri, N.; Häußler, J.; Javakhishvili, N.; Vieweg, D.; Zourelidis, A.; Trojanowicz, B.; Haemmerle, M.; Esposito, I.; Glaß, M.; Sunami, Y.; et al. Gene expression dynamics in fibroblasts during early-stage murine pancreatic carcinogenesis. iScience 2024, 28, 111572. [Google Scholar] [CrossRef] [PubMed]
- Beyer, F.; Lüdje, W.; Karpf, J.; Saher, G.; Beckervordersandforth, R. Distribution of Aldh1L1-CreERT2 Recombination in Astrocytes Versus Neural Stem Cells in the Neurogenic Niches of the Adult Mouse Brain. Front. Neurosci. 2021, 15. [Google Scholar] [CrossRef] [PubMed]
- Rose, J.; Brian, C.; Pappa, A.; Panayiotidis, M.I.; Franco, R. Mitochondrial Metabolism in Astrocytes Regulates Brain Bioenergetics, Neurotransmission and Redox Balance. Front. Neurosci. 2020, 14. [Google Scholar] [CrossRef] [PubMed]
- Yu, S.; Zhang, C.; Xie, K.-P. Therapeutic resistance of pancreatic cancer: Roadmap to its reversal. Biochim. et Biophys. Acta (BBA) - Rev. Cancer 2021, 1875, 188461. [Google Scholar] [CrossRef] [PubMed]
- Rodríguez-Zavala, J.S.; Calleja, L.F.; Moreno-Sánchez, R.; Yoval-Sánchez, B. Role of Aldehyde Dehydrogenases in Physiopathological Processes. Chem. Res. Toxicol. 2019, 32, 405–420. [Google Scholar] [CrossRef] [PubMed]
- Chang, P.M.-H.; Chen, C.-H.; Yeh, C.-C.; Lu, H.-J.; Liu, T.-T.; Chen, M.-H.; Liu, C.-Y.; Wu, A.T.H.; Yang, M.-H.; Tai, S.-K.; et al. Transcriptome analysis and prognosis of ALDH isoforms in human cancer. Sci. Rep. 2018, 8, 1–10. [Google Scholar] [CrossRef] [PubMed]
- Januchowski, R.; Wojtowicz, K.; Zabel, M. The role of aldehyde dehydrogenase (ALDH) in cancer drug resistance. Biomed. Pharmacother. 2013, 67, 669–680. [Google Scholar] [CrossRef] [PubMed]
- Raha, D.; Wilson, T.R.; Peng, J.; Peterson, D.; Yue, P.; Evangelista, M.; Wilson, C.; Merchant, M.; Settleman, J. The Cancer Stem Cell Marker Aldehyde Dehydrogenase Is Required to Maintain a Drug-Tolerant Tumor Cell Subpopulation. Cancer Res. 2014, 74, 3579–3590. [Google Scholar] [CrossRef] [PubMed]
- Liu, Q.; Li, H.; Chen, X.; Luo, X. Dual roles and therapeutic potential of ALDH3 family members in cancer. Chem. Interactions 2025, 418, 111622. [Google Scholar] [CrossRef] [PubMed]
- Lavudi, K.; Nuguri, S.M.; Pandey, P.; Kokkanti, R.R.; Wang, Q.-E. ALDH and cancer stem cells: Pathways, challenges, and future directions in targeted therapy. Life Sci. 2024, 356, 123033. [Google Scholar] [CrossRef] [PubMed]
- Ginestier, C.; Hur, M.H.; Charafe-Jauffret, E.; Monville, F.; Dutcher, J.; Brown, M.; Jacquemier, J.; Viens, P.; Kleer, C.G.; Liu, S.; et al. ALDH1 Is a Marker of Normal and Malignant Human Mammary Stem Cells and a Predictor of Poor Clinical Outcome. Cell Stem Cell 2007, 1, 555–567. [Google Scholar] [CrossRef] [PubMed]
- Dinavahi, S.S.; Bazewicz, C.G.; Gowda, R.; Robertson, G.P. Aldehyde Dehydrogenase Inhibitors for Cancer Therapeutics. Trends Pharmacol. Sci. 2019, 40, 774–789. [Google Scholar] [CrossRef] [PubMed]
- Fernando, W.; Cruickshank, B.M.; Arun, R.P.; MacLean, M.R.; Cahill, H.F.; Morales-Quintanilla, F.; Dean, C.A.; Wasson, M.-C.D.; Dahn, M.L.; Coyle, K.M.; et al. ALDH1A3 is the switch that determines the balance of ALDH+ and CD24−CD44+ cancer stem cells, EMT-MET, and glucose metabolism in breast cancer. Oncogene 2024, 43, 3151–3169. [Google Scholar] [CrossRef] [PubMed]
- Kurowski, K.; Föll, M.; Werner, T.; Schilling, O.; Werner, M.; Fichtner-Feigl, S.; Bengsch, B.; Bronsert, P.; Holzner, P.A.; Timme, S. Impact of ALDH1A1 Expression in Intrahepatic Cholangiocellular Carcinoma. J. Cancer 2025, 16, 1–11. [Google Scholar] [CrossRef] [PubMed]
- Chen, X.-Q.; He, J.-R.; Wang, H.-Y. Decreased expression of ALDH1L1 is associated with a poor prognosis in hepatocellular carcinoma. Med Oncol. 2011, 29, 1843–1849. [Google Scholar] [CrossRef] [PubMed]
- Tian, X.; Han, Y.; Yu, L.; Luo, B.; Hu, Z.; Li, X.; Yang, Z.; Wang, X.; Huang, W.; Wang, H.; et al. Decreased expression of ALDH5A1 predicts prognosis in patients with ovarian cancer. Cancer Biol. Ther. 2017, 18, 245–251. [Google Scholar] [CrossRef] [PubMed]
- Patel, M.; Lu, L.; Zander, D.S.; Sreerama, L.; Coco, D.; Moreb, J.S. ALDH1A1 and ALDH3A1 expression in lung cancers: Correlation with histologic type and potential precursors. Lung Cancer 2008, 59, 340–349. [Google Scholar] [CrossRef] [PubMed]
- Yang, H.; Cui, Y.; Zhu, Y. Comprehensive analysis reveals signal and molecular mechanism of mitochondrial energy metabolism pathway in pancreatic cancer. Front. Genet. 2023, 14, 1117145. [Google Scholar] [CrossRef] [PubMed]
- Buscail, L.; Bournet, B.; Cordelier, P. Role of oncogenic KRAS in the diagnosis, prognosis and treatment of pancreatic cancer. Nat. Rev. Gastroenterol. Hepatol. 2020, 17, 153–168. [Google Scholar] [CrossRef] [PubMed]
- de Visser, K.E.; Joyce, J.A. The evolving tumor microenvironment: From cancer initiation to metastatic outgrowth. Cancer Cell 2023, 41, 374–403. [Google Scholar] [CrossRef] [PubMed]
- Melssen, M.M.; Sheybani, N.D.; Leick, K.M.; Slingluff, C.L. Barriers to immune cell infiltration in tumors. J. Immunother. Cancer 2023, 11, e006401. [Google Scholar] [CrossRef] [PubMed]
- Raskov, H.; Orhan, A.; Christensen, J.P.; Gögenur, I. Cytotoxic CD8+ T cells in cancer and cancer immunotherapy. Br. J. Cancer 2021, 124, 359–367. [Google Scholar] [CrossRef] [PubMed]
- Doser, R.L.; Knight, K.M.; Deihl, E.W.; Hoerndli, F.J. Activity-dependent mitochondrial ROS signaling regulates recruitment of glutamate receptors to synapses. eLife 2024, 13. [Google Scholar] [CrossRef] [PubMed]
- Poturnajova, M.; Kozovska, Z.; Matuskova, M. Aldehyde dehydrogenase 1A1 and 1A3 isoforms – mechanism of activation and regulation in cancer. Cell. Signal. 2021, 87, 110120. [Google Scholar] [CrossRef] [PubMed]
- Croker, A.K.; Allan, A.L. Inhibition of aldehyde dehydrogenase (ALDH) activity reduces chemotherapy and radiation resistance of stem-like ALDHhiCD44+ human breast cancer cells. Breast Cancer Res. Treat. 2011, 133, 75–87. [Google Scholar] [CrossRef] [PubMed]
- Ciccone, V.; Simonis, V.; Del Gaudio, C.; Cucini, C.; Ziche, M.; Morbidelli, L.; Donnini, S. ALDH1A1 confers resistance to RAF/MEK inhibitors in melanoma cells by maintaining stemness phenotype and activating PI3K/AKT signaling. Biochem. Pharmacol. 2024, 224, 116252. [Google Scholar] [CrossRef] [PubMed]
- Januchowski, R.; Wojtowicz, K.; Sterzyſska, K.; Sosiſska, P.; Andrzejewska, M.; Zawierucha, P.; Nowicki, M.; Zabel, M. Inhibition of ALDH1A1 activity decreases expression of drug transporters and reduces chemotherapy resistance in ovarian cancer cell lines. Int. J. Biochem. Cell Biol. 2016, 78, 248–259. [Google Scholar] [CrossRef] [PubMed]
- Xu, X.; Chai, S.; Wang, P.; Zhang, C.; Yang, Y.; Yang, Y.; Wang, K. Aldehyde dehydrogenases and cancer stem cells. Cancer Lett. 2015, 369, 50–57. [Google Scholar] [CrossRef] [PubMed]
- Muralikrishnan, V.; Hurley, T.D.; Nephew, K.P. Targeting Aldehyde Dehydrogenases to Eliminate Cancer Stem Cells in Gynecologic Malignancies. Cancers 2020, 12, 961. [Google Scholar] [CrossRef] [PubMed]
- Huang, C.-P.; Tsai, M.-F.; Chang, T.-H.; Tang, W.-C.; Chen, S.-Y.; Lai, H.-H.; Lin, T.-Y.; Yang, J.C.-H.; Yang, P.-C.; Shih, J.-Y.; et al. ALDH-positive lung cancer stem cells confer resistance to epidermal growth factor receptor tyrosine kinase inhibitors. Cancer Lett. 2013, 328, 144–151. [Google Scholar] [CrossRef] [PubMed]
- Li, Z.; Qin, C.; Yang, X.; Zhao, B.; Li, T.; Zhao, Y.; Zhang, X.; Wang, W. Phthalocyanine and photodynamic therapy relieve albumin paclitaxel and gemcitabine chemoresistance in pancreatic cancer. Exp. Cell Res. 2025, 446, 114455. [Google Scholar] [CrossRef] [PubMed]
Figure 1.
Kaplan-Meier curves of PAAD patients with above or below median expression levels of ALDH1L1(A), ALDH3A1(B), ALDH3B1(C) , ALDH5A1 (D).
Figure 1.
Kaplan-Meier curves of PAAD patients with above or below median expression levels of ALDH1L1(A), ALDH3A1(B), ALDH3B1(C) , ALDH5A1 (D).
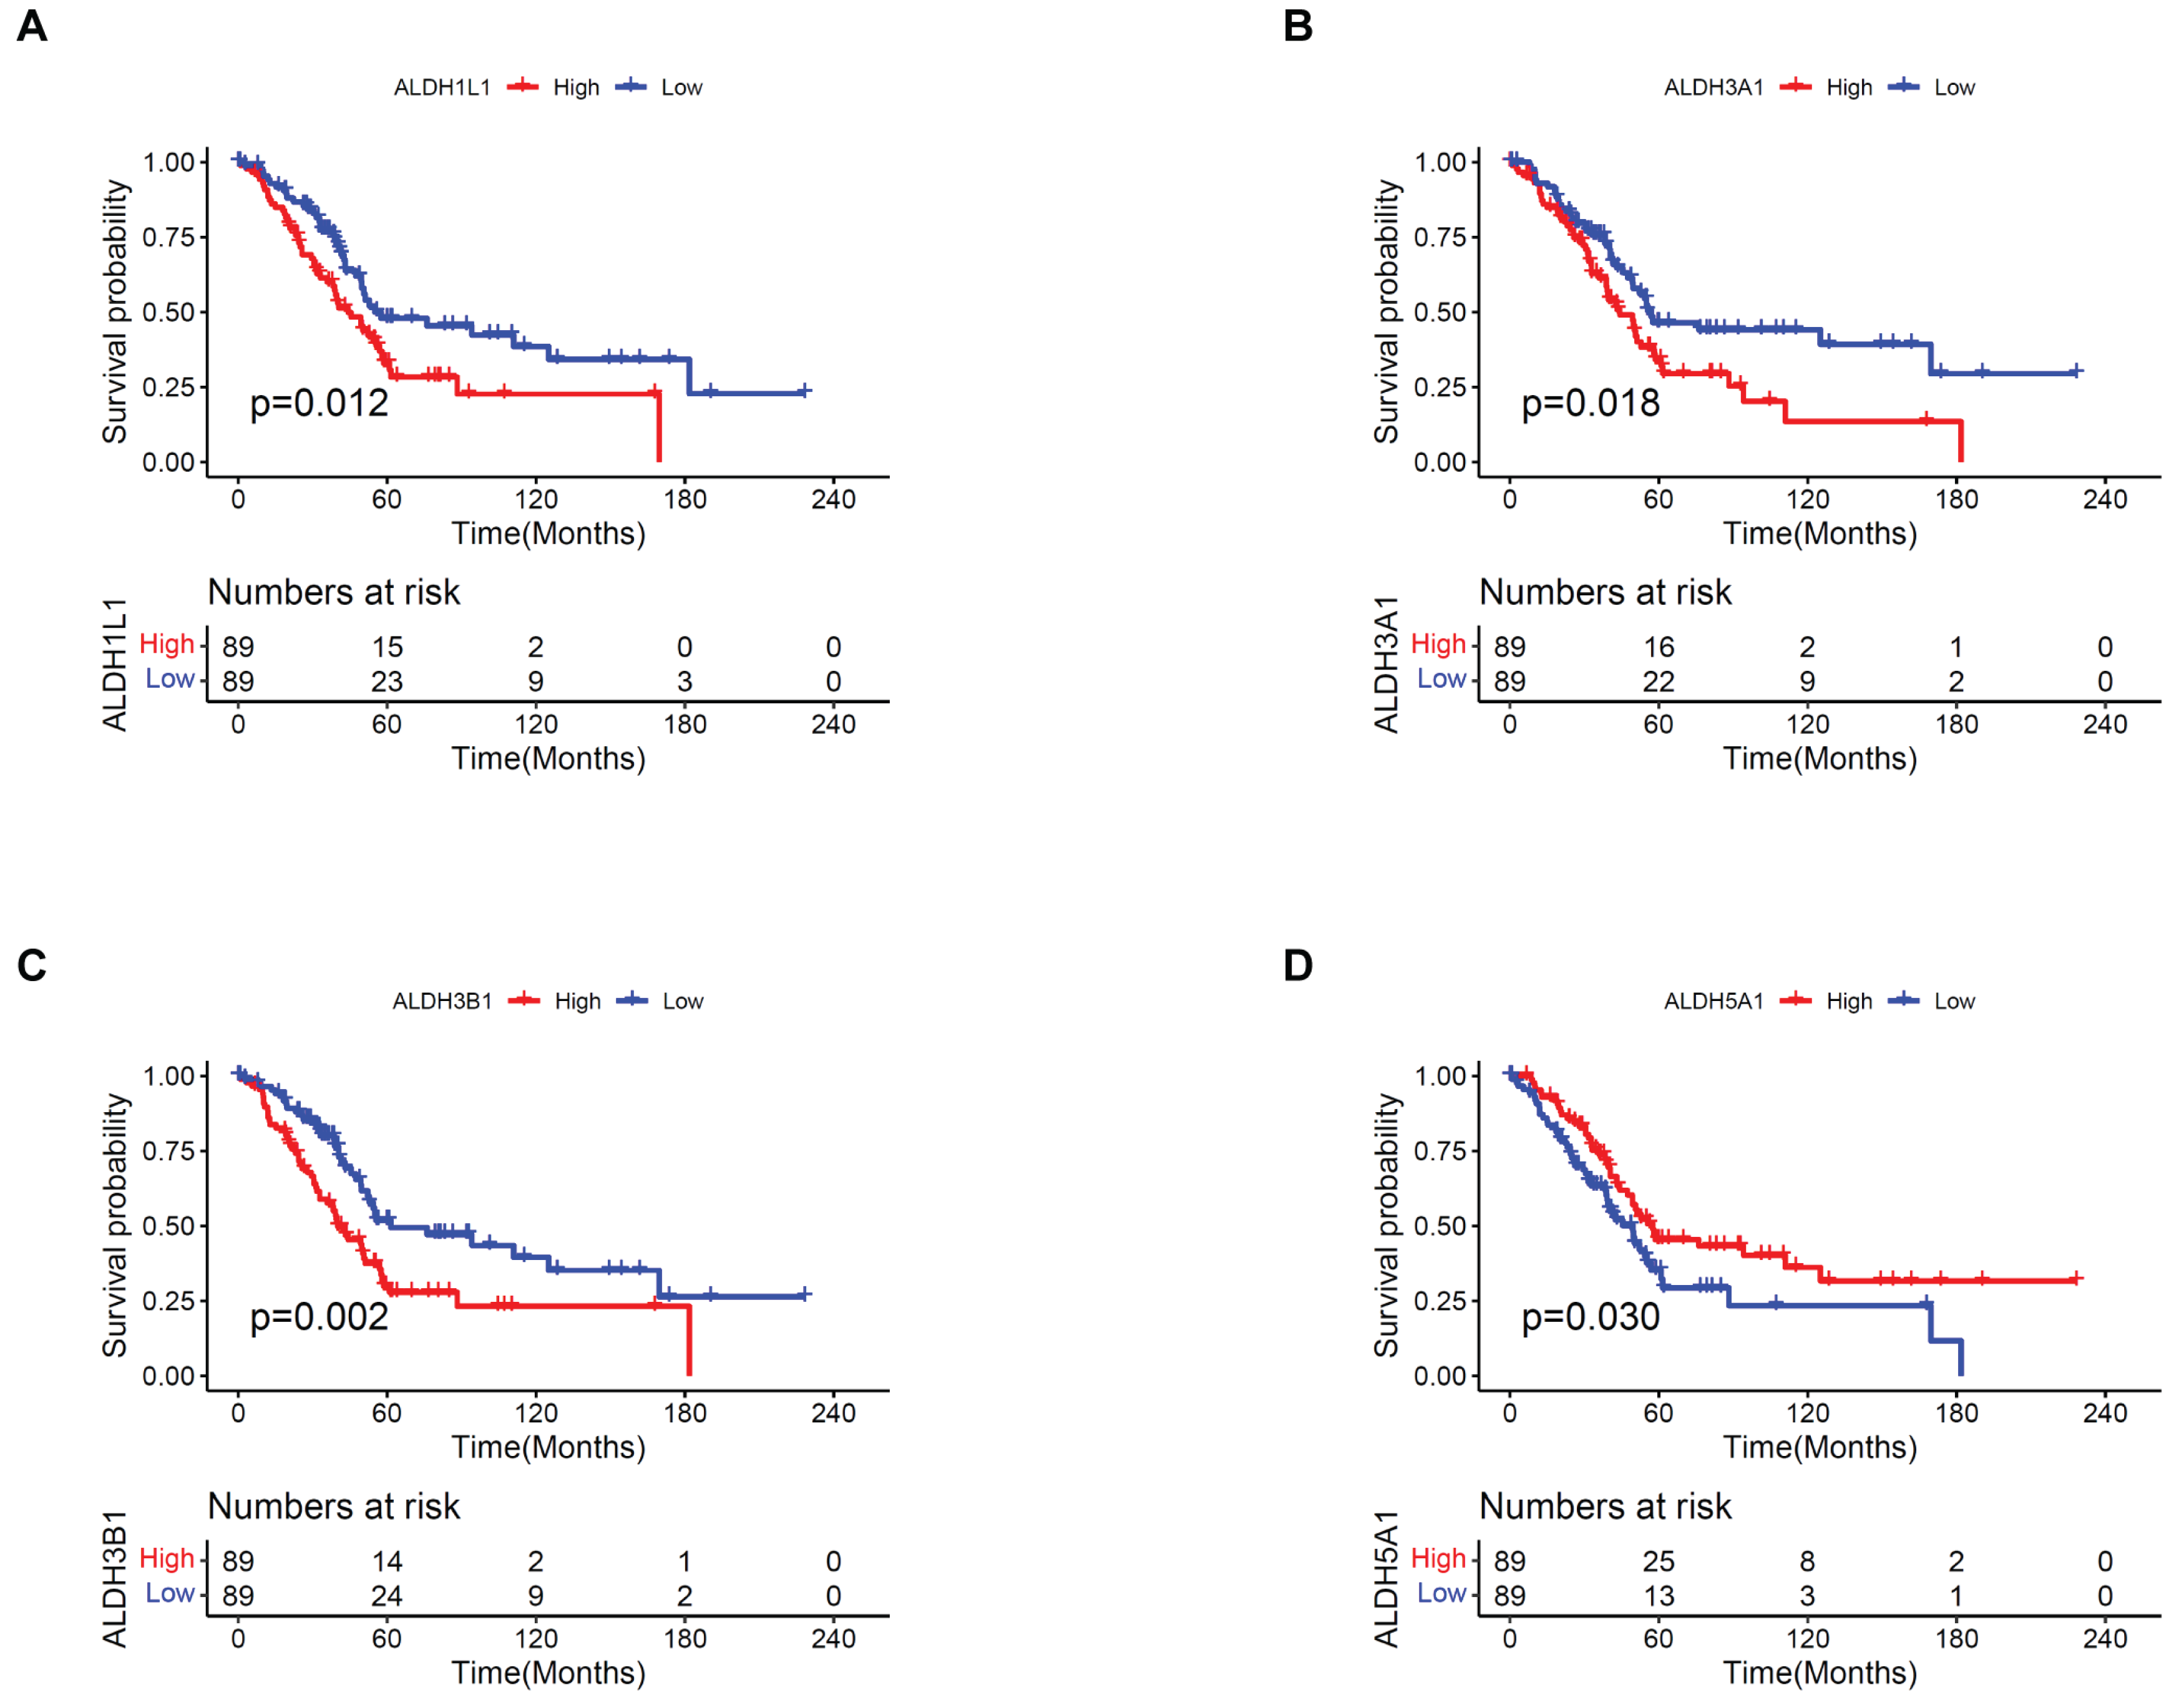
Figure 2.
ALDHs expression in different cell types in the single-cell transcriptomic dataset PAAD_CRA001160. Comparison of ALDH1L1(A), ALDH3A1(B), ALDH3B1(C), ALDH5A1(D) expression in pancreatic tumor (red) and normal (blue) tissues. (E) UMAP plot displays an integrated cellular map composed of 12 annotated cell types in PAAD_ CRA001160. (F) UMAP showing ALDH1L1 expression in each cell type. (G) UMAP showing ALDH3A1 expression in each cell type. (H) VInPlot showing ALDH1L1, ALDH3A1, ALDH3B1, ALDH5A1 expression in each cell type. (I) UMAP showing ALDH3B1 expression in each cell type. (J) UMAP showing ALDH5A1 expression in each cell type. *p <0.05; ns, not significant.
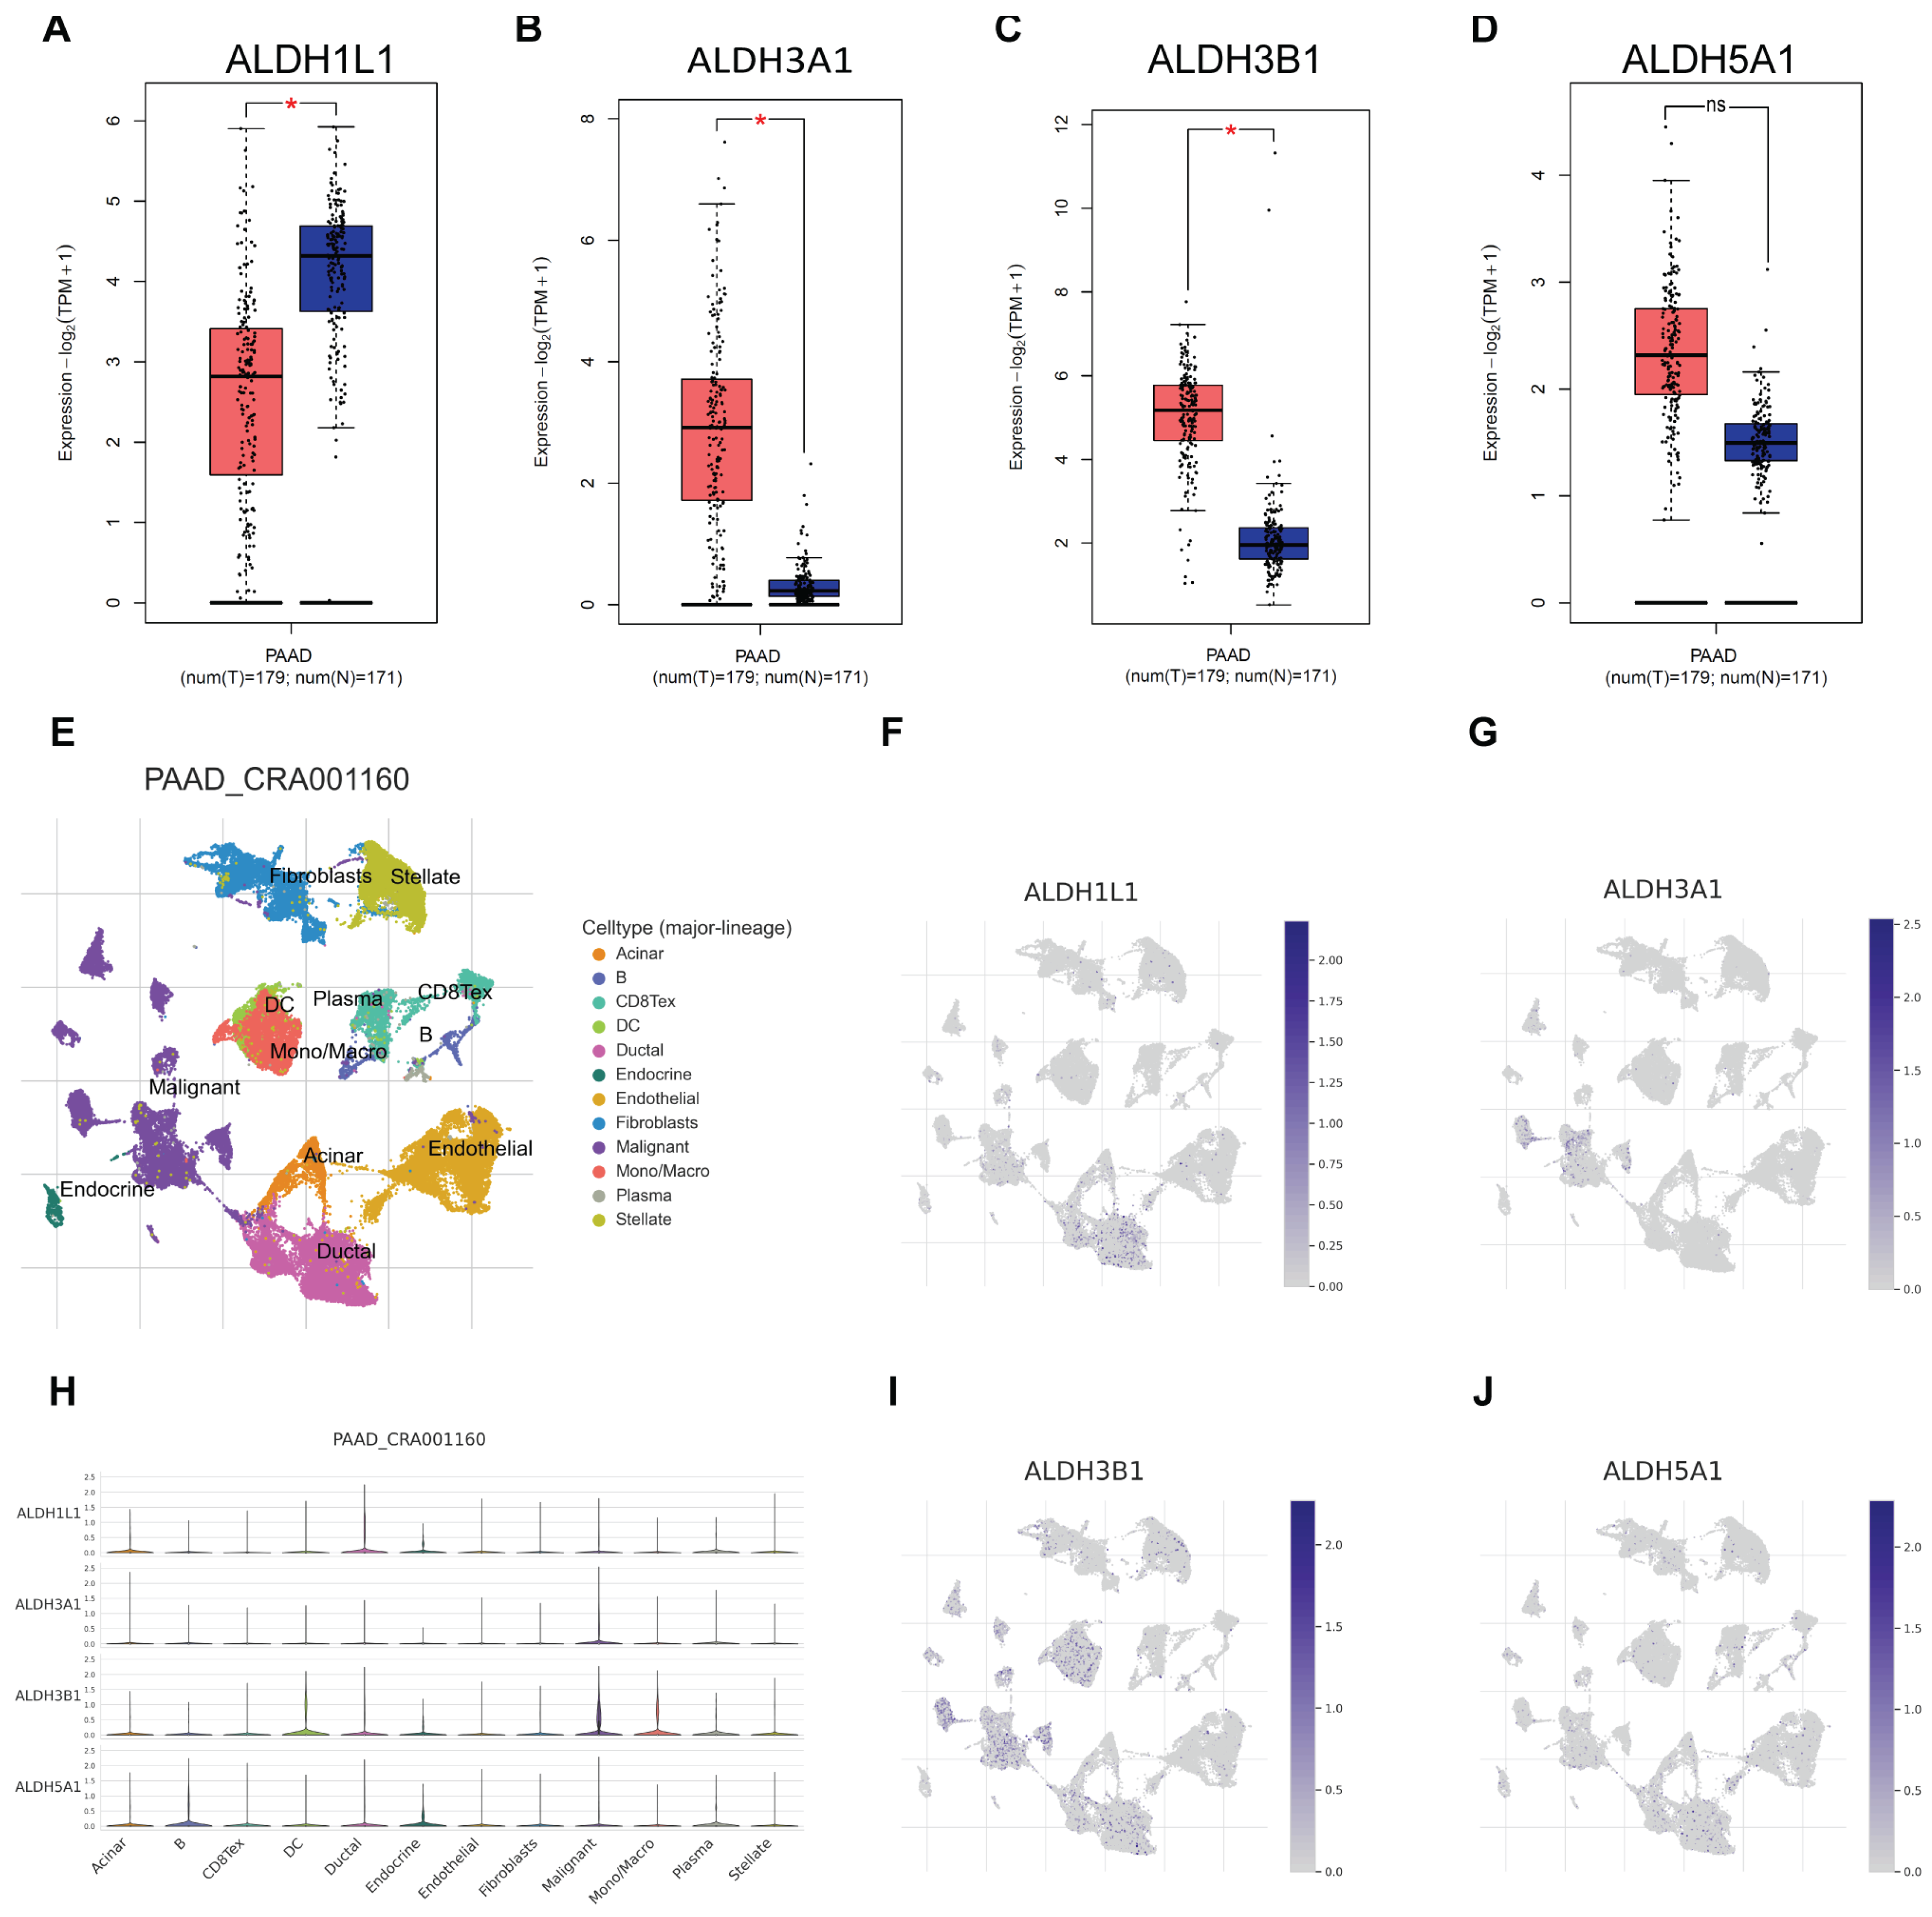
Figure 3.
ALDH3A1 expression in pancreatic cancer and normal pancreatic tissues and pancreatic cancer cell lines. (A) Analysis of ALDH3A1 expression in pancreatic cancer cell lines using HPA. (B) The expression of ALDH3A1 in pancreatic cancer cells (BxPC-3, Capan-1, AsPC-1, Su.86.86, MIA PaCa-2, PANC-1) was analyzed by qPCR. (C, D) The expression of ALDH3A1 in pancreatic cancer cells (BxPC-3, Capan-1, AsPC-1, Su.86.86, MIA PaCa-2, PANC-1) was analyzed by Western blot assays. (E-G) Representative immunohistochemistry images showing ALDH3A1 expression in pancreatic cancer tissues. (H-J) Representative immunohistochemistry images showing ALDH3A1 expression in normal pancreatic tissues. Bar: 20μm.
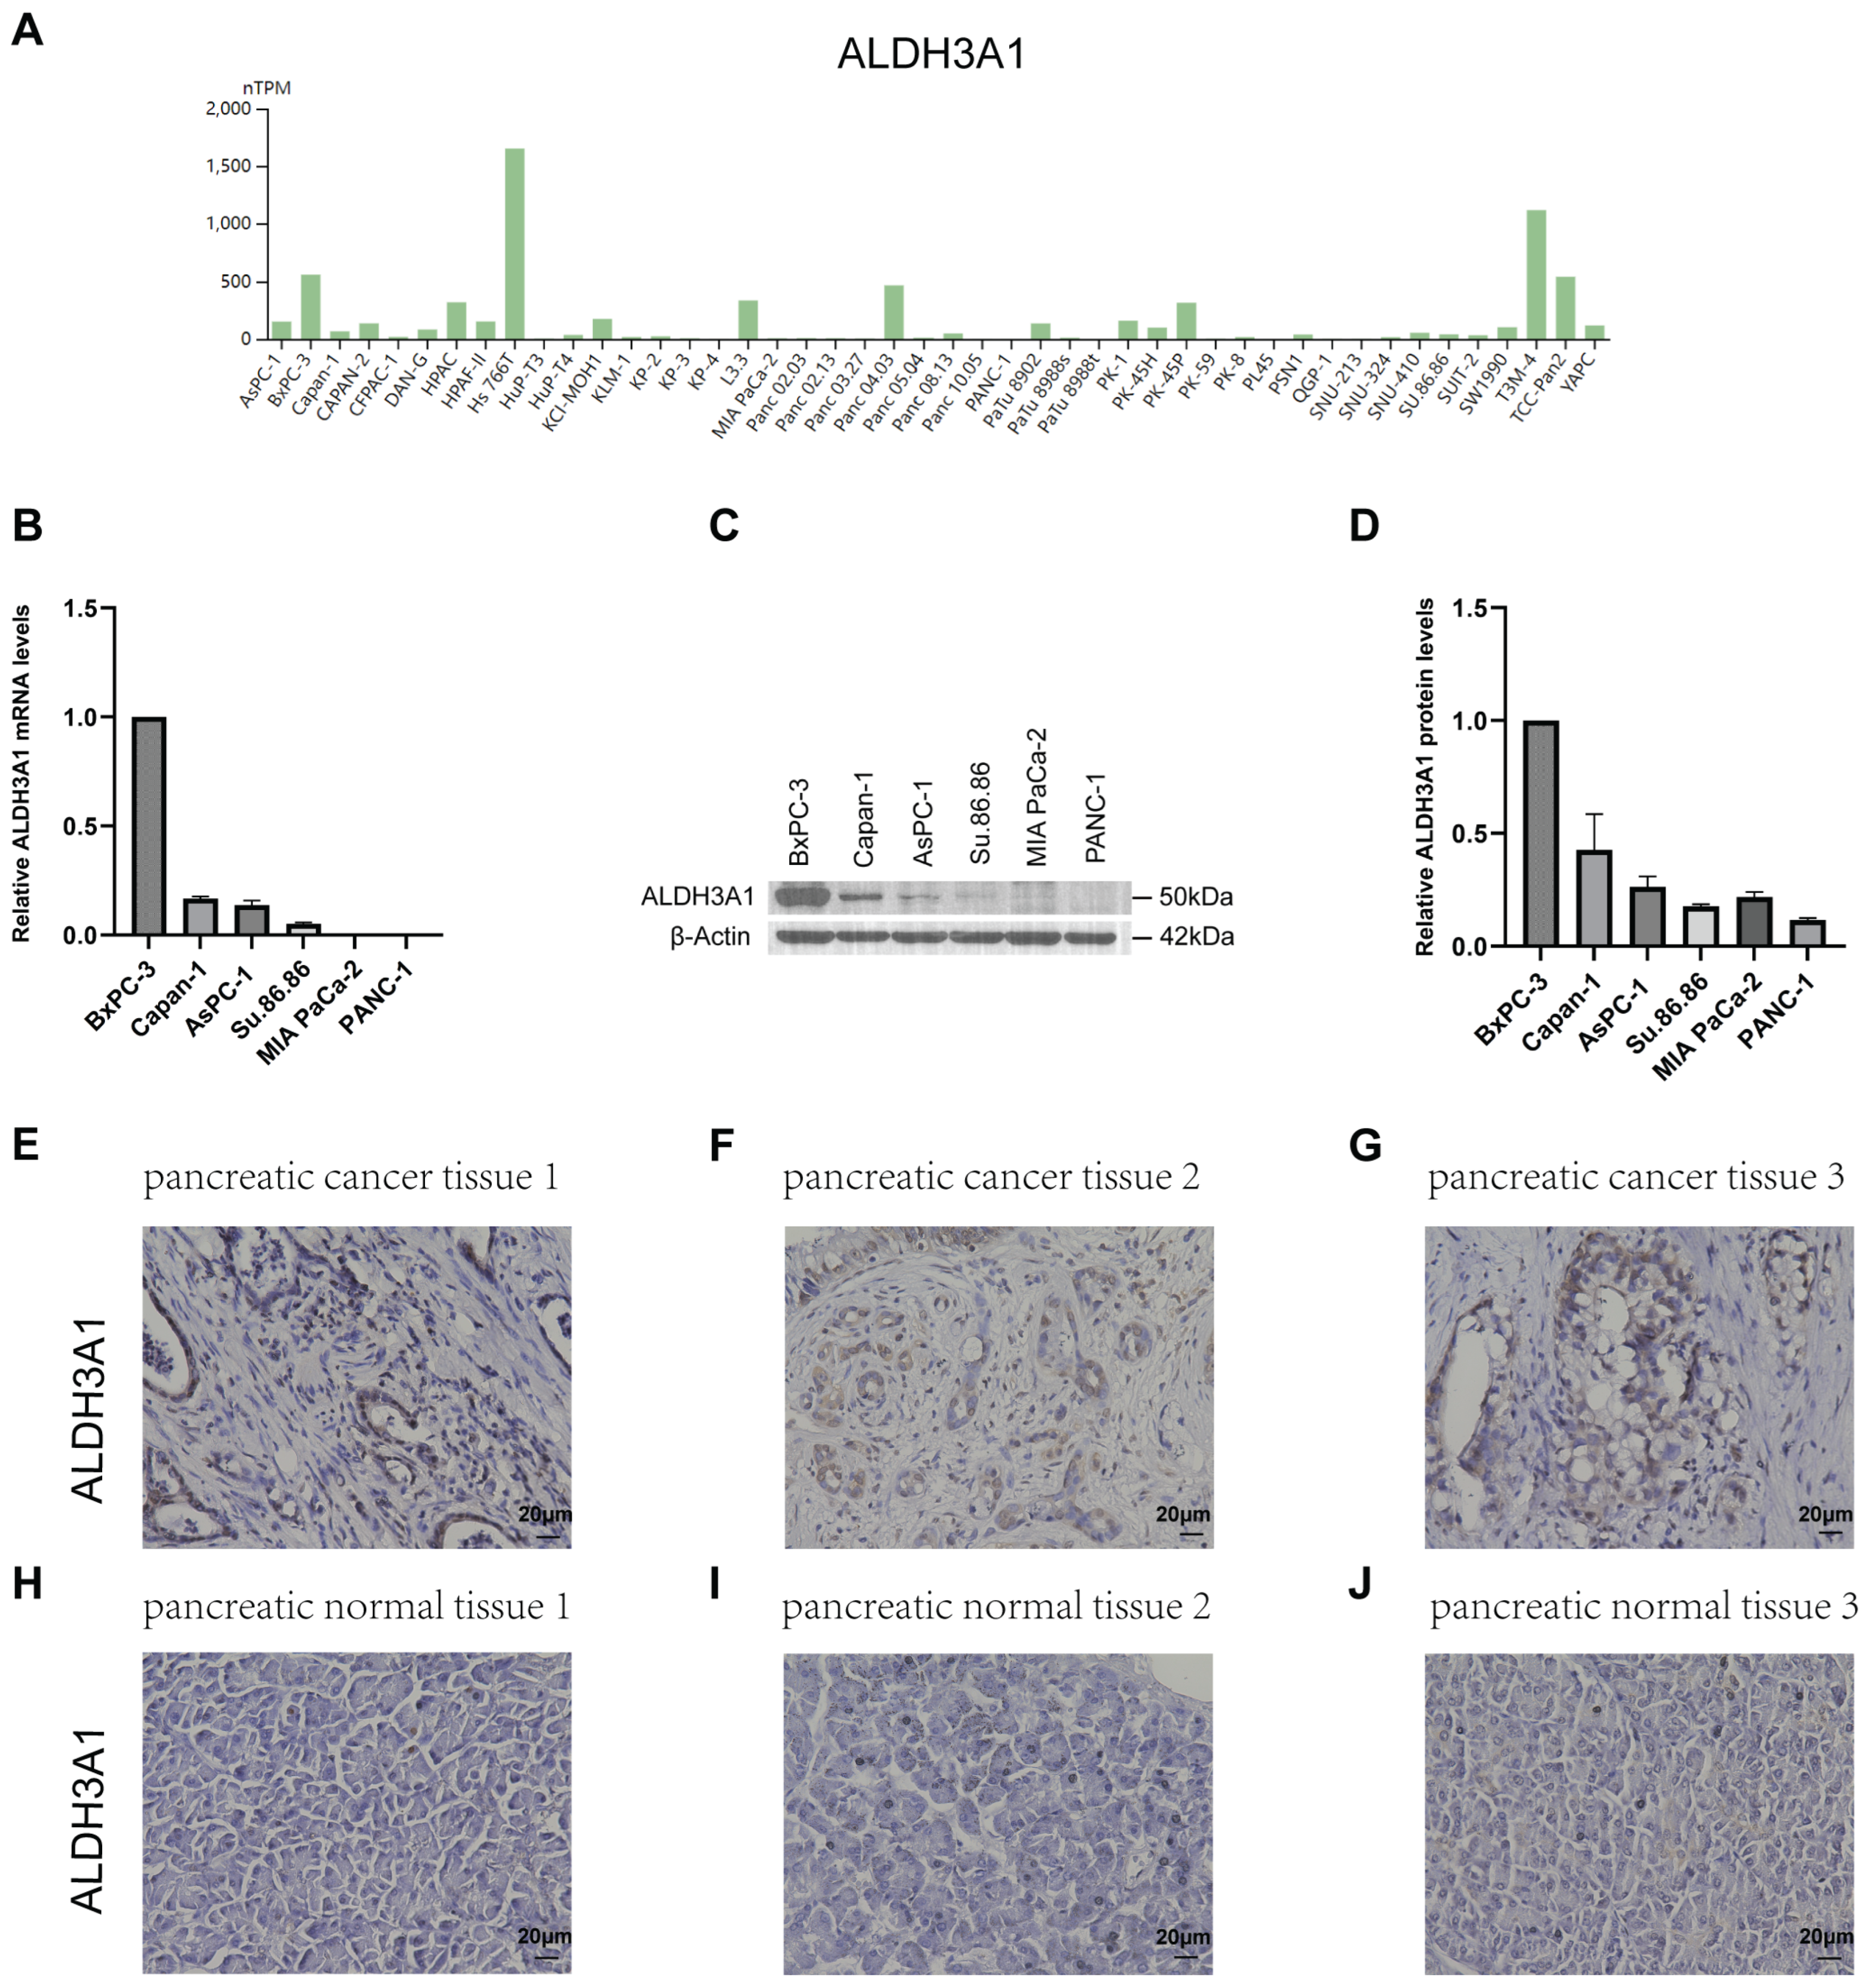
Figure 4.
Correlation between ALDHs expression and clinicopathological parameters in PAAD. Correlation of ALDH1L1(A), ALDH3A1(B), ALDH3B1(C), ALDH5A1(D) expression with cancer stage. Correlation of ALDH1L1(E), ALDH3A1(F), ALDH3B1(G), ALDH5A1(H) expression with KRAS status. ***p <0.001; **p <0.01; *p <0.05; ns, not significant.
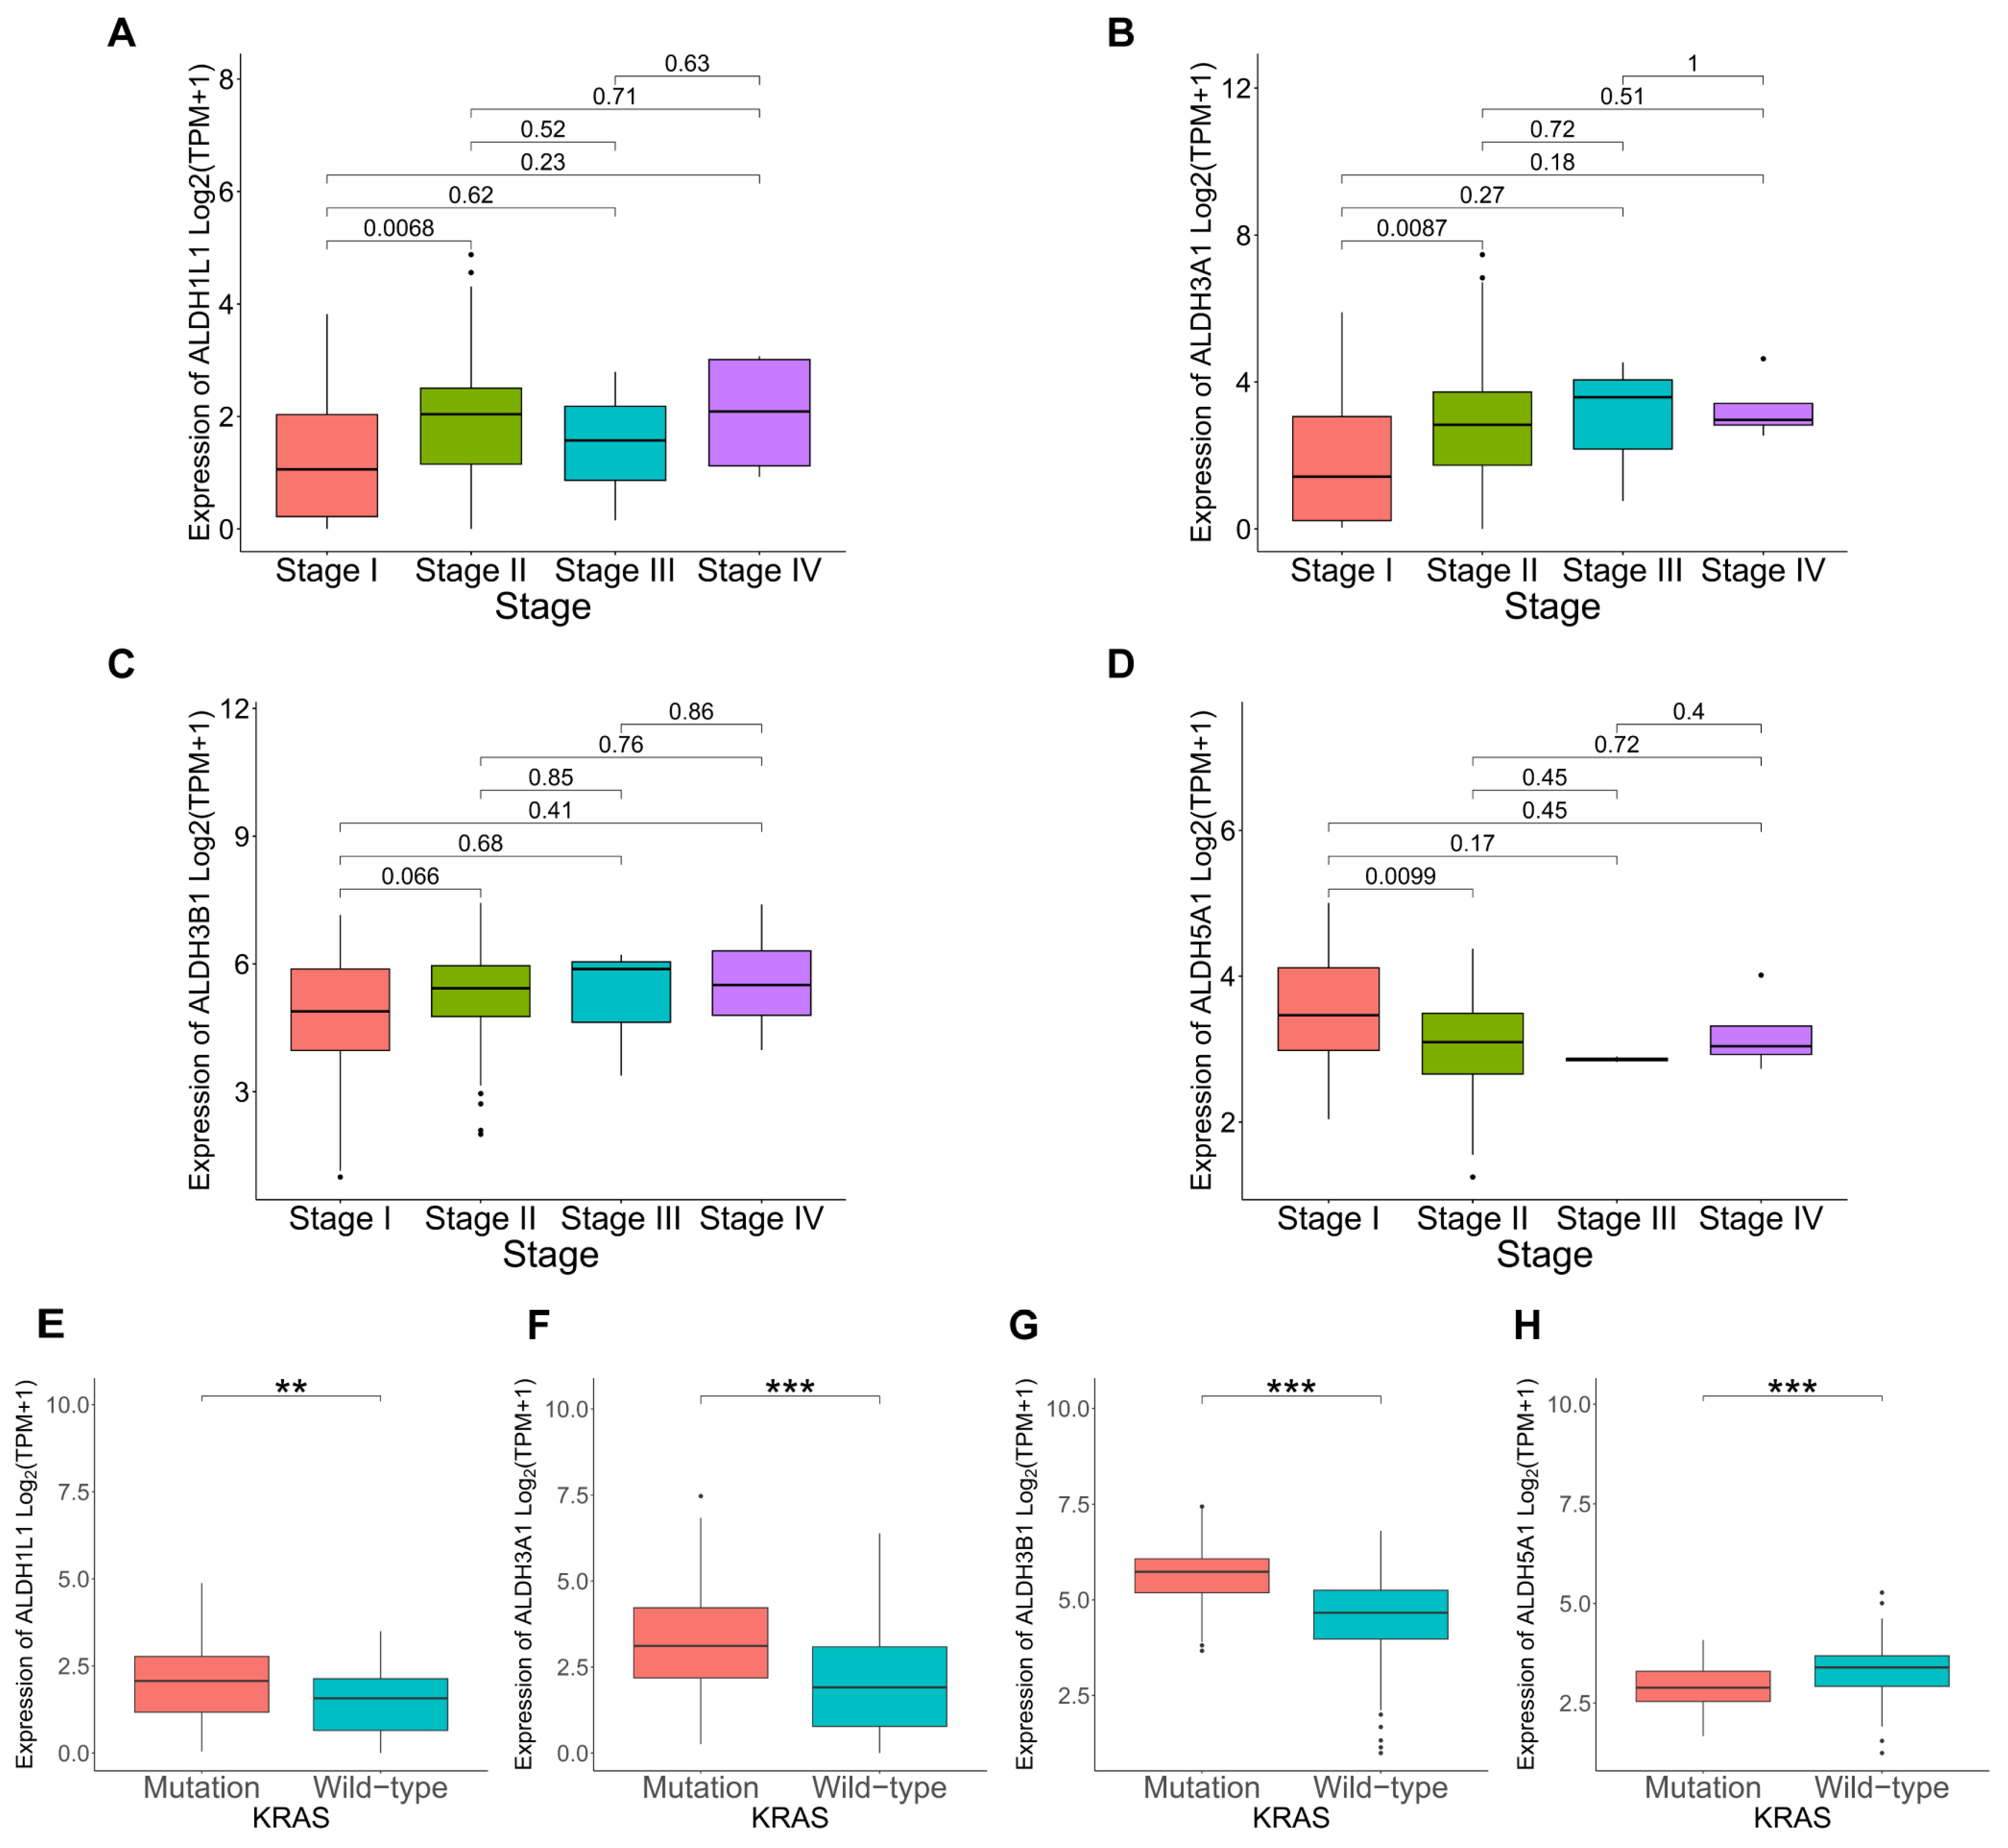
Figure 5.
GO functional enrichment analysis of ALDHs in PAAD. Exploring the enrichment of ALDH1L1(A), ALDH3A1(B), ALDH3B1(C), ALDH5A1(D) expressed above and below median levels in terms of biological function by GO analysis.
Figure 5.
GO functional enrichment analysis of ALDHs in PAAD. Exploring the enrichment of ALDH1L1(A), ALDH3A1(B), ALDH3B1(C), ALDH5A1(D) expressed above and below median levels in terms of biological function by GO analysis.
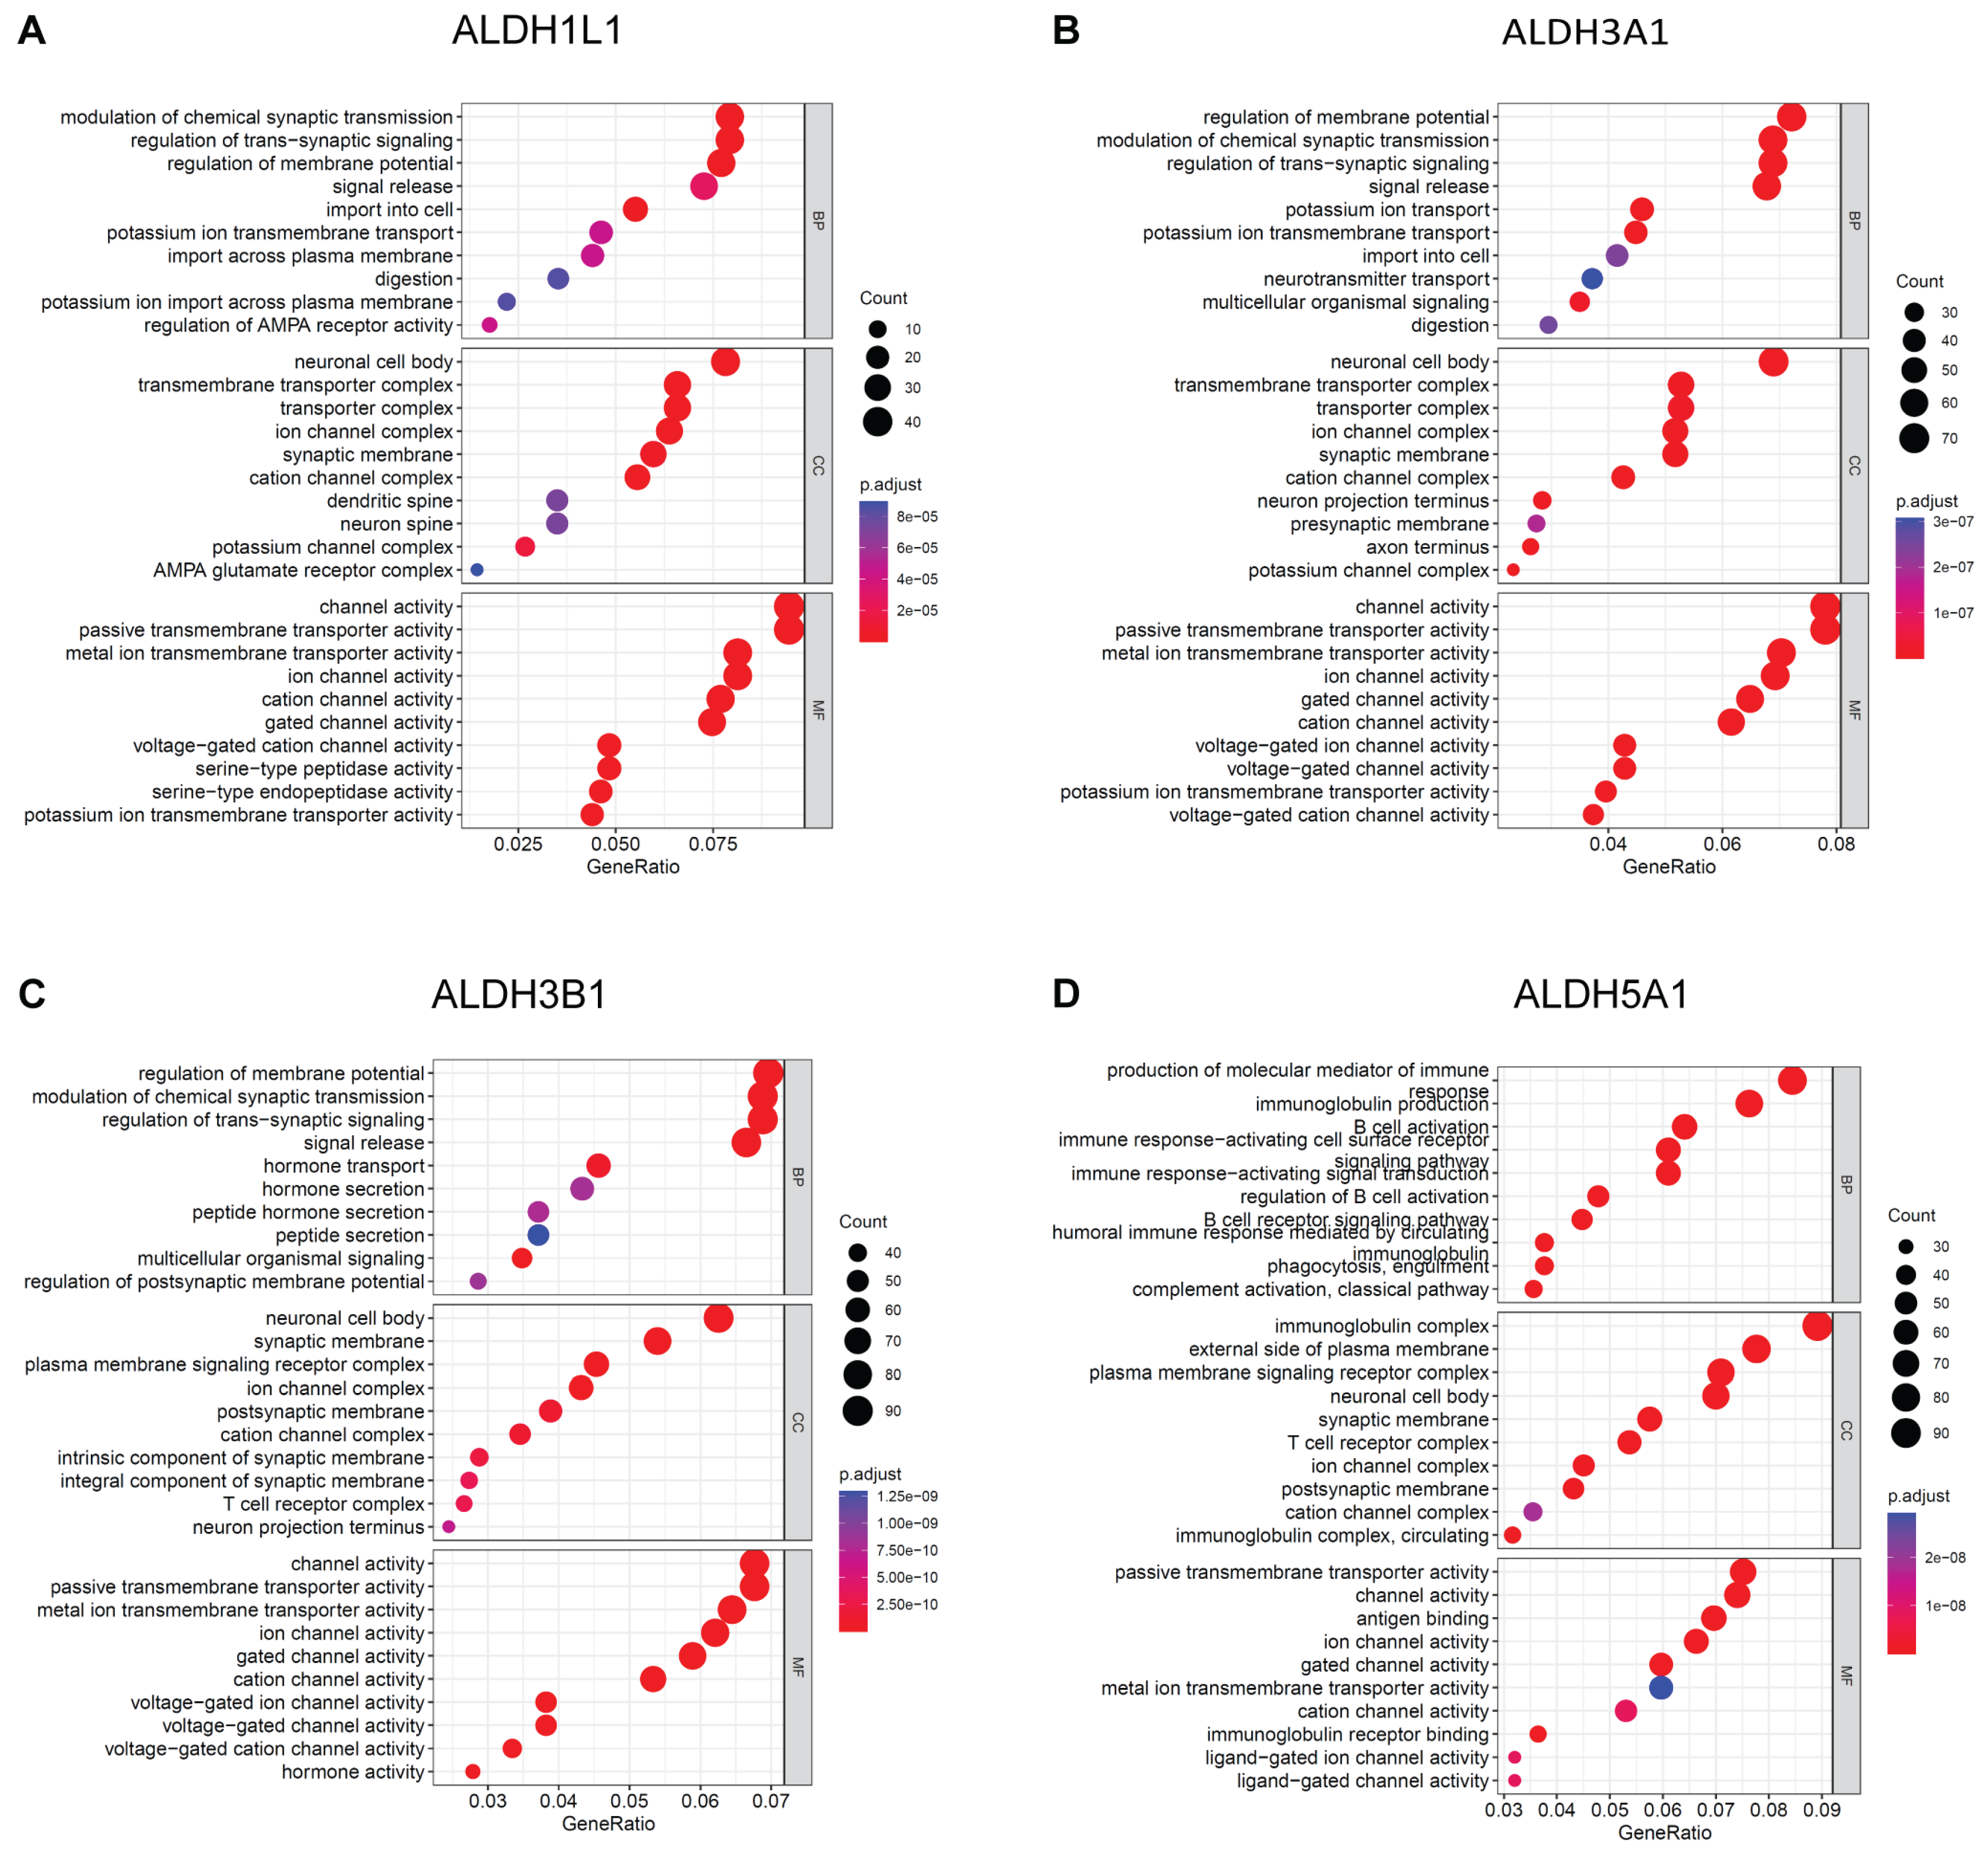
Figure 6.
KEGG Pathway analysis of ALDHs in PAAD. Exploring the enrichment of ALDH1L1(A), ALDH3A1(B), ALDH3B1(C), ALDH5A1(D) expressed above and below median levels by KEGG Pathway analysis.
Figure 6.
KEGG Pathway analysis of ALDHs in PAAD. Exploring the enrichment of ALDH1L1(A), ALDH3A1(B), ALDH3B1(C), ALDH5A1(D) expressed above and below median levels by KEGG Pathway analysis.
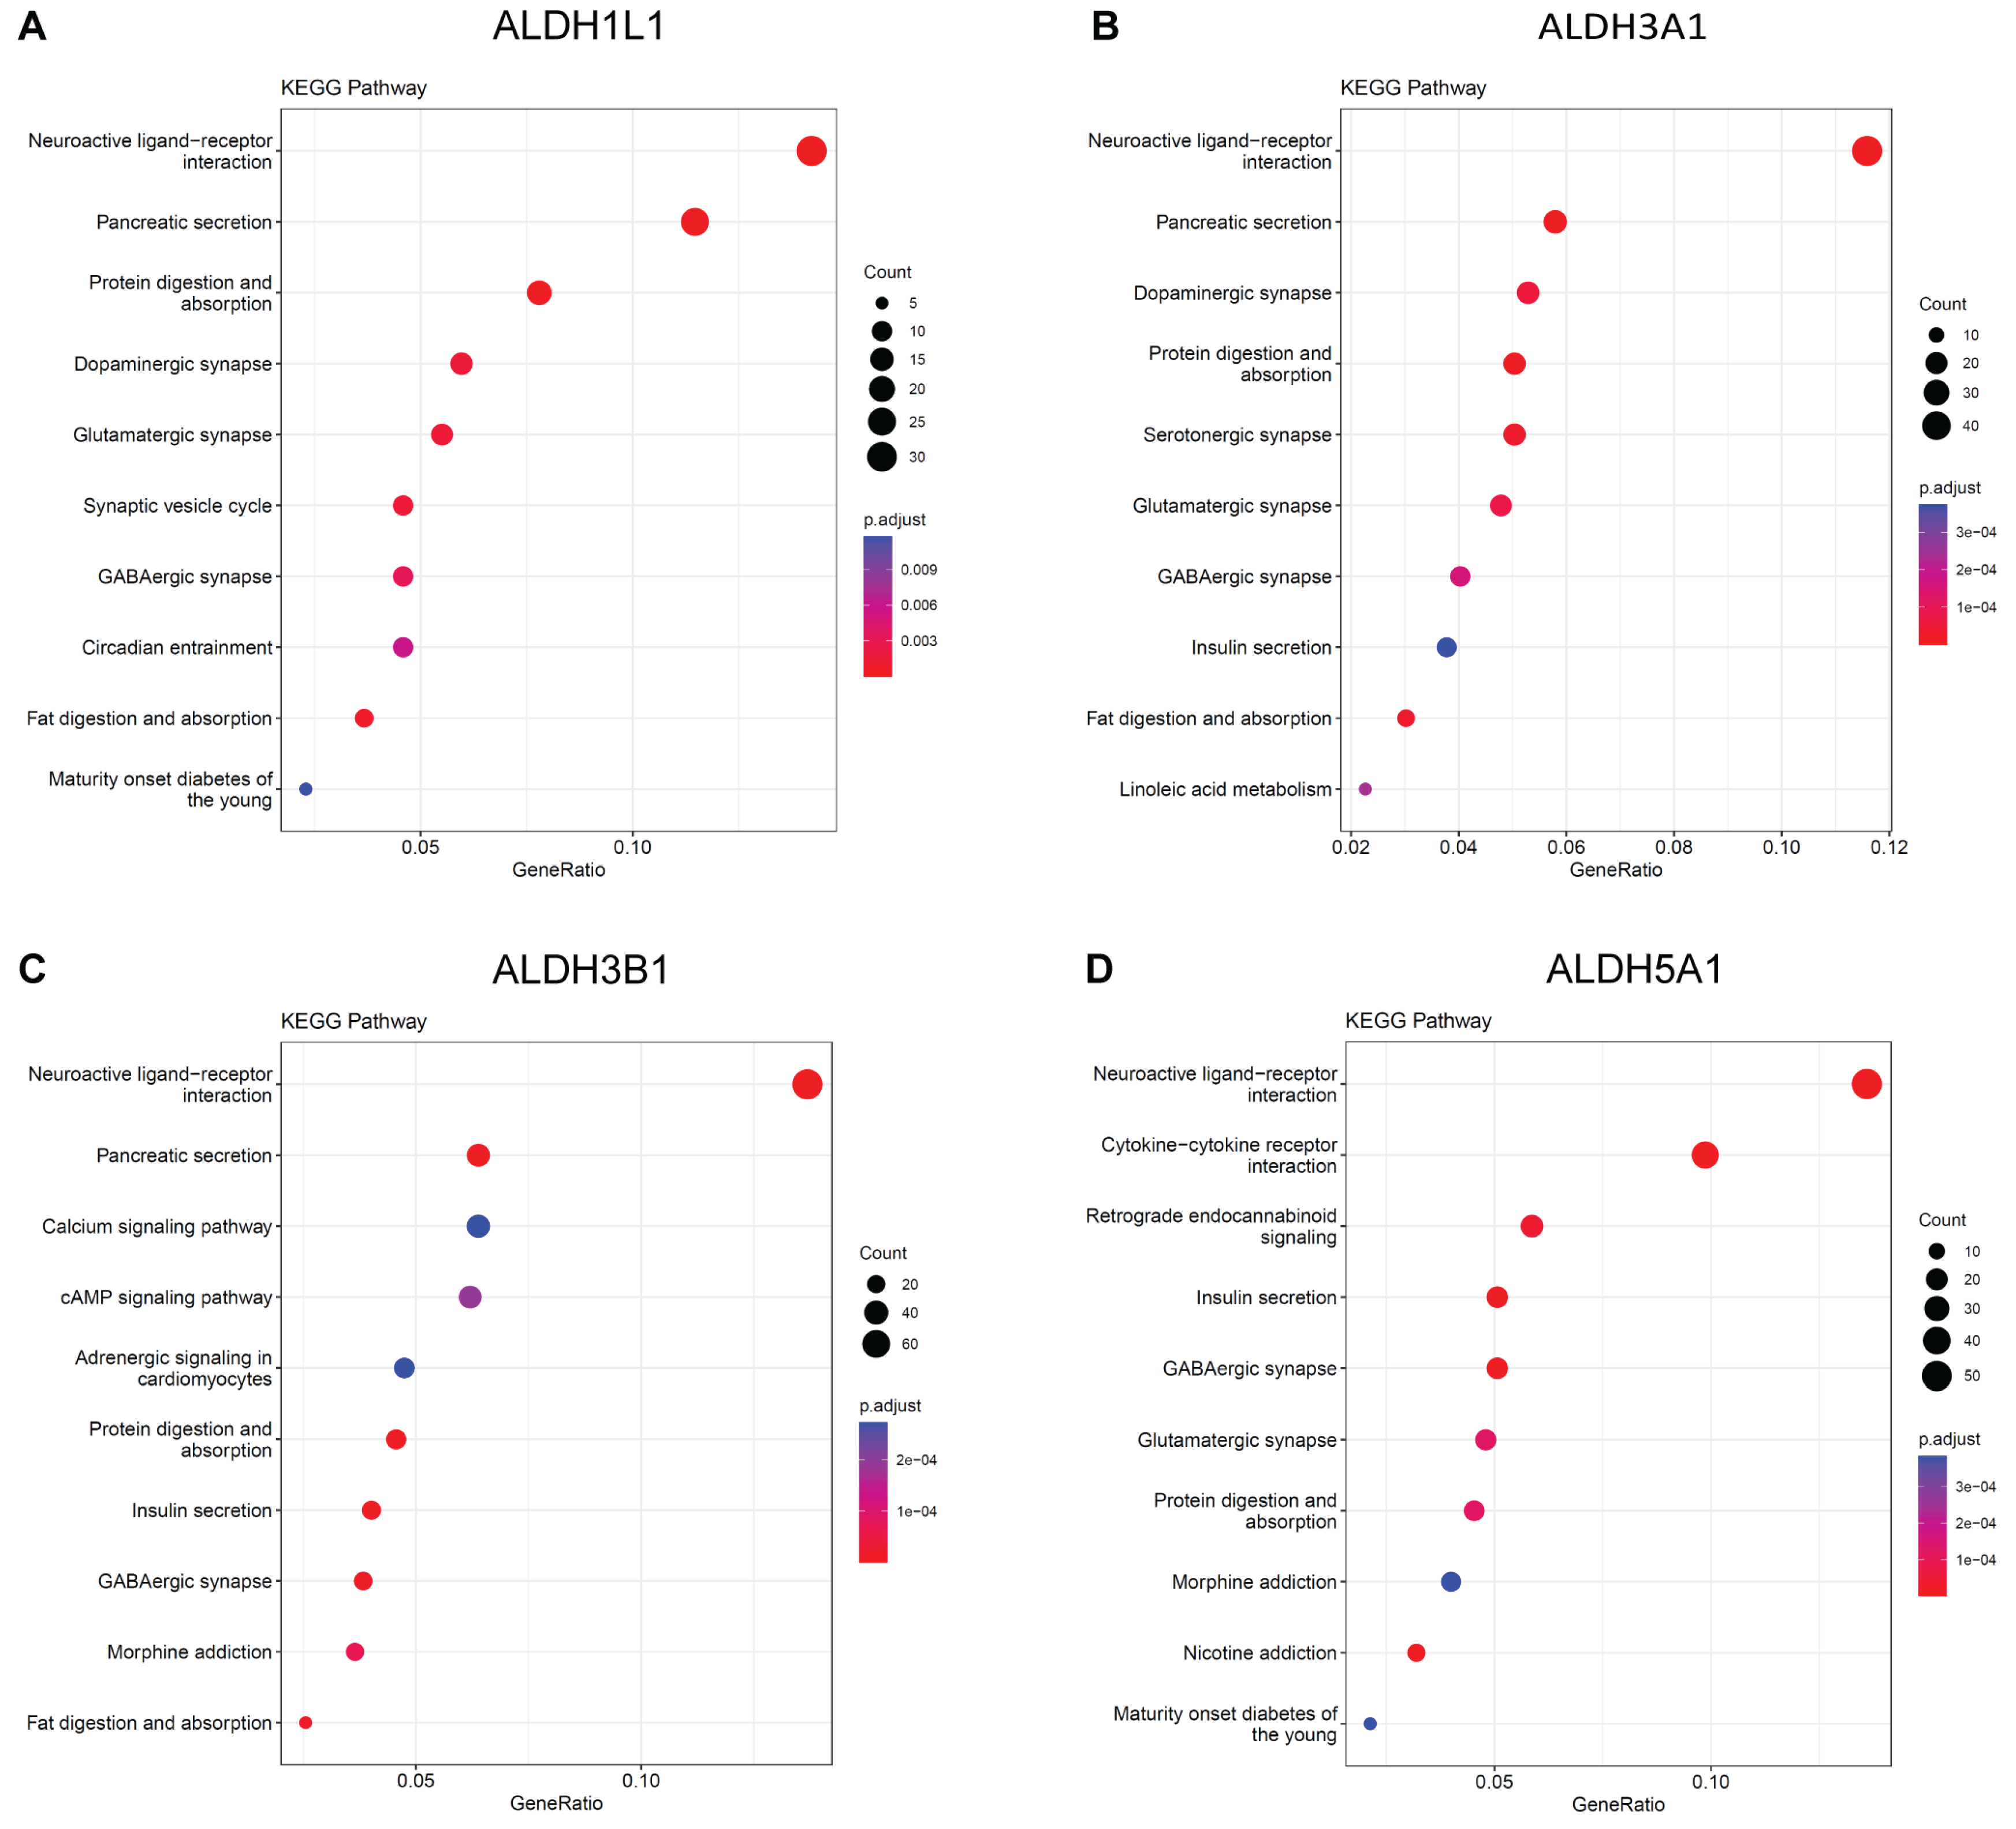
Figure 7.
Investigation of drug sensitivity and ALDH expression in PAAD. (A-T) Comparison of 5-fluorouracil (5-FU), gemcitabine, irinotecan, oxaliplatin, or paclitaxel sensitivity in ALDH1L1, ALDH3A1, ALDH3B1, ALDH5A1 above and below median expression groups. ***p <0.001; **p <0.01; *p <0.05; ns, not significant.
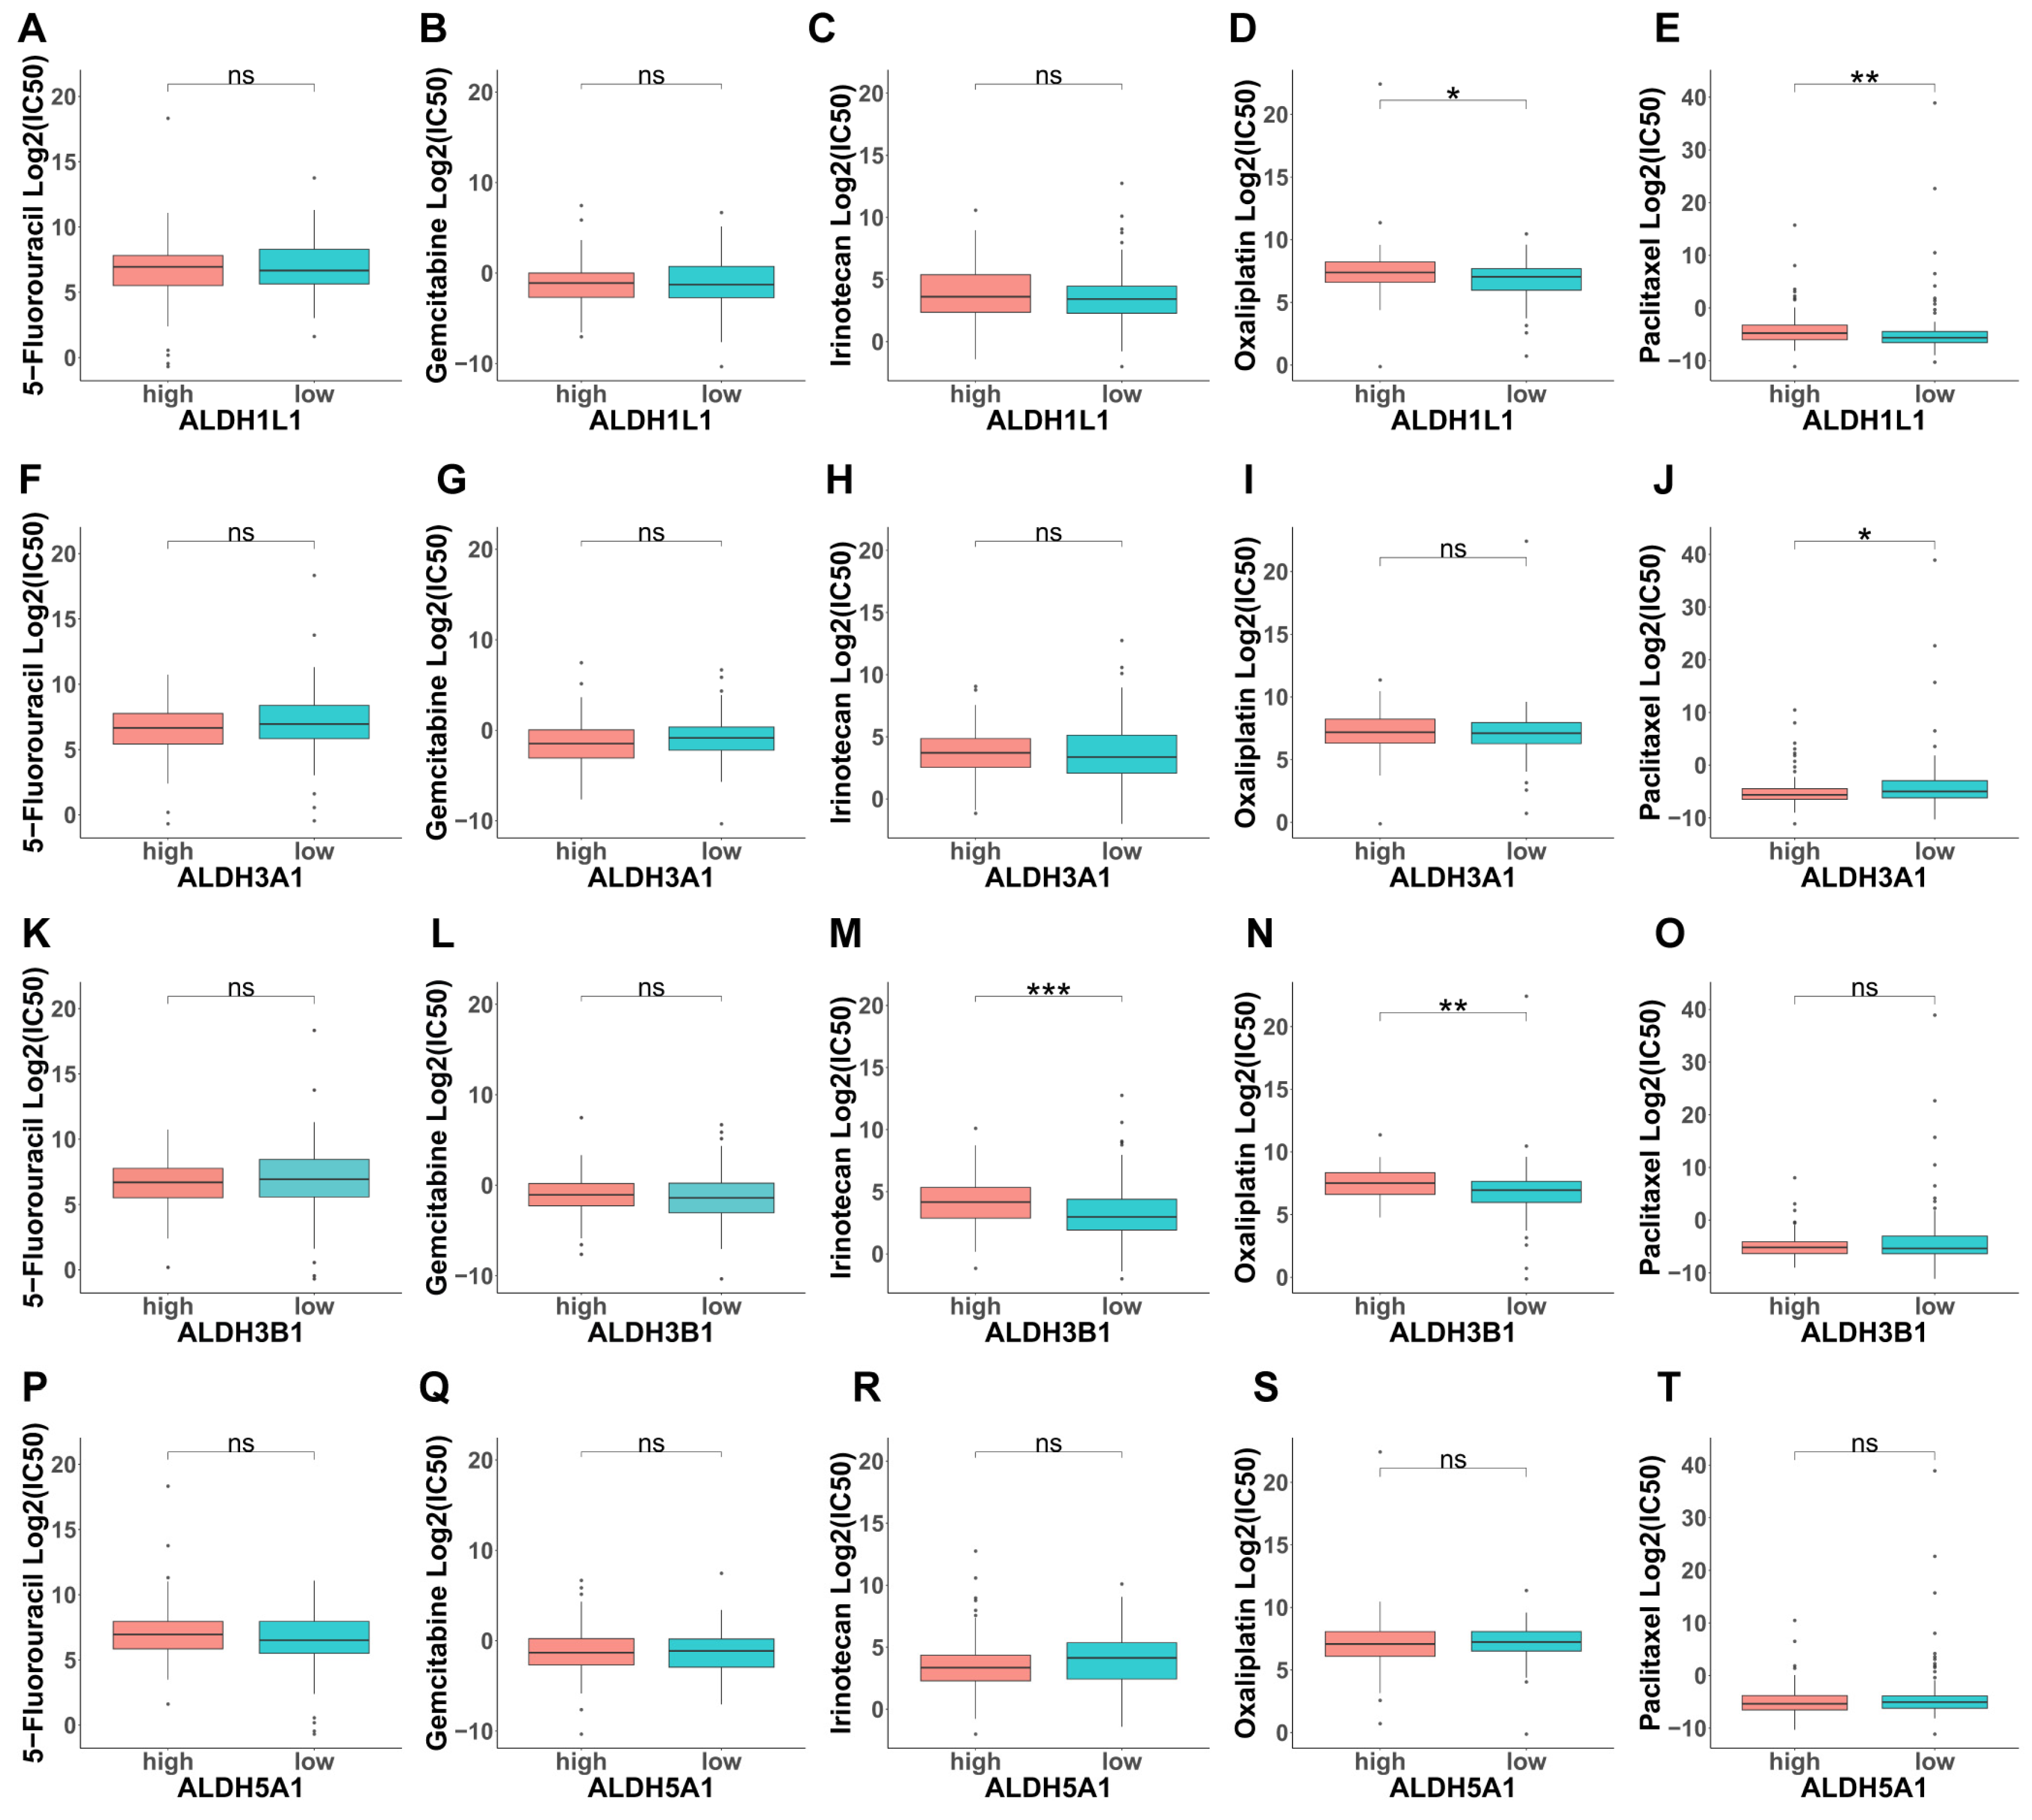
Figure 8.
Estimation of TME Scores and Immune infiltration and ALDH expression in PAAD. Correlation between ALDH1L1(A), ALDH3A1(B), ALDH3B1(C), ALDH5A1(D) expression with TME Scores by the ESTIMATE algorithm. The relationship between the proportion of immunocytes and the expression of ALDH1L1(E), ALDH3A1(F), ALDH3B1(G), ALDH5A1(H). ***p <0.001; **p <0.01; *p <0.05; ns, not significant.
Disclaimer/Publisher’s Note: The statements, opinions and data contained in all publications are solely those of the individual author(s) and contributor(s) and not of MDPI and/or the editor(s). MDPI and/or the editor(s) disclaim responsibility for any injury to people or property resulting from any ideas, methods, instructions or products referred to in the content. |
© 2025 by the authors. Licensee MDPI, Basel, Switzerland. This article is an open access article distributed under the terms and conditions of the Creative Commons Attribution (CC BY) license (http://creativecommons.org/licenses/by/4.0/).
Copyright: This open access article is published under a Creative Commons CC BY 4.0 license, which permit the free download, distribution, and reuse, provided that the author and preprint are cited in any reuse.


