Preprint
Article

This version is not peer-reviewed.

Clinical Significance of Risk Factor Analysis in Pancreatic Cancer by Using Supervised Model of Machine Learning

Submitted:

02 December 2024

Posted:

04 December 2024

You are already at the latest version

Abstract

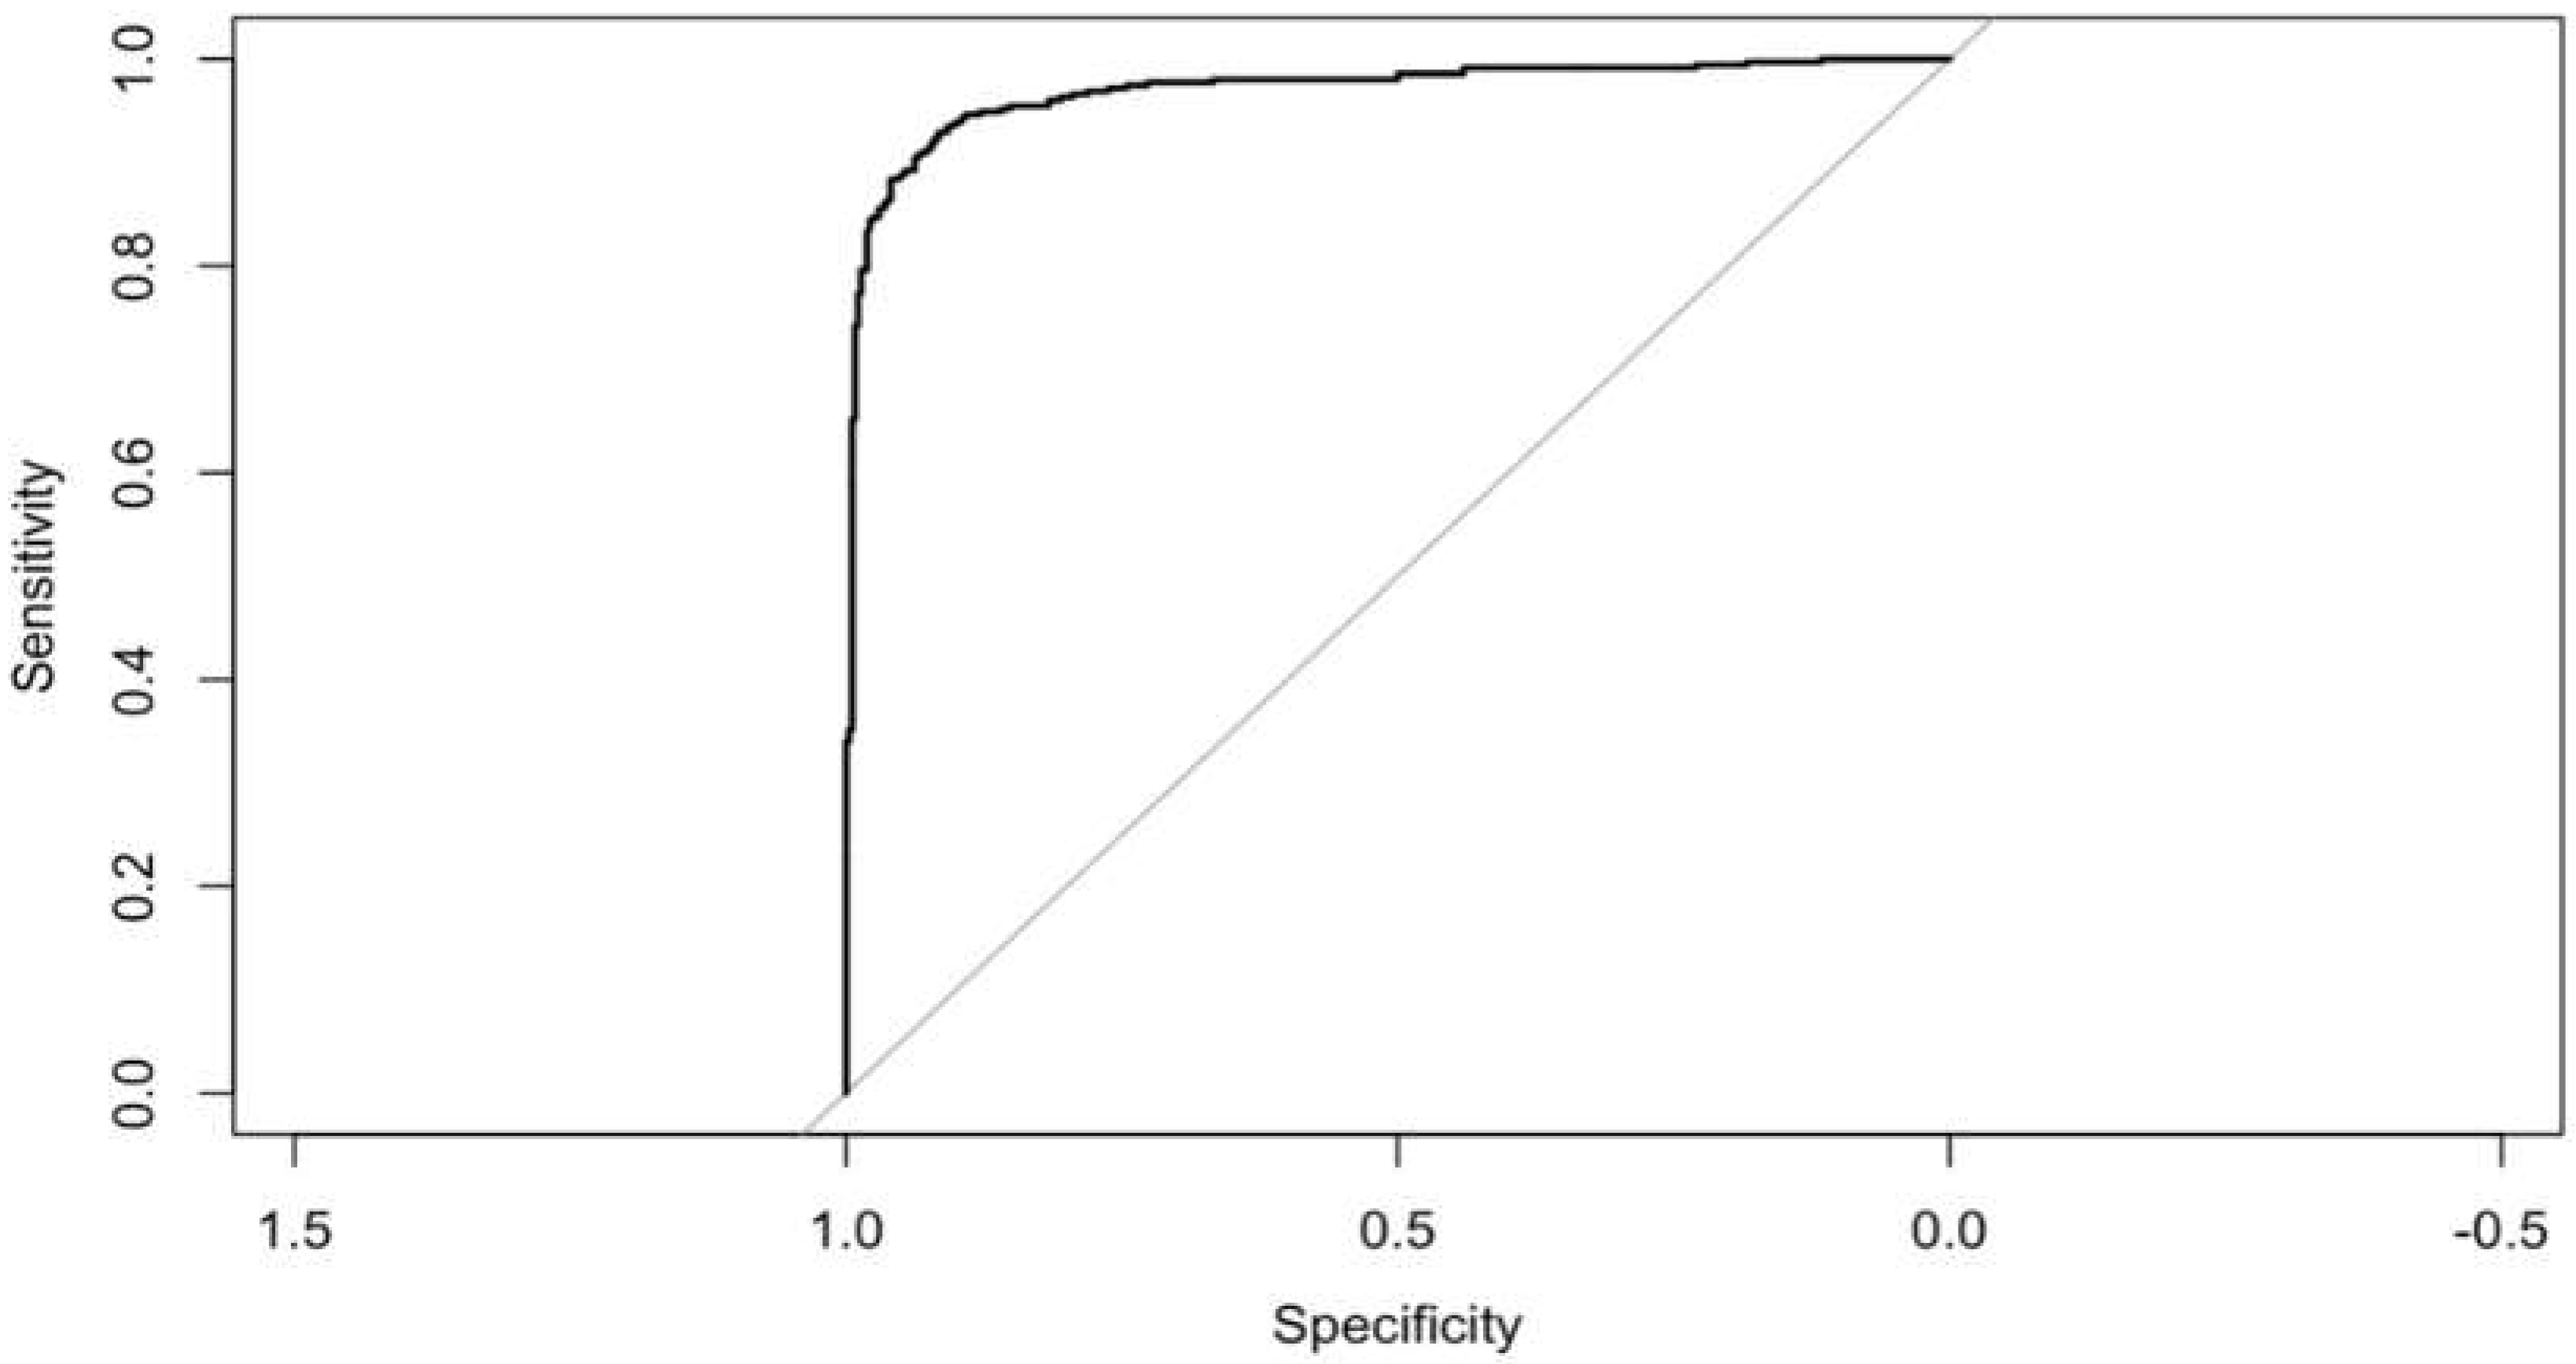
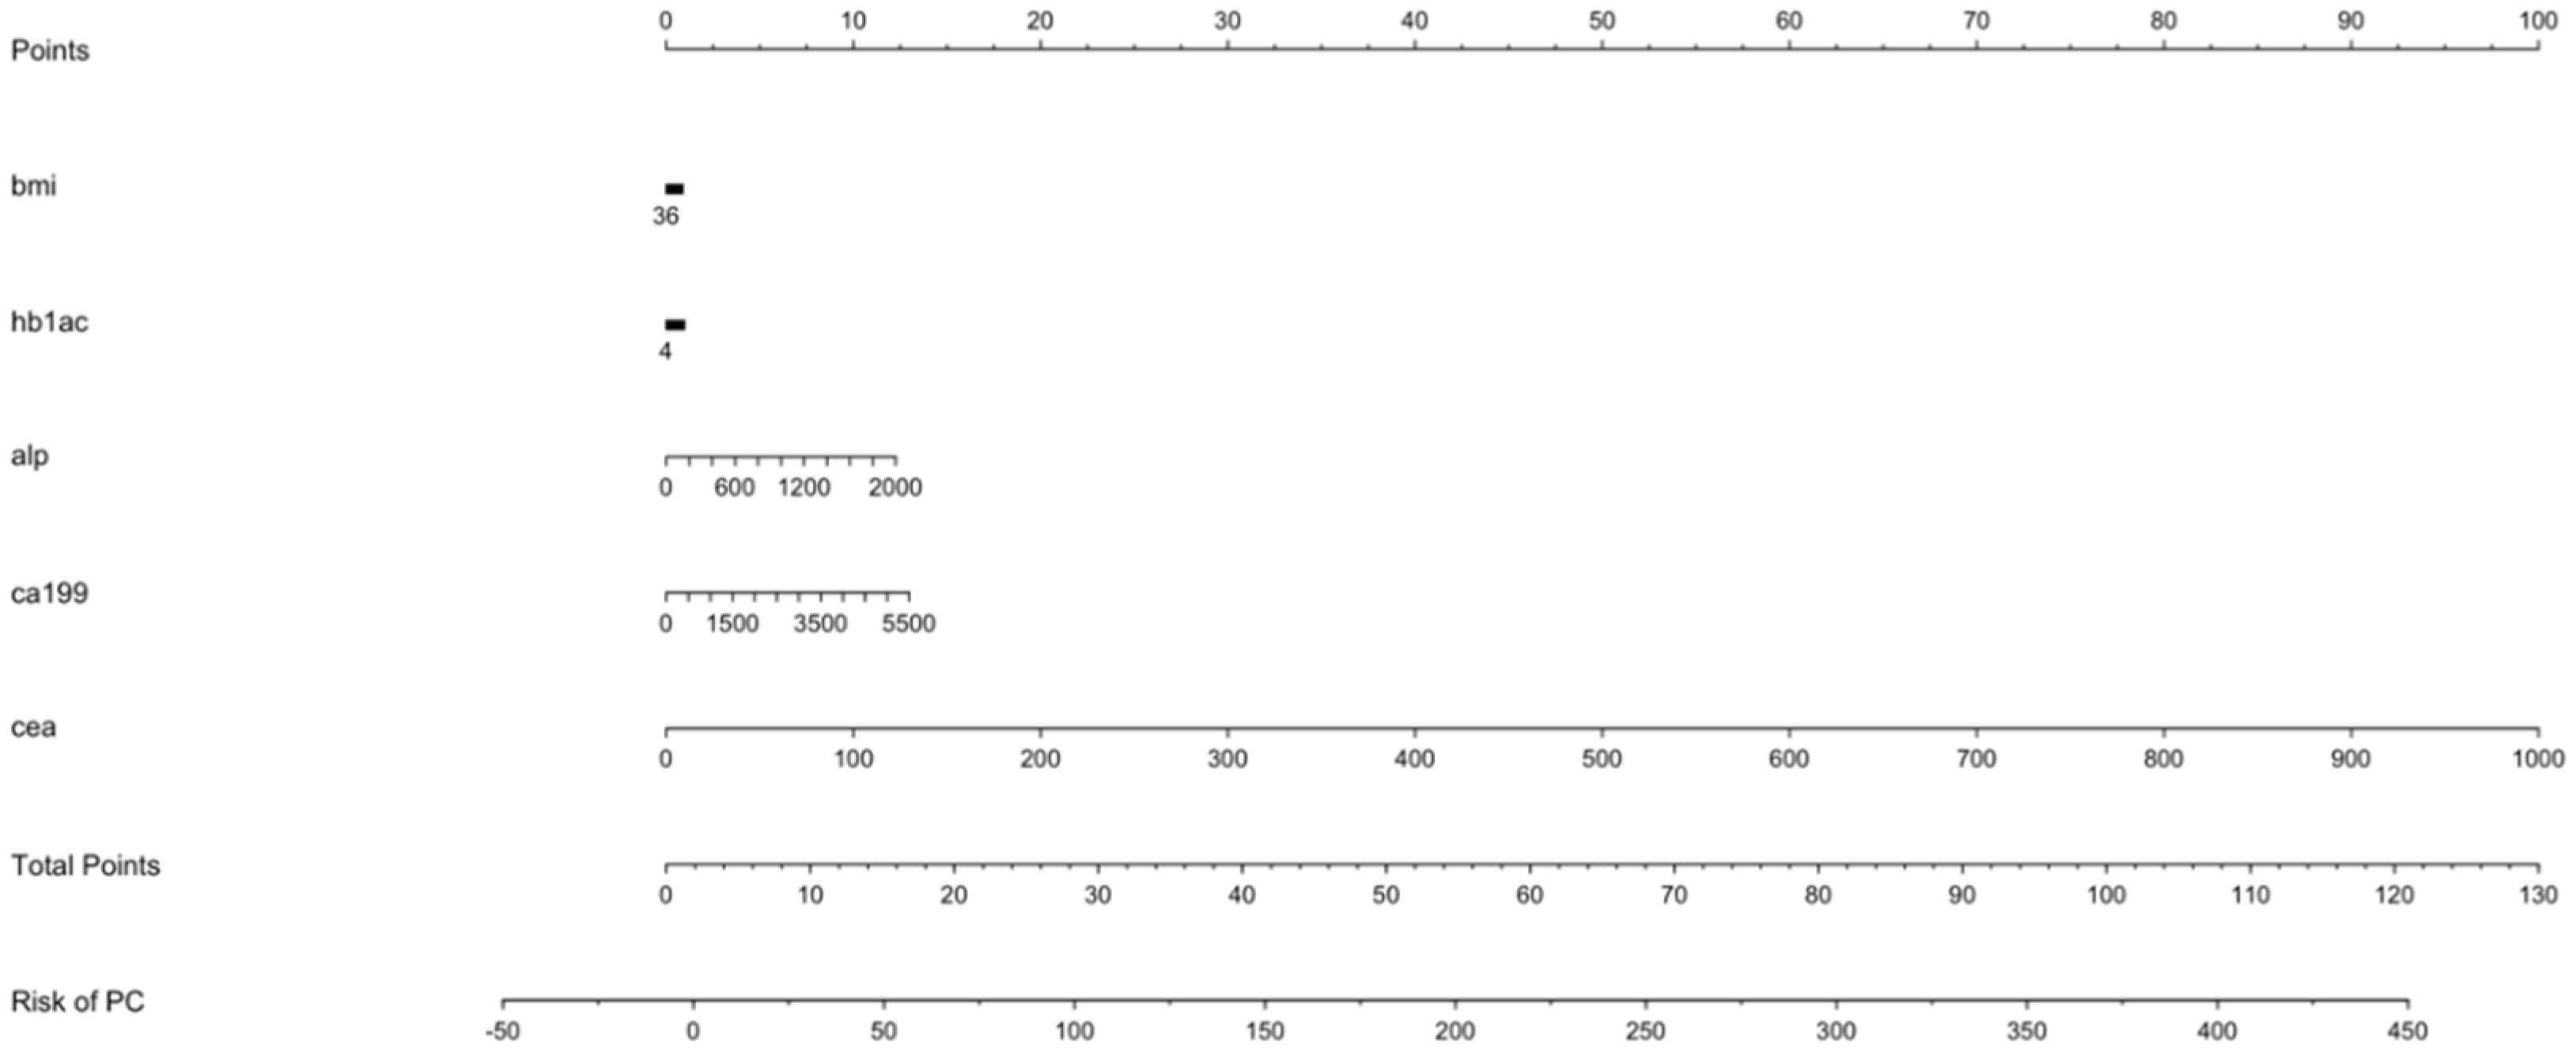
Introduction: Particularly pancreatic cancer, poses a significant global health challenge due to its high mortality rates despite advancements in treatment. Early detection remains crucial as most cases are diagnosed at late stages when surgical intervention is no longer viable. We focused to identify relevant risk factors of pancreatic cancer. Our goal was to determine pertinent risk factors for pancreatic cancer. The best machine learning model was used for risk scoring in pancreatic cancer based on those risk factors and determine their diagnostic value. Methods: We conducted a matched case-control study, retrospectively collecting demographic data and common haemato-logical indicators from all participants. Best model of machine learning among SVM and Logistic regression was chosen to identify risk factors for pancreatic cancer after initial variable selection by dendrogram. Based on these factors, we created a best model for risk scoring in pancreatic cancer and showed higher diagnostic value. Result: 353 cases and 370 controls were finally participated in our study. The discoveries of our machine learning logistic regression with backward elimination showed that Haemoglobin A1c (OR 1.28, 95%CI: 1.08,1.52), Alkaline phosphatase (OR 1.02, 95%CI: 1.01,1.03), CA19-9 (OR 1.01, 95%CI: 1.01,1.01), and Carcinoembryonic antigen (OR 1.41, 95%CI: 1.2,1.66) were related to an expanded risk of PC, while BMI (OR 0.88, 95%CI: 0.81,0.97) were asso-ciated with a diminished risk of PC. Based on these outcomes, the clinical PC for risk scoring was well fitted in the modelled populace, and the score had strong predictive worth with area under receiver operating curve was 0.969 (P < 0.001) which showed higher diagnostic value. Conclusion: HbA1C, ALP, BMI, CA19-9 and CEA levels were associated with the risk of PC. The risk scoring scale (nomogram) might be useful in clinical PC screening as a diagnostic tool by supervised ma-chine learning.

Keywords: 
;  ;  ;  

1. Introduction

Cancer continues to pose a significant global public health concern due to its exceptionally high mortality rate, despite several advanced therapeutic approaches [1]. Pancreatic cancer among all malignant tumours has the highest mortality rate with an aggressive behaviour and a poor prognosis [2,3]. Recently, both in men and women with older age followed by younger age, PC has shown increasing trend in incidence rate with a five-year survival rate of only 10% [4]. According to Global cancer statistic 2022, PC incidence took precedence of 14th in malignancy incidence, while mortality in position of 7th related to death with malignancy [5]. On the basis of Cancer statistics 2021, the American cancer society reported approximately 60430 new cases and 48220 deaths for PC in the United States; ranking third after lung and bronchus cancer and colorectal cancer related death [6]. Currently, the number of death from PC is increasing and it is predicted to be the second leading cause of cancer related deaths in US by 2030[7]. Over the last two decades, the incidence of the PC has steadily increased which accounts for about 2% of all cancers and is associated with 5% of cancer related death[8].In China, the rate of incidence of PC was tenth among malignant tumors, while the mortality rate was sixth among fatalities associated to malignant tumors. These numbers were predicted to increase in the upcoming years as a result of changes in lifestyle and an aging population. As of now, the main treatment that can "fix" PC is careful intercession. Despite this, pancreatic cancer (PC) is a covert illness that presents with surprising early side effects. The majority of patients are found to be suffering from a late-stage illness, which suggests that receiving careful treatment is not a feasible option[9]. Research has exhibited that patients with beginning phase pancreatic malignant growth that didn't have metastases had an endurance pace of 29% over a time of five years, however patients with far off metastases had an endurance pace of just 2.6% [10]. Thus, identifying those who are at risk for various stages of pancreatic cancer is crucial for the analysis and early treatment of pancreatic malignant growth.
Recent epidemiological studies have focused on identifying those at higher risk, estimating the risk, and learning more about the symptoms of pancreatic cancer in order to enhance early identification. Known risk factors include advanced age, diabetes, gallbladder disease, and chronic pancreatitis [11]. Weight loss, elevated blood sugar, back pain, stomach discomfort, and gastrointestinal issues are among the symptoms [12,13]. Just few examinations have researched the elements that influence pancreatic disease related to clinical signs with few biochemical indicators [14,15]. However, in clinical practice, we frequently use a few biochemical indicators to comprehensively evaluate the illness. Specific clinical signs with few hematological indicators are essential for the early disclosure of the condition, legitimate treatment at the fitting time, and an improvement in the visualization of the condition. In recent years, we investigated thoroughly in haematological examination for all suspected malignant tumour but finally assisted with the most widely utilized inspection techniques such as Computed Tomography, Ultrasonography, Magnetic Resonance Imaging, and pathological biopsy for specific diagnosis which may be greatly impacted by its financial factor. To overcome such problem, we consider many hematological examinations with medical and family histories for screening to explore relevant risk factors associated with pancreatic cancer. In several studies previously conducted in Korea reported that not only the DM but also the elevated fasting blood glucose was related to risk of pancreatic cancer even if the level was lower than the diagnostic level for DM [16,17].
The homodimeric enzyme alkaline phosphatase (ALP) is used to remove phosphate groups. All tissues and organs express ALP; however the liver, bile duct, kidney, and bones have the highest concentrations. Researchers have found over the years that a lower prognosis for cancer of the prostate [18,19,20], cancer of the colorectal [21], triple negative cancer of the breast [22], nasopharyngeal cancer [23], and esophageal cancer [24] is significantly correlated with elevated serum ALP levels. However, there has never been a thorough discussion of the relationship between PC survival and serum ALP measurements made at significant times, particularly upon diagnosis or prior to or following curative resection. Furthermore, because PC patients' ALP readings will unavoidably fluctuate throughout the course of the survival period, dynamic survival models that can further account for this time-varying aspect of ALP should also be employed to produce a more believable conclusion. ALP level may be a sensitive biomarker of tumor proliferation because a previously published study indicated that in patients with resected esophageal cancer, higher ALP was significantly linked with lymph node involvement [25]. It is plausible that an elevated ALP in patients with PC, particularly those who have had their PC removed, may be linked to lymph node involvement as another kind of solid malignant tumor. This could lead to an early recurrence and further advancement of the illness.
Similarly, in 1965, tissue from fetal colon and colon cancer was used to identify the glycoprotein known as carcinoembryonic antigen (CEA), which has a molecular weight of 180–200 kDa [26].In addition to colorectal cancer, there is a rise in CEA in a number of other cancer types as well, such as thyroid, lung, and breast cancers [27,28,29] Furthermore, 30% to 60% of individuals with pancreatic cancer had elevated serum levels of CEA [30]. The most widely used organic marker, CA19-9, is now thought to represent the best quality level for PC. As demonstrated in [31,32], CA19-9 was employed in PC as a biomarker, indicator, advertising, and in other capacities. In this way, it may be helpful to look at the factors linked to the danger of pancreatic neoplastic growth in relation to clinical symptoms in order to determine the criteria for evaluating clinical PC.
The goal of machine learning, or ML, a subset of AI, is to enable computers to learn from experience. To complete tasks, it uses algorithms that rely on large amounts of data [33]. Prediction in modern medicine is challenging due to the abundance of data. Big data integration both observed and predicted is where machine learning shines in a nonlinear, clever way [34]. By kind of mark, machine learning strategies are divided into four categories: semi-supervised, supervised, unsupervised, and reinforcement learning. Another technique to integrate different algorithms is grouping learning. ML classifiers are organized with the use of ROC curves, which show classifier performance. Plotting sensitivity against specificity, they are line charts. Performance is indicated by the area under the ROC curve (AUC), where higher AUC values correspond to better performance. When assessing machine learning processes, additional measures including accuracy, sensitivity, specificity, R-squared value, Brier score, PPV, and NPV are frequently employed [35].
In order to investigate the variables associated with the risk of PC and use them to generate a risk assessment scale of PC, we utilized a matched case-control study to retrospectively analyze the medical records of 353 PC patients and 370 control individuals at the Tenth's People Hospital of Tongji University from January 2017 to December 2023. The goal of this study was to enable early detection and prompt treatment of PC patients in clinical practice.

2. Materials and Methods

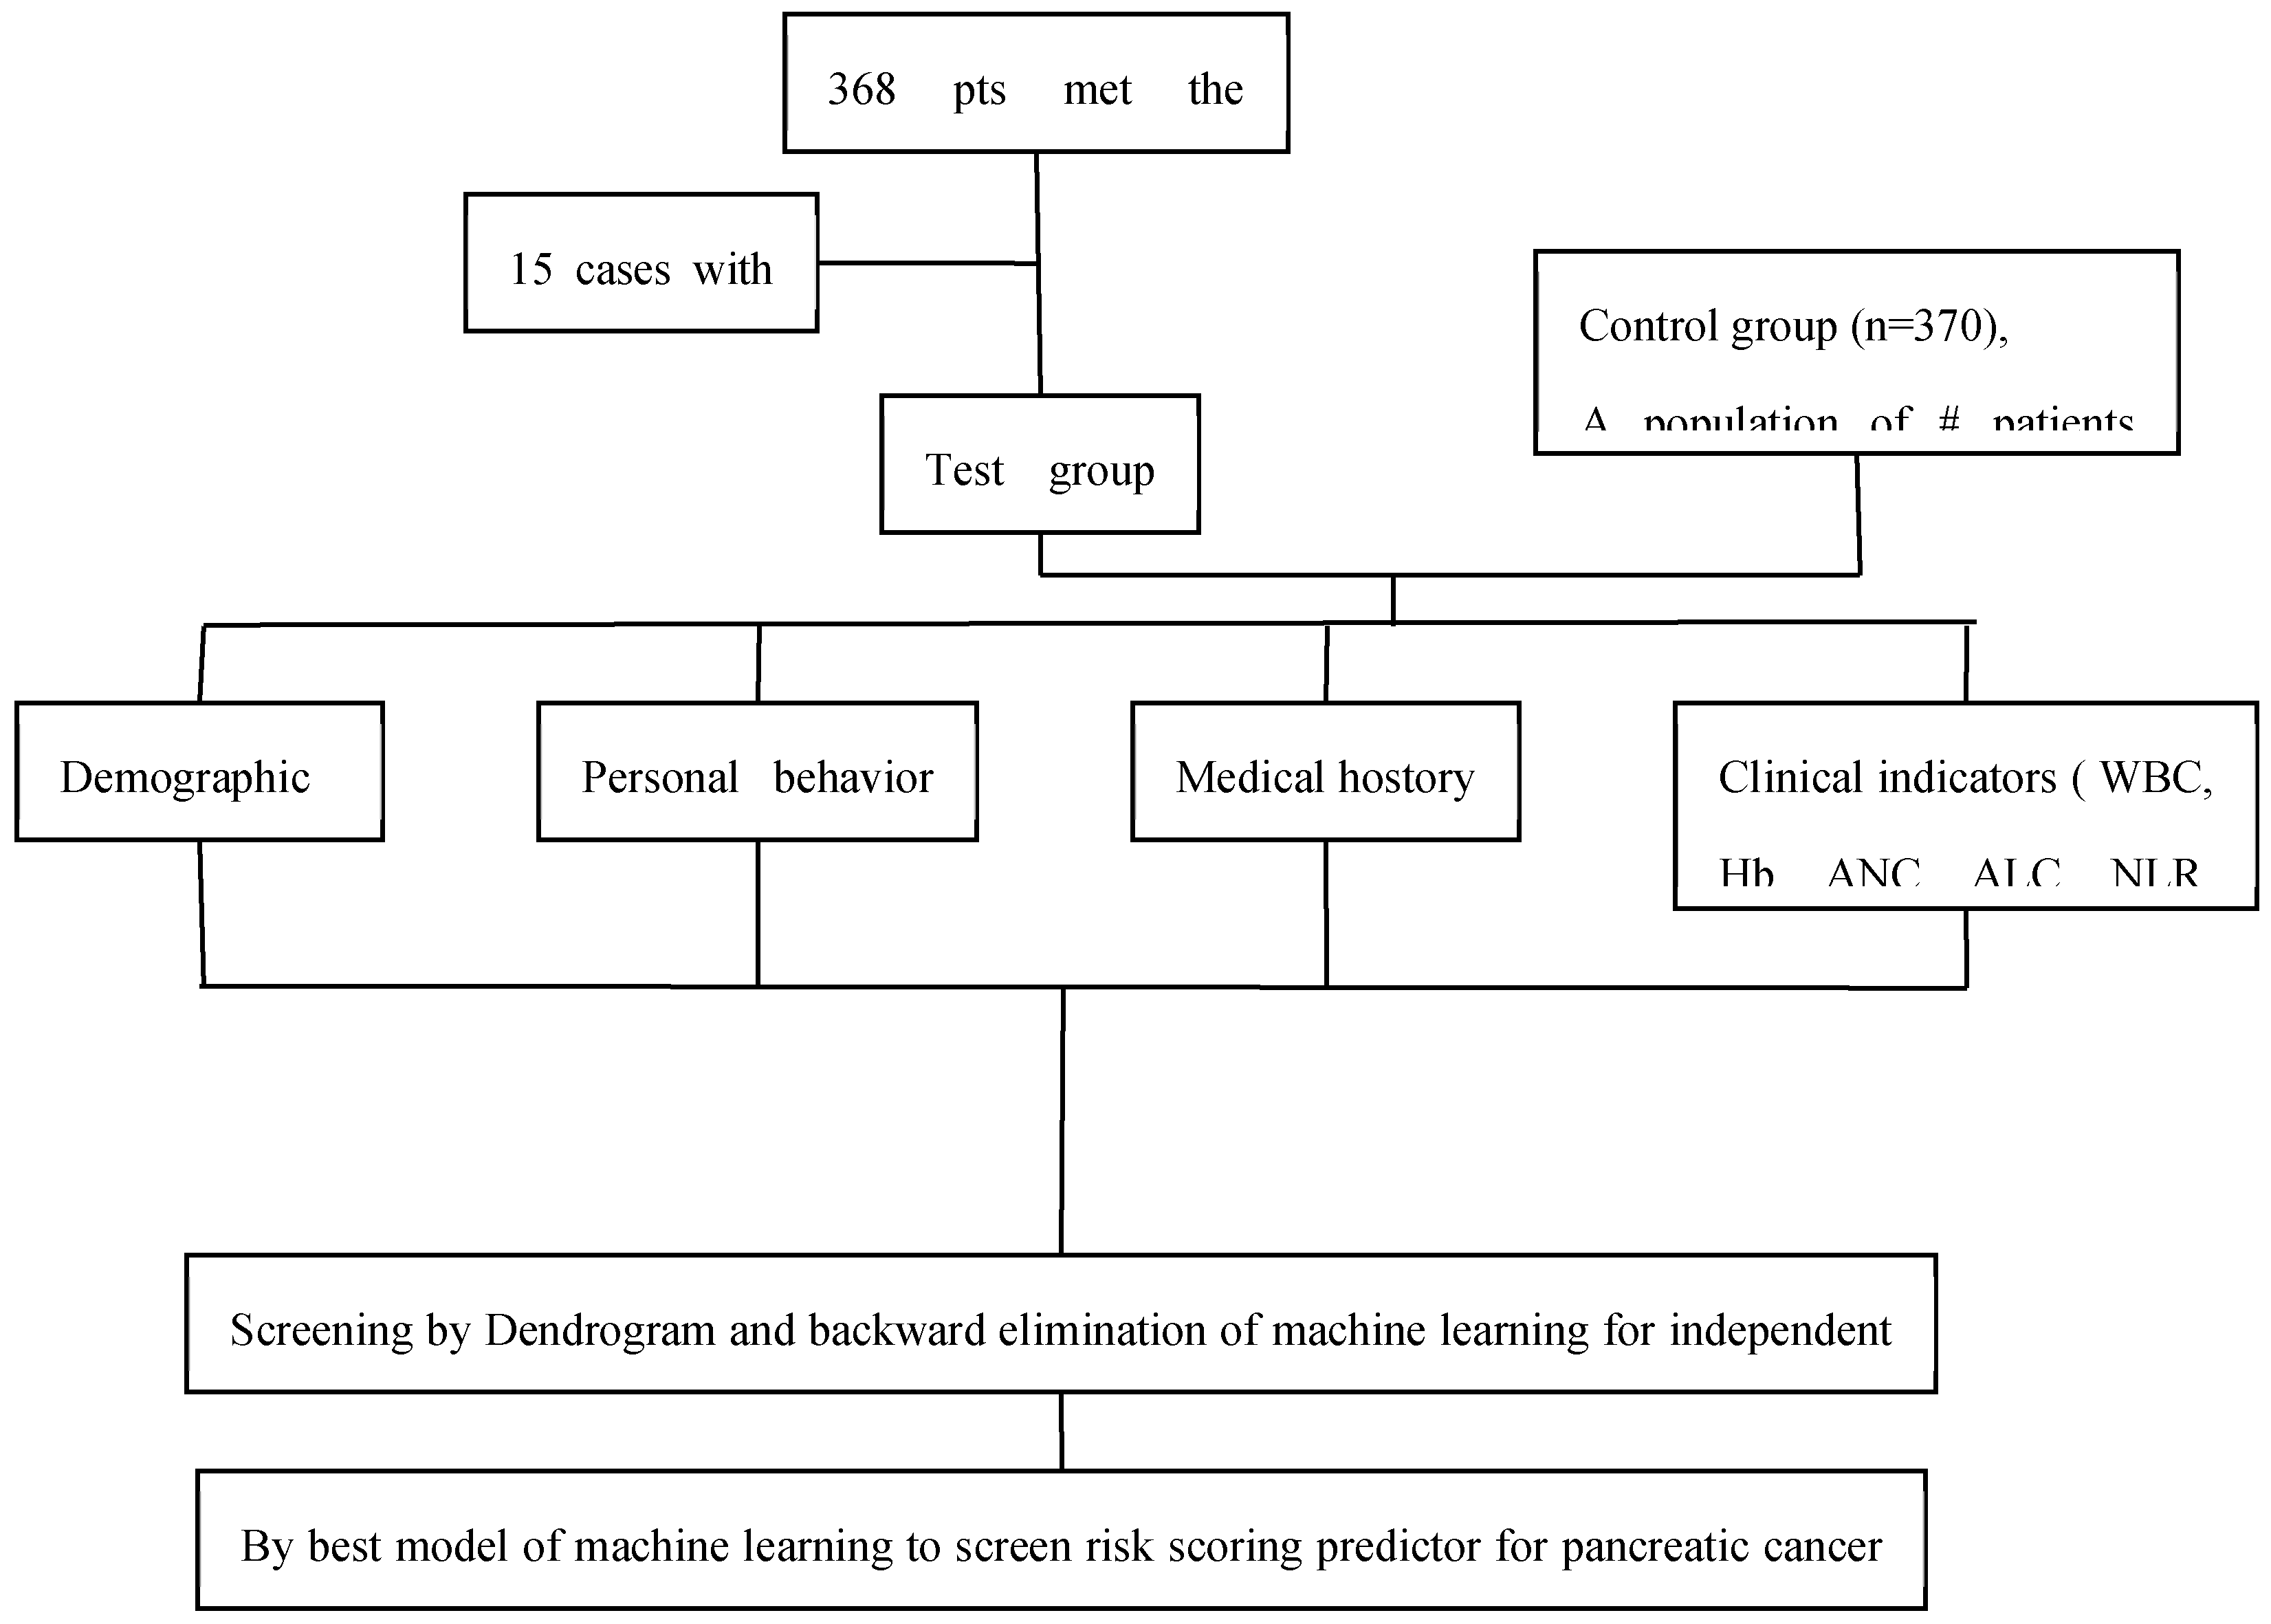
2.1. Study Population

This study included patients who underwent pathological or imaging exams, or clinical signs suggestive with PC, at the Tenth People’s Hospital of Tongji University between January 2017 and December 2023. Out of 368 patients for primary screening criteria, 15 patients with incomplete data were excluded. Eventually, 353 patients were available at the final follow-up and included in the study. Similarly, Control group of 370 fractured patients admitted in the orthopedic department matched by gender and age at the same hospital were randomly chosen at the same period.

2.2. Inclusion Exclusion Criteria

Inclusion Criteria
➢
All patients who met primary screening criteria are included.
➢
Blood tests of first visit after pancreatic cancer diagnosis prior to start of treatment.
➢
Age more than 18 years are included
Exclusion Criteria
➢
Pancreatic cancers patients associated with other malignant tumor were not included.
➢
Patients with incomplete data information were excluded.
➢
Ages less than 18 year are excluded.

2.3. Study Design

The following data were retrospectively collected by reviewing medical records and telephone follow-ups: age, gender, height, weight, body mass index(BMI), history of smoking, history of alcohol consumption, history of diabetes, history of hypertension, lipid indexes: total cholesterol (TC), triglycerides (TG), high-density lipoprotein cholesterol (HDL-C), low-density lipoprotein cholesterol (LDL-C), D-Dimer, WBC, ANC, ALC, Platelet, Hemoglobin, NLR , PLR, CRP, Fasting blood glucose, glycated hemoglobinm, Albumin, Uric acid, LFT indexes:AST, ALT, ALP, DBIL, TBIL and tumor marker: carbohydrate antigen (CA19-9) and CEA levels. The factors associated with PC risk were first analyzed by Dendrogram for variable selection. Furthermore, variables selections were done by machine learning of logistic regression with backward elimination and SVM under AKC and features importance rank. Then a risk scoring population for pancreatic cancer were identified from best model and also find diagnostic values. The specific flow is shown in Figure 1

2.4. Statistical Analysis

Data were entered in MS Excel® and imported to R version 4.3.2 for data cleaning and analysis. Participant characteristics were described using numbers (percentages) for categorical variables and median (Interquartile range) for continuous variables. The distribution of predictor variables among pancreatic cancer and non-pancreatic cancer groups was compared using the Chi-square test and Wilcoxon rank sum test.
In the variables selection process, cluster dendrograms were constructed initially using the Hmisc package; employing Hoeffding's distance for continuous variables and comparison of proportions for categorical variables. Variables were selected from the dendrogram based on their grouping within distinct clusters, indicating similarity (with a threshold of 30 times Hoeffding distance > 0.3), along with expert knowledge. Three continuous variables were removed from the dendrogram, whereas no categorical variable was removed from the dendrgram as the proportion of concurrent categories was lower than 0.25 for all the categorical variables. Furthermore, two distinct machine learning models were employed: Support Vector Machine (SVM) using e1071 package, and logistic regression models with backward elimination using rms package, aimed at identifying the most robust predictors of pancreatic cancer. Variables were further selected based on their importance derived from Akaike Information Criterion in logistic regression, and weights assigned by linear kernel SVM. Subsequently, the selected variables were used to execute the corresponding models, and their performance was assessed based on the receiver operating characteristic curve’s area under the curve (AUC). The logistic regression model exhibited the highest AUC among the two, thus chosen as the final model.
Odds ratios and their corresponding 95% confidence intervals (CIs) were calculated, with a significance level set at P < 0.05 (two-tailed). Internal validation of the final model was conducted using bootstrapping with 150 repetitions. Predictive performance of the model was evaluated through calibration and discrimination. Calibration was assessed by plotting observed proportions against predicted probabilities and a smoothed plot was obtained. Discrimination, indicating the model's ability to differentiate between participants experiencing or not experiencing an event, was measured using the area under the receiver operating characteristic curve or c-statistics (ranging from 0.5 for chance to 1 for perfect discrimination).Using the final logistic regression model, a nomogram was developed to predict the risk of pancreatic cancer using rms package.

3. Results

3.1. Basic Information of the Study Participants

This study comprised 353 PC (case group) patients with a median age of onset of [68.0 (63.0, 75.0)] years. In the case group, there were 210 (59.5) males and 143 (40.5) females, for a male to female sex ratio of 1.46:1. In addition, 370 non-pancreatic cancer (control group) were chosen from the Fractured patients throughout the same time, with a median onset age of [68.0 (62.0, 74.0)] years. There were 165 (44.6) males and 205 (55.4) females in the control group for a male-to-female ratio of 1:1.24. Regarding age, there were no statistical differences between the two groups whereas in gender there was statistical different (p = 0.6, p = <0.001).
In terms of diabetes and smoking history, the proportion of patients in the case group were higher than that in the control group (43.6% vs22.4%, p<0.001, 27.8% vs 17.3%, <0.001).The proportion of hypertension and coronary artery disease history in the two groups were not statistically different whereas alcohol history in proportion was less significant in comparison to two group (p= 0.8, p= >0.9 and p=0.033). The case group’s median BMI, Hb, ALC, TC and LDL-C levels were lower than that of the control group (p< 0.001). Whereas as shown in Table 1, the case group’s median level of NLR, CRP, Hb1AC, DBIL, TBIL, ALP, CA19-9 and CEA were greater than that of control group and statistically significant (P <0.001) but some of the continuous variables such as WBC, platelet, CRP, ANC and TG were not statistically significant between two groups (p= 0.4, 0.3, 0.009, 0.7 and 0.2).

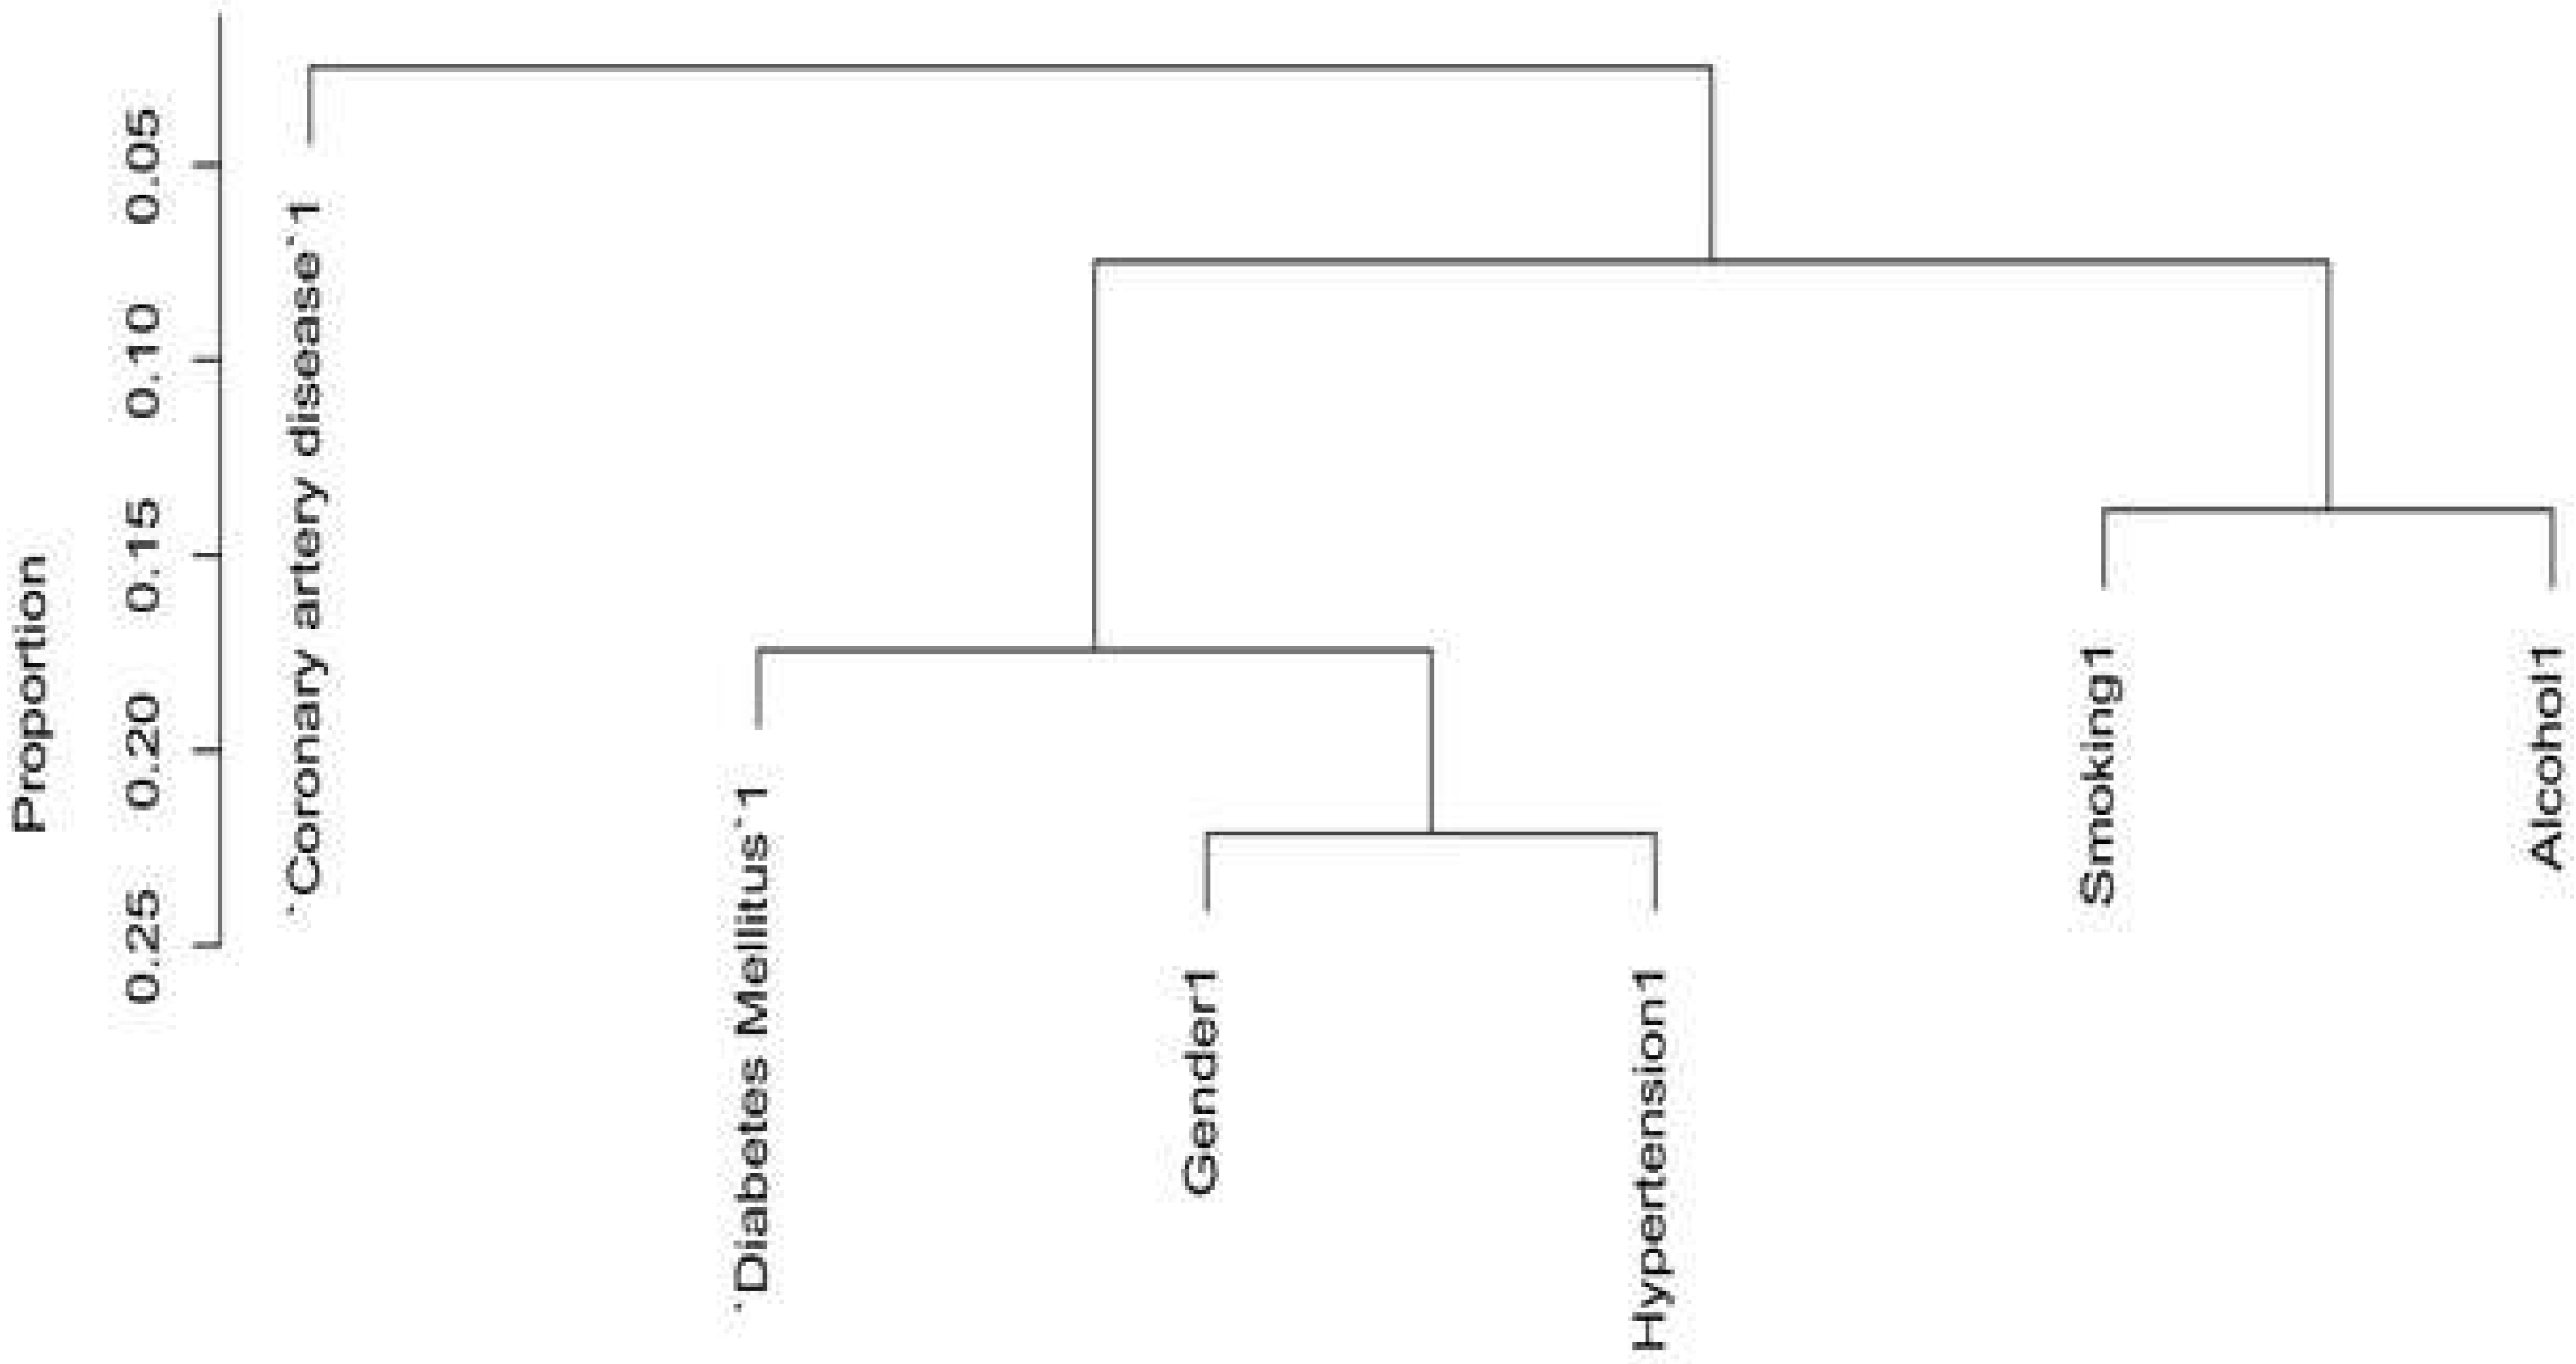
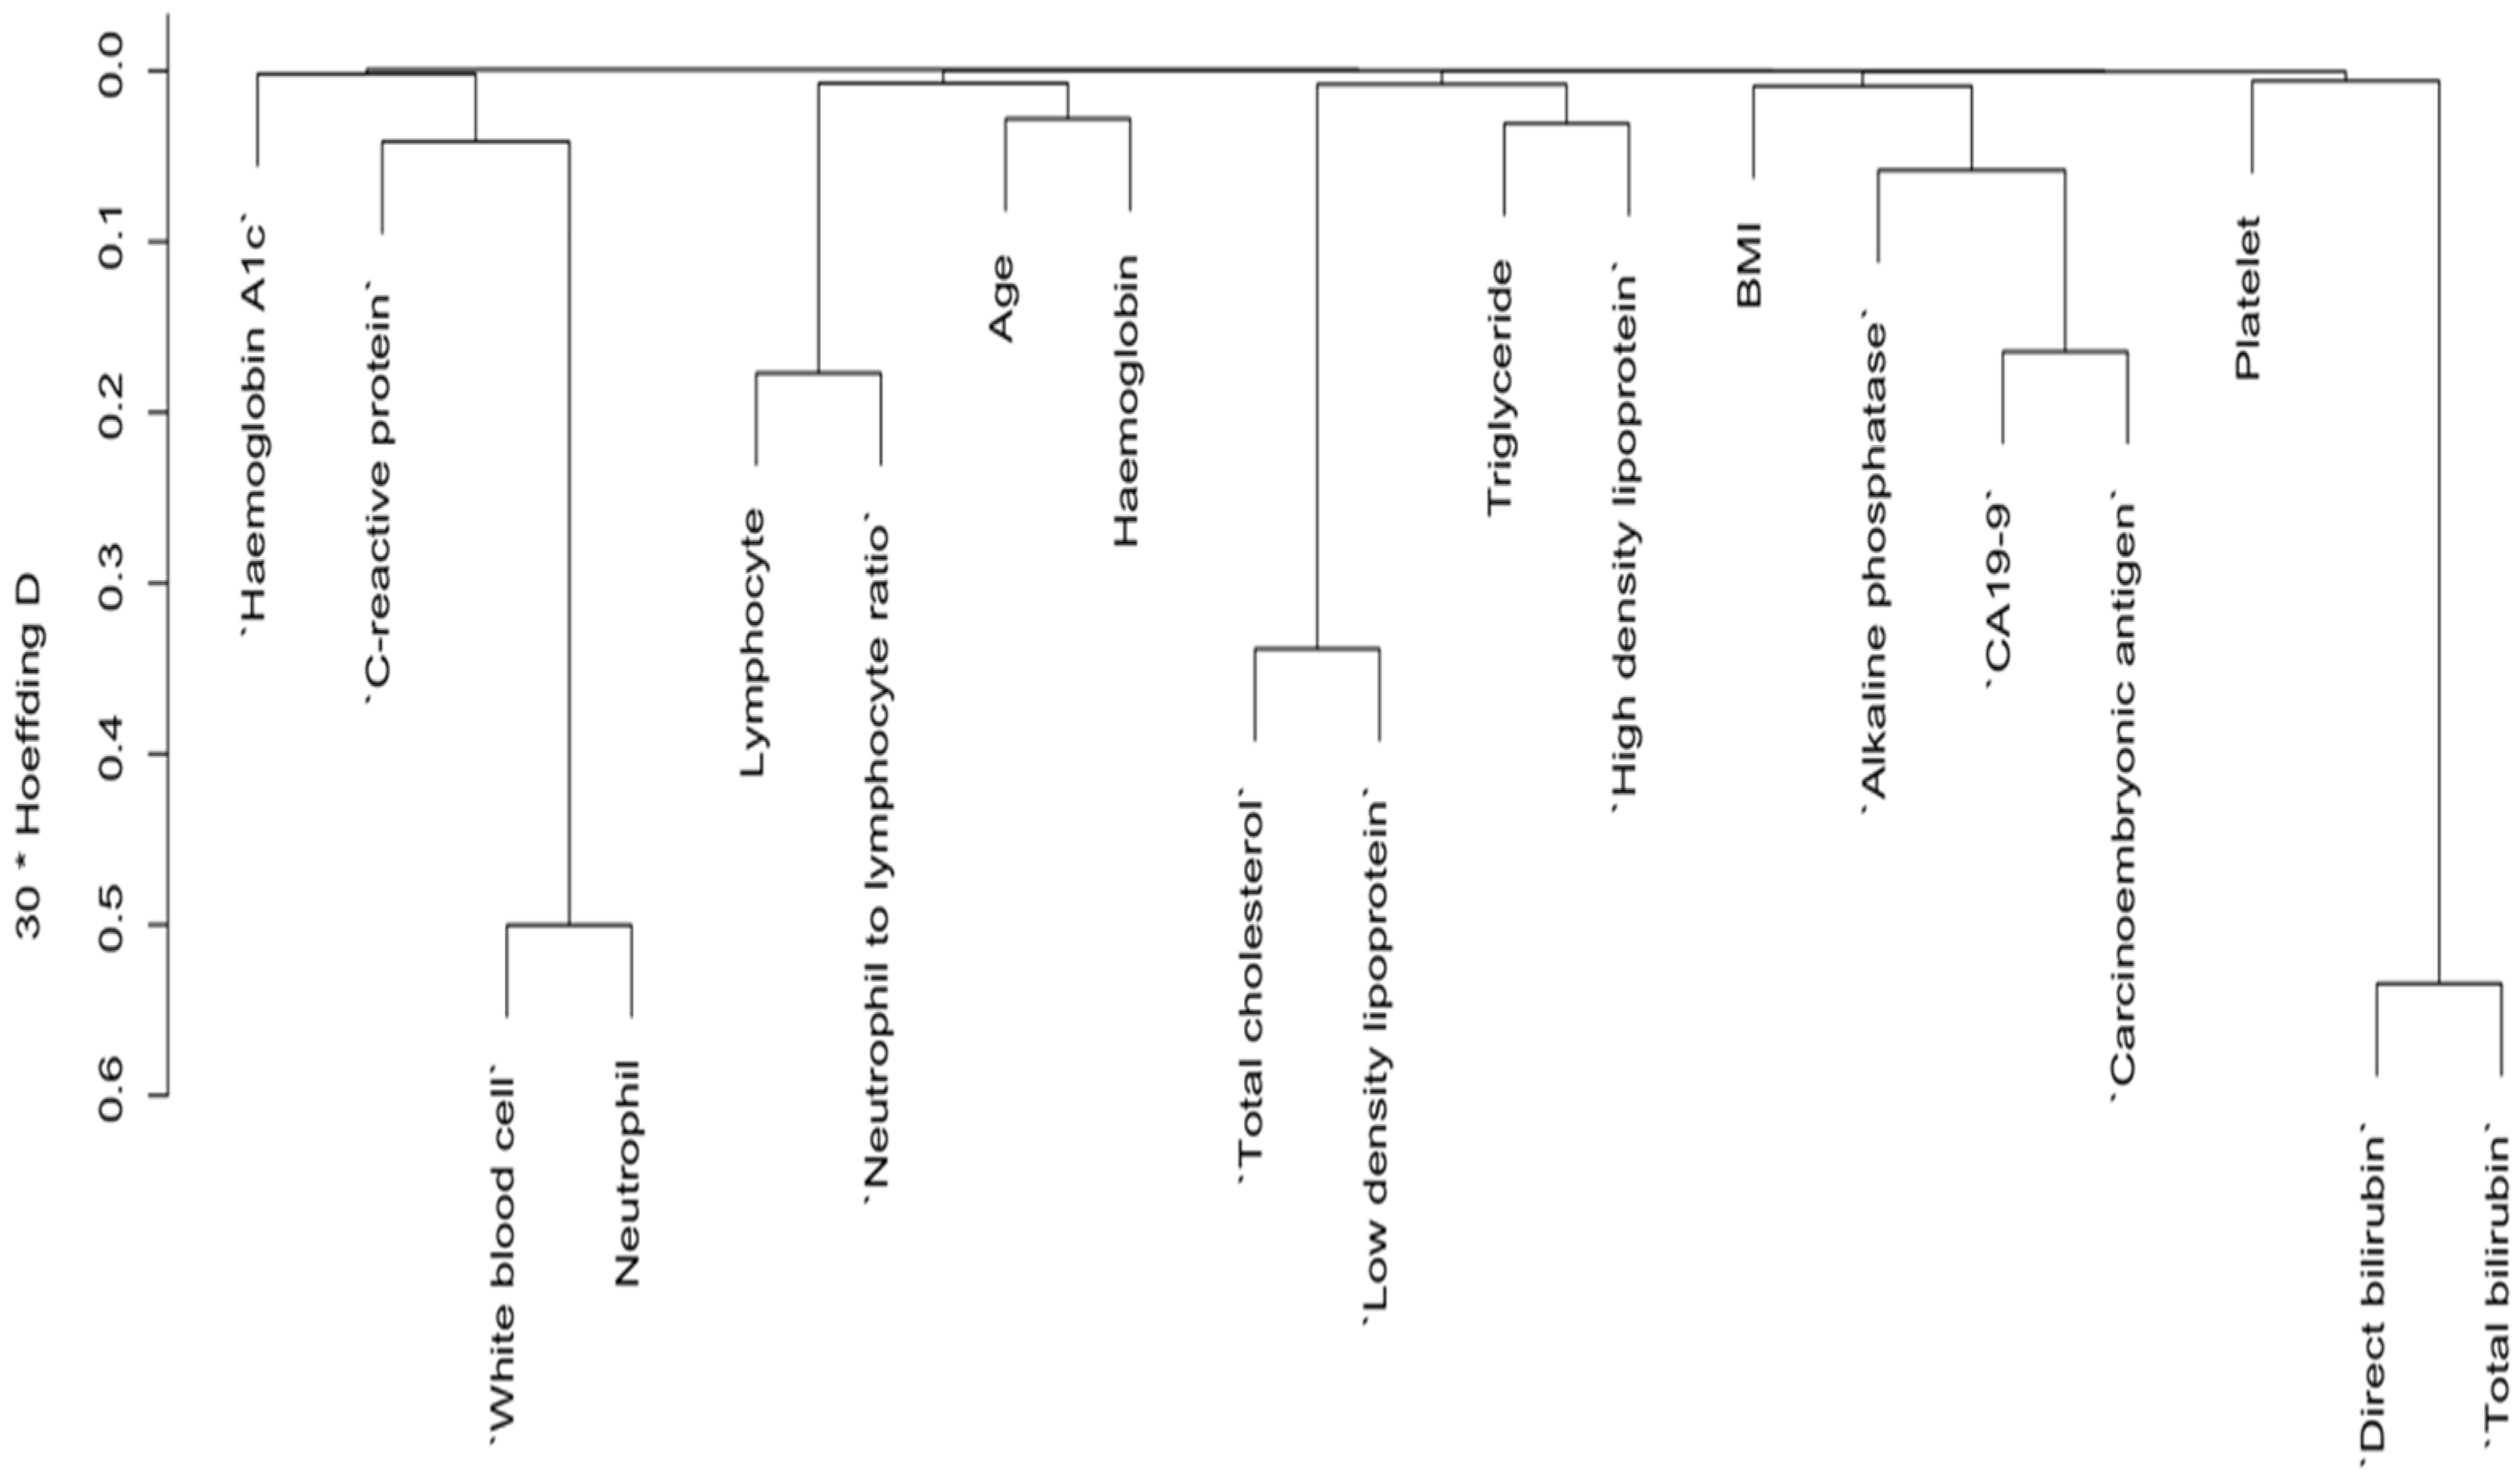
3.2. Variables Selection for Risk of Pancreatic Cancer by Dendrogram Cluster Analysis for Both Categorical and Continuous Predictors

To reduce the redundancy of the predictor variables and to select the distinct predictors of PC, we used cluster dendrogram. Figure 2 presents the cluster dendrogram of categorical variables. No variable had a concurrent grouping of positive cases in more than 25% of observations, so we did not remove any variables. In Figure 3, because there were three distinct clusters with high similarity indicated by a >0.3 Hoeffding’s distance, we removed three variables from the model based on expert knowledge (removed variables: Neutrophil, Total cholesterol, and Total billirubin).
Figure 1. Cluster dendrogram for categorical variables.
Preprints 141492 g002

3.3. Further Variable Selection by Backward Elimination and Features Importance Ranked

As the outcome variable was binary, two classification methods were employed and compared to select the more parsimonious model for the diagnosis of PC. Using logistic regression and SVM, we ranked the importance of predictors in diagnosing pancreatic cancer. In the backward elimination process, the variables retained based on the AIC criteria were BMI, Hemoglobin1AC, Alkaline phosphatase, CA19-9, and Carcinoembryonic antigen. The top five most important variables for predicting pancreatic cancer in the case of SVM were CA19-9, Carcinoembryonic antigen, Alkaline phosphatase, Neutrophil to lymphocyte ratio, and Hemoglobin A1c. With an AUC of 0.969 for the five predictors in the logistic regression model, we also retained the top five variables from SVM. However, the AUC of these variables in SVM was 0.906, which was inferior to the logistic regression model. Therefore, we chose the logistic regression model for further development and internal validation as shown in Table 2.

3.4. Odd Ratio for Final Variables by Logistic Regression

The odds ratios obtained from the logistic regression model are presented in Table 3. With a 1 kg/m² increase in BMI, the odds of pancreatic cancer decreased by 12% (aOR: 0.88, 95% CI: 0.81, 0.97). Similarly, with a 1 unit increase in HbA1c, the odds of observing pancreatic cancer increased by 28% (aOR: 1.28, 95% CI: 1.08, 1.52). So on, Alkaline phosphatase if increased by 1 unit, the odds for risk being pancreatic cancer accelerated by 2% (aOR: 1.02, 95% CI: 1.01.1.03). Subsequently, Common tumor marker CA199 if increased by 1 unit, then the odds of noting pancreatic cancer increased by 1% (aOR: 1.01, 95% CI: 1.01. 1.01). As such, the most common tumor marker being CEA if increased by 1 unit, the odds of remarking pancreatic cancer increased by 41% (aOR: 1.41,95% CI: 1.2, 1.66) which plays a significant role for increase risk of pancreatic cancer.

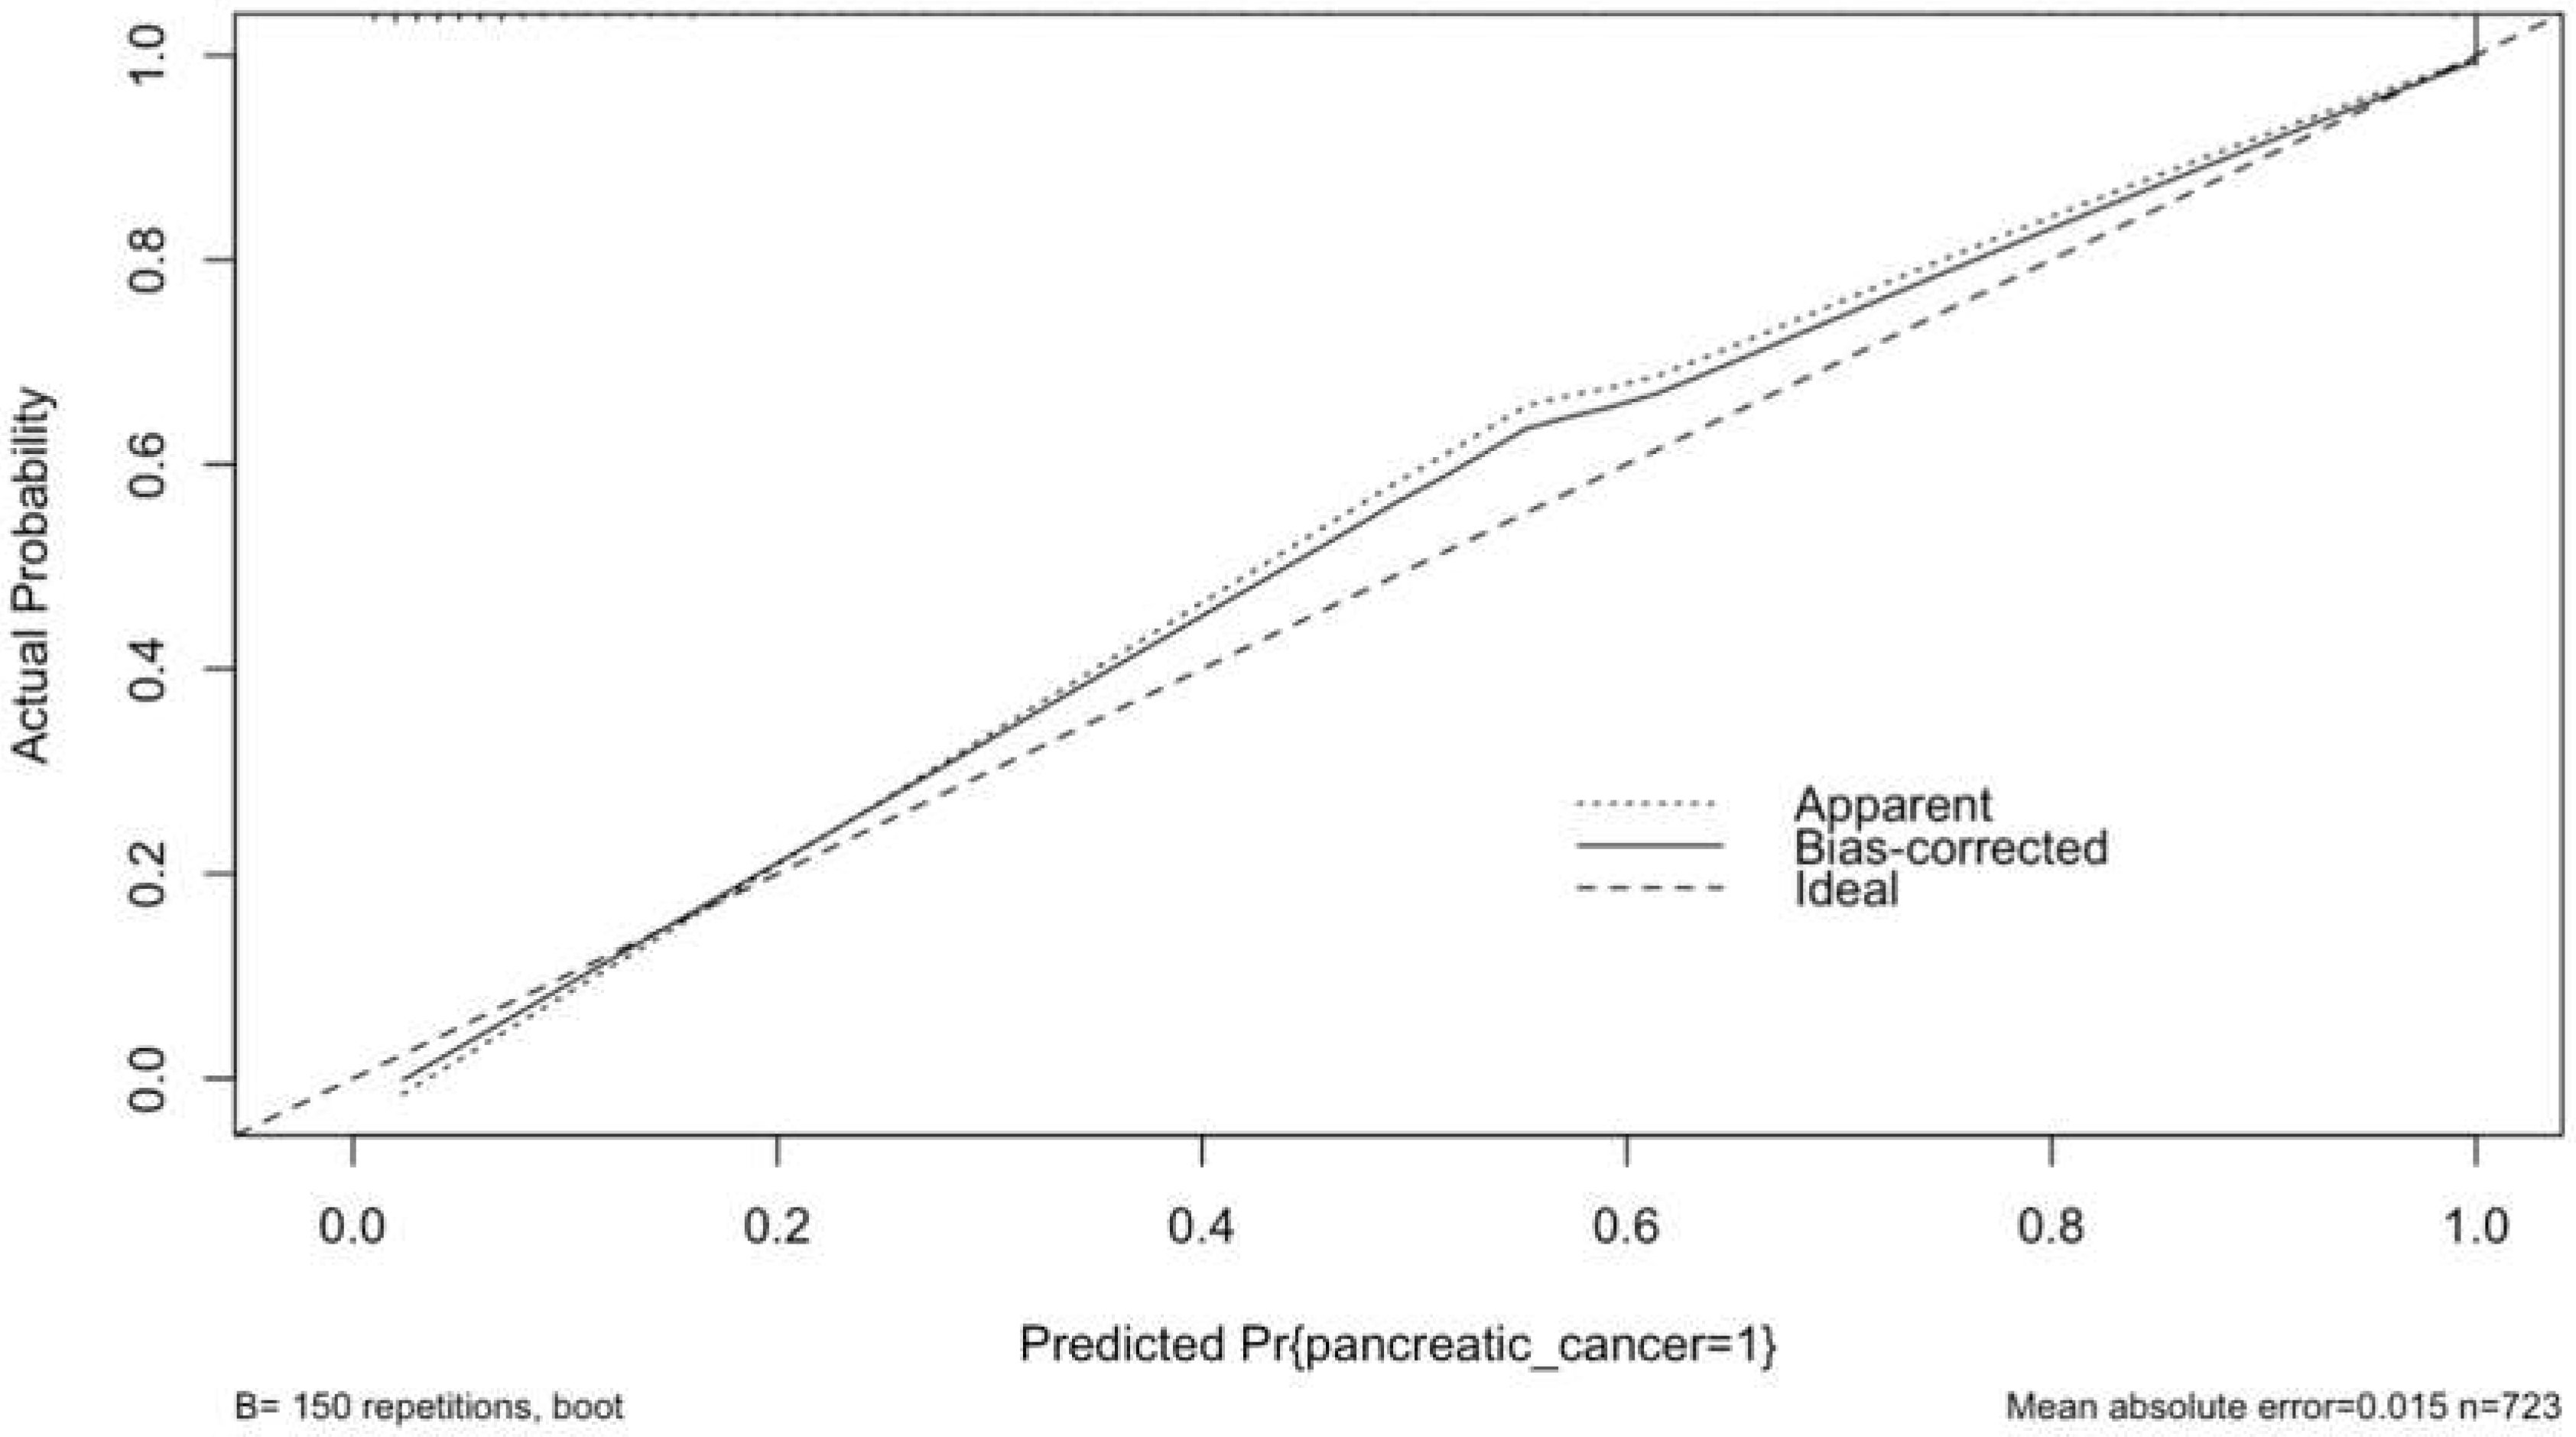
3.5. Calibration Plot with Internal Validation from Logistic Regression

The performance of the model was assessed using the measure of calibration and discrimination. The result of calibration and description are presented in section 3.5 and 3.6 respectively. The smoothed calibration plot presented in Figure 3 indicates slight mis-calibration in the 0.5 probability region, yet the bias-corrected probability has adjusted the curve towards the ideal line. Overall, the curve demonstrates acceptable calibration, with a mean absolute error of 0.015.

3.6. Final Model Performance

Figure 4 displays the ROC curve for the final logistic regression model. The model exhibits strong performance with an AUC of 0.969. Additionally, the accuracy is high at 0.9156 (95% CI: 0.8929, 0.9349), indicating the proportion of correctly classified cases. Sensitivity and specificity are also notable, with values of 0.9595 and 0.8697 respectively, highlighting the model's ability to correctly identify positive and negative cases. Moreover, the positive predictive value (PPV) and negative predictive value (NPV) are 0.8853 and 0.9534 respectively, further indicating the model's effectiveness in predicting outcomes. The balanced accuracy, reflecting the average of sensitivity and specificity, is also strong at 0.9146. Additionally, the R-squared value of 0.798 suggests that the model explains a substantial portion of the variance in the data. The Brier score of 0.062 indicates good calibration of the model's predicted probabilities with observed outcomes.

3.7. Points Predictor in Nomogram for Pancreatic Cancer

The result of the prediction model has been presented as a nomogram (figure 5) for ease of interpretation and ease of use in clinical setting. Table 4 presents the points assigned to predictors in the nomogram for predicting pancreatic cancer. Each predictor, including BMI, HbA1c, ALP, CA19-9, and CEA, is associated with a specific point value based on its respective range. For instance, BMI ranges from 12 to 36, with corresponding points assigned accordingly, at 1 from 12 to 22 and 0 from 24 to 36 , Hb1Ac ranges from 4 to 17, with corresponding points allocated accordingly; at 0 from 4 to 10 and 1 from 11 to 17, ALP ranges from 0 to 2000, with corresponding points appointed accordingly; at 0 for and 1 for 200, 2 for 400, 4 for 600, 5 for 800,6 for 1000,7 for1200,9 for 1400, 10 for 1600, 11 for 1800,12 for 2000, CA19-9 ranges from 0 to 5500, with corresponding points assigned accordingly; at 0 for 0, 1 for 500, 2 for 1000, 4 for 1500, 5 for 2000,6 for 2500, 7 for 3000, 8 for 3500 ,9 for 4000, 11 for 4500, 12 for 5000 and 13 for 5500 and finally CEA ranges from 0 to 1000, with corresponding points assigned accordingly; at 0 for 0, 10 for 100,20 for 200, 30 for 300, 40 for 400,50 for 500, 60 for 600, 70 for 700,80 for 800, 90 for 900 and 100 for 1000 respectively.
Points for each five predictors ranges from 0 to 100 where each corresponding predictors; BMI and Hb1AC within 0 to 10, ALP and Ca19-9 within 0 to 20 and CEA from 0 to 100 if added together to give their respective total points which total from 0 to 150 for their corresponding risk of pancreatic cancer to be associated with risk scoring from -50 to 450 are to be predicted on their basis as shown in Figure 5.

4. Discussion

The mortality rate of PC is high, and the early diagnosis of the disease is difficult. At now, China lacks a thorough PC screening program [36,37]. Previous research has examined a limited number of risk variables for pancreatic cancer, in addition to clinical signs. Our examination inspected PC risk factors and clinical indicators to foster a total clinical PC risk group scoring. This scale was useful for early identification of PC patients in clinical settings, based on general influencing factors. We found that Hemoglobin A1c (odds ratio: 1.28, 95% confidence interval: 1.08, 1.52), Alkaline phosphatase (odds ratio: 1.02, 95% confidence interval: 1.01,1.03), CA19-9 (odds ratio: 1.01, 95% confidence interval: 1.01,1.01), and Carcinoembryonic antigen (odds ratio: 1.41, 95% confidence interval: 1.2,1.66) were associated with an increased risk of PC, whereas Body Mass Index (odds ratio: 0.88, 95% confidence interval: 0.81,0.97) was associated with a reduction in the risk of PC. Taking into consideration these findings, the clinical PC risk scoring scale was found to be well-fitted in the population that was being modeled. Furthermore, the scale shown strong predictive value when it was used for screening the clinical PC risks scoring population. The discovery that body mass index (BMI) is adversely related with the risk of pancreatic cancer is in line with the findings of a meta-analysis conducted by Li et al. (2018)[38], which came to the conclusion that overweight and obesity are inversely associated with the incidence of pancreatic cancer. However, there is still no agreement about the relationship between BMI and PC. It is quite probable that this is related to the complicated hormonal and metabolic processes that influence the development of cancer. Greater BMI levels were found to be associated with a higher risk of PC in a research of Jacobs et al. [39]. Moreover, high BMI and a trajectory toward adult obesity were found to be positively correlated with PC in a 15-year subsequent study by Arjani et al. [40], with the association being higher in obesity with early onset and the male population. Controlling obesity throughout the adult life period may help prevent PC. The case group in our study had a lower BMI than the control group. Simultaneously, the results of the multifaceted analysis showed that BMI levels below the normal range were associated with an increased risk of PC. Taking into account that this was a case-control study, and the majority of patients had advanced PC at the moment of clinical analysis. Patients with advanced PC commonly experienced substantial weight loss due to cachexia.
Recent years have seen a significant increase in the amount of attention paid to the connection between haemoglobin A1C and PC. According to the findings of an analysis of the research, the risk of PC was shown to be inversely related to the amount of hemoglobin A1C, with persons who had just been diagnosed with increased haemoglobin A1C having the greatest risk of cardiovascular disease. Older patients with increased glycated hemoglobin (new onset diabetes) have about an 8-fold higher risk of developing pancreatic cancer than the general population [41]. A multiethnic cohort study also demonstrated that recent-onset diabetes is a manifestation of pancreatic cancer and if long-standing diabetes then it plays a role of risk of developing pancreatic cancer [42].
In this study, we found that hemoglobin A1C was associated with an increased risk of pancreatic cancer. However, the connection between the hemoglobin A1C variable and PC was not that much significant. This suggests that glycated hemoglobin A1C may be an early clinical manifestation of pancreatic cancer.
Similarly, ALP is produced in every tissue or organ, although it is mostly concentrated in the kidney, liver, bile duct, and bones. Patients with PC will always have different ALP readings from successive tests. ALP level may therefore be a sensitive indication of tumor growth, as evidenced by a previously published study that indicated a higher ALP was significantly linked with involvement of lymph nodes in patients with resected esophageal cancer [25]. An elevated ALP has been linked to lymph node involvement in PC patients, particularly in those who had their PCs removed. ALP was found to be elevated and linked to a greater possibility of pancreatic cancer in our study. ALP may be a risk factor in clinical detection for an early stage since PC is diagnosed lately with metastases.
According to the discoveries of our examination, CA19-9 was found to be positively correlated with the risk of PC, which showed that the utilization of CA19-9 as a diagnostic sign for PC is vital for some degree. Right now, the main serologic diagnostic marker that is perceived for PC is the CA19-9. In any case, inflammation, false positive in non-PC conditions, and misleading negatives in Lewis' antigen-negative patients are factors that could impair the diagnostic specificity of CA19-9 [43,44,45]. It is conceivable that the early identification of pancreatic cancer may be aided by the revelation of novel serological markers, which, when paired with CA19-9 and other tumor indicators, could be utilized to conduct the test. (Scara, S.; Bottoni, et al., 2015; Yang, M. et al., 2021) [46].
The most widely utilized tumor marker was carcinoembryonic antigen (CEA), which was first identified as a tumor serum biomarker by Gold and Freedman in 1965 [47]. Malignant tissue, particularly gastrointestinal carcinomas, benign diseases, and normal, healthy people can all have CEA. Despite having limited sensitivity and specificity, CEA showed a considerable increase in distant metastasis of colorectal cancer when compared to non-distant metastases [48]. Additionally, 30–60% of PDAC patients had higher serum CEA levels [49,50]. A prior study found that patients with low CA19-9 had less frequent CEA expression than those with high CA19-9 tumors (P<0.0001) [51]. Given that PC is diagnosed late, at the metastatic stage, screening for PC may be more important. Lately, the primary emphasis of the study was to examine the relationship between PC and CEA. Out of the five risk factors that were discovered, CEA was determined to be the one that was most strongly linked with PC.
The identification of relevant predictors of pancreatic cancer risk was accomplished by the use of logistic regression with backward elimination in the experiment. According to Chari et al. (2015) and Goonetilleke and Siriwardena (2007)[52,53], the predictors that have been discovered, which include body mass index (BMI), haemoglobin A1c, alkaline phosphatase, CA19-9, and carcinoembryonic antigen, are in agreement with the recognised risk factors and biomarkers that are related with pancreatic cancer. This discovery is in line with the findings of a number of previously published articles that have emphasised the diagnostic and prognostic usefulness of these biomarkers in pancreatic cancer (Goonetilleke & Siriwardena, 2007; Kim et al., 2018)[54]. In particular, CA19-9 has been subjected to a great deal of research and has been confirmed as a biomarker for pancreatic cancer. According to Chari et al. (2015), increased levels of CA19-9 are related with the existence of the illness as well as its development. This similarity with previously published research lends credence to the conclusions of our study, which increases their validity. The methods of logistic regression with backward elimination and Support Vector Machine (SVM) were used in our research in order to uncover important predictors of pancreatic cancer. Important characteristics that contribute to the prediction of pancreatic cancer (PC) include key predictors such CA19-9, haemoglobin A1c, alkaline phosphatase, and carcinoembryonic antigen. In line with previous studies that have highlighted the relevance of these biomarkers in the diagnosis and prognosis of pancreatic cancer (Ducreux et al., 2019; Tempero et al., 2019)[55,56], our conclusion is consistent with those findings.
It is possible to prevent developing PC by avoiding growing overweight throughout the adult year. This is one way to avoid developing PC. Those who had a body mass index (BMI) of lower than normal range were found to have a risk of PC that was 1.99 times greater than those who had a BMI level of 21.5 to 24.4 kg/m2 (ratio: 1.99, 95% confidence interval: 1.03 to 3.84)[57]. This was the finding that was made among former smokers who had a BMI. For the purposes of our study, the group that served as the case had a body mass index (BMI) that was lower than the group that served as the control. Furthermore, the results of the research showed that a lower body mass index (BMI) was associated with a decreased risk of acquiring cancer. This was proven by the findings of the study. Clinical characteristics such as body mass index (BMI) and haemoglobin A1c were included in the prediction model in addition to biomarkers from the previous section. This all-encompassing approach is in line with the current trend in pancreatic cancer research, which places an emphasis on the significance of including many risk variables in order to conduct an accurate risk assessment (Canto et al., 2018)[58]. By including these clinical factors into the model, the predictive potential of the model is improved, and doctors are provided with a more comprehensive understanding of the pancreatic cancer risk associated with a person.
It has been proven that the model has great performance, as shown by high accuracy, sensitivity, and specificity, in addition to a calibration plot that has been effectively calibrated. These findings are in line with those that were discovered in earlier research that evaluated prediction models for pancreatic cancer (Huang et al., 2018)[59]. We found that the robust performance of the model showed that it might have potential value in clinical practice for risk prediction and early diagnosis of pancreatic cancer. This is a job that continues to be difficult to accomplish owing to the fact that pancreatic cancer often presents itself in a late stage.
A further confirmation of the significance of body mass index (BMI), haemoglobin A1c, alkaline phosphatase, CA19-9, and carcinoembryonic antigen as significant predictors of pancreatic cancer risk is provided by the odds ratios and the logistic regression analysis. Based on the results of previous investigation, the percentage of individuals in the case group who tested positive for CA19-9 was exactly 84.0 percent. The fact that this rate was shown to have a positive link with the risk of PC demonstrated that the use of CA19-9 as a diagnostic indication for PC is significant to a certain degree that can be considered significant. As of right now, the CA19-9 is the only serologic diagnostic marker that is recognised for the presence of colon cancer. There are a number of variables that have the potential to reduce the diagnostic specificity of CA19-9. Previous research conducted by Mokdad et al. (2019) and Pannala et al. (2019)[60,61] has shown a correlation between the development of PC and obesity (BMI), diabetes (Haemoglobin A1c), and biomarker levels. These results are in line with those findings. By using a support vector machine (SVM) model in addition to logistic regression, we were able to determine that CA19-9, Carcinoembryonic antigen, and Alkaline phosphatase were the most significant predictors. According to Kim et al. (2018) and Koopmann et al. (2004)[62,63], these findings are in agreement with the results of the logistic regression, and they provide more evidence that these biomarkers are significant in the process of predicting pancreatic cancer. The logistic regression model demonstrated excellent performance measures, such as high accuracy, sensitivity, and specificity, as well as a high area under the ROC curve (AUC). The findings of this study are equivalent to or even beyond those that were published in other research that evaluated prediction models for pancreatic cancer (Canto et al., 2018; Huang et al., 2018) [58,59]. The calibration plot and the calibration slope both suggest that the model has been appropriately calibrated, which further enhances the model’s reliability.
When it comes to predicting PC, the logistic regression model exhibits great performance, with high levels of accuracy, sensitivity, and specificity. With an area under the curve (AUC) of 0.969, the discrimination ability is quite good. The model has a high sensitivity, but there is need for improvement in terms of its specificity in order to cut down on the number of false positives. In investigations that are equivalent to this one, Rahib et al. (2021) and Siegel et al. (2021)[64,65] found that these performance measures are comparable to or even better than those reported in those studies. The high accuracy of your logistic regression model, which is 91.56%, and the area under the curve (0.969) are similar to those that have been reported in previous research. For example, Zhang et al. (2020) [66] conducted research that used machine learning to reach an area under the curve (AUC) of 0.97 for PC prediction. This finding exemplifies the potential of these approaches in this particular field.
With the nomogram that was produced as a result of our results, doctors now have a user-friendly tool at their disposal to evaluate the individual risk of PC based on the predictors that were found. According to Balachandran et al. (2015)[67], nomograms have become more popular in the field of cancer due to its capacity to include a wide range of risk variables and to provide personalized risk assessments. Therefore, this makes a contribution to this area by providing a nomogram that is user-friendly and particularly designed for the evaluation of pancreatic cancer risk, which in turn makes it easier for clinical decision-makers to make educated choices. According to García-Albéniz et al. (2017) and Vickers et al. (2016)[68,69], this coincides with the trend in personalized medicine, which involves the use of risk prediction models to assist in clinical decision-making and patient care tasks. The nomogram that was created based on the logistic regression model offers doctors a user-friendly tool that allows them to assess the risk of pancreatic cancer in a person based on the biomarker levels and clinical features of that individual. The research adds to this by offering a well-calibrated and accurate tool for pancreatic cancer risk assessment. Nomograms have been increasingly employed in clinical practice for risk prediction and decision-making (Balachandran et al., 2015)[67]. This work contributes to this trend by giving a nomogram.
The results of the study are in line with the (Molina-Montes et al., 2020; Rahib et al., 2014)[70,64] the research on PC risk prediction models. These findings emphasize the significance of biomarkers, clinical factors, and machine learning approaches in the process of enhancing diagnostic accuracy and risk assessment. On the other hand, the research makes a contribution by providing a comprehensive analysis of the significance of features, odds ratios, model performance, and nomogram generation. This, in turn, improves the comprehension of PC risk prediction models and their usefulness in clinical settings. The purpose of this presentation is to provide insightful information on the development and evaluation of predictive models for the assessment of pancreatic cancer risk. Our work makes a contribution to the development of personalized medicine and to the improvement of patient care in the setting of pancreatic cancer. This is accomplished via the incorporation of thorough analyses and the development of a nomogram that user-friendly. Through the creation of prediction models and nomograms that are based on biomarkers and clinical characteristics, the makes a significant contribution to the evaluation of the risk of pancreatic cancer. The reliability of our study's findings, as well as their potential therapeutic value, is bolstered by the fact that they are consistent with research that has already been published and that models perform very well.
Our results are consistent with (Chari et al., 2015; Kim et al., 2018) [52,54] that have been published in the past about the significance of body mass index (BMI), haemoglobin A1c, CA19-9, and carcinoembryonic antigen as predictors of the risk of developing pancreatic cancer. The robustness of the technique that was provided in our work is shown by the fact that the performance metrics of the predictive model are comparable to or even better to those that were published in studies that were comparable to ours (Canto et al., 2018; Huang et al., 2018). [58,59]
For the purpose of finding a solution to these issues, researchers have investigated the ways in which machine learning models may assist in the detection of pancreatic cancer. Using a variety of machine learning techniques, such as support vector machines (SVMs), logistic regression (LR), and deep learning approaches, several studies have investigated the analysis of imaging data and biomarkers with the purpose of achieving a more accurate diagnosis. The outcomes of these studies are promising because they have the potential to assist in the identification of subtle patterns that may be indicative of pancreatic cancer and for the improvement of the accuracy of diagnosis.
All things considered, earlier research on the identification of pancreatic cancer has prepared the way for the creation of more effective and trustworthy diagnostic techniques. Through the use of cutting-edge imaging technology, unique biomarkers, and machine learning models, researchers are making significant progress in enhancing early detection rates, facilitating prompt intervention, and eventually enhancing patient outcomes in the treatment of pancreatic cancer.
In general, the results of the study are in agreement with the previous research that has been conducted on the subject of predicting the risk of pancreatic cancer and evaluating biomarkers. Our knowledge of pancreatic cancer risk assessment is advanced as a result of this work, which also offers a significant tool for clinical practice. The study extends our understanding by adding both proven biomarkers and clinical characteristics into the prediction model.

5. Conclusions

In this study, we illustrated a clinically PC risk score scale (nomogram) using some selected feature importance and backward elimination from common factors and routine hematological indicators that were simple way to identify and acquired by supervised machine learning. The findings of this work, taken as a whole, provide evidence that supervised machine learning models have the potential to enhance pancreatic cancer risk assessment by discovering new risk variables and building effective prediction tools. It was clinically helpful and had a lower screening cost. The scale, meanwhile, has a few shortcomings. For instance, certain characteristics could only be demonstrated to correlate with PC due to the case-control study that was performed; hence, future research was required to confirm the investigation of the causative association.

6. Patents

No any

Author Contributions

Amir Sherchan & Maoquan Li; Conceptualization, Data Curation, Formal analysis, original draft, writing and review and editing. Feng Jin ; Conceptualization, Supervision, reviewer for this case. Bhakti Sherchan ; Formal analysis, Data interpretation, literature review and editing. Sujit Kumar Mandal & Ranita Ghisisng ; Data analysis , software, literature review and editing. Binit Regmi &Sandesh raj Upadhaya; validation and literature review. Sandesh; visualization, literature review. Bishnu; Methodology and literature review. Dipendra Pathak ; Data curation, Investigation and literature review.

Funding

This work was supported by the National Natural Science Foundation of China ( Grant no. 8207070257) and Shanghai Tenth People’s Hospital.

Institutional Review Board Statement

This retrospective study was approved by the Research Ethics Committee of Shanghai Tenth People’s Hospital affiliated with Tongji University School of Medicine and conducted in accordance with declaration of Helsinki with approval number SHSY-IEC-5.0/24K175/P01.

Informed Consent Statement

Informed consent was obtained from all subjects involved in the study

Data Availability Statement

Data supporting reported results can be provided upon request

Acknowledgments

he authors thanks Tongji University and Shanghai Tenth People’s Hospital Affiliated to Tongji University for the data acquisition.

Conflicts of Interest

The authors declare no conflicts of interest.

Appendix A

Appendix B

References

  1. Stewart BW and Wild CP (eds): World Cancer Report 2014. IARC Press, Lyon, 2014.
  2. World Health Organization World Health Organization Statistical Information System. WHO Mortality Database. 2012.
  3. Malvezzi M, Bertuccio P, Levi F, La Vecchia C, Negri E. European cancer mortality predictions for the year 2013. Ann Oncol. 2013; 24(3):792–800. [CrossRef]
  4. Cai, J.; Chen, H.; Lu, M.; Zhang, Y.; Lu, B.; You, L.; Zhang, T.; Dai, M.; Zhao, Y. Advances in the epidemiology of pancreatic cancer: Trends, risk factors, screening, and prognosis. Cancer Lett. 2021, 520, 1–11. [Google Scholar] [CrossRef] [PubMed]
  5. Siegel, R. L. , Miller, K. D., Fuchs, H. E., & Jemal, A. (2022). Cancer statistics, 2022. CA: a cancer journal for clinicians, 72(1), 7–33. [CrossRef]
  6. Siegel, R. L. , Miller, K. D., Fuchs, H. E., & Jemal, A. (2021). Cancer Statistics, 2021. CA: a cancer journal for clinicians, 71(1), 7–33. [CrossRef]
  7. Rahib L, Smith BD, Aizenberg R, et al. Projecting cancer incidence and deaths to 2030: The unexpected burden of thyroid, liver, and pancreas cancers in the United States. Cancer Res. 2014; 74: 2913–21. [CrossRef]
  8. Bo, X. , Shi, J., Liu, R., Geng, S., Li, Q., Li, Y., Jin, H., Yang, S., Jiang, H., & Wang, Z. (2019). Using the Risk Factors of Pancreatic Cancer and Their Interactions in Cancer Screening: A Case-Control Study in Shanghai, China. Annals of global health, 85(1), 103. [CrossRef]
  9. P. Rawla, T. Sunkara, and V. Gaduputi, "Epidemiology of Pancreatic Cancer: Global Trends, Etiology and Risk Factors," World Journal of Oncology, vol. 10, pp. 10–27, 2019. [CrossRef]
  10. G. Bond-Smith et al., "Pancreatic adenocarcinoma," BMJ, vol. 344, p. e2476, 2012. [CrossRef]
  11. Woodmansey, C. , et al., Incidence, Demographics, and Clinical Characteristics of Diabetes of the Exocrine Pancreas (Type 3c): A Retrospective Cohort Study. Diabetes Care, 2017. 40(11): p. 1486–1493. [CrossRef] [PubMed]
  12. Olson, S.H. , et al., Weight Loss, Diabetes, Fatigue, and Depression Preceding Pancreatic Cancer. Pancreas, 2016. 45(7): p. 986–91. [CrossRef]
  13. Hippisley-Cox, J. and Coupland C., Identifying patients with suspected pancreatic cancer in primary care: derivation and validation of an algorithm. Br J Gen Pract, 2012. 62(594): p. e38–45. [CrossRef]
  14. S. Midha, S. S. Midha, S. Chawla, and P. K. Garg, "Modifiable and non-modifiable risk factors for pancreatic cancer: A review," Cancer Letters, vol. 381, pp. 269–277, 2016. [CrossRef]
  15. J. Lang et al., "Risk factors of pancreatic cancer and their possible uses in diagnostics," Neoplasma, vol. 68, pp. 227–239, 2021. [CrossRef]
  16. Koo DH, Han KD, Park CY. The Incremental Risk of Pancreatic Cancer According to Fasting Glucose Levels: Nationwide Population-Based Cohort Study. The Journal of clinical endocrinology and metabolism. 2019; 104(10):4594–9. [CrossRef] [PubMed]
  17. Rawla P, Sunkara T, Gaduputi V. Epidemiology of Pancreatic Cancer: Global Trends, Etiology and Risk Factors. World journal of oncology. 2019; 10(1):10–27. [CrossRef] [PubMed]
  18. Flechon A, Pouessel D, Ferlay C, Perol D, Beuzeboc P, Gravis G, et al. Phase II study of carboplatin andetoposide in patients with anaplastic progressive metastatic castrationresistant prostate cancer (mCRPC) with or without neuroendocrine differentiation: results of the French Genito-urinary tumor group (GETUG) P01 trial. Ann Oncol. 2011;22:2476–81. [CrossRef]
  19. Sonpavde G, Pond GR, Berry WR, de Wit R, Armstrong AJ, Eisenberger MA, et al. Serum alkaline phosphatase changes predict survival independent of PSA changes in men with castration-resistant prostate cancer and bone metastasis receiving chemotherapy. Urol Oncol. 2012;30:607–13. [CrossRef]
  20. Mikah P, Krabbe LM, Eminaga O, Herrmann E, Papavassilis P, Hinkelammert R, et al. Dynamic changes of alkaline phosphatase are strongly associated with PSA-decline and predict best clinical benefit earlier than PSA-changes under therapy with abiraterone acetate in bone metastatic castration resistant prostate cancer. BMC Cancer. 2016;16:214. [CrossRef]
  21. Hung HY, Chen JS, Yeh C-Y, Tang R, Hsieh PS, Tasi W-S, et al. Preoperative alkaline phosphatase elevation was associated with poor survival in colorectal cancer patients. Int J Color Dis. 2017;32:1775–8. [CrossRef]
  22. Chen B, Dai D, Tang H, Chen X, Ai X, Huang X, et al. Pre-treatment serum alkaline phosphatase and lactate dehydrogenase as prognostic factors in triple negative breast cancer. J Cancer. 2016;7:2309–16. [CrossRef]
  23. Xie Y, Wei ZB, Duan XW. Prognostic value of pretreatment serum alkaline phosphatase in nasopharyngeal carcinoma. Asian Pac J Cancer Prev. 2014;15:3547–53. [CrossRef]
  24. Wei XL, Zhang DS, He MM, Jin Y, Wang DS, Zhou YX, et al. The predictive value of alkaline phosphatase and lactate dehydrogenase for overall survival in patients with esophageal squamous cell carcinoma. Tumour Biol. 2016;37:1879–87. [CrossRef]
  25. Aminian A, Karimian F, Mirsharifi R, Alibakhshi A, Hasani SM, Dashti H, et al. Correlation of serum alkaline phosphatase with clinicopathological characteristics of patients with oesophageal cancer. East Mediterr Health J. 2011;17:862–6. [CrossRef]
  26. Gold P, Freedman SO. Specific carcinoembryonic antigens of the human digestive system. J Exp Med. 1965; 122(3):467–481. [CrossRef]
  27. Molina R, Barak V, van Dalen A, et al. Tumor markers in breast cancer-European Group on Tumor Markers recommendations. Tumour Biol. 2005;26(6):281–293. [CrossRef]
  28. Grunnet M, Sorensen JB. Carcinoembryonic antigen (CEA) as tumor marker in lung cancer. Lung Cancer. 2012; 76(2):138–143. [CrossRef]
  29. Juweid M, Sharkey RM, Behr T, et al. Improved detection of medullary thyroid cancer with radiolabeled antibodies to carcinoembryonic antigen. J Clin Oncol. 1996;14(4):1209–1217. [CrossRef]
  30. Nazli O, Bozdag AD, Tansug T, Kir R, Kaymak E. The diagnostic importance of CEA and CA 19-9 for the early diagnosis of pancreatic carcinoma. Hepatogastroenterology. 2000; 47(36):1750–1752.
  31. G. Luo et al., "Roles of CA19-9 in pancreatic cancer: Biomarker, predictor and promoter," Biochimica et BiophysicaActa Reviews on Cancer, vol. 1875, p. 188409, 2021. [CrossRef]
  32. G. Luo et al., "Optimize CA19-9 in detecting pancreatic cancer by Lewis and Secretor genotyping," Pancreatology, vol. 16, pp. 1057–1062, 2016. [CrossRef]
  33. Jordan MI, Mitchell TM. Machine learning: Trends, perspectives, and prospects. Science. 2015; 349:255–60. [CrossRef]
  34. Obermeyer Z, Emanuel EJ. Predicting the Future - Big Data, Machine Learning, and Clinical Medicine New Engl J Med. 2016; 375:1216–9. [CrossRef]
  35. Caruana R, Niculescu-Mizil A. An Empirical Comparison of Supervised Learning Algorithms. InICML '06. New York, NY, USA. 2006. p. 161-8. [CrossRef]
  36. Lang, J.; Kunovský, L.; Kala, Z.; Trna, J. Risk factors of pancreatic cancer and their possible uses in diagnostics. Neoplasma 2021, 68, 227–239. [Google Scholar] [CrossRef]
  37. Al-Hawary, M. Role of Imaging in Diagnosing and Staging Pancreatic Cancer. J. Natl. Compr. Cancer Netw. 2016, 14, 678–680. [Google Scholar] [CrossRef]
  38. Hu, J.X.; Zhao, C.F.; Chen, W.B.; Liu, Q.C.; Li, Q.W.; Lin, Y.Y.; Gao, F. Pancreatic cancer: A review of epidemiology, trend, and risk factors. World J. Gastroenterol. 2021, 27, 4298–4321. [Google Scholar] [CrossRef] [PubMed]
  39. Jacobs, E.J.; Newton, C.C.; Patel, A.V.; Stevens, V.L.; Islami, F.; Flanders, W.D.; Gapstur, S.M. The Association Between Body Mass Index and Pancreatic Cancer: Variation by Age at Body Mass Index Assessment. Am. J. Epidemiology 2019, 189, 108–115. [Google Scholar] [CrossRef] [PubMed]
  40. Arjani, S.; Saint-Maurice, P.F.; Julian-Serrano, S.; Eibl, G.; Stolzenberg-Solomon, R. Body Mass Index Trajectories Across the Adult Life Course and Pancreatic Cancer Risk. JNCI Cancer Spectr. 2022, 6, pkac066. [Google Scholar] [CrossRef] [PubMed]
  41. Hu JX, Zhao CF, Chen WB, Liu QC, Li QW, Lin YY, Gao F. Pancreatic cancer: A review of epidemiology, trend, and risk factors. World J Gastroenterol 2021; 27(27): 4298-4321. [CrossRef]
  42. Setiawan VW, Stram DO, Porcel J, Chari ST, Maskarinec G, Le Marchand L, Wilkens LR, Haiman CA, Pandol SJ, Monroe KR. Pancreatic Cancer Following Incident Diabetes in African Americans and Latinos: The Multiethnic Cohort. J Natl Cancer Inst. 2019; 111:27-33. [CrossRef]
  43. Luo, G.; Jin, K.; Deng, S.; Cheng, H.; Fan, Z.; Gong, Y.; Qian, Y.; Huang, Q.; Ni, Q.; Liu, C.; et al. Roles of CA19-9 in pancreatic cancer: Biomarker, predictor and promoter. Biochim. Biophys. Acta Rev. Cancer 2021, 1875, 188409. [Google Scholar] [CrossRef]
  44. Scara, S.; Bottoni, P.; Scatena, R. CA 19-9: Biochemical and Clinical Aspects. Adv. Exp. Med. Biol. 2015, 867, 247–260. [Google Scholar] [CrossRef] [PubMed]
  45. Yang, M.; Zhang, C.Y. Diagnostic biomarkers for pancreatic cancer: An update. World J. Gastroenterol. 2021, 27, 7862–7865. [Google Scholar] [CrossRef] [PubMed]
  46. Scarà, S., Bottoni, P., & Scatena, R. (2015). CA 19-9: Biochemical and Clinical Aspects. Advances in experimental medicine and biology, 867, 247–260. [CrossRef]
  47. Gold P, Freedman SO. Specific carcinoembryonic antigens of the human digestive system. J Exp Med. 1965; 122:467–481. [CrossRef]
  48. Luo H, Shen K, Li B, Li R, Wang Z, Xie Z. Clinical significance and diagnostic value of serum NSE, CEA, CA19-9, CA125 and CA242 levels in colorectal cancer. Oncol Lett. 2020 Jul; 20(1):742-750. [CrossRef] [PubMed] [PubMed Central]
  49. Nazli O, Bozdag AD, Tansug T, Kir R, Kaymak E. The diagnostic importance of CEA and CA 19-9 for the early diagnosis of pancreatic carcinoma. Hepatogastroenterology. 2000; 47:1750–1752.
  50. Satake K, Chung YS, Yokomatsu H, Nakata B, Tanaka H, Sawada T, Nishiwaki H, Umeyama K. A clinical evaluation of various tumor markers for the diagnosis of pancreatic cancer. Int J Pancreatol. 1990; 7:25–36. [CrossRef]
  51. Ermiah E, Eddfair M, Abdulrahman O, Elfagieh M, Jebriel A, Al-Sharif M, Assidi M, Buhmeida A. Prognostic value of serum CEA and CA19-9 levels in pancreatic ductal adenocarcinoma. Mol Clin Oncol. 2022 Jun 16; 17(2):126. [CrossRef] [PubMed] [PubMed Central]
  52. Chari, S. T., Kelly, K., Hollingsworth, M. A., Thayer, S. P., Ahlquist, D. A., Andersen, D. K., ... & Pandol, S. J. (2015). Early detection of sporadic pancreatic cancer: summative review. Pancreas, 44(5), 693-712. [CrossRef]
  53. Goonetilleke, K. S., & Siriwardena, A. K. (2007). Systematic review of carbohydrate antigen (CA 19-9) as a biochemical marker in the diagnosis of pancreatic cancer. European Journal of Surgical Oncology (EJSO), 33(3), 266-270. [CrossRef]
  54. Kim, J. E., Lee, K. T., Lee, J. K., Paik, S. W., & Rhee, J. C. (2018). Clinical usefulness of carbohydrate antigen 19-9 as a screening test for pancreatic cancer in an asymptomatic population. Journal of Gastroenterology and Hepatology, 33(1), 347-353. [CrossRef]
  55. Ducreux, M., Sa Cunha, A., Cuhna, A.S., et al. (2019). Cancer of the pancreas: ESMO Clinical Practice Guidelines for diagnosis, treatment and follow-up. Annals of Oncology, 30(8), 1127-1133. [CrossRef]
  56. Tempero, M.A., Malafa, M.P., Al-Hawary, M., et al. (2019). Pancreatic Adenocarcinoma, Version 1.2019, NCCN Clinical Practice Guidelines in Oncology. Journal of the National Comprehensive Cancer Network, 17(3), 202-210. [CrossRef]
  57. Untawale, S.; Odegaard, A.O.; Koh, W.P.; Jin, A.Z.; Yuan, J.M.; Anderson, K.E. Body mass index and risk of pancreatic cancer in a Chinese population. PLoS One 2014, 9, e85149. [Google Scholar] [CrossRef] [PubMed]
  58. Canto, M. I. , Harinck, F., Hruban, R. H., Offerhaus, G. J. A., Poley, J. W., Kamel, I.,... & Kluijt, I. (2018). International Cancer of the Pancreas Screening (CAPS) Consortium summit on the management of patients with increased risk for familial pancreatic cancer. Gut, 67(2), 390-398. [CrossRef]
  59. Huang, L., Holtz, A., Gould, M., & Barlow, W. E. (2018). Validating prediction models for pancreatic cancer risk: A systematic review of the literature. Cancer Epidemiology and Prevention Biomarkers, 27(11), 1243-1253.
  60. Mokdad, A.A., Murphy, C.C., Scarborough, P., et al. (2019). Trends in pancreatic cancer incidence in the United States, 2000-2015. JAMA, 322(14), 1478-1480. [CrossRef]
  61. Pannala, R., Leirness, J.B., Bamlet, W.R., & Basu, A. (2019). Risk factors for pancreatic cancer: A summary review of meta-analytical studies. International Journal of Cancer, 360(2), 206-215. [CrossRef]
  62. Kim, J. E., Lee, K. T., Lee, J. K., Paik, S. W., & Rhee, J. C. (2018). Clinical usefulness of carbohydrate antigen 19-9 as a screening test for pancreatic cancer in an asymptomatic population. Journal of Gastroenterology and Hepatology, 33(1), 347-353. [CrossRef]
  63. Koopmann, J., Zhang, Z., White, N., Rosenzweig, J., Fedarko, N., Jagannath, S.,... & Canto, M. I. (2004). Serum diagnosis of pancreatic adenocarcinoma using surface-enhanced laser desorption and ionization mass spectrometry. Clinical Cancer Research, 10(3), 860-868. [CrossRef]
  64. Rahib, L., Wehner, M.R., Matrisian, L.M., Nead, K.T. (2021). Estimated Projection of US Cancer Incidence and Death to 2040. JAMA Network Open, 4(4), e214708. [CrossRef]
  65. Siegel, R.L., Miller, K.D., Jemal, A. (2021). Cancer statistics, 2021. CA: A Cancer Journal for Clinicians, 71(1), 7-33. [CrossRef]
  66. Zhang, W., Li, J., Liu, S., Sun, C., & Luo, G. (2020). Machine learning-based identification of potential biomarkers for the early diagnosis of pancreatic cancer. Frontiers in oncology, 10, 1302. https://www.ncbi.nlm.nih.gov/pmc/articles/PMC10437932/.
  67. Balachandran, V. P., et al. (2015). Nomograms in oncology: More than meets the eye. The Lancet Oncology, 16(4), e173-e180. [CrossRef]
  68. García-Albéniz, X. , Hsu, J., Hernán, M.A., & Hernández-Díaz, S. (2017). The value of explicitly emulating a target trial when using real-world evidence: An application to colorectal cancer screening. European Journal of Epidemiology, 32(6), 495-500. [CrossRef]
  69. Vickers, A.J., Elkin, E.B., & Kattan, M.W. (2016). Method for evaluating prediction models that apply the results of randomized trials to individual patients. Trials, 17(1), 14. [CrossRef]
  70. Molina-Montes, E., Sánchez, M.J., Buckland, G., et al. (2020). Mediterranean diet and risk of pancreatic cancer in the European Prospective Investigation into Cancer and Nutrition cohort. British Journal of Cancer, 124(12), 238-246. [CrossRef]
Figure 1. Study flow chart.
Preprints 141492 g001
Figure 2. Cluster dendrogram for continuous variables.
Preprints 141492 g003
Figure 3. Calibration plot of the internal validation model from logistic regression.
Preprints 141492 g004
Figure 4. ROC curve for the final model from logistic regression.
Preprints 141492 g005
Figure 5. Nomogram of the model from logistic regression.
Preprints 141492 g006
Table 1. Baseline characteristics of the study participants.
Predictors Overall,
N = 7231
Control,
n= 3701
Case,
n = 3531
p-value2
Gender [n, (%)] <0.001
Male 375 (51.9) 165 (44.6) 210 (59.5)
Female 348 (48.1) 205 (55.4) 143 (40.5)
Age (years) 68.0 (62.0, 75.0) 68.0 (62.0, 74.0) 68.0 (63.0, 75.0) 0.6
BMI (kg/m2) 22.8 (20.7, 24.8) 23.5 (21.3, 25.8) 22.2 (20.0, 24.1) <0.001
Smoking [n, (%)] <0.001
Yes 162 (22.4) 64 (17.3) 98 (27.8)
No 561 (77.6) 306 (82.7) 255 (72.2)
Alcohol [n, (%)] 0.033
Yes 158 (21.9) 69 (18.6) 89 (25.2)
No 565 (78.1) 301 (81.4) 264 (74.8)
Diabetes Mellitus [n, (%)] <0.001
Yes 237 (32.8) 83 (22.4) 154 (43.6)
No 486 (67.2) 287 (77.6) 199 (56.4)
Hypertension [n, (%)] 0.8
Yes 326 (45.1) 165 (44.6) 161 (45.6)
No 397 (54.9) 205 (55.4) 192 (54.4)
Coronary heart disease[n, (%)] >0.9
Yes 87 (12.0) 45 (12.2) 42 (11.9)
No 636 (88.0) 325 (87.8) 311 (88.1)
White blood cell (10 9/L) 6.5 (5.3, 8.2) 6.6 (5.4, 8.1) 6.5 (5.2, 8.2) 0.4
Haemoglobin 127.0 (114.0, 138.5) 131.5 (119.0, 142.8) 122.0 (109.0, 134.0) <0.001
Lymphocyte 1.4 (1.0, 1.8) 1.5 (1.1, 2.0) 1.3 (0.9, 1.7) <0.001
Platelet 210.0 (169.5, 260.0) 215.0 (174.0, 258.0) 207.0 (162.0, 262.0) 0.3
Neutrophil to lymphocyte ratio 3.1 (2.0, 4.9) 2.8 (1.9, 4.2) 3.4 (2.2, 5.6) <0.001
C-reactive protein 6.1 (3.3, 18.9) 4.4 (3.3, 14.1) 8.3 (3.3, 22.8) 0.009
Haemoglobin A1c 6.1 (5.6, 6.9) 5.9 (5.5, 6.5) 6.3 (5.8, 8.3) <0.001
Direct bilirubin (mmol/L) 5.1 (3.6, 8.0) 4.7 (3.6, 6.0) 5.7 (3.7, 63.2) <0.001
Total bilirubin (mmol/L) 14.6 (10.7, 23.4) 14.1 (10.5, 18.8) 15.5 (10.7, 85.6) <0.001
Neutrophil 4.3 (3.3, 5.9) 4.3 (3.3, 5.9) 4.3 (3.3, 5.8) 0.7
Total cholesterol (mmol/L) 4.3 (3.7, 5.0) 4.4 (3.9, 5.0) 4.1 (3.5, 4.8) <0.001
Alkaline phosphatase ( 82.0 (67.5, 132.4) 72.2 (60.9, 82.3) 127.3 (81.8, 297.4) <0.001
Triglyceride (mmol/L) 1.2 (0.9, 1.7) 1.1 (0.9, 1.6) 1.3 (0.9, 1.7) 0.048
HDL-C (mmol/L) 1.1 (0.9, 1.3) 1.1 (1.0, 1.3) 1.1 (0.8, 1.4) 0.2
LDL-C (mmol/L) 2.6 (2.0, 3.1) 2.7 (2.2, 3.2) 2.3 (1.8, 3.0) <0.001
CA19-9 (U/ml) 19.0 (6.8, 435.7) 7.7 (4.8, 12.8) 436.3 (84.0, 1,000.0) <0.001
CEA (U/ml) 2.5 (1.3, 5.2) 1.5 (0.8, 2.3) 5.2 (2.9, 11.8) <0.001
1 n (%); Median (IQR). 2 Pearson's Chi-squared test; Wilcoxon rank sum test.
Table 2. Comparison of feature importance using different machine learning models.
Logistic regression with backward elimination Support vector machine
Predictors P-value AIC Predictors Feature weight Importance Rank
Variables deleted from the model Variables kept
Alcohol 0.918 -1.99 CA19-9 3.56 1
Diabetes Mellitus 0.975 -3.95 Carcinoembryonic antigen 3.12 2
Coronary artery disease 0.989 -5.88 Alkaline phosphatase 2.23 3
White blood cell 0.994 -7.78 Neutrophil to lymphocyte ratio 0.59 4
Platelet 0.994 -9.56 Haemoglobin A1c 0.37 5
Direct bilirubin 0.989 -11.09 Variables discarded
C-reactive protein 0.986 -12.61 Direct bilirubin 0.33 6
Hypertension 0.978 -13.92 Smoking 0.33 7
Lymphocyte 0.957 -14.83 Age 0.2 8
Triglyceride 0.914 -15.37 Haemoglobin 0.17 9
High density lipoprotein 0.860 -15.81 Low density lipoprotein 0.16 10
Gender 0.767 -15.77 BMI 0.14 11
Neutrophil to lymphocyte ratio 0.664 -15.63 High density lipoprotein 0.14 12
Hemoglobin 0.528 -15.02 Alcohol 0.1 13
Low density lipoprotein 0.324 -13.09 Hypertension 0.1 14
Age 0.109 -8.84 Coronary artery disease 0.1 15
Smoking 0.0238 -3.63 Platelet 0.09 16
Variables kept Gender 0.09 17
BMI White blood cell 0.08 18
Haemoglobin A1c Lymphocyte 0.08 19
Alkaline phosphatase C-reactive protein 0.08 20
CA19-9 Diabetes Mellitus 0.04 21
Carcinoembryonic antigen Triglyceride 0.01 22
AUC for SVM: 0.906. AUC for LR: 0.969.
Table 3. Odds ratio for final variables retained from backward elimination using logiistic regression.
Variable aOR (95% CI) P-value
BMI 0.88 (0.81,0.97) <0.001
Haemoglobin A1c 1.28 (1.08,1.52) <0.001
Alkaline phosphatase 1.02 (1.01,1.03) <0.001
CA19-9 1.01 (1.01,1.01) <0.001
Carcinoembryonic antigen 1.41 (1.2,1.66) <0.001
aOR: Adjusted odds ratio.
Table 4. Points for predictors in the nomogram.
BMI Points Hb1Ac Points ALP Points CA19-9 Points CEA Points
12 1 4 0 0 0 0 0 0 0
14 1 5 0 200 1 500 1 100 10
16 1 6 0 400 2 1000 2 200 20
18 1 7 0 600 4 1500 4 300 30
20 1 8 0 800 5 2000 5 400 40
22 1 9 0 1000 6 2500 6 500 50
24 0 10 0 1200 7 3000 7 600 60
26 0 11 1 1400 9 3500 8 700 70
28 0 12 1 1600 10 4000 9 800 80
30 0 13 1 1800 11 4500 11 900 90
32 0 14 1 2000 12 5000 12 1000 100
34 0 15 1 5500 13
36 0 16 1
17 1
Points per unit of linear predictor: 0.264601
Linear predictor units per point: 3.779275
Disclaimer/Publisher’s Note: The statements, opinions and data contained in all publications are solely those of the individual author(s) and contributor(s) and not of MDPI and/or the editor(s). MDPI and/or the editor(s) disclaim responsibility for any injury to people or property resulting from any ideas, methods, instructions or products referred to in the content.
Copyright: This open access article is published under a Creative Commons CC BY 4.0 license, which permit the free download, distribution, and reuse, provided that the author and preprint are cited in any reuse.
Prerpints.org logo

Preprints.org is a free preprint server supported by MDPI in Basel, Switzerland.

Subscribe

Disclaimer

Terms of Use

Privacy Policy

Privacy Settings

© 2025 MDPI (Basel, Switzerland) unless otherwise stated