
Submitted:
28 March 2024
Posted:
29 March 2024
You are already at the latest version
Abstract
This study aimed to introduce a novel machine learning (ML) model designed to predict the need of interventions during endoscopy in patients with upper gastrointestinal bleeding (UGIB). The risk stratification tools in current use, such as the Glasgow Blatchford Score (GBS) and pre-endoscopic Rockall score, have limitations in accurately predicting the need for endoscopic interventions. All patients diagnosed with UGIB from January 2013 to October 2023 who underwent endoscopy were included in the study. Variables extracted included demographics, social history ,clinical history, clinical presentation and symptoms, drug history, management prior to endoscopy, findings during endoscopy, laboratory variables and vitals, and post-endoscopic results. Three machine learning models including Random Forest Classifier (RFC), Gradient Boosting Classifier (GBC), and AdaBoost Classifier were used to evaluate the need for intervention during endoscopy in our study. A total of 1372 patients were included from three major hospitals in Jordan, of whom 242 underwent endoscopic intervention. The GBC outperformed all other models and pre-endoscopic scores in predicting the need for endoscopic intervention with an area under the curve of 0.861. Findings during endoscopy, platelet count, pulse rate and systolic blood pressure during admission were the most contributing features in predicting the need for the need of endoscopic intervention. This study highlights the potential of machine learning models in enhancing decision making for UGIB management.
Keywords:
upper gastrointestinal bleeding
; machine learning
; endoscopic intervention
; gradient boosting classifier
; Glasgow Blatchford Score
; Rockall Score
1. Introduction
Upper gastrointestinal bleeding (UGIB) is defined as bleeding in the gastrointestinal tract proximal to the ligament of Treitz. It is a commonly encountered and potentially life-threatening condition that often requires frequent hospitalizations. The incidence varies worldwide, ranging from 48 to 172 cases per 100,000 individuals [1], with a corresponding mortality rate of 2-10% [2,3]. Non-variceal bleeding is considered the most common cause of UGIB with peptic ulcers accounting for approximately half of the cases [3,4,5].
The international Consensus Group and the European Society of Gastrointestinal Endoscopy recommend that patients with UGIB should undergo endoscopy within 12-24 hours of presentation [6,7,8]. However, patients with non-variceal UGIB who are at low risk of re-bleeding and mortality can be managed as outpatients with non-urgent endoscopy. These patients are identified using pre-endoscopy risk scores. Several scoring systems have been developed to evaluate risk stratification of UGIB. The most commonly used are Glasgow Blatchford score (GBS) and pre-endoscopic Rockall score. In 2000, Blatchford et al. [9] proposed GBS by evaluating the data of 1748 patients with UGIB, and they then prospectively validated this scoring system by applying it on 197 patients. The score is based on hemoglobin, blood urea nitrogen, systolic blood pressure, pulse, the presence of melena, syncope, liver disease, and/or heart failure. The purpose of this scoring system was to predict the need for treatment including blood transfusion, endoscopic or surgical intervention, with the validity of it in identifying low-risk patients who do not need an intervention being well established in the literature [10]. Pre-endoscopic Rockall score was developed by Rockall et al. [11] in 1996 with the initial model being based on the data of 3981 patients with UGIB. The score takes into account age, comorbidities, and shock status, which is based on pulse and systolic blood pressure. Furthermore, the Rockall score was then externally validated in two populations of 1584 and 2531 patients with UGIB for identifying patients at low risk of re-bleeding and mortality [11,12].
The use of these scoring systems in identifying low-risk patients is well established. However, there is still a need to efficiently identify patients who need an urgent endoscopic intervention. Therefore, two prospective studies compared these scores and found that GBS was better in identifying patients who need clinical management, including endoscopic intervention, than pre-endoscopic Rockall score [10,13]. However, the two studies showed that GBS was not reliable in identifying patients who need endoscopic intervention alone. Thus, the accepted use of these tools remains to identify very low-risk patients who may be safely discharged from emergency departments to be followed up as outpatients with a non-urgent endoscopy, not to predict the need for an endoscopic intervention. The purpose of this study was to develop a novel machine learning model to predict the need for endoscopic intervention in the management of acute UGIB.
2. Methods
2.1. Study Design and Settings:
This is a retrospective, multicenter study in Jordan that included all patients diagnosed with UGIB who underwent endoscopy from January 2013 to October 2023. Data was collected from three major hospitals: King Abdullah University Hospital (KAUH), Jordan University Hospital (JUH), and Prince Hamza Hospital (PHH). Each of these hospitals serves a distinct demographic area, thereby ensuring a thorough evaluation of the condition across different settings within the country. King Abdullah University Hospital (KAUH) is in the northern region and is affiliated with the Jordan University of Science and Technology (JUST). As a leading tertiary care and teaching hospital, KAUH serves not only the immediate urban population but also the surrounding rural areas, providing a wide patient base in terms of socioeconomic status and healthcare needs. Jordan University Hospital (JUH), situated in the capital city of Amman, serves a large urban population, and is considered a major referral hospital for complex cases in the region. This contributes to the study with a population that potentially has more complex or advanced presentations of UGIB. Prince Hamza Hospital (PHH), also in Amman, serves a densely populated area of the city and is known for its accessibility to lower-income populations. As a government-funded public hospital, it often deals with a high volume of patients and provides services to a wide array of the population, including those who might not have ready access to private healthcare facilities.
The ethical approval was obtained from the institutional review board (IRB) of all included institutions, Jordan University Hospital, King Abdullah University Hospital, and Prince Hamza Hospital. In each participating center, the IRB waived the need for direct informed consent from the patients as it included only variables that are routinely recorded from all patients with acute upper gastrointestinal bleeding and the study did not include any interventions or procedures.
2.2. Eligibility Criteria and Data Extraction
Patients eligible for inclusion in this retrospective multicenter study were those diagnosed with upper gastrointestinal (GI) bleeding who underwent endoscopy upon admission to one of three major hospitals in Jordan: King Abdullah University Hospital, Jordan University Hospital, and Prince Hamza Hospital. The study was limited to individuals aged 18 years and older who had provided informed consent for the use of their medical data. Exclusion criteria were designed to omit patients with lower GI bleeding, incomplete medical records, recent GI surgery within the last 30 days, primary coagulopathy disorders, refusal to consent for research use of their data, endoscopic interventions conducted outside the participating hospitals, alternative diagnoses accounting for the GI symptoms, pregnant women, and any previous enrollees in the study to prevent duplication of data. The extracted variables included patient demographics: age and sex, social history: smoking and alcohol use, clinical presentation and symptoms: abdominal pain, heart failure presentation, dizziness, melena, hepatic disease presentation, syncope, dyspnea, hematemesis, hematochezia and coffee ground vomit, comorbid conditions: hypertension, diabetes mellitus, ischemic heart disease, cerebrovascular disease, arrhythmias, congestive heart failure, valvular heart disease, asthma, chronic obstructive pulmonary disease, deep vein thrombosis, pulmonary embolism, cirrhosis, chronic kidney disease, malignancy and peptic ulcer disease, medication history: NSAIDs, aspirin, warfarin, antiplatelets, direct oral anticoagulants and heparin, details of the endoscopic intervention: variceal band ligation, adrenaline injection, coaptive coagulation and hemoclip application, pre-endoscopy management strategies: administration of IV fluids, proton pump inhibitors, erythromycin, vitamin K, plasma clotting factors, tranexamic acid, octreotide and blood products (whole blood, fresh frozen plasma, packed red blood cells, cryoprecipitate and platelets), endoscopic findings: active bleeding, esophageal ulcer, gastric ulcer, duodenal ulcer, varices, Mallory-Weiss tear, esophagitis, gastritis, esophageal tumor, gastric tumor, duodenal tumor, polyps, adherent clots, gastric erosions, esophageal erosions and duodenal erosions, laboratory data and vitals: systolic blood pressure (mmHg), diastolic blood pressure (mmHg), mean arterial pressure (mmHg), pulse rate, hemoglobin (g/dL), platelet count (in thousands), creatinine (mmol/L), C-reactive protein (mg/dL), INR, albumin, WBC count (in thousands) and blood urea nitrogen. Post-endoscopic outcomes included length of hospital stay, re-admission rates, the need for surgery and mortality. Risk stratification scores such as Glasgow-Blatchford Score (GBS) and Rockall score were calculated based on the clinical and laboratory data to assess the severity of the bleeding episode. The time to endoscopy from admission was recorded to examine its impact on patient outcomes.
2.3. Statistical Analysis
All data analyses were performed using Jamovi 2.3.28, an open-source statistical software built on R. Descriptive measures included means ± standard deviations for continuous data if the normality assumption was not violated, according to the Shapiro–Wilk test, and median with first and third quartiles (Q1–Q3) if the assumption was violated. Categorical data were presented by frequencies and percentages (%). Continuous data were compared using the student t test in normally distributed variables and the Mann–Whitney U-test if not normally distributed. Categorical data were compared using the χ2 test or the Fisher's exact test if 1 cell had an expected count of less than 5. Statistical significance was considered at a 2-sided P value of ≤.05.
2.4. Machine Learning Analysis
For the current work, three different ML algorithms have been used: the Random Forest Classifier (RFC), the Gradient Boosting Classifier (GBC), and the AdaBoost Classifier (ABC). These algorithms have been considered excellent for multi-dimensional, complex data. To support the reliability and further keep the credibility of the models used, standard scaling uniformly over all features was done using the module StandardScaler from scikit-learn. This processing entailed converting the feature matrices onto a common scale, hence normalizing the data, and ruling out any possibility of a bias that different scales among various features may have against each other. After cleaning of this dataset, binary-classification-output machine learning models were trained to predict the target variable "Underwent endoscopic intervention" using 81 features as variables. Subsequent machine learning included a model fit by dropping all post-endoscopy variables to be able to identify predictive ability in our model to identify the need for endoscopic intervention. Feature selection was done by Recursive Feature Elimination (RFE) considering all features that contribute to the model and eliminating them progressively from the least contributing. RFE was implemented using the estimator from an RFC model. The method was configured to select only 10 significant features. This is applied on the dataset, and it provides the variables selected for the final model development. The Synthetic Minority Oversampling Technique (SMOTE) was used to handle the imbalance in the dataset. This is achieved using the SMOTE approach in the imbalanced-learn library to synthetically sample from the minority class. The SMOTE was set to automatically change the class distribution of the target variable, and a random state was set for reproducibility. The scaled training data then was subjected to the following process to represent a balanced representation: The next step was applying the preprocessing operation on the patients' dataset in KAUH (n = 989) that leads to a random partitioning into two disjoint parts: 80% of data as the training set (n = 791) and 20% as the testing set (n = 198). Our models were then externally validated using another dataset (n=383) for patients in both JUH and PHH. The permutation importance method is used to calculate the importance of the contribution of the feature in predicting the variable "Underwent endoscopic intervention." A higher reduction in mean accuracy represents higher importance in the predictions of the model. We plotted receiver operating characteristic (ROC) curves and summarized them with the area under the curve (AUC) scores in each model. Using the roc_curve function of the module sklearn.metrics, the False Positive Rate (FPR) and the True Positive Rate (TPR) are computed for all models. It extracts the predicted probability of the positive class using the predict_proba method of the fitted models. The AUC scores were determined using the roc_auc_score function. A custom plotting function was defined, plot_roc_curve, in order to plot the ROC curves of multiple models. The model was also evaluated with a 10-fold cross-validation, accuracy, sensitivity, and specificity, classification report, classification report for precision, recall, and F1-score. All ML implementations were processed using the scikit-learn 0.18 package in Python.
3. Results
3.1. Demographics and Clinical Characteristics
A total of 1372 patients diagnosed with upper GI bleeding were included in this study, of which 242 had endoscopic intervention. These interventions were distributed as follows: 112 patients received variceal band ligation, 87 were treated with adrenaline injection, 54 underwent coaptive coagulation, and 19 had hemoclip application. Majority of the patients were at KAUH, which accounted for 68.2% of the study population. The mean age was 56.5 with a standard deviation of 19.3, and there was a male predominance with males accounting for 65.1% of patients. Melena was the most prevalent symptom, present in 74.5% of patients, followed by abdominal pain and dizziness, found in 31.7% and 25.5% respectively. A more detailed overview of demographics and clinical characteristics in relation to endoscopic interventions can be found in Table 1. Regarding comorbidities, hypertension was the most common, followed by diabetes mellitus, affecting 48.5% and 39.1% of patients respectively. Aspirin was the most common drug in patients' drug history, present in 29.9% of patients with upper gastrointestinal bleed. A more comprehensive overview can be seen in Table 2, showing the association between comorbidities and drug history with endoscopic interventions. IV fluids were the most common management prior to endoscopy, administered to 45.3% of patients, followed by proton pump inhibitors given to 40.3% of patients. Whole blood and packed red blood cell transfusions were the most common transfusions, administered to 39.9% and 38.3% of patients respectively. The mean GBS score was 10.9 with a standard deviation of 2.6, while the Rockall score had a mean of 4.2 with a standard deviation of 1.5. The most common finding during endoscopy was a duodenal ulcer at 22.9%, followed by varices at 17.4% of patients. The mean time to endoscopy was 39.0 hours with a standard deviation of 92.5. A more detailed overview of pre-endoscopic management and endoscopic findings is provided in Table 3. There was a mortality rate of 6.19% among all patients with upper gastrointestinal bleed and 13.4% of patients experienced re-admissions within 30 days, and 1.8% of patients required surgery. The mean length of hospital stay for all patients was 5.9 days with a standard deviation of 12.0. For a more detailed overview of laboratory values, vitals and post-endoscopic results compared to endoscopic interventions, refer to Table 4.
3.2. Characteristics of all Patients Undergoing Endoscopic Intervention
The highest number of cases was extracted from KAUH; however, the patients were intervened endoscopically in the three hospitals. The location of the hospital became a statistically significant variable with a p-value of 0.004. The symptoms that portrayed statistical significance among them were abdominal pain, dizziness, melena, hepatic disease, hematemesis, all with p-values of <0.05. From the social history, only alcohol had statistical significance, with a p-value of 0.002. Among the comorbidities of the patient, only diabetes and cirrhosis showed statistical significance, both with p-values of <0.05. On the history of drugs, all drugs were inconclusive to find any associated risk among the patients subjected to endoscopic intervention. All pre-endoscopy management modalities, namely, erythromycin, IV fluids, proton pump inhibitors, and octreotide, were highly associated with endoscopic intervention, all with p-values of <0.05. Transfusions, including whole blood, FFP, and PRBC, were also found to be associated with endoscopic intervention. Both traditional pre-endoscopy scores, GBS, and Rockall showed statistical significance with a p-value of <0.001. Various findings, which were statistically significant during endoscopy, included active bleeding, varices, esophagitis, gastritis, and adherent clots, with p-values of <0.001. Other endoscopic findings such as gastric erosions and duodenal erosions also showed significance, both with p-values of <0.05. In other laboratory values, only the platelet count, albumin, and BUN were statistically significant, having a p-value of <0.001. Hemoglobin also shows significance, having a p-value of 0.023. Post-endoscopic results indicated statistical significance for mortality and re-admission, with p-values <0.001 and 0.001 respectively, suggesting a higher mortality and re-admission rate among patients undergoing endoscopic intervention.
3.3. Variceal Band Ligation
Patients undergoing variceal band ligation also exhibited statistical significance across hospitals, particularly with KAUH showing a larger number of procedures performed, with a p-value of 0.028. Age also demonstrated statistical significance with a p-value of 0.008, indicating a younger patient population compared to other endoscopic interventions. Symptoms such as melena, hepatic disease, and hematemesis showed statistical significance with p-values <0.001. Regarding social history, patients undergoing variceal band ligation had a lower percentage of smokers compared to other endoscopic interventions, with statistical significance at a p-value of <0.001. Various comorbidities were statistically significant, including diabetes mellitus, ischemic heart disease, cerebrovascular disease, arrhythmias, congestive heart failure, cirrhosis, and chronic kidney disease, all with p-values <0.05. Regarding drug history, NSAIDs, Aspirin, Warfarin, and antiplatelets showed statistical significance, all with p-values <0.05. Pre-endoscopy management strategies such as erythromycin, vitamin K, and octreotide were statistically significant, all with p-values <0.05. Among transfusions, only fresh frozen plasma showed significance with patients undergoing variceal band ligation with a p-value of <0.001. Among pre-endoscopic scores, only the Rockall score showed statistical significance with a p-value of <0.001. Various endoscopic findings including active bleeding, gastric ulcer, duodenal ulcer, varices, esophagitis, and gastritis were statistically significant, all with a p-value of <0.001. Gastric erosions and duodenal erosions also showed statistical significance, both with p-values <0.05. Regarding lab values and vitals, systolic blood pressure, platelet count, albumin, and WBC count all showed statistical significance, all with p-values <0.05. All post-endoscopic results, including mortality, re-admission, and the need for surgery, showed statistical significance, all with p-values <0.05.
3.4. Adrenaline Injection
In patients who received adrenaline injection, there was a significant male predominance with a p-value of <0.001. Symptoms such as dizziness, melena, hematemesis, and coffee ground vomit showed statistical significance, all with p-values <0.05. Regarding comorbidities, hypertension, diabetes mellitus, deep vein thrombosis, and absence of comorbidities were statistically significant, all with p-values <0.05. Drug history did not show any statistically significant associations. Among management prior to endoscopy, only IV fluids were statistically significant with a p-value of 0.018. Transfusions including blood and packed red blood cell transfusions were statistically significant, both with p-values <0.05. The Glasgow-Blatchford score was statistically significant with a p-value of <0.001. Findings during endoscopy including active bleeding, duodenal ulcer, gastritis, adherent clot, and gastric erosions were statistically significant, all with p-values <0.05. Lab values including diastolic blood pressure, mean arterial pressure, albumin, white blood cell count, and BUN were statistically significant, all with p-values <0.05. Among post-endoscopic results, only mortality was statistically significant with a p-value of 0.01.
3.5. Coaptive Coagulation
Regarding patients undergoing coaptive coagulation, hospital association was statistically significant with a p-value of <0.001. These patients tended to be older, which was statistically significant with a p-value of 0.020. Among symptoms, only melena was statistically significant with a p-value of 0.031. Among comorbidities, only hypertension was statistically significant with a p-value of 0.001. No drugs in patients undergoing coaptive coagulation were statistically significant. Regarding management prior to endoscopy, only proton pump inhibitors were statistically significant with a p-value of 0.041. None of the transfusions were statistically significant. Findings during endoscopy, including active bleeding, varices, gastritis, and adherent clot, were statistically significant, all with p-values <0.05. Only BUN showed statistical significance among lab values with a p-value of 0.007. None of the post-endoscopic results were statistically significant.
3.6. Hemoclip Application
Among symptoms, only heart failure was statistically significant with a p-value of 0.017. Regarding social history, smoking history showed statistical significance with a p-value of <0.001. Comorbidities including hypertension, diabetes mellitus, cerebrovascular disease, and malignancy showed statistical significance, all with p-values <0.05. Among drug history, only aspirin showed statistical significance with a p-value of 0.007. Management prior to endoscopy, IV fluids, and plasma clotting factor were statistically significant, both with p-values <0.05. Transfusions including blood, fresh frozen plasma, and packed red blood cells were statistically significant, all with p-values <0.05. Pre-endoscopic scores showed no statistical significance. Findings during endoscopy, including active bleeding, gastric ulcer, duodenal ulcer, and adherent clot, showed statistical significance, all with p-values <0.05. Among lab values, only diastolic blood pressure and mean arterial pressure showed statistical significance with a p-value of <0.001. None of the post-endoscopic results were statistically significant.
3.7. Machine Learning Analysis
Across all the machine learning models evaluated, the Gradient Boosting Classifier (GBC) showed the highest AUC score at 0.861, marking it as the most predictive model. Other models also displayed high AUC scores, with AdaBoost classifier close at 0.839 and Random Forest Classifier (RFC) at 0.803. The external validation (EV) versions for RFC, GBC, and AdaBoost recorded AUC scores of 0.810, 0.819, and 0.775, respectively, outperforming traditional pre-endoscopic scores like GBS and Rockall, which had AUC scores of 0.609 and 0.568, respectively. This indicates a superior predictive capability of our models for the need for endoscopic interventions, as shown in Figure 1. Performance metrics varied, with model accuracies ranging from 82.32% to 86.95%, recall between 59.21% and 66.67%, and F1 scores from 56.79 to 65.28. GBC EV achieved the highest precision at 69.12%, RFC EV the highest specificity at 0.912, and GBC the highest sensitivity at 0.667. For detailed insights, refer to Table 5. Permutation feature importance analysis identified active bleeding, varices, and gastritis as key predictors for the need for endoscopic intervention, as detailed in Figure 2.
4. Discussion
Assessment and prediction of which type of patient would benefit from an endoscopic intervention is the most important step in the management of a life-threatening disease like UGIB, thus the main goal of the following study is to use machine learning models to predict the need for interventions during endoscopy. Data were collected in three main hospitals in Jordan. We included 1372 patients with baseline characteristics, clinical, and endoscopic data out of which 242 were the ones that needed endoscopic intervention. Importantly, the ML models, in particular the Gradient Boosting Classifier (GBC), have generally shown great improvement in prediction performance compared to existing traditional pre-endoscopic scores, such as GBS and Rockall, with better AUC scores. In the study by Veisman et al. [14], the goal was to predict the need for endoscopic interventions. They tried to improve the currently existing scores and schemes by using them within a standard ML framework. Their work specifically aims at integrating established pre-endoscopy scores with machine learning models in order to fine-tune the prediction accuracy, while our approach builds on the use of ML algorithms applied directly to a larger set of clinical parameters, thus avoiding possible drawbacks generated by existing traditional scoring systems. In the demographic distribution, the present study observed a male predominance (65.1%) and a mean age of 56.5 years. The results are in coherence with the earlier findings suggesting that male sex and old age are associated with the occurrence of upper GI bleeding [15,16]. The most reported symptom was melena, which is in agreement with the literature reporting this as the most common feature in the presentation of UGIB cases [17,18,19]. The present study further highlights hypertension and diabetes mellitus as common comorbid conditions, which aligns with previously published literature, affecting the risk and outcomes of UGIB [20,21]. The significant variables identified for patients undergoing endoscopic interventions, such as hospital location and certain symptoms (abdominal pain, dizziness, melena), provide perspectives into factors that may guide clinical decision-making [22,23]. The association of hospital location with intervention rates would certainly be reflective of differences in hospital protocols or patient case mix and so would be worth further study. The differing profiles for the subgroups of endoscopic intervention, like the variceal band ligation and adrenaline injection, might be explained by the differing pathologies that require intervention. For example, the younger age distribution within variceal band ligation may illustrate that the etiology for variceal bleeding is commonly associated with liver disease in a relatively younger cohort and goes along with previous literature showing a similar mean age for variceal band ligation [24,25]. The permutation feature importance further identified 'active bleeding,' 'varices,' and 'gastritis' as the important features supporting the view that ML may infer subtle relations not fully disclosed by traditional statistical models for the complex interactions of clinical features in UGIB. These findings could help guide the development of clinical algorithms for endoscopic triage of patients and subsequently improve efficiency in the utilization of health resources and patient outcomes. Some studies have demonstrated good predictive models, like the Random Forest, which accurately predicted urgent intervention among patients of acute gastrointestinal bleeding, with model accuracies of about 80% and above, and an area under the ROC curve greater than 0.85 [26]. However, a few limitations that should be taken into account in the interpretation of our study are as follows: first, it was a retrospective study and might hence be subjected to inherent biases, such as selection and information bias. Furthermore, the fact that we had to rely on median imputation for the missing values, while practical, might add another layer of bias. However, differences in the protocols of hospital care and diversity within the populations of patients being attended to may limit the power of generalization of our models to be applied in other settings. We should therefore focus future work on the prospective validation of our machine learning models in varied clinical environments and to integrate them into real-time clinical decision support systems. Further exploration of the features presented here, through the lens of deep learning methods, could reveal more nuanced patterns in the data, which shallower, simpler machine learning models might miss.
5. Conclusions
In conclusion, our study demonstrates the potential of machine learning to revolutionize the triage process for upper GI bleeding, paving the way for personalized medicine that tailors interventions to individual risk profiles. This could ultimately translate to more efficient use of endoscopic resources, improved patient outcomes, and reduced healthcare costs.
Authors’ contribution
Data curation, Yaman Ahmed, Mustafa Khasawneh, Laith Alquran, Batool AlQadri, Qasim Mhaidat, Hamza Alhawamleh, Own Al-Ajlouni, Khalil Hamarneh, Mohammad Hussein, Lina Mustafa, Basel Al-Bkoor, Amro Alkhatib, Layla Abu Joudeh and Osama Alghafri; Formal analysis, Omran Abu-Dhaim and Owais Ghammaz; Investigation, Daoud Al Aruri; Methodology, Omran Abu-Dhaim, Abdel-Latif Mughrabi Sabbagh and Daoud Al Aruri; Project administration, Omran Abu-Dhaim and Abdel-Latif Mughrabi Sabbagh; Resources, Abdel-Latif Mughrabi Sabbagh and Daoud Al Aruri; Software, Karam Khraim; Supervision, Abdel-Latif Mughrabi Sabbagh and Niazy Abu Farsakh; Validation, Yaman Ahmed and Karam Khraim; Writing – original draft, Abdel-Latif Mughrabi Sabbagh, Yaman Ahmed and Daoud Al Aruri; Writing – review & editing, Omran Abu-Dhaim, Yaser Rayyan, Omar Alqudah and Mu'taz Massad.
Funding
This research received no external funding.
Consent for publication
Not applicable.
Informed Consent Statement
Not applicable.
Availability of data and materials
The datasets used and/or analyzed during the current study are available from the corresponding author on reasonable request.
Competing interests
The authors declare that they have no competing interests.
Ethics approval and consent to participate
This study was approved by the ethics committee from all participating centers including the University of Jordan, Jordan University of Science and Technology, and Prince Hamza Hospital. IRB approval number 10/2024/8309. The study was conducted according to the ethical considerations and the Declaration of Helsinki.
References
- Shung, D.L.; Au, B.; Taylor, R.A.; Tay, J.K.; Laursen, S.B.; Stanley, A.J.; Dalton, H.R.; Ngu, J.; Schultz, M.; Laine, L. Validation of a Machine Learning Model That Outperforms Clinical Risk Scoring Systems for Upper Gastrointestinal Bleeding. Gastroenterology 2020, 158, 160–167. [Google Scholar] [CrossRef] [PubMed]
- Laine, L.; Yang, H.; Chang, S.-C.; Datto, C. Trends for Incidence of Hospitalization and Death Due to GI Complications in the United States From 2001 to 2009. Am. J. Gastroenterol. 2012, 107, 1190–1195. [Google Scholar] [CrossRef] [PubMed]
- Oakland, K. Changing epidemiology and etiology of upper and lower gastrointestinal bleeding. Best Pr. Res. Clin. Gastroenterol. 2019, 42-43, 101610. [Google Scholar] [CrossRef] [PubMed]
- Hearnshaw, S.A.; Logan, R.F.A.; Lowe, D.; Travis, S.P.L.; Murphy, M.F.; Palmer, K.R. Acute upper gastrointestinal bleeding in the UK: patient characteristics, diagnoses and outcomes in the 2007 UK audit. Gut 2011, 60, 1327–1335. [Google Scholar] [CrossRef] [PubMed]
- Wuerth, B.A.; Rockey, D.C. Changing Epidemiology of Upper Gastrointestinal Hemorrhage in the Last Decade: A Nationwide Analysis. Dig. Dis. Sci. 2017, 63, 1286–1293. [Google Scholar] [CrossRef] [PubMed]
- Barkun, A.N.; Almadi, M.; Kuipers, E.J.; Laine, L.; Sung, J.; Tse, F.; Leontiadis, G.I.; Abraham, N.S.; Calvet, X.; Chan, F.K.; et al. Management of Nonvariceal Upper Gastrointestinal Bleeding: Guideline Recommendations From the International Consensus Group. Ann. Intern. Med. 2019, 171, 805. [Google Scholar] [CrossRef] [PubMed]
- Karstensen, J.G.; Ebigbo, A.; Bhat, P.; Dinis-Ribeiro, M.; Gralnek, I.; Guy, C.; Le Moine, O.; Vilmann, P.; Antonelli, G.; Ijoma, U.; et al. Endoscopic treatment of variceal upper gastrointestinal bleeding: European Society of Gastrointestinal Endoscopy (ESGE) Cascade Guideline. Endosc. Int. Open 2020, 08, E990–E997. [Google Scholar] [CrossRef]
- Gralnek, I.M.; Stanley, A.J.; Morris, A.J.; Camus, M.; Lau, J.; Lanas, A.; Laursen, S.B.; Radaelli, F.; Papanikolaou, I.S.; Gonçalves, T.C.; et al. Endoscopic diagnosis and management of nonvariceal upper gastrointestinal hemorrhage (NVUGIH): European Society of Gastrointestinal Endoscopy (ESGE) Guideline – Update 2021. Endoscopy 2021, 53, 300–332. [Google Scholar] [CrossRef]
- Blatchford, O.; Murray, W.R.; Blatchford, M. A risk score to predict need for treatment for upper-gastrointestinal haemorrhage. Lancet. 2000, 356. [Google Scholar]
- Stanley, A.J.; Laine, L.; Dalton, H.R.; Ngu, J.H.; Schultz, M.; Abazi, R.; Zakko, L.; Thornton, S.; Wilkinson, K.; Khor, C.J.L.; et al. Comparison of risk scoring systems for patients presenting with upper gastrointestinal bleeding: international multicentre prospective study. BMJ 2017, 356, i6432. [Google Scholar] [CrossRef]
- A Rockall, T.; Logan, R.F.; Devlin, H.B.; Northfield, T.C. Risk assessment after acute upper gastrointestinal haemorrhage. Gut 1996, 38, 316–321. [Google Scholar] [CrossRef] [PubMed]
- Rockall, T.; Devlin, H.; Logan, R.; Northfield, T. Selection of patients for early discharge or outpatient care after acute upper gastrointestinal haemorrhage. Lancet 1996, 347, 1138–1140. [Google Scholar] [CrossRef] [PubMed]
- Pang, S.H.; Ching, J.Y.; Lau, J.Y.; Sung, J.J.; Graham, D.Y.; Chan, F.K. Comparing the Blatchford and pre-endoscopic Rockall score in predicting the need for endoscopic therapy in patients with upper GI hemorrhage. Gastrointest. Endosc. 2010, 71, 1134–1140. [Google Scholar] [CrossRef] [PubMed]
- Veisman, I.; Oppenheim, A.; Maman, R.; Kofman, N.; Edri, I.; Dar, L.; Klang, E.; Sina, S.; Gabriely, D.; Levy, I.; et al. A Novel Prediction Tool for Endoscopic Intervention in Patients with Acute Upper Gastro-Intestinal Bleeding. J. Clin. Med. 2022, 11, 5893. [Google Scholar] [CrossRef] [PubMed]
- Hreinsson, J.P.; Kalaitzakis, E.; Gudmundsson, S.; Björnsson, E.S. Upper gastrointestinal bleeding: incidence, etiology and outcomes in a population-based setting. Scand. J. Gastroenterol. 2012, 48, 439–447. [Google Scholar] [CrossRef] [PubMed]
- Youssouf, B.M.; Alfalati, B.H.; Alqthmi, R.; Alqthmi, R.; Alsehly, L.M. Causes of Upper Gastrointestinal Bleeding Among Pilgrims During the Hajj Period in the Islamic Years 1437-1439 (2016-2018). Cureus 2020, 12, e10873. [Google Scholar] [CrossRef] [PubMed]
- Kamboj, A.K.; Hoversten, P.; Leggett, C.L. Upper Gastrointestinal Bleeding: Etiologies and Management. Mayo Clin. Proc. 2019, 94, 697–703. [Google Scholar] [CrossRef] [PubMed]
- Raj, A.; Kaeley, N.; Prasad, H.; Patnaik, I.; Bahurupi, Y.; Joshi, S.; Shukla, K.; Galagali, S.; Patel, S. Prospective observational study on clinical and epidemiological profile of adult patients presenting to the emergency department with suspected upper gastrointestinal bleed. BMC Emerg. Med. 2023, 23, 1–8. [Google Scholar] [CrossRef] [PubMed]
- Kocic, M.; Rasic, P.; Marusic, V.; Prokic, D.; Savic, D.; Milickovic, M.; Kitic, I.; Mijovic, T.; Sarajlija, A. Age-specific causes of upper gastrointestinal bleeding in children. World J. Gastroenterol. 2023, 29, 6095–6110. [Google Scholar] [CrossRef]
- Alakuş. ; Kara, U.; Tasçi, C.; Eryilmaz, M. Upper gastrointestinal system bleedings in COVID-19 patients: risk factors and management / A retrospective Cohort Study. Turk. J. Trauma Emerg. Surg. 2021, 28, 762–768. [Google Scholar] [CrossRef]
- Siebenhüner, K.; Blaser, J.; Nowak, A.; Cheetham, M.; Mueller, B.U.; Battegay, E.; Beeler, P.E. Comorbidities Associated with Worse Outcomes Among Inpatients Admitted for Acute Gastrointestinal Bleeding. Dig. Dis. Sci. 2021, 67, 3938–3947. [Google Scholar] [CrossRef] [PubMed]
- Moledina, S.M.; Komba, E. Risk factors for mortality among patients admitted with upper gastrointestinal bleeding at a tertiary hospital: a prospective cohort study. BMC Gastroenterol. 2017, 17, 1–11. [Google Scholar] [CrossRef] [PubMed]
- Stanley, A.J.; Laine, L. Management of acute upper gastrointestinal bleeding. BMJ 2019, 364, l536. [Google Scholar] [CrossRef] [PubMed]
- Mostafa, E.F.; Mohammad, A.N. Incidence and predictors of rebleeding after band ligation of oesophageal varices. Arab. J. Gastroenterol. 2014, 15, 135–141. [Google Scholar] [CrossRef] [PubMed]
- Butt, N.; Abbasi, A.; Khan, M.A.; Butt, S.; Ahmad, S.M. Esophageal Variceal Band Ligation Interval and Number Required for the Obliteration of Varices: A Multi-center Study from Karachi, Pakistan. Cureus 2019, 11, e4993. [Google Scholar] [CrossRef]
- Chu, A.; Ahn, H.; Halwan, B.; Kalmin, B.; Artifon, E.L.; Barkun, A.; Lagoudakis, M.G.; Kumar, A. A decision support system to facilitate management of patients with acute gastrointestinal bleeding. Artif. Intell. Med. 2008, 42, 247–259. [Google Scholar] [CrossRef]
Figure 1.
Receiver operating characteristic (ROC) curve comparison for all models compared to traditional pre-endoscopic scores.
Figure 1.
Receiver operating characteristic (ROC) curve comparison for all models compared to traditional pre-endoscopic scores.
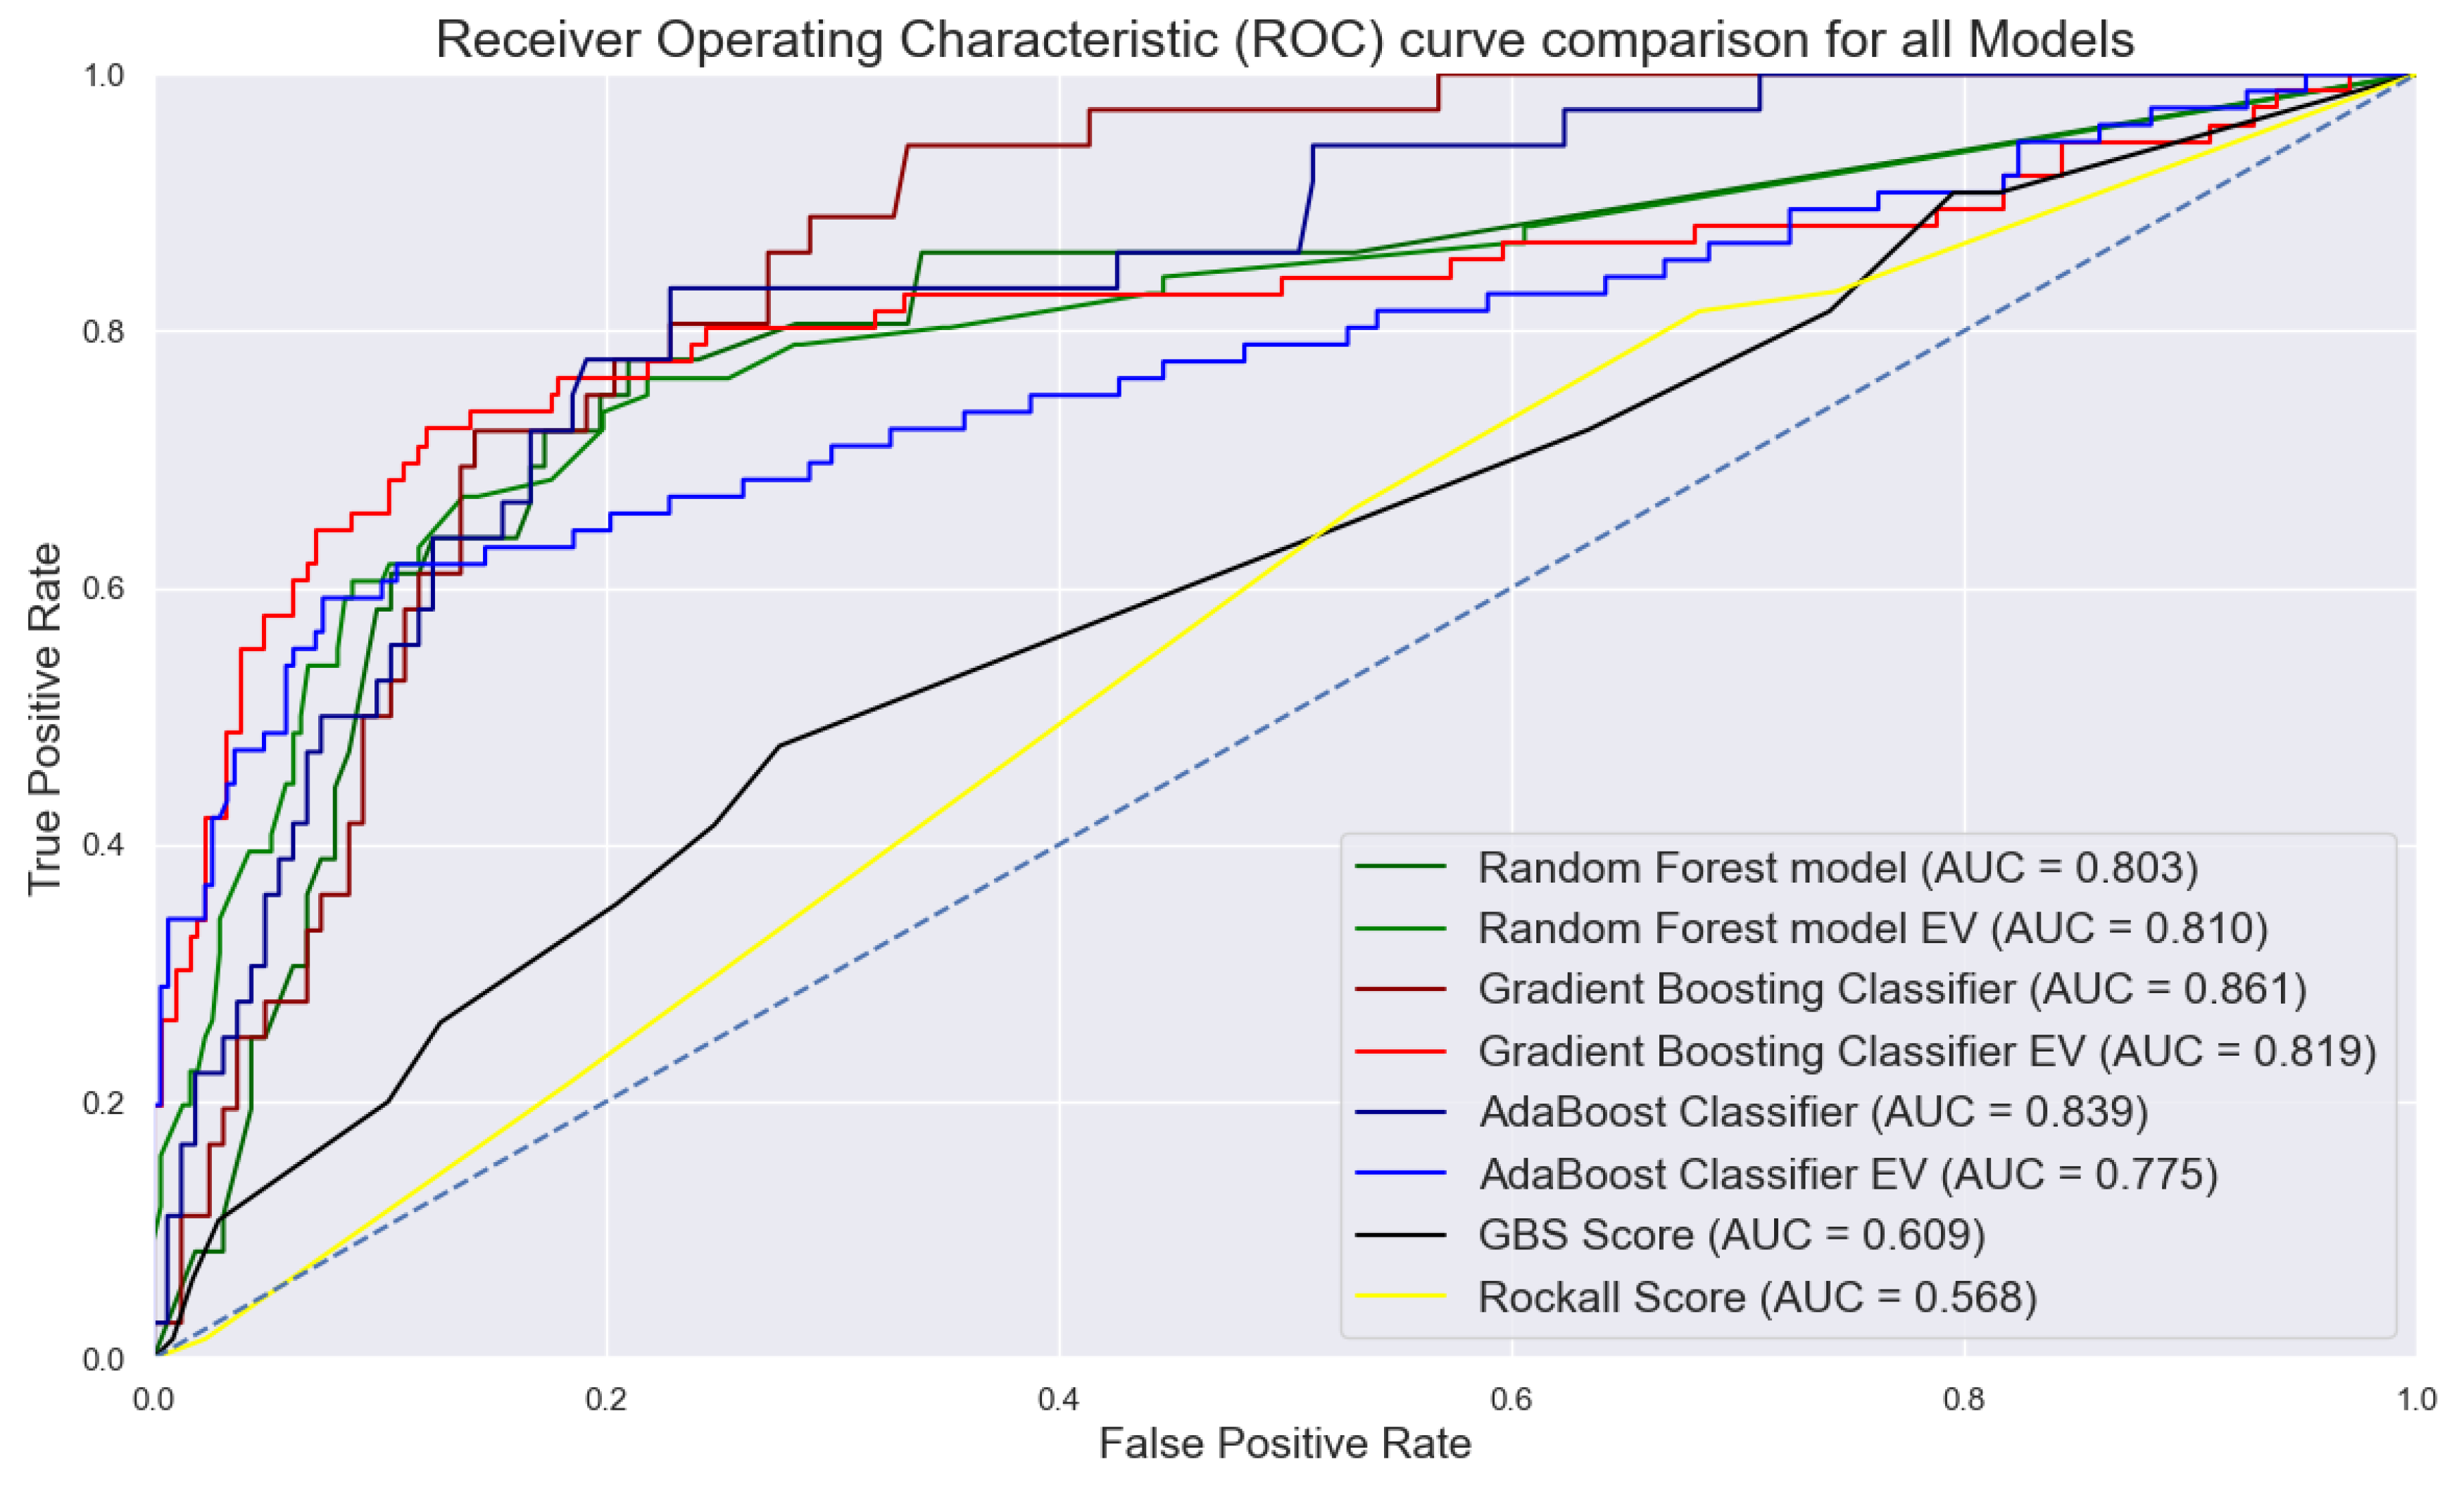
Figure 2.
Permutation feature importance method highlighting the most contributing factors predicting the need for endoscopic intervention in upper gastrointestinal bleeding.
Figure 2.
Permutation feature importance method highlighting the most contributing factors predicting the need for endoscopic intervention in upper gastrointestinal bleeding.
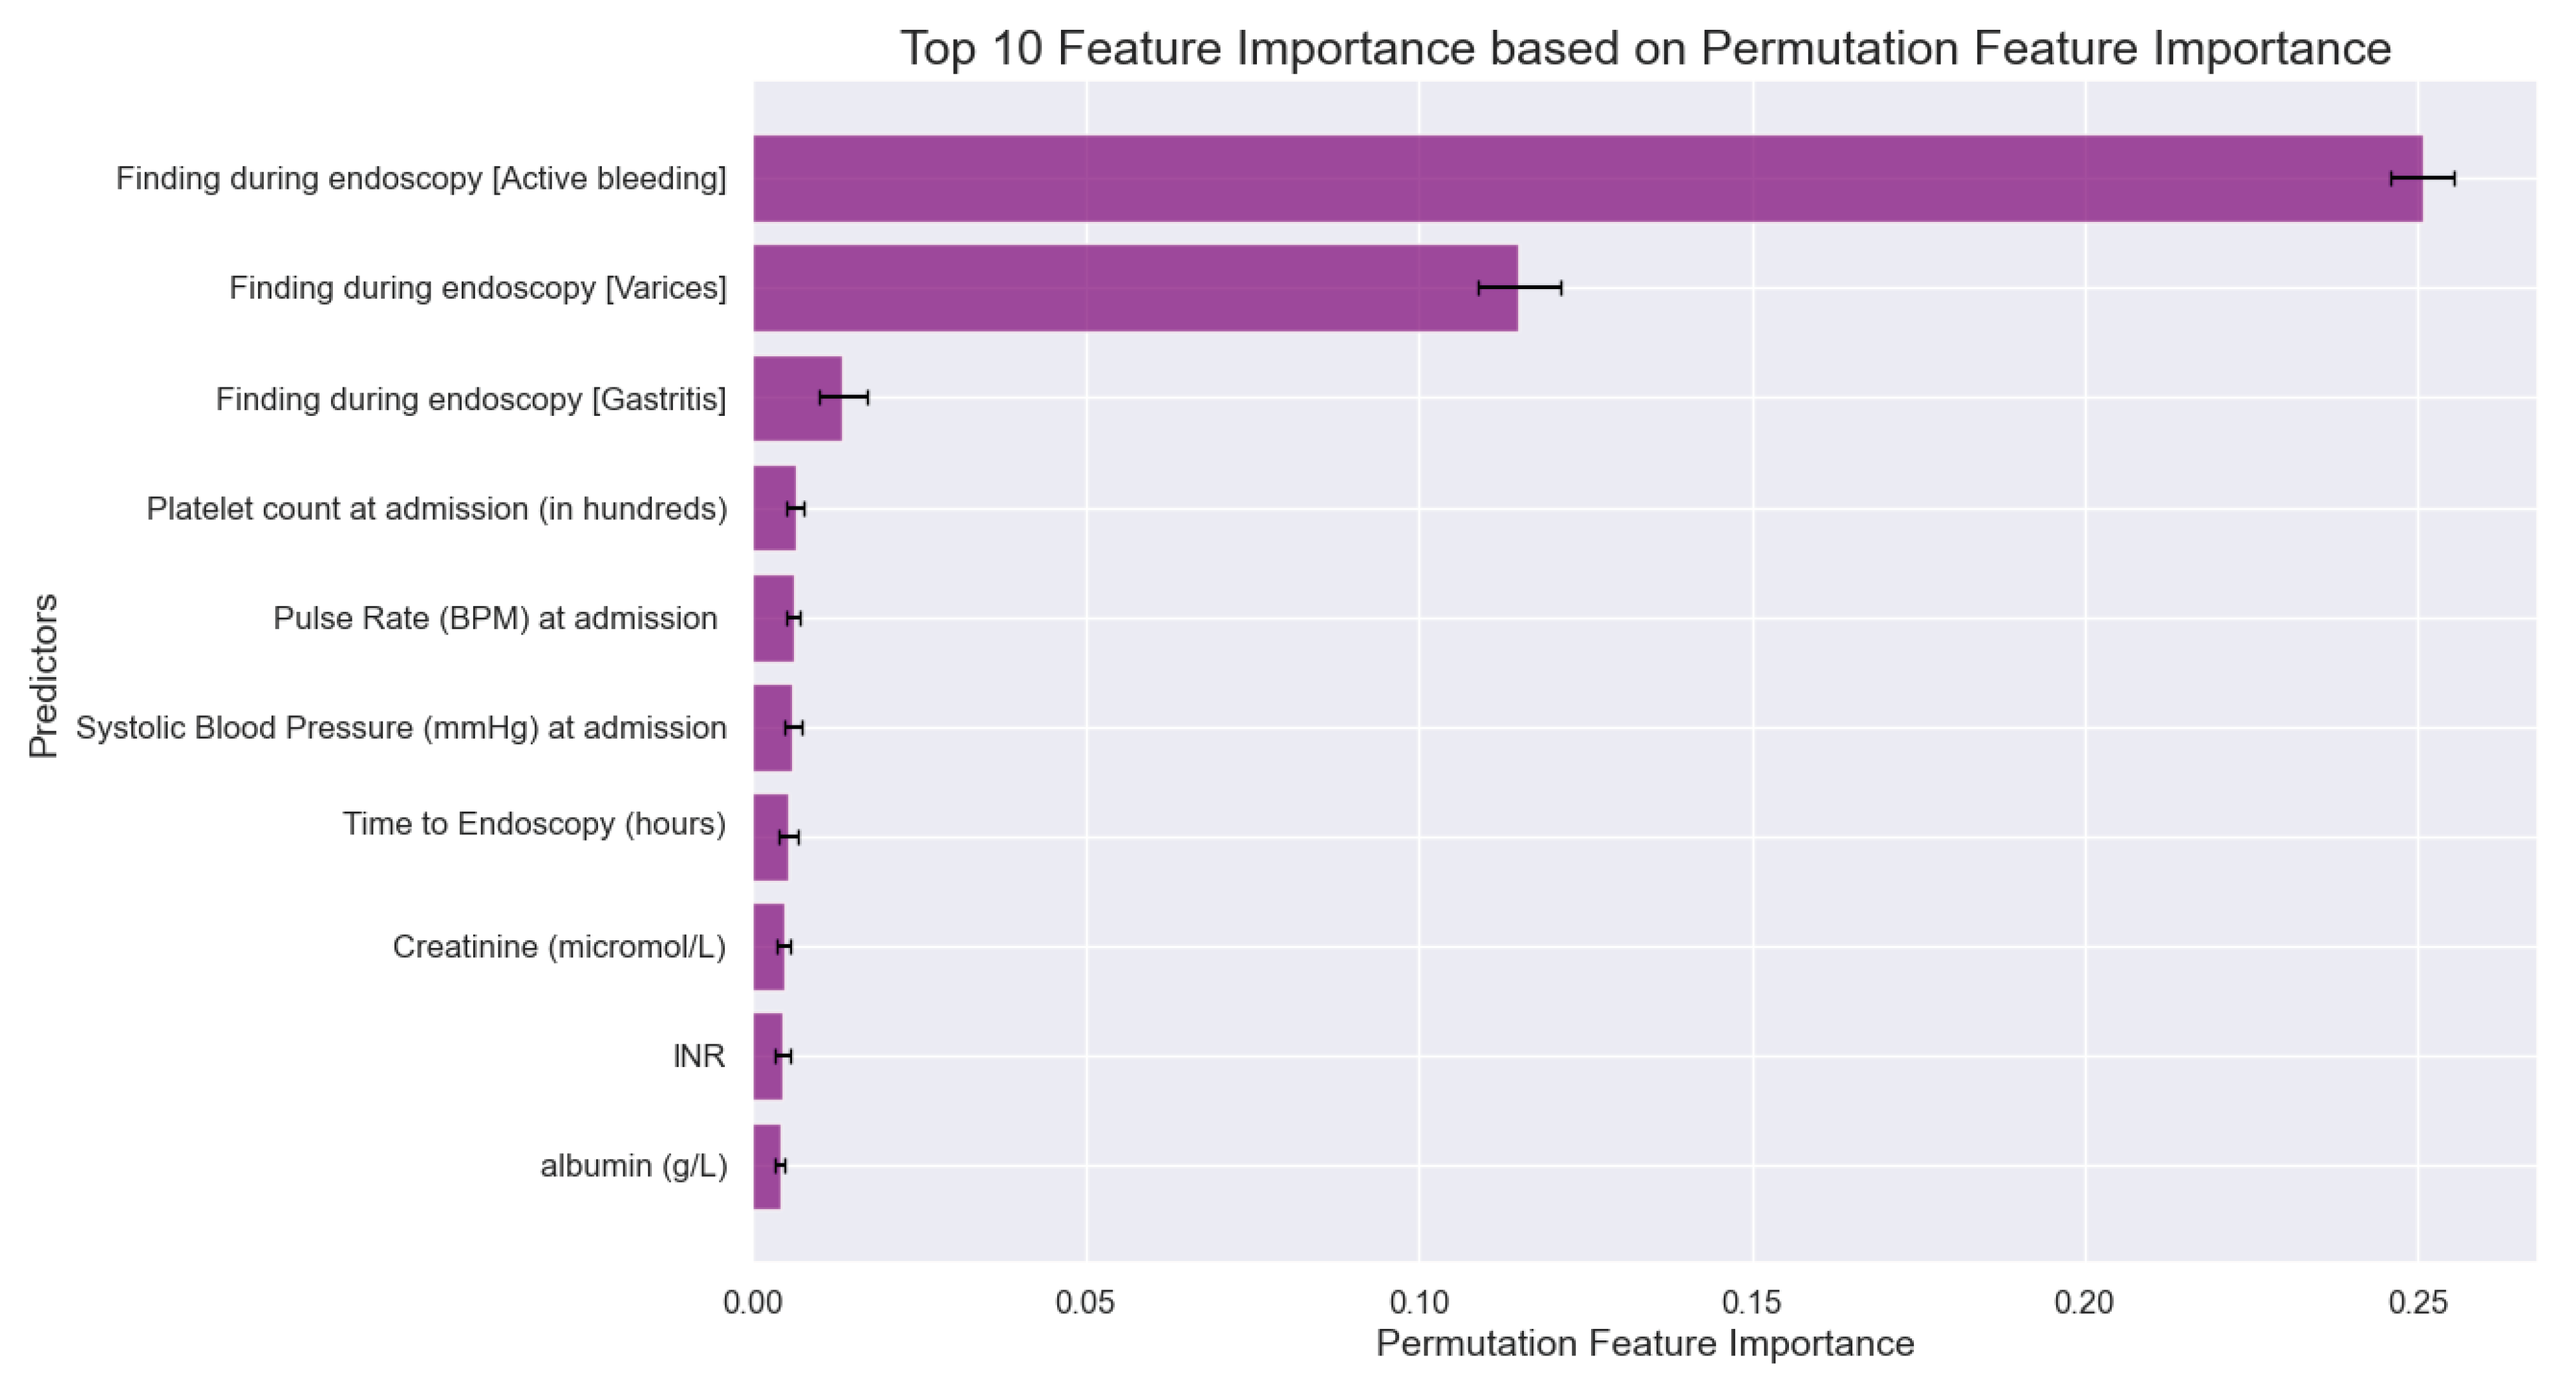

Table 1.
Demographics and clinical characteristics of patients with upper GI bleeding in association with various endoscopic intervention.
Table 1.
Demographics and clinical characteristics of patients with upper GI bleeding in association with various endoscopic intervention.
| Variables | All patients (n=1372) | Underwent endoscopic intervention (n=242) | P value | Variceal band ligation (n=112) | P value | Adrenaline injection (n=87) | P value | Coaptive coagulation (n=54) | P value | Hemoclip application (n=19) | P value |
|---|---|---|---|---|---|---|---|---|---|---|---|
| Hospital, n (%) | 0.004* | 0.028* | 0.57 | <.001* | 0.16 | ||||||
| KAUH | 989 (72.1) | 165 (68.2) | 76 (67.9) | 67 (77.0) | 35 (64.8) | 10 (52.6) | |||||
| JUH | 253 (18.4) | 61 (25.2) | 30 (26.8) | 13 (14.9) | 19 (35.2) | 6 (31.6) | |||||
| PHH | 130 (9.5) | 15 (6.2) | 6 (5.4) | 7 (8.0) | 0 (0.0) | 3 (15.8) | |||||
| Age, mean (SD) | 56.5 (19.3) | 56.2 (16.9) | 0.816 | 51.8 (15.8) | 0.008* | 57.7 (17.3) | 0.53 | 62.5 (15.9) | 0.020* | 59.4 (15.2) | 0.504 |
| Gender (Male), n (%) | 893 (65.1) | 165 (68.5) | 0.256 | 69 (61.6) | 0.42 | 72 (82.8) | <.001* | 39 (72.2) | 0.26 | 12 (63.2) | 0.86 |
| Symptoms, n (%) | |||||||||||
| Abdominal pain | 436 (31.7) | 60 (24.9) | 0.014* | 27 (24.1) | 0.069 | 24 (27.6) | 0.39 | 15 (27.8) | 0.52 | 4 (21.1) | 0.31 |
| Heart failure presentation | 32 (2.3) | 8 (3.3) | 0.377 | 2 (1.8) | 0.69 | 2 (2.3) | 0.98 | 3 (5.6) | 0.11 | 2 (10.6) | 0.017* |
| Dizziness | 381 (25.5) | 84 (34.9) | 0.009* | 29 (25.9) | 0.64 | 39 (44.8) | <.001* | 19 (35.2) | 0.21 | 9 (47.4) | 0.055 |
| Melena | 1022 (74.5) | 166 (68.9) | 0.034* | 55 (49.1) | <.001* | 76 (87.4) | 0.004* | 47 (87.0) | 0.031* | 16 (84.2) | 0.33 |
| Hepatic disease presentation | 110 (8.0) | 39 (16.2) | <.001* | 34 (30.4) | <.001* | 4 (4.6) | 0.22 | 2 (3.7) | 0.23 | 0 (0.0) | 0.2 |
| Syncope | 36 (2.6) | 5 (2.1) | 0.715 | 0 (0.0) | 0.07 | 5 (5.7) | 0.06 | 2 (3.7) | 0.61 | 0 (0.0) | 0.47 |
| Dyspnea | 157 (11.4) | 24 (10.0) | 0.493 | 7 (6.3) | 0.072 | 11 (12.6) | 0.72 | 8 (14.8) | 0.43 | 4 (21.1) | 0.19 |
| Hematemesis | 261 (19.0) | 78 (32.4) | <.001* | 45 (40.2) | <.001* | 26 (29.9) | 0.008* | 10 (18.5) | 0.92 | 6 (31.6) | 0.16 |
| Hematochezia | 122 (8.9) | 16 (6.6) | 0.219 | 8 (7.1) | 0.5 | 7 (8.0) | 0.77 | 2 (3.7) | 0.17 | 2 (10.5) | 0.8 |
| Coffee ground vomit | 218 (15.9) | 44 (18.3) | 0.312 | 17 (15.2) | 0.83 | 24 (27.6) | 0.002* | 8 (14.8) | 0.83 | 6 (31.6) | 0.06 |
| Social history, n (%) | |||||||||||
| Smoking | 308 (22.4) | 58 (24.1) | 0.563 | 22 (19.6) | <.001* | 27 (31.0) | 0.2 | 11 (20.4) | 0.71 | 5 (26.3) | <.001* |
| Alcohol | 17 (1.2) | 8 (3.3) | 0.002* | 6 (5.4) | 0.46 | 1 (1.1) | 0.63 | 1 (1.9) | 1.00 | 0 (0.0) | 0.37 |
Note: * P values ≤ 0.05 were considered statistically significant. Abbreviations: SD; Standard deviation; KAUH; King Abdullah University Hospital; JUH; Jordan University Hospital; PHH; Prince Hamza Hospital.
Table 2.
Comorbidities and drug history of patients with upper GI bleeding in association with various endoscopic interventions.
Table 2.
Comorbidities and drug history of patients with upper GI bleeding in association with various endoscopic interventions.
| Variables | All patients (n=1372) | Underwent endoscopic intervention (n=242) | P value | Variceal band ligation (n=112) | P value | Adrenaline injection (n=87) | P value | Coaptive coagulation (n=54) | P value | Hemoclip application (n=19) | P value |
|---|---|---|---|---|---|---|---|---|---|---|---|
| Comorbidities, n (%) | |||||||||||
| Hypertension | 666 (48.5) | 131 (54.4) | 0.055 | 50 (44.6) | 0.39 | 52 (59.8) | <.001* | 38 (70.4) | 0.001* | 12 (63.2) | <.001* |
| DM | 536 (39.1) | 113 (46.9) | 0.008* | 60 (53.6) | 0.001* | 38 (43.7) | 0.03* | 24 (44.4) | 0.41 | 7 (36.9) | 0.03* |
| IHD | 282 (20.6) | 41 (17.0) | 0.158 | 10 (8.9) | 0.002* | 15 (17.2) | 0.36 | 16 (29.6) | 0.092 | 6 (31.6) | 0.84 |
| CVD | 103 (7.5) | 12 (5.0) | 0.132 | 0 (0.0) | 0.002* | 0 (0.0) | 0.43 | 7 (13.0) | 0.12 | 3 (15.8) | 0.23 |
| Arrhythmias | 86 (6.2) | 12 (5.0) | 0.446 | 0 (0.0) | 0.004* | 5 (5.7) | 0.84 | 7 (13.0) | 0.038* | 2 (10.5) | 0.17 |
| CHF | 95 (6.9) | 14 (5.8) | 0.541 | 1 (0.9) | 0.009* | 8 (9.2) | 0.84 | 4 (7.4) | 0.89 | 4 (21.1) | 0.44 |
| VHD | 25 (1.8) | 4 (1.7) | 1.00 | 0 (0.0) | 0.13 | 2 (2.3) | 0.39 | 2 (3.7) | 0.29 | 0 (0.0) | 0.015* |
| Asthma | 28 (2.0) | 5 (2.1) | 1.00 | 2 (1.8) | 0.84 | 2 (2.3) | 0.73 | 1 (1.9) | 0.92 | 1 (5.3) | 0.55 |
| COPD | 15 (1.1) | 4 (1.7) | 0.555 | 0 (0.0) | 0.25 | 4 (4.6) | 0.86 | 1 (1.9) | 0.58 | 0 (0.0) | 0.32 |
| DVT | 17 (1.2) | 1 (0.4) | 0.341 | 0 (0.0) | 0.22 | 0 (0.0) | 0.001* | 1 (1.9) | 0.68 | 0 (0.0) | 0.64 |
| PE | 6 (0.4) | 1 (0.4) | 1.00 | 1 (0.9) | 0.45 | 0 (0.0) | 0.28 | 0 (0.0) | 0.62 | 0 (0.0) | 0.62 |
| Cirrhosis | 186 (13.6) | 88 (36.5) | <.001* | 79 (70.5) | <.001* | 8 (9.2) | 0.52 | 5 (9.3) | 0.35 | 0 (0.0) | 0.77 |
| CKD | 122 (8.9) | 19 (7.9) | 0.631 | 4 (3.6) | 0.039* | 9 (10.3) | 0.22 | 5 (9.3) | 0.58 | 7 (36.9) | 0.082 |
| Malignancy | 117 (8.5) | 22 (9.1) | 0.801 | 8 (7.1) | 0.58 | 10 (11.5) | 0.62 | 5 (9.3) | 0.84 | 2 (10.5) | <.001* |
| PUD | 78 (5.7) | 15 (6.2) | 0.807 | 2 (1.8) | 0.063 | 11 (12.6) | 0.31 | 5 (9.3) | 0.25 | 0 (0.0) | 0.75 |
| None | 79 (5.8) | 8 (3.3) | 0.102 | 2 (1.8) | 0.06 | 4 (4.6) | 0.004* | 3 (5.6) | 0.95 | 2 (10.5) | 0.28 |
| Drug history, n (%) | |||||||||||
| NSAIDs | 112 (8.2) | 15 (6.2) | 0.28 | 2 (1.8) | 0.01* | 11 (12.6) | 0.11 | 5 (9.3) | 0.76 | 3 (15.8) | 0.22 |
| Aspirin | 409 (29.9) | 59 (24.5) | 0.057 | 13 (11.6) | <.001* | 29 (33.3) | 0.46 | 20 (37.0) | 0.24 | 11 (57.9) | 0.007* |
| Warfarin | 90 (6.6) | 10 (4.1) | 0.128 | 1 (0.9) | 0.011* | 2 (2.3) | 0.097 | 5 (9.3) | 0.41 | 3 (15.8) | 0.1 |
| Antiplatelets | 125 (9.1) | 16 (6.6) | 0.179 | 3 (2.7) | 0.014* | 8 (9.2) | 0.98 | 6 (11.1) | 0.6 | 2 (10.5) | 0.98 |
| DOAC | 40 (2.9) | 5 (2.1) | 0.52 | 1 (0.9) | 0.18 | 2 (2.3) | 0.72 | 2 (3.7) | 0.73 | 0 (0.0) | 0.72 |
| Heparin | 31 (2.3) | 10 (4.1) | 0.053 | 1 (0.9) | 0.31 | 7 (8.0) | 0.47 | 2 (3.7) | 0.47 | 2 (10.5) | 0.47 |
Note: * P values ≤ 0.05 were considered statistically significant. Abbreviations: DM; Diabetes mellitus; IHD; Ischemic heart disease; CVD; Cerebrovascular disease; CHF; Congestive heart failure; VHD; Valvular heart disease; COPD; Chronic obstructive pulmonary disease; DVT; Deep vein thrombosis; PE; Pulmonary embolism; CKD; Chronic kidney disease; PUD; Peptic ulcer disease; NSAIDs; Nonsteroidal anti-inflammatory drugs; DOAC; Direct oral anticoagulants.
Table 3.
Comparative analysis of pre-endoscopic management and endoscopic findings across different endoscopic Interventions for upper gastrointestinal bleeding.
Table 3.
Comparative analysis of pre-endoscopic management and endoscopic findings across different endoscopic Interventions for upper gastrointestinal bleeding.
| Variables | All patients (n=1372) | Underwent endoscopic intervention (n=242) | P value | Variceal band ligation (n=112) | P value | Adrenaline injection (n=87) | P value | Coaptive coagulation (n=54) | P value | Hemoclip application (n=19) | P value |
|---|---|---|---|---|---|---|---|---|---|---|---|
| Management prior to endoscopy, n (%) | |||||||||||
| Erythromycin | 9 (0.66) | 6 (2.5) | <.001* | 6 (5.4) | <.001* | 0 (0.0) | 0.43 | 0 (0.0) | 0.54 | 0 (0.0) | 0.72 |
| IV fluids | 621 (45.3) | 133 (55.0) | <.001* | 58 (51.8) | 0.15 | 50 (57.5) | 0.018* | 30 (55.6) | 0.12 | 13 (68.4) | 0.041* |
| Vitamin K | 19 (1.4) | 5 (2.2) | 0.313 | 4 (3.6) | 0.039* | 0 (0.0) | 0.25 | 0 (0.0) | 0.37 | 1 (5.3) | 0.15 |
| Plasma clotting factor transfusion | 26 (1.9) | 8 (3.3) | 0.074 | 4 (3.6) | 0.17 | 2 (2.3) | 0.78 | 1 (1.9) | 0.98 | 2 (10.5) | 0.006* |
| Tranexamic acid | 5 (0.4) | 1 (0.4) | 0.886 | 0 (0.0) | 0.5 | 0 (0.0) | 0.56 | 1 (1.9) | 0.064 | 0 (0.0) | 0.79 |
| Proton pump inhibitor | 553 (40.3) | 112 (46.3) | 0.032* | 50 (44.6) | 0.33 | 37 (42.5) | 0.66 | 29 (53.7) | 0.041* | 10 (52.6) | 0.27 |
| Octreotide | 59 (4.3) | 29 (12.0) | <.001* | 22 (19.6) | <.001* | 5 (5.7) | 0.49 | 4 (7.4) | 0.25 | 0 (0.0) | 0.35 |
| Transfusion, n (%) | |||||||||||
| Whole Blood | 548 (39.9) | 116 (47.9) | 0.015* | 49 (43.8) | 0.665 | 47 (54.0) | 0.021* | 22 (40.7) | 0.973 | 14 (73.7) | 0.010* |
| FFP | 115 (8.4) | 33 (13.6) | 0.004* | 94 (83.9) | <.001* | 9 (10.3) | 0.767 | 3 (5.6) | 0.730 | 5 (26.3) | 0.018* |
| PRBC | 525 (38.3) | 113 (46.7) | 0.007* | 47 (42.0) | 0.600 | 47 (54.0) | 0.007* | 21 (38.9) | 0.918 | 14 (73.7) | 0.006* |
| Cryoprecipitate | 7 (0.5) | 2 (0.8) | 0.670 | 2 (1.8) | 0.136 | 0 (0.0) | 0.762 | 0 (0.0) | 0.848 | 0 (0.0) | 0.945 |
| Platelets | 11 (0.8) | 2 (0.8) | 0.817 | 1 (0.9) | 0.970 | 0 (0.0) | 0.975 | 0 (0.0) | 0.993 | 1 (5.3) | 0.190 |
| Pre-endoscopic scores, mean (SD) | |||||||||||
| GBS | 10.9 (2.6) | 11.4 (2.7) | <.001* | 11.3 (2.6) | 0.098 | 11.8 (3.0) | <.001* | 11.2 (2.7) | 0.301 | 11.8 (3.3) | 0.122 |
| Rockall score | 4.2 (1.5) | 4.7 (1.6) | <.001* | 4.9 (1.0) | <.001* | 4.3 (1.4) | 0.432 | 4.5 (1.4) | 0.119 | 4.6 (1.4) | 0.211 |
| Findings during endoscopy, n (%) | |||||||||||
| Active bleeding | 188 (13.7) | 136 (56.2) | <.001* | 42 (37.5) | <.001* | 69 (79.3) | <.001* | 38 (70.4) | <.001* | 10 (52.6) | <.001* |
| Esophageal ulcer | 41 (3.0) | 5 (2.1) | 0.359 | 2 (1.8) | 0.43 | 0 (0.0) | 0.091 | 1 (1.9) | 0.62 | 2 (10.5) | 0.052 |
| Gastric ulcer | 154 (11.2) | 26 (10.7) | 0.813 | 2 (1.8) | <.001* | 13 (14.9) | 0.26 | 8 (14.8) | 0.39 | 7 (36.8) | <.001* |
| Duodenal Ulcer | 314 (22.9) | 60 (24.8) | 0.413 | 3 (2.7) | <.001* | 51 (58.6) | <.001* | 15 (27.8) | 0.38 | 8 (42.1) | 0.045* |
| Varices | 239 (17.4) | 121 (50.0) | <.001* | 0 (0.0) | <.001* | 9 (10.3) | 0.072 | 3 (5.6) | 0.019* | 2 (10.5) | 0.42 |
| Mallory-Weiss Tear | 6 (0.4) | 0 (0.0) | 0.257 | 0 (0.0) | 0.46 | 0 (0.0) | 0.52 | 0 (0.0) | 0.62 | 0 (0.0) | 0.77 |
| Esophagitis | 164 (12.0) | 11 (4.5) | <.001* | 0 (0.0) | <.001* | 7 (8.0) | 0.25 | 6 (11.1) | 0.85 | 1 (5.3) | 0.37 |
| Gastritis | 281 (20.5) | 14 (5.8) | <.001* | 4 (3.6) | <.001* | 6 (6.9) | 0.001* | 3 (5.6) | 0.006* | 2 (10.5) | 0.28 |
| Esophageal Tumor | 4 (0.3) | 0 (0.0) | 0.355 | 0 (0.0) | 0.55 | 0 (0.0) | 0.6 | 0 (0.0) | 0.69 | 0 (0.0) | 0.81 |
| Gastric Tumor | 28 (2.0) | 5 (2.1) | 0.967 | 0 (0.0) | 0.11 | 3 (3.4) | 0.34 | 2 (3.7) | 0.38 | 0 (0.0) | 0.53 |
| Duodenal Tumor | 7 (0.5) | 1 (0.4) | 0.819 | 0 (0.0) | 0.43 | 1 (1.1) | 0.39 | 0 (0.0) | 0.59 | 0 (0.0) | 0.75 |
| Polyps | 36 (2.6) | 6 (2.5) | 0.886 | 4 (3.6) | 0.51 | 1 (1.1) | 0.37 | 1 (1.9) | 0.72 | 0 (0.0) | 0.47 |
| Adherent Clot | 38 (2.8) | 20 (8.3) | <.001* | 6 (5.4) | 0.082 | 11 (12.6) | <.001* | 4 (7.4) | 0.034* | 4 (21.1) | <.001* |
| Gastric Erosions | 201 (14.7) | 20 (8.3) | 0.002* | 7 (6.3) | 0.009* | 2 (2.3) | <.001* | 9 (16.7) | 0.67 | 2 (10.5) | 0.61 |
| Esophageal erosion | 29 (2.1) | 4 (1.7) | 0.589 | 1 (0.9) | 0.35 | 1 (1.1) | 0.52 | 1 (1.9) | 0.89 | 1 (5.3) | 0.34 |
| Duodenal erosion | 122 (8.9) | 12 (5.0) | 0.019* | 3 (2.7) | 0.016* | 7 (8.0) | 0.77 | 4 (7.4) | 0.7 | 1 (5.3) | 0.58 |
| Time to endoscopy (hours), mean (SD) | 39.0 (92.5) | 32.1 (58.3) | 0.199 | 27.7 (39.9) | 0.175 | 41.0 (82.8) | 0.835 | 43.6 (96.4) | 0.710 | 20.9 (24.6) | 0.391 |
Note: * P values ≤ 0.05 were considered statistically significant. Abbreviations: SD; Standard deviation; FFP; Fresh frozen plasma; PRBC; Packed red blood cells; GBS; Glasgow-Blatchford score.
Table 4.
Lab values, vitals, and post-endoscopic results across various endoscopic interventions.
| Variables | All patients (n=1372) | Underwent endoscopic intervention (n=242) | P value | Variceal band ligation (n=112) | P value | Adrenaline injection (n=87) | P value | Coaptive coagulation (n=54) | P value | Hemoclip application (n=19) | P value |
|---|---|---|---|---|---|---|---|---|---|---|---|
| Lab values and vitals, mean (SD) | |||||||||||
| SBP (mmHg) | 121.8 (20.5) | 119.8 (20.9) | 0.131 | 116.5 (19.9) | 0.009* | 121.4 (22.0) | 0.868 | 122.7 (19.1) | 0.752 | 114.6 (25.9) | 0.135 |
| DBP (mmHg) | 72.8 (27.3) | 75.4 (57.9) | 0.115 | 70.2 (14.0) | 0.347 | 82.1 (91.9) | 0.001* | 72.3 (11.8) | 0.99 | 114.2 (193.6) | <.001* |
| MAP (mmHg) | 89.1 (21.5) | 90.4 (41.4) | 0.350 | 86.0 (15.4) | 0.144 | 95.2 (64.3) | 0.010* | 89.1 (12.9) | 0.988 | 114.0 (131) | <.001* |
| Pulse rate | 88.0 (15.7) | 88.5 (15.6) | 0.614 | 88.1 (17.0) | 0.953 | 91.0 (14.6) | 0.083 | 83.9 (13.2) | 0.076 | 89.4 (13.5) | 0.710 |
| Hemoglobin (g/dL) | 9.8 (3.8) | 9.3 (3.3) | 0.023* | 9.5 (4.1) | 0.348 | 9.1 (2.7) | 0.071 | 9.5 (2.8) | 0.481 | 8.7 (1.9) | 0.196 |
| Platelet count (in thousands) | 250.9 (133.8) | 201.1 (117.5) | <.001* | 141.0 (94.0) | <.001* | 265.8 (121.3) | 0.282 | 239.2 (103.7) | 0.514 | 203.0 (80.0) | 0.116 |
| Creatinine (mmol/L) | 118.8 (132.6) | 117.1 (118.5) | 0.829 | 99.3 (67.1) | 0.119 | 141.4 (160.4) | 0.099 | 113.7 (99.9) | 0.776 | 142.6 (146.3) | 0.430 |
| CRP (mg/dL) | 38.6 (66.1) | 34.6 (65.9) | 0.654 | 29.6 (44.7) | 0.587 | 31.1 (40.7) | 0.676 | 41.5 (95.1) | 0.848 | 24.3 (24.8) | 0.564 |
| INR | 1.4 (1.1) | 1.5 (0.8) | 0.564 | 1.6 (0.6) | 0.142 | 1.4 (1.2) | 0.560 | 1.3 (0.3) | 0.275 | 1.4 (0.5) | 0.868 |
| Albumin | 3.6 (0.7) | 3.4 (0.6) | <.001* | 3.2 (0.7) | <.001* | 3.4 (0.6) | 0.035* | 3.6 (0.6) | 0.876 | 3.4 (0.6) | 0.255 |
| WBC count (in thousands) | 9.6 (5.6) | 9.0 (5.0) | 0.092 | 6.9 (3.4) | <.001* | 11.1 (5.4) | 0.007* | 9.9 (6.5) | 0.649 | 11.0 (3.7) | 0.252 |
| BUN | 33.7 (34.8) | 41.6 (48.2) | <.001* | 33.8 (32.9) | 0.981 | 49.2 (64.6) | <.001* | 46.8 (36.6) | 0.007* | 41.7 (28.9) | 0.314 |
| Post-endoscopic results, n (%) | |||||||||||
| Deceased | 85 (6.19) | 27 (11.2) | <.001* | 13 (11.6) | 0.013* | 11 (12.6) | 0.01* | 3 (5.6) | 0.842 | 1 (5.3) | 0.865 |
| Re-admission | 184 (13.4) | 48 (19.8) | 0.001* | 30 (26.8) | <.001* | 9 (10.3) | 0.386 | 8 (14.8) | 0.757 | 5 (26.3) | 0.096 |
| Surgery required | 25 (1.8) | 8 (3.3) | 0.056 | 8 (7.1) | <.001* | 1 (1.1) | 0.628 | 0 (0.0) | 0.307 | 0 (0.0) | 0.55 |
| Length of stay, mean (SD) | 5.9 (12.0) | 6.1 (8.3) | 0.787 | 5.7 (10.1) | 0.831 | 7.1 (6.6) | 0.334 | 5.87 (6.9) | 0.993 | 6.1 (5.5) | 0.951 |
Note: * P values ≤ 0.05 were considered statistically significant. Abbreviations: SD; standard deviation; SBP; Systolic blood pressure; DBP; Diastolic blood pressure; MAP; Mean arterial pressure; CRP; C-reactive protein; INR; International normalized ratio; WBC; White blood cell; BUN; Blood urea nitrogen.
Table 5.
Machine learning models evaluation using various metrics.
| Machine learning models | Accuracy | Precision | Recall | F1 score | Specificity | Sensitivity | 10-fold CV | AUC |
|---|---|---|---|---|---|---|---|---|
| RFC | 82.32 | 51.11 | 63.89 | 56.79 | 0.870 | 0.639 | 0.931 | 0.803 |
| GBC | 82.83 | 52.17 | 66.67 | 58.54 | 0.864 | 0.667 | 0.927 | 0.861 |
| AdaBoost | 82.83 | 52.27 | 63.89 | 57.50 | 0.870 | 0.639 | 0.890 | 0.839 |
| RFC EV | 84.86 | 62.50 | 59.21 | 60.81 | 0.912 | 0.592 | 0.810 | 0.810 |
| GBC EV | 86.95 | 69.12 | 61.84 | 65.28 | 0.932 | 0.619 | 0.836 | 0.819 |
| AdaBoost EV | 84.07 | 60.00 | 59.21 | 59.60 | 0.902 | 0.592 | 0.838 | 0.775 |
Abbreviations: RFC; Random Forest classifier; GBC; Gradient boosting classifier; EV; External validation; CV; Cross validation; AUC; Area under the curve.
Disclaimer/Publisher’s Note: The statements, opinions and data contained in all publications are solely those of the individual author(s) and contributor(s) and not of MDPI and/or the editor(s). MDPI and/or the editor(s) disclaim responsibility for any injury to people or property resulting from any ideas, methods, instructions or products referred to in the content. |
© 2024 by the authors. Licensee MDPI, Basel, Switzerland. This article is an open access article distributed under the terms and conditions of the Creative Commons Attribution (CC BY) license (http://creativecommons.org/licenses/by/4.0/).
Copyright: This open access article is published under a Creative Commons CC BY 4.0 license, which permit the free download, distribution, and reuse, provided that the author and preprint are cited in any reuse.


