
Submitted:
14 July 2025
Posted:
15 July 2025
You are already at the latest version
Abstract
Reactive oxygen species (ROS) are fundamental components found in cells that exist in an oxygen environment. While they are often viewed as detrimental metabolic byproducts that can harm cells, leading to aging and cell death, they can also play a role in cellular regulatory processes and have beneficial effects. One of the main ROS present in all cells is hydrogen peroxide (H2O2), which can function as a signaling molecule in extra- and intracellular signaling. To enhance our understanding of how various enzymes regulate cellular H2O2 level we created a mathematical model of H2O2 neutralization and performed computer simulations to estimate the neutralization efficiency in various types of cells. Data on gene expression for genes participating in this process was incorporated into the calculations, along with enzymes’ regulation of oxidation and reduction processes. The conducted simulations demonstrate that cells originating from different tissues differently utilize systems neutralizing H2O2 which results in differences in H2O2 cellular levels. The simulation findings suggest that the differences in radiosensitivity seen in various cancer cell types may be linked to their effectiveness in neutralizing H2O2. Analysis of results from model simulations for colorectal, lung and breast cancer cell lines indicated that radiosensitive cell lines exhibit elevated levels of H2O2, attributed to the reduced efficiency of neutralizing enzymes.
Keywords:
reactive oxygen species
; H2O2 neutralization
; ROS neutralization mathematical modelling
1. Introduction
Reactive oxygen species (ROS) are generally regarded as harmful byproducts resulting from life in an oxygen environment [1]. They are recognized as secondary messengers in the overall cellular signaling [1,2]. For a long time, these species were thought to be damaging to cells, involved in aging and cell death [1,3,4]. Today, they are seen as crucial players in the regulation of cellular processes such as proliferation, senescence, and apoptosis [3,5]. Hydrogen peroxide (H2O2) is non-radical member of reactive oxygen species group, which occurs in large amounts in cell of different organisms including plants [6,7]. H2O2 concentration in cells was shown to vary and is assumed to be 1-700nM [8,9] with cytotoxic values inducing apoptosis over 700nM [8,9]. It should be noted the actual intracellular concentration of H2O2 reached in the steady state incubation is lower than the extracellular value that leads to cell death [8]. Thus, the levels of H2O2 found outside the cell in vitro, which are generally cytotoxic, are significantly elevated compared to the intracellular concentrations of H2O2 that are assumed to be harmful [4]. Concentrations up to 15µM have been found to stimulate cell proliferation, whereas those over 1mM were shown to lead to necrotic cell death. H2O2 is found to be stable in comparison to other members of ROS group, with half-life about milliseconds [6]. Due to its long half-life, it is considered a signaling molecule [10] which is able to influence cellular processes like apoptosis or cell proliferation [6,7]. Hydrogen peroxide is formed by dismutation of superoxide (O2.-), it is also generated by enzymes such as amino acid oxidase, xanthine oxidase and NOX [11,12]. H2O2 can freely pass through cell membranes and directly induce the breaking of phosphodiester bonds [1,13]. H2O2 can react with metals, producing .OH (Fenton reaction) [14]. It is believed that the greatest toxicity of H2O2 and O2.- is achieved during the transition to hydroxyl radicals [14,15,16].
Neutralization of hydrogen peroxide and thus protection against damage is carried out mainly by catalase (CAT) [1,13,17], an antioxidant present in almost all aerobic organisms, through the interaction with glutathione peroxidase (GPX), in which glutathione is converted to its oxidized form GSSG [18,19,20], and by enzymes from the peroxiredoxin family (PRDX), which were used for oxidation by the H2O2 (Figure 1) [21,22,23].
Neutralizing enzymes targeting H2O2 are evolutionarily conserved from sponges to mammals, with the glutathione-linked GPX system being the youngest neutralizing family. CAT and PRDX are old families, well conserved between species, their essential antioxidant functions having led to the conservation of genes throughout the animal kingdom [24]. Catalase exists in three main types: typical catalases (in aerobic organisms), catalase-peroxidases (in fungi, archaea, and bacteria), and manganese catalases (bacteria-specific). Typical catalases are categorized into three subgroups, the third of which encompasses animals, including humans [25,26]. Catalase is commonly found in cells, particularly in peroxisomes (liver cells) and in the cytoplasm (erythrocytes). Besides neutralizing hydrogen peroxide, it also decomposes peroxynitrite and oxidizes nitric oxide to nitrite [20,21]. Glutathione peroxidase functions by using glutathione (GSH) to neutralize ROS. This process relies on the redox cycling of GSH, which is regulated by glutathione reductases and peroxidases. GPX1 is found in the cytosol, nucleus, and mitochondria; GPX2 is located in the cytosol and nucleus; GPX3 is present in the cytosol; and GPX4 is distributed in the nucleus, cytosol, mitochondria, and cell membranes [18,27].
Cells require balanced redox conditions to proper function, maintained by strictly controlled oxidation and reduction processes. For the antioxidant system to function correctly, it is necessary to convert oxidized enzymes back to their reduced state. This function is carried out by glutathione reductase (GSR) which catalyzes the reduction of GSSG to GSH [18] and thioredoxins (TXN) which reduce peroxiredoxins [28]. Peroxiredoxins, thioredoxins and glutathione contain cysteines with thiol groups, which occur in reduced (S-H) or oxidized (S-S) forms. During the reduction of H2O2, peroxiredoxins are oxidized and later reduced by thioredoxins, which are in turn oxidized. To ensure the system works correctly, oxidized thioredoxins must be reduced by thioredoxin reductases (TXNRD), the basic elements of the thioredoxin system, which restore their enzymatic activity [29]. The electrons essential for the reduction of enzymes originate from the constant reduction reactions occur during metabolism [23,29].
Antioxidant action of H2O2 neutralizing enzymes vary among organelles. Melo et al. showed that neutralization systems do not function equally in different cellular locations, e.g., in erythrocytes CAT is more vital for cytoplasmic antioxidant protection than for that of membrane components, when its activity is impaired, PRDX and GPX are transported to the cell membrane, probably to protect against lipid peroxidation [30]. Catalytic activity of main H2O2 antioxidant enzymes also differ. PRDX catalytic activity was proven to compete with GPX in H2O2 neutralization and PRDX reaction rate constant is in range of 107M-1s-1, comparable to catalase which reaction rate constant is in range 107M-1s-1, whereas for GPX1 it was shown to be ~108M-1s-1 [31].
For a better understanding the processes observed in cells, mathematical models are used. They in a simplified way represent the reactions occurring in cells. Computer simulations make possible to track many different variants of cell behavior. Regulatory processes of ROS ensure the proper functioning of cells, and a disturbed balance, called oxidative stress, can lead to cell death or its pathology. Differences in the expression of neutralizing enzymes observed in our previous studies and analyzes [32,33] suggested that it would be important to be able to predict differences in ROS levels for different cell types of different tissue origin. There are multiple models in the literature describing systems related to reactive oxygen and nitrogen species [34,35,36,37]. The existing mathematical models related to the neutralization of ROS focused mainly on the oxidative processes taking place in the mitochondria (see Kembro et.al [28]). Therefore, we created model describing the process of H2O2 neutralization regarding oxidation/reduction of antioxidant enzymes, focused on the differences in neutralization between different types of cells. We conducted series of computer simulations using publicly available expression data of neutralizing enzymes to compare differences of various cell types with special attention to colorectal, lung and breast cancer. Using the created model, we also tried to check whether there are differences in H2O2 neutralization between cell lines of the same origin but differing in expression of neutralizing enzymes. We considered influence of radiation and explored relationships of ROS neutralization and radiosensitivity and radioresistance. In the conducted simulations we focused on neutralization systems with enzymes such as: catalase, peroxiredoxin with thioredoxin and glutathione peroxidase with glutathione and we show that these neutralization systems can differentiate radiosensitive and radioresistant cells among colorectal, lung and breast cancer cell lines.
2. Model Formulation
In our previous research, we found that different cell types exhibit distinct levels of antioxidant enzymes. We concluded that the neutralization process can occur via different leading pathways in those cells, which explains the observed differences in various kinds of ROS levels among these cells. The aim of introduced model is to analyze how the levels of H2O2 are affected by different neutralization systems. We simulated neutralization process and checked whether there are differences, between the H2O2 neutralization systems using the following enzymes: peroxiredoxin (PRDX) with thioredoxin (TXN), glutathione peroxidase (GPX) using glutathione, and catalase (CAT). The first two systems are complex and require several oxidation and reduction reactions, which is why we included these dependencies in the model. To better understand neutralization process we analyzed multiple cell lines from different tissue origin available in Cancer Cell Line Encyclopedia (CCLE) database based on RNA-seq data [38]. The analysis was performed for 1025 cancer cell lines from various tissues and simulated their neutralization of H2O2. Figure 1 presents process of H2O2 neutralization through different pathways: first pathway is PRDX/TXN, second is CAT and third is GPX-GSH pathway.
We aimed to determine if the three neutralization pathways (PRDX/TXN, CAT, and GPX/GSH) are engaged in the neutralization process in all cell types with comparable effectiveness, or if there are specific preferences among different cell lines. We examined this by disabling certain pathways, and one of them remained operational. It is crucial to understand that in living cells, the levels of H2O2 and other ROS fluctuate, and our model simplifies this by representing an average ROS level at a given moment. The dynamic fluctuations of ROS, which are closely related to their behavior, are not accounted for. Instead, we implemented oxidation and reduction processes, which are crucial component of maintaining redox balance in cells. The equations for the mathematical model were implemented in the Matlab Simulink environment, where all simulations of model equations were performed. The version of MATLAB used was R2021a. The created model was used to conduct series of computer simulations.
Values of enzymes concentration in multiple cell lines are hard to obtain due to practical issues therefore the data for the model are sourced from existing literature and represent values obtained from various cell lines. These data were adapted from [34,35,39,40,41,42] and presented in Table 1. Model parameters were obtained from [34] and [35] through linearization of equations presented in those papers in operating point to quantify proper values for equations’ coefficients used in model presented in Table 2. Rate constants (k) show the speed of processes and shows how quickly the process happens. Our model assumes that the reaction parameters remain the same for different cell types, but the expression of neutralizing enzymes varies between cells. The levels of enzymes were estimated on their transcript levels given in publicly available databases (CCLE) [38]. These values were normalized as the ratio of mRNA expression levels in a particular line to those in the HCT116 line. For HCT116, the proportion parameter is 1, indicating that this cell line corresponds to the concentration values found in Table 1, whereas other cell lines exhibit concentrations that vary proportionally according to their expression levels. Due to the fact that we used available expression data of antioxidant genes (which generally but not always correlates with protein levels) not actual protein amount our results of H2O2 level in steady state after neutralization are presented in arbitrary units. The original data presented in the study obtained from the mathematical model are openly available in RepOD repository at [10.18150/ZDFI94/https://doi.org/10.18150/ZDFI94].
2.1. Model Equations
Here we present set of mathematical model equations (1-7) used in article. The model contains the following components: (a) Main equation (equation 1) of H2O2 neutralization by neutralizing enzymes through 3 different neutralization pathways with H2O2 as state variable, (b) the GSH system, encompassing the GPX and GSR, with GSH/GSSG as state variables (equations 2 and 3) and (c) PRDX/TXN system which considers the reduced/oxidized species PRDX and TXN as state variables (both couples linked through relationships) (equations 4-7). In the present model, catalase was also taken into account and appears in equation 1 as additional ROS scavenger.
In set of Equations (1)-(7): [PRDX,PRDXox,TXN,TXNox,GSH,GSSG] represent the concentrations of peroxiredoxin, oxidized peroxiredoxin, thioredoxin, oxidized thioredoxin, glutathione and oxidized glutathione, respectively. We assumed that the total amount of reduced and oxidized forms is constant and typical for the cell. It should be noted that PRDXTOTAL=PRDX+PRDXox, GSHTOTAL= GSH+GSSG, TXNTOTAL=TXN+TXNox. In the implementation, we also assumed that the concentrations of GSR, GPX, TXNRD, CAT are constant values, dependent on the cell type. Moreover, we assumed that the H2O2 influx in cells is approximately constant and is influenced by many factors, e.g., constant influx from mitochondria or peroxisomes. In equation (1) H2O2IN is to reflect this constant H2O2 influx therefore for the implementation we used a step function which was designated as H2O2IN.
3. Results and Discussion
One of the major reactive oxygen species present in all cells is H2O2, which can act as a signaling molecule in intracellular and extracellular signaling. Using the created model, we tried to check whether there are differences in H2O2 neutralization between cell lines in which the expression of neutralizing enzymes is different. Considering the connection between ROS and radiation, we also explored how H2O2 levels might relate to radiosensitivity and radioresistance. Our objective was to assess whether all three neutralization pathways (PRDX/TXN, CAT and GPX/GSH) are equally effective in every cell type or if certain preferences exist. In computer simulations, we used a constant supply of H2O2 to the system, which in a real system can be considered as a constant supply from mitochondria, and then we checked how H2O2 neutralization proceeded by switching off different neutralization systems one by one (such a situation is possible, e.g., in the case of mutation of the enzymes) and for all systems operating correctly. We observed how this mutation influences the level of H2O2 in different types of cells.
We investigated kidney, thyroid, ovary, bone, haematopoietic, breast, large intestine and lung cancer cell lines. The results of H2O2 neutralization mathematical model are demonstrated in Figure 2 which shows that when all systems are working there are slight differences in H2O2 level and we are not able to distinguish any particular pattern, the process of neutralization remains similar in different tissues. When all systems are working neutralization of H2O2 is the least efficient is in haematopoietic and bone tissue and the most efficient in breast and kidney tissue.
Because there are not particular differences in neutralization process when all neutralization pathways are switched on, we wanted to check if there are any differences when some of pathway/s are switched off. Turning off one of the neutralization systems indicated differences among cell lines originating from various tissues, but these differences were only significant for the PRDX/TXN and CAT pathways. The combination of these two systems effectively neutralizes H2O2, particularly in breast and large intestine tissues, while exhibiting the least efficiency in kidney cells (Figure 3). The results for CAT+GSH and PRDX/TXN+GSH were comparable to those of GSH alone, demonstrating that this system is the most effective neutralization pathway in our model, and this is why only this one was included to the Figure 3. Such results are observed due to the high concentration of GSH assumed in our model. GSH is extensively used also in other cellular processes, suggesting that the actual GSH available for GPX/GSH neutralization is probably much lower.
Analysis of cell lines from different tissue types reveals that system with only PRDX/TXN system working is the least efficient in kidney tissue and the most efficient in large intestine and breast tissue. Neutralization pathway of catalase is the least efficient in lung tissue and the most efficient in haematopoietic tissue. The glutathione system is the least efficient in haematopoietic tissue and the most efficient in kidney tissue. There are differences among tissues in neutralizing H2O2 observed for different pathways of neutralization.
3.1. H2O2 Neutralization Pathways and Their Connection to Radioresistance
Analyses show the differences among tissues according to neutralization pathway. Consequently, we aimed to investigate whether there are variations among cell lines derived from the same tissue origin. The analyses were performed on various cell lines from a single tissue type, based on the characterizations documented in the literature. We conduced series of analyses and selected lung, breast, and colorectal cancer cell lines based on their radiosensitivity. Indeed, there is difference in radiosensitivity depending on neutralization systems observed in cell lines of these tissues. In colorectal cancer there is difference between radiosensitive and radioresistant cell lines; cell could be distinguished due to GPX-GSH neutralization system, as radioresistant cell lines are more efficient in neutralizing H2O2. We also observed major differences among kidney cell lines (data not shown), but this type of cancer is not well characterized in literature. Some of analyzed cell lines with less effective peroxiredoxin system are radioresistant, but due to low data availability the analyzes could not be done. Figure 4 shows the results with all three systems of neutralization working.
Lung, breast and colorectal cancers are the most frequently diagnosed cancers. Here we show simulation results of H2O2 neutralization for cell lines of this tissue origins. They vary due to its potential to neutralize H2O2 by H2O2 neutralization enzymes and show differences between radioresistant and radiosensitive cell lines presented in Table 3.
Fourteen lung cell lines were classified as radiosensitive (RS) and radioresistant (RR) according to literature [43,44,45,46,47,48,49,50,51,52]. Sixteen breast cancer cell lines were classified as RS and RR according to literature [53,54,55,56,57,58,59,60,61,62,63,64,65]. Twelve radioresistant colorectal cancer cell lines were classified as RS and RR according to literature [66,67,68,69,70]. Contrary to other radioresistant colorectal cancer cell lines SW48 [69,70] seems to be radiosensitive with efficient neutralization of H2O2 by GPX/GSH system. The results of H2O2 neutralization in these cells are shown on Figure 5.
Computer simulation results suggest significant role of PRDX/TXN and PGX/GSH systems in functioning of the cells. In our simulations cell lines with the less effective H2O2 neutralization through PRDX/TXN system (the highest H2O2 amount in steady state after neutralization) correlated with radioresistance of these cells. Significant differences were observed for lung and breast cancer cell lines, in colorectal cancer cell lines PRDX/TXN system is also less efficient in radioresistant cells, but this observation is not statistically significant.
Peroxiredoxins (thioredoxin peroxidases), are major thiol-targeting enzymes that represent up to 1% of the protein content in some organisms. Their primary role is to serve as antioxidants for H2O2 and ONOO-, effectively reducing cellular peroxides by nearly 90% [21]. Six peroxiredoxins can be distinguished: PRDX1, PRDX2 and PRDX6 located in the cytosol, PRDX3 located in mitochondria, PRDX4 located in the extracellular space and PRDX5 located in mitochondria and peroxisomes [23]. Results from [65] indicated that higher PRDX1 and PRDX2 mRNA levels were linked to better survival in lung cancer, while PRDX5 and PRDX6 were associated with worse outcomes [72]. H2O2 added to cells can block antioxidant enzymes through microRNA action for specific window of H2O2 doses [73]. Such response to oxidants exposure is rather counterintuitive. However, H2O2 acts as a signaling molecule, and the observed changes may be elements of the establishment of H2O2 levels that are specific and optimal for a given cell type. Indeed, H2O2 acts as a promoter for cell cycle progression by oxidizing specific thiol proteins [74]. This group includes PRDXs that serve as signaling mediators, enabling the local accumulation of H2O2 through the inactivation of their peroxidase function [74]. Rising H₂O₂ levels can overoxidize PRDXs, limiting their scavenging ability [80]. The concentrations of intracellular H2O2 increase as the cell cycle progresses from G1 to mitosis [74]. Cells are the most radiosensitive in G2/M phase of cell cycle, however G2/M cell cycle arrest were shown to correlate with radioresistance of cells [75,76]. Our findings of increased H₂O₂ after PRDX/TXN neutralization need further study, as PRDXs may prevent premature cell cycle progression under oxidative stress from UV or IR during interphase [74] and knockdown of PRDX2 sensitized glioma cells to IR and its decrease lowered GSH and GSR activity, increased cell cycle doubling time and reduced clonogenic cell survival after IR and H2O2 [77].
Neutralization by catalase is comparable in lung and breast cancer cells and less effective in radioresistant colorectal cancer cell lines, however it is not statistically significant. D-penicillamine (DPEN) with copper can generate H2O2 in cancer cells and induce clonogenic cell killing while catalase inhibited this effect [78]. H₂O₂ induced apoptosis in leukemia KG1 cells, likely via catalase deactivation, ROS accumulation, ATP depletion, caspase-3 activation, and altered Bcl-2 family expression [79]. According to the findings in [80], different concentrations of H2O2 can affect both cell growth and programmed cell death. At 50–200 μM, growth of MCF-7 breast cancer cells was inhibited; 1–10 μM stimulated hepatoma 7721 cell growth, and 10 μM increased HT-29 colon cancer cell proliferation. A high dose (1000 μM) induced apoptosis, while 100 μM H₂O₂ reduced migration of H460 lung cancer cells [80].
We also observed the difference for GPX/GSH system of neutralization (similar pattern like for all enzymes active, Figure 4). In colorectal cancer radioresistant cells are significantly more effective in H2O2 neutralization than radiosensitive cells, similarly on average in breast cancer cells, however this difference is not statistically significant. In lung cancer neutralization by GPX/GSH pathway is comparable. In research of Zhang et al. they showed that radioresistant cell lines has lower level of ROS and sensitization of LS180 cells with GNP-PEG and GNP-PEG-R8 increased ROS and induced apoptosis. In this studies ROS were marked with dye DCFH-DA which detects several radicals, however it was first used for detection of H2O2 [81,82] so observed changes may reflect mainly H2O2 levels what corresponds with our findings. In [83] similarly to our simulation results, they showed that lower ROS levels in colorectal cancer are connected to radioresistance and higher levels are connected to radiosensitivity [83]. In [84] researchers demonstrated that radioresistant cell lines, developed through repeated irradiation, had lower ROS levels and increased expression of cell viability genes compared to wild-type cells [84]. GSH significantly influences cell cycle progression, with its levels changing during the cycle; the highest concentrations of GSH are detected in the G2 and M phases, intermediate levels are noted in the S phase, and the lowest levels are seen in the G1 phase of the cell cycle. [85]. Analogous to colorectal cancer, cancer stem cells (CSCs) overexpress genes involved in GSH synthesis. Depletion of these genes resulted in elevation of ROS levels and reduced the colony formation in CSCs [86]. Depletion of GSH itself enhanced radiosensitivity of CSCs. Emmink et al. found that GPX2 downregulation increased ROS, increased sensitivity to H₂O₂-induced apoptosis, and reduced colon cancer cell growth and metastasis, suggesting ROS elevation could improve chemotherapy response [87]. The same pattern regarding ROS was observed in head and neck cancers, MitoTam treatment raised ROS levels and increased cell death, even in radioresistant UT-SCC-5 cells [88]. Park et al. showed that H₂O₂ inhibits lung cancer cell growth by inducing cell death and G1-phase arrest in Calu-6 and A549 cells, but not in HeLa cells; the effect varied by cell type and H₂O₂ concentration [89]. It appears that H2O2 and its neutralization enzymes levels fluctuate regularly and are directly related to the cell cycle, which may impact the radioresistance of particular cells.
Cancer cells produce higher levels of reactive oxygen species (ROS) due to an increased metabolic rate, genetic mutations, and hypoxia. Studies demonstrated that cancer cells can adapt to elevated ROS levels by activating antioxidant pathways, which enhances their ability to neutralize ROS [90]. A reduced level of ROS in tumor cells correlates with enhanced radioresistance [86]. However, H2O2 is used in therapy to sensitize radioresistant cells. Good sensitization effects were observed for melanoma [91] and for cervical, liver and breast cancer [92]. Panieri et al. showed that resistant NSCLC cells can be sensitized by high H₂O₂ levels (48 μM), causing DNA damage and ATP depletion via a caspase-independent pathway, or by lower levels (6.5 μM), which inhibit glycolysis and ATP recovery [80]. Antioxidant enzyme expression differs across various cell types, and the neutralization process does not contribute equally in all cell types. As a result, different levels of reactive oxygen species (ROS) are observed in cells, which may relate to the differing effects of H2O2 at various concentrations, particularly on apoptosis and cell proliferation.
Data from our model analyzing cell lines of various tissue origins demonstrate that neutralization systems can differentiate cells both within the same tissue origin and across different origins. This capability is especially relevant due to the significant role of ROS generated during anticancer therapies involving ionizing radiation which induces ROS, leading to changes in cells. In irradiated cells there are observed changes in gene expression, inhibition of proliferation, and death rate. However, some cells do not respond to treatment and those that avoid death are called radioresistant [93]. The effectiveness of radiation therapy in curing human tumors varies greatly. This variability in treatment has been linked to several factors, including the presence of hypoxic cells, inadequate reoxygenation during therapy, low intrinsic radiosensitivity, and the potential for repairing lethal damage [94]. Cells that are mature, differentiated, and not actively dividing (e.g., neurons) are more radioresistant. A cell that is radiosensitive would be more prone to die after exposure to ionizing radiation than a radioresistant one [95].
Findings from the simulations imply that the disparities in radiosensitivity across various cancer cell types could be related to their capacity to neutralize H2O2. Analysis of colorectal, lung and breast cancer cell lines showed that radiosensitive cells have different levels of H2O2 than radioresistant cell lines, which may be due to the decreased effectiveness of neutralizing enzymes. Previous analyzes [32,33] together with data collected from the model confirm importance of H2O2 and suggest that it might be key molecule to understand radioresistance in cancer cells. However, the exact role of H2O2 in this process remain to be elucidated.
Author Contributions
Conceptualization, S.C. and J.RW.; methodology, S.C., K.M. and K.F.; validation, K.F. and K.M.; formal analysis, S.C.; investigation, S.C.; resources, S.C.; data curation, S.C.; writing—original draft preparation, S.C. and J.RW.; visualization, S.C. and J.RW.; supervision, J.RW. and KF.; project administration, S.C. and K.F.; funding acquisition, S.C. and K.F. All authors have read and agreed to the published version of the manuscript.
Funding
This research was funded by the National Science Centre, Poland, grants number 2019/35/N/ST6/04281 to S.C. and K.F.
Data Availability Statement
The original data presented in the study are openly available in RepOD repository at [10.18150/ZDFI94/https://doi.org/10.18150/ZDFI94].
Acknowledgments
Will be added
Conflicts of Interest
The authors declare no conflict of interest.
References
- Sarsour, E.H.; Kumar, M.G.; Chaudhuri, L.; Kalen, A.L.; Goswami, P.C. Redox control of the cell cycle in health and disease. Antioxidants and Redox Signaling, 2009, 11, 2985–3011. [Google Scholar] [CrossRef]
- Zhang, J.; Xing, D.; Gao, X. Low-power laser irradiation activates Src tyrosine kinase through reactive oxygen species-mediated signaling pathway. Journal of Cellular Physiology, 2008, 217, 518–528. [Google Scholar] [CrossRef]
- Feinendegen, L.; Pollycove, M.; Sondhaus, C.A. Responses to Low Doses of Ionizing Radiation in Biological Systems. Nonlinearity in Biology, Toxicology, Medicine, 2004, 2, 154014204905074. [Google Scholar] [CrossRef] [PubMed]
- Trachootham, D.; Lu, W.; Ogasawara, M.A.; Valle, N.R.D.; Huang, P. Redox regulation of cell survival. Antioxidants and Redox Signaling, 2008, 10, 1343–1374. [Google Scholar] [CrossRef] [PubMed]
- Thannickal, V.J.; Fanburg, B.L. Reactive oxygen species in cell signaling. American Journal of Physiology - Lung Cellular and Molecular Physiology, 2000, 279, 23–26. [Google Scholar] [CrossRef] [PubMed]
- Bienert, G.P.; Schjoerring, J.K.; Jahn, T.P. Membrane transport of hydrogen peroxide. Biochimica et Biophysica Acta (BBA) - Biomembranes, 2006, 1758, 994–1003. [Google Scholar] [CrossRef]
- Stone, J.R.; Yang, S.; Peroxide, H.; Signaling, R. ; vol.; no.; pp. 2006. [Google Scholar] [CrossRef]
- Antunes, F.; Cadenas, E. Cellular titration of apoptosis with steady state concentrations of H2O2: submicromolar levels of H2O2 induce apoptosis through fenton chemistry independent of the cellular thiol state. Free Radical Biology and Medicine, 2001, 30, 1008–1018. [Google Scholar] [CrossRef]
- Gülden, M.; Jess, A.; Kammann, J.; Maser, E.; Seibert, H. Cytotoxic potency of H2O2 in cell cultures: impact of cell concentration and exposure time. Free Radic Biol Med, 2010, 49, 1298–1305. [Google Scholar] [CrossRef]
- Burdon, R. Superoxide and hydrogen peroxide in relation to mammalian cell proliferation. Free radical biology & medicine, 1995, 18, 775–794. [Google Scholar] [CrossRef]
- Lee, J.; Koo, N.; Min, D.B.; Species, R.O. ; Aging; Nutraceuticals. A., Comprehensive Reviews in Food Science and Food Safety, 2004, 3, 21–33. [Google Scholar] [CrossRef]
- Matsunaga, S.; et al. Hypoxia stabilizes the H2O2-producing oxidase Nox4 in cardiomyocytes via suppressing autophagy-related lysosomal degradation. Genes to Cells, 2024, 29, 63–72. [Google Scholar] [CrossRef]
- Radi, R.; Cassina, A.; Hodara, R.; Quijano, C.; Castro, L. Peroxynitrite reactions and formation in mitochondria. Free radical biology & medicine, 2002, 33, 1451–1464. [Google Scholar] [CrossRef]
- Henle, E.; Linn, S. ; Formation; prevention, and repair of DNA damage by iron/hydrogen peroxide. The Journal of biological chemistry, 1997, 272, 19095–19098. [Google Scholar] [CrossRef] [PubMed]
- Florence, T.M. The production of hydroxyl radical from hydrogen peroxide. Journal of Inorganic Biochemistry, 1984, 22, 221–230. [Google Scholar] [CrossRef]
- Puppo, A.; Halliwellt, B. Formation of hydroxyl radicals from hydrogen peroxide in the presence of iron Is haemoglobin a biological Fenton reagent? Biochem. J, 1988, 249, 185–190. [Google Scholar] [CrossRef]
- Nandi, A.; Yan, L.-J.; Jana, C.K.; Das, N. Role of Catalase in Oxidative Stress- and Age-Associated Degenerative Diseases. Oxidative Medicine and Cellular Longevity, 2019. [Google Scholar] [CrossRef]
- Meister, A. Glutathione metabolism and its selective modification. Journal of Biological Chemistry, 1988, 263, 17205–17208. [Google Scholar] [CrossRef]
- Shelly, C.L. Regulation of glutathione synthesis. Molecular Aspects of Medicine, 2009, 30, 42–59. [Google Scholar] [CrossRef]
- Adamiec, M.; Skonieczna, M. UV radiation in HCT 116 cells influences intracellular H2O2 and glutathione levels, antioxidant expression, and protein glutathionylation. Acta Biochimica Polonica, 2019, 66, 605–610. [Google Scholar] [CrossRef]
- Immenschuh, S.; Baumgart-Vogt, E. ; Peroxiredoxins; oxidative stress; cell proliferation. Antioxidants and Redox Signaling, 2005, 7, 768–777. [Google Scholar] [CrossRef]
- Poynton, R.A.; Hampton, M.B. Peroxiredoxins as biomarkers of oxidative stress. Biochimica et Biophysica Acta - General Subjects, 2014, 1840, 906–912. [Google Scholar] [CrossRef]
- Sue, G.R.; Ho, Z.C.; Kim, K. Peroxiredoxins: A historical overview and speculative preview of novel mechanisms and emerging concepts in cell signaling. Free Radical Biology and Medicine, 2005, 38, 1543–1552. [Google Scholar] [CrossRef]
- Hewitt, O.H.; Degnan, S.M. Antioxidant enzymes that target hydrogen peroxide are conserved across the animal kingdom, from sponges to mammals. Scientific Reports, 2023, 13, 2510. [Google Scholar] [CrossRef] [PubMed]
- Glorieux, C.; Calderon, P.B. ; Catalase, a remarkable enzyme: Targeting the oldest antioxidant enzyme to find a new cancer treatment approach. Biological Chemistry, 2017, 398, 1095–1108. [Google Scholar] [CrossRef] [PubMed]
- Bai, J.; Cederbaum, A.I. Mitochondrial catalase and oxidative injury. NeuroSignals, 2001, 10, 189–199. [Google Scholar] [CrossRef]
- Margis, R.; Dunand, C.; Teixeira, F.K.; Margis-Pinheiro, M. Glutathione peroxidase family – an evolutionary overview. The FEBS Journal, 2008, 275, 3959–3970. [Google Scholar] [CrossRef]
- Powis, G.; Montfort, W.R. Properties and biological activities of thioredoxins. Annual review of biophysics and biomolecular structure, 2001, 30, 421–455. [Google Scholar] [CrossRef]
- Arnér, E.S.J.; Holmgren, A. Physiological functions of thioredoxin and thioredoxin reductase. European Journal of Biochemistry, 2000, 267, 6102–6109. [Google Scholar] [CrossRef]
- Melo, D.; Coimbra, S.; Rocha, S.; Santos-Silva, A. ; Inhibition of erythrocyte’s catalase, glutathione peroxidase or peroxiredoxin 2 – Impact on cytosol and membrane. Archives of Biochemistry and Biophysics, 2023, 739, 109569. [Google Scholar] [CrossRef]
- Mitozo, P.A.; et al. A study of the relative importance of the peroxiredoxin-, catalase-, and glutathione-dependent systems in neural peroxide metabolism. Free Radical Biology and Medicine, 2011, 51, 69–77. [Google Scholar] [CrossRef]
- Ciesielska, S.; Bil, P.; Gajda, K.; Poterala-Hejmo, A.; Hudy, D.; Rzeszowska-Wolny, J. Cell type-specific differences in redox regulation and proliferation after low UVA doses. PLOS ONE, 2019, 14, e0205215. [Google Scholar] [CrossRef]
- Bil, P.; Ciesielska, S.; Jaksik, R.; Rzeszowska-Wolny, J. Circuits Regulating Superoxide and Nitric Oxide Production and Neutralization in Different Cell Types: Expression of Participating Genes and Changes Induced by Ionizing Radiation. Antioxidants, 2020, 9, 701. [Google Scholar] [CrossRef]
- Aon, M.A.; et al. Glutathione/thioredoxin systems modulate mitochondrial H2O2 emission: An experimental-computational study. The Journal of General Physiology, 2012, 139, 479. [Google Scholar] [CrossRef]
- Cortassa, S.; Aon, M.A.; Winslow, R.L.; O’Rourke, B. A Mitochondrial Oscillator Dependent on Reactive Oxygen Species. Biophysical Journal, 2004, 87, 2060–2073. [Google Scholar] [CrossRef]
- Kembro, J.M.; Aon, M.A.; Winslow, R.L.; O’Rourke, B.; Cortassa, S.; Energetics, I.M. , Redox and ROS Metabolic Networks: A Two-Compartment Model. Biophysical Journal, 2013, 104, 332–343. [Google Scholar] [CrossRef] [PubMed]
- Ng, C.F.; Schafer, F.Q.; Buettner, G.R.; Rodgers, V.G.J. The rate of cellular hydrogen peroxide removal shows dependency on GSH: Mathematical insight into in vivo H2O2 and GPx concentrations. Free Radical Research, 2007, 41, 1201. [Google Scholar] [CrossRef] [PubMed]
- Ghandi, M.; et al. Next-generation characterization of the Cancer Cell Line Encyclopedia. Nature, 2019, 569, 503–508. [Google Scholar] [CrossRef]
- Ambarsari, L.; Lindawati, E. ; Isolation, Fractionation and Characterization of Catalase from Neurospora crassa (InaCC F226)’. [CrossRef]
- Makino, N.; Mochizuki, Y.; Bannai, S.; Sugita, Y. Kinetic Studies on the Removal of Extracellular Hydrogen Peroxide by Cultured Fibroblasts. The Journal of Biological Chemistry, 1994, 269, 1020–1025. [Google Scholar] [CrossRef] [PubMed]
- Karpenko, I.L.; Valuev-Elliston, V.T.; Ivanova, O.N.; Smirnova, O.A.; Ivanov, A.V. Peroxiredoxins-The Underrated Actors during Virus-Induced Oxidative Stress. Antioxidants (Basel, Switzerland), 2021, 10, 6. [Google Scholar] [CrossRef]
- Manta, B.; Hugo, M.; Ortiz, C.; Ferrer-Sueta, G.; Trujillo, M.; Denicola, A. The peroxidase and peroxynitrite reductase activity of human erythrocyte peroxiredoxin 2. Archives of Biochemistry and Biophysics, 2009, 484, 146–154. [Google Scholar] [CrossRef]
- Yang, H.J.; Kim, N.; Seong, K.M.; Youn, H.; Youn, B. Investigation of Radiation-induced Transcriptome Profile of Radioresistant Non-small Cell Lung Cancer A549 Cells Using RNA-seq. PLOS ONE, 2013, 8, e59319. [Google Scholar] [CrossRef]
- Amornwichet, N.; et al. The EGFR mutation status affects the relative biological effectiveness of carbon-ion beams in non-small cell lung carcinoma cells. Sci Rep, 2015, 5, 11305. [Google Scholar] [CrossRef] [PubMed]
- Das, A.K.; Bell, M.H.; Nirodi, C.S.; Story, M.D.; Minna, J.D. Radiogenomics- predicting tumor responses to radiotherapy in lung cancer. Semin Radiat Oncol, 2010, 20, 149–155. [Google Scholar] [CrossRef] [PubMed]
- Karagounis, I.V.; et al. Repression of the autophagic response sensitises lung cancer cells to radiation and chemotherapy. Br J Cancer, 2016, 115, 312–321. [Google Scholar] [CrossRef] [PubMed]
- Schilling, D.; Bayer, C.; Li, W.; Molls, M.; Vaupel, P.; Multhoff, G. Radiosensitization of Normoxic and Hypoxic H1339 Lung Tumor Cells by Heat Shock Protein 90 Inhibition Is Independent of Hypoxia Inducible Factor-1α. PLoS One, 2012, 7, e31110. [Google Scholar] [CrossRef]
- Kang, J.; Kim, W.; Kwon, T.; Youn, H.; Kim, J.S.; Youn, B. Plasminogen activator inhibitor-1 enhances radioresistance and aggressiveness of non-small cell lung cancer cells. Oncotarget, 2016, 7, 23961–23974. [Google Scholar] [CrossRef]
- Liberal, F.D.C.G.; McMahon, S.J. Characterization of Intrinsic Radiation Sensitivity in a Diverse Panel of Normal, Cancerous and CRISPR-Modified Cell Lines. International Journal of Molecular Sciences, 2023, 24, 9. [Google Scholar] [CrossRef]
- Lüdeking, M.; et al. Efficiency of moderately hypofractionated radiotherapy in NSCLC cell model. Front Oncol, 2024, 14, 1293745. [Google Scholar] [CrossRef]
- Carmichael, J.; et al. Radiation sensitivity of human lung cancer cell lines. Eur J Cancer Clin Oncol, 1989, 25, 527–534. [Google Scholar] [CrossRef]
- Yun, H.S.; et al. Radiotherapy diagnostic biomarkers in radioresistant human H460 lung cancer stem-like cells. Cancer Biol Ther, 2016, 17, 208–218. [Google Scholar] [CrossRef]
- Mahmoud, A.S.; Casciati, A.; Bakar, Z.A.; Hamzah, H.; Ahmad, T.A.T.; Noor, M.H.M. The Detection of DNA Damage Response in MCF7 and MDA-MB-231 Breast Cancer Cell Lines after X-ray Exposure. Genome Integrity, 2023, 14, 20220001. [Google Scholar] [CrossRef]
- Bristol, M.L.; et al. Dual functions of autophagy in the response of breast tumor cells to radiation. Autophagy, 2012, 8, 739–753. [Google Scholar] [CrossRef] [PubMed]
- Bruss, C.; et al. Neoadjuvant radiotherapy in ER+, HER2+, and triple-negative -specific breast cancer based humanized tumor mice enhances anti-PD-L1 treatment efficacy. Front Immunol, 2024, 15, 1355130. [Google Scholar] [CrossRef]
- Kwon, Y.-S.; et al. Overcoming radioresistance of breast cancer cells with MAP4K4 inhibitors. Sci Rep, 2024, 14, 7410. [Google Scholar] [CrossRef]
- Gray, M.; et al. Development and characterisation of acquired radioresistant breast cancer cell lines. Radiation Oncology, 2019, 14, 64. [Google Scholar] [CrossRef]
- Lafontaine, J.; Boisvert, J.-S.; Glory, A.; Coulombe, S.; Wong, P. Synergy between Non-Thermal Plasma with Radiation Therapy and Olaparib in a Panel of Breast Cancer Cell Lines. Cancers, 2020, 12, 2. [Google Scholar] [CrossRef]
- Anastasov, N.; et al. Radiation resistance due to high expression of miR-21 and G2/M checkpoint arrest in breast cancer cells. Radiation Oncology (London, England), 2012, 7, 206. [Google Scholar] [CrossRef]
- Aschenbrenner, B.; et al. Simvastatin Is Effective in Killing the Radioresistant Breast Carcinoma Cells. Radiol Oncol, 2021, 55, 305–316. [Google Scholar] [CrossRef]
- Jha, S.; Rajagopalan, D.; Hora, S.; Jadhav, S.P. Breast Cancer: From Transcriptional Control to Clinical Outcome. in Breast Cancer - From Biology to Medicine, P. V. Pham, Ed. 2017. [Google Scholar] [CrossRef]
- ‘HCC70: A model of triple negative breast cancer’. Accessed: 22, 2025. [Online]. Available: https://oncology.labcorp.
- Steffen, A.-C.; Göstring, L.; Tolmachev, V.; Palm, S.; Stenerlöw, B.; Carlsson, J. Differences in radiosensitivity between three HER2 overexpressing cell lines. Eur J Nucl Med Mol Imaging, 2008, 35, 1179–1191. [Google Scholar] [CrossRef]
- Kowalska, A.; Nasonova, E.; Kutsalo, P.; Czerski, K. Chromosomal radiosensitivity of human breast carcinoma cells and blood lymphocytes following photon and proton exposures. Radiat Environ Biophys, 2023, 62, 151–160. [Google Scholar] [CrossRef]
- Schröder-Heurich, B.; et al. Functional deficiency of NBN, the Nijmegen breakage syndrome protein, in a p.R215W mutant breast cancer cell line. BMC Cancer, 2014, 14, 434. [Google Scholar] [CrossRef]
- Kobunai, T.; Watanabe, T.; Fukusato, T. ; REG4; NEIL2, and BIRC5 Gene Expression Correlates with Gamma-radiation Sensitivity in Patients with Rectal Cancer Receiving Radiotherapy. Anticancer Research, 2011, 31, 4147. [Google Scholar]
- Guardamagna, I.; Lonati, L.; Savio, M.; Stivala, L.A.; Ottolenghi, A.; Baiocco, G. An Integrated Analysis of the Response of Colorectal Adenocarcinoma Caco-2 Cells to X-Ray Exposure. Front Oncol, 2021, 11, 688919. [Google Scholar] [CrossRef]
- Morini, J.; Babini, G.; Barbieri, S.; Baiocco, G.; Ottolenghi, A. The Interplay between Radioresistant Caco-2 Cells and the Immune System Increases Epithelial Layer Permeability and Alters Signaling Protein Spectrum. Front Immunol, 2017, 8, 223. [Google Scholar] [CrossRef]
- Dunne, A.L.; Price, M.E.; Mothersill, C.; McKeown, S.R.; Robson, T.; Hirst, D.G. Relationship between clonogenic radiosensitivity, radiation-induced apoptosis and DNA damage/repair in human colon cancer cells. Br J Cancer, 2003, 89, 2277–2283. [Google Scholar] [CrossRef] [PubMed]
- Rödel, C.; Haas, J.; Groth, A.; Grabenbauer, G.G.; Sauer, R.; Rödel, F. Spontaneous and radiation-induced apoptosis in colorectal carcinoma cells with different intrinsic radiosensitivities: Survivin as a radioresistance factor. International Journal of Radiation Oncology, Biology, Physics, 2003, 55, 1341–1347. [Google Scholar] [CrossRef]
- Clifford, R.E.; et al. Targeting Acid Ceramidase to Improve the Radiosensitivity of Rectal Cancer. Cells, 2020, 9, 2693. [Google Scholar] [CrossRef] [PubMed]
- Chen, L. ; Huang,Chunli; Yang,Xiaojun; Zhang,Qiuqin; Chen, ‘Prognostic roles of mRNA expression of peroxiredoxins in lung cancer. OncoTargets and Therapy, 2018, 11, 8381–8388. [Google Scholar] [CrossRef] [PubMed]
- Ciesielska, S.; Slezak-Prochazka, I.; Bil, P.; Rzeszowska-Wolny, J. Micro RNAs in Regulation of Cellular Redox Homeostasis. International Journal of Molecular Sciences, 2021, 22, 6022. [Google Scholar] [CrossRef]
- Heo, S.; Kim, S.; Kang, D. The Role of Hydrogen Peroxide and Peroxiredoxins throughout the Cell Cycle. Antioxidants (Basel), 2020, 9, 280. [Google Scholar] [CrossRef]
- Liu, C.; Nie, J.; Wang, R.; Mao, W. The Cell Cycle G2/M Block Is an Indicator of Cellular Radiosensitivity. Dose-Response, 2019, 17, 4. [Google Scholar] [CrossRef]
- Tamamoto, T.; et al. Correlation between γ-ray-induced G2 arrest and radioresistance in two human cancer cells. International Journal of Radiation Oncology*Biology*Physics, 1999, 44, 905–909. [Google Scholar] [CrossRef]
- Smith-Pearson, P.S.; Kooshki, M.; Spitz, D.R.; Poole, L.B.; Zhao, W.; Robbins, M.E. Decreasing peroxiredoxin II expression decreases glutathione, alters cell cycle distribution, and sensitizes glioma cells to ionizing radiation and H2O2. Free Radic Biol Med, 2008, 45, 1178–1189. [Google Scholar] [CrossRef]
- Sciegienka, S.J.; et al. D-penicillamine combined with inhibitors of hydroperoxide metabolism enhances lung and breast cancer cell responses to radiation and carboplatin via H2O2-mediated oxidative stress. Free Radical Biology and Medicine, 2017, 108, 354–361. [Google Scholar] [CrossRef]
- Kohshour, M.O.; Najafi, L.; Heidari, M.; Sharaf, M.G. Antiproliferative Effect of H2O2 against Human Acute Myelogenous Leukemia KG1 Cell Line. Journal of Acupuncture and Meridian Studies, 2013, 6, 134–141. [Google Scholar] [CrossRef] [PubMed]
- Vilema-Enríquez, G.; Arroyo, A.; Grijalva, M.; Amador-Zafra, R.I.; Camacho, J. Molecular and Cellular Effects of Hydrogen Peroxide on Human Lung Cancer Cells: Potential Therapeutic Implications. Oxidative Medicine and Cellular Longevity, 2016, 2016, 1908164. [Google Scholar] [CrossRef] [PubMed]
- Ubezio, P.; Civoli, F. Flow cytometric detection of hydrogen peroxide production induced by doxorubicin in cancer cells. Free radical biology & medicine, 1994, 16, 509–516. [Google Scholar] [CrossRef]
- Arnold, R.; et al. Hydrogen peroxide mediates the cell growth and transformation caused by the mitogenic oxidase Nox1. Proceedings of the National Academy of Sciences of the United States of America, 2001, 98, 5550–5555. [Google Scholar] [CrossRef]
- Zhang, X.; Wang, H.; Coulter, J.A.; Yang, R. Octaarginine-modified gold nanoparticles enhance the radiosensitivity of human colorectal cancer cell line LS180 to megavoltage radiation. Int J Nanomedicine, 2018, 13, 3541–3552. [Google Scholar] [CrossRef]
- Nguyen, L.; et al. Impact of DNA repair and reactive oxygen species levels on radioresistance in pancreatic cancer. Radiotherapy and Oncology, 2021, 159, pp. [Google Scholar] [CrossRef]
- Conour, J.E.; Graham, W.V.; Gaskins, H.R. A combined in vitro/bioinformatic investigation of redox regulatory mechanisms governing cell cycle progression. Physiol Genomics, 2004, 18, 196–205. [Google Scholar] [CrossRef]
- Diehn, M.; et al. Association of Reactive Oxygen Species Levels and Radioresistance in Cancer Stem Cells. Nature, 2009, 458, 780–783. [Google Scholar] [CrossRef]
- Emmink, B.L.; et al. GPx2 Suppression of H2O2 Stress Links the Formation of Differentiated Tumor Mass to Metastatic Capacity in Colorectal Cancer. Cancer Research, 2014, 74, 6717–6730. [Google Scholar] [CrossRef] [PubMed]
- Reinema, F.V.; et al. MitoTam induces ferroptosis and increases radiosensitivity in head and neck cancer cells. Radiother Oncol, 2024, 200, 110503. [Google Scholar] [CrossRef] [PubMed]
- Park, W.H. Hydrogen peroxide inhibits the growth of lung cancer cells via the induction of cell death and G1-phase arrest. Oncology Reports. 2018. 40, 1787–1794. [CrossRef]
- Nakamura, H.; Takada, K. Reactive oxygen species in cancer: Current findings and future directions. Cancer Sci, 2021, 112, 3945–3952. [Google Scholar] [CrossRef]
- Fang, Y.; Moore, B.; Bai, Q.; Cook, K. Hydrogen Peroxide Enhances Radiation-induced Apoptosis and Inhibition of Melanoma Cell Proliferation | Request PDF. Anticancer Research, 2013, 33, 1799–1807. [Google Scholar]
- Hu, R.; et al. Radiosensitization using hydrogen peroxide in patients with cervical cancer. Molecular and Clinical Oncology, 2021, 15, 1–7. [Google Scholar] [CrossRef]
- Busato, F.; Khouzai, B.E.; Mognato, M. Biological Mechanisms to Reduce Radioresistance and Increase the Efficacy of Radiotherapy: State of the Art. International Journal of Molecular Sciences 2022, 2022, 23. [Google Scholar] [CrossRef]
- Guichard, M.; Dertinger, H.; Malaise, E.P. Radiosensitivity of Four Human Tumor Xenografts. Influence of Hypoxia and Cell-Cell Contact. Radiation Research, 1983, 95, 602. [Google Scholar] [CrossRef]
- Bolus, N.E. Basic Review of Radiation Biology and Terminology. Journal of Nuclear Medicine Technology, 2017, 45, 259–264. [Google Scholar] [CrossRef]
Figure 1.
H2O2 neutralization to water by enzymes: peroxiredoxin (PRDX) with thioredoxin (TXN), catalase (CAT) and glutathione peroxidase (GPX) with glutathione (GSH). PRDX in reduced form is oxidized (PRDXox), TXN is used for re-reduction, which is then oxidized (TXNox) and then reduced again by thioredoxin reductase (TXNRD). In the case of GPX, GSH is used for reduction, which is oxidized to GSSG and then reduced by glutathione reductase (GSR).
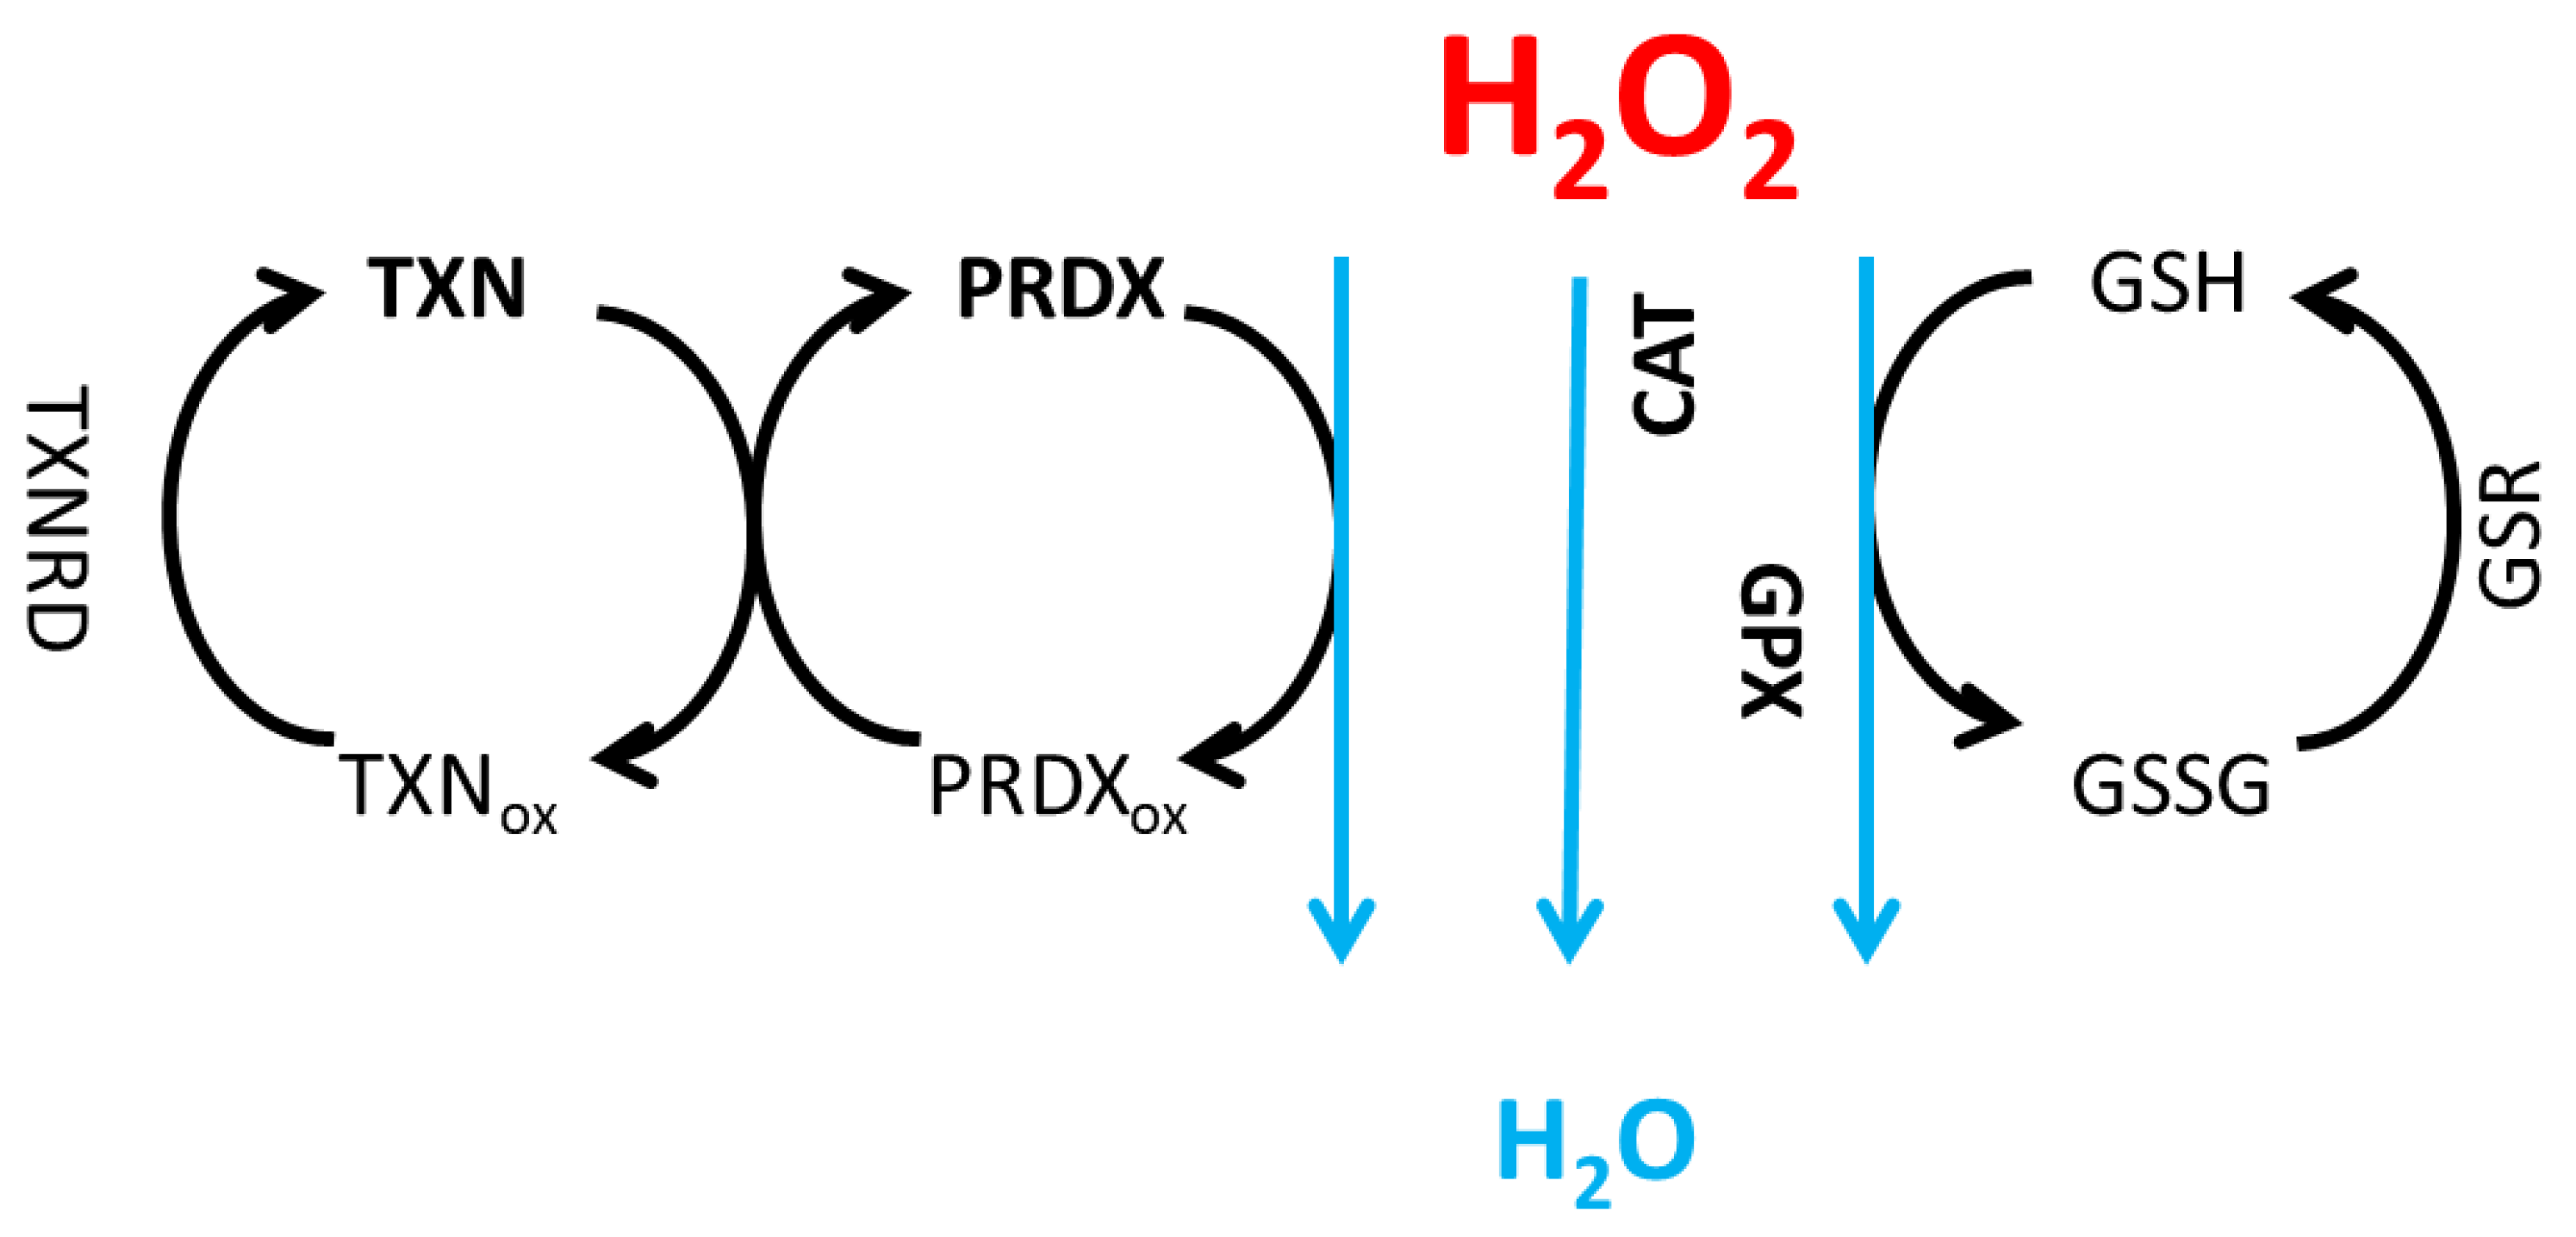
Figure 2.
Computer simulations of H2O2 levels in cell lines of different tissue origin obtained with assumptions that all systems of neutralization are active. The results present average values obtained for different cell lines of the same origin ±SD.
Figure 2.
Computer simulations of H2O2 levels in cell lines of different tissue origin obtained with assumptions that all systems of neutralization are active. The results present average values obtained for different cell lines of the same origin ±SD.
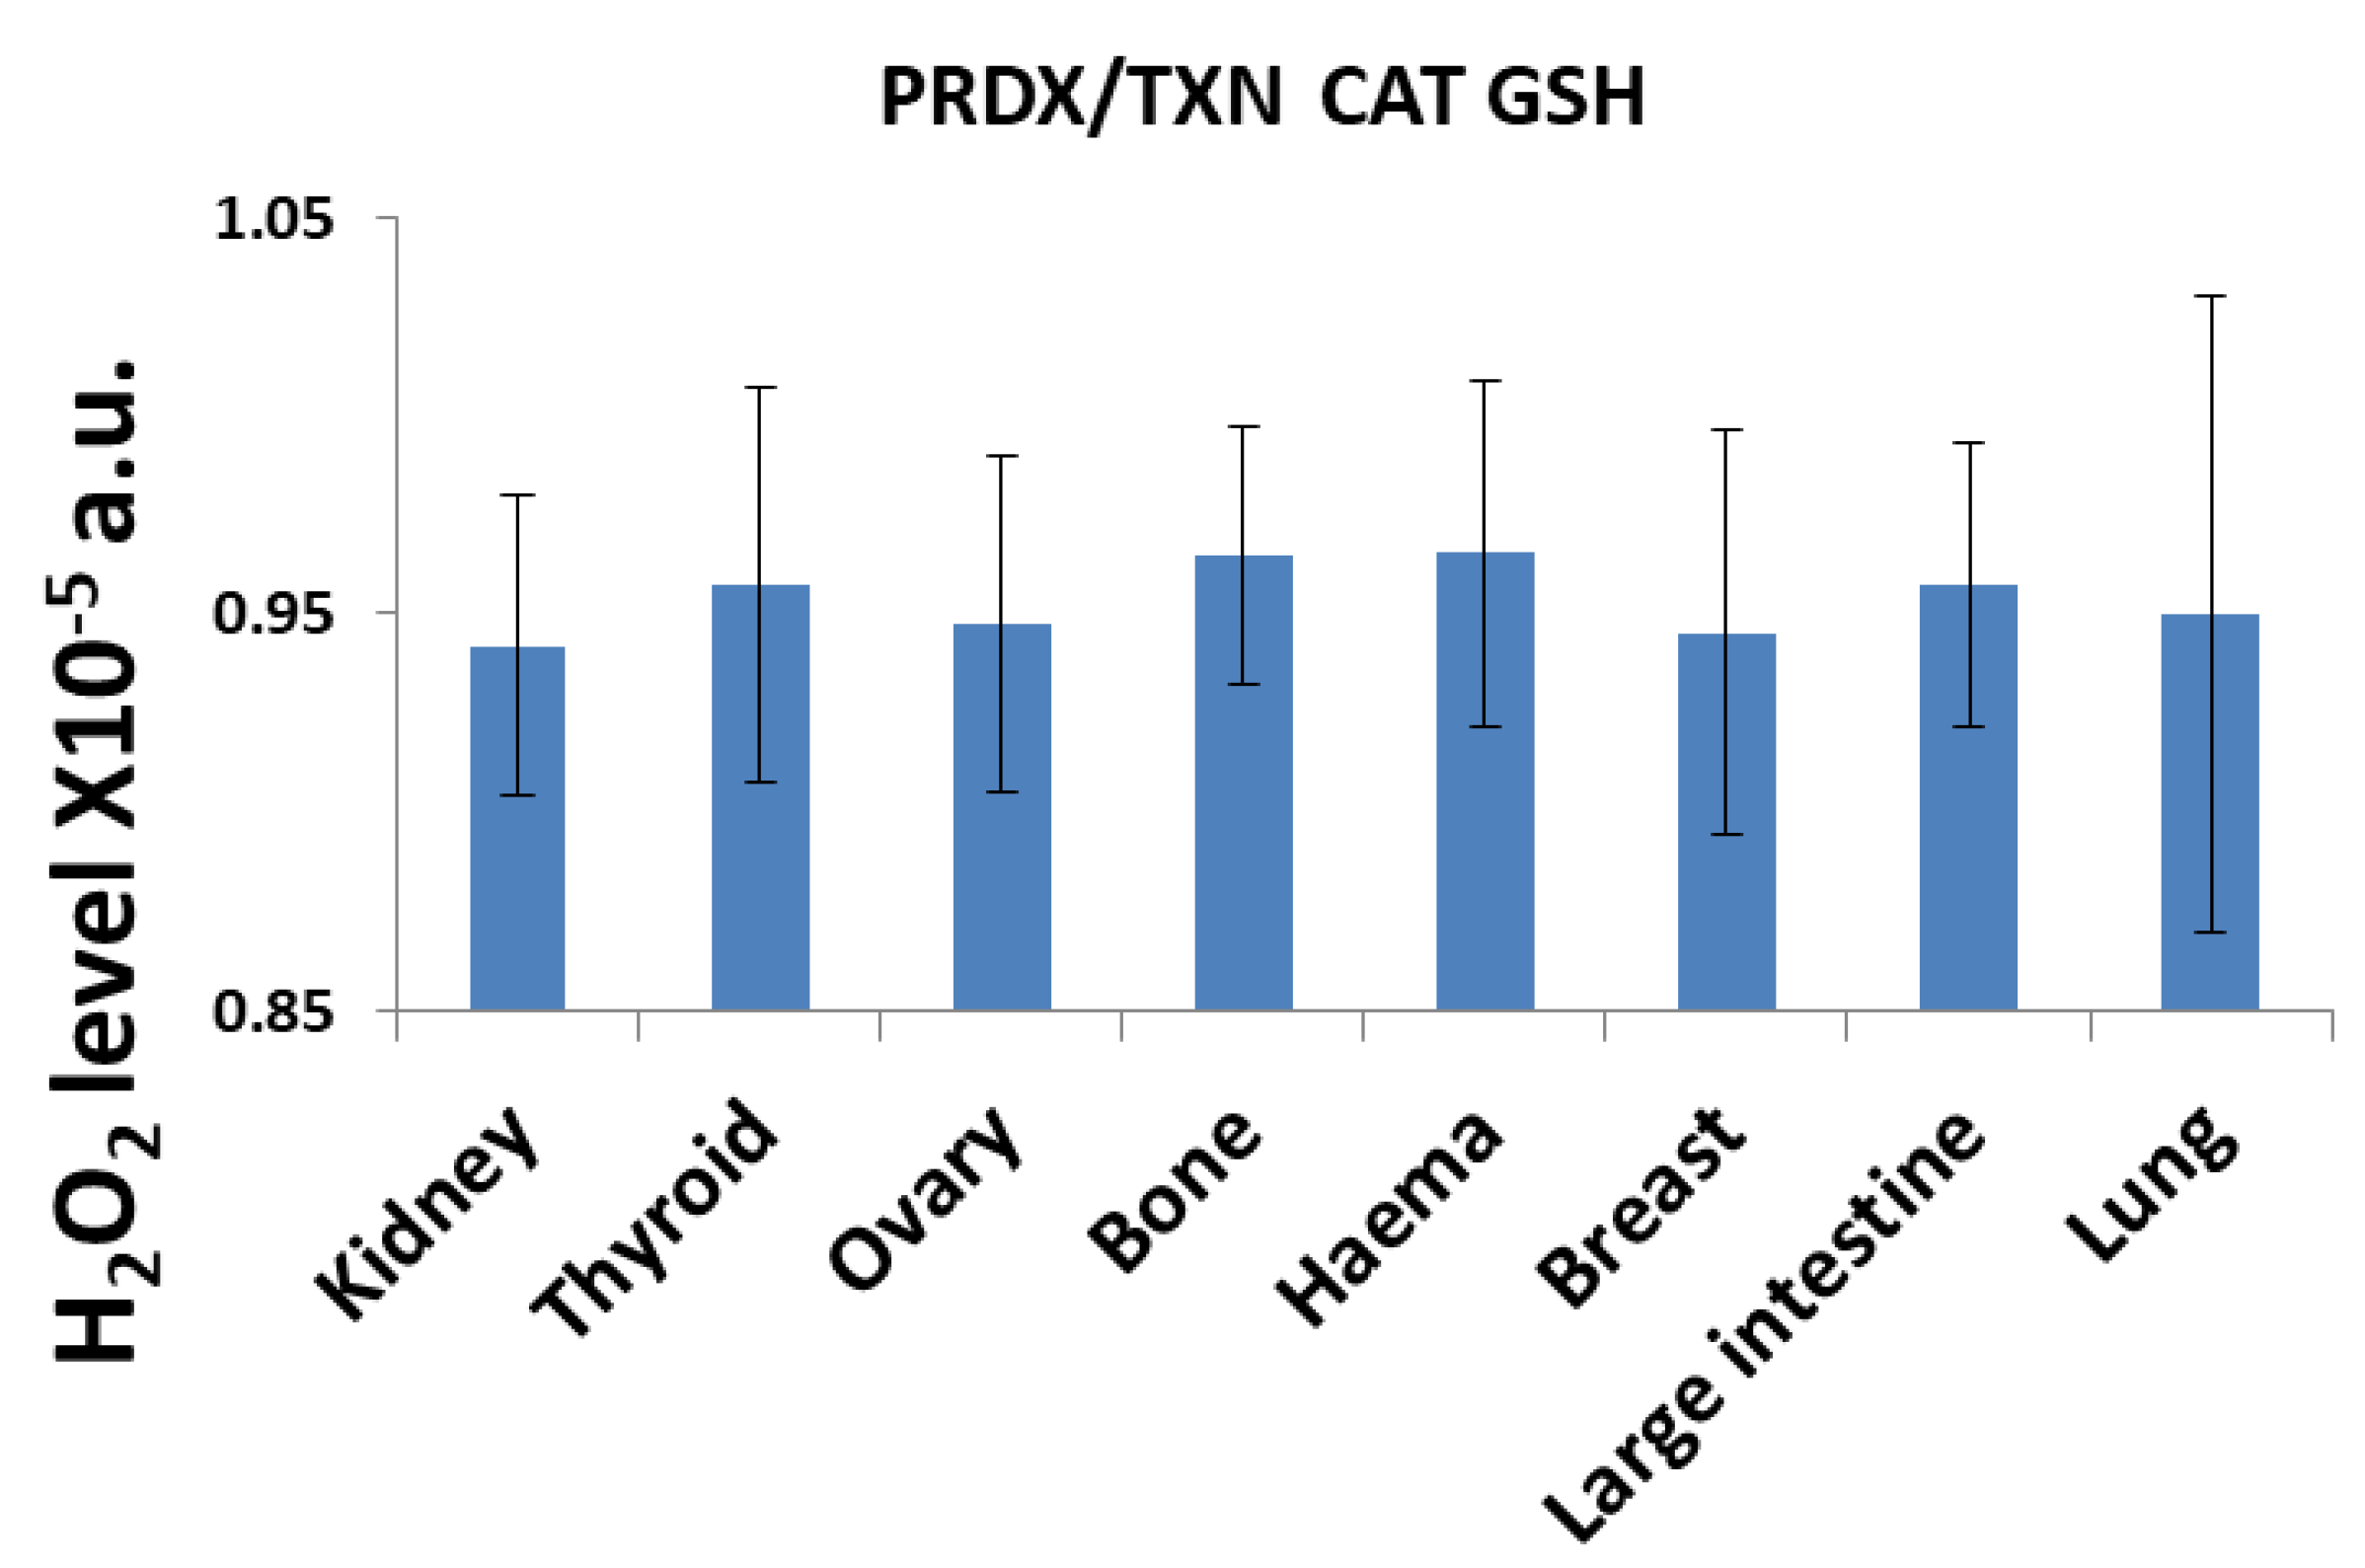
Figure 3.
Computer simulations of H2O2 levels in cell lines of different tissue origin obtained with assumptions that only some of the systems of neutralization are active. Active system of neutralization was marked as black, the grey is the one switched off. The results present average values obtained for different cell lines of the same origin ±SD.
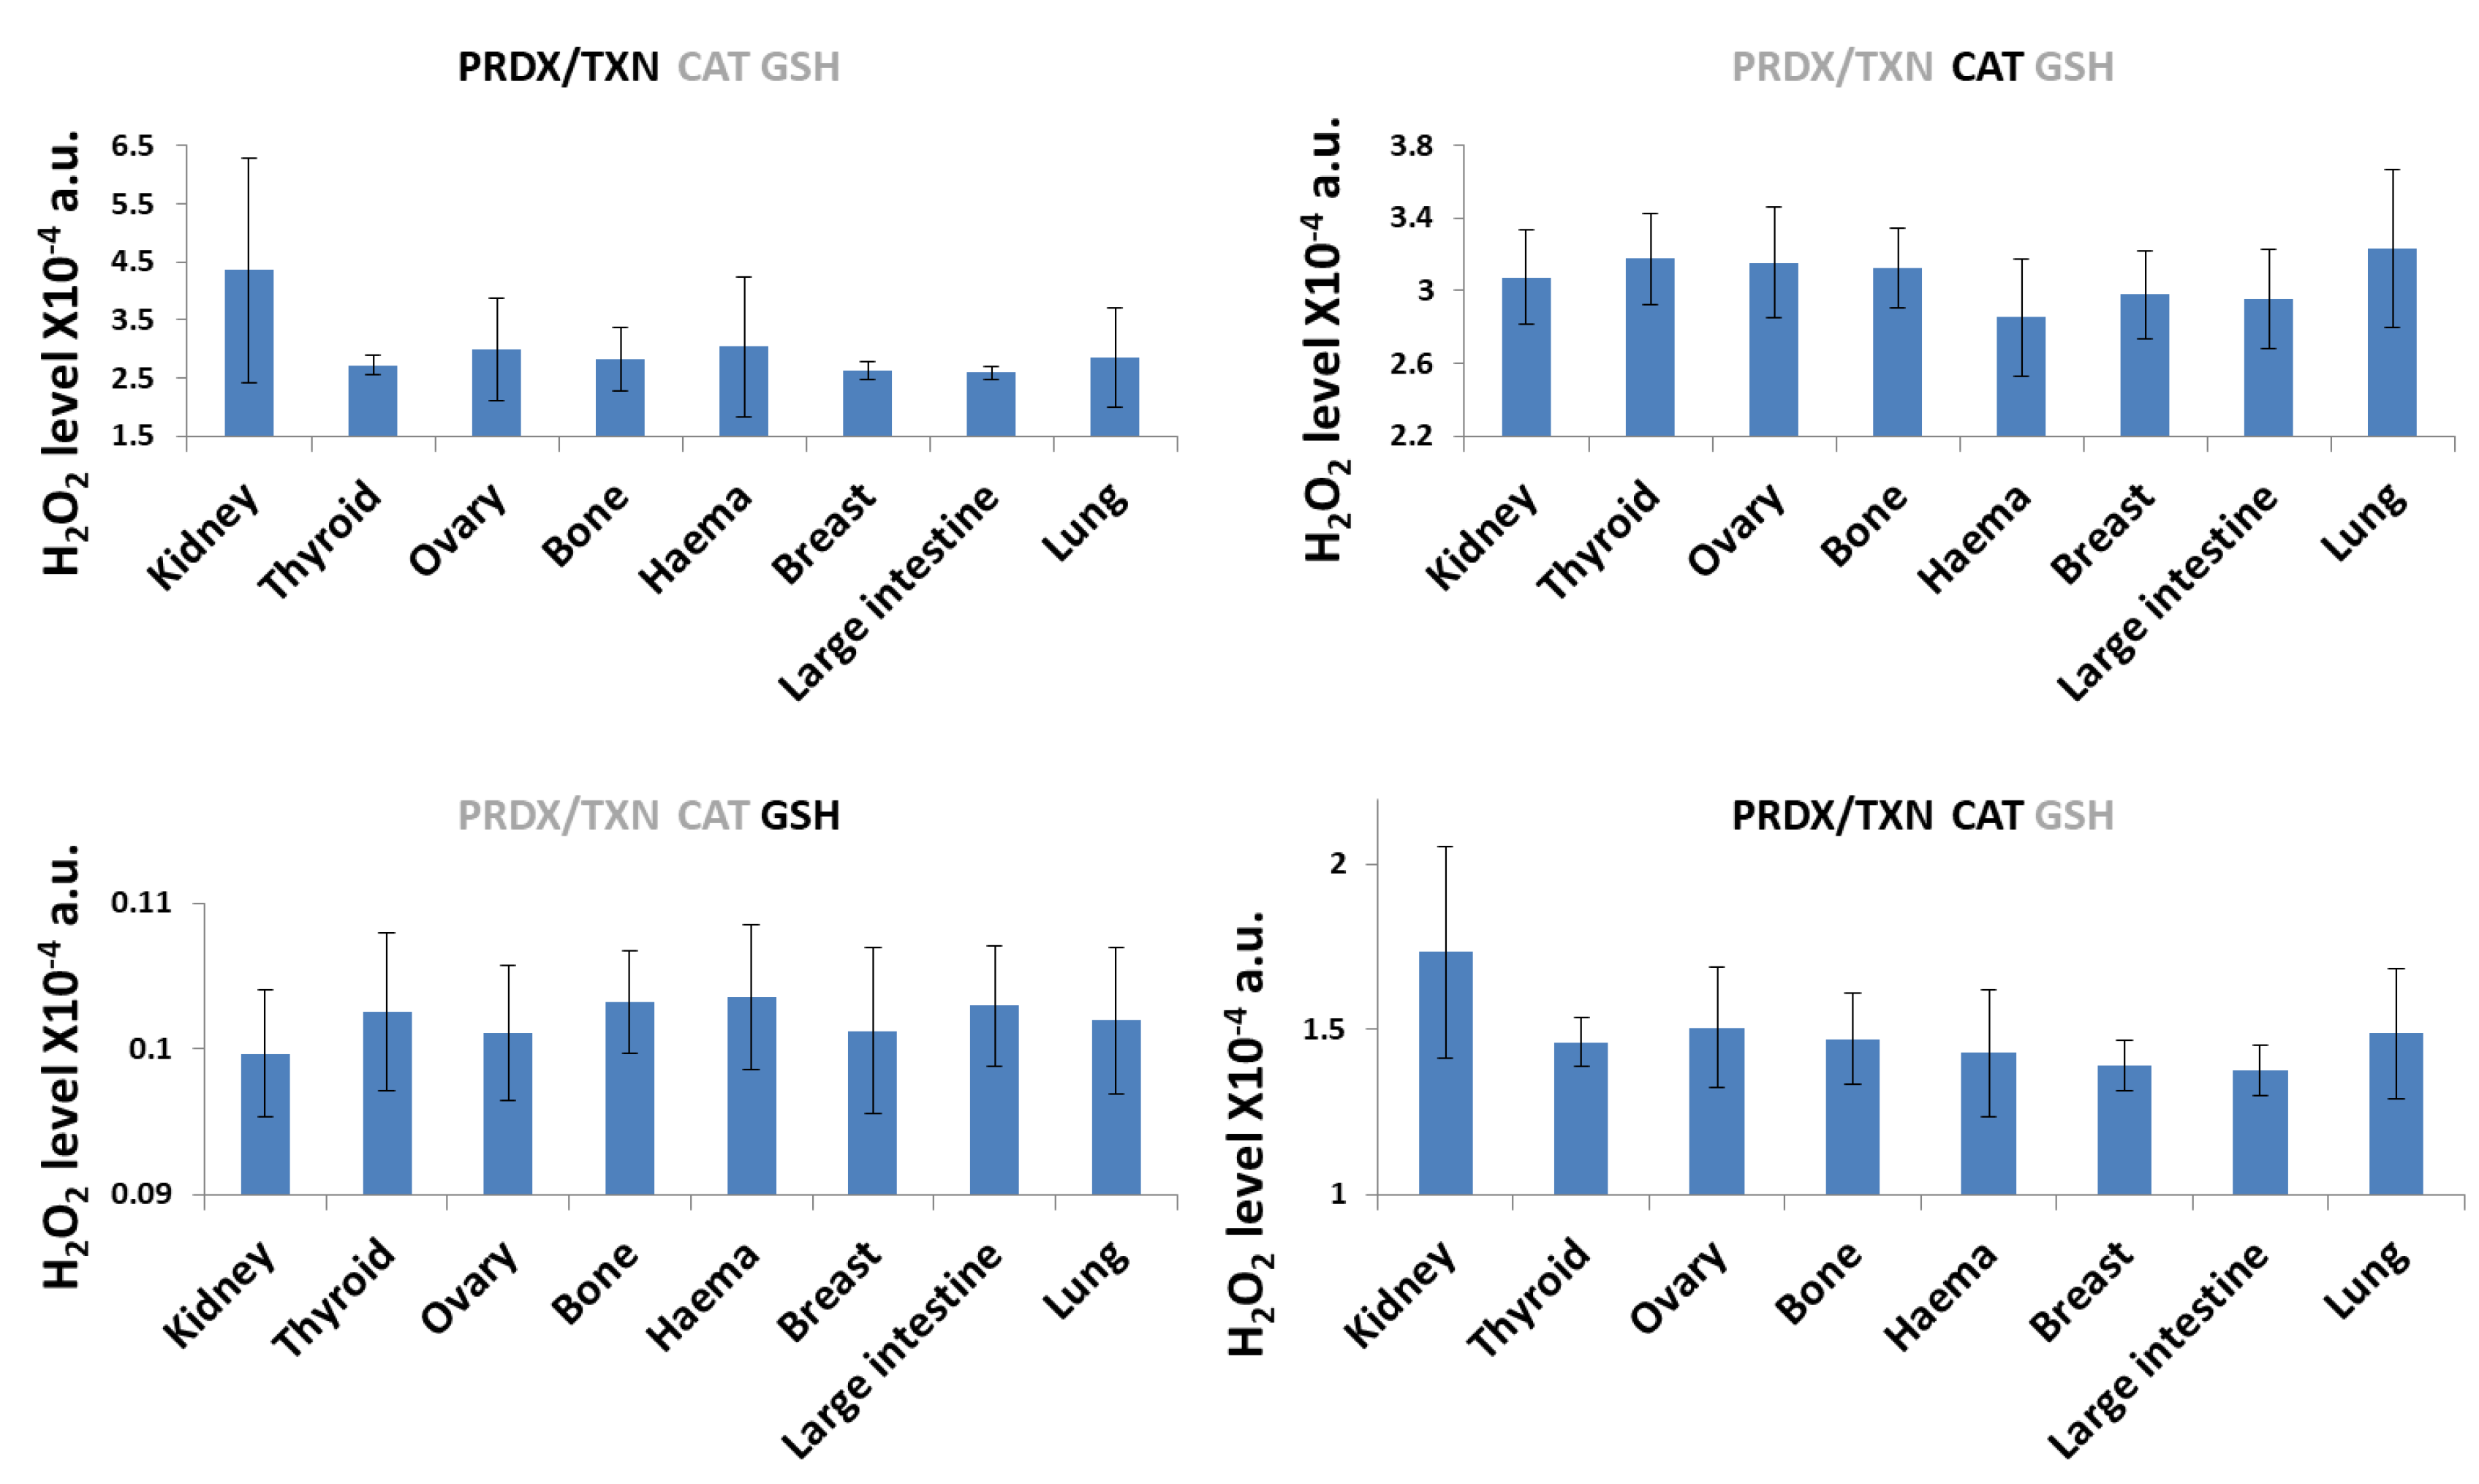
Figure 4.
Average H2O2 level for radiosensitive (RS) and radioresistant (RR) lung, breast and colorectal cancer cell lines with all neutralization systems active obtained in computer simulations. The results are presented as the mean ±SD. Asterisk denote statistical significance with p-value <0.05 comparing radioresistant and radiosensitive cell line groups.
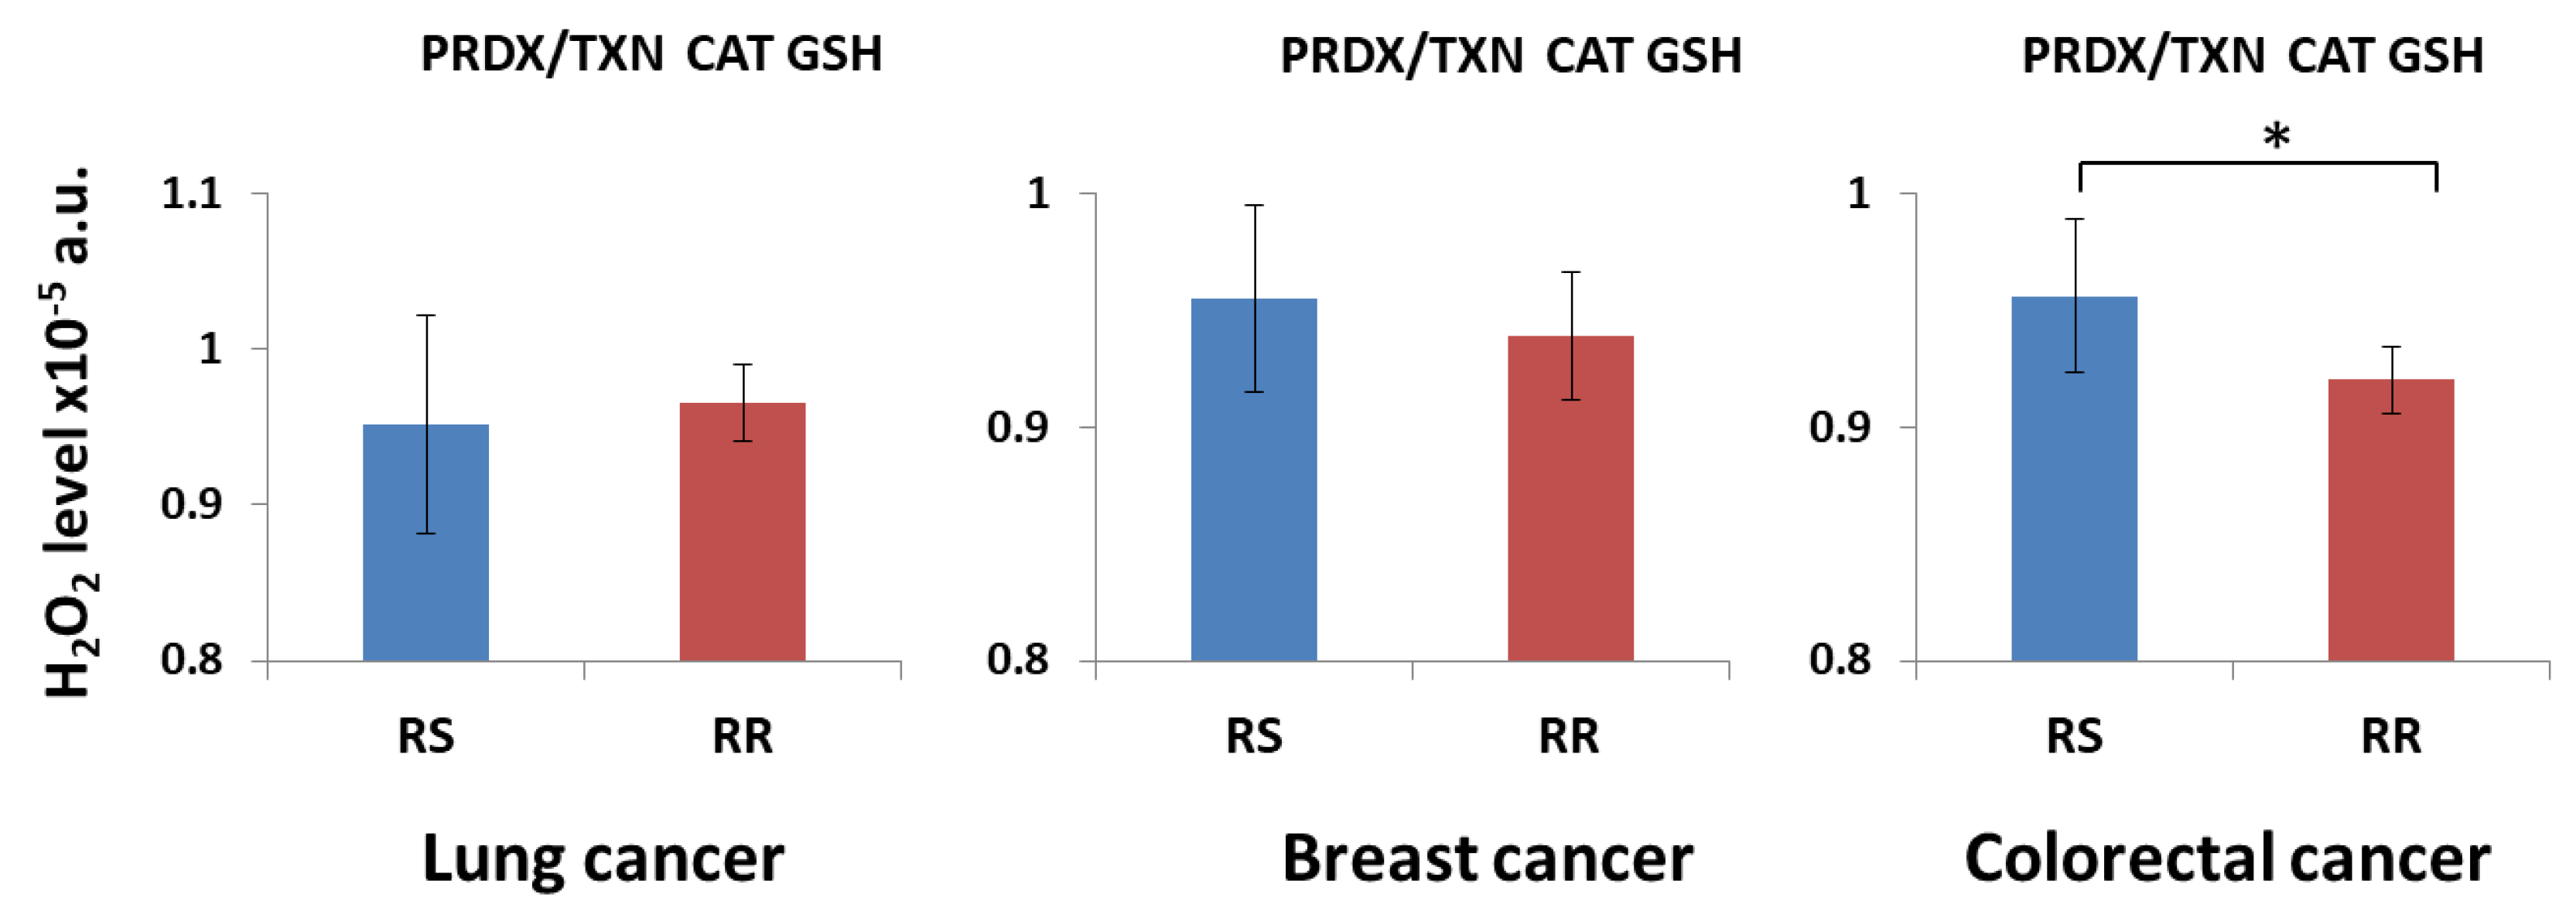
Figure 5.
Average H2O2 level for radiosensitive (RS) and radioresistant (RR) lung cancer cell lines with some of neutralization systems active obtained by computer simulations. First row shows neutralization of H2O2 in lung cancer, second row in breast cancer and the third in colorectal cancer. Active system of neutralization was marked as black, the grey is the one switched off. The results are presented as the mean ±SD. Asterisk denote statistical significance with p-value <0.05 comparing radioresistant and radiosensitive cell line groups.
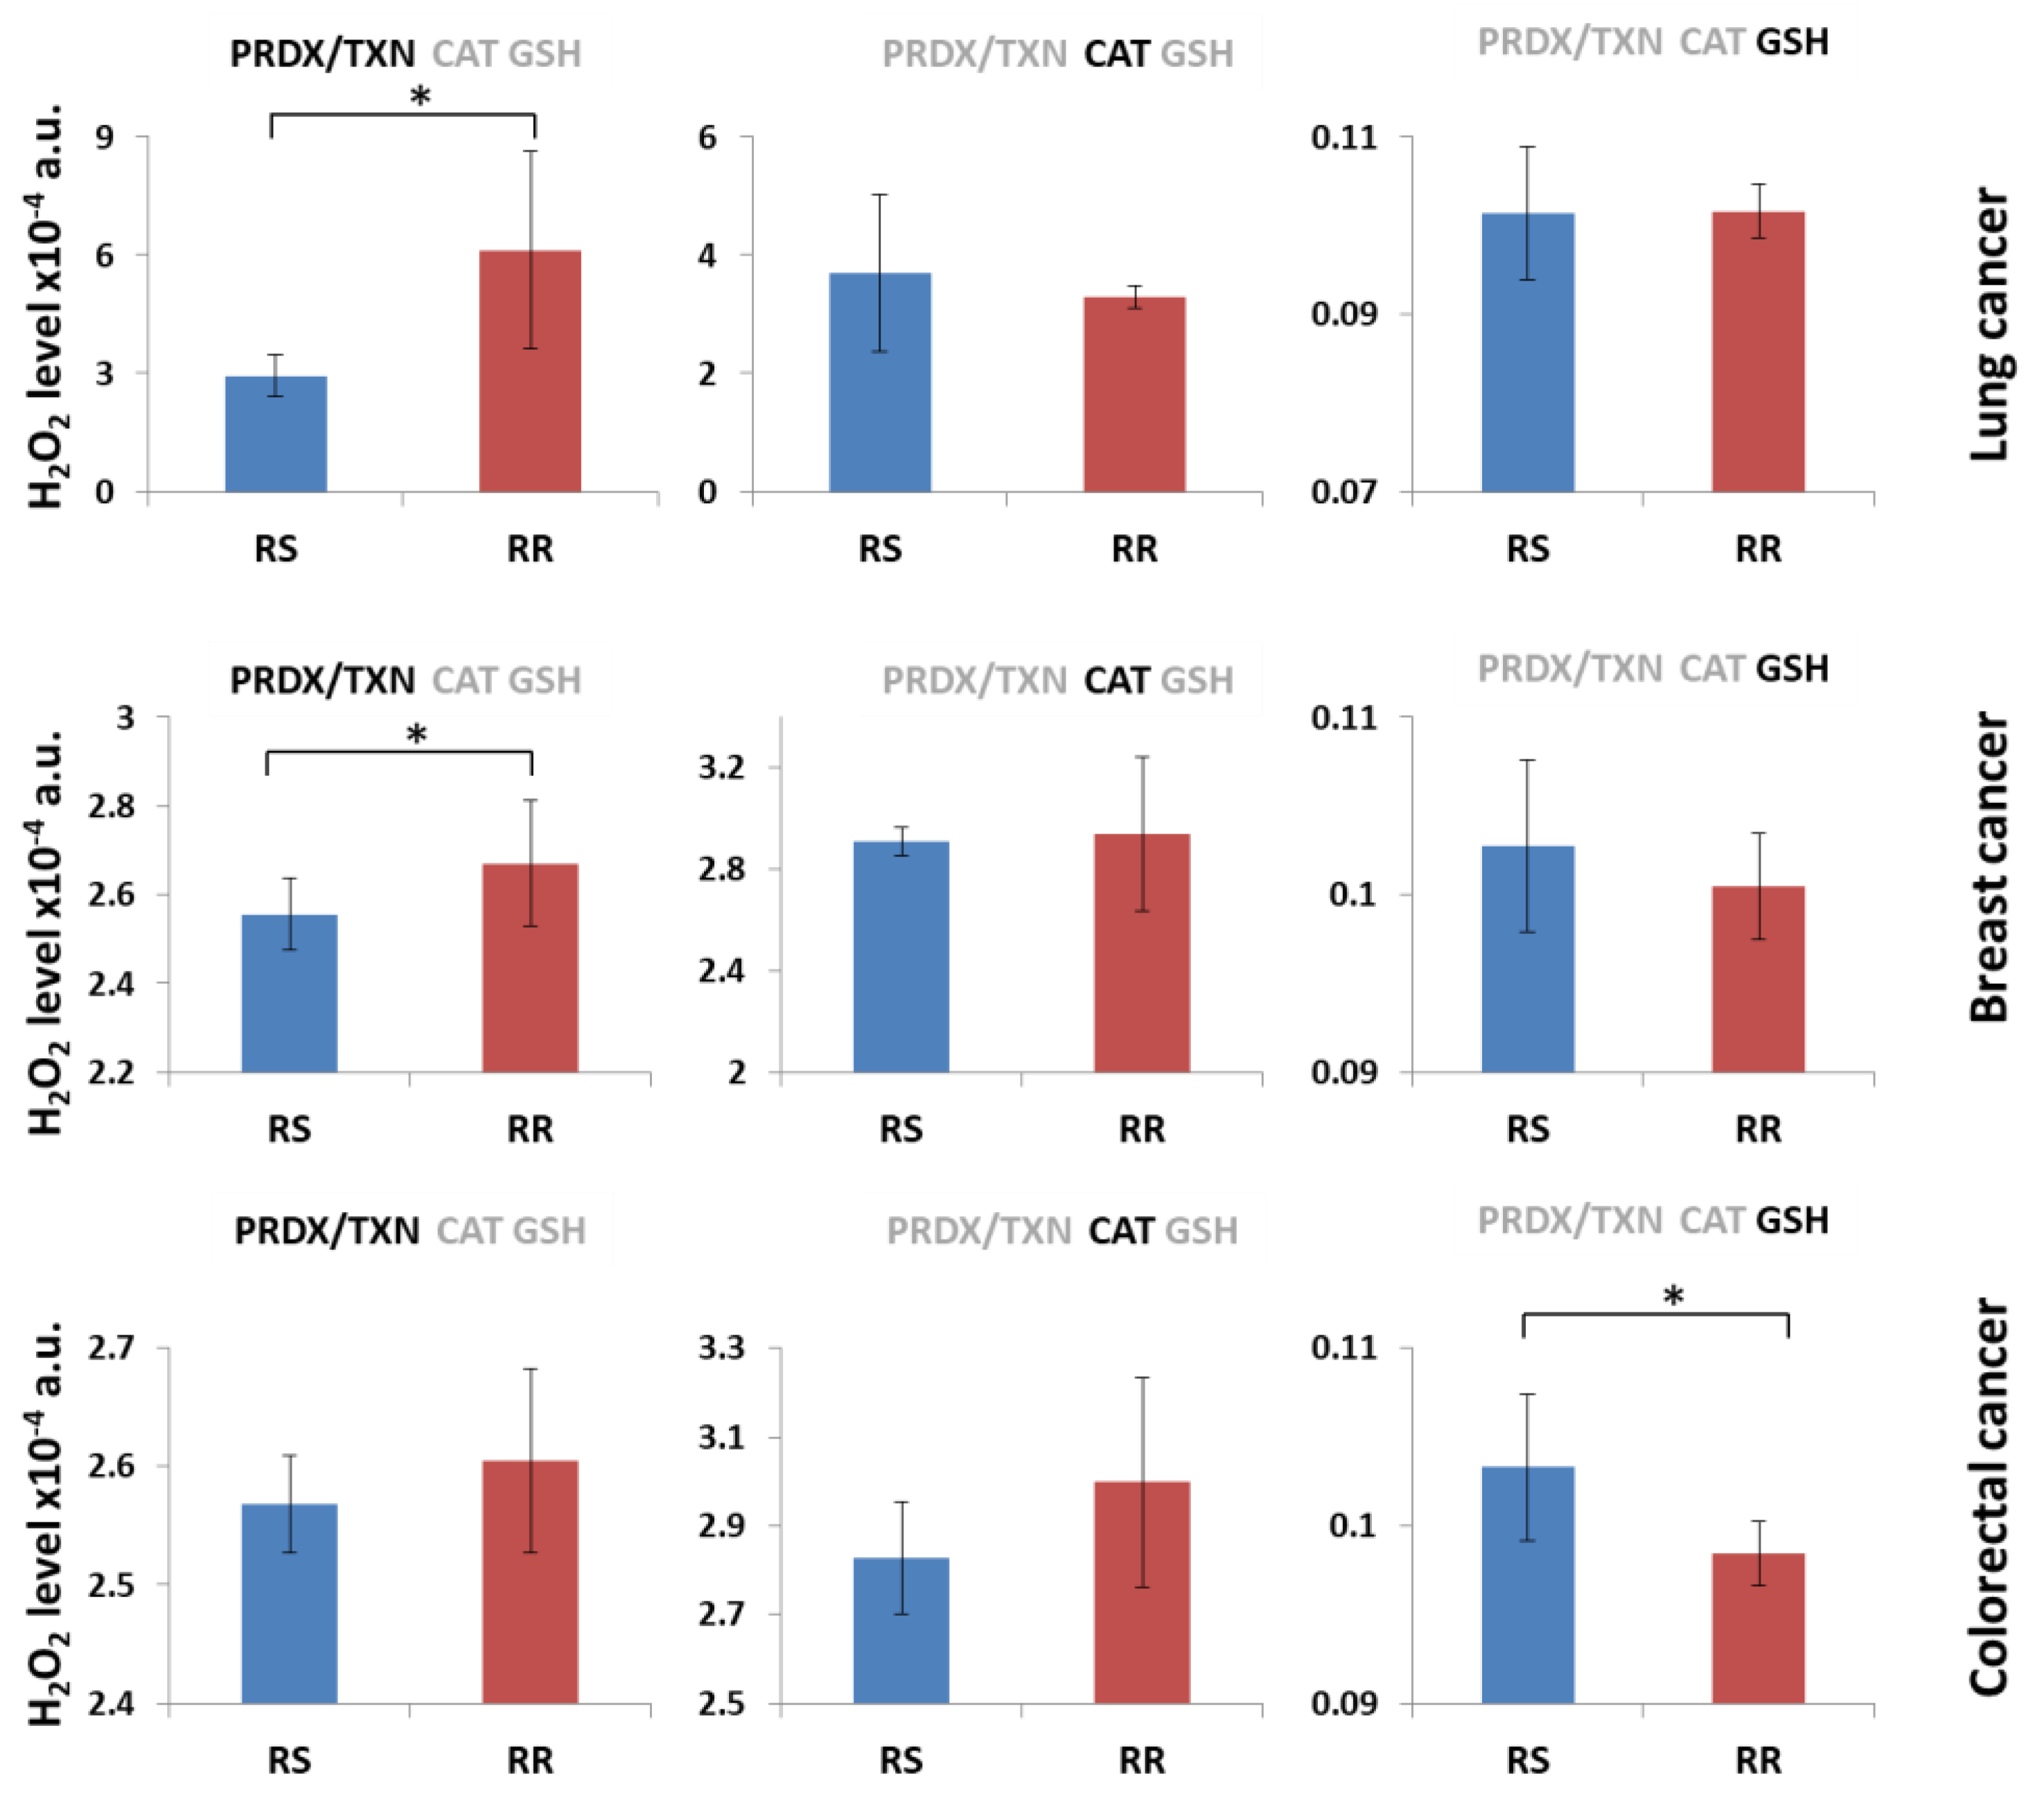

Table 1.
Initial concentration of enzymes used in the model of H2O2 neutralization.
| Description | Symbol | Value1 [mM] |
|---|---|---|
| CAT concentration | CAT | 0.001 |
| PRDX concentration | PRDX | 0.15 |
| TXN concentration | TXN | 0.025 |
| TXNRD concentration | TXNRD | 0.025 |
| GSH concentration | GSH | 3.0 |
| GPX concentration | GPX | 0.05 |
| GSR concentration | GSR | 0.05 |
1 A set of parameters to which the remaining calculated values of expression are referred.
Table 2.
Parameters used in the model of H2O2 neutralization.
| Description | Symbol | Value [unit] |
|---|---|---|
| Rate constant of CAT | kCAT | 0.034 [mM-1ms-1] |
| Rate constant of PRDX | kPRDX | 0.26 [mM-1ms-1] |
| Rate constant of TXN | kTXNox | 0.23 [mM-1ms-1] |
| Rate constant of TXNRD | kTXNRD | 0.31 [mM-1ms-1] |
| Rate constant of GSR | kGSR | 0.08 [mM-1ms-1] |
| Rate constant of GPX1 | kGPX | 67 [mM-2ms-1] |
| H2O2 influx to the system1 | H2O2IN | 10-6[mMms-1] |
1 Adjusted.
Table 3.
Radioresistant and radiosensitive lung, breast and colorectal cancer cell lines used in mathematical model of H2O2 neutralization.
Table 3.
Radioresistant and radiosensitive lung, breast and colorectal cancer cell lines used in mathematical model of H2O2 neutralization.
| Type of cancer | Cell line | Radiosensitive (RS)/ Radioresistant (RR) |
Reference |
|---|---|---|---|
| Lung | A549 | RR | [43] |
| H1703 | RR | [44] | |
| H661 | RR | [45] | |
| H1299 | RR | [46] | |
| H1339 | RR | [47] | |
| H292 | RR | [48] | |
| H358 | RR | [48] | |
| H23 | RS | [48] | |
| H441 | RS | [49] | |
| H1650 | RS | [50] | |
| H522 | RS | [50] | |
| HCC827 | RS | [44] | |
| H69 | RS | [51] | |
| H460 | RS | [52] | |
| Breast | MCF-7 | RR | [53,54,55] |
| SK-BR-3 | RR | [56] | |
| ZR-751 | RR | [57] | |
| HCC1428 | RR | [58] | |
| T47D | RR | [59,60] | |
| HS578T | RR | [54] | |
| UACC-812 | RR | [61] | |
| MDA-MB-175VII | RR | [58] | |
| MDA-MB-361 | RS | [59] | |
| HCC70 | RS | [62] | |
| MDA-MB-231 | RS | [53,55,60] | |
| BT474 | RS | [54,63] | |
| JIMT-1 | RS | [55] | |
| CAL-51 | RS | [64] | |
| HCC1395 | RS | [65] | |
| Colorectal | HT115 | RR | [66] |
| DLD-1 | RR | [66] | |
| Lovo | RR | [66] | |
| HT29 | RR | [66] | |
| Caco-2 | RR | [67,68] | |
| SW480 | RR | [69,70] | |
| MDST8 | RR | [71] | |
| Colo-201 | RS | [66] | |
| Colo-205 | RS | [66] | |
| Colo-320 | RS | [66] | |
| HCT116 | RS | [66] | |
| SW48 | RS | [69,70] |
Disclaimer/Publisher’s Note: The statements, opinions and data contained in all publications are solely those of the individual author(s) and contributor(s) and not of MDPI and/or the editor(s). MDPI and/or the editor(s) disclaim responsibility for any injury to people or property resulting from any ideas, methods, instructions or products referred to in the content. |
© 2025 by the authors. Licensee MDPI, Basel, Switzerland. This article is an open access article distributed under the terms and conditions of the Creative Commons Attribution (CC BY) license (http://creativecommons.org/licenses/by/4.0/).
Copyright: This open access article is published under a Creative Commons CC BY 4.0 license, which permit the free download, distribution, and reuse, provided that the author and preprint are cited in any reuse.


