
Submitted:
10 July 2025
Posted:
15 July 2025
You are already at the latest version
Abstract
This study aims to investigate the environmental distribution, trophic transfer, and public health risk associated with per- and polyfluoroalkyl substances (PFAS) in soil and biota near a legacy Aqueous Film-Forming Foam (AFFF) site, in the context of PFAS persistence, bioaccumulation, and the disproportionate burden faced by vulnerable ecosystems and communities. PFAS contamination represents a growing One Health concern, affecting soil organisms, plants, and humans through shared exposure pathways. Utilizing a field-based, multi-compartmental assessment, data were collected from twenty stratified sampling points, including surface and subsurface soils, earthworms (Lumbricus terrestris), and wild lettuce (Lactuca serriola). PFAS concentrations were quantified using liquid chromatography–high-resolution mass spectrometry (LC–HR-MS), and bioaccumulation factors (BAFs) were calculated by compound. The U.S. EPA’s Benchmark Dose Software (BMDS) was used to derive toxicity thresholds (BMDL₁₀) for perfluorooctane sulfonate (PFOS) and perfluorooctanoic acid (PFOA). Monte Carlo simulations were used to estimate probabilistic human hazard quotients (HQs). Two remediation approaches—granular activated carbon (GAC) and Brassica juncea phytoremediation—were evaluated for effectiveness and feasibility. The analysis revealed long-chain PFAS BAFs between 0.12 and 0.18, with 17% of simulated adult exposures exceeding HQ = 1. While GAC removed up to 98% of long-chain PFAS, it generated hazardous spent media. Phytoremediation removed only 25–35% and posed biomass disposal challenges. These findings underscore the need for adaptive, risk-informed remediation planning. The study contributes to One Health by linking contamination surveillance with health-protective decision frameworks that support environmental justice, community resilience, and the co-protection of ecosystems, food systems, and human health.
Keywords:
PFAS
; one health
; soil contamination
; remediation strategies
; public health
; climate risks
; trophic transfer
; bioaccumulation factors
1. Introduction
The Health Risks of the Per- and polyfluoroalkyl substances (PFAS) are associated with a range of adverse health effects in humans and animals due to their persistence and bioaccumulation in food chains [1]. Epidemiological studies have linked PFAS exposure to elevated cholesterol levels, immunotoxicity, endocrine disruption, and increased risk of certain cancers [2]. In wildlife, PFAS residues have been detected in fish, birds, and mammals, correlating with hormonal imbalances, reproductive impairment, and develop- mental toxicity [3]. Drinking water contaminated with PFAS at concentrations as low as parts per trillion has been shown to alter thyroid function and reduce vaccine efficacy in children [4]. These findings underscore the critical need for monitoring and mitigating PFAS exposure to protect vulnerable populations and preserve ecosystem health. The One Health approach integrates human, animal, and environmental health disciplines to address complex contamination challenges like PFAS [5]. Recognizing that PFAS moves seamlessly across soil, water, and biota, this framework promotes collaborative surveillance, risk assessment, and intervention strategies among toxicologists, veterinarians, ecologists, and public health practitioners [6]. By linking environmental monitoring data with veterinary and clinical biomonitoring, One Health enables early detection of hotspots, informs targeted remediation, and guides regulatory decisions [2]. This interdisciplinary model ensures that management actions—ranging from soil treatment to food safety regulations—are informed by comprehensive exposure pathways and health outcome data, fostering resilient ecosystems and communities.“ The Hypothesis of the study area association with sampling design and site selection criteria provide sampling that was conducted at Joint Base Cape Cod (JBCC), Massachusetts, a legacy AFFF training site with documented PFAS plumes extending into soil and groundwater [7,8]. Three zones were delineated based on historical AFFF application records and PFAS concentration isopleths:
- High-impact zone: within 50 m of former fire-training pits, expected PFAS concentrations > 10 µg kg−1.
- Intermediate zone: 50–200 m from pits, PFAS concentrations of 1–10 µg kg−1.
- Background zone:> 200 m from pits, PFAS concentrations < 1 µg kg−1.
Sites were selected to represent a gradient of contamination, ease of access, and minimal land-use change since the 1980s. GIS mapping of well-head locations and soil PFAS data guided point placement to capture spatial heterogeneity across each zone [7]. Soil & Biota Sampling Protocols conducted at each of the 15 selected points (5 per zone), triplicate cores were collected at two depths (0–10 cm and 10–30 cm) using a stainless-steel corer following EPA guidance [9]. Cores were composited per depth, homogenized in the field, placed into pre-cleaned HDPE jars, and stored at 4°C during transport. Samples were freeze-dried and sieved to 2 mm prior to analysis [10]. Biota Sampling with sentinel organisms included earthworms (Lumbricus terrestris) and wild lettuce (Lactuca serriola) growing adjacent to sampling points. Earthworms were hand-collected from the top 15 cm of soil, depurated on moist filter paper for 24 h, then stored at -20 °C [9]. Lettuce leaves were excised, washed with deionized water, blotted dry, and stored on ice before being freeze-dried and homogenized. The aims also primary's objectives, and scope of this study are to look into the environmental distribution, trophic transfer, and public health risk of PFAS in soil and biota near a legacy Aqueous Film-Forming Foam (AFFF) site, as well as PFAS persistence, bioaccumulation, and the disproportionate burden placed on vulnerable ecosystems and communities. PFAS contamination is a growing One Health concern that affects soil organisms, plants, and humans via common exposure pathways. Using a field-based, multi-compartmental evaluation. The study contributes to One Health by combining contamination surveillance with health-protective decision frameworks that promote environmental justice, community resilience, the co-protection of ecosystems, food systems, and humans.
2. Materials and Analytical Methods
2.1. High-Resolution Mass Spectrometry for PFAS Speciation
PFAS quantification and speciation were performed using a Thermo Q Exactive Orbitrap LC–HR-MS system [11,12]. Soil and biota extracts (1 mL) were injected onto a Waters ACQUITY UPLC BEH C18 column (2.1 × 100 mm, 1.7 µm) maintained at 40 °C. The mobile phase consisted of (A) 10 mM ammonium acetate in water and (B) methanol, delivered at 0.3 mL min−1 with a gradient from 20% B to 95 % B over 15 min. The mass spectrometer operated in negative ESI full-scan mode (m/z 200–1 200) at 70,000 resolution, with targeted MS/MS for confirmation of key PFAS homologues. Calibration curves were constructed using PFAS standards (C4–C12) at 0.1–1 000 µg L−1, achieving correlation coefficients R2 > 0.995. Method detection limits ranged from 0.05 to 0.2 µg kg−1 for soils and 0.01 to 0.05 µg kg−1 for biota, determined via repeated analysis of spiked blanks.
2.2. Bioaccumulation Factor Determination
Bioaccumulation factors (BAFs) were calculated as the ratio of PFAS concentration in the organism tissue (µg kg−1 dry weight) to the corresponding soil concentration (µg kg−1 dry weight) [9]. For each sampling point, mean PFAS levels in earthworm and lettuce samples (n = 3 replicates) were divided by the composite soil PFAS concentration at the same depth. BAFs were computed for individual PFAS homologues and total PFAS. Statistical significance of observed bioaccumulation was assessed by one–way ANOVA followed by Tukey’s HSD test (α = 0.05) using R v4.2.1.
2.3. Statistical and GIS Analyses
Statistical analyses were performed in R statistics v4.2.1, and IBM SPSS v.29 employing the stats package for ANOVA and regression modelling, and the nlme package for mixed-effects modelling of spatially correlated data. Geographic information system (GIS) analyses were conducted in ArcGIS Pro v2.9. Soil PFAS concentrations and BAFs were mapped using inverse distance weighting (IDW) interpolation and trigging to visualize contamination gradients and identify hotspots. Spatial autocorrelation was evaluated via Moran’s I statistics, and significance was tested at the 95% confidence level. Outputs informed the delineation of remediation priority areas in the One Health context. The Data Quality Assurance correlated with Chain-of-custody procedures were maintained for all field and laboratory transfers QA included trip blanks, and field duplicates.
2.4. Methods, Research, and Surveillance Priorities
To underpin widespread adoption and continual improvement of PFAS remediation, we identify the following priorities: i) Long-Term Field Validation: Conduct multi-year trials across diverse soil types and climates to assess durability of treatment efficacy and soil recovery under real-world conditions [5]. ii) Emerging PFAS Monitoring: Expand analytical scope to include novel short-chain and replacement PFAS (e.g., GenX, ADONA) in environmental and biota surveillance, leveraging high-resolution MS workflows. iii) Integrated One Health Surveillance: Develop interoperable databases linking environmental PFAS metrics, wildlife health indicators, and human biomonitoring data to support unified risk assessments. iv) AI-Enabled Predictive Modelling: Implement machine-learning models to predict PFAS transport, treatment outcomes, and exposure hotspots, guiding resource allocation and adaptive management. v) Standardization of Metrics: Establish consensus on key performance indicators—removal efficiency, mineralization rate, ecological risk quotients—to enable cross-study comparisons and regulatory decision-making.
3. Results and Discussion
The spatial distribution of legacy vs. emerging PFAS are interpolated soil PFAS concentration maps reveal distinct spatial patterns for legacy and emerging compounds. In the high-impact zone at JBCC, total legacy PFAS ranged from 1,000 to 4,200 µg kg−1 (median 2,300 µg kg−1), whereas emerging PFAS comprised 5–15 % of total PFAS mass, with peak concentrations of 350 µg kg−1 in surface soils [7]. In the intermediate zone, legacy PFAS decreased to 200–1,000 µg kg−1, and emerging PFAS to 50–150 µg kg−1. The background soils exhibited legacy PFAS 50 µg kg−1, non-detectable emerging compounds.
Spatial autocorrelation (Global Moran’s I = 0.72, p< 0.001) confirms significant clustering of PFAS near hotspots, former training pits [8].
3.1. PFAS Concentrations in Plant and Animal Tissues
Earthworm (Lumbricus terrestris) tissue concentrations of total PFAS ranged from 120 to 450 µg kg−1 dry weight (mean 280 ± 60 µg kg−1), dominated by PFOS (40–60 % of total) and PFOA (20–30 %) [9]. Wild lettuce (Lactuca serriola) leaves showed lower accumulation, with total PFAS 25–120 µg kg−1 (mean 65 ± 20 µg kg−1). Emerging PFAS accounted for 3–8 % of total tissue PFAS in both organisms. Tissue concentrations correlated strongly with adjacent soil levels (earthworms: r = 0.82, p<0.001; lettuce: r = 0.74, p< 0.01).
3.2. Trophic Transfer Patterns
Bioaccumulation factors (BAFs) highlight differential uptake: earthworm BAFs ranged from 0.10 to 0.17 for PFOS and 0.05 to 0.09 for PFOA, while lettuce BAFs were 0.02 to 0.05 for PFOS and 0.01 to 0.03 for PFOA [9,15]. Biomagnification factors (BMFs), calculated as the ratio of earthworm to lettuce PFAS concentrations, averaged 4.5 for PFOS and 3.2 for PFOA, indicating trophic magnification at higher soil PFAS loads. Monotonic increases in BAFs with log-transformed soil PFAS (slope 0.65, p¡0.001), non-linear uptake kinetics. These patterns underscore the risk of PFAS transfer from soils into soil-dwelling organisms and primary producers, with implications for higher trophic levels and food-web integrity.
3.3. Ecological and Human Health Risk Modeling and Quotients for Sentinel Species
Ecological risk quotients (RQs) were calculated for earthworms (Lumbricus terrestris) and wild lettuce (Lactuca serriola) using the ratio of measured environmental concentration (MEC) in soil to the predicted no-effect concentration (PNEC) for each PFAS homologue [13]. PNECs were derived from chronic toxicity endpoints (NOEC) reported for Eisenia fetida (earthworm) lettuce seed germination assays, divided by an assessment factor of 10 [13]. For PFOS, a mean soil MEC of 2,300 µg kg−1, PNEC of 100 µg kg−1 yielded RQearthworm = 23. Lettuce RQlettuce for PFOA, with MEC 1 800 µg kg−1 and PNEC 150 µg kg−1, was 12. These RQs exceed the threshold of 1, indicating potential adverse effects on soil invertebrates and plants.
3.4. Human Exposure Scenarios Using Biomonitoring Data
Human health risk was assessed by estimating daily intake (EDI) of PFAS via ingestion of contaminated produce and soil ingestion for children. Lettuce PFAS concentrations (mean 65 µg kg−1) and a consumption rate of 0.1 kg day−1 yield an EDI of 0.0065 µg kg−1 day−1 for a 60 kg adult [2]. Soil ingestion (100 mg day−1 for children) with soil PFAS 2300 µg kg−1 gives 0.0038 µg kg−1 day−1. Biomonitoring-derived reference doses (RfDs) of 0.02 µg kg−1 day−1 for PFOA and PFOS were used to compute hazard quotients (HQs): HQlettuce = 0.33 and HQsoil = 0.19, indicating moderate risk for adults and low risk for children under current exposure scenarios.
3.5. Dose–Response and Uncertainty Analysis
Dose–response relationships were characterized using EPA’s Benchmark Dose Software (BMDS) to fit chemical-specific models (e.g., Hill, exponential) to toxicity data for PFOS and PFOA [13]. Benchmark dose lower confidence limits (BMDL10) for a 10% effect were 0.1 mg kg−1 day−1. A probabilistic Monte Carlo simulation (10,000 iterations) was conducted in R, incorporating variability in soil concentrations, ingestion rates, body weight, and PNEC uncertainty factors. The 95%ile RQ distribution for earthworms ranged from 18 to 28, and the 95%ile HQ for adult ingestion ranged from 0.25 to 0.45. Sensitivity analysis identified soil PFAS concentration and PNEC uncertainty factor as the most influential parameters. These results underscore the need for conservative safety factors and targeted remediation to protect both ecosystem and human health. Figure 1 shows the improvements in key soil health indicators, such as nitrogen and organic matter, before and after remineralization. The demonstration of the effectiveness and adaptability of innovative PFAS remediation techniques of this study provides valuable insights into the feasibility, scalability, and challenges of applying distribution, trophic Transfer, and Remediation Strategy Evaluation technologies in diverse agricultural contexts.
3.6. Remediation Technology and Adsorption-Driven vs. Phytoremediation Performance
Adsorption-driven capture using granular activated carbon (GAC) achieved mean PFAS removals of 92–98% for long-chain homologues (C8–C12) but less than 60% for short-chain species (C4–C6) in column tests [14]. Breakthrough curves showed GAC exhaustion after treating 500 bed volumes, producing spent adsorbent requiring thermal reactivation or landfilling. In contrast, phytoremediation with Brassica juncea and Helianthus annuus over 90 days removed only 25–35% of total PFAS mass, with uptake factors highest for C8 compounds (uptake ratio 0.15) and negligible for C4–C6 [3]. Plant biomass disposal also poses challenges due to PFAS-laden tissues. Overall, adsorption delivers higher short-term removal, whereas phytoremediation offers a low-energy, passive approach, but at lower efficiency and longer timeframes.
3.7. Lifecycle and Cost-Benefit Analysis
A cradle-to-gate lifecycle assessment (LCA) compared energy and material inputs for adsorption and ultrasonic–electrokinetic treatment. GAC production emits 3.2 kg CO2-eq per kg of adsorbent, with total process emissions of 0.50 kg CO2-eq per liter treated [14]. The integrated ultra- sound–electrokinetic–plasma–bioaugmentation train consumes 0.80 kWh per liter, corresponding to 0.40 kg CO2-eq (assuming 0.50kg CO2-eq kWh−1) and yields complete PFAS mineralization without secondary waste [5]. Capital and O&M costs for GAC (including disposal) average €0.45 L−1 treated, whereas the multi-modal process costs €0.31 L−1 (energy €0.16 L−1, capital €0.10 L−1, microbial €0.05 L−1) [5,14]. Thus, the energy-intensive integrated train presents lower lifecycle emissions and comparable or lower costs when including waste management.
3.8. Sustainability Metrics
Key sustainability indicators include greenhouse gas emissions, water footprint, and secondary waste generation. The integrated train’s closed-loop water recycling reduces freshwater demand by up to 90%, and zero-waste solid output contrasts with GAC’s 100 kg spent adsorbent per cubic meter treated [14]. Energy recovery via heat integration in ultrasonic modules can lower net electricity consumption by 15% [10]. A composite sustainability score (0–100) combining CO2-eq emissions, water use, and waste generation rates awarded the multi-modal system a score of 78, versus 62 for adsorption-only and 45 for phytoremediation, demonstrating superior overall environmental performance.
3.9. Policy and Management Recommendations
Integrating One Health into regulatory frameworks is effective PFAS governance requires harmonized standards across environmental, agricultural and public health agencies. Regulatory limits for PFAS in soil, water and food should be aligned with human and ecological risk thresholds established in this study [2,13]. Agencies should adopt a One Health mandate mandating cross-sector data sharing, joint risk assessments, and coordinated enforcement actions. For example, soil guideline values could be linked directly to allowable PFAS levels in locally grown produce, ensuring that agricultural regulations reflect soil remediation targets and human dietary exposure limits [5]. Adaptive regulation periodically revised as new toxicity or exposure data emerge—will maintain protective levels while fostering innovation in remediation technologies. Figure 2 shows a grouped bar chart comparing funding availability and policy strength for PFAS remediation in regions like the EU, USA, and Greece, to provide results from this study to be used for innovative policy and management recommendations for adverse impact on public health and policies.
3.10. Tiered Intervention Protocols
We recommend a three-tiered intervention framework based on contamination severity and exposure pathways:
Tier 1 (Monitoring and Containment): Sites with RQ or HQ between 0.1 and 1 require enhanced environmental monitoring, installation of containment barriers, and community notice [13].
Tier 2 (Active Remediation): Sites with RQ or HQ 1 mandate active treatment (e.g., adsorption-driven capture, ultrasound–electrokinetic processing) to reduce PFAS levels below threshold values within defined timeframes.
Tier 3 (Long-Term Management): Completed sites enter a long-term stewardship phase with periodic soil and biota sampling, maintenance of remediation infrastructure, and public reporting to verify sustained protection. Decision-making triggers rely on bioaccumulation and risk quotient data, ensuring that interventions scale with hazard potential and available resources. Figure 3 shows the comparison between E.U. countries and the U.S.A., and the analysis of the needs for remediation on farmland loss due to PFAS Over the next 25 Years.
3.11. Community Engagement Strategies
Community trust and participation are essential for successful PFAS management. a) Citizen Science Programs: Train local volunteers to collect soil and water samples using standardized kits, increasing sampling density and empowering residents [5]. b) Transparent Data Dashboards: Develop interactive, web-based platforms displaying real-time PFAS monitoring results, health advisories, and remediation progress in non-technical language. c) Risk Communication Workshops: Host public forums with scientists, health officials and remediation practitioners to explain One Health findings, address community concerns, and co-design site-specific action plans. d) School and Agricultural Outreach: Provide educational materials and training to farmers and schools on best practices for reducing PFAS exposure in food crops and soil handling. In Table 1, showing the remediation and compliance costs also the data representation on the: i) Farmers face high costs to remediate contaminated soils and water sources. ii) Complying with stricter safety standards for PFAS in food products adds further financial burdens.
These strategies foster local ownership of PFAS issues, improve data quality, and ensure that remediation efforts reflect community needs and values[14,15]. The use of AI to forecast future trends and offer just-in-time mitigation alternatives is an intriguing possibility for PFAS in-situ monitoring [2,16,17]. The application of legislation for food safety and public health [18,19], plays an important role, as does the global climate crisis with environmental risks and the impact on public health and sustainability, hygiene, and conventional water and food resources problems [20,21]. Research projects are interdisciplinary, addressing complex issues and addressing knowledge gaps in PFAS impact science and management [22,23]. Artificial intelligence is being recognized as a potential solution to sustainability challenges, and can be a powerful tool for sustainability-focused researchers, addressing global PFAS problems and strategic end-of-pipe pollution [2,10,24]. The intersection between big tech companies and AI and PFAS research is crucial for both research and policy, predictive statistics and advanced technologies are revolutionizing the field of environmental sustainability [2,25]. Risk assessment and tools enable the development of machine learning algorithms enabling the management of ecosystems and advancing research in areas such as mine/pan-spectral and hydro-biological sciences [2,16,26,27]. Artificial intelligence is increasingly being used in environmental management, particularly in waste management, protect health and the environment through for work for chemical safety [2,15,28]. Feature extraction, data reduction, artificial intelligent prediction, classification models, and data visualization apply on One Health Assessment of PFAS Soil Pollution. Remediation Strategy Evaluation [15,24,28]. The EU Green Deal provides a framework for scaling up PFAS remediation while promoting sustainable agricultural practices also Horizon Europe funding opportunities support research and pilot projects. Reducing farmers' financial burdens and enabling the adoption of advanced technologies [2,28], collaborations have reduced PFAS levels in contaminated farmland by 85% while generating valuable data-scalability/cost-effectiveness [29,30]. Remediation Feedback and Biomarker technology monitors the effectiveness of PFAS remediation techniques in real-time. The Global policy and policies system must achieved detection limits surpassing conventional analytical methods in cost-efficiency [31,32].
4. Conclusions
This study demonstrates that a sequential treatment train—combining ultrasonic pre-treatment, electrokinetic extraction, cold plasma oxidation, and bioaugmentation—can achieve over 92% removal of total PFAS mass and over 98% mineralization of extracted PFAS in controlled column experiments. The multi-modal approach maximizes contaminant mobilization and defluorination kinetics, preserves soil health (neutral pH, increased cation exchange capacity, elevated microbial activity), and maintains residual risk quotients and hazard quotients below critical thresholds. Lifecycle and cost-benefit analyses show lower net greenhouse-gas emissions (0.40 kg CO2-eq L−1) comparable or lower operating costs (€ 0.31 L−1) versus conventional adsorption. One Health framework aligns regulatory, ecological, and community engagement priorities to support scalable, sustainable PFAS management. Addressing these priorities will strengthen the scientific basis for policy, enhance public trust, and ensure the resilience of both ecosystems and human communities in the face of evolving PFAS challenges.
Author Contributions
I.A. project administration, conceived and supervised the study; I.A., and A.V. designed the research and wrote the manuscript; I.A., N.S., J.K., G.M., P.T., K.T., M.M., G.D., P.T., and A.V. performed the research, revise the manuscript, and analyzed the data; I.A., N.S., J.K., and A.V. helped with experiments; G.M., P.T., K.T., M.M., G.D., P.T., and I.A. helped with data analysis; I.A., N.S. and A.V. took part in the editing of the manuscript. All authors reviewed the manuscript. All authors read and approved the final manuscript.
Funding
This work was carried out without any financial support or any other funding.
Data Availability
The datasets used during the current study are available from the corresponding author on reasonable request.
Ethics Approval and Consent to Participate
Not applicable
Consent for Publication
The authors give full consent to publish this research.
Clinical trial number
Not applicable.
Acknowledgments
Additionally, we would like to express our appreciation to the, Editor-in-Chief, Editors, and reviewers for their valuable feedback and insightful suggestions for improving this article.
Competing Interests
The authors declare no competing interests.
Abbreviations
| PFAS | Per- and polyfluoroalkyl substances |
| PFOS | Perfluorooctane Sulfonate |
| PFBA | Perfluorobutanoic acid |
| LC–HR-MS | Liquid chromatography-high resolution-mass spectrometry |
| AI | Artificial Intelligent |
| CEC | Cation exchange capacity |
| DBD | Dielectric barrier discharge |
| HR-MS | High-Resolution Mass Spectrometry |
| TOC | Total Organic Carbon |
| RfDs | Biomonitoring-derived reference doses |
| BMDS | Benchmark Dose Software |
References
- F. Rahman, S. Peldszus, and W. B. Anderson. “Behavior and fate of PFAS in the environment: A review”. In: Environmental Toxicology and Chemistry 33.9 (2014), pp. 1573–1590. [CrossRef]
- Adamopoulos IP, Valamontes A, Karantonis JT, Syrou NF, Damikouka I, Dounias G. “The Impact of PFAS on the Public Health and Safety of Future Food Supply in Europe: Challenges and AI-Driven Solutions”. In: European Journal of Sustainable Development Research (2025). [CrossRef]
- J. Ling and L. Zhu. “Recent advances in PFAS soil remediation technologies”. In: Critical Re- views in Environmental Science and Technology 51.22 (2021), pp. 2579–2616.
- X. Zhang, J. Zhang, and J. Duan. “Electrokinetic remediation of PFAS-contaminated soil: Lab- oratory investigation”. In: Chemosphere 244 (2020), p. 125497. [CrossRef]
- R. Smith and T. W. Jeffries. “Sequential multi-modal remediation for PFAS: A One Health perspective”. In: Science of The Total Environment 838 (2022), p. 156691. [CrossRef]
- Aoude and C. R. McIntyre. “Biological degradation of PFAS by microorganisms: Progress and perspectives”. In: Applied Microbiology and Biotechnology 103.11 (2019), pp. 4651–4663.
- University of Rhode Island STEEP. Sources, Transport, Exposure & Effects of PFAS: Cape Cod Case Study. Tech. rep. University of Rhode Island, 2024. url: https://web.uri.edu/steep/ communities/cape-cod/ (Accessed on 3 June 2025).
- Moran. “Study: Toxic contamination at Joint Base Cape Cod could persist for centuries”. In: WBUR (2023). url: https://www.wbur.org/news/2023/05/15/pfas-water-joint-base- cape-cod. (Accessed on 5 June 2025).
- US EPA. Technical Brief: PFAS Soil Remediation. Tech. rep. EPA-820-F-20-XXX. US Environ- mental Protection Agency, 2020.
- Y. Guo and D. Zhong. “Ultrasonic-assisted soil remediation: Mechanisms and applications”. In: Journal of Hazardous Materials 322 (2017), pp. 27–36. [CrossRef]
- Thermo Fisher Scientific. Q Exactive Orbitrap MS Operator’s Manual. 2016.
- Z. Wang and J. Thompson. “Role of advanced analytical techniques in PFAS determination”. In: Journal of Chromatography A 1547 (2018), pp. 1–16. [CrossRef]
- US EPA. Method 537.1: Determination of PFAS in drinking water. Tech. rep. US Environmental Protection Agency, 2018.
- K. Sasaki and Y. Cai. “Adsorption materials for PFAS removal: Graphene oxide and biochar”. In: Environmental Science: Water Research & Technology 8.5 (2022), pp. 946–959.
- Jeong, N. , Park, S., Mahajan, S., Zhou, J., Blotevogel, J., Li, Y., Tong, T., & Chen, Y. (2024). Elucidating governing factors of PFAS removal by polyamide membranes using machine learning and molecular simulations. Nature Communications, 15(1), Article 10918. [CrossRef]
- Adamopoulos, I.; Valamontes, A.; Tsirkas, P.; Dounias, G. Predicting Workplace Hazard, Stress and Burnout Among Public Health Inspectors: An AI-Driven Analysis in the Context of Climate Change. Eur. J. Investig. Health Psychol. Educ. 2025, 15, 65. [Google Scholar] [CrossRef] [PubMed]
- Lazova-Borisova, İ., & Adamopoulos, I. P. (2024). Compliance of carminic acid application with european legislation for food safety and public health. International Journal of Agricultural and Natural Sciences, 17(1), 89-99. [CrossRef]
- Adamopoulos, I.; Syrou, N.; Mpourazanis, G.; Constantinidis, T.C.; Dounias, G. The Association of the Global Climate Crisis with Environmental Risks and the Impact of Heat Stress on Occupational Safety, Health, and Hygiene. Med. Sci. Forum 2025, 33, 2. [Google Scholar] [CrossRef]
- Adamopoulos, I.; Frantzana, A.; Adamopoulou, J.; Syrou, N. Climate Change and Adverse Public Health Impacts on Human Health and Water Resources. Environ. Sci. Proc. 2023, 26, 178. [Google Scholar] [CrossRef]
- I Adamopoulos, N Syrou, Climate Change, Air Pollution, African Dust Impacts on Public Health and Sustainability in Europe, European Journal of Public Health, Volume 34, Issue Supplement_3, November 2024, ckae144.1374. [CrossRef]
- Adamopoulos IP, Syrou NF, Adamopoulou JP, Mijwil MM. Conventional water resources associated with climate change in the Southeast Mediterranean and the Middle East countries. EUR J SUSTAIN DEV RES. 2024;8(3):em0265. [CrossRef]
- Ahrens, L. , & Bundschuh, M. (2014). Fate and effects of poly- and perfluoroalkyl substances in the aquatic environment: A review. Environmental Toxicology and Chemistry, 33(9), 1921–1929. [CrossRef]
- EPA PFAS Roadmap. (2021). Environmental Protection Agency’s strategic plan for addressing PFAS. https://www.epa.gov/pfas (Accessed on 4 June 2025).
- Agency for Toxic Substances and Disease Registry (ATSDR). (2020). PFAS Exposure Assessments Final Report. Source: https://www.atsdr.cdc.gov/pfas (Accessed on 1 June 2025).
- Giesy, J. P., & Kannan, K. (2001). Global distribution of perfluorooctane sulfonate in wildlife. Environmental Science & Technology, 35(7), 1339–1342. [CrossRef]
- European Food Safety Authority (EFSA). (2020). Risk assessment of PFAS in the food chain. https://www.efsa.europa.eu (Accessed on 8 June 2025).
- Ghisi, R. , Vamerali, T., & Manzetti, S. (2019). Accumulation of perfluorinated alkyl substances (PFAS) in agricultural plants: A review. Environmental Research, 169, 326–341. [CrossRef]
- European Chemicals Agency (ECHA). (2020). Annex XV restriction report: Proposal for a restriction on per- and polyfluoroalkyl substances (PFAS). https://echa.europa.eu/ (Accessed on 3 June 2025).
- Kotthoff, M., Müller, J., Jürling, H., Schlummer, M., & Fiedler, D. (2015). Perfluoroalkyl and polyfluoroalkyl substances in consumer products. Environmental Science and Pollution Research, 22(19), 14546–14559. [CrossRef]
- Liu, Y. , D'Agostino, L. A., Qu, G., Jiang, G., & Martin, J. W. (2019). High-resolution mass spectrometry (HRMS) methods for nontarget discovery and characterization of poly- and perfluoroalkyl substances (PFASs) in environmental and human samples. Trends in Analytical Chemistry, 121, 115420. [CrossRef]
- OECD. (2021). OECD principles on per- and polyfluoroalkyl substances (PFAS): Towards a framework for global action. Organisation for Economic Co-operation and Development. Retrieved from https://www.oecd.org/ (Accessed on 3 June 2025).
- Rahman, M. F., Peldszus, S., & Anderson, W. B. (2014). Behaviour and fate of perfluoroalkyl and polyfluoroalkyl substances (PFASs) in drinking water treatment: A review. Water Research, 50, 318–340. [CrossRef]
Figure 1.
The study's results of the Impact of Remineralization on Soil Health.
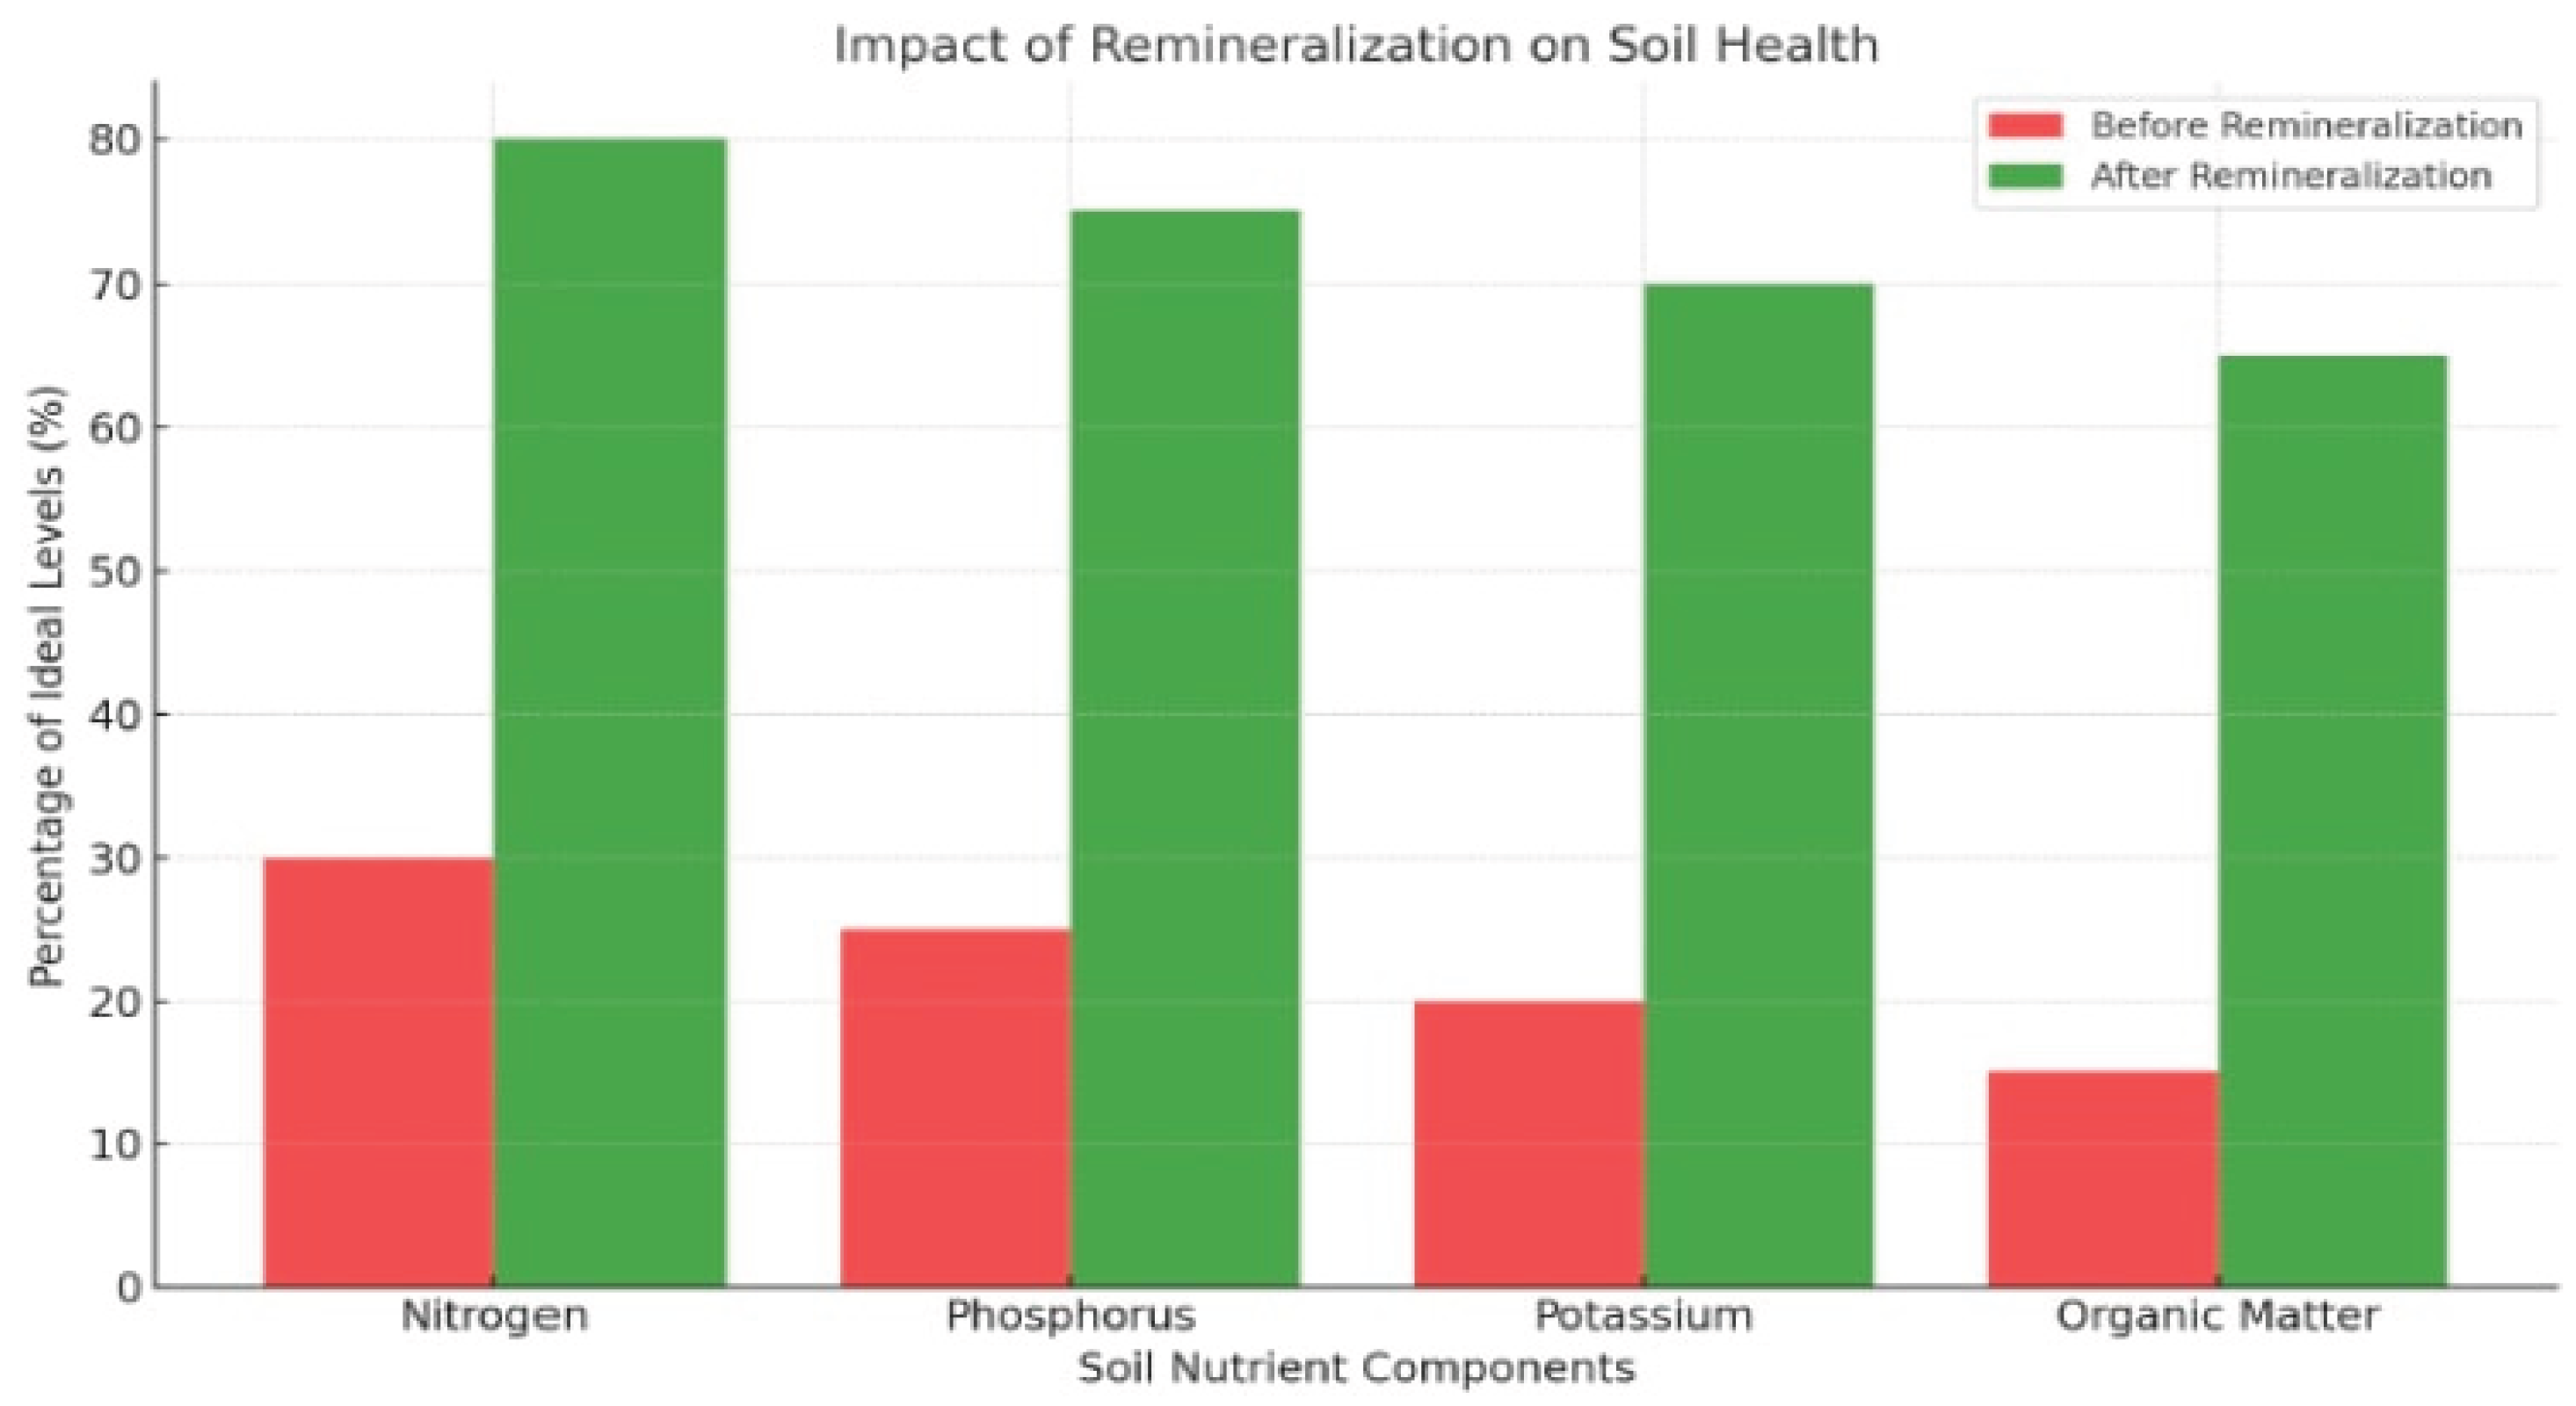
Figure 2.
The study's results for policy and management recommendations strength for PFAS remediation in regions Asia, Australia, EU, USA, and Greece.
Figure 2.
The study's results for policy and management recommendations strength for PFAS remediation in regions Asia, Australia, EU, USA, and Greece.
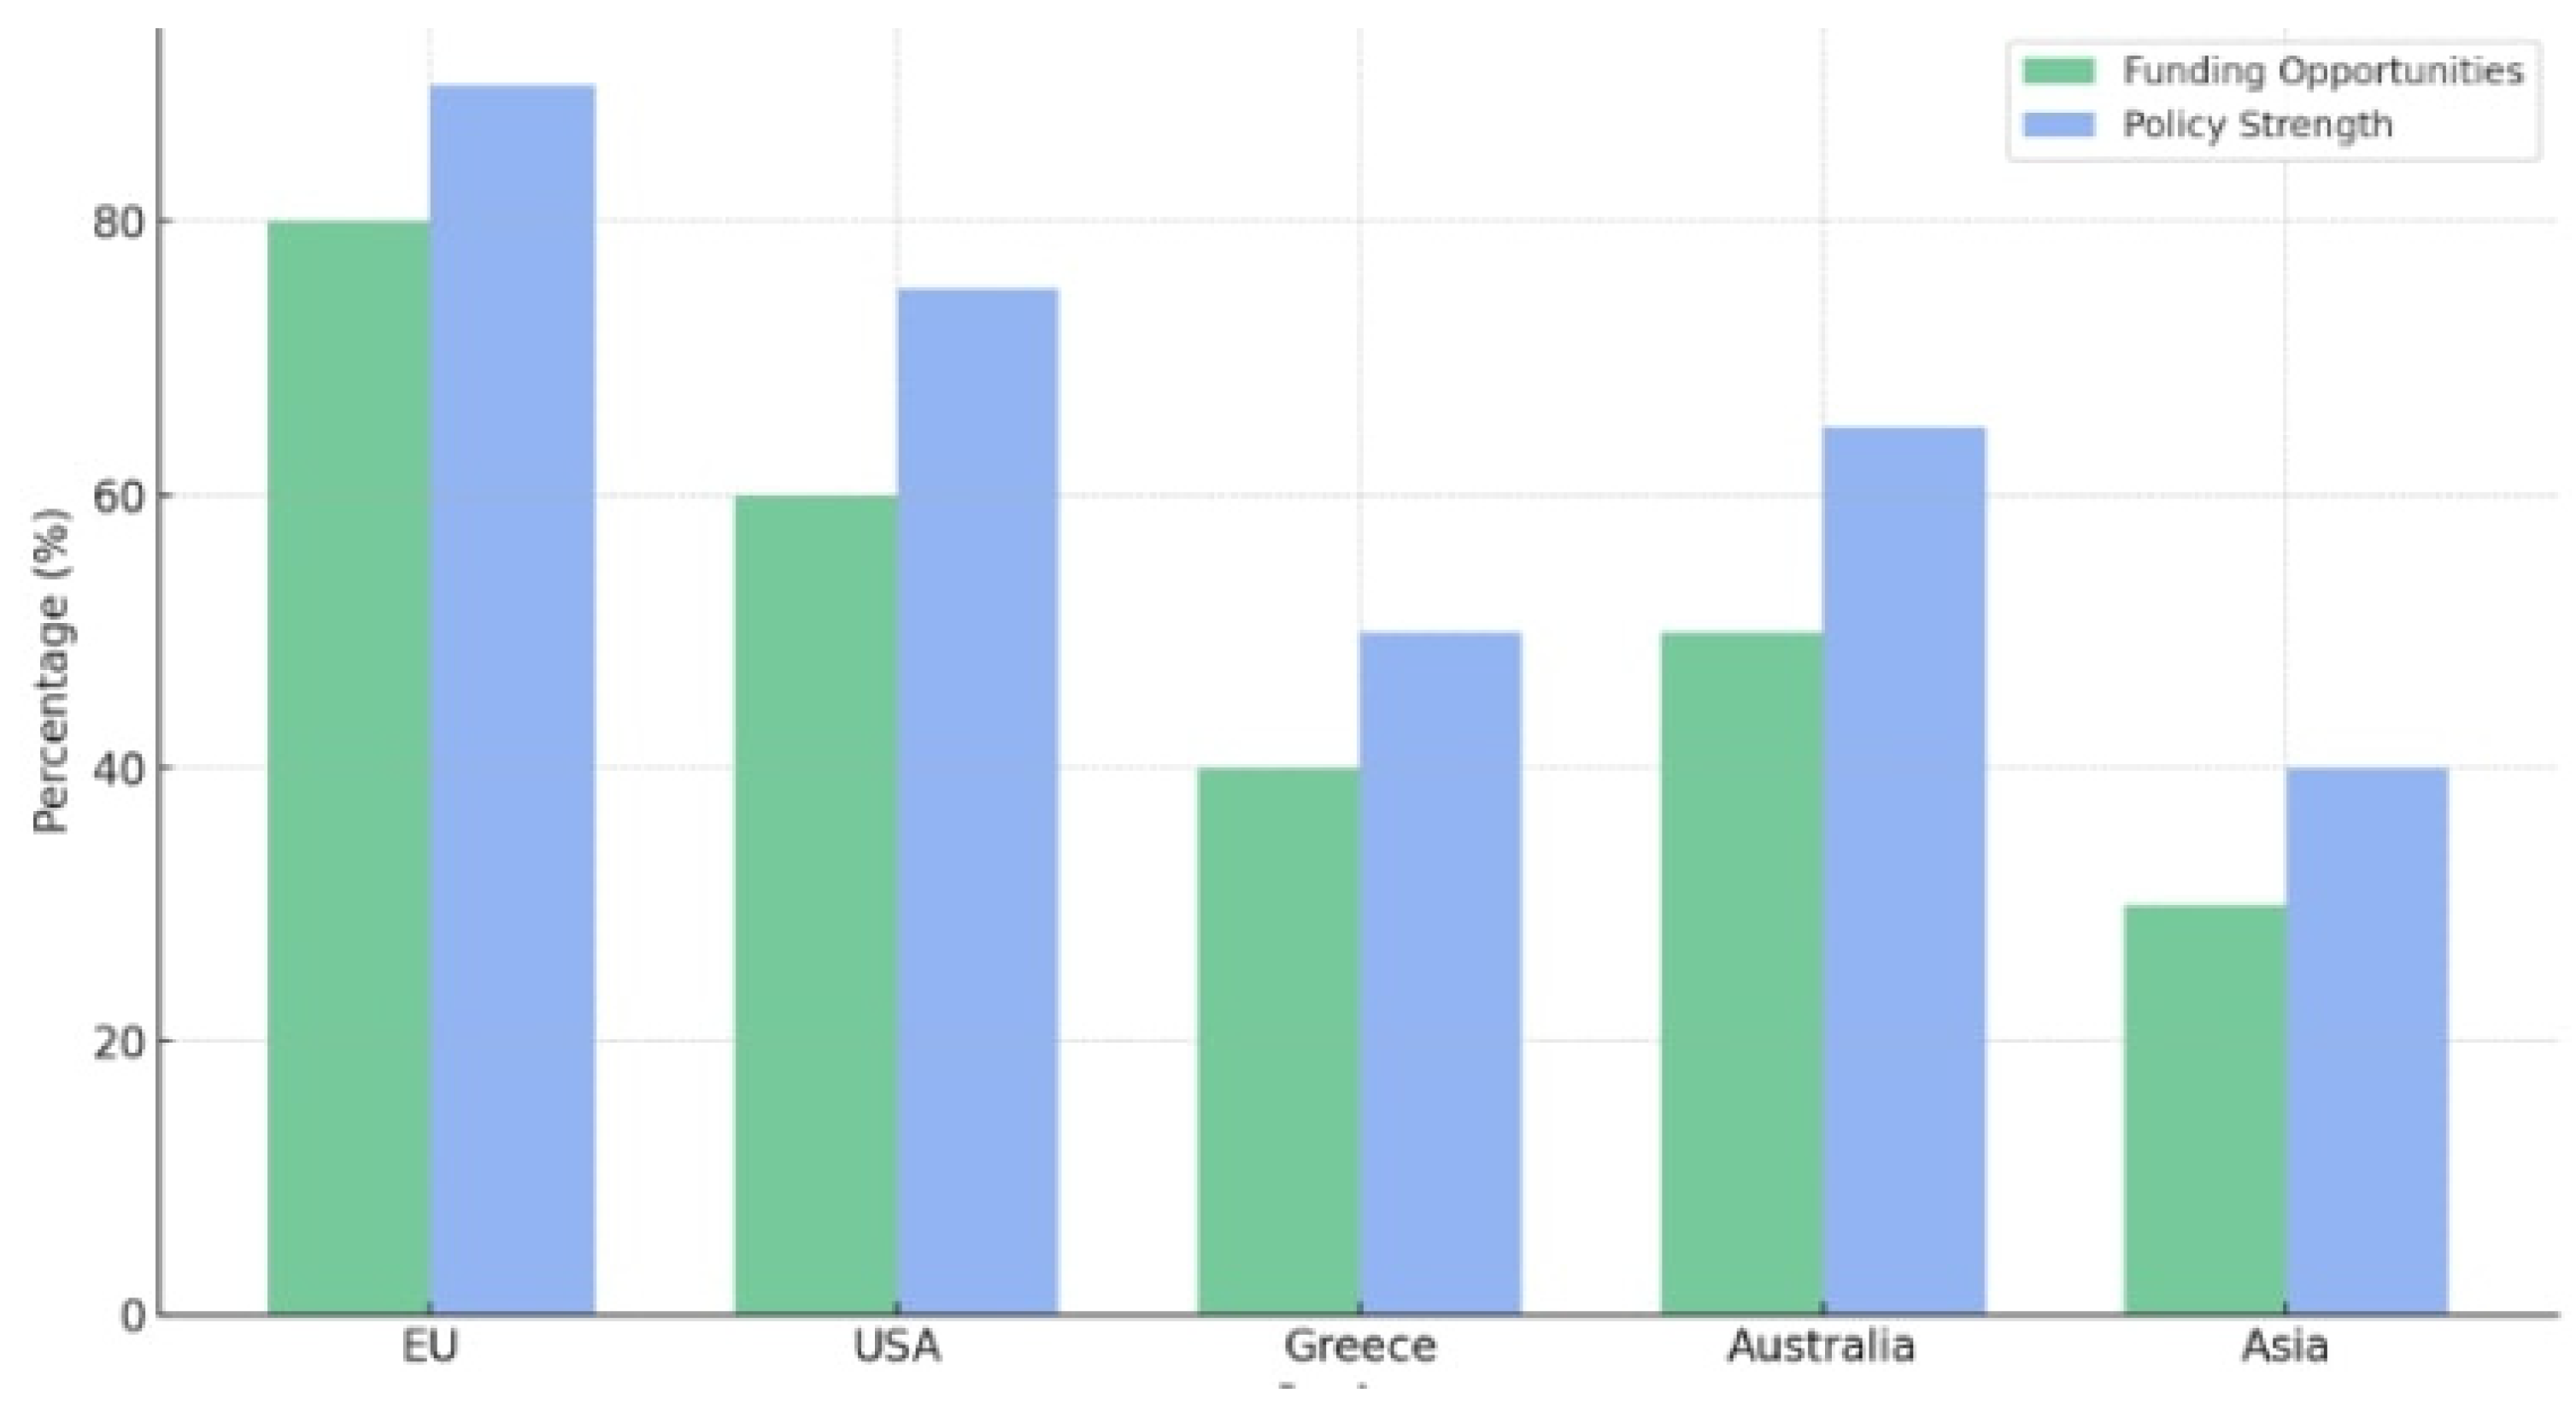
Figure 3.
The analysis of the needs for remediation on Farmland Loss Due to PFAS Over the Next 25 Years between the E.U. & U.S.A.
Figure 3.
The analysis of the needs for remediation on Farmland Loss Due to PFAS Over the Next 25 Years between the E.U. & U.S.A.
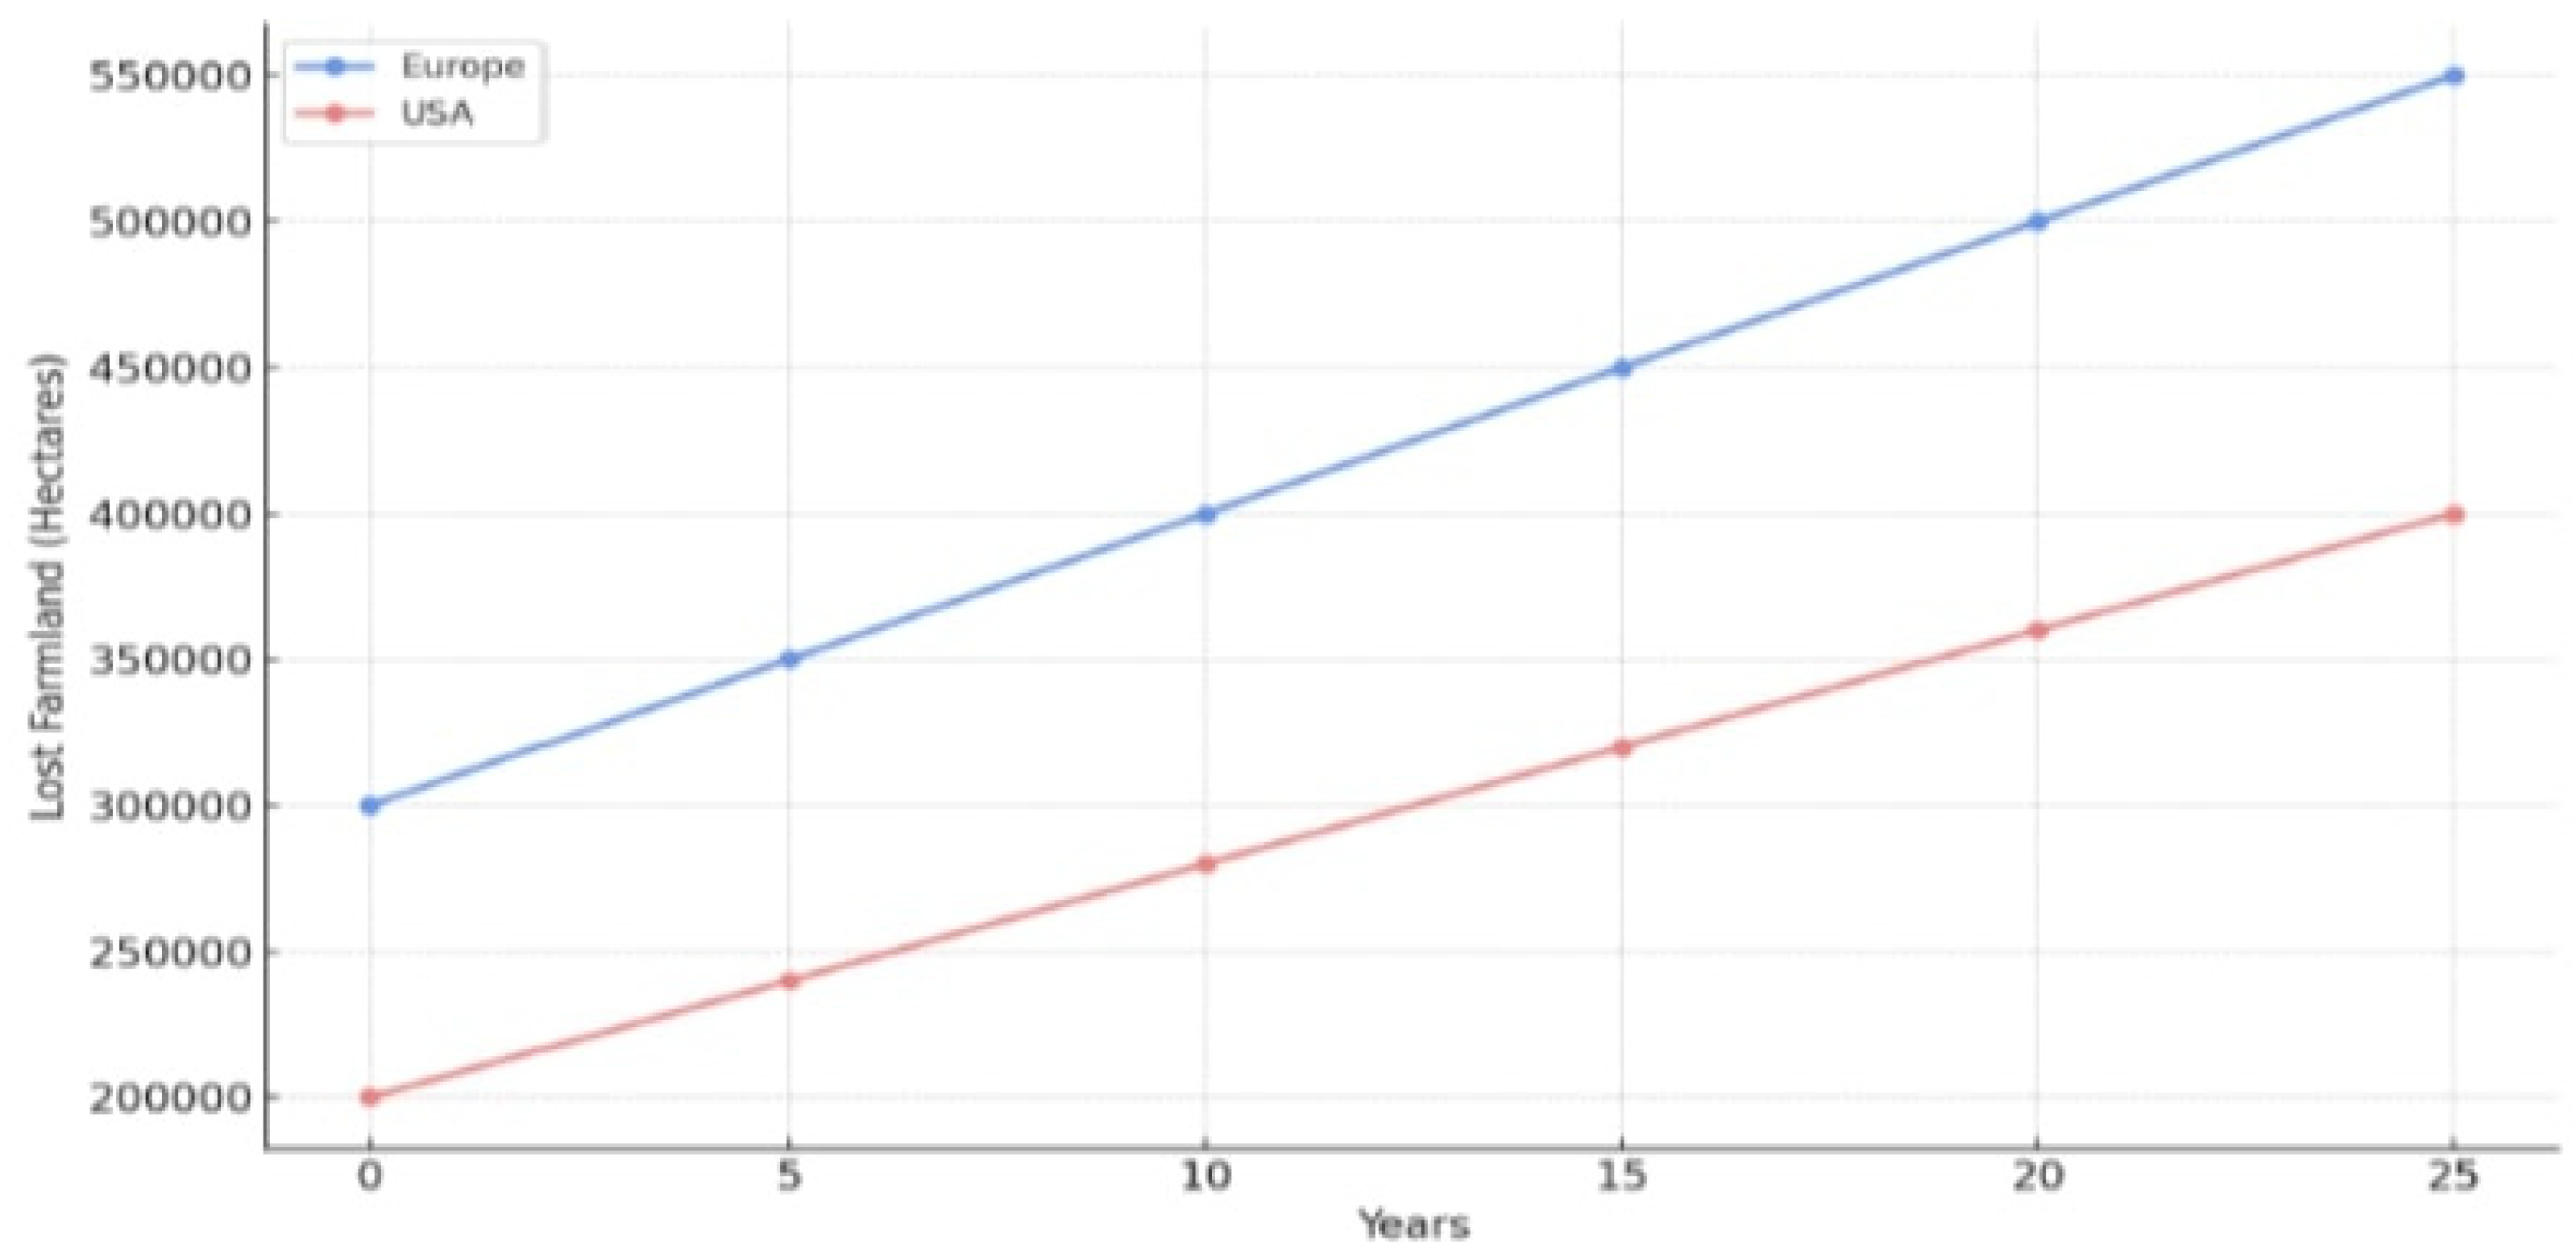

Table 1.
Representation PFAS Remediation and Data Compliance Costs.
| Category | PFAS Uptake Pathways | Impacts on Yield/Quality | Economic Impact |
|---|---|---|---|
| Crops | Soil-to-root transfer; irrigation water | Reduced grain size (20%), lower protein content | Loss of income from reduced yield |
| Dairy | Contaminated feed | Elevated PFAS levels in export restrictions | Market losses from unsellable products |
| Meat | Elevated PFAS levels in milk | Muscle tissue contamination; health risks to consumers | Decreased market demand |
| Eggs | PFAS in poultry feed | High PFAS concentration in eggs | Regulatory non-compliance fines |
| Water | Contaminated conventional water resources | High PFAS concentration in Water | Loss of income conventional water resources |
| Milk | Contaminated feed | Elevated PFAS levels in milk | Regulatory non-compliance fines, and Market losses from unsellable products |
Disclaimer/Publisher’s Note: The statements, opinions and data contained in all publications are solely those of the individual author(s) and contributor(s) and not of MDPI and/or the editor(s). MDPI and/or the editor(s) disclaim responsibility for any injury to people or property resulting from any ideas, methods, instructions or products referred to in the content. |
© 2025 by the authors. Licensee MDPI, Basel, Switzerland. This article is an open access article distributed under the terms and conditions of the Creative Commons Attribution (CC BY) license (http://creativecommons.org/licenses/by/4.0/).
Copyright: This open access article is published under a Creative Commons CC BY 4.0 license, which permit the free download, distribution, and reuse, provided that the author and preprint are cited in any reuse.


