
Submitted:
13 July 2025
Posted:
15 July 2025
You are already at the latest version
Abstract
Laboratory astrophysics is an emerging interdisciplinary field bridging high-energy-density plasma physics and astrophysics. Optical diagnostic techniques, leveraging their high spatiotemporal resolution and capability for synchronous multi-physical-field inversion, have become indispensable tools for deciphering extreme plasma dynamics in laboratory astrophysics. This review systematically elaborates on the physical principles and inversion methodologies of key optical diagnostics, including Nomarski interferometry, shadowgraphy, and Faraday rotation. Highlighting frontier progress by our team, we showcase the application of these techniques in analyzing jet collimation mechanisms, turbulent magnetic reconnection, collisionless shocks, and particle acceleration. Future trajectories for optical diagnostic development are also discussed.
Keywords:
laboratory astrophysics
; optical diagnostic
; laser
1. Introduction
Astrophysics seeks to unravel the laws governing cosmic evolution, encompassing phenomena across the full spectrum from stellar formation to galactic evolution. Traditional research paradigms are often constrained by extreme distances, protracted timescales, and the inherent uncontrollability of astrophysical environments, presenting significant challenges for acquiring detailed physical parameters within localized space-time domains. Recent advancements in high-power laser technology have enabled the recreation of extreme astrophysical environments under controlled laboratory conditions. These experiments offer unique advantages, including proximity, transient nature, controllability, active probing, and repeatability [1], thereby providing a novel pathway for the quantitative validation of astrophysical theories and the elucidation of underlying microscopic physical mechanisms [2]. Laboratory astrophysics emerged in the 1990s, driven by the recognition of profound physical similarities between plasmas generated by intense lasers and key astrophysical phenomena, such as radiation transport, hydrodynamic instabilities, and magnetic reconnection [3]. Over decades of development, laboratory astrophysics has yielded numerous significant achievements. These include resolving the Cepheid variable star pulsation mystery through experimentally determined key opacity data [4], alongside insights into stellar formation dynamics [5], the evolution of Rayleigh-Taylor (RT) instabilities in supernova remnants [6], the structure of X-ray sources atop solar flare loops [7], kink instabilities in the Crab Nebula jet [8], the physical conditions governing magnetic field origins in the interstellar medium [9], and the frontier detection of thermonuclear reactions in stellar cores [10].
The core objective of laboratory astrophysics is to uncover the physical principles governing matter under extreme plasma conditions relevant to astrophysics. These environments are characterized by extreme parameters: ultra-high temperatures (), ultra-high pressures (), and intense self-generated magnetic fields ( range). Accurate physical modeling of such systems critically depends on the precise resolution of multiscale parameters, including density gradients, magnetic field configurations, and particle energy spectra. However, the transient nature of these extreme environments (with timescales ranging from nanoseconds to picoseconds) and the presence of intense gradients pose unprecedented challenges for conventional diagnostic techniques.
In this context, optical diagnostics have emerged as pivotal tools for dissecting fundamental processes such as radiation transport, shock wave evolution, and magnetic reconnection [11,12,13,14,15,16]. Their critical advantages lie in high spatiotemporal resolution and the capability for synchronous inversion of multiple physical fields. Key techniques include optical shadowgraphy for capturing plasma contour dynamics, Nomarski interferometry for density gradient mapping, and Faraday rotation for inferring axial magnetic field strength. The synergistic application of these diagnostics provides robust support for the ongoing transformation of laboratory astrophysics from macroscopic phenomenon simulation towards the deep analysis of microscopic mechanisms. For instance, Sano et al. [17] successfully captured the shock-induced growth of Richtmyer-Meshkov instability perturbations and the turbulent amplification of a weak seed magnetic field using optical shadowgraphy combined with B-dot probes, confirming the crucial role of this mechanism in interstellar magnetic field enhancement. Kuramitsu et al. [16], employing combined Nomarski interferometry and self-emission imaging, revealed plasma self-focusing and jet propagation at the electron Alfvén velocity under conditions of electron magnetization in a weak vertical magnetic field, providing direct experimental evidence for electron-dynamics-dominated microscopic magnetic reconnection. Revet et al. [18] quantitatively analyzed the decay of jet collimation efficiency with increasing magnetic field inclination angle using Nomarski interferometry and X-ray spectroscopic imaging, elucidating the significant redirection effect of large-scale ambient magnetic field configurations on astrophysical jet evolution.
This paper systematically elucidates the framework of optical diagnostic techniques for laser-produced plasmas, with a focused analysis on their physical principles, performance parameters, and inversion methodologies. We will also briefly highlight our team’s recent research advances utilizing these optical diagnostics within the field of laboratory astrophysics.
2. Optical Diagnostic System
2.1. Optical Diagnostic Setup
The diagnostic configurations and experiments described herein were primarily conducted using the Shenguang-II (SG-II) laser facility located at the Shanghai Institute of Optics and Fine Mechanics, China. Figure 1a and b schematically illustrate the optical diagnostic layout relative to the target chamber. The background pressure within the target chamber was maintained at . The SG-II facility delivers eight beams, each with an energy , a wavelength of 351 , and a pulse duration of 1 . As depicted in Fig. 1, a counterfoil target configuration was employed, utilizing a pair of copper foils separated by 4.5 . The eight drive beams were symmetrically split into two groups and simultaneously focused onto the opposing surfaces of the foils, achieving a focal spot diameter of 150 . The expanding plasma flows interact near the midplane between the foils. A ninth probe laser beam, with a wavelength of 527 and a duration of 30 , was directed transversely through the interaction region to serve as the diagnostic probe. This probe enabled three distinct optical diagnostics: Nomarski interferometry, shadowgraphy, and Faraday rotation. The temporal evolution of the plasma within the interaction region was captured by varying the relative delay time between the main drive beams and the probe beam. Representative images obtained from these diagnostics are shown in Figure 1c (interferogram), Figure 1d (Faraday rotation image), and Figure 1f (shadowgraphy).
2.2. Principles of Optical Diagnosis
Figure 2 illustrates the schematic principles of data analysis for the three diagnostics. After traversing the plasma, the probe light undergoes changes in phase, polarization state, and intensity. The Nomarski interferometer, constructed based on the variation of optical phase, can provide the distribution of electron number density and velocity. The Faraday rotation, established based on the variation of optical polarization, can measure the distribution of magnetic field strength along the direction of the probe light. Shadowgraphy is highly sensitive to the second spatial derivative of electron density and can reveal the spatial profile of plasma outflow. The measurement principles of these three optical diagnostics will be detailed in the following section.
2.2.1. Nomarski Interferometer
Nomarski interferometry employs a strictly equal-path interference scheme. For experiments involving nanosecond-scale laser pulses driving solid targets, only the spatial coherence needs consideration. Assuming the probe laser is initially horizontally linearly polarized, a front polarizer (acting as the polarizer) is rotated by relative to the horizontal axis. After passing through the plasma region, the probe light is relayed through primary and secondary imaging lenses onto a CCD camera. Emerging from the secondary imaging lens as a spherical wave, the light passes through a Wollaston prism positioned near the lens’s focal point. The prism splits the wave into two beams with orthogonal polarizations: the ordinary (o) and the extraordinary (e). A final polarizer (analyzer), oriented perpendicularly to the initial polarizer, is placed before the final image plane. Interference fringes are thus formed on the image plane. The fringe width can be adjusted by altering the position of the Wollaston prism relative to the secondary imaging lens.
Nomarski interferometry primarily retrieves the electron density distribution and the propagation velocity of the plasma. The relationship between electron density and fringe shift is derived as follows:
where is the critical density (), D is the displacement of the stripes, and is the probe wavelength. Both are known constants for a given probe laser. Utilizing this equation, the two-dimensional electron density distribution perpendicular to the probe beam path can be obtained via Abel inversion, applicable where the electron density . Furthermore, the average plasma velocity () is determined from the fringe displacement observed at different relative delay times.
2.2.2. Shadowgraphy
Shadowgraphy employs short-pulsed laser probes (e.g., picosecond or femtosecond durations) directed through a target region (plasma expansion zone) to directly image plasma morphology. The receiving device is a scientific-grade CCD camera, enabling the capture of transient plasma evolution at millimeter spatial scales and nanosecond temporal resolutions. Research establishes that shadowgraphy imaging primarily depends on the probe laser intensity and the refractive index distribution within the plasma region. When the probe laser traverses the plasma under vacuum conditions, probe rays undergo deflection, inducing intensity variations at the imaging plane. The deflection angles ( and representing the angles in the x- and y-directions, respectively) are proportional to the gradient of the refractive index () within the observed plasma region, expressed as:
The relative change in intensity (I) at the imaging plane compared to the incident probe intensity () is proportional to the divergence (gradient) of the deflection angles, expanded as:
Consequently, the resultant shadowgram is proportional to the second-order spatial derivative of the refractive index. High-resolution shadowgraphy images are obtained only when refractive index gradients exhibit significant spatial variation (i.e., non-uniform plasma density structures are present).
2.2.3. Faraday Rotation
When a linearly polarized optical probe traverses a magnetized plasma medium, its plane of polarization undergoes rotation about the axis defined by the local magnetic field vector. The presence of a magnetic field within the plasma implies that the scattering process depends not only on the electron density but also intrinsically on the magnetic field configuration. To enable single-shot diagnostics of the probe beam’s polarization state change, a Wollaston prism is employed experimentally to split the beam into two orthogonally polarized components. These components ordinary (O) and extraordinary (E) are imaged non-interferometrically onto the same CCD detector. This configuration is functionally analogous to a Nomarski interferometer but operates without beam coherence, facilitating spatially separated imaging of each polarization component. This optical design permits direct pixel-by-pixel comparison of intensity variations between the two images, thereby enabling quantitative determination of the Faraday rotation angle for the probe beam.
The polarization probe, exhibiting the magnetic-field-induced Faraday rotation, is resolved by the Wollaston prism into the two orthogonal polarization states: ordinary (O) and extraordinary (E) components. A square aperture positioned at the primary image plane ensures that the modulated intensity distributions of both the O-ray () and E-ray () are captured across the full field of view by a scientific-grade CCD camera. The Faraday rotation angle () is calculated by inverting the measured intensity ratio of the images, satisfying the relation . Furthermore, is related to the magnetic field strength (B) via: , where is the electron density and is the probe wavelength. The derived component represents the magnetic field projection parallel to the probe beam propagation direction.
3. Typical Applications in Laboratory Astrophysics
3.1. Study on the Formation and Evolution of Collimated Jets
Astrophysical jets are highly collimated, supersonic plasma outflows ejected from various astrophysical systems. They are ubiquitously observed in diverse environments, including young stellar objects (YSOs), planetary nebulae, active galactic nuclei (AGNs), and gamma-ray bursts [19,20,21,22]. The triggering mechanisms and collimation processes of these jets remain central topics in astrophysics. While radiative cooling, magnetic fields, and the surrounding interstellar medium (ISM) are currently regarded as key factors influencing jet collimation, the precise details remain unresolved [23,24,25]. Given the inherent complexity of jet evolution and the limitations imposed by finite observation times and viewing angles for specific astrophysical jets, high-power laser facilities have emerged in recent years as vital tools for complementing astrophysical observations and theoretical modeling.
Here, Yuan et al. [26] utilized the SG-II laser facility to irradiate C-shaped targets, generating colliding plasma flows. We employed a combined diagnostic approach using Nomarski interferometer and shadowgraphy imaging to diagnose the jet formation and evolution dynamics in real-time, as illustrated in Figure 3. Specifically, CH (plastic) targets and high-Z Au (gold) targets were used to investigate the effect of differing radiative cooling efficiencies on plasma propagation.
The experiments reveal a striking contrast: The Au target, exhibiting strong radiative cooling, produced a highly collimated jet with a characteristic velocity of , a narrow radius of , and a high aspect ratio of (Figure 3 a, b). In stark contrast, the CH target produced a significantly diffused outflow with a radius of and a much lower aspect ratio of (Figure 3 c, d). This pronounced morphological disparity provides direct experimental evidence that radiative cooling is the core physical mechanism responsible for maintaining tight collimation in the Au jet. The radiative cooling power () causes the thermal radial expansion of the gold plasma to be counteracted by a strong density collapse effect, thereby enabling the Au jet to maintain a stable, narrow radius during propagation. Conversely, the CH outflow, lacking efficient cooling, exhibits dynamics dominated by thermal pressure, resulting in rapid radial expansion (expansion velocity ). This work demonstrates for the first time in a laboratory setting the synergistic dominance of radiative cooling and the photoionized ambient medium in achieving and sustaining jet collimation.
3.2. Study on Turbulent Magnetic Reconnection
Turbulent magnetic reconnection represents a fundamental mechanism for magnetic energy dissipation in plasmas. Its dissipation region is characterized by fragmented current sheets containing multiple reconnection sites, exhibiting phenomena such as splitting, disruption, and the acceleration of energetic electrons and ions. This process is ubiquitously observed in astrophysical plasma environments, including the solar atmosphere and Earth’s magnetosphere [27,28,29,30,31]. Previously, direct in situ probing of the fragmented current sheet structures and turbulent cascade processes inherent to turbulent reconnection has proven exceptionally challenging.
Ping et al. [32] have achieved the first laboratory realization of laser-driven turbulent magnetic reconnection using the SG-II facility. As depicted in Figure 4a, four symmetrically incident laser beams irradiated two parallel Al foil targets separated by 600 . This setup generated oppositely directed toroidal magnetic fields via the Biermann battery effect. Employing 60 green probe laser shadowgraphy () combined with Fourier power spectrum analysis, the experiment captured, for the first time in a laboratory setting, the turbulent fragmentation of the current sheet (Figure 4b, c). Under strong drive conditions (Case I: 200 focal spot separation), the current sheet exhibited significantly enhanced density fluctuations. Its power spectrum manifested dual power-law scaling: in the fluid regime () and in the ion inertial range () (Figure d). Under weak drive conditions (Case II: 400 separation), the corresponding spectral indices were and (Figure 4e). This spectral evolution – consistent with turbulent spectra observed in the heliosphere – confirms that strong driving enhances the turbulent cascade. Crucially, the variation in spectral indices is directly linked to magnetic island formation resulting from current sheet fragmentation. These findings provide critical insights into energy dissipation, the origins of high-energy particles, and acceleration mechanisms in solar flares.
3.3. Experimental Observation of Electrostatic Shock Wave Pairs
Collisionless shocks represent a remarkable phenomenon in space and astrophysical plasmas, where supersonic flows generate electromagnetic fields via instabilities, enabling particle acceleration to cosmic-ray energies. Despite abundant astrophysical observations, understanding these microscopic processes remains a fundamental challenge. Yuan et al. [33] investigated the formation and evolution of counter-propagating electrostatic shocks using laser-driven, symmetric copper (Cu) foils. Figure 5 present characteristic interferograms and the corresponding electron density distributions within the interaction region at and , respectively. At (Figure 5a, c), the two colliding plasma streams (initial density , relative velocity ) undergo mutual penetration near the center (), forming an overlapping double-shock structure. The peak density reaches , significantly exceeding the free-stream superposition expectation (), yielding a density jump ratio of 2.6. The shock transition width of 450 is substantially smaller than the ion mean free path (), confirming the collisionless nature of the shocks. By (Figure 5b, d), the shock pair separates and propagates along the -direction. The peak density increases to , the transition region broadens to , and the average propagation velocity is , corresponding to a Mach number .
Theoretical analysis identifies these shocks as electrostatically dominated. Applying the electrostatic shock width model by Park et al. [34] with experimental parameters (, ) yields a calculated width , agreeing well with measurements (). Conversely, the characteristic width for an electromagnetic (Weibel-type) shock () far exceeds the target separation (4.5 , effectively excluding its dominance. This work reports the first laboratory observation of stably propagating, counter-propagating collisionless shocks. It reveals the formation dynamics of electrostatic shock pairs in symmetric flow systems, providing a critical experimental counterpart to astrophysical shocks, such as the double-shock structures observed in supernova remnants.
3.4. Electron Stochastic Acceleration in Kinetic Turbulent Plasmas
The origin of high-energy charged particles in the universe remains a fundamental unsolved problem, long challenging astrophysicists and recognized as one of Science’s 125 pivotal questions [35,36,37,38,39]. While astronomical observations combined with simulations have provided insights into particle acceleration mechanisms—including magnetic reconnection acceleration [40,41,42], diffusive shock acceleration [43,44], and stochastic acceleration [45,46] and recent experiments have confirmed electron acceleration via processes like magnetic reconnection and collisionless shock formation [47,48], laboratory identification of stochastic acceleration as a viable mechanism has remained elusive, particularly due to challenges in generating collisionless, turbulent plasmas.
Addressing this, Yuan et al. [49] report the first direct laboratory observation of turbulent magnetic field evolution dynamics driven by the Weibel instability, employing polarization-sensitive Faraday rotation diagnostics combined with shadowgraphy imaging. The experiment, conducted on the Shenguang-II laser facility, utilized two symmetrically incident laser beams (, 1 per beam) to ablate a lithium deuteride (LiD) powder target, generating interpenetrating plasma flows (separation: 3.2 mm) with a Mach number 6. Faraday rotation measurements (Figure 6e) reveals, the magnetic field exhibits a regular filamentary structure, with a peak path-integrated field strength () of 0.75 during the linear phase (). By the nonlinear phase (), adjacent current filaments merge and kink (Figure 6f), evolving into magnetic island-like structures with spatial scales of , signifying a transition to a turbulent magnetic topology. Synchronized shadowgraphy captured the transverse growth of current filaments (Figure 6c, d). Fourier power spectrum analysis confirmed that the power spectrum of this disordered structure closely aligns with kinetic-scale turbulent spectra. Theoretical simulations indicate that the observed energetic electrons arise primarily from turbulent stochastic acceleration: Thermal electrons gain energy through multiple collisions (scattering events) with magnetic islands within the turbulent plasma. This work represents the first laboratory recreation of a kinetic-scale turbulent environment analogous to the transition phase preceding shock formation in supernova remnants. It provides critical experimental evidence for the turbulence-dominated stochastic acceleration mechanism, directly addressing the long-standing challenge of understanding the microphysical basis of particle acceleration in turbulent astrophysical plasmas.
3.5. Kelvin Helmholtz Instability
The Kelvin-Helmholtz (KH) instability, a fundamental fluid instability, is ubiquitous in space and astrophysical plasmas. Its evolution in environments such as Earth’s magnetopause is significantly regulated by magnetic fields. However, the kinetic evolution of magnetized KH instability has long lacked experimental validation, hindering our understanding of mass and energy transport processes in solar wind-magnetosphere coupling [50,51,52].
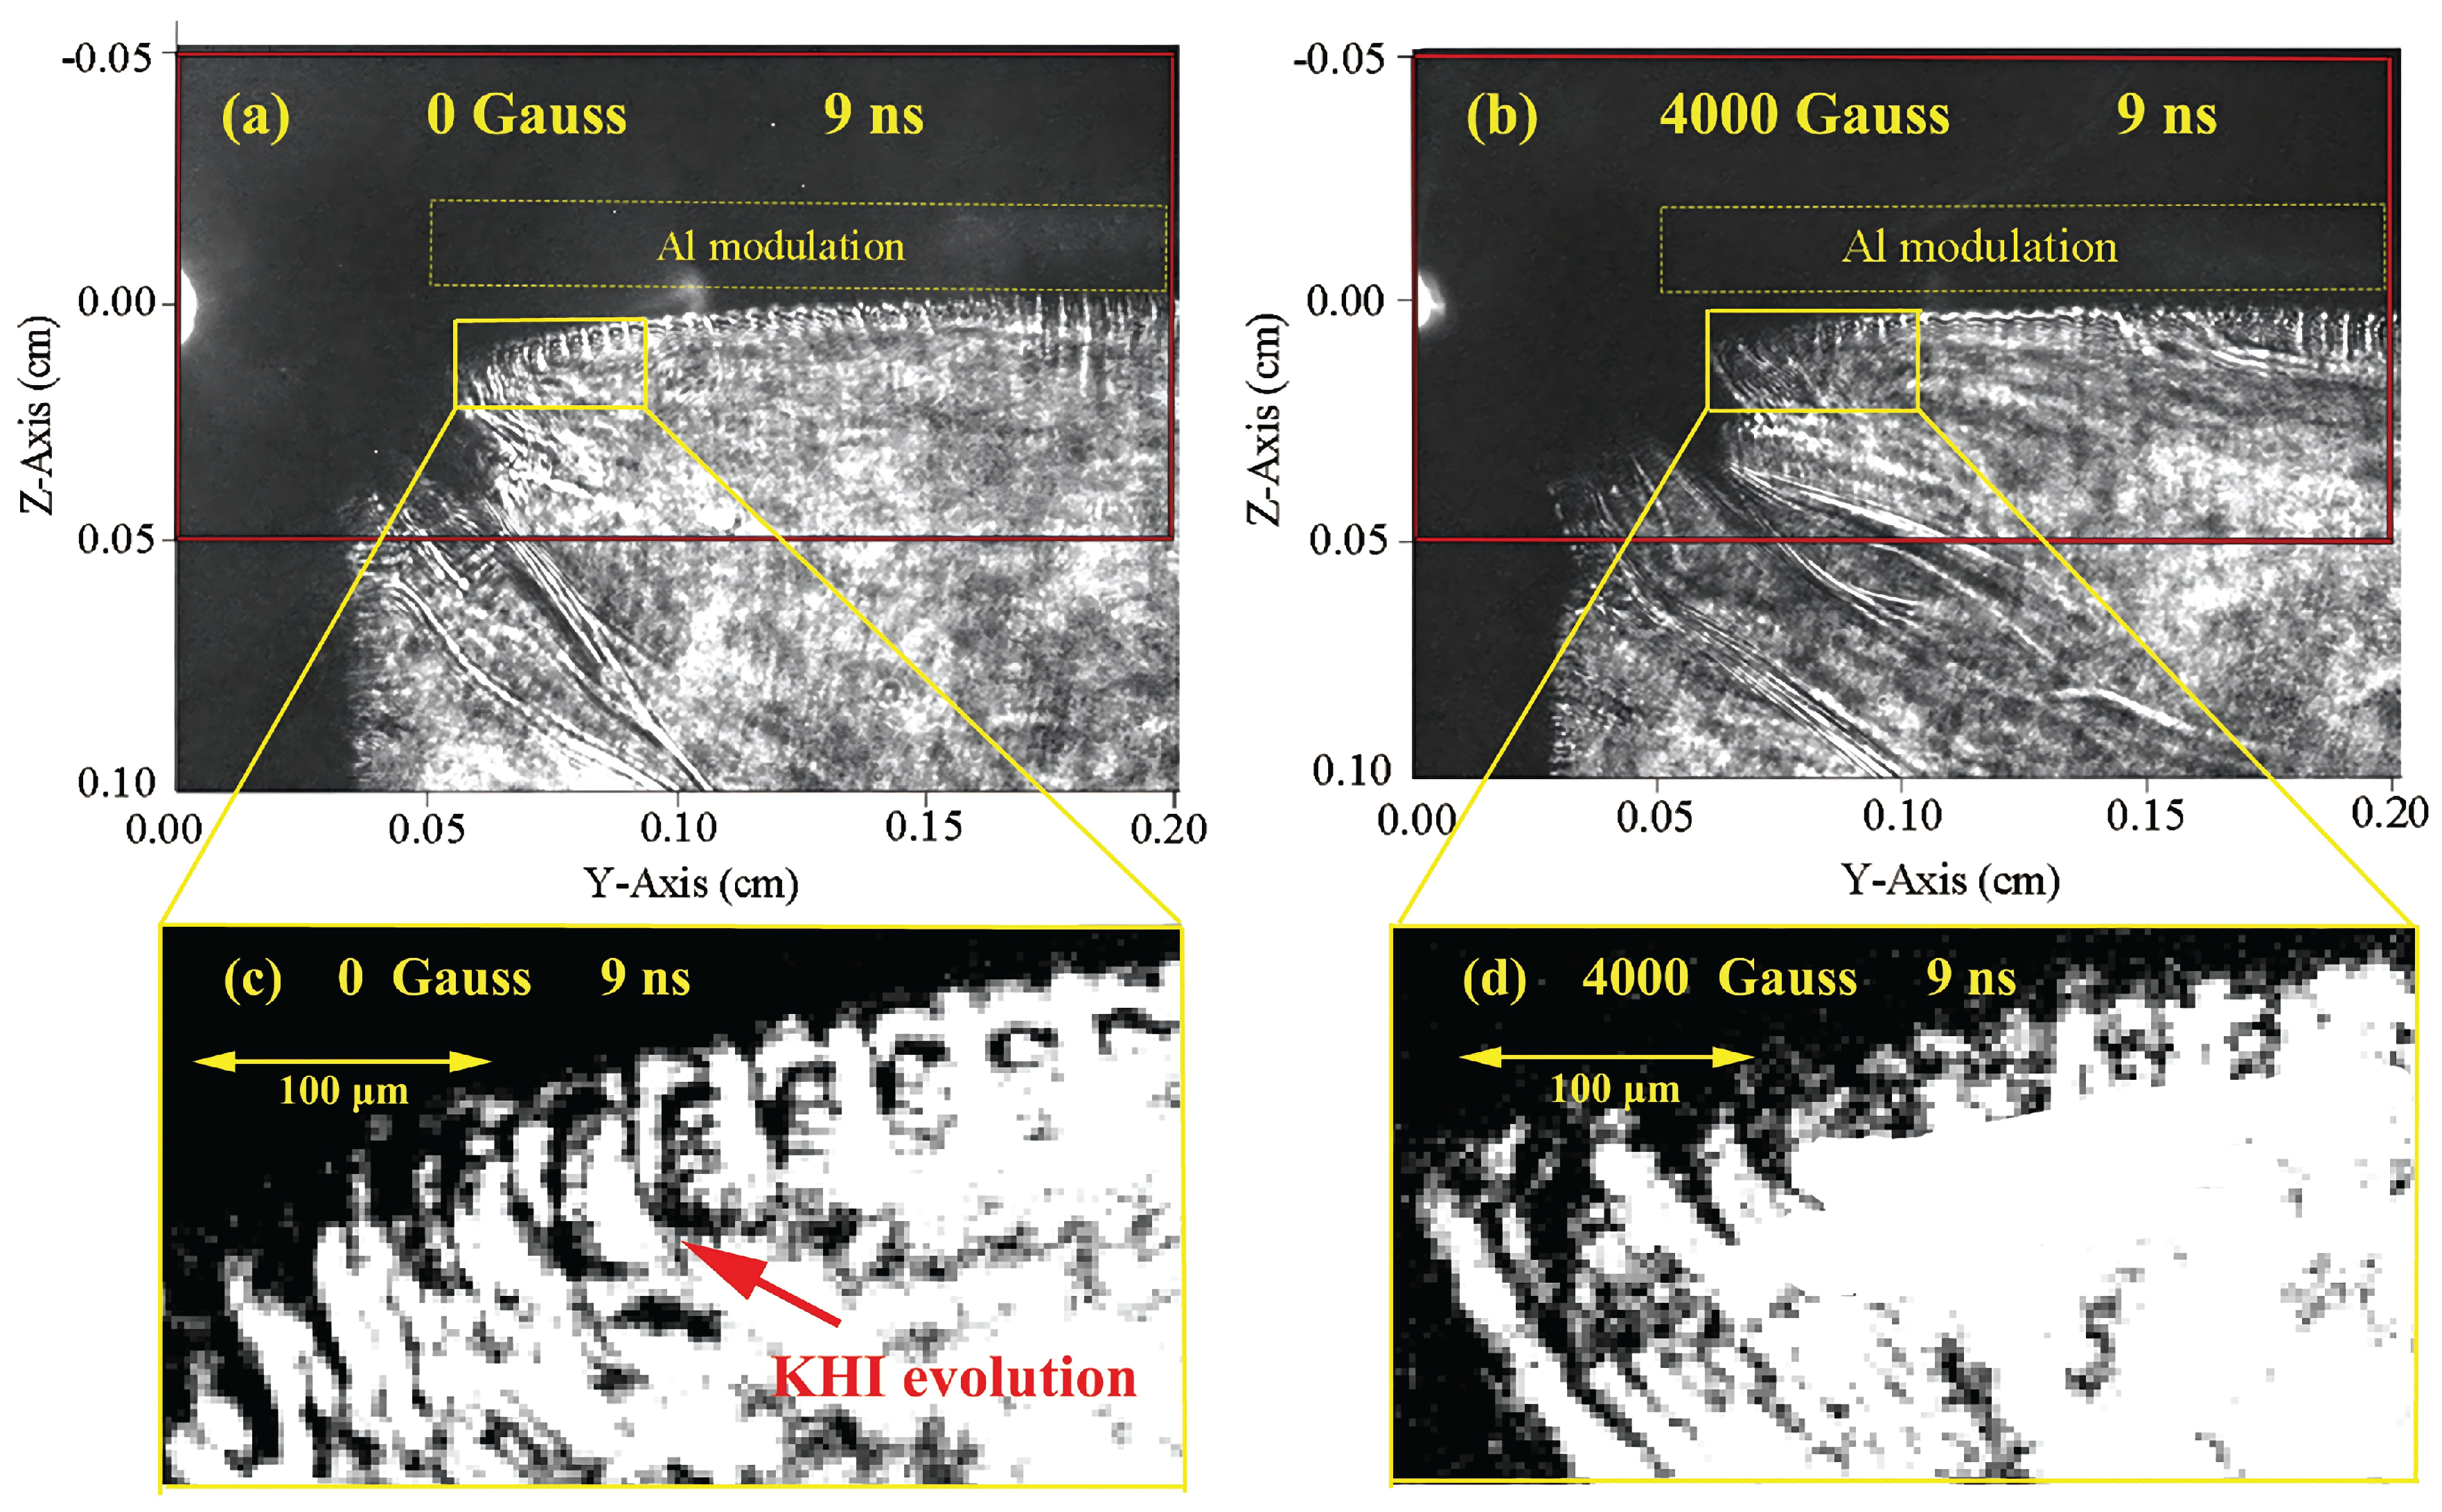
Using the SG-II laser facility, Sun et al. [53,54] conducted pioneering experiments investigating the effect of an external magnetic field on the KH instability. Four nanosecond laser beams (total energy: 1 , , intensity irradiated a 10 thick CH foil, generating a high-velocity plasma flow (). This flow interacted with a periodically modulated aluminum layer (amplitude: 25 , wavelength: 75 ), forming a velocity shear layer that subsequently developed the KH instability. A 0.4 permanent magnetic field was applied perpendicular to the plasma propagation direction (Z-axis), simulating the magnetopause’s perpendicular field configuration. Synchronous shadowgraphy and Nomarski interferometer measurements captured the KH vortex evolution. Figure 7a,c show that without the magnetic field, pronounced KH vortices form at the modulated Al layer interface, with the vortex height increasing linearly. In contrast, Figure 7b,d reveal that under a 0.4 magnetic field, the vortex count decreases by and the vortex height is significantly compressed and suppressed.
The corresponding FLASH simulations indicate that the compression of the plasma flow amplifies the external field from 0.4 to 2 . The amplified magnetic field persistently compresses the plasma, displacing the flow 150 in the +Z direction. This displacement attenuates the velocity shear layer, thereby suppressing KH instability development. This work presents the first laboratory realization and comprehensive optical diagnosis of magnetized KHI evolution spanning linear to nonlinear regimes. The experimental results align with observations from the Magnetospheric Multiscale (MMS) mission satellites and are critical for understanding solar wind-magnetosphere interactions and energy dissipation during geomagnetic storms.
4. Conclusions
This paper systematically elaborates on the pivotal role of optical diagnostic technologies in laboratory astrophysics research. By developing a synergistic diagnostic system incorporating Nomarski interferometer, shadowgraphy, and Faraday rotation, we have achieved simultaneous multiphysical field inversion of extreme plasma parameters (electron density gradient, plasma profile, magnetic field strength, velocity field) with spatiotemporal resolution reaching the picosecond and micrometer scales. Using the SG-II laser facility, we have obtained the following innovative results: (1) Jet Collimation Mechanism Analysis: Through comparative Au/CH double-target experiments, the radiative cooling effect () was quantitatively demonstrated for the first time as the key factor maintaining the high collimation (aspect ratio ) of astrophysical jets, resolving the cooling efficiency controversy in theoretical models. (2) Turbulent Magnetic Reconnection Dynamics: Fragmented current sheet structures and dual-power-law energy spectra were captured, revealing the governing influence of drive strength on turbulent cascade processes. (3) Experimental collisionless shock calibration: Stable electrostatic shock propagation (Mach number ) was observed in symmetric flow systems. The measured shock width () is in excellent agreement with the predictions of the Park model, effectively ruling out an electromagnetic shock-dominated mechanism. (4) Validation of Turbulent Stochastic Acceleration: By reconstructing the evolution of Weibel turbulence magnetic fields via Faraday rotation, the collision-dominated stochastic electron acceleration process within magnetic islands was experimentally confirmed for the first time, providing new evidence for the origin of cosmic high-energy particles. (5) Magnetohydrodynamic Instability Control: A external magnetic field was found to suppress the growth of KH vortices through shear layer compression, clarifying the physical constraints on energy transport at magnetopause boundaries.
However, the current optical diagnostic system still faces several technical challenges. First, in 3D Field Reconstruction, existing Faraday rotation techniques only invert the axial magnetic field component, hindering the reconstruction of three-dimensional turbulent magnetic field topologies and resulting in incomplete validation of magnetic energy cascade models. The second, in complexity of Multi-Physical-Field Coupling, refractive-index discontinuities in strongly gradient plasmas induce optical path distortions, degrading the quantitative accuracy of shadowgraphy. Furthermore, algorithms for the joint inversion of density and magnetic fields require significant optimization. To address these challenges, future advancements in optical diagnostic technologies necessitate breakthroughs in areas such as magnetic topology tomography reconstruction and artificial intelligence-enhanced inversion techniques.
Author Contributions
D.W. Y. proposed and conceived this work; W. S. contributed to the manuscript preparation; J. Y. Z. provided additional support for the content and logic of the manuscript; Z. Zhang and G. Z. supervised the project.
Funding
This research was funded by the National Natural Science Foundation of China (Grants Nos. 12473099, 12205382), the Chinese Academy of Sciences Youth Interdisciplinary Team, and the Strategic Priority Research Program of the Chineses Academy of Sciences (grants Nos. XDA25030500, XDA25030100, XDA25030300, XDA25010100 and XDA25010300), Innovation Fund of China Institute of Atomic Energy (Grant No. 18YZ010250924845).
Informed Consent Statement
Informed consent was obtained from all subjects involved in the study.
Acknowledgments
We thank the staff members of the SG II facility (https://cstr.cn/31126.02.SGII.HP LF)/SG II upgrade facility (https://cstr.cn/31126.02.SGII.UP.HPLF) at the Shen Guang II High Power Laser Facility in Shanghai (https://cstr.cn/31126.02.SGII) for providing technical support and assistance in data collection and analysis.
Conflicts of Interest
The authors declare no conflicts of interest.
Abbreviations
References
- Zhang, J. , Zhao, G. Introduction to Laboratory Astrophysics. Physics 2000, 29(7), 393. [Google Scholar]
- Kuramitsu, Y. , et al. Laboratory investigations on the origins of cosmic rays. Plasma Physics and Controlled Fusion 2012, 54(12), 124049. [Google Scholar] [CrossRef]
- Drake, R. P. Introduction to high-energy-density physics; Springer: Berlin Heidelberg, 2006; pp. 1–17. [Google Scholar]
- Rogers, F. J. , Iglesias, C. A. Science 1994, 263(5143), 50–55. [Google Scholar] [CrossRef] [PubMed]
- Pound, M. W. Scaled eagle nebula experiments on NIF., (http://www.osti.gov/scitech/biblio/1348848).
- Rigon, G. , Casner, A., Albertazzi, B., et al. Physical Review E 2019, 100(2), 021201. [Google Scholar] [CrossRef] [PubMed]
- Zhong, J. , Li, Y., Wang, X., et al. Nature Physics 2010, 6, 984. [Google Scholar] [CrossRef]
- Li, C. K. , Tzeferacos, P., Lamb, D., et al. Nature Communications 2016, 7(1), 13081. [Google Scholar] [CrossRef] [PubMed]
- Gregori, G. , Ravasio, A., Murphy, C. D., et al. Nature 2012, 481(7382), 480–483. [Google Scholar] [CrossRef] [PubMed]
- Casey, D. T. , Sayre, D. B., Brune, C. R., et al. Nature Physics 2017, 13(12), 1227. [Google Scholar] [CrossRef]
- Kuranz, C. C. , Park, H. S., Huntington, C. M., et al. Nature Communications 2018, 9(1), 1564. [Google Scholar] [CrossRef] [PubMed]
- Harilal, S. S. , Phillips, M. C., Froula, D. H., et al. Reviews of Modern Physics 2022, 94(3), 035002. [Google Scholar] [CrossRef]
- Miles, R. B. Progress in Aerospace Sciences 2015, 72, 30–36. [CrossRef]
- Yuan, D. , Wei, H., Liang, G., et al. High Power Laser Science and Engineering 2018, 6, e45. [Google Scholar] [CrossRef]
- Kuramitsu, Y. , Moritaka, T., Sakawa, Y., et al. Nature Communications 2018, 9(1), 5109. [Google Scholar] [CrossRef] [PubMed]
- Bolaños, S. , Sladkov, A., Smets, R., et al. Nature Communications 2022, 13(1), 6426. [Google Scholar] [CrossRef] [PubMed]
- Revet, G. , Khiar, B., Filippov, E., et al. Nature Communications 2021, 12(1), 762. [Google Scholar] [CrossRef] [PubMed]
- Sano, T. , Tamatani, S., Matsuo, K., et al. Physical Review E 2021, 104(3), 035206. [Google Scholar] [CrossRef] [PubMed]
- Machida, M. N. , Omukai, K., Matsumoto, T., et al. The Astrophysical Journal 2006, 647(1), L1. [Google Scholar] [CrossRef]
- Livio, M. , Soker, N. The Astrophysical Journal 2001, 552(2), 685. [Google Scholar] [CrossRef]
- Falcke, H. , Biermann, P. L. Astronomy and Astrophysics 1996, 308, 321–329. [Google Scholar]
- Kumar, P. , Zhang, B. Physics Reports 2015, 561, 1–109. [Google Scholar] [CrossRef]
- Blandford, R. D. , Payne, D. G. Monthly Notices of the Royal Astronomical Society 1982, 199, 883. [Google Scholar] [CrossRef]
- Ferreira, J. Astronomy and Astrophysics 1997, 319, 340.
- Tanaka, S. J. , Toma, K. Monthly Notices of the Royal Astronomical Society 2020, 494, 338. [Google Scholar] [CrossRef]
- Yuan, D. , Li, Y., Tao, T., et al. The Astrophysical Journal 2018, 860(2), 146. [Google Scholar] [CrossRef]
- Zweibel, E. , Yamada, M. Annual Review of Astronomy and Astrophysics 2009, 47, 291–332. [Google Scholar] [CrossRef]
- Pesnell, W. D. , Thompson, B. J., Chamberlin, P. C. Solar Physics 2012, 275, 3–15. [Google Scholar] [CrossRef]
- Bárta, Miroslav, et al. The Astrophysical Journal 2011, 737, 24.
- Zhao, L. L. , et al. The Astrophysical Journal 2020, 898, 113. [Google Scholar] [CrossRef]
- Zank, G. P. , et al. Physics of Plasmas 2021, 28, 080501. [Google Scholar] [CrossRef]
- Ping, Y. , Zhong, J., Wang, X., et al. Nature Physics 2023, 19(2), 263–270. [Google Scholar]
- Yuan, D. , Li, Y., Liu, M., et al. Scientific Reports 2017, 7(1), 42915. [Google Scholar]
- Park, H. S. , Ryutov, D. D., Ross, J. S., et al. High Energy Density Physics 2012, 8, 38. [Google Scholar] [CrossRef]
- Su, Y. , et al. Nature Physics 2013, 9, 489–493. [Google Scholar] [CrossRef]
- Masuda, S. , Kosugi, T., Hara, H., et al. Nature 1994, 371, 495–497. [Google Scholar] [CrossRef]
- The LHAASO Collaboration. Science 2021, 373, 425–430.
- Aharonian, F. A. , et al. Nature 2004, 432, 75–77. [Google Scholar] [CrossRef] [PubMed]
- The LHAASO Collaboration. Science 2023, 380, 1390–1396.
- Zweibel, E. , Yamada, M. Annual Review of Astronomy and Astrophysics 2009, 47, 291–332. [Google Scholar] [CrossRef]
- Yamada, M. , Kulsrud, R., Ji, H. Reviews of Modern Physics 2010, 82, 603–664. [Google Scholar] [CrossRef]
- Ji, H. , et al. Nature Reviews Physics 2022, 4, 263–282. [Google Scholar] [CrossRef]
- Blandford, R. , Eichler, D. Physics Reports 1987, 154, 1–75. [Google Scholar] [CrossRef]
- Spitkovsky, A. The Astrophysical Journal 2008, 682, L5–L8. [CrossRef]
- Sturrock, P. A. Physical Review 1966, 141(1), 186. [CrossRef]
- Petrosian, V. Space Science Reviews 2012, 173, 535–556. [CrossRef]
- Matsumoto, Y. , Amano, T., Kato, T. N., et al. Science 2015, 347(6225), 974–978. [Google Scholar] [CrossRef] [PubMed]
- Fiuza, F. , Swadling, G. F., Grassi, A., et al. Nature Physics 2020, 16(9), 916–920. [Google Scholar] [CrossRef]
- Yuan, D. , Lei, Z., Wei, H., et al. Nature Communications 2024, 15(1), 5897. [Google Scholar] [CrossRef] [PubMed]
- Hasegawa, H. , Fujimoto, M., Phan, T. D., et al. Nature 2004, 430, 755–758. [Google Scholar] [CrossRef] [PubMed]
- Mishin, V. V. , Tomozov, V. M. Solar Physics 2016, 291, 3165–3184. [Google Scholar] [CrossRef]
- Nykyri, K. Geophysical Research Letters 2024, 51(8), e2024GL108605. [CrossRef]
- Sun, W. , Zhong, J., Lei, Z., et al. Plasma Physics and Controlled Fusion 2020, 62(6), 065007. [Google Scholar] [CrossRef]
- Sun, W. , Zhong, J. Y., Zhang, S., et al. High Energy Density Physics 2019, 31, 47–51. [Google Scholar] [CrossRef]
Figure 1.
Schematic view of the experimental setup. (a, b): Shadowgraphy, Nomarski interferometry, and Faraday rotation diagnostics all employ two-stage imaging. The green beam represents the probe light, while the purple beams represent the drive light. The temporal evolution of the plasma is acquired by varying the relative delay time between the probe and drive beams. Representative images obtained from the diagnostics are shown: (c) interferogram, (d) Faraday rotation image, (e) and (f) Shadowgraphy.
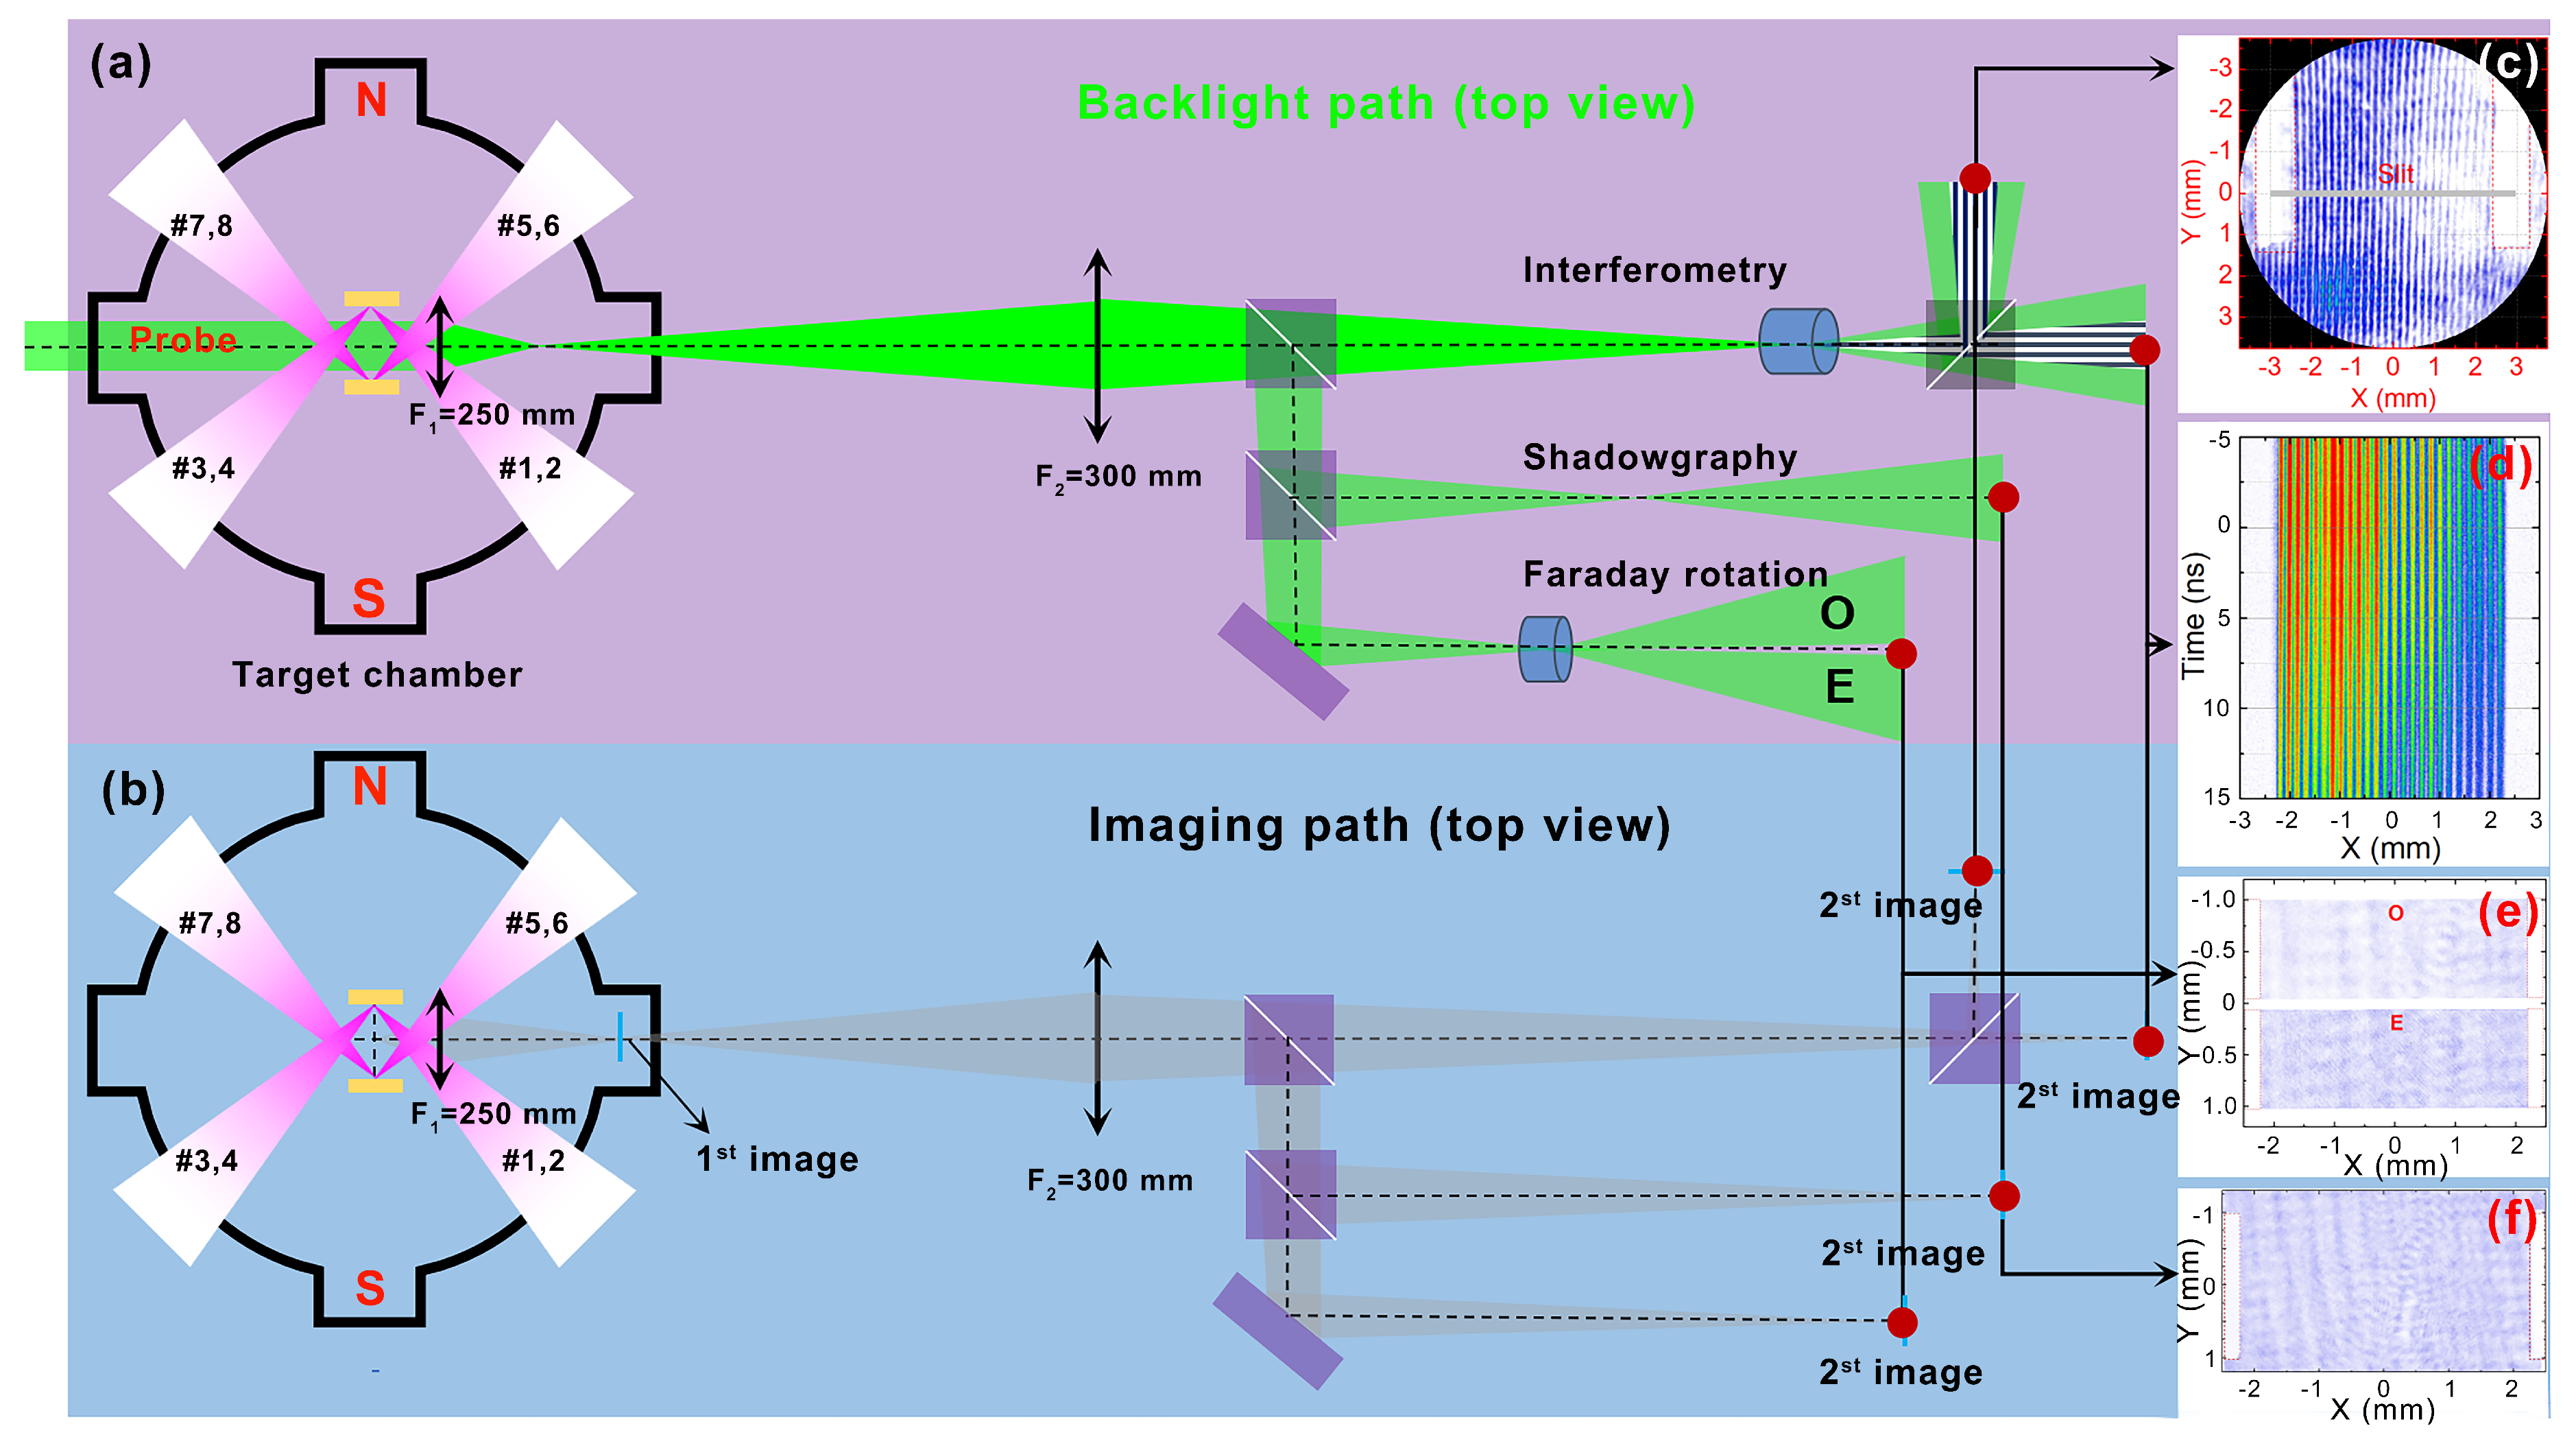
Figure 2.
Schematic diagram of data analysis principles for shadowgraphy, Nomarski interferometer, and Faraday rotation
Figure 2.
Schematic diagram of data analysis principles for shadowgraphy, Nomarski interferometer, and Faraday rotation
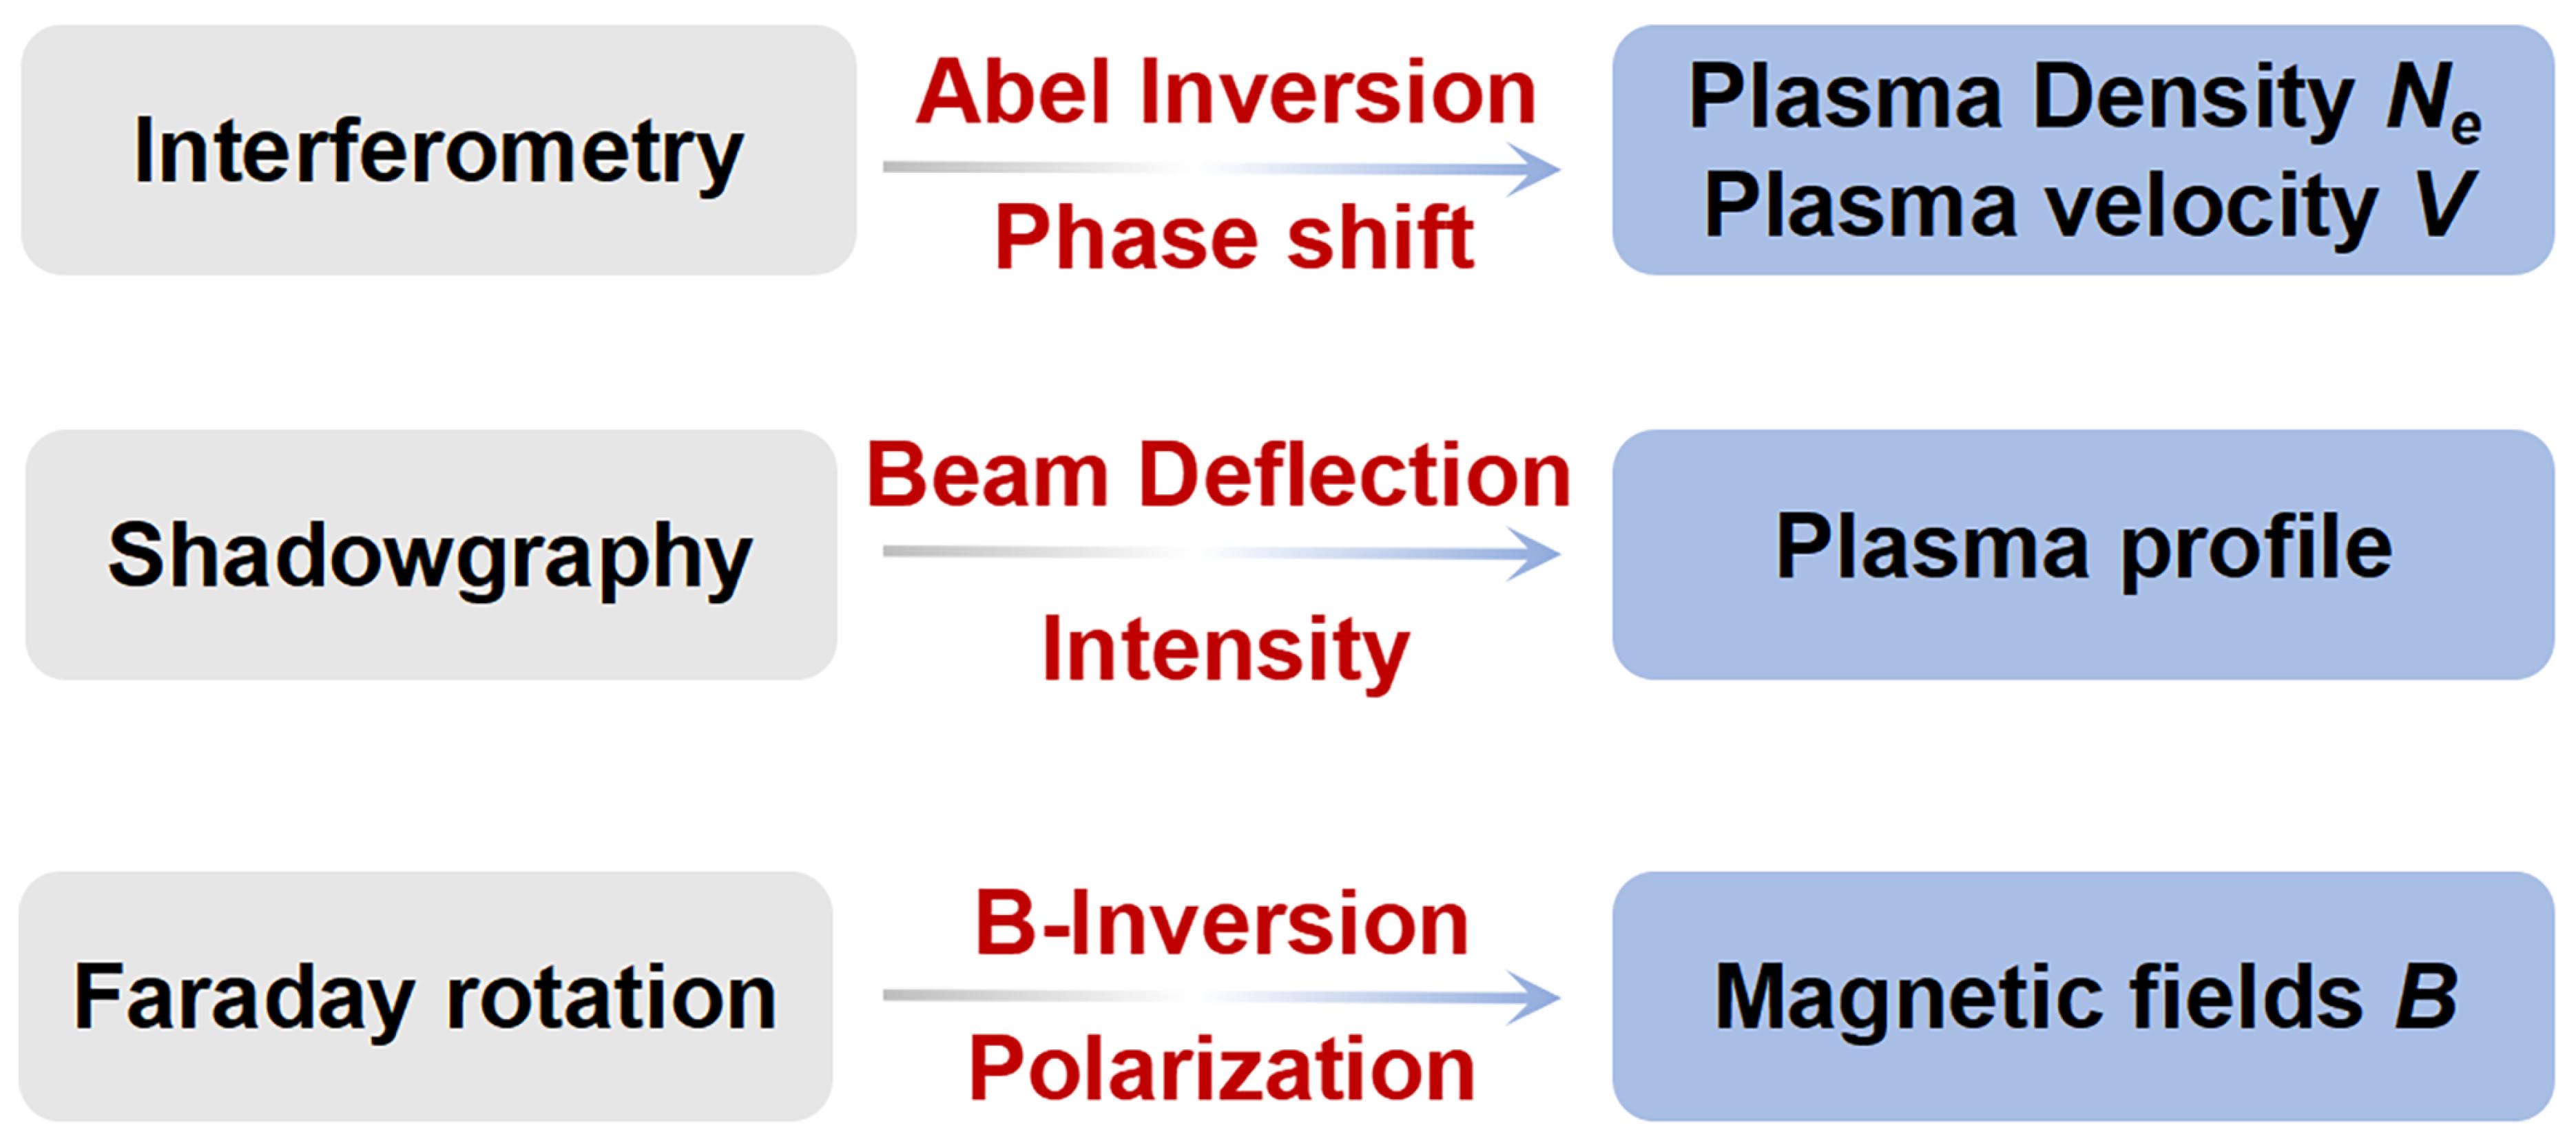
Figure 3.
Experimental jets generated by Au and CH targets at 3 . The first row shows (a) the interferogram and (b) the shadowgraph of the Au-jet. The second row shows (c) the interferogram and (d) the shadowgraph of CH-jet [26].
Figure 3.
Experimental jets generated by Au and CH targets at 3 . The first row shows (a) the interferogram and (b) the shadowgraph of the Au-jet. The second row shows (c) the interferogram and (d) the shadowgraph of CH-jet [26].
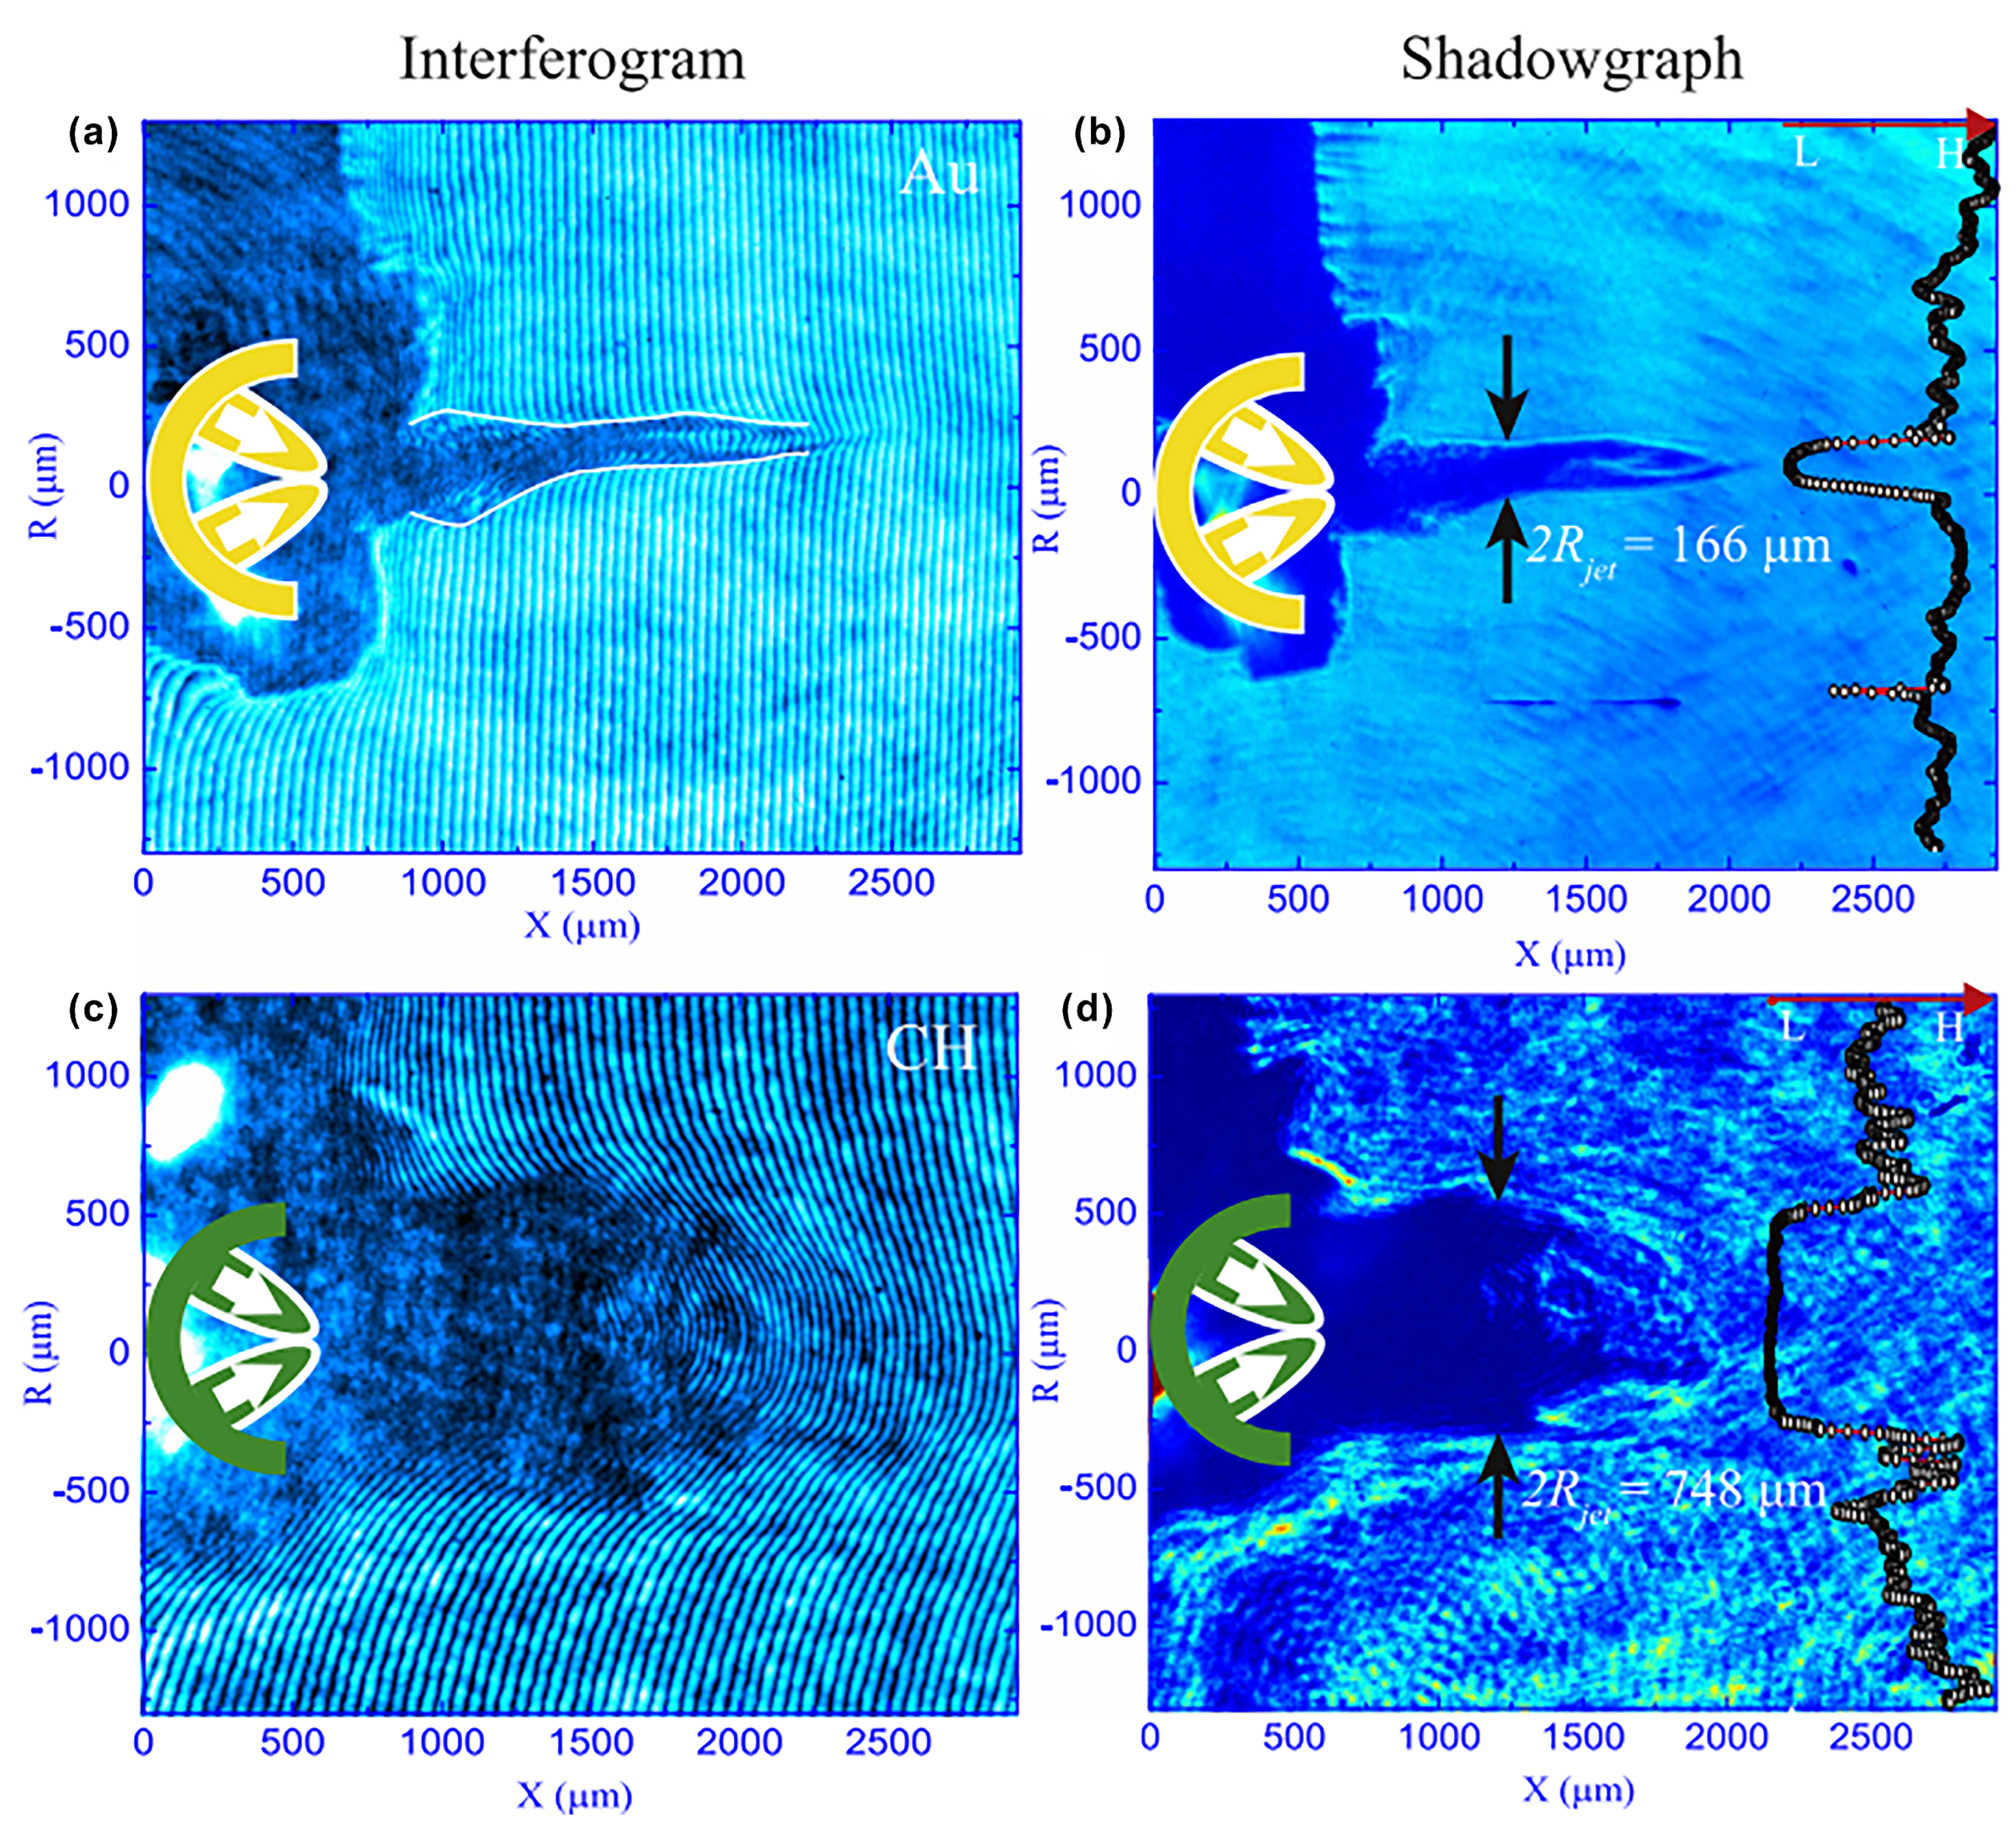
Figure 4.
Laser-driven turbulent magnetic reconnection experiments. a, The experimental set-up. b,c, Optical shadowgraphy results at the delay time of 1 for cases I (b) and II (c). d,e, Power spectra of the average light intensity, PSi [32].
Figure 4.
Laser-driven turbulent magnetic reconnection experiments. a, The experimental set-up. b,c, Optical shadowgraphy results at the delay time of 1 for cases I (b) and II (c). d,e, Power spectra of the average light intensity, PSi [32].
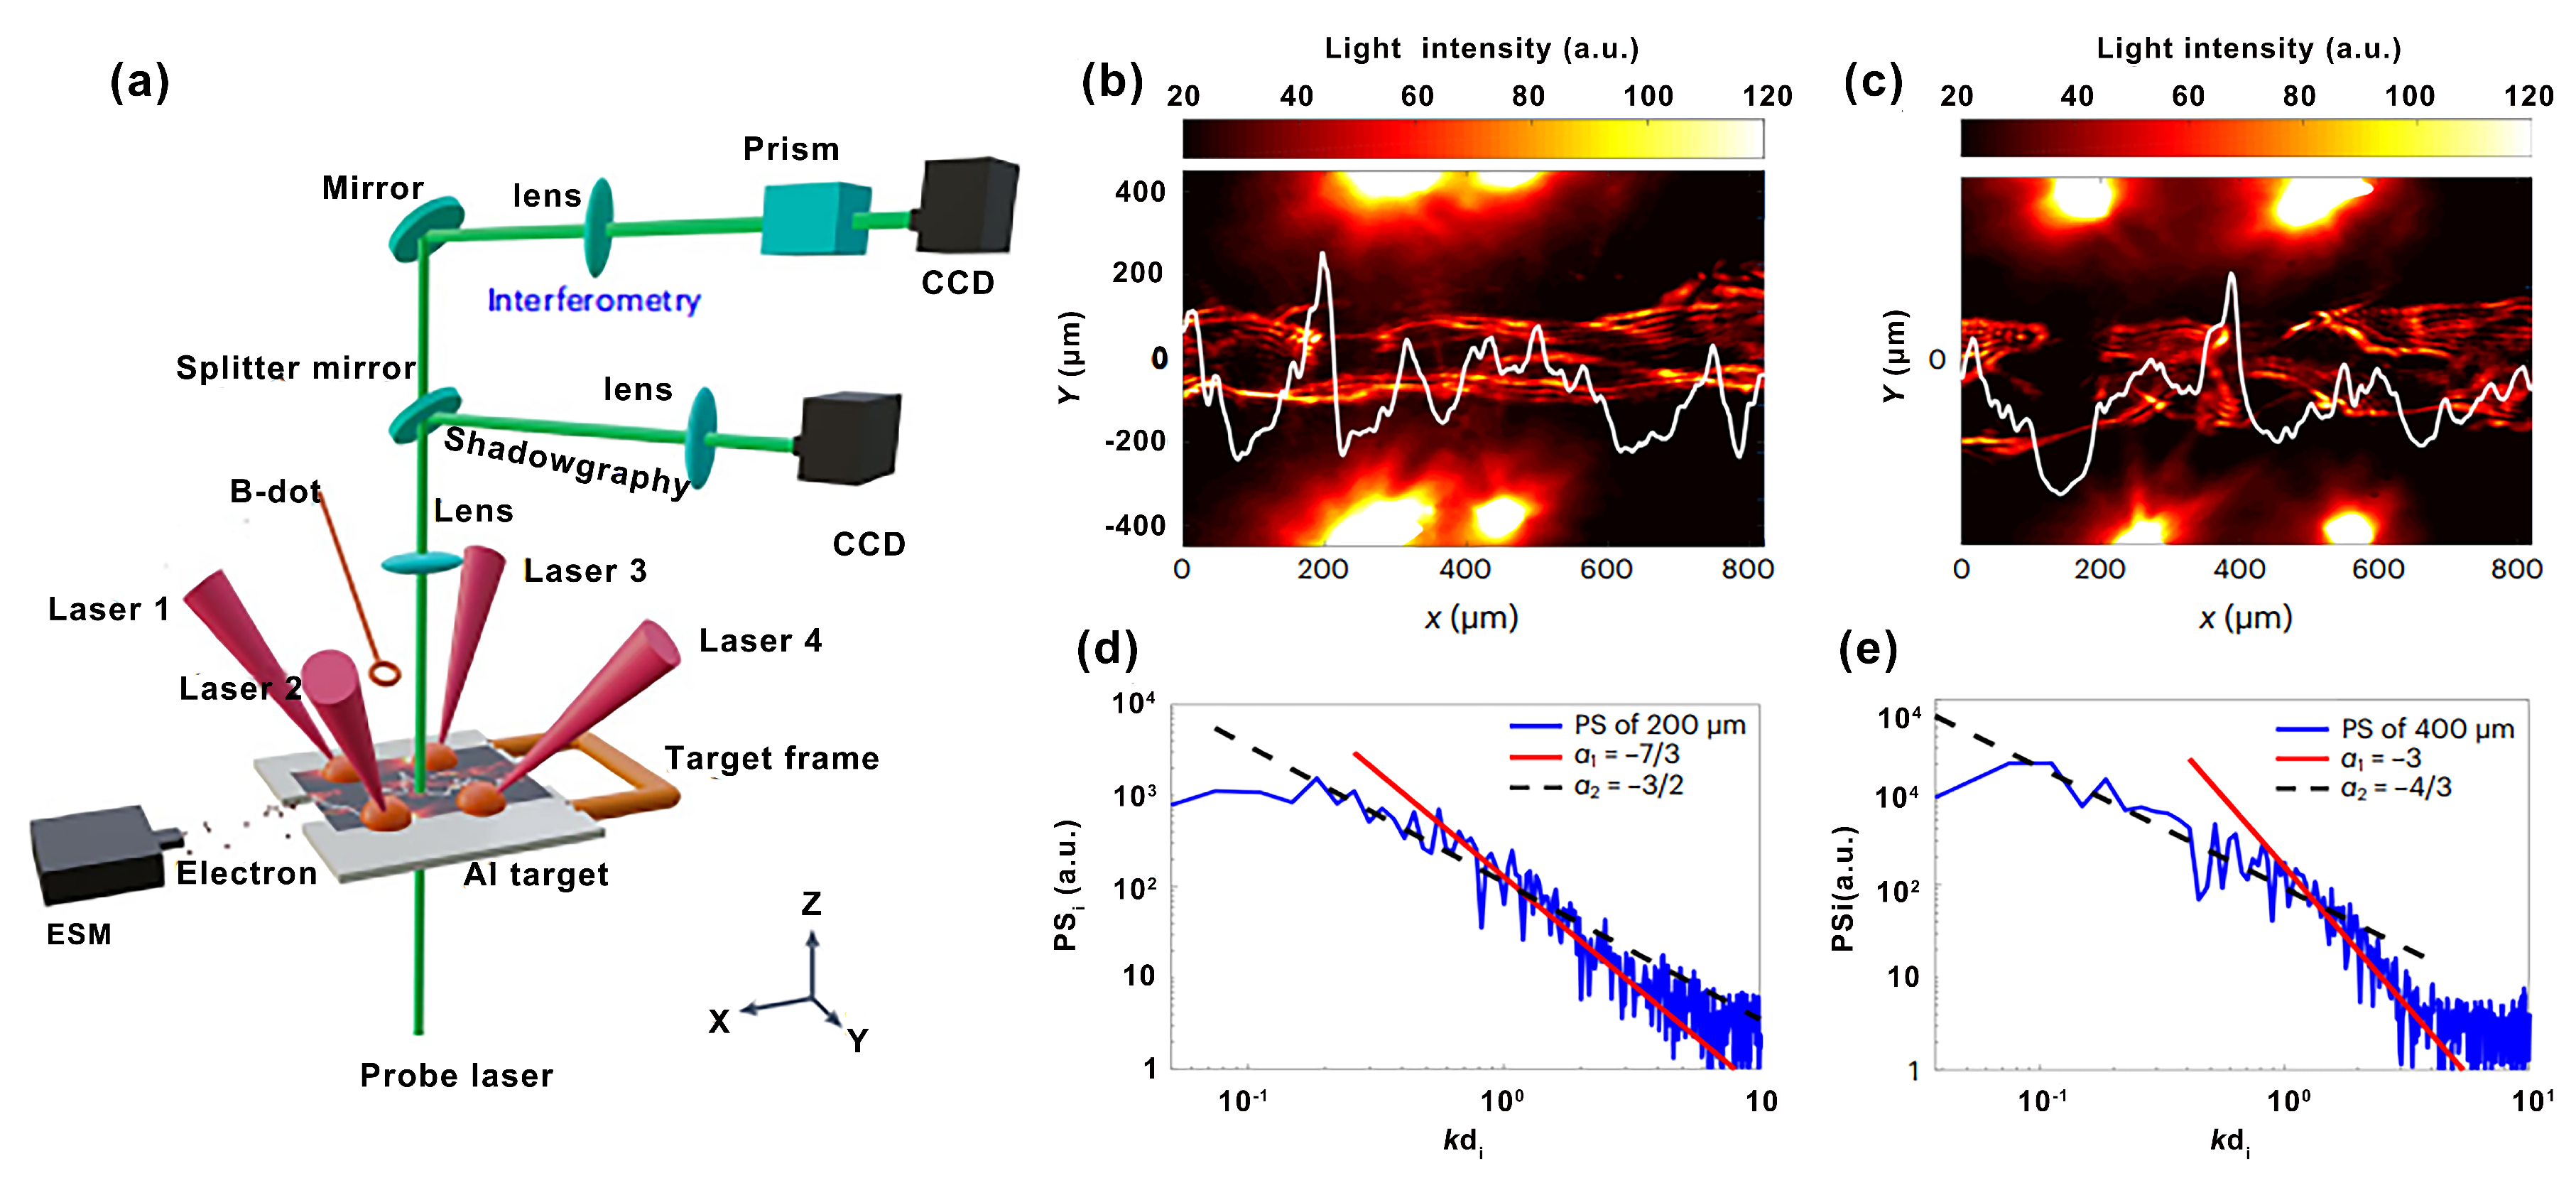
Figure 5.
Experimental results before shocks formation. (a) The raw image (below) and corresponding electron density map (up) obtained by the Abel inversion before shocks formation at 3 . The color bar stands for the value of electrons density. (b) and (c) are the electron density profile (blue circle) and the corresponding fitting curve (black solid) plotted in the flow direction [34].
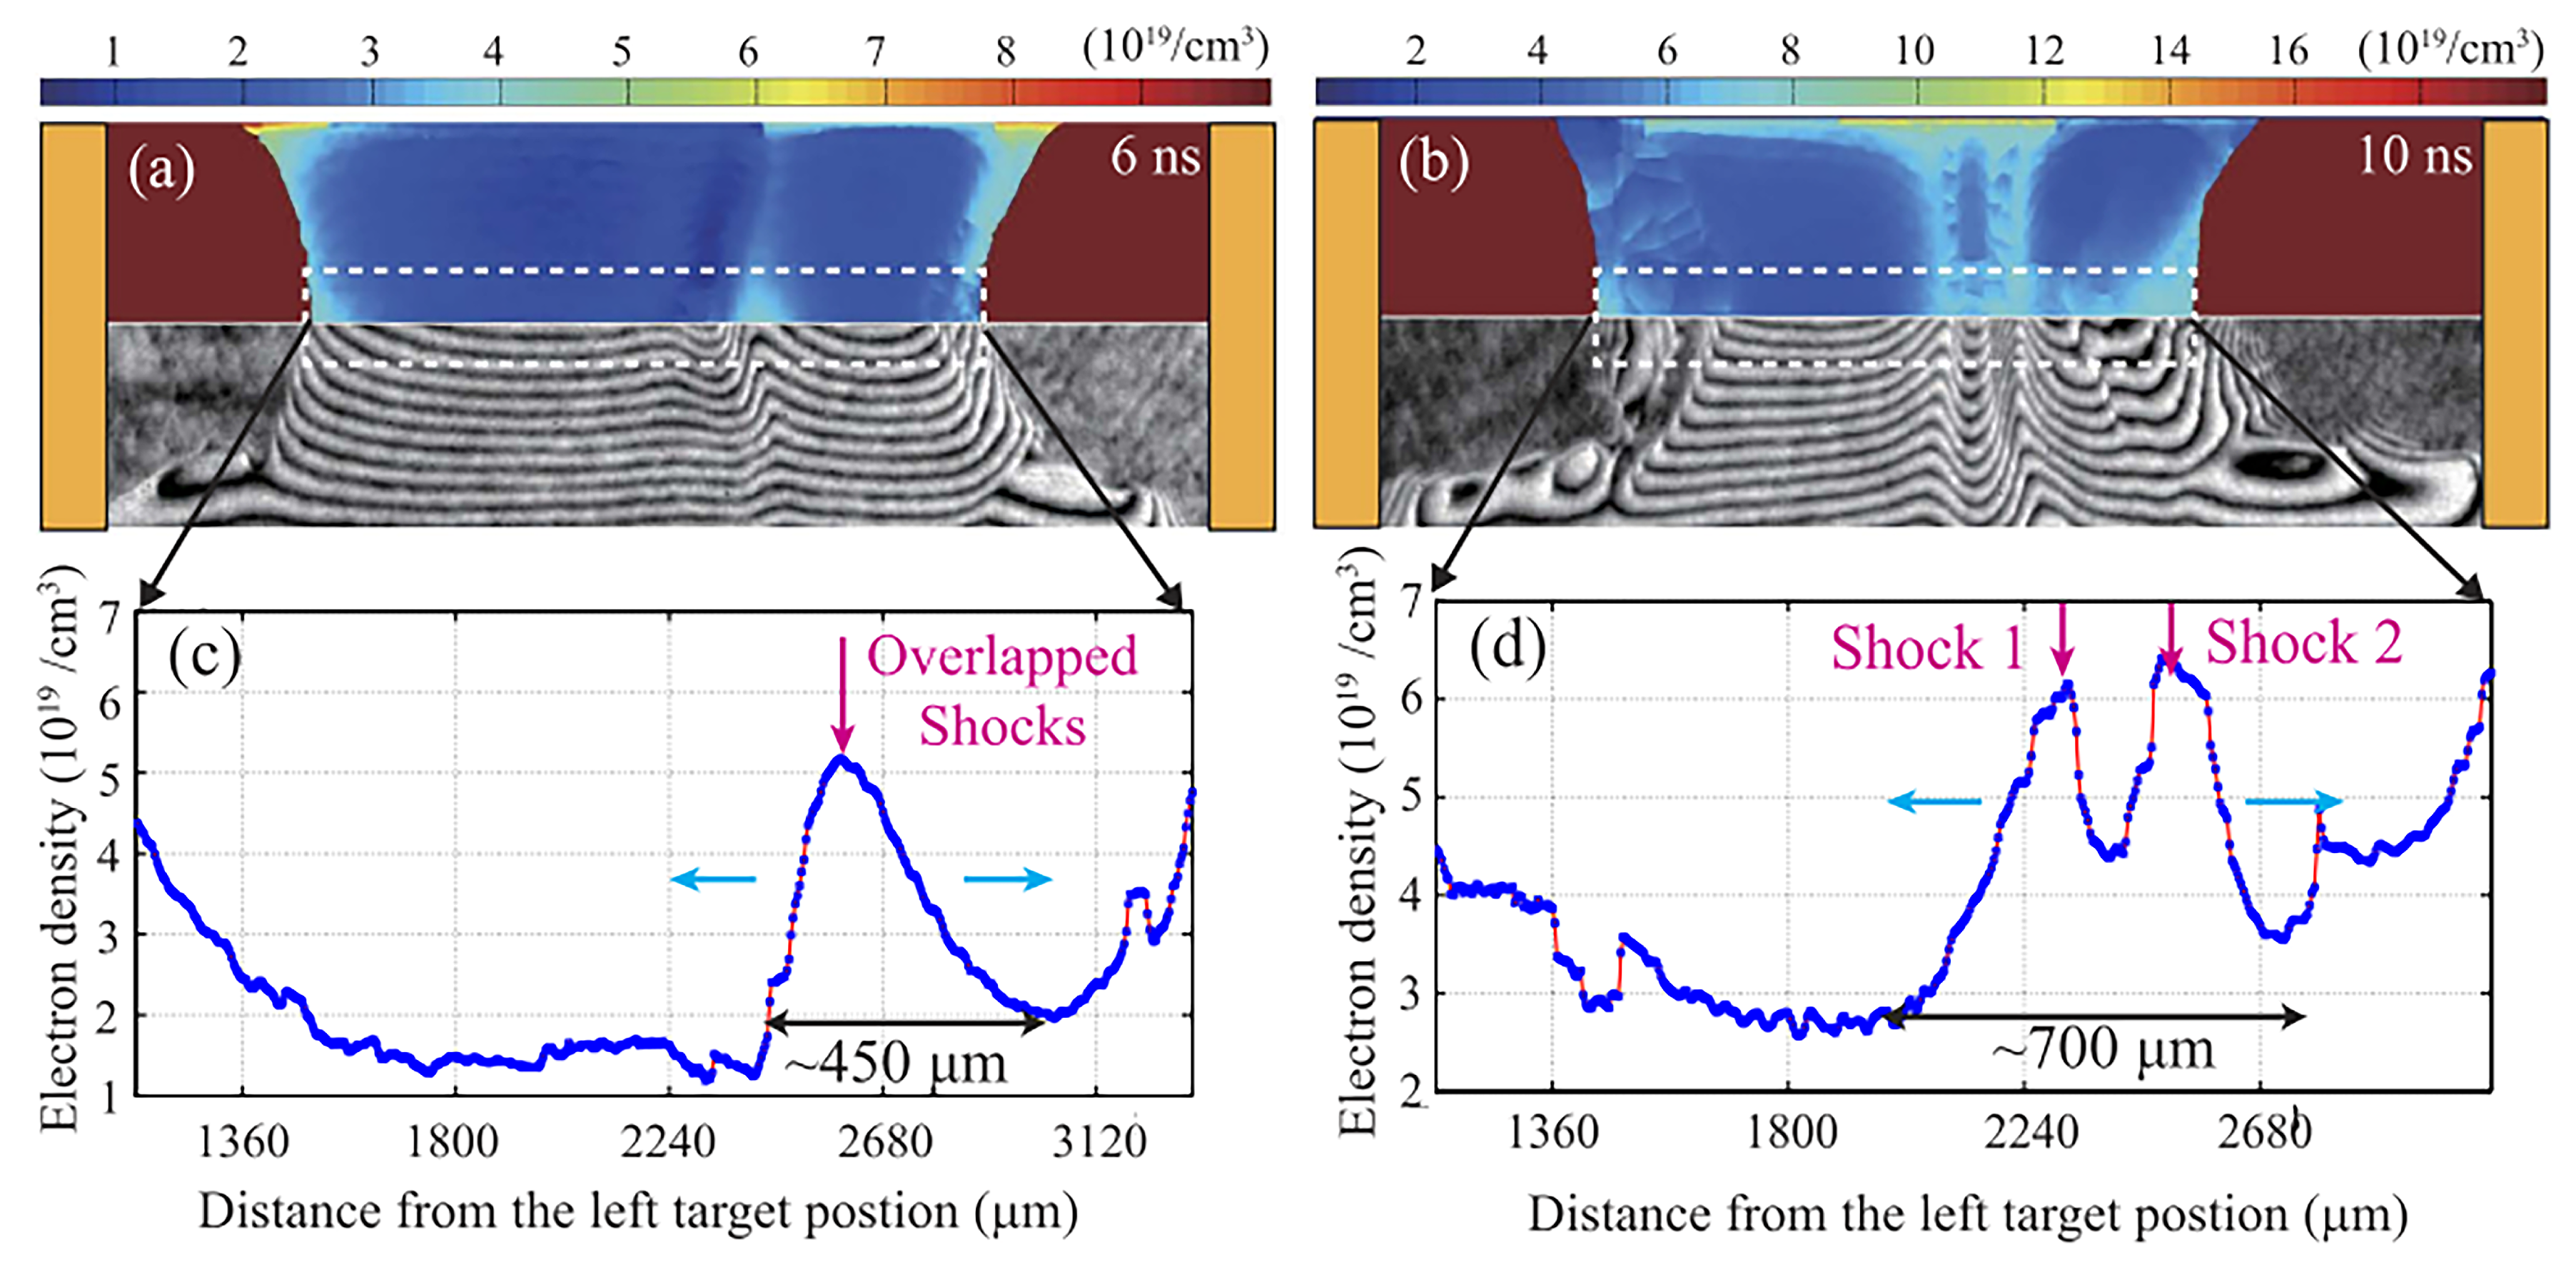
Figure 6.
Experiment demonstrating the evolution of Weibel instability. Filaments in (a-d) measured using shadowgraphy represent the information of plasma density, and in (e, f) measured using the Faraday method represent the path-integrated magnetic field strength [49]
Figure 6.
Experiment demonstrating the evolution of Weibel instability. Filaments in (a-d) measured using shadowgraphy represent the information of plasma density, and in (e, f) measured using the Faraday method represent the path-integrated magnetic field strength [49]
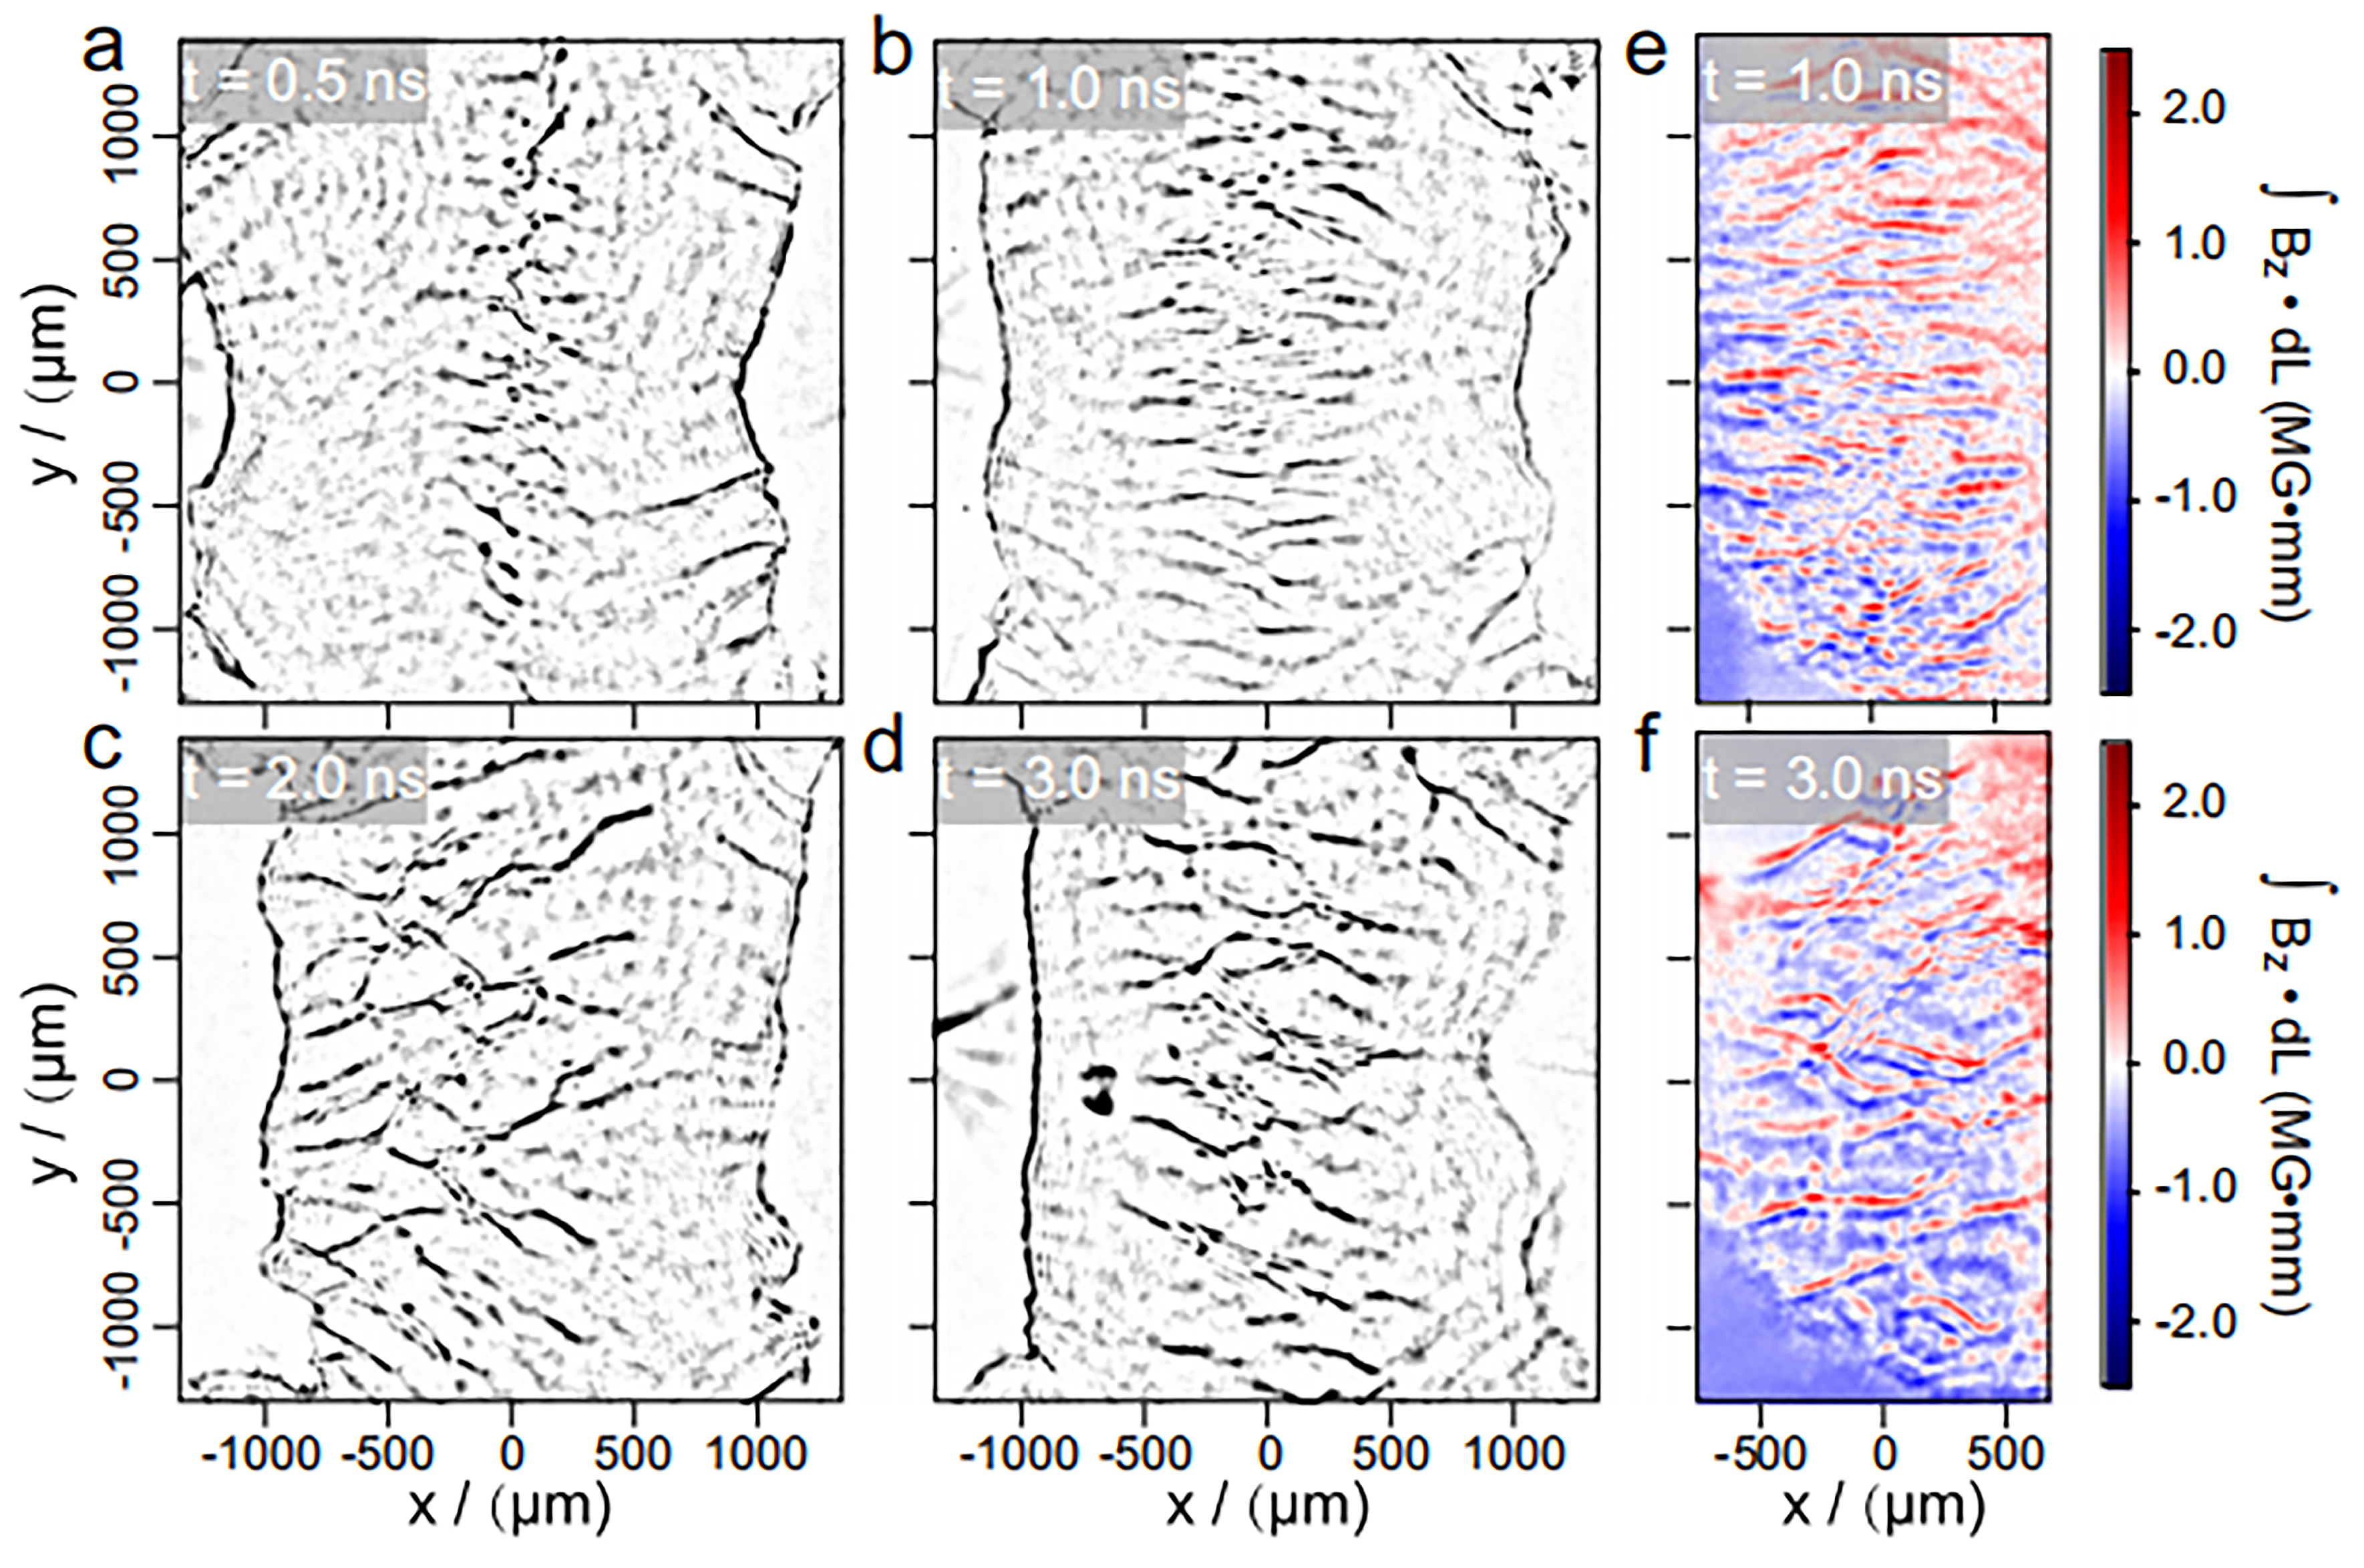
Figure 7.
Side viewing images from the shadowgraph. (a) the magnetic field of a magnet was null. (b) the magnetic field was 4000 Gauss. (a) and (b) are images from the shadowgraph in the experiments, and (c) and (d) are contrast-enhanced data. All images were taken at 9 after the main shot [53].
Figure 7.
Side viewing images from the shadowgraph. (a) the magnetic field of a magnet was null. (b) the magnetic field was 4000 Gauss. (a) and (b) are images from the shadowgraph in the experiments, and (c) and (d) are contrast-enhanced data. All images were taken at 9 after the main shot [53].
Disclaimer/Publisher’s Note: The statements, opinions and data contained in all publications are solely those of the individual author(s) and contributor(s) and not of MDPI and/or the editor(s). MDPI and/or the editor(s) disclaim responsibility for any injury to people or property resulting from any ideas, methods, instructions or products referred to in the content. |
© 2025 by the authors. Licensee MDPI, Basel, Switzerland. This article is an open access article distributed under the terms and conditions of the Creative Commons Attribution (CC BY) license (http://creativecommons.org/licenses/by/4.0/).
Copyright: This open access article is published under a Creative Commons CC BY 4.0 license, which permit the free download, distribution, and reuse, provided that the author and preprint are cited in any reuse.


