
Submitted:
11 July 2025
Posted:
15 July 2025
You are already at the latest version
Abstract
The effects of varying dietary metabolizable energy (ME) and crude protein (CP) levels, along with their interactive effects, on the apparent nutrient metabolism, development of digestive organs, intestinal morphology, and microbial composition in Jingyuan chickens during the growing phase were evaluated. A total of 540 seven-week-old male Jingyuan chickens were randomly assigned to 9 groups, with 6 replicates per group and 10 chickens per replicate. The trial lasted for 11 weeks. A 3×3 factorial design was adopted, comprising three levels of ME, namely, low (11.28 MJ/kg, LE group), medium (11.70 MJ/kg, ME group), and high (12.12 MJ/kg, HE group) and three levels of CP, namely, low (14.00%, LP group), medium (15.50%, MP group), and high (17.00%, HP group). The levels of ME and CP, along with their interactions, had a significant effect on the average daily gain (ADG), average daily feed intake, feed-to-gain ratio (F/G), apparent metabolizable rate of CP, gizzard weight, duodenal and cecal lengths, jejunal villus height (VH), crypt depth (CD), and muscle layer thickness (MLT) (P<0.05). The combination of mediumlevel ME (11.70 MJ/kg) and medium-level CP (15.50%) (MEMP group) exhibited the best performance and exhibited the highest ADG and the lowest F/G (P <0.05). Moreover, this group exhibited significantly higher apparent metabolizable rates of CP, gizzard weight, duodenal length, jejunal VH, CD, and MLT compared with those in the other groups (P <0.05). Dietary ME and CP levels significantly influenced cecal microbial composition. Chickens in the MEMP group exhibited an increased abundance of Erysipelotrichaceae, Syntrophomonadaceae, Akkermansia, and Clostridia_vadinBB60_group, and significantly decreased the relative abundance of Desulfobacterota (P <0.05). This study demonstrated that dietary ME and CP levels, along with their interactions, could significantly influence the growth performance, apparent nutrient metabolism, and intestinal development of Jingyuan chickens during the growing phase. Dietary ME and CP levels modulated the cecal microbiota composition, potentially inhibiting the abundance of harmful bacteria Desulfobacterota while enriching the abundance of beneficial bacteria, thereby enhancing gut development and nutrient absorption. The combination of medium-level ME and CP (11.70 MJ/kg ME, 15.50% CP) demonstrated the most favorable outcomes in our study.
Keywords:
crude protein
; energy
; growing chicken
; ileum histomorphometry
; gut microbiota
1. Introduction
Metabolizable energy (ME) and crude protein (CP) are primary factors influencing the nutritional quality of poultry diets. These factors not only directly affect the growth performance of livestock and poultry but also play a crucial role in intestinal development, microbial community composition, and nutrient absorption efficiency [1,2]. Excessive or insufficient energy and protein intake typically reduces intestinal villus height, restricts intestinal development, and lowers the rate of metabolism of nutrients, consequently retarding growth and weight gain in chickens [3,4]. Additionally, inadequate dietary energy restricts the efficient utilization of dietary proteins, leading to reduced protein metabolism efficiency and increased ammonia and urea emissions[5]. These outcomes extend beyond merely affecting intestinal morphology and nutrient metabolism and further include changes in gut microbial composition[6]. When chickens are fed diets characterized by imbalanced energy and protein levels, pathogenic bacteria proliferate and beneficial microbial populations are suppressed, resulting in gut dysbiosis and metabolic disorders[7]. Shifts in gut microbiota composition are closely linked to the intestinal health and growth performance of chickens [8]. Appropriate energy and protein levels are essential in enhancing the abundance of beneficial bacteria such as Bifidobacteriaceae, Paraprevotella, and Lactobacillus crispatus; promoting intestinal development; and improving the efficiency of nutrient absorption [9,10]. Thus, the gut microbiota serves as a key mediator in the optimal utilization of the effects of dietary energy and protein on chicken growth and development[11,12].
Indigenous breeds (e.g., Jingyuan chicken) exhibit unique digestive characteristics compared with commercial poultry breeds, particularly with respect to their tolerance for coarse feed and adaptability to energy and protein requirements[13]. Studies suggest that indigenous chickens have relatively lower energy and protein demands, making appropriately reduced dietary energy and protein levels more conducive to leveraging their genetic traits[7,14]. For instance, yellow-feathered chickens demonstrate distinct nutritional needs, requiring lower energy and protein levels compared with white-feathered chickens (commercial breeds), enabling them to sustain growth and maintain strong stress resistance under comparatively lower energy and protein conditions[1]. In contrast, there are very few studies on the energy and protein requirements of Jingyuan chicken, a high-quality indigenous breed in Ningxia. Therefore, clarifying the nutritional demands and growth performance of this breed under varying energy and protein levels is crucial to precisely regulate their feed and diet.
An optimal energy and protein ratio maximizes broiler growth while avoiding adverse effects on production performance and health resulting from nutrient deficiency or metabolic overload[15]. While studies on Jingyuan chickens have focused on genetic and germplasm resources, studies on nutritional requirements remain limited, posing a challenge in establishing feed standards and precise nutritional management for efficient farming. Thus, there is a pressing need to study optimal energy and protein regulation in advancing Jingyuan chicken production. The aim of this study was to investigate the effects of diets with varying energy and protein levels on the nutrient metabolism, digestive organ indices, intestinal morphology, and microbial structure of male Jingyuan chickens aged 7–18 weeks. Our findings will help lay both theoretical and practical foundations in formulating nutritional requirements and standards during the growth period of meat-type Jingyuan chickens.
2. Materials and Methods
2.1. Experimental Design and Diets
A total of 540 seven-week-old healthy male Jingyuan chickens (418.19 ± 1.25 g) with uniform body weights were obtained from Ningxia Wansheng Industrial Co. Ltd. (Ningxia, China) and randomly divided into 9 groups, with 6 replicates per group and 10 chickens per replicate. Each replicate comprised 5 cages, with 2 chickens per cage. A 3×3 factorial experimental design was adopted, with three dietary ME levels, namely, 11.28 MJ/kg (low ME, LE), 11.70 MJ/kg (medium ME, ME), and 12.12 MJ/kg (high ME, HE), and three dietary CP levels, namely, 14.00% (low CP, LP), 15.50% (medium CP, MP), and 17.00% (high CP, HP). The following nine diets were formulated in total: low ME and low CP (LELP) group, low ME and medium CP (LEMP) group, low ME and high CP (LEHP) group, medium ME and low CP (MELP) group, medium ME and medium CP (MEMP) group, medium ME and high CP (MEHP) group, high ME and low CP (HELP) group, high ME and medium CP (HEMP) group, and high ME and high CP (HEHP) group. ME and CP levels were primarily based on China’s Feeding Standard of Chickens (NY/T 33—2004), with appropriate adjustments made to the ME and CP settings. The composition and nutritional levels of the experimental diets are detailed in Table 1.
2.2. Feeding Management
Prior to the experiment, a comprehensive cleaning and sterilization protocol was implemented to clean the chicken cages and associated equipment. The experiment utilized a three-tier semi-stepped cage configuration, with two chickens per cage and a balanced distribution across the tiers. The facility was subjected to regular disinfection and ventilation. The temperature was maintained between 20 and 25°C, and the chickens were subjected to 16 h of light. The experiment included 1 week of the adaptation period followed by 10 weeks of a formal trial.
2.3. Growth Performance
The initial and final weights of Jingyuan chickens were recorded at the commencement and conclusion of the formal trial, respectively. During the trial, the feed intake was recorded on a weekly basis, and the average daily feed intake (ADFI), average daily gain (ADG), and feed-to-weight ratio (F/G) were calculated. The number of deceased Jingyuan chickens was recorded on a daily basis, and the F/G was corrected based on the mortality data.
2.4. Apparent Nutrient Metabolism
One week before the end of the trial, a metabolism experiment was conducted using the total fecal-collection method. Feed intake and excreta weight were accurately recorded for each replicate over 1 week, and contemporaneous feed samples were collected for subsequent nutrient analysis. The collected excreta samples were inspected daily. Foreign matter (e.g., feathers) was removed and the samples were sprayed with an appropriate amount of 10% concentrated sulfuric acid for nitrogen fixation. The weights of fresh excreta samples were recorded. Subsequently, fresh excreta and feed samples were dried, weighed, ground, sieved, and stored. The apparent metabolic rates of dry matter (DM), gross energy (GE), and CP were measured and analyzed[16].
DM, GE, and CP contents were determined according to GB/T 6435-2014, GB/T 45104-2024, and GB/T 6432-1994, respectively. Samples were dried at 105°C for 24 h, and the DM content was calculated based on the weight after drying. GE was measured using an adiabatic bomb calorimeter (C 5001, IKA, Stuttgart, Germany) and the results are expressed in MJ/kg. CP was analyzed using the Kjeldahl nitrogen method, and nitrogen content was determined using a nitrogen analyzer (KDN103F, Shanghai Fiber Inspection Instrument Co., Ltd., Shanghai, China). CP content was calculated as 6.25× Kjeldahl nitrogen.
2.5. Digestive Organ Index
After 12 h of fasting at the end of the formal trial, six chickens from each group with body weights close to the average body weight of the group were randomly selected for slaughter. The glandular stomach and gizzard were emptied of their contents and weighed, and the lengths of the duodenum, jejunoileum, and cecum were measured[17].
2.6. Jejunal Morphology
A 3–5-cm segment of jejunal tissue (located 5–10 cm below the junction of the duodenum and the jejunum) was excised, gently flushed with physiological saline to remove chyme, and fixed in 4% formaldehyde solution for 24 h. After dehydration with gradient ethanol and transparentization with xylene, the tissues were embedded in paraffin. The trimmed paraffin blocks were sectioned into 4-μm-thick slices using a microtome and stained with hematoxylin and eosin[18]. Ten well-oriented villus and crypt regions were selected for analysis. Villus height (VH), crypt depth (CD), and muscle layer thickness (MLT) were determined using a light microscope (NIKON ECLIPSE E100, NIKON, Tokyo, Japan) and Image-Pro Plus 6.0 software (Media Cybernetics, Inc., Rockville, MD).
2.7. 16S rDNA Sequencing and Analysis
The MELP, MEMP, and MEHP groups were selected based on medium energy levels, and the LEMP, MEMP, and HEMP groups were selected based on medium protein levels. At the end of the 77-day feeding trial, the cecal contents were collected for 16S rDNA sequencing analysis. Total genomic DNA from cecal contents was extracted using a soil and fecal genomic DNA extraction kit, following the manufacturer’s instructions, and stored at –20°C until further use. The V3–V4 region of the bacterial 16S rDNA gene was amplified using PCR using the forward primer 341F (5′-CCTAYGGGRBGCASCAG-3′) and reverse primer 806R (5′-GGACTACNNGGGTATCTAAT-3′). The PCR products were purified using 2% agarose gel electrophoresis and recovered using a DNA purification kit. Sequencing was performed on the Illumina NovaSeq 6000 platform.
2.8. Data Processing and Statistical Analysis
Statistical analyses were performed using SPSS 23.0. After confirming that the data were normally distributed, variance was analyzed using the General Linear Model. Differences between groups were compared using Duncan’s multiple range test. Differences were considered significant at P <0.05.
3. Results
3.1. Growth Performance
As shown in Table 2, varying levels of ME and CP had significant effects on ADG and F/G, with a notable interaction between the two factors (P <0.01). While ME and CP levels did not affect the ADFI, their interaction exhibited significant differences. The combination of 11.70 MJ/kg ME and 15.5% CP resulted in the highest ADG and the lowest F/G among the groups (P <0.05). Additionally, when the dietary CP level was 17%, the group receiving 12.12 MJ/kg ME exhibited a significantly higher ADFI than the other ME groups (P <0.05).
3.2. Apparent Nutrient Metabolism
As shown in Table 3, different levels of ME and CP significantly affected the apparent metabolic rates of GE and CP (P <0.01). However, neither ME nor CP levels significantly impacted the apparent metabolic rate of DM (P >0.05). A significant interaction between ME and CP levels was observed for the apparent metabolic rate of CP (P <0.05). At an ME level of 11.28 MJ/kg, the apparent metabolic rate for CP in the 17% CP group was significantly lower than in the other CP groups (P < 0.05); while at CP levels of 15.5%, the apparent metabolic rate of CP in the 12.12 MJ/kg ME group was significantly lower compared to the other ME groups (P < 0.05).
3.3. Digestive Organ Index
It can be seen in Table 4 that varying levels of ME significantly affected the weights of the proventriculus and gizzard and the lengths of the duodenum and cecum (P <0.05). In contrast, varying CP levels led to significant changes in the lengths of the jejunoileum and cecum (P <0.05). A significant interaction between ME and CP levels (P <0.05) was observed with respect to gizzard weight and duodenum length. Specifically, when the CP level was 17%, the group of chickens receiving 12.12 MJ/kg ME exhibited significantly higher gizzard weights and duodenum length compared with chickens in the other ME groups. When CP was 15.5%, the duodenum length in chickens in the 11.70 MJ/kg ME group was significantly higher than that in the other CP groups of chickens (P <0.05).
3.4. Jejunal Morphology
As seen in Table 5, ME levels significantly influenced VH, MLT, and VH/CD, whereas CP levels significantly affected CD, VH, and MLT (P <0.05). A significant interaction between ME and CP levels was observed for the morphological parameters in the jejunum, including CD and VH (P <0.01). Specifically, when the CP level was 15.5%, the group with 12.12 MJ/kg ME exhibited significantly lower CD, VH, and MLT values (P <0.05) compared with those in the other ME groups. When the ME was 11.70 MJ/kg, the 15.5% CP group showed significantly higher VH, VH/CD, and MLT values (P <0.05) compared with those in the other CP groups; however, the CD was not significantly different between groups (P >0.05).
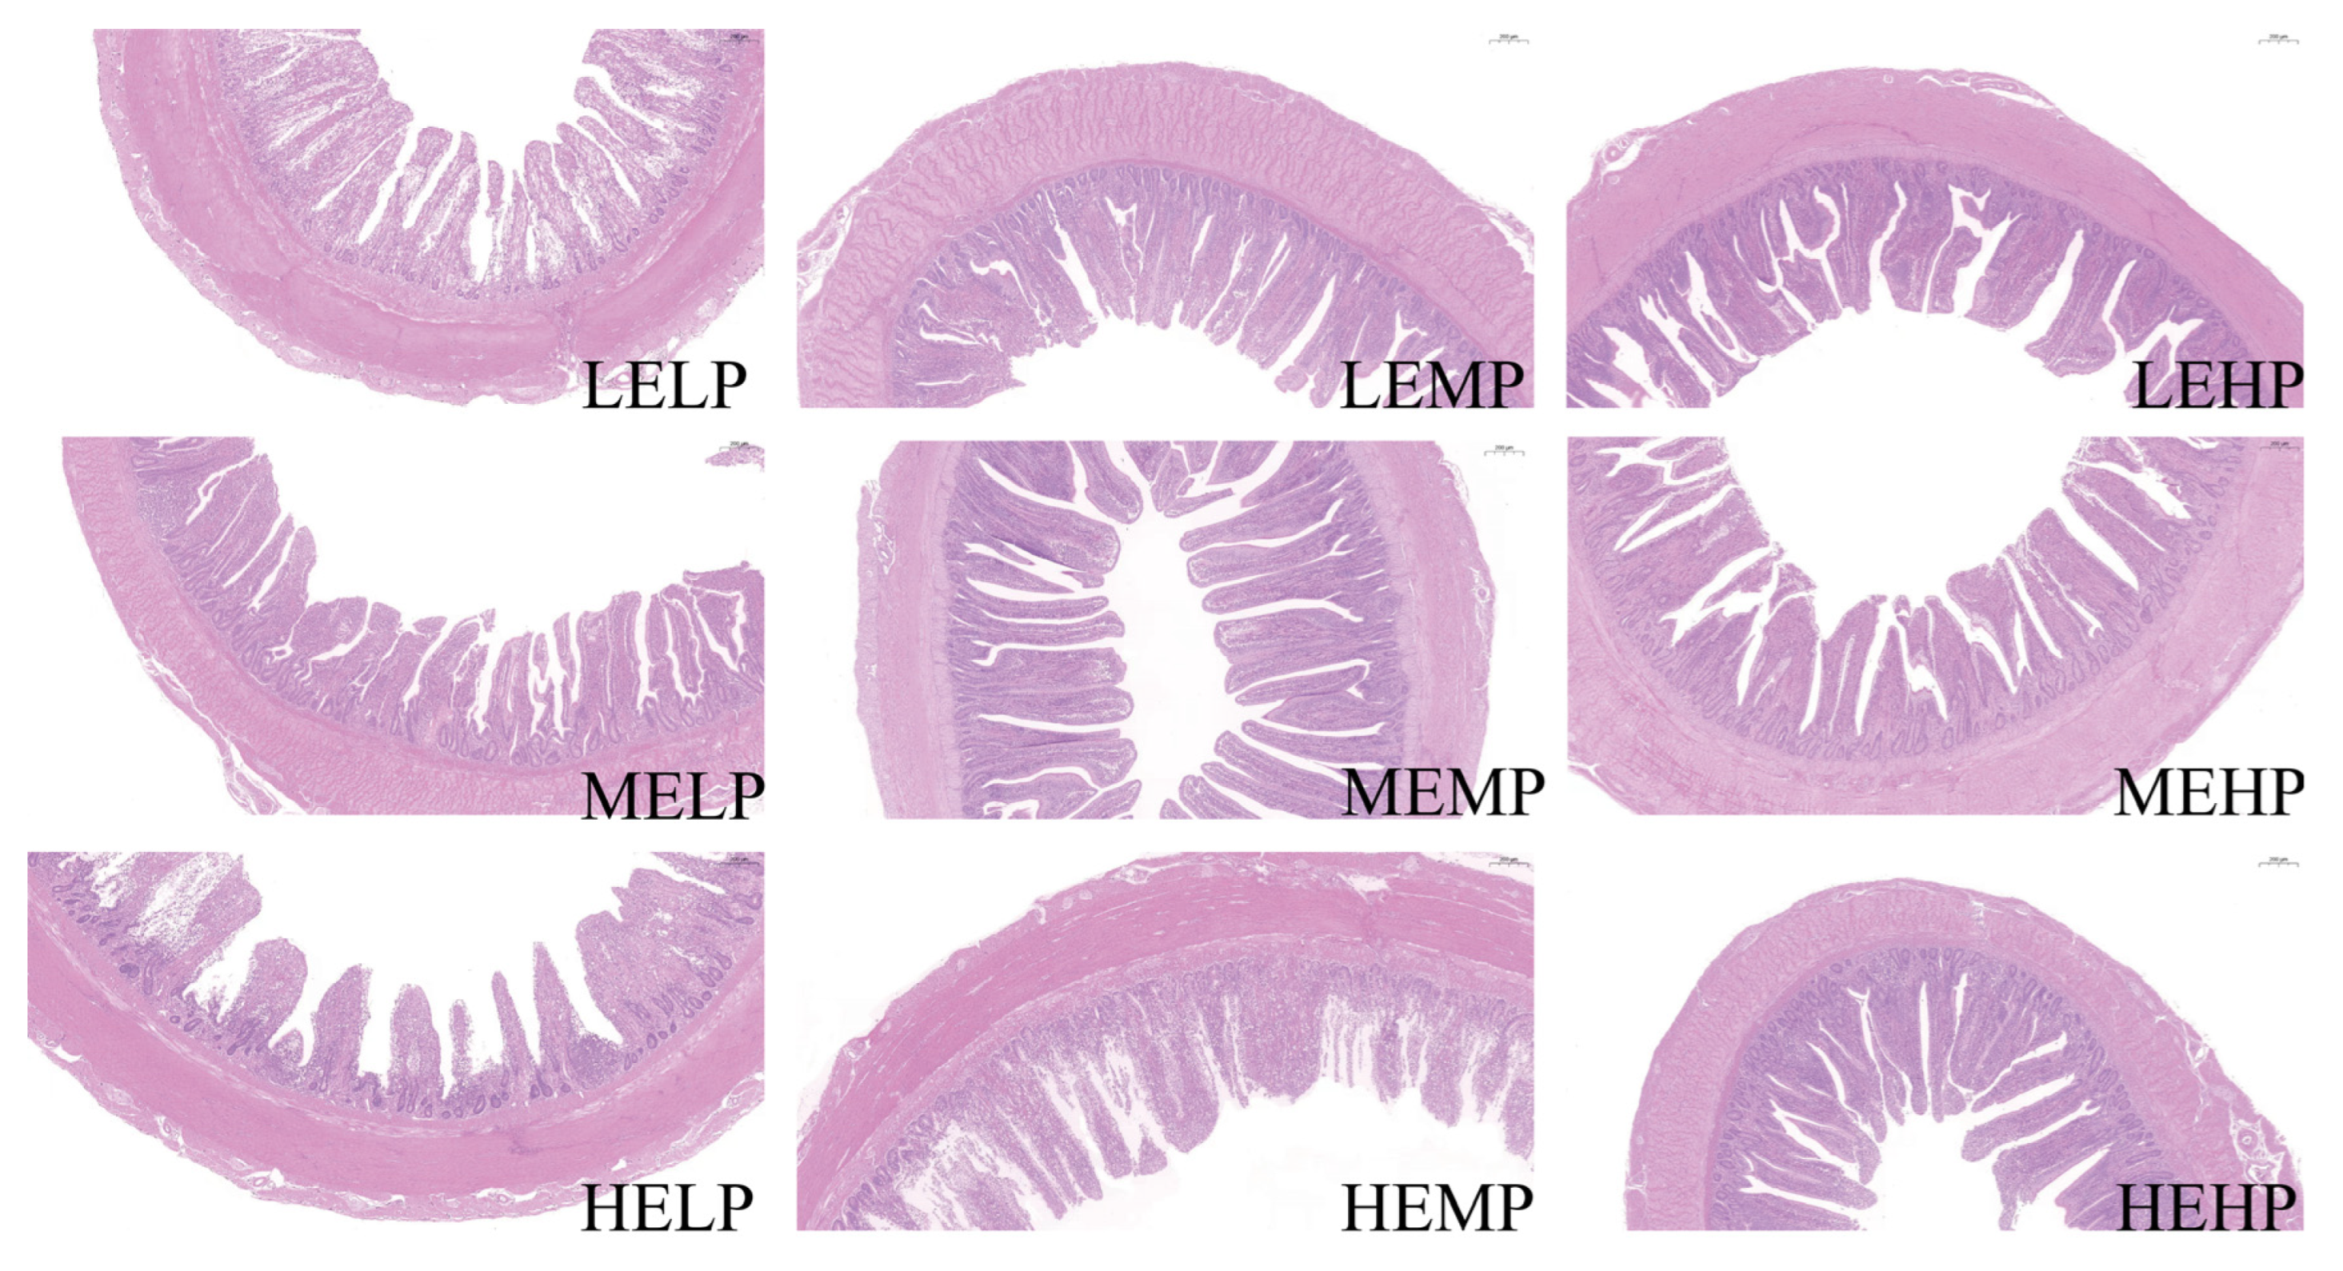
Figure 1.
Microscopic images of the jejunum (scale bar = 200 μm). Low ME, low CP group (LELP); low ME, medium CP group (LEMP); low ME, high CP group (LEHP); medium ME, low CP group (MELP); medium ME, medium CP group (MEMP); medium ME, high CP group (MEHP); high ME, low CP group (HELP); high ME, medium CP group (HEMP); high ME, high CP group (HEHP).
3.5. 16SrDNA Analysis of Cecal Microbiota
The intestinal microbiota of Jingyuan chickens in the LEMP, MELP, MEMP, MEHP, and HEMP groups shared 760 operational taxonomic units (OTUs), as shown in Figure 2A. When the relative abundance of OTUs in each group dropped below 10−4, the rarefaction curves gradually leveled off, indicating sufficient sequencing depth and a relatively even species distribution, as illustrated in Figure 2B. Figure 2C shows that no significant differences (P >0.05) in the Shannon, Simpson, and Chao 1 indices were noted among the groups with respect to cecal microbiota.
The relative abundance of cecal microbiota in Jingyuan chickens was analyzed at both the phylum and genus levels, as presented in Figure 3 and Figure 4. At the phylum level, Bacteroidota, Firmicutes, Proteobacteria, and Desulfobacterota were the dominant taxa in the cecum, as shown in Figure 3A. The relative abundance of Desulfobacterota was significantly higher in the MELP group (2.91% vs. 4.45%) versus that in the MEMP group. Compared with the MELP group, the MEHP group exhibited a significant decrease in the abundance of Desulfobacterota (4.45% vs. 2.45%) and Synergistota (0.79% vs. 0.48%). Additionally, the LEMP group showed a significant increase in the abundance of Fusobacteriota (0.75% vs. 2.0%) and a decrease in the abundance of Synergistota (0.79% vs. 0.41%) relative to the MELP group, as demonstrated in Figure 4A.
Bacteroides, Romboutsia, Lactobacillus, Rikenellaceae_RC9_gut_group, and Muribaculaceae were identified as the dominant genera in the cecum. The relative abundance of Clostridia_vadinBB60_group was significantly lower in the MEHP group than that in the MEMP group (0.54% vs. 0.79%), whereas the relative abundance of F082 was significantly higher in both the MELP (0.24% vs. 1.62%) and LEMP (0.24% vs. 0.84%) groups. The MEHP group exhibited a significant decrease in Rikenellaceae_RC9_gut_group (8.60% vs. 4.27%), Clostridia_vadinBB60_group (0.81% vs. 0.54%), and Olsenella (0.27% vs. 0.19%) compared with that in the MELP group. Relative to the LEMP group, the MEHP group showed a significant decrease in the abundance of Odoribacter (0.62% vs. 0.30%). The MELP group had a significantly lower relative abundance of Bacteroides (34.56% vs. 27.95%), Fusobacterium (2.0% vs. 0.75%), and Odoribacter (0.62% vs. 0.29%) but a higher relative abundance of Rikenellaceae_RC9_gut_group (5.70% vs. 8.60%), Synergistes (0.41% vs. 0.78%), and Escherichia-Shigella (0.22% vs. 0.49%) compared with that in the LEMP group. The HEMP group exhibited a significant reduction in the relative abundance of F082 (0.84% vs. 0.32%) and Parabacteroides (1.36% vs. 0.94%) but an increase in the relative abundance Megasphaera (0.53% vs. 1.06%) compared with that in the LEMP group. These differences are illustrated in Figure 4B.
Figure 5 presents the results of Linear discriminant analysis–effect size was used to identify the bacterial taxa in the cecal samples of Jingyuan chickens provided different levels of ME and CP. Erysipelotrichaceae, Syntrophomonadaceae, and Akkermansia were notably enriched in the MEMP group, whereas F082, Odoribacter, Rikenellaceae, Desulfobulbaceae, and Clostridia_vadinBB60_group were enriched in the LEMP and MELP groups. Ruminococcus was predominantly enriched in the HEMP and MEHP groups.
4. Discussion
4.1. Growth Performance and Apparent Nutrient Metabolism
Energy and protein levels are fundamental components of livestock and poultry diets, with their composition and balance playing a crucial role in nutrient utilization and production performance[19]. Low levels of ME and CP compromise feed palatability, reduce feed intake, and ultimately decrease ADG, thereby limiting production efficiency[20]. Although chickens fed low-protein diets exhibit reduced ADG, they demonstrate improved nitrogen utilization efficiency[21], a trend that was consistent with the findings of our study. However, excessive levels of ME and CP may prematurely satisfy the energy requirements of chickens, leading to reduced feed intake and impaired feed-conversion efficiency[9]. The combination of excessively high ME and insufficient CP leads to constrained growth performance due to protein deficiency. Furthermore, excessive energy intake can promote fat deposition and increase feed wastage[6]. Conversely, the combination of high CP levels and low ME may increase feed intake, but the surplus protein is inefficiently utilized, as it is oxidized to yield energy rather than contributing to muscle accretion[5]. The findings of our study confirm that inappropriate dietary energy and protein levels—whether insufficient, excessive, or imbalanced—can negatively affect the growth performance and nutrient metabolism of Jingyuan chickens. A significant interaction was observed between ME and CP levels in determining growth performance. Therefore, optimizing the ME-to-CP ratio is crucial in improving feed efficiency and enhancing nutrient digestion and absorption in chickens[22]. Previous studies have suggested that optimal production performance in indigenous chickens can be achieved with dietary ME levels ranging from 11.51–12.50 MJ/kg and CP levels ranging from 14%–15%[7,10,23]. Our findings indicate that male Jingyuan chickens in the MEMP group (11.70 MJ/kg ME, 15.50% CP) showed higher ADG and feed efficiency during the growing period.
4.2. Digestive Organ Index and Jejunal Morphology
The proventriculus and gizzard are the primary digestive organs responsible for the grinding of food and secretion of gastric acid in chickens. Their development is influenced by dietary ME and CP levels[24,25]. In our study, increasing dietary ME levels while maintaining CP levels at 17% resulted in an increase in gizzard weights. Our findings aligns with those reported previously[26], wherein significant interactive effects between ME and CP levels on the gizzard weight in pigeons were noted. Similarly, chickens that were fed diets containing 2550 kcal/kg ME and 17% CP had significantly higher gizzard weights than those fed diets containing 3000 kcal/kg ME and 20% CP[15]. These results suggest that lower energy-to-protein ratios may enhance the mechanical digestion capacity of the gizzard and promote its development.
The duodenum and jejunum are intestinal segments that play a crucial role in nutrient absorption in chickens. Restricted dietary ME and CP levels are known to significantly reduce duodenal and jejunoileal lengths as well as VH and the absorptive surface area[27,28]. VH exhibits a quadratic response to dietary protein levels, indicating that both very high and very low nutrient densities may impair intestinal development[4,29]. Furthermore, an imbalanced ME-to-CP ratio can decrease nutrient metabolism efficiency, interfere with intestinal cell proliferation (e.g., mitosis of jejunal cells), and hinder intestinal development ([26,30].Optimizing the dietary ME-to-CP ratio can significantly improve intestinal structure and function. For example, adjusting ME and CP levels can enhance the VH in the duodenum and ileum, increase the villus height–to–crypt depth (VH/CD) ratio, and optimize intestinal morphology[4,31]. In the current study, chickens subjected to a high daily-gain diet (MEMP group, 11.70 MJ/kg ME and 15.50% CP) exhibited significantly higher duodenal length, jejunal VH, and muscularis thickness. Additionally, the interaction between ME and CP levels significantly altered these indices. Overall, an appropriate ME-to-CP ratio can contribute to the optimization of intestinal and villus structures, promoting nutrient absorption.
4.3. Cecal Microbiome
Bacteroidota, Firmicutes, and Desulfobacterota are the dominant microbial phyla in the cecum of chickens that play crucial roles in gut health and energy metabolism. Among them, Bacteroidota and Firmicutes are particularly effective in degrading dietary proteins and carbohydrates, providing essential energy for chickens, facilitating weight gain, and maintaining intestinal homeostasis[32]. Firmicutes can also degrade tryptophan to produce indole compounds, which help prevent intestinal tissue damage and pathogen invasion, thereby maintaining the gut barrier function [33,34]. However, in our study, an increase in the relative abundance of Desulfobacterota was noted in the ceca of chickens fed a low-protein diet, which is consistent with that reported in a previous study[6]. Under low-CP conditions, the proliferation of Desulfovibrio leads to the degradation of amino acids and other carbon substrates to hydrogen sulfide, a compound known to be toxic to enterocytes. Consequently, this process damages the intestinal mucosa and disrupts gut homeostasis [35,36].A low-protein diet induced the proliferation of Desulfovibrio spp., impaired the intestinal mucosa and microenvironment, and reduced the relative abundances of beneficial bacteria, including Bifidobacterium and Clostridium butyricum[37].
Organic acids are key metabolites that are produced in the gut during microbial fermentation. These acids play a crucial role in supporting the growth and intestinal development of broilers[38]. In the MEMP group, the bacterial families Erysipelotrichaceae, Syntrophomonadaceae, Akkermansia, and Clostridia_vadinBB60_group were enriched, and these bacteria are associated with the metabolism of acetic acid and propionic acid. Short-chain fatty acids, including acetate and propionate, help maintain intestinal barrier function and regulate gut immune responses, thereby promoting the growth and health of chickens[39,40,41]. Although broiler growth performance is suppressed when fed diets low in ME and CP, certain microbial groups, such as F082 and Rikenellaceae_RC9_gut_group, can still improve gut health and promote the growth and production performance via propionate fermentation[42,43]. For example, feeding organic acids can improve gut morphology, effectively increasing crypt depth and the VH/CD ratio and enhancing nutrient absorption[44]. Erysipelotrichaceae and Akkermansia are closely involved in organic acid production and play crucial roles in regulating intestinal immunity and inflammation[45]. The abundance of Odoribacter in the cecum was also significantly enriched in the LEMP group. Odoribacter from the Bacteroidota phylum inhibits the growth of harmful bacteria by modulating fatty acid metabolism and producing short-chain fatty acids, effectively enhancing nutrient absorption[46,47]. Based on these findings, Erysipelotrichaceae, Syntrophomonadaceae, Akkermansia, Clostridia_vadinBB60_group, and Odoribacter may represent a group of bacteria that are potentially beneficial for broiler growth.
5. Conclusions
Varying dietary energy and protein levels significantly affected the growth performance, apparent nutrient metabolism, digestive organ development, and gut microbiota composition of growing Jingyuan chickens, and a significant interaction between the two factors was noted. Chickens in the medium energy (11.70 MJ/kg) and medium protein (15.50 %) group exhibited the best growth performance and intestinal development. Dietary energy and appropriate protein levels could markedly optimize the gut microbiota structure by suppressing the relative abundance of Desulfobacterota and increasing the abundances of beneficial bacteria, including Erysipelotrichaceae, Syntrophomonadaceae, Akkermansia, the Clostridia_vadinBB60_group, and Odoribacter, thereby improving the intestinal environment and promoting nutrient absorption and utilization.
Author Contributions
X. Guo: Writing – review & editing, Writing – original draft, Methodology. J. Liu: Methodology, Data curation, Conceptualization. J. Yang: Methodology. Q.X. Gao: Formal analysis. J. Zhang: Supervision, Project administration. W.Z. Yang: Conceptualization. G.S. Xin: Writing – review & editing, Supervision, Funding acquisition.
Funding
We sincerely thank the Key Research and Development Program of Ningxia (Project Nos. 2022BBF02034 and 2023BCF01037) for their financial support of this research.
Institutional Review Board Statement
All animal procedures were approved by the Institutional Animal Care and Use Committee of Ningxia University (Approval No. NXU-A-2023-096).
Informed Consent Statement
Not applicable.
Data Availability Statement
All data generated or analyzed during this study are included in this published article.
Conflicts of Interest
The authors declare no conflicts of interest.
Abbreviations
| ME | Metabolizable energy |
| CP | Crude protein |
| ADG | Average daily gain |
| F/G | Feed-to-gain ratio |
| VH | Villus height |
| CD | Crypt depth |
| MLT | Muscle layer thickness |
| DM | Dry matter |
| GE | Gross energy |
References
- Zhang, Qianqian, Hongtao Zhang, Yukun Jiang, Jianping Wang, De Wu, Caimei Wu, Lianqiang Che, Yan Lin, Yong Zhuo, Zheng Luo, Kangkang Nie, and Jian Li. “Chromium Propionate Supplementation to Energy- and Protein-Reduced Diets Reduces Feed Consumption but Improves Feed Conversion Ratio of Yellow-Feathered Male Broilers in the Early Period and Improves Meat Quality.” Poultry Science 103, no. 2 (2024): 103260.
- Shen, Yutian, Wentao Li, Lixia Kai, Yuqing Fan, Youping Wu, Fengqin Wang, Yizhen Wang, and Zeqing Lu. “Effects of Dietary Metabolizable Energy and Crude Protein Levels on Production Performance, Meat Quality and Cecal Microbiota of Taihe Silky Fowl during Growing Period.” Poultry Science 104, no. 1 (2025): 104654.
- Ko, Hanseo, Jinquan Wang, Josh Wen-Cheng Chiu, and Woo Kyun Kim. “Effects of Metabolizable Energy and Emulsifier Supplementation on Growth Performance, Nutrient Digestibility, Body Composition, and Carcass Yield in Broilers.” Poultry Science 102, no. 4 (2023): 102509.
- Laudadio, V., L. Passantino, A. Perillo, G. Lopresti, A. Passantino, R. U. Khan, and V. Tufarelli. “Productive Performance and Histological Features of Intestinal Mucosa of Broiler Chickens Fed Different Dietary Protein Levels.” Poultry Science 91, no. 1 (2012): 265-70.
- Yu, Yao, Chunxiao Ai, Caiwei Luo, and Jianmin Yuan. “Effect of Dietary Crude Protein and Apparent Metabolizable Energy Levels on Growth Performance, Nitrogen Utilization, Serum Parameter, Protein Synthesis, and Amino Acid Metabolism of 1- to 10-Day-Old Male Broilers.” International Journal of Molecular Sciences 25, no. 13 (2024).
- Hu, Hong, Ying Huang, Anjian Li, Qianhui Mi, Kunping Wang, Liang Chen, Zelong Zhao, Qiang Zhang, Xi Bai, and Hongbin Pan. “Effects of Different Energy Levels in Low-Protein Diet on Liver Lipid Metabolism in the Late-Phase Laying Hens through the Gut-Liver Axis.” Journal of Animal Science and Biotechnology 15, no. 1 (2024): 98.
- Chang, C., Q. Q. Zhang, H. H. Wang, Q. Chu, J. Zhang, Z. X. Yan, H. G. Liu, and A. L. Geng. “Dietary Metabolizable Energy and Crude Protein Levels Affect Pectoral Muscle Composition and Gut Microbiota in Native Growing Chickens.” Poultry Science 102, no. 2 (2023): 102353.
- Goodarzi Boroojeni, Farshad, W. Vahjen, K. Männer, A. Blanch, D. Sandvang, and J. Zentek. “Bacillus Subtilis in Broiler Diets with Different Levels of Energy and Protein.” Poultry Science 97, no. 11 (2018): 3967-76.
- Li, Wentao, Lixia Kai, Wei Wei, Yuqing Fan, Yizhen Wang, and Zeqing Lu. “Dietary Metabolizable Energy and Crude Protein Levels Affect Taihe Silky Fowl Growth Performance, Meat Quality, and Cecal Microbiota during Fattening.” Poultry Science 103, no. 12 (2024): 104363.
- Zhou, Luli, Dingfa Wang, Khaled Abouelezz, Liguang Shi, Ting Cao, and Guanyu Hou. “Impact of Dietary Protein and Energy Levels on Fatty Acid Profile, Gut Microbiome and Cecal Metabolome in Native Growing Chickens.” Poultry Science 103, no. 8 (2024): 103917.
- Wen, Chaoliang, Wei Yan, Chunning Mai, Zhongyi Duan, Jiangxia Zheng, Congjiao Sun, and Ning Yang. “Joint Contributions of the Gut Microbiota and Host Genetics to Feed Efficiency in Chickens.” Microbiome 9, no. 1 (2021): 126.
- Jackson, Starr, J. D. Summers, and S. Leeson. “Effect of Dietary Protein and Energy on Broiler Carcass Composition and Efficiency of Nutrient Utilization.” Poultry Science 61, no. 11 (1982): 2224-31.
- Zhao, J. P., J. L. Chen, G. P. Zhao, M. Q. Zheng, R. R. Jiang, and J. Wen. “Live Performance, Carcass Composition, and Blood Metabolite Responses to Dietary Nutrient Density in Two Distinct Broiler Breeds of Male Chickens1.” Poultry Science 88, no. 12 (2009): 2575-84.
- Candrawati, Desak Putu Mas Ari. “The Effect of Different Energy-Protein Ratio in Diets on Feed Digestibility and Performance of Native Chickens in the Starter Phase.” International Journal of Fauna and Biological Studies 7 (2020): 92-96.
- Matus-Aragón, Miguel Ángel, Fernando González-Cerón, Josafhat Salinas-Ruiz, Eliseo Sosa-Montes, Arturo Pro-Martínez, Omar Hernández-Mendo, Juan Manuel Cuca-García, and David Jesús Chan-Díaz. “Productive Performance of Mexican Creole Chickens from Hatching to 12 Weeks of Age Fed Diets with Different Concentrations of Metabolizable Energy and Crude Protein.” Animal Bioscience 34, no. 11 (2021): 1794-801.
- Dong, Liping, Yumei Li, Yonghong Zhang, Yan Zhang, Jing Ren, Jinlei Zheng, Jizhe Diao, Hongyu Ni, Yijing Yin, Ruihong Sun, Fangfang Liang, Peng Li, Changhai Zhou, and Yuwei Yang. “Effects of Organic Zinc on Production Performance, Meat Quality, Apparent Nutrient Digestibility and Gut Microbiota of Broilers Fed Low-Protein Diets.” Scientific Reports 13, no. 1 (2023): 10803.
- Mera-Zúñiga, F., A. Pro-Martínez, J. F. Zamora-Natera, E. Sosa-Montes, J. D. Guerrero-Rodríguez, S. I. Mendoza-Pedroza, J. M. Cuca-García, R. M. López-Romero, D. Chan-Díaz, C. M. Becerril-Pérez, A. J. Vargas-Galicia, and J. Bautista-Ortega. “Soybean Meal Substitution by Dehulled Lupine (Lupinus Angustifolius) with Enzymes in Broiler Diets.” Asian-Australas J Anim Sci 32, no. 4 (2019): 564-73.
- Hou, Jinwang, Lizhi Lu, Lina Lian, Yong Tian, Tao Zeng, Yanfen Ma, Sisi Li, Li Chen, Wenwu Xu, Tiantian Gu, Guoqin Li, and Xin Liu. “Effects of Coated Sodium Butyrate on the Growth Performance, Serum Biochemistry, Antioxidant Capacity, Intestinal Morphology, and Intestinal Microbiota of Broiler Chickens.” Frontiers In Microbiology 15 (2024): 1368736.
- Corsetti, Giovanni, Evasio Pasini, Tiziano M. Scarabelli, Claudia Romano, Arashpreet Singh, Carol C. Scarabelli, and Francesco S. Dioguardi. “Importance of Energy, Dietary Protein Sources, and Amino Acid Composition in the Regulation of Metabolism: An Indissoluble Dynamic Combination for Life.” Nutrients 16, no. 15 (2024): 2417.
- Dairo, Festus, Akinyele Adesehinwa, A. T, and J. Oluyemi. “High and Low Dietary Energy and Protein Levels for Broiler Chickens.” African Journal of Agricultural Research 5 (2010): 2030-38.
- Musigwa, Sosthene, Natalie Morgan, Robert A. Swick, Pierre Cozannet, and Shu-Biao Wu. “Energy Dynamics, Nitrogen Balance, and Performance in Broilers Fed High- and Reduced-Cp Diets.” Journal of Applied Poultry Research 29, no. 4 (2020): 830-41.
- Zeng, Q. F., P. Cherry, A. Doster, R. Murdoch, O. Adeola, and T. J. Applegate. “Effect of Dietary Energy and Protein Content on Growth and Carcass Traits of Pekin Ducks.” Poultry Science 94, no. 3 (2015): 384-94.
- Geng, Ai Lian, Qian Qian Zhang, Cheng Chang, Hai Hong Wang, Qin Chu, Jian Zhang, Zhi Xun Yan, and Hua Gui Liu. “Dietary Metabolizable Energy and Crude Protein Levels Affect the Performance, Egg Quality and Biochemical Parameters of a Dual-Purpose Chicken.” Animal Biotechnology 34, no. 7 (2023): 2714-23.
- Frikha, M., H. M. Safaa, E. Jiménez-Moreno, R. Lázaro, and G. G. Mateos. “Influence of Energy Concentration and Feed Form of the Diet on Growth Performance and Digestive Traits of Brown Egg-Laying Pullets from 1 to 120 Days of Age.” Animal Feed Science and Technology 153, no. 3 (2009): 292-302.
- Yang, Haiming, Zhi Yang, Zhiyue Wang, Wei Wang, Kaihua Huang, Wenjia Fan, and Tianli Jia. “Effects of Early Dietary Energy and Protein Dilution on Growth Performance, Nutrient Utilization and Internal Organs of Broilers.” Italian Journal of Animal Science 14, no. 2 (2015): 3729.
- Peng, Jie, Weiying Huang, Wei Zhang, Yanlin Zhang, Menglin Yang, Shiqi Zheng, Yantao Lv, Hongyan Gao, Wei Wang, Jian Peng, and Yanhua Huang. “Effect of Different Dietary Energy/Protein Ratios on Growth Performance, Reproductive Performance of Breeding Pigeons and Slaughter Performance, Meat Quality of Squabs in Summer.” Poultry Science 102, no. 7 (2023): 102577.
- Incharoen, Tossaporn, Koh-en Yamauchi, Tomoki Erikawa, and Hisaya Gotoh. “Histology of Intestinal Villi and Epithelial Cells in Chickens Fed Low-Crude Protein or Low-Crude Fat Diets.” Italian Journal of Animal Science 9, no. 4 (2010): e82.
- Sun, Z. H., Z. X. He, Q. L. Zhang, Z. L. Tan, X. F. Han, S. X. Tang, C. S. Zhou, M. Wang, and Q. X. Yan. “Effects of Energy and Protein Restriction, Followed by Nutritional Recovery on Morphological Development of the Gastrointestinal Tract of Weaned Kids1.” Journal of Animal Science 91, no. 9 (2013): 4336-44.
- Gu, X., and D. Li. “Effect of Dietary Crude Protein Level on Villous Morphology, Immune Status and Histochemistry Parameters of Digestive Tract in Weaning Piglets.” Animal Feed Science and Technology 114, no. 1 (2004): 113-26.
- Buwjoom, T., K. Yamauchi, T. Erikawa, and H. Goto. “Histological Intestinal Alterations in Chickens Fed Low Protein Diet.” Journal of Animal Physiology and Animal Nutrition 94, no. 3 (2010): 354-61.
- Houshmand, M., K. Azhar, I. Zulkifli, M. H. Bejo, and A. Kamyab. “Effects of Nonantibiotic Feed Additives on Performance, Nutrient Retention, Gut Ph, and Intestinal Morphology of Broilers Fed Different Levels of Energy.” Journal of Applied Poultry Research 20, no. 2 (2011): 121-28.
- Garçon, C. J. J., J. L. Ellis, C. D. Powell, A. Navarro Villa, A. I. Garcia Ruiz, J. France, and S. de Vries. “A Dynamic Model to Measure Retention of Solid and Liquid Digesta Fractions in Chickens Fed Diets with Differing Fibre Sources.” animal 17, no. 7 (2023): 100867.
- Yokoyama, M. T., and J. R. Carlson. “Microbial Metabolites of Tryptophan in the Intestinal Tract with Special Reference to Skatole.” The American Journal of Clinical Nutrition 32, no. 1 (1979): 173-78.
- Huang, Yichen, Xing Shi, Zhiyong Li, Yang Shen, Xinxin Shi, Liying Wang, Gaofei Li, Ye Yuan, Jixiang Wang, Yongchao Zhang, Lei Zhao, Meng Zhang, Yu Kang, and Ying Liang. “Possible Association of Firmicutes in the Gut Microbiota of Patients with Major Depressive Disorder.” Neuropsychiatric Disease and Treatment 14 (2018): 3329-37.
- Willis, C. L., J. H. Cummings, G. Neale, and G. R. Gibson. “Nutritional Aspects of Dissimilatory Sulfate Reduction in the Human Large Intestine.” Current Microbiology 35, no. 5 (1997): 294-98.
- Rowan, Fiachra, Neil G. Docherty, Madeline Murphy, T. Brendan Murphy, J. Calvin Coffey, and P. Ronan O’Connell. “Bacterial Colonization of Colonic Crypt Mucous Gel and Disease Activity in Ulcerative Colitis.” Annals of Surgery 252, no. 5 (2010): 869-75.
- Zhou, Xinhong, Shiyi Li, Yilong Jiang, Jicheng Deng, Chuanpeng Yang, Lijuan Kang, Huaidan Zhang, and Xianxin Chen. “Use of Fermented Chinese Medicine Residues as a Feed Additive and Effects on Growth Performance, Meat Quality, and Intestinal Health of Broilers.” Frontiers In Veterinary Science 10 (2023): 1157935.
- Saleem, Kinza, Saima, Abdur Rahman, Talat Naseer Pasha, Athar Mahmud, and Zafar Hayat. “Effects of Dietary Organic Acids on Performance, Cecal Microbiota, and Gut Morphology in Broilers.” Tropical Animal Health and Production 52, no. 6 (2020): 3589-96.
- Yin, Zhenchen, Shuyun Ji, Jiantao Yang, Wei Guo, Yulong Li, Zhouzheng Ren, and Xiaojun Yang. “Cecal Microbial Succession and Its Apparent Association with Nutrient Metabolism in Broiler Chickens.” mSphere 8, no. 3 (2023): e00614-22.
- Liu, Yue, Akiber Chufo Wachemo, HaiRong Yuan, and XiuJin Li. “Anaerobic Digestion Performance and Microbial Community Structure of Corn Stover in Three-Stage Continuously Stirred Tank Reactors.” Bioresource Technology 287 (2019): 121339.
- Sebastià, Cristina, M. Folch Josep, Maria Ballester, Jordi Estellé, Magí Passols, María Muñoz, M. García-Casco Juan, I. Fernández Ana, Anna Castelló, Armand Sánchez, and Daniel Crespo-Piazuelo. “Interrelation between Gut Microbiota, Scfa, and Fatty Acid Composition in Pigs.” mSystems 9, no. 1 (2023): e01049-23.
- Han, Haoqi, Liyang Zhang, Yuan Shang, Mingyan Wang, Clive J. C. Phillips, Yao Wang, Chuanyou Su, Hongxia Lian, Tong Fu, and Tengyun Gao. “Replacement of Maize Silage and Soyabean Meal with Mulberry Silage in the Diet of Hu Lambs on Growth, Gastrointestinal Tissue Morphology, Rumen Fermentation Parameters and Microbial Diversity.” Animals, no. 11 (2022).
- Zhu, Yixiao, Zhisheng Wang, Rui Hu, Xueying Wang, Fengpeng Li, Xiangfei Zhang, Huawei Zou, Quanhui Peng, Bai Xue, and Lizhi Wang. “Comparative Study of the Bacterial Communities Throughout the Gastrointestinal Tract in Two Beef Cattle Breeds.” Applied Microbiology and Biotechnology 105, no. 1 (2021): 313-25.
- Ma, Jiayu, Jian Wang, Shad Mahfuz, Shenfei Long, Di Wu, Jie Gao, and Xiangshu Piao. “Supplementation of Mixed Organic Acids Improves Growth Performance, Meat Quality, Gut Morphology and Volatile Fatty Acids of Broiler Chicken.” Animals, no. 11 (2021).
- Kou, Ruixin, Jin Wang, Ang Li, Yuanyifei Wang, Dancai Fan, Bowei Zhang, Wenhui Fu, Jingmin Liu, Hanyue Fu, and Shuo Wang. “2’-Fucosyllactose Alleviates Ova-Induced Food Allergy in Mice by Ameliorating Intestinal Microecology and Regulating the Imbalance of Th2/Th1 Proportion.” Food & Function 14, no. 24 (2023): 10924-40.
- Zhang, Bing, Haoran Zhang, Yang Yu, Ruiqiang Zhang, Yanping Wu, Min Yue, and Caimei Yang. “Effects of Bacillus Coagulans on Growth Performance, Antioxidant Capacity, Immunity Function, and Gut Health in Broilers.” Poultry Science 100, no. 6 (2021): 101168.
- Huber-Ruano, Isabel, Enrique Calvo, Jordi Mayneris-Perxachs, M. Mar Rodríguez-Peña, Victòria Ceperuelo-Mallafré, Lídia Cedó, Catalina Núñez-Roa, Joan Miro-Blanch, María Arnoriaga-Rodríguez, Aurélie Balvay, Claire Maudet, Pablo García-Roves, Oscar Yanes, Sylvie Rabot, Ghjuvan Micaelu Grimaud, Annachiara De Prisco, Angela Amoruso, José Manuel Fernández-Real, Joan Vendrell, and Sonia Fernández-Veledo. “Orally Administered Odoribacter Laneus Improves Glucose Control and Inflammatory Profile in Obese Mice by Depleting Circulating Succinate.” Microbiome 10, no. 1 (2022): 135.
Figure 2.
Effects of different ME and CP levels on the α-diversity of cecal microbiota in Jingyuan chickens. (A) Venn diagram of cecal microbiota OTUs in the LEMP, MELP, MEMP, MEHP, and HEMP groups. (B) Rarefaction curves. (C) Shannon and Simpson indices representing microbial community diversity; Chao 1 index representing microbial community richness.
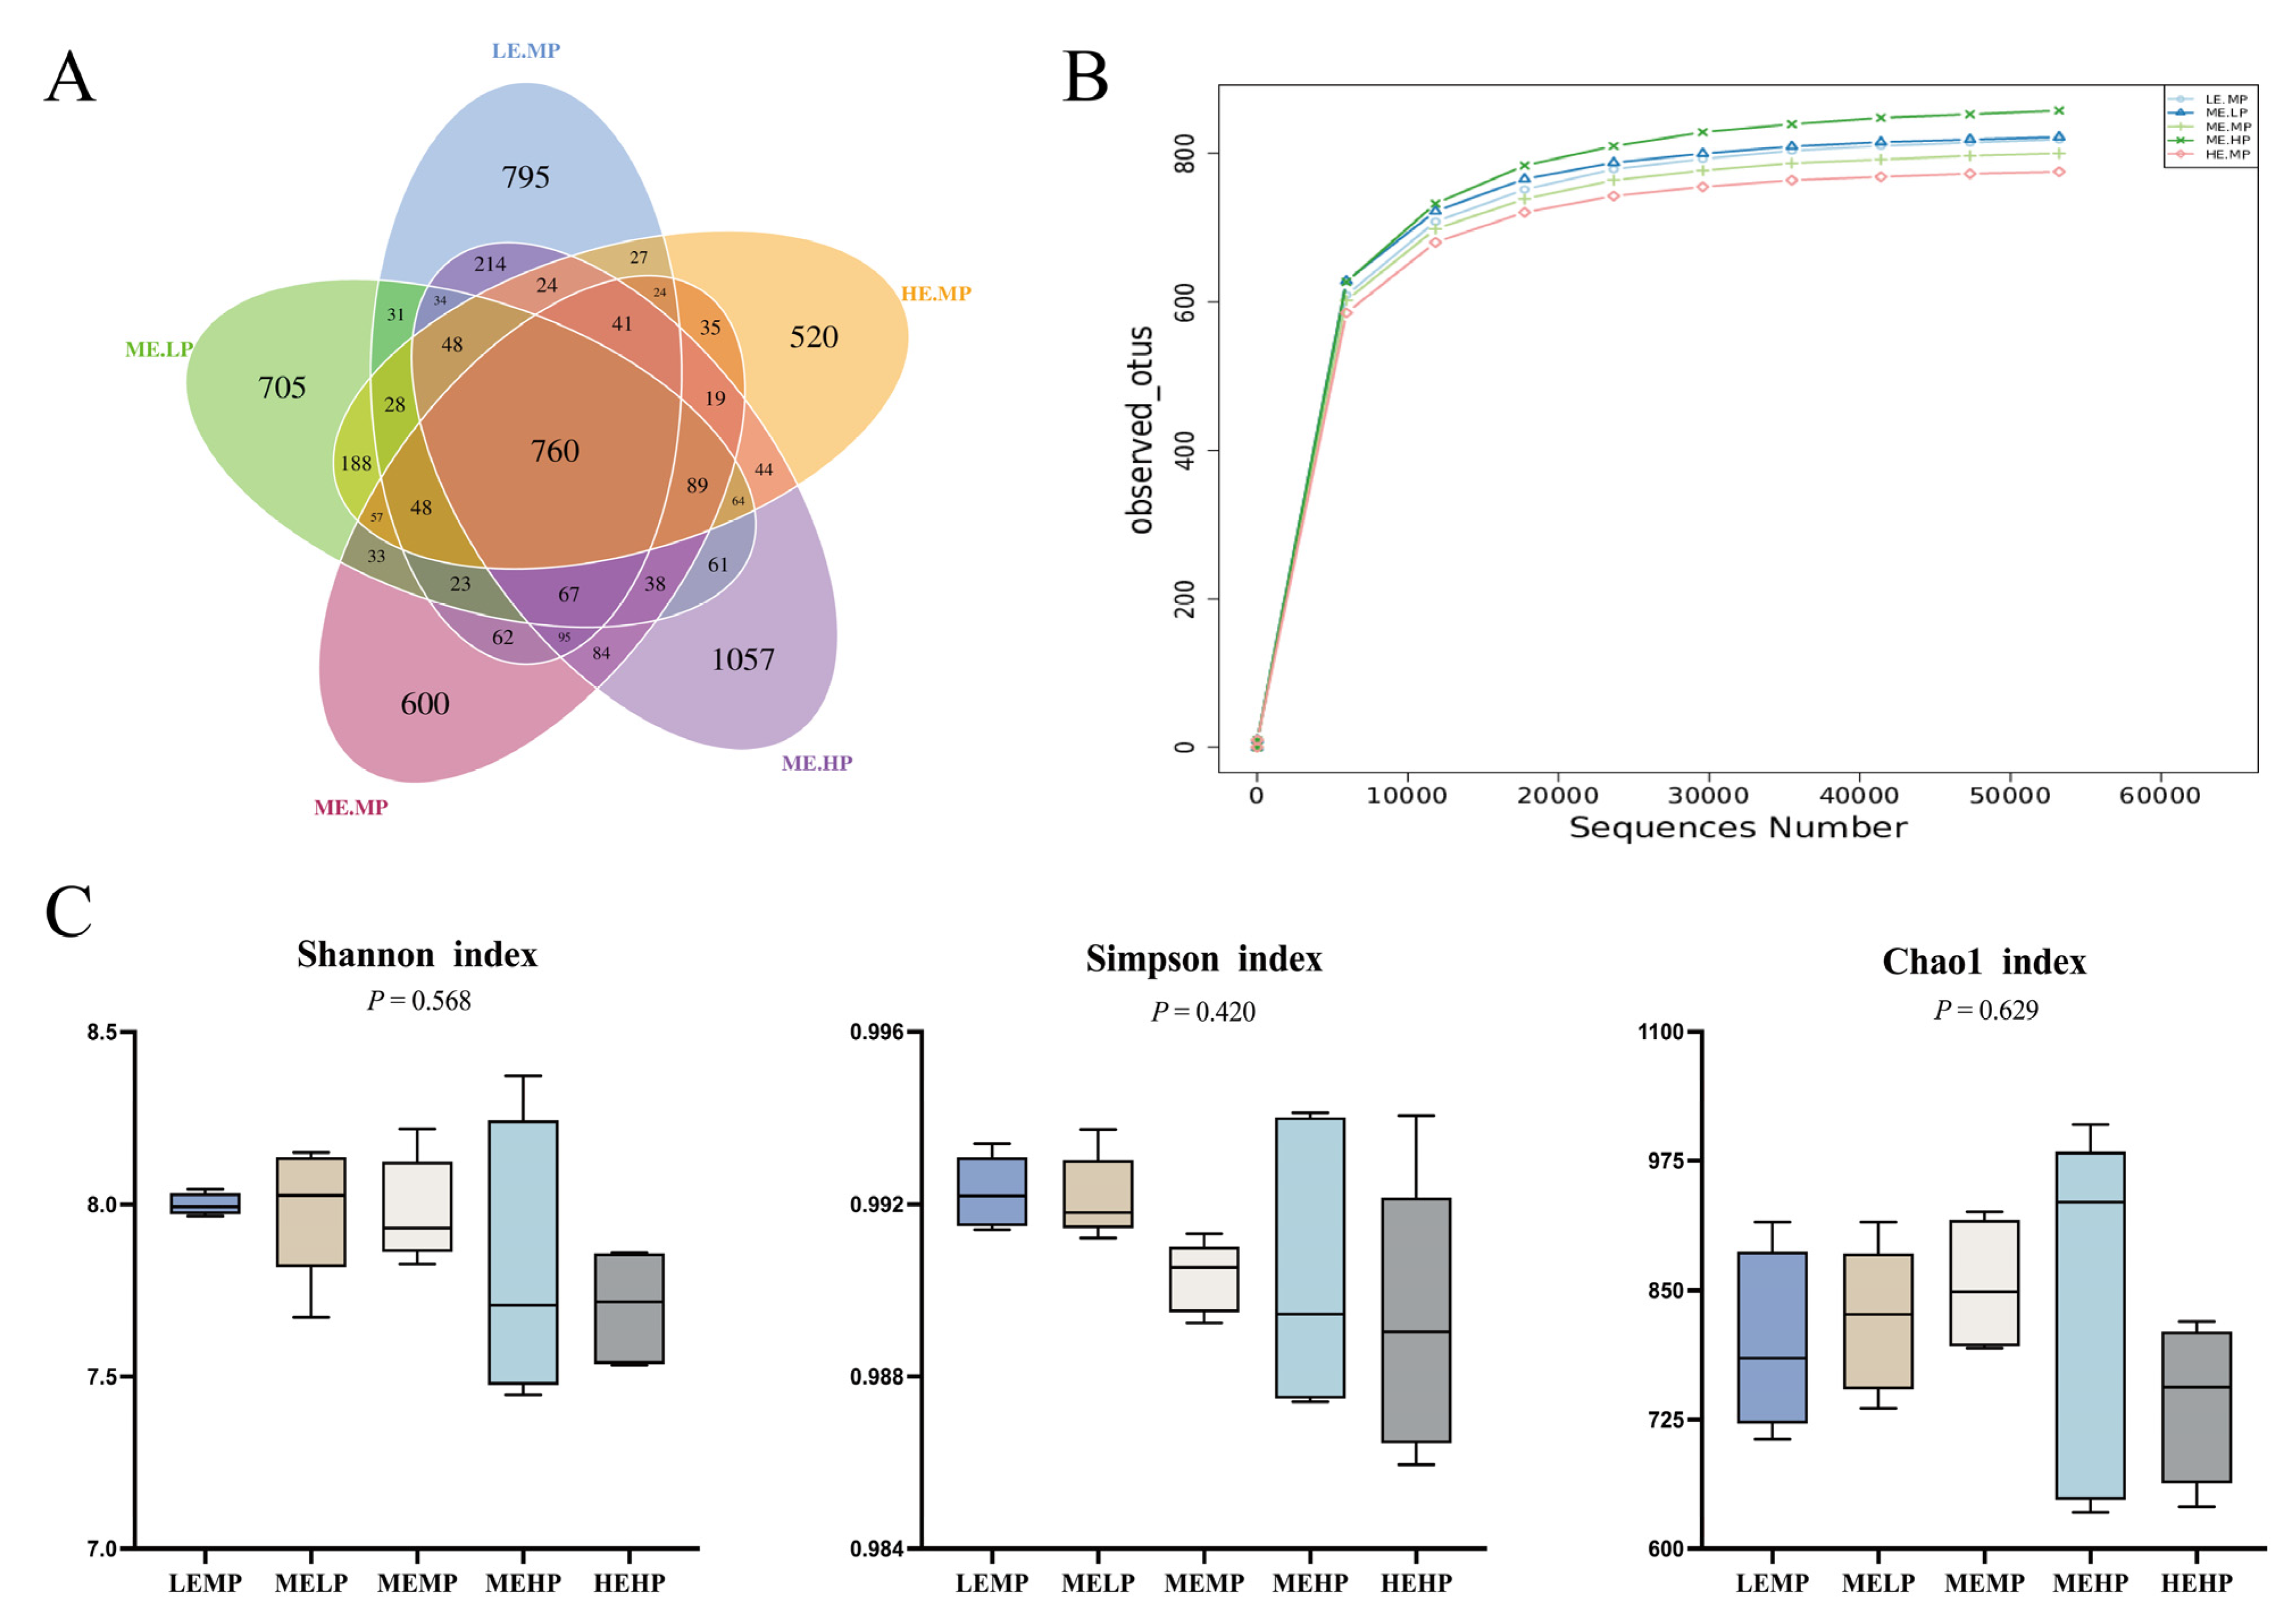
Figure 3.
Effects of different ME and CP levels on the composition of cecal microbiota at the phylum and genus levels in Jingyuan chickens. (A) Relative abundance of dominant bacterial phyla in each group. (B) Relative abundance of dominant bacterial genera in each group. Groups: LEMP (low ME and medium CP), MELP (medium ME and low CP), MEMP (medium ME and medium CP), MEHP (medium ME and high CP), and HEMP (high ME and medium CP).
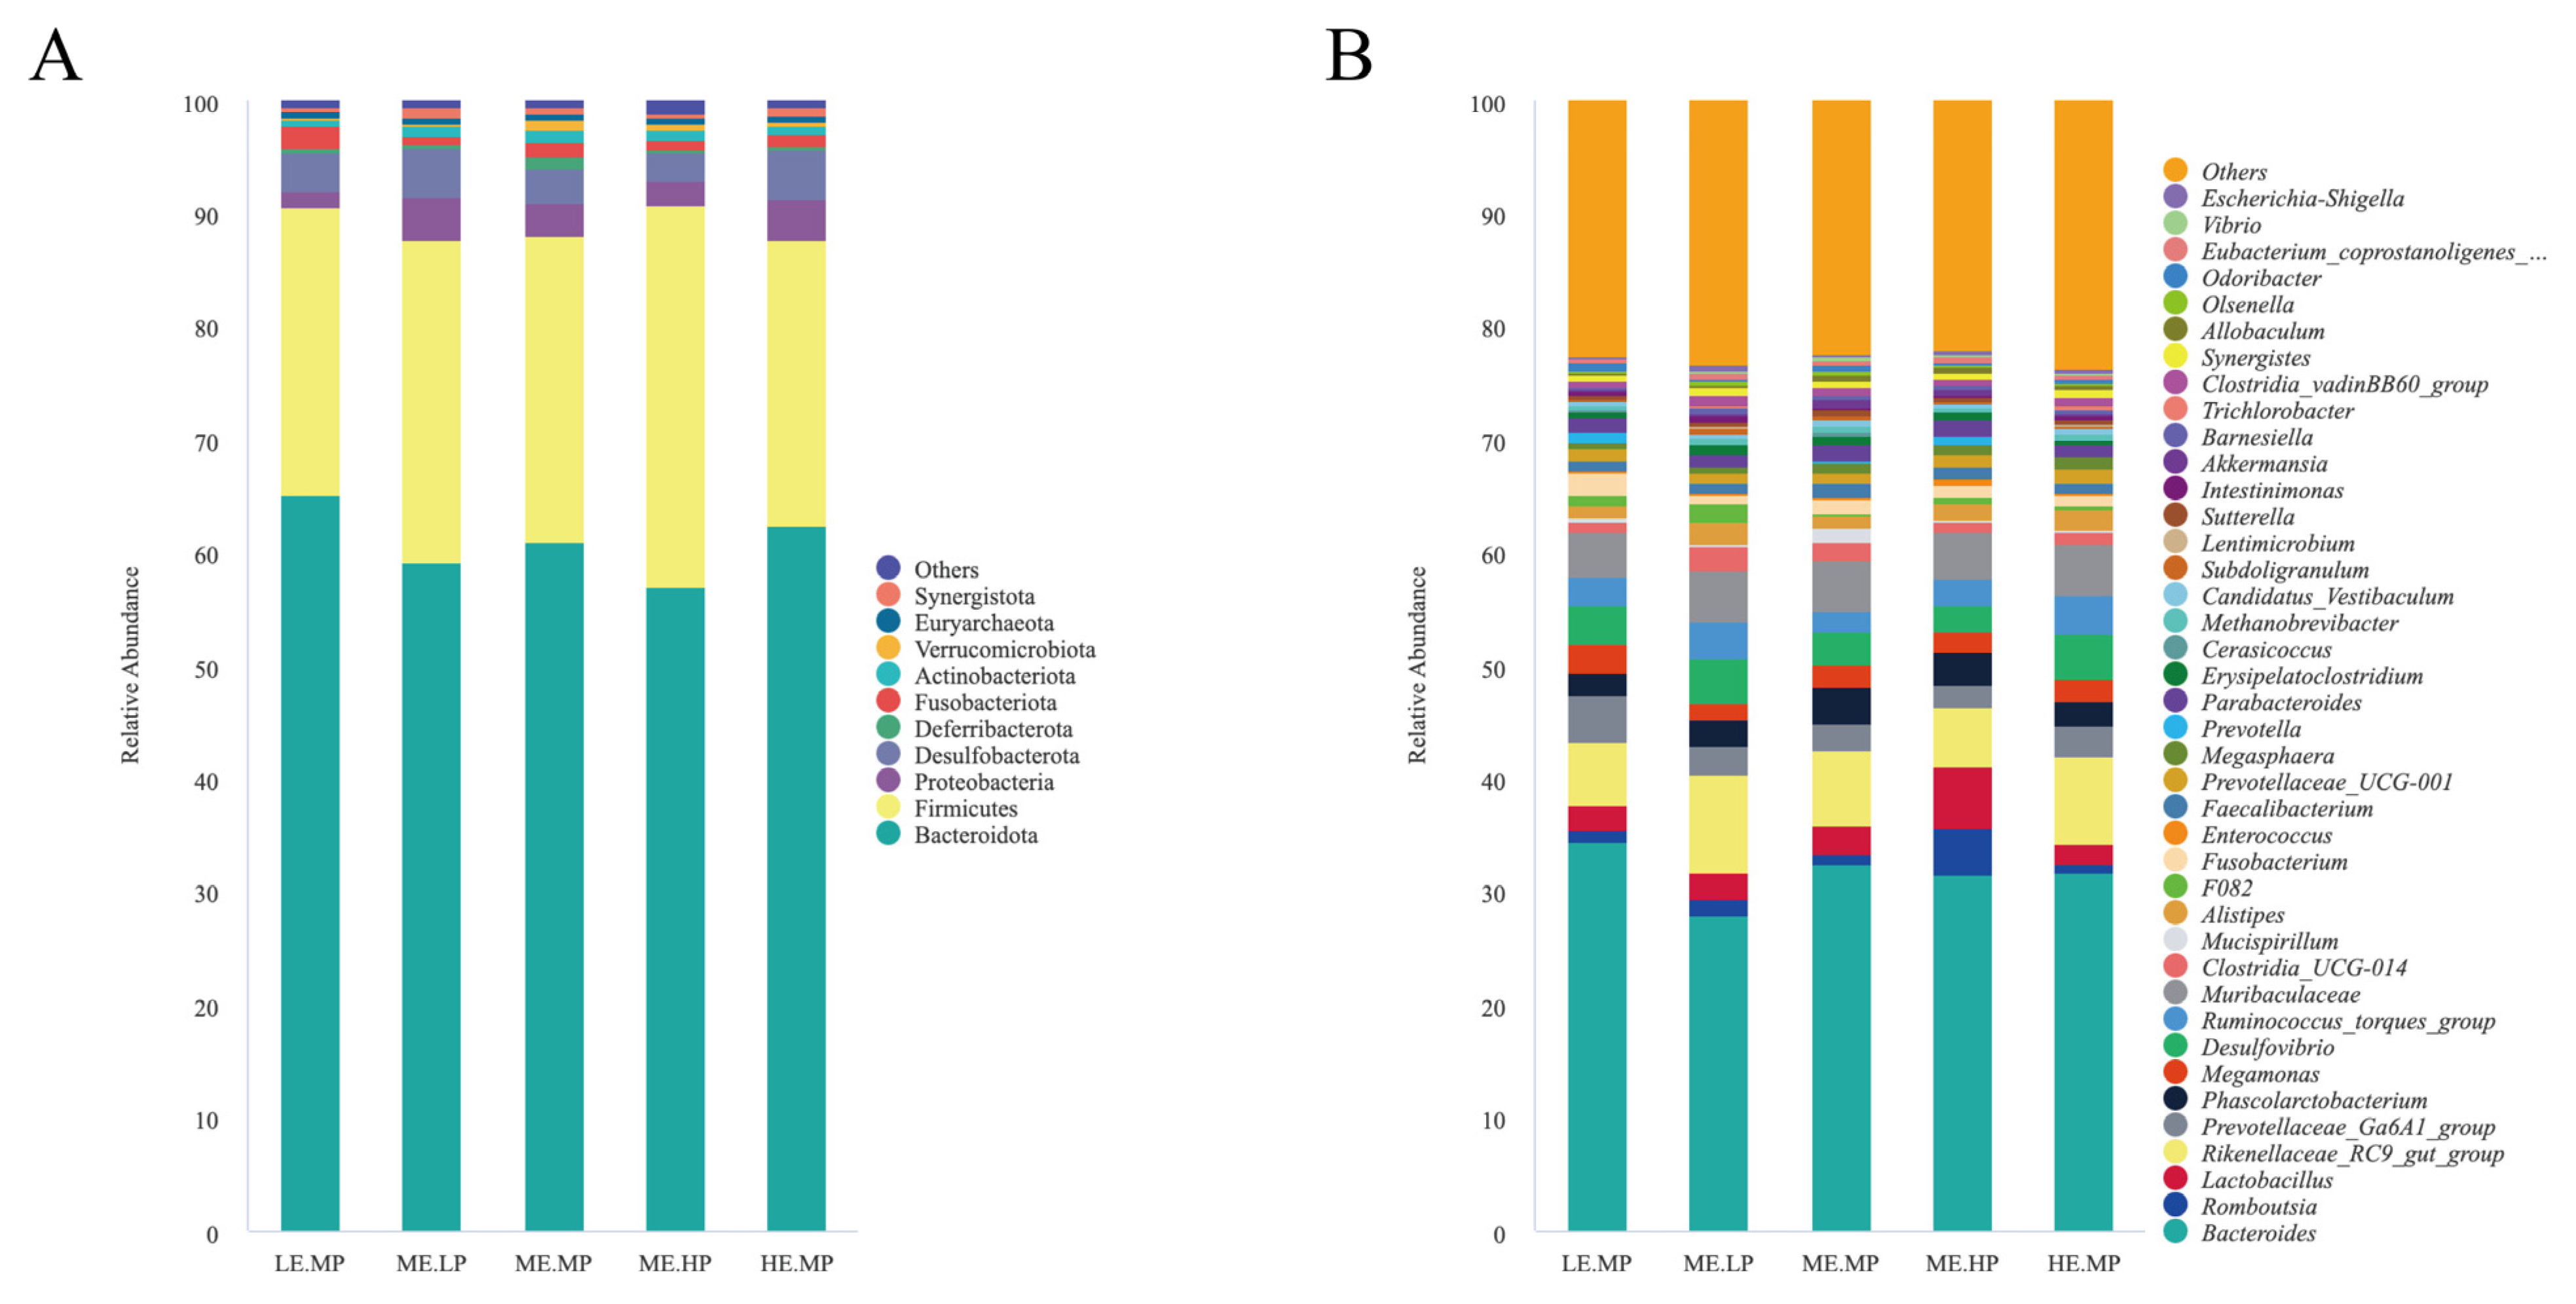
Figure 4.
Differential cecal microbiota at the phylum and genus levels in Jingyuan chickens under different ME and CP levels. (A) Differential bacterial phyla. (B) Differential bacterial genera. Groups: LEMP (low ME and medium CP), MELP (medium ME and low CP), MEMP (medium ME and medium CP), MEHP (medium ME and high CP), and HEMP (high ME and medium CP). Method: T-test.
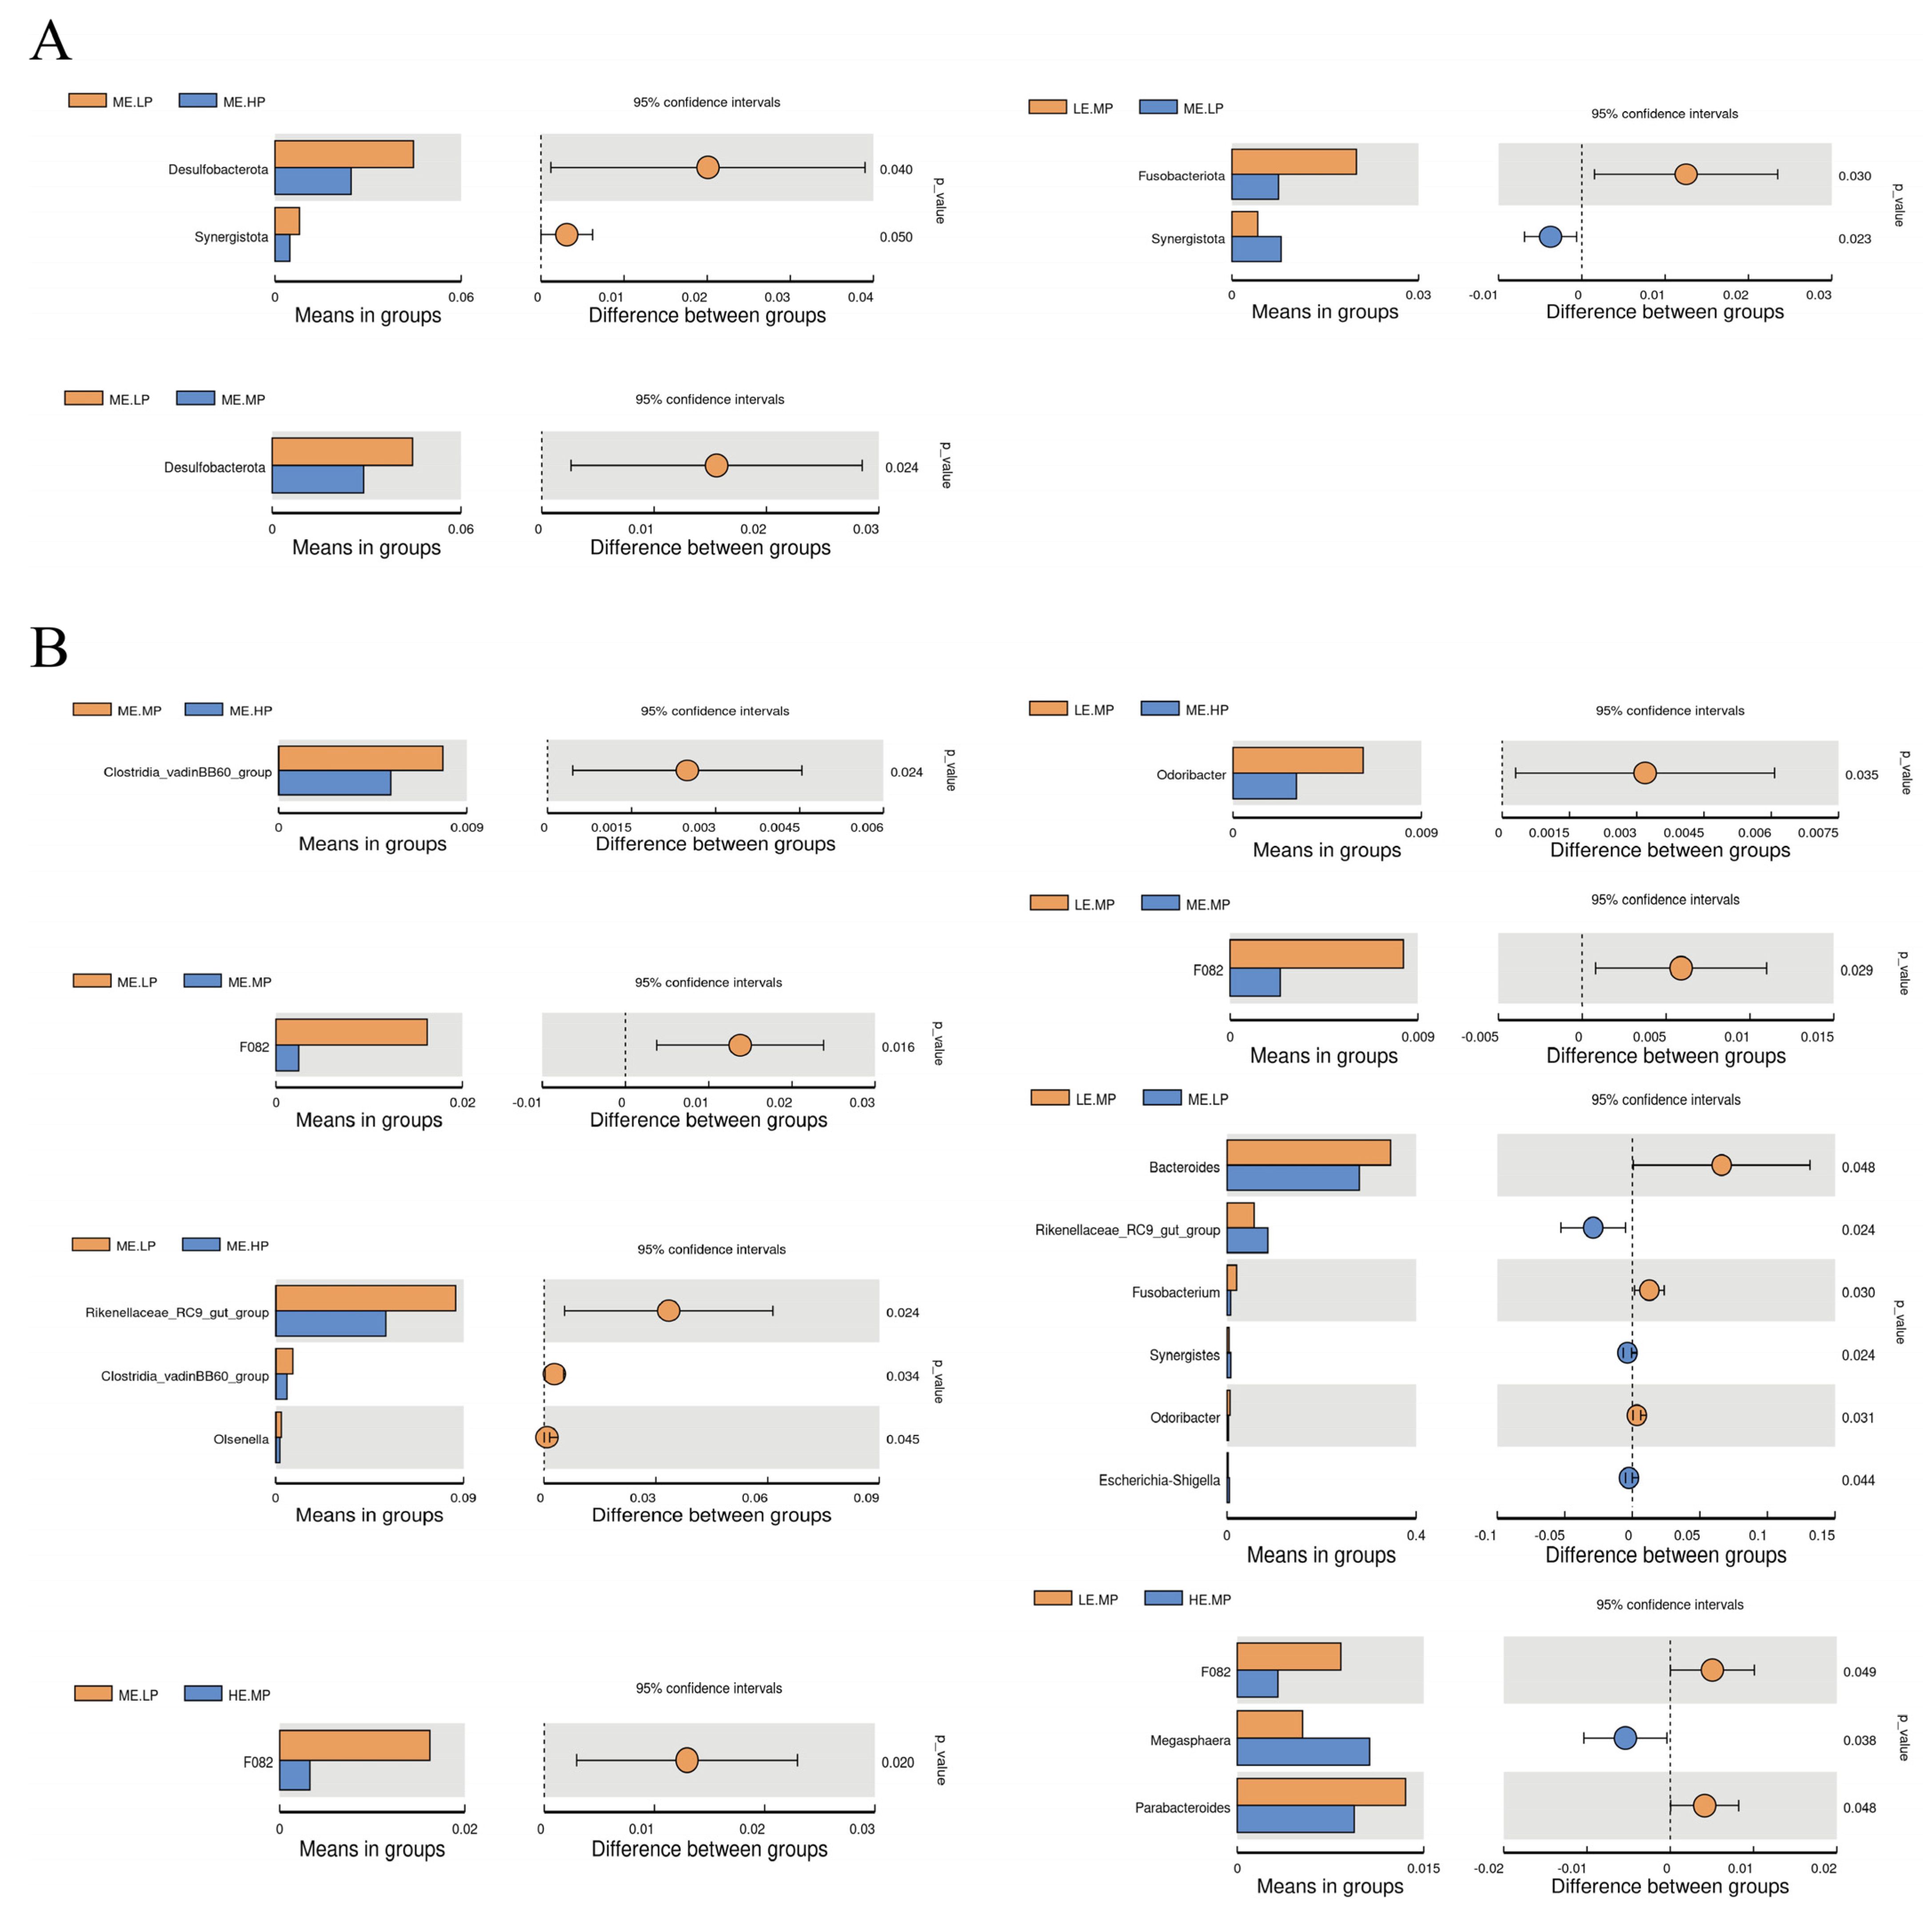
Figure 5.
Identification of significantly different taxa among groups using linear discriminant analysis effect size (LEfSe) with default parameters (LDA score = 2). (A) Taxa representing significant differences among LEMP (low ME and medium CP), MELP (medium ME and low CP), MEMP (medium ME and medium CP), MEHP (medium ME and high CP), and HEMP (high ME and medium CP) groups. (B) Taxa representing significant differences among MELP, MEMP, and MEHP groups. (C) Taxa representing significant differences among LEMP, MEMP, and HEMP groups.
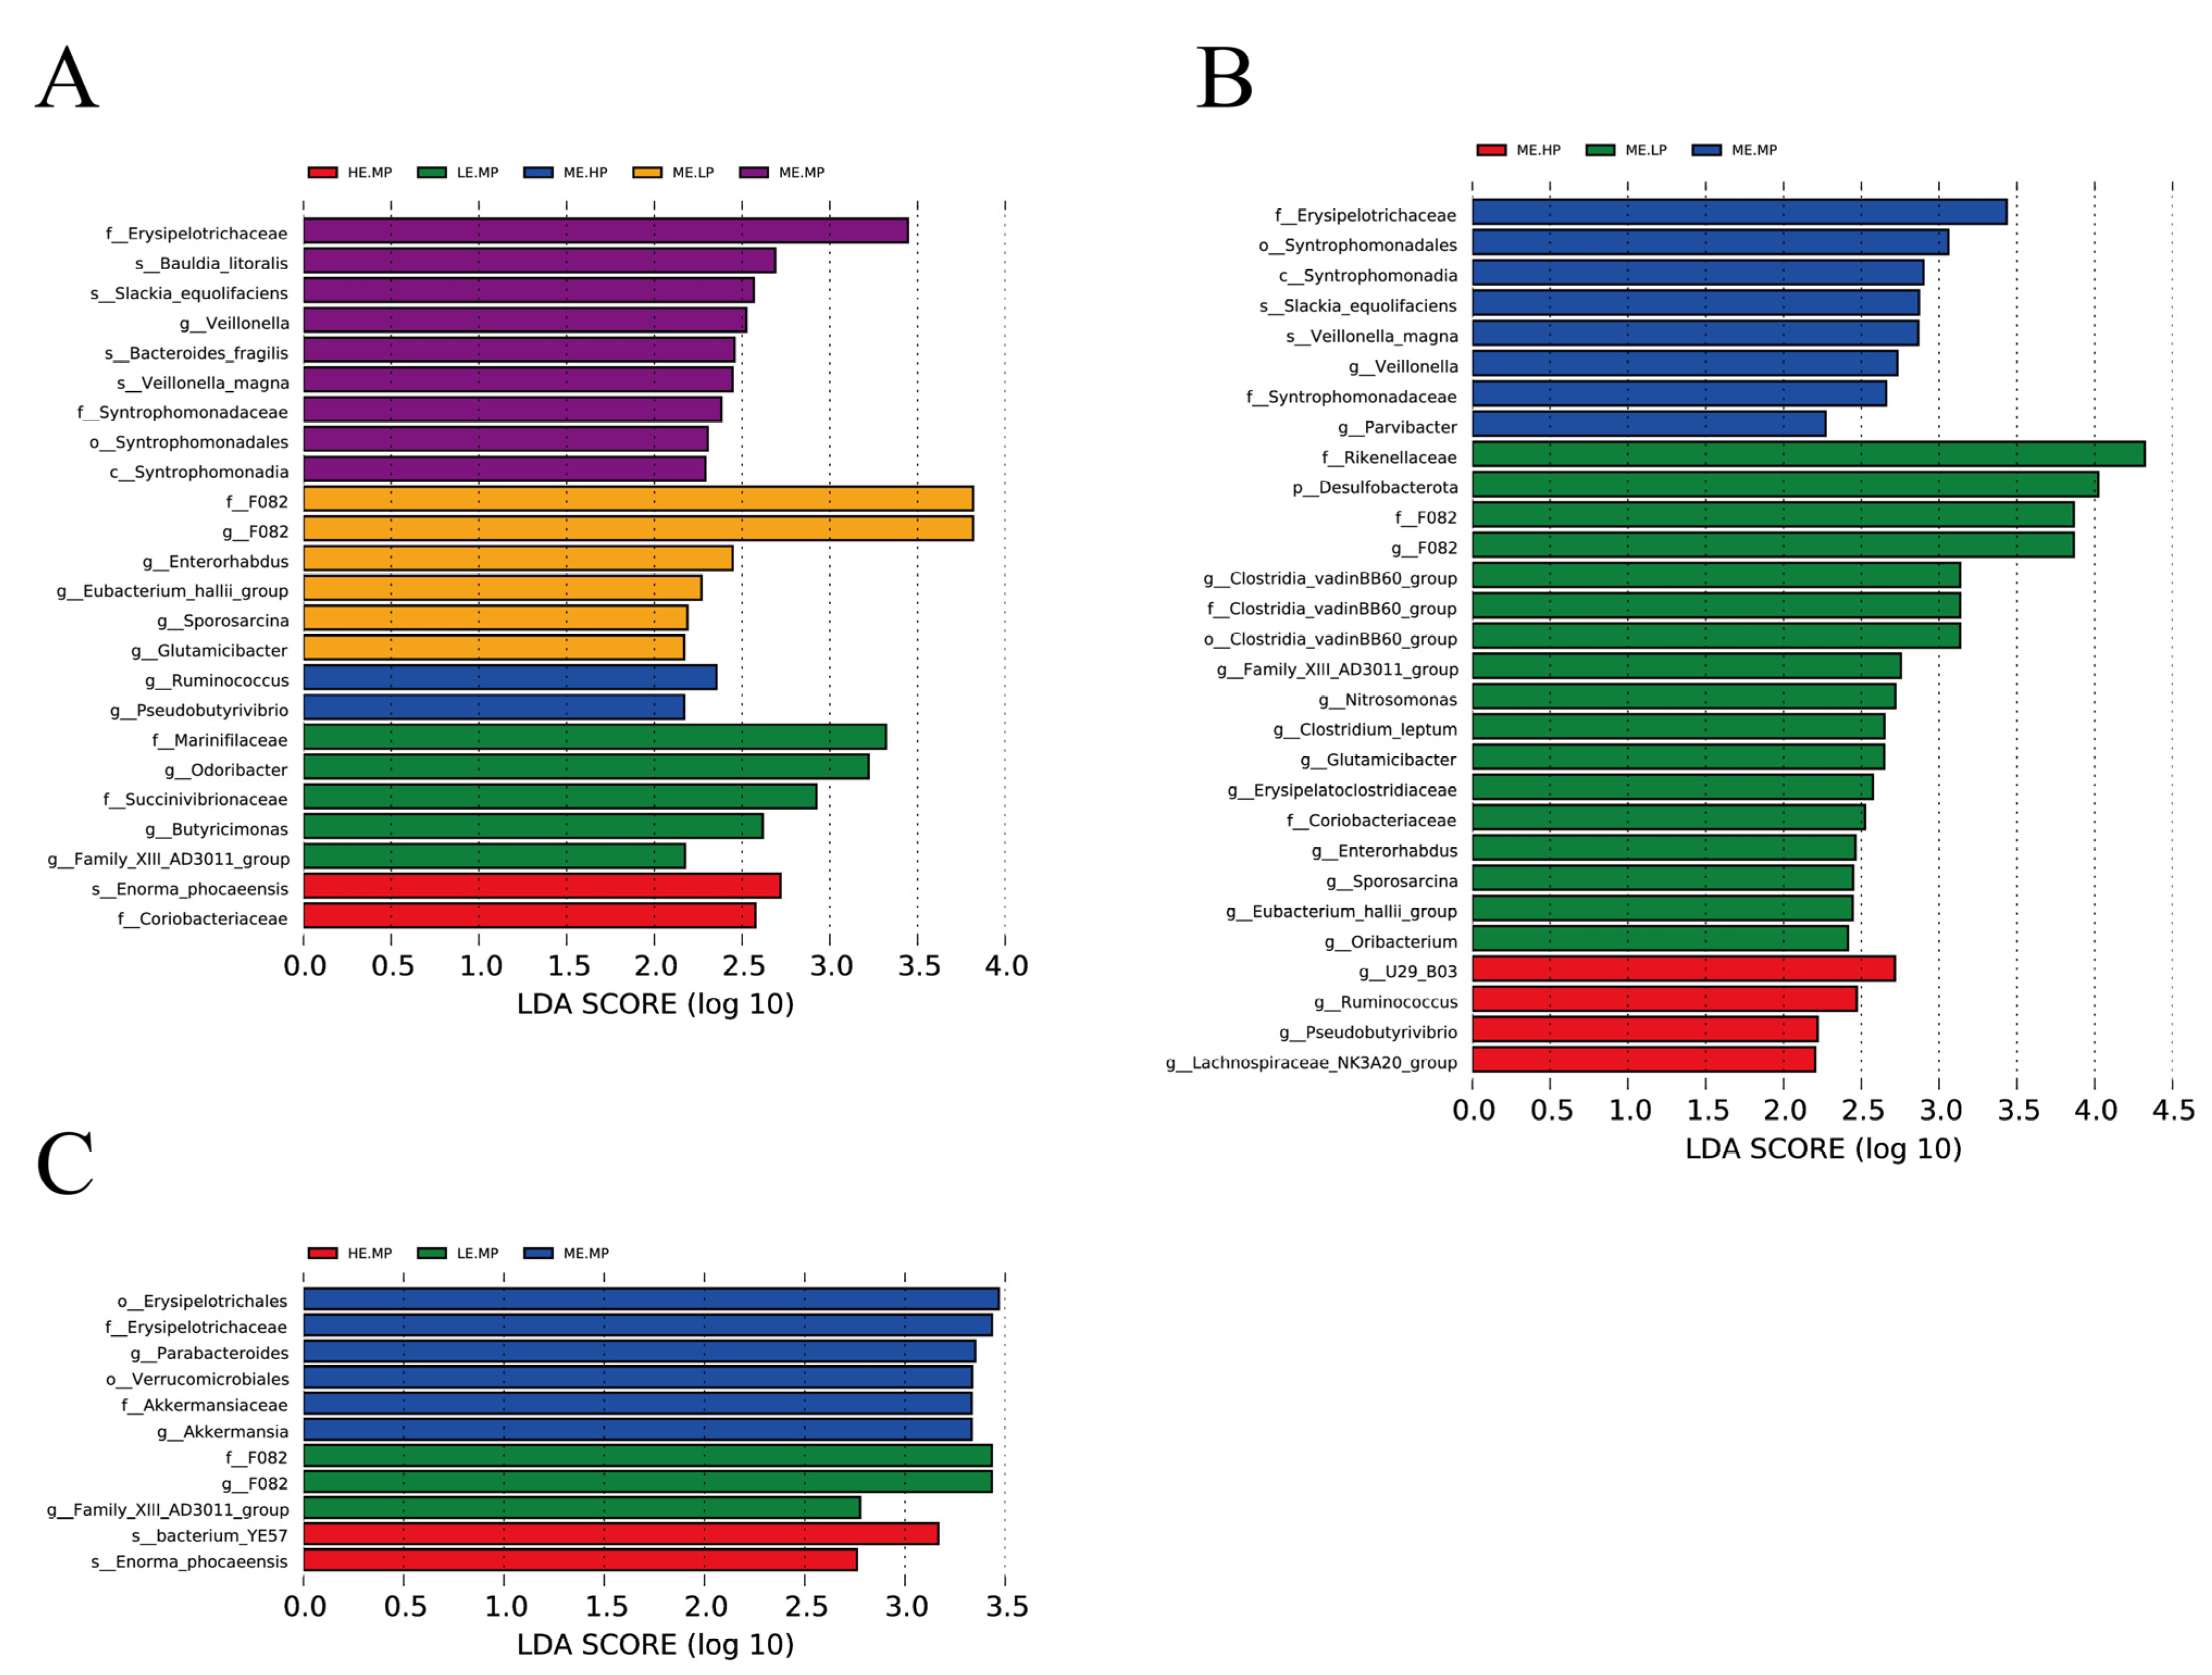

Table 1.
Composition and nutrient levels of the basal diet (air-dry basis).
| Items | LE | ME | HE | ||||||
| LP | MP | HP | LP | MP | HP | LP | MP | HP | |
| Ingredients, % | |||||||||
| Corn | 47.32 | 44.00 | 47.18 | 47.92 | 49.02 | 46.50 | 50.27 | 48.40 | 47.34 |
| Soybean meal | 6.98 | 11.85 | 18.10 | 7.90 | 13.56 | 18.78 | 8.03 | 12.22 | 16.10 |
| Wheat middling | 16.70 | 18.00 | 11.50 | 18.00 | 13.80 | 14.20 | 14.50 | 13.70 | 12.00 |
| Soybean oil | 1.00 | 1.00 | 1.00 | 2.00 | 2.00 | 2.00 | 3.40 | 3.40 | 3.40 |
| Wheat barn | 21.80 | 19.17 | 16.60 | 18.20 | 15.80 | 12.90 | 16.94 | 14.94 | 12.90 |
| Corn protein meal | 1.10 | 1.16 | 1.00 | 1.00 | 1.00 | 1.00 | 1.82 | 2.45 | 3.50 |
| Mountain flour | 1.72 | 1.72 | 1.66 | 1.64 | 1.60 | 1.58 | 1.60 | 1.58 | 1.54 |
| CaHPO4 | 1.30 | 1.26 | 1.29 | 1.38 | 1.40 | 1.38 | 1.45 | 1.44 | 1.45 |
| NaCl | 0.50 | 0.40 | 0.40 | 0.40 | 0.40 | 0.40 | 0.40 | 0.40 | 0.40 |
| Premix1 | 1.00 | 1.00 | 1.00 | 1.00 | 1.00 | 1.00 | 1.00 | 1.00 | 1.00 |
| Lys | 0.34 | 0.23 | 0.09 | 0.33 | 0.22 | 0.08 | 0.35 | 0.25 | 0.17 |
| L-Met | 0.24 | 0.21 | 0.18 | 0.23 | 0.20 | 0.18 | 0.24 | 0.22 | 0.20 |
| Total | 100.00 | 100.00 | 100.00 | 100.00 | 100.00 | 100.00 | 100.00 | 100.00 | 100.00 |
| Analysis results of nutrient level2 | |||||||||
| DM, % | 94.66 | 94.06 | 94.96 | 94.63 | 95.24 | 95.50 | 96.48 | 95.60 | 94.66 |
| Gross energy, MJ/kg |
11.27 | 11.20 | 11.20 | 11.70 | 11.70 | 11.70 | 12.12 | 12.13 | 12.13 |
| CP, % | 13.53 | 15.40 | 17.26 | 14.80 | 15.33 | 16.71 | 14.44 | 15.35 | 16.93 |
| Nutrient levels3 | |||||||||
| CP, % | 14.00 | 15.52 | 17.01 | 14.00 | 15.50 | 17.03 | 14.04 | 15.50 | 17.01 |
| ME, MJ/kg | 11.28 | 11.28 | 11.29 | 11.70 | 11.70 | 11.69 | 12.12 | 12.12 | 12.13 |
| Ca, % | 1.07 | 1.07 | 1.07 | 1.07 | 1.07 | 1.07 | 1.07 | 1.07 | 1.07 |
| P, % | 0.75 | 0.75 | 0.75 | 0.75 | 0.75 | 0.75 | 0.75 | 0.75 | 0.75 |
| AP, % | 0.35 | 0.35 | 0.37 | 0.37 | 0.39 | 0.39 | 0.39 | 0.39 | 0.40 |
| Ca/P | 1.42 | 1.44 | 1.44 | 1.42 | 1.43 | 1.43 | 1.43 | 1.43 | 1.43 |
| Lys, % | 0.84 | 0.84 | 0.84 | 0.84 | 0.85 | 0.84 | 0.84 | 0.84 | 0.84 |
| Met, % | 0.41 | 0.41 | 0.41 | 0.41 | 0.40 | 0.41 | 0.41 | 0.41 | 0.41 |
Abbreviations: Low protein (LP), medium protein (MP), high protein (HP), low energy (LE), medium energy (ME), high energy (HE). 1 The premix provided the following per kilogram of diet: VA 10,000 IU, VD3 3,125 IU, VE 2.5 mg, VK3 2.5 mg, VB1 2.5 mg, VB2 8.75 mg, VB6 3.75 mg, VB12 0.015 mg, D-biotin 0.18 mg, folic acid 0.75 mg, nicotinamide 37.5 mg, calcium pantothenate 12.5 mg, Fe 100 mg, Cu 8 mg, Mn 120 mg, I 1 mg, Se 0.3 mg. 2 Analyzed in triplicates. 3 The nutritional levels were calculated based on the measured values of feed ingredients, with partial data referenced from the China Feed Composition and Nutritional Value Table (26th Edition, 2015).
Table 2.
Effects of dietary ME and CP levels on growth performance of male Jingyuan chickens aged 7-18 weeks.
Table 2.
Effects of dietary ME and CP levels on growth performance of male Jingyuan chickens aged 7-18 weeks.
| ME, MJ/kg | CP, % | ADG/g | ADFI/g | F/G |
| 11.28 | 14.0 | 21.52d | 78.99ab | 3.67a |
| 15.5 | 21.26d | 78.68abc | 3.70a | |
| 17.0 | 21.52d | 76.93c | 3.58ab | |
| 11.70 | 14.0 | 21.66d | 78.54abc | 3.62ab |
| 15.5 | 24.02a | 77.66bc | 3.23d | |
| 17.0 | 22.67c | 77.00c | 3.40c | |
| 12.12 | 14.0 | 21.58d | 77.59bc | 3.60ab |
| 15.5 | 22.35c | 78.71abc | 3.52bc | |
| 17.0 | 23.34b | 79.83a | 3.42c | |
| SEM | 0.187 | 0.240 | 0.030 | |
| Main effect means | ||||
| ME | 11.28 | 21.43b | 78.20 | 3.65a |
| 11.70 | 22.78a | 77.73 | 3.42b | |
| 12.12 | 22.42a | 78.71 | 3.51b | |
| CP | 14.0 | 21.59b | 78.37 | 3.63a |
| 15.5 | 22.54a | 78.35 | 3.49b | |
| 17.0 | 22.51a | 77.92 | 3.47b | |
| P-value | ME | <0.001 | 0.139 | <0.001 |
| CP | <0.001 | 0.558 | <0.001 | |
| ME*CP | <0.001 | 0.011 | <0.001 | |
Abbreviations: Average daily gain (ADG), Average daily feed intake (ADFI), Feed to gain ratio (F/G). Values within the same column with no superscripts or identical superscripts indicate no significant difference (P > 0.05), while different uppercase superscripts indicate a significant difference (P < 0.05).
Table 3.
Effects of ME and CP levels on apparent nutrient metabolism of Jingyuan chickens aged 18 weeks.
Table 3.
Effects of ME and CP levels on apparent nutrient metabolism of Jingyuan chickens aged 18 weeks.
| ME, MJ/kg | CP, % | Dry matter % | Gross energy % | Crude protein % |
| 11.28 | 14.0 | 64.77 | 62.47 | 67.03ab |
| 15.5 | 64.50 | 63.04 | 67.29a | |
| 17.0 | 64.15 | 65.60 | 64.63c | |
| 11.70 | 14.0 | 64.25 | 65.37 | 65.85abc |
| 15.5 | 65.01 | 67.21 | 66.51ab | |
| 17.0 | 64.42 | 67.08 | 65.56bc | |
| 12.12 | 14.0 | 64.38 | 67.23 | 62.70d |
| 15.5 | 63.95 | 66.33 | 64.67c | |
| 17.0 | 64.19 | 66.66 | 64.32c | |
| SEM | 0.089 | 0.382 | 0.309 | |
| Main effect means | ||||
| ME | 11.28 | 64.47 | 63.70b | 66.32a |
| 11.70 | 64.56 | 66.55a | 65.97a | |
| 12.12 | 64.17 | 66.74a | 63.90b | |
| CP | 14.0 | 64.46 | 65.02 | 65.19b |
| 15.5 | 64.49 | 65.53 | 66.16a | |
| 17.0 | 64.25 | 66.45 | 64.84b | |
| P-value | ME | 0.135 | <0.001 | <0.001 |
| CP | 0.418 | 0.061 | 0.018 | |
| ME*CP | 0.100 | 0.071 | 0.021 | |
Values within the same column with no superscripts or identical superscripts indicate no significant difference (P > 0.05), while different uppercase superscripts indicate a significant difference (P < 0.05).
Table 4.
Effects of ME and CP levels on digestive organ index of Jingyuan chickens aged 18 weeks.
| ME, MJ/kg | CP, % | Proventriculus/g | Gizzard/g | Duodenum/cm | Jejunoileum/cm | Cecum/cm |
| 11.28 | 14.0 | 5.37 | 39.30ab | 22.20b | 107.75 | 36.00 |
| 15.5 | 5.33 | 36.85bc | 21.00b | 113.50 | 38.00 | |
| 17.0 | 5.20 | 33.39c | 23.20b | 114.20 | 39.00 | |
| 11.70 | 14.0 | 4.98 | 35.96bc | 22.23b | 97.50 | 32.60 |
| 15.5 | 5.91 | 38.35ab | 27.20a | 121.25 | 33.80 | |
| 17.0 | 5.52 | 34.34c | 21.50b | 112.40 | 35.40 | |
| 12.12 | 14.0 | 5.57 | 39.05ab | 22.20b | 108.20 | 36.20 |
| 15.5 | 6.02 | 39.64ab | 21.80b | 121.00 | 38.00 | |
| 17.0 | 6.53 | 40.96a | 26.25a | 119.20 | 42.75 | |
| SEM | 0.114 | 0.521 | 0.386 | 1.746 | 0.643 | |
| Main effect means | ||||||
| ME | 11.28 | 5.30b | 36.54b | 22.21b | 112.00 | 37.54a |
| 11.70 | 5.38b | 36.07b | 23.80a | 110.54 | 33.93b | |
| 12.12 | 6.00a | 39.77a | 23.21ab | 115.79 | 38.77a | |
| CP | 14.0 | 5.30 | 38.10 | 22.21 | 104.48b | 34.93b |
| 15.5 | 5.75 | 38.28 | 23.50 | 118.58a | 36.60ab | |
| 17.0 | 5.75 | 36.23 | 23.62 | 115.27a | 38.77a | |
| P-value | ME | 0.011 | 0.002 | 0.039 | 0.283 | <0.001 |
| CP | 0.100 | 0.099 | 0.055 | 0.002 | 0.011 | |
| ME*CP | 0.223 | 0.034 | <0.001 | 0.471 | 0.699 | |
Values within the same column with no superscripts or identical superscripts indicate no significant difference (P > 0.05), while different uppercase superscripts indicate a significant difference (P < 0.05).
Table 5.
Effects of ME and CP levels on intestinal morphology of Jingyuan chickens aged 18 weeks.
| ME, MJ/kg | CP, % |
Crypt Depth, CD/μm |
Villus Height, VH/μm |
VH/CD |
Muscle Layer Thickness, MLT/μm |
| 11.28 | 14.0 | 128.19de | 702.44c | 5.33bc | 271.45ab |
| 15.5 | 131.10cd | 699.45c | 5.08cd | 276.10ab | |
| 17.0 | 135.15abc | 628.31d | 4.62de | 279.55a | |
| 11.70 | 14.0 | 132.51bcd | 744.55b | 4.98cd | 182.95d |
| 15.5 | 131.83bcd | 799.02a | 6.24a | 280.55a | |
| 17.0 | 130.32cd | 684.28c | 5.15bc | 246.30c | |
| 12.12 | 14.0 | 139.53a | 679.58c | 5.11bcd | 273.67ab |
| 15.5 | 123.68e | 629.25d | 4.39e | 247.85c | |
| 17.0 | 136.84ab | 753.82b | 5.60b | 256.47bc | |
| SEM | 0.626 | 4.854 | 0.063 | 3.050 | |
| Main effect means | |||||
| ME | 11.28 | 132.25 | 675.89b | 4.97b | 275.79a |
| 11.70 | 131.41 | 737.09a | 5.44a | 220.62c | |
| 12.12 | 134.05 | 688.12b | 5.12b | 261.28b | |
| CP | 14.0 | 134.58a | 703.63ab | 5.12 | 227.78b |
| 15.5 | 129.38b | 714.03a | 5.33 | 270.05a | |
| 17.0 | 133.65a | 681.29b | 5.10 | 259.74a | |
| P-value | ME | 0.359 | <0.001 | <0.001 | <0.001 |
| CP | <0.001 | 0.043 | 0.624 | <0.001 | |
| ME*CP | <0.001 | <0.001 | <0.001 | <0.001 | |
Values within the same column with no superscripts or identical superscripts indicate no significant difference (P > 0.05), while different uppercase superscripts indicate a significant difference (P < 0.05).
Disclaimer/Publisher’s Note: The statements, opinions and data contained in all publications are solely those of the individual author(s) and contributor(s) and not of MDPI and/or the editor(s). MDPI and/or the editor(s) disclaim responsibility for any injury to people or property resulting from any ideas, methods, instructions or products referred to in the content. |
© 2025 by the authors. Licensee MDPI, Basel, Switzerland. This article is an open access article distributed under the terms and conditions of the Creative Commons Attribution (CC BY) license (http://creativecommons.org/licenses/by/4.0/).
Copyright: This open access article is published under a Creative Commons CC BY 4.0 license, which permit the free download, distribution, and reuse, provided that the author and preprint are cited in any reuse.


