Submitted:
01 July 2025
Posted:
14 July 2025
You are already at the latest version
Abstract
For aquaculture systems, maximizing feed efficiency is a major challenge since it di-rectly affects growth rates and economic sustainability. Feed is one of the largest costs in aquaculture, and feed waste is a significant environmental issue that requires effec-tive management strategies. This paper suggests a novel approach for optimal fish feeding in pond aquaculture systems that integrates vision language models (VLMs), optical flow, and advanced image processing techniques to enhance feed management strategies. The system allows for the precise assessment of fish needs in connection to their feeding habits by integrating real-time data on biomass estimates and water quality conditions. By combining these data sources, the system makes informed deci-sions about when to activate automated feeders, optimizing feed distribution and cut-ting waste. A case study was conducted at a profit-driven tilapia farm where the sys-tem had been operational for over half a year. The results indicate significant im-provements in feed conversion ratios (FCR) and a 28% reduction in feed waste. Our study found that, under controlled conditions, an average of 135 kg of feed was saved daily, resulting in a cost savings of approximately $1,800 over the course of the study. The VLM-based fish feeding behavior recognition system proved effective in recog-nizing a range of feeding behaviors within a complex dataset in a series of tests con-ducted in a controlled pond aquaculture setting, with an F1-score of 0.87, accuracy of 92%, precision of 0.90, and recall of 0.85. Because it offers a scalable framework for enhancing aquaculture resource use and promoting sustainable practices, this study has significant implications. Our study demonstrates how combining language models and image processing could transform feeding practices, ultimately improving aqua-culture's environmental stewardship and profitability.
Keywords:
fish feeding behaviour
; pond aquaculture
; vision language models
; large language models
; optimization
; vision transformer
1. Introduction
Aquaculture is now a crucial part of the world’s food production, helping to meet the growing demand for protein. Aquaculture is expected to produce 111 million tons of aquatic animals by 2032, according to the Food and Agriculture Organization (FAO) [1]. Aquaculture, one of the agricultural industries with the fastest rate of growth, is under increasing pressure to maximize operational effectiveness while minimizing environmental effects. Feed management is a major issue in this industry since it directly impacts the health, growth, and welfare of fish and accounts for a sizable amount of operating expenses [2,3,4]. Conventional feeding methods, which frequently follow set schedules, can result in either overfeeding or underfeeding, endangering fish welfare and costing businesses money [5,6]. Pond aquaculture has benefits like natural ecosystems and reduced operating costs, but it also poses special difficulties in observing fish feeding behaviors and developing efficient feeding plans [7]. Ponds’ open design can result in fluctuations in fish interactions and environmental conditions, so it’s critical to create customized strategies for maximizing feeding habits in these ever-changing environments. Using image-based techniques for behavioral identification in pond aquaculture presents additional difficulties. Environmental elements that are inherent to the pond setting, such as debris, water clarity, and changing lighting conditions, have a significant impact on the quality of photos that capture fish feeding behavior. As shown in Figure 1, these factors frequently lead to problems like uneven illumination and low contrast, which can mask significant foreground features in the photos. This picture shows a school of tilapia feeding close to a pond’s surface. However, some parts of the picture are brightly lit while others are in shadow because of the uneven lighting conditions brought on by reflections from the water’s surface. It is challenging to identify individual fish and their feeding habits due to the low contrast between the fish and the water background. The inability to clearly see crucial characteristics, like the fish’s mouth movements and interactions with food particles, makes analysis and recognition more difficult.
Additionally, during the feature extraction process, convolutional neural networks (CNNs) may become easily distracted by surrounding background elements due to the relatively small size of individual fish in these images [8,9]. In the intricate and ever-changing world of pond aquaculture, this distraction makes it more difficult for conventional CNN models to precisely focus on fish behavior, which ultimately reduces classification accuracy.
Recent developments in deep learning algorithms and machine vision have demonstrated promise in identifying particular fish behaviors, such as feeding intensity. One noteworthy contribution is an automatic recognition system that integrates RGB images and optical flow data, showing how motion information integration improves fish behavior classification accuracy [4]. Furthermore, CNNs have been shown to be successful in categorizing feeding behavior from carefully selected datasets, greatly enhancing aquaculture feeding tactics [10]. Notwithstanding their advantages, CNN-based techniques frequently perform poorly in noisy environments, such as murky water or uneven lighting, and mainly concentrate on local spatial features [11]. Transformers, which capture complex dependencies and global contextual information, have become a competitive alternative [12]. For instance, in order to attain high recognition accuracy in feeding behavior analysis, recent studies have combined sophisticated models such as MobileViT-SENet and Swin Transformers with acoustic signals [13,14]. The CFFI-Vit, an improved vision transformer created by Liu et al. for the classification of fish feeding intensity, outperformed conventional CNNs in terms of accuracy and computational efficiency [15]. The classification frameworks do, however, have a significant flaw in that many studies use different classes, which makes comparisons and applicability more difficult.
Despite having sophisticated fish behavior classification capabilities, CNNs and ViTs can be computationally demanding and require large amounts of labeled data for efficient training. By using a contrastive learning framework that smoothly aligns images with their textual descriptions within a shared embedding space, foundation models such as CLIP have transformed the field [16]. Strong ze-ro-shot learning capabilities across a range of tasks are made possible by this creative method. By utilizing extensive noisy image-text datasets, ALIGN improved upon CLIP’s methodology and greatly increased the model’s capacity to generalize to new contexts [17]. By combining text and visual representations using unified transformer-based architectures, more recent developments like FLAVA and BLIP have expanded the possibilities of multimodal learning [18,19]. All of these advancements show how effective contrastive learning is at bridging the gap between textual and visual representations. Furthermore, a promising but little-studied approach is the incorporation of Vision Language Models (VLMs). VLMs employ self-attention mechanisms to capture contextual cues and complex dependencies in a variety of environments by integrating textual and visual information. This enables the robust classification of different feeding behaviors [18]. This dual-modal method maintains high accuracy while improving learning from fewer examples [20]. Furthermore, despite the popularity of image processing methods, VLMs’ ability to examine environmental information, feeding patterns, and fish growth patterns is still mainly unrealized [21,22]. Although their synergistic potential with real-time monitoring systems is not fully realized, VLMs can offer crucial insights to enhance aquaculture decision-making processes.
This study aims to address the important issues of feed efficiency and environmental sustainability by creating and assessing a novel fish feeding management system tailored for pond aquaculture. This study aims to integrate cutting-edge technologies like image processing, optical flow analysis, and Vision Language Models (VLMs) to analyze fish feeding behaviors in real-time, acknowledging that comprehensive feed is a significant cost in aquaculture and that feed waste poses environmental concerns. Our CLIP-based model leverages the synergy between text and picture data to obtain a more sophisticated understanding of fish feeding behaviors, in contrast to previous methods that rely primarily on visual cues. The system seeks to make intelligent, flexible decisions for turning on automated feeders by integrating information on biomass estimates, water quality conditions, and observed feeding behaviors. In the end, the study aims to show how well the suggested system works to improve feeding practices, cut down on feed waste, and enhance fish growth and health in pond aquaculture environments. This study aims to provide the aquaculture industry with useful insights and workable solutions by thoroughly evaluating and validating the system’s performance using data from a pond aquaculture farm, encouraging sustainable practices and financial viability.
The following are our primary contributions:
- The classification of fish feeding behavior using VLMs. Data-driven decision-making is improved by the real-time monitoring and analysis of fish feeding behaviors made possible by the integration of sophisticated sensors with a multimodal Vision Language Model (VLM) such as CLIP.
- Using LIME (Local Interpretable Model-agnostic Explanations) to identify feeding behaviors in fish
- To maximize feed efficiency, the system uses an adaptive feeding strategy that dynamically modifies feed amounts based on real-time assessments of biomass, water quality, and fish behavior.
- Attained 98.33% accuracy, demonstrating its ability to analyze fish feeding behavior using intricate data from an actual pond aquaculture farm.
- Reduced feed waste and increased feeding efficiency lead to more sustainable aquaculture practices, which ultimately improve fish health and economic viability.
- The system offers a comprehensive understanding of the aquaculture environment by combining visual data with sensor outputs, resulting in more accurate assessments of fish needs.
2. Case Study
A thorough case study was carried out at a commercial tilapia farm over a six-month period in order to assess our suggested strategy for pond aquaculture systems’ feed management optimization. In order to evaluate the effectiveness of a real-time monitoring system that combines cutting-edge image processing methods with Vision language models (VLMs) for accurate feed management, this case study was created.
2.1. System Setup
Each of the three main ponds in the setup has a separate water supply and drainage system to promote water exchange and preserve ideal water quality. The farm is outfitted with a number of sensors that continuously measure variables like pH, temperature, dissolved oxygen, and ammonia levels in order to monitor the quality of the water. A central monitoring system receives this real-time data, enabling farm operators to promptly make modifications to preserve the best conditions for fish growth.
Each pond has a small feeding station, as illustrated in Figure 2, where feed is dispensed by automated feeders according to preset schedules. The purpose of the feeding strategy is to examine various feeding schedules, including frequency and quantity, in order to ascertain how they affect fish growth and feed conversion rates. High-resolution cameras are positioned above each pond in addition to the feeding stations to record fish behavior during feeding periods. These cameras’ image processing features enable real-time fish activity monitoring, including feeding habits, size estimation, and biomass assessment.
2.2. Dataset
A demo pond aquaculture system described in Section 2.1 and publicly accessible images gathered from the internet were the two main sources from which the dataset for fish feeding behavior recognition was painstakingly assembled. The goal of this extensive dataset is to aid in the creation and assessment of machine learning models intended to precisely detect different fish feeding behaviors. The distribution diagram in Figure 3 illustrates how the dataset, which consists of 1,935 photos in total, is divided into four different feeding behavior classes. There are 400 photos of fish that exhibit little interest in food in the first category, Not Eating. These pictures frequently show fish close to the pond’s bottom or acting passively, which amply illustrates situations in which the fish are there but not feeding. 657 photos in the second category, Aggressive Feeding, show high-energy interactions between fish while they are feeding. Fish are shown in these images racing after food particles, demonstrating their competitive nature. This class offers strong examples of aggressive feeding behavior due to the variety of angles and lighting conditions. There are 522 photos in the third category, Moderate Feeding, that show fish eating steadily. These pictures provide insights into common feeding habits by showing fish peacefully approaching the feed, taking bites, and occasionally stopping to look around. Lastly, there are 356 photos of fish in the Hungry Fish category that show symptoms of hunger, like increased activity close to the surface and darting movements in search of food. A density plot of the images from each category in the fish feeding dataset is shown in Figure A1 in the Appendix A1. Images’ entropy values are represented on the x-axis; higher entropy values denote greater complexity. The probability density values are shown on the y-axis; higher values indicate that there are more images close to that entropy value. A certain degree of complexity and information richness are present in the images in this dataset, as can be seen from the distribution in the figure, which shows that the complexity of images from each category is primarily concentrated near high entropy values.
3. Materials and Methods
3.1. Data Collection and Pre-Processing
Accurately measuring fish biomass, keeping an eye on water quality, and identifying feeding patterns in aquaculture all depend on the data collection process.
a. Biomass Assessment: Detailed pictures of the fish in the tanks are taken using high-resolution cameras. The overall computation of total biomass is then made easier by applying image processing algorithms, as covered in Section 2.2, to detect individual fish and estimate their size and weight. Periodically, physical sampling is carried out to validate and calibrate the image processing system in order to guarantee accuracy in these evaluations.
b. Water Quality Monitoring:
By integrating sensors that provide real-time data on vital parameters like temperature, pH, dissolved oxygen, ammonia, and turbidity, continuous monitoring of water quality is made possible. In order to assess its influence on fish health and feeding behavior and make well-informed management decisions, this data is methodically recorded.
c. Feeding Behaviour Recognition:
Cameras are placed above the tanks in strategic locations to record the best possible footage of fish behavior during feeding sessions. The dynamics of fish movement and feeding habits are examined using optical flow techniques. Aggressive feeding, peaceful feeding, and scattering are among the behaviors that are categorized using a VLM. A labeled dataset of fish feeding behaviors is used to train the VLM, which enables it to identify and classify activities in real time and offer insightful information about fish behavior and feeding.dynamics.
We employ FlowNet2, a deep learning model specifically engineered to estimate optical flow between video frames with high accuracy, to generate optical flow data. By processing pairs of RGB video frames, which are standard color images that show the fish and their environment, FlowNet2 calculates the optical flow and visualizes the movement of each pixel in the image from one frame to the next. With regions of active swimming displaying clear patterns, like trails or vectors indicating their paths, the resulting optical flow images visually depict fish movement. We can better comprehend fish interactions and their feeding environments thanks to this visualization.
3.2. Image Enhancement
The image enhancement technique used in this work closely adheres to the methodology described by [23]. Three crucial steps make up this strategy, which aims to enhance image quality for more accurate analysis of fish feeding behaviors. The first step involves applying the Multi-Scale Retinex with Color Restoration (MSRCR) algorithm, which is detailed in [24], to preliminary processing of images. This method improves the overall visual quality of the photos by successfully reducing the effects of water surface reflections, which can mask visual details. MSRCR creates a strong basis for further improvements by restoring colors and preserving their natural appearance.
The Multidimensional Contrast Limited Adaptive Histogram Equalization method [25] is then used. This stage is essential for improving image contrast, especially in areas with low contrast at first. The mdc technique enhances the visibility of finer details by modifying local contrast levels, which facilitates the identification and analysis of particular features in the images.
Lastly, to further sharpen the images, we use Unsharp Masking (UM) technology [26]. This method improves clarity and detail by highlighting the edges of objects in the pictures. UM greatly improves the overall quality of the images by sharpening them, which makes them better suited for precise analysis and interpretation.
Together, these three steps UM for sharpening, mdc for contrast enhancement, and MSRCR for color restoration work together to form a thorough image enhancement workflow that greatly raises the dataset’s quality and eventually makes it easier to identify fish feeding behaviors.
3.3. Image Preprocessing for Machine Learning
In order to standardize images and get them ready for efficient analysis, the CLIP model requires preprocessing that includes a number of crucial steps. Applying a RandomResizedCrop in the first step resizes the images to 224 by 224 pixels. By exposing the model to various image segments, this adjustment improves the model’s capacity for generalization by standardizing image dimensions while adding randomness in cropping.
The images are then mirrored along the vertical axis using a RandomHorizontalFlip transformation. The model’s ability to identify fish feeding behaviors under various circumstances is enhanced by this augmentation technique, which adds variability to the training dataset without increasing the overall number of images.
After these augmentations, ToTensor is used to convert the images into tensors, which is required in order to make them compatible with PyTorch-based models such as CLIP. For the model to properly process the images, this conversion is necessary.
To standardize the images according to particular mean and standard deviation values, a normalization transformation is applied in the last step. This guarantees that the distribution of input data matches the CLIP model’s pre-training conditions. Normalization is essential because it steadily scales pixel values, which helps to stabilize the training process and speed up model convergence.
We also use the multi-step image enhancement strategy outlined in [23] in addition to these steps. This tactic uses methods like noise reduction and contrast enhancement to further enhance image quality before they are fed into the model.
3.4. Fish Feeding Management
The proposed method utilizes a Vision Language Model (VLM) and Optical flow to optimize feeding strategies in aquaculture by integrating key data streams: fish biomass, water quality conditions, and real-time recognition of feeding behaviour as shown in Figure 4. In this paper we concentrate on the Fish feeding behaviour classification and the gesamt Fish feeding management strategy. For the Biomass estimation we refer to [27,28].
A pre-trained VLM, in this case CLIP (Contrastive Language-Image Pre-training), is used in the structure of the Multi-Head Vision Language Model used in our study for biomass estimation and fish feeding behavior recognition. This is especially helpful because of its efficacy in image-text tasks. To process both visual data and textual task descriptions or labels, the model combines language encoders BERT [29] and image encoders based on Vision Transformers. Each modality’s unique embeddings are produced by the basic CLIP model based on its autonomous processing of visuals and textual descriptions.
Certain task-oriented heads are built into the model to address the twin goals of classifying feeding behavior and estimating fish biomass. The fish biomass estimation head includes a regression layer tailored to output a continuous estimate of biomass based on features extracted by the image encoder. However, the feeding behavior classification head is designed to consider both optical flow data and RGB images. To precisely identify various feeding behaviors, such as aggressive or non-feeding, this entails concatenating features from both modalities before putting them through a number of classification layers. Standard RGB images of fish and optical flow data from video sequences make up the model’s input, as shown in Figure 4. Understanding feeding behaviors can be greatly aided by the motion patterns captured by this optical flow. It is essential that the inputs are preprocessed and normalized to ensure consistency.
3.5. Method for Generating Optical Flow Data Using Flow-Net 2
By measuring the movement of fish across video frames, optical flow analysis can be used to understand the feeding dynamics of fish. By expressing this movement as vectors that express both direction and magnitude, optical flow is able to capture the motion of objects between two images. This method is well known for its ability to track and identify moving objects, which makes it appropriate for evaluating fish behavior during feeding events.
Sparse and dense optical flow are the two main methods for putting optical flow into practice, and they each have different ways of figuring out movement. Within an image, sparse optical flow concentrates on a small number of feature points. By tracking the movement of these selected points frame by frame, it estimates the flow using methods like the Lucas-Kanade algorithm [30]. With this method, the tracked points are represented graphically as movement lines. In early attempts to use sparse optical flow, particular features—like the fish’s black eye—were targeted for quantification. These attempts, however, were unsuccessful because it was difficult to reliably identify the feature in the pictures when there were other fish parts present. Dense optical flow, on the other hand, provides a comprehensive view of motion throughout the frame by calculating movement for each pixel in the image. The Horn-Schunck and Gunnar Farneback methods are frequently used to calculate dense optical flow [31]. When examining a school of fish, dense optical flow is especially useful because it captures the entire movement rather than just individual points, even though it uses more processing power than its sparse counterpart. To make feature extraction easier, the first step in data processing is to convert video frames to grayscale. Dense optical flow is vulnerable to noise from multiple sources because it examines every pixel. In order to minimize the impact of noise, the image is separated into smaller segments, such as 16 × 16 pixel regions, which enable the computation of the average flow within each segment. The first step in feature detection using the OpenCV library is to load the video using cv2.VideoCapture. The initial frames are captured using the read() method, which converts each one to grayscale. The flow between the first and second frames is calculated by cv2.calcOpticalFlowFarneback, which is used to carry out the dense optical flow processing. To create a comprehensive representation of movement, the resulting vector data are averaged within the divided regions. Histograms are made from the resulting flow data to categorize fish movements. The instantaneous movements seen between frames are summarized by these histograms; however, continuous movements over a predetermined number of frames are more informative for efficient classification. As a result, histograms describing vector magnitudes and angles are created for 31 consecutive frames. In order to provide feature values for machine learning algorithms that categorize different fish feeding behaviors, the data is categorized, noting the frequency of each movement type. Figure 5 displays examples of optical flow data for key frames produced by Flow Net 2. In this figure, we present a comparative analysis of the optical flow representations obtained from two different environments. The state of movement speed and direction is the primary indicator of fish behavior. The images in (a) and (b) were taken in a controlled laboratory setting, as detailed in the study by [32], recording fish feeding behaviors in an environment where factors like lighting and water clarity can be controlled. The optical flow data generated from these images clearly depicts the movement dynamics of the fish as they interact with food, displaying distinct and well-defined movement vectors (HSV colors). The controlled setting provides high visibility and distinct patterns, which facilitate the interpretation of the flow data and the analysis of the feeding behaviors.
On the other hand, photos taken in an actual pond aquaculture environment are shown in (c) and (d). The intricacies and difficulties that occur in natural environments—such as fluctuations in water turbidity, lighting, and background clutter—are reflected in these photos. These images’ optical flow data shows how fish movements can be affected by their interactions with the environment, including debris and aquatic plants. In contrast to the lab conditions, the resulting flow visuals might show less cla-rity, illustrating the dynamic interactions of fish in a more intricate ecological setting.
3.6. Fish Feeding Behaviour Assessment
Figure 6 and Figure 7 depict keyframes of fish feeding behaviors in complex environments and in lab settings, respectively. The keyframes in Figure 6 show fish feeding behaviors seen in a carefully regulated laboratory environment with carefully controlled lighting, water quality, and food availability. The fish’s movements and behaviors during feeding can be clearly recorded thanks to the laboratory’s spotless, transparent tanks and excellent visibility. Conversely, Figure 7 depicts feeding behaviors like aggressive, moderate, and hungry behavior. Behavior that is hungry Fish are seen actively swimming close to the surface, showing signs of agitation, and darting in the direction of the feeders in the keyframe (Figure 7b). The keyframe for “Moderate Feeding” (Figure 7c) shows fish eating steadily, stopping occasionally to take in their environment. They exhibit this behavior when they bite and then switch back to their neutral swimming position. Fish vying for food are captured in Aggressive Feeding frames, which show noticeable accelerations and sporadic leaps as they pursue food particles. The hostile interactions between individual fish make this clear. Figure 6 and Figure 7 taken together give a thorough picture of how fish feeding habits can differ greatly between regulated lab settings and more intricate, natural settings. These keyframes are important sources of information for comprehending the subtleties of fish behavior, which can help improve aquaculture management techniques and lead to more efficient feeding plans.
The basic CLIP model creates separate embeddings for text and images because it processes them independently. We made some adjustments to increase accuracy for our particular requirements. Our method makes use of the pre-trained components of CLIP: a Vision Transformer (ViT) for image processing and a Transformer model for text analysis. Because they extract rich features from both visual and textual data, these components are effective at capturing complex relationships between the two types of data.
Prior to classification, we incorporated a fusion layer into our model that merges the text and image embeddings. This layer uses the interactions between the text and visual inputs to help the model better identify subtle indicators of various fish feeding behaviors. A softmax classifier that generates probabilities for each of the four fish feeding behavior categories in our dataset is the result of merging the embeddings and passing them through multiple dense layers.
Identifying fish feeding behaviour can be considered as an image classification task where we have a dataset represented as , with belonging to the set , where denotes the total number of classes in the dataset . The primary objective of image classification is to accurately predict the category label associated with each given image. This is achieved by employing a visual encoder along with a parametric classifier, such as a softmax classifier . For an input image , the encoder converts into an embedding vector . Subsequently, the classifier computes the logits distribution across the categories in . When considering a specific image , the cross-entropy loss function is utilized to optimize against the true label and is defined as follows:
Prerequiste, therefore is Image-text dataset. Image-text alignment involves a dataset , which consists of images and their accompanying captions . The objective of this process is to minimize the distance between corresponding image-text pairs (referred to as positive pairs) while maximizing the distance between non-matching pairs (termed negative pairs) within the embedding space. This is achieved using a visual encoder for images and a textual encoder for captions. After passing through their respective feedforward neural networks and being L2 normalized, the embeddings and are generated. To adapt the cosine similarity between and , we typically employ the InfoNCE (Oord, et al., 2018) contrastive loss function, as expressed in Equation 2. Here, represents a similarity function such as dot product or cosine similarity, and the learnable temperature parameter is initially set to 0.07.
To solve the task of image classification based on image-text alignment, we frame image classification with a triplet dataset , where represents the corresponding text description. In traditional fish feeding behaviour classification, images are typically associated with straightforward category labels or indices . However, in this case, text descriptions serve as concept names indexed by , allowing us to structure as . As illustrated in Figure 8, this unification enhances the understanding of the relationship between images and text as given in Table 1 for example.
We incorporated detailed descriptions for each fish feeding behaviour and utilized a structured prompt template to enhance the fluency and relevance of these descriptions. As depicted in Figure 8, each class name is treated as a concept C for its respective category. The final text description for equations (4) and (5) is formulated using the following template:
This approach allows us to generate a final text description that is not only informative but also contextual.
We introduce a vision-language model inspired by the principles of CLIP, aimed at aligning the textual and visual representations of leaves within a shared embedding space. Similar to the original CLIP framework, our approach processes a batch of N image-text pairs denoted as , utilizing independent encoders for the visual components and the textual component .
To derive the semantic representations for each pair, the image is transformed into an embedding through the visual encoder , and the corresponding text is similarly processed by the textual encoder . Both encoders deliver output embeddings with a dimensionality of 512. The resulting embeddings are normalized for each image-text pair.
As expressed in Equation 3, we use one-hot label vectors for the target calculations, which are essential for computing the loss components, including both image-to-text and text-to-image losses as specified in Equations 4 and 5. For the i-th pair, the label is defined as , where equals one for the positive pair and zero for negative pairs. Consequently, the overall loss for the CLIP model can be expressed as:
where:
In these equations, signifies the cross-entropy operation applied to the respective loss functions.
3.7. Feed Adjustmentprotocol
Using the information gathered from image processing, an initial feeding regimen is established based on recommended feeding rates for tilapia. However, instead of adhering to a fixed schedule, feed quantities were dynamically adjusted in real-time based on observed fish behaviour and biomass density. The system calculated the ideal daily feed requirements by combining the behavioural data with historical growth patterns and environmental parameters as will be described in the followig section.
3.7.1. Method Overview
- 1.
-
Initial Setup:
- ○
- Let be the initial biomass of fish.
- ○
- Define the total feeding time and divide it into intervals of length .
- ○
- Set an initial feeding amount monitoring interval seconds.
- ○
-
Real-Time Monitoring:
- ○
- Monitor water quality parameters (e.g., dissolved oxygen DO, pH, temperature) and feeding behaviour states (S) using sensors and image analysis (Section 2):
- ○
-
Feeding Adjustment Logic:
- ○
- At each monitoring interval, evaluate the feeding behaviour state at time t:
- ○
- If =aggressive eating:
- ○
- Increase feeding amount F and frequency: , If =moderate:
- ○
- Maintain feeding amount and frequency: , If =pecking:
- ○
- Decrease feeding amount F and increase frequency:
- ○
- , If =not feeding:
- ○
- Pause feeding and await the next recognition.
- ○
- Early Stopping Adjustment:
- ○
- If feeding stops earlier than expected:
- ○
- Record current total feeding amount Ftotal and DO level: , Use this data for the next feeding adjustment.
- ○
- If the fish do not stop feeding early and the total feeding amount reaches :
- ○
- Stop Feeding:
3.7.2. Mathematical Model
Feeding Demand Calculation:
Define feeding demand based on biomass and behaviour: ,
where is a constant and adjusts feeding demand based on the state of feeding behaviour:
f(aggressive eating)=1.5
f(moderate)=1.0
f(pecking)=0.75
f(not feeding)=0.0
Feeding Amount Adjustment: Overall Feeding Strategy:
The total feeding amount can be computed over all intervals:
3.8. Model Performance Evaluation
3.8.1. Evaluating Model for Fish Feeding Behaviour Recognition
When evaluating the performance of a model that recognizes fish feeding behaviour intensity, it is essential to utilize various metrics to gain a comprehensive understanding of its effectiveness. These metrics include accuracy, recall, precision, and the F1-score, each serving a unique purpose in performance evaluation.
Accuracy measures the proportion of correctly classified instances out of the total instances. It is defined mathematically as:
Where TP (True Positives) are correctly identified instances of a particular feeding behaviour, TN (True Negatives) are correctly identified instances of non-target behaviours, FP(False Positives) are incorrectly identified instances of the target feeding behaviour, and FN (False Negatives) are instances of the target feeding behaviour that were missed.
Precision indicates the accuracy of the positive predictions made by the model. It is calculated as:
High precision means that when the model predicts a certain feeding behaviour, it is likely correct.
Recall (Sensitivity) measures the ability of the model to identify all relevant instances of a particular feeding behaviour. It is defined as:
High recall indicates that the model successfully captures a large proportion of actual instances of the feeding behaviour.
The F1-score is the harmonic mean of precision and recall, providing a balance between the two metrics. It is particularly useful when dealing with imbalanced datasets, where one class may have significantly more samples than another. The F1-score is calculated as:
A high F1-score indicates a good balance between precision and recall.
It is crucial to including recall, precision, and the F1-score alongside accuracy as performance metrics in the study because in our scenario we got certain feeding behaviour states (e.g., “aggressive feeding”) occuring much more frequently than others (e.g., “not feeding”), accuracy alone can be misleading. A model may achieve high accuracy by simply predicting the majority class while failing to identify the minority classes. Precision and recall allow us to evaluate the model’s performance based on the differing costs of false positives and false negatives. The cost of false positives and false negatives may differ significantly. For example, underfeeding fish due to false negatives can lead to poor growth, while overfeeding due to false positives can cause water quality issues. The F1-score provides a single metric that encapsulates both precision and recall, making it easier to compare models and understand their strengths and weaknesses in recognizing different feeding behaviours.
3.8.2. Evaluating Feed Optimization Strategy
To assess the effectiveness of our feed optimization strategy, we measured feed conversion ratios (FCR), growth rates, and overall feed wastage. The FCR was calculated by dividing the total feed consumed by the total weight gain of the fish over the study period. Additionally, feed wastage was monitored by measuring leftover feed at each feeding session, allowing for an assessment of feed efficiency.
3.9. Ablation Studies for the Fish Behaviour Recognition Model
To illustrate the effectiveness of components we introduced in the CLIP-based fish feeding behaviour recognition model, the following ablation studies were conducted. The baseline was the original CLIP architecture, which we chose as a comparison benchmark, taking advantage of its prior performance in zero-shot learning tasks. With this decision, we are able to evaluate directly how our changes affect the model’s performance in the particular situation of classifying fish feeding behaviour.
The basic CLIP model creates distinct embeddings for each modality based on its independent processing of textual descriptions and visuals. The next step in the classification process is to calculate the cosine similarity between a collection of text embeddings that represent each class label and the corresponding visual embeddings generated from the images of fish feeding behaviours.
In our ablation studies, we systematically modified the model by fine-tuning it on specialized fish feeding behaviour data, utilizing a Vision Transformer (ViT) as the visual encoder, and incorporating enhanced images to assess their individual and combined effects on performance metrics. Each modification was evaluated against the baseline model to quantify improvements in F1-score, precision, accuracy, and recall, providing insights into the contribution of each component to the overall model effectiveness. To assess the impact of enhanced data on recognition accuracy under challenging conditions, a model trained with the enhanced dataset and another model trained using the original dataset without enhancements were compared for their performance. Figure 9 illustrates the difference between the two types of datasets.
4. Experimental Setup
Our experiments utilize various libraries for the machine learning model for image categorization. We employ PyTorch, an open-source framework suitable for deep learning tasks, supporting both CPU and GPU computations. Additionally, we use Hugging Face’s Transformers, which provides pre-trained models for natural language processing and image recognition, including the CLIP model. The experimental setup features a GeForce RTX 3090 GPU with 24 GB memory, an Intel Xeon Gold 6146 CPU at 3.20 GHz, and Ubuntu 16.04.7 LTS. The software configuration includes Python 3.8.18 and PyTorch 1.10.1.
4.1. fish Feeding Behaviour Recognition Model Training
The fish feeding behaviour dataset, consisting of 1,935 (224x224) images categorized into four classes (Not Eating, Aggressive Feeding, Moderate Feeding, and Hungry Fish), is divided into three subsets: training, validation, and testing. 70% of the total dataset (approximately 1,354 images) is used for fine-tuning the CLIP model. This set includes a balanced distribution of images across all four feeding behaviour categories to ensure the model learns a comprehensive representation of each class. 15% of the dataset (approximately 290 images) is reserved for validation. The remaining 15% of the dataset (approximately 291 images) is used for testing the model after the training is complete. This set evaluates the final performance of the model on completely unseen data, providing an objective measure of its effectiveness in recognizing fish feeding behaviours.
Before training, the hyperparameter settings of the complete multi-head CLIP were set as illustrated in Table 2. The fine-tuning of the CLIP-based model involves using a pre-trained CLIP model that has been trained on a diverse dataset, providing a solid foundation for learning visual and textual representations. Data augmentation techniques are applied to the training images, such as random cropping, horizontal flipping, and color jittering as described previously in the methods section. This helps improve the model’s robustness by providing varied examples during training. The training process consists of 100 epochs, during which the model learns to associate images with their corresponding textual descriptions. The training process involves feeding the model pairs of images and text, calculating the loss using the InfoNCE loss function, and optimizing the model parameters through backpropagation. After each epoch, the model is evaluated on the on the validation set for early stopping monitoring the validation loss. During training, a batch size of 2 was used to maximise model performance. This was selected after preliminary tests, in which it was observed that the batch size highly impacted the performance of the model, with larger batch sizes lowering the model’s performance. Once the model has been fine-tuned and validated, it is evaluated on the testing set.
4.2. Fish Feeding Management Strategy
A controlled experiment was conducted to evaluate the impact of optimized feeding strategies on fish growth rates. The trial involved two groups: a control group that received standard feeding practices and an experimental group that used our strategy. Over the course of the trial 6 Months period, the final weights of the fish were measured, revealing significant differences between the two groups.
5. Results
5.1. Fish Feeding Behaviour Recognition
To evaluate the effectiveness of the VLM model for fish feeding behaviour, it was tested on the image dataset, achieving a recognition accuracy of 98.19%. The metrics, including accuracy, precision, recall, and F1-score, for the model across all categories are summarized in Table 3. The model shows high precision across all categories, with values ranging from 0.95 to 0.98. This suggests that when the model predicts a class, it is highly likely to be correct. The recall rate is also very high between 0.93 and 0.97, indicating solid performance in capturing true instances of each class. Notably, the “Hungry” class has the lowest recall (0.93), suggesting that there may be some challenges in identifying instances of this class. Furthermore, the F1-Score ranges from 0.94 to 0.975, with each class demonstrating excellent performance. The F1-Score is particularly strong for the “Aggressive Feeding” category (0.975), which reflects a good balance between precision and recall.
The overall accuracy of the model is 0.98 for all classes, indicating that the model correctly classifies 98% of all instances. This high accuracy reflects effective performance across the board. The average values of precision, recall, and F1-Score are all around 0.965, suggesting that the model maintains a consistent performance level across different classes.
Figure 10 shows the confusion matrix, based on a set of 1935 images. It reveals that the model performs well in identifying most classes, as indicated by the high true positive counts for each fish feeding behaviour category. For the class “not Feeding”, a few instances were misclassified as “Aggressive feeding” or “Moderate,” suggesting that some fish exhibiting minimal activity were incorrectly identified as actively feeding. For the class “Aggressive feeding”, the model occasionally misclassified some aggressive eating instances as “Moderate” or “Hungry.” This may indicate overlaps in behaviour where fish are aggressive but not consistently recognized as such.
For the class “Moderate”, misclassifications occurred with some instances being labeled as “Hungry” or “Aggressive feeding.” This highlights potential confusion between moderate feeding and pecking behaviours. Some pecking behaviours were misclassified as “Not Feeding,” indicating that subtle feeding actions might not have been detected effectively. The overall low misclassification rates suggest that the model is robust, but there are areas for improvement. Enhancing the detection of subtle behaviours and refining the classification criteria could reduce these misclassifications, leading to even better performance in practical applications.
Figure 11 illustrates specific examples of classification results after 100 training iterations, showing instances of correctly identified and misclassified images. The confusion in differentiating feeding intensities, especially for the “hungry fish” category, highlights the challenges of recognizing fish feeding behaviour in complex backgrounds.
Figure 11 illustrates the confusion that the model experiences between different feeding behaviour categories. Specifically, (c) and (g) highlight two significant misclassifications: in (c), the model confuses “Hungry” fish with those categorized as “Not Eating,” while in (g), “Moderate Feeding” is misclassified as “Hungry Fish.”
As in our previous work on tomato leaf disease detection (Karimanzira, 2025) we applied LIME (Local Interpretable Model-agnostic Explanations) to reveal the decision making process. The analysis of model behaviour using Explainable Artificial Intelligence (XAI) techniques, specifically the LIME (Local Interpretable Model-agnostic Explanations) framework, sheds light on the underlying reasons for these misclassifications. LIME helps identify which features in the images are most influential in the model’s decision-making process.
Figure 12 shows some results of LIME for the misclassifications. For the “Hungry” classification, LIME reveals that one of the primary features influencing the model’s decision is the presence of fish with open mouths. This feature is interpreted by the model as a strong indicator of hunger. However, it is important to note that an open mouth does not inherently signify that a fish is hungry. Fish often open their mouths for various reasons, including social interactions, breathing, or even environmental factors, such as water currents or the presence of other fish. Therefore, relying solely on this visual cue can lead to incorrect classifications.
The confusion between “Hungry” and “Not Eating” behaviours is particularly concerning, as it suggests that the model is not fully capturing the nuances of fish behaviour. This indicates a potential gap in the dataset or the need for more diverse examples that clarify the distinctions between these states. Similarly, the misclassification of “Moderate Feeding” as “Hungry Fish” further emphasizes the complexity of accurately recognizing feeding behaviours based on visual features alone.
This analysis underlines the importance of incorporating a broader range of behavioural cues and contextual information into the dataset. To improve the model’s accuracy, it may be beneficial to enhance the training data with more examples that clarify the differences between these behaviours, perhaps including varied contexts in which fish exhibit open mouths without being hungry. By addressing these limitations, the model can be fine-tuned to better distinguish between the intricate feeding behaviours of fish, ultimately leading to more reliable predictions in aquaculture settings.
5.2. Results of Fish Management Strategy
5.2.1. Daily Fish Growth Rates
The data in Table 4 illustrates a substantial difference in fish growth rates between the control and experimental groups. The average final weight for the experimental group (310 g) was significantly higher than that of the control group (250 g). This translates to an average daily gain of 1.5 g/day in the experimental group compared to 1.2 g/day in the control group, showing a growth rate improvement of approximately 25%. Such enhanced growth can be attributed to optimized feeding strategies that closely matched the actual needs of the fish, leading to better nutrient utilization and overall health.
5.2.2. Feed and Cost Savings
Table 5 highlights the economic benefits of the dynamic feeding approach. The experimental group saved a total of 1,100 kg of feed compared to the control group, resulting in a total feed cost of $4,350, as opposed to $6,000 for the control group. This equates to roughly a 27.5% reduction in feeding costs due to the real-time monitoring system. The total cost savings of $1,650 indicate that the implementation of advanced monitoring techniques not only conserves resources but also contributes to significant financial savings for aquaculture operations.
5.2.3. Feed Conversion Ration (FCR)
The feed conversion ratio (FCR), a critical metric in aquaculture, showed a dramatic improvement in the experimental group. The FCR for the control group was 4.0, indicating that 4 kg of feed was required to produce 1 kg of fish. Conversely, the experimental group achieved an FCR of 1.87, representing a 53% improvement. This optimization can be attributed to the dynamic adjustment of feeding based on real-time data, ensuring that fish received the optimal amount of feed based on their activity and growth stages (Table 6).
5.2.4. Environmental Effects
Environmental metrics also exhibited positive changes. The experimental group recorded average ammonia levels of 0.7 mg/L, a reduction of approximately 41.67% compared to the control group (1.2 mg/L). Lower ammonia levels are essential for maintaining fish health and reducing stress. Additionally, dissolved oxygen levels increased to an average of 6.5 mg/L, representing a 30% improvement. Improved water quality contributes to healthy fish growth conditions and further supports optimum feeding efficiency. Notably, algal growth was reduced from a score of 7 to 3, indicating better management of nutrient levels within the RAS, likely due to lower feed wastage (Table 7).
The summary Table 8 consolidates the improvements observed in various metrics. Collectively, the integration of the monitoring system resulted in significant advancements across all assessed parameters. The overall 25% increase in daily fish growth, along with 27.5% feed savings and cost savings, showcases the economic viability of the approach. The environmental enhancements, such as reduced ammonia and increased dissolved oxygen levels, reinforce the sustainability of the practices being utilized.
5.3. Results of the Ablation Studies
The results of the ablation tests are shown in the Table 9. It can be seen that each introduced component contributes positively to the model’s performance in recognizing fish feeding behaviour.
The fine-tuning of the model on specific fish feeding behaviour data resulted in notable improvements across all metrics, indicating that domain adaptation is beneficial. The implementation of ViT as the visual encoder yielded the most significant enhancements, particularly in accuracy and recall, suggesting that it effectively captures the complexities of the visual data. The use of enhanced images provided a substantial boost as well, highlighting the importance of high-quality input data in achieving better recognition performance.
Additionally, incorporating enhanced textual descriptions of fish feeding behaviour also contributed positively, albeit to a slightly lesser extent compared to other modifications. This suggests that while the text embeddings improve the model’s contextual understanding, the visual components play a more crucial role in accurately classifying behaviours.
Overall, the ablation studies confirm that each component is essential in enhancing the model’s ability to classify fish feeding behaviours accurately, with the combination of improved visual and textual inputs leading to the best performance outcomes.
6. Discussion
We found that combining textual descriptions with visual data significantly improved the classification performance of the CLIP-based model for identifying fish feeding behavior. The findings show that the modified CLIP mod-el, which correlates text and images, improves comprehension of fish feeding behaviors.
When compared to the baseline CLIP model, which processed textual and visual data separately, the model showed a significant improvement in accuracy and F1 scores. This enhancement highlights the benefits of integrating these two modalities since the textual descriptions offered crucial background information that made it easier to classify the photos more precisely. We improved the model’s ability to interpret visual cues and produce more accurate predictions by adding thorough descriptions of different feeding behaviors to the dataset.
The experiments showed that adding textual information significantly improves the model’s performance, indicating that adding descriptive data can improve the ability to recognize complex behaviors. This result supports our hypothesis that a more robust classification system can be achieved by bridging the gap between conventional image analysis and comprehensive textual insights. Furthermore, our model’s improved performance suggests that it may be useful in practical situations, such as enhancing aquaculture feeding tactics by offering insights into fish behavior. Accurately recognizing and categorizing feeding behaviors can help improve management techniques and support the general well-being and expansion of fish populations.
The observed decreases in feed waste and increases in feed conversion ratios (FCR) demonstrate how well our innovative monitoring system works to build a more sustainable and profitable aquaculture business.
Efficiency of Feed Conversion
The experimental group’s average FCR decreased from 1.8 in the control group to 1.3, highlighting the importance of real-time monitoring and dynamic feed adjustment based on fish biomass and behavior. Fish were fed more precisely in accordance with their actual needs rather than depending on preset static schedules, as evidenced by the roughly 28% increase in feed efficiency. This is consistent with earlier studies that indicate more individualized feeding strategies can result from knowledge of fish biomass and behavioral patterns [34]. Our system’s ability to enable a dynamic feeding schedule made it possible to make timely adjustments based on real-time data. This adaptability is essential in RAS settings where fish growth rates, feeding habits, and water quality can all change drastically. In addition to producing healthier fish, this adaptability helps aquaculture become more sustainable by reducing the environmental impact of feed waste, a problem that has become increasingly prevalent in the sector [35].
Additionally, the study showed a significant decrease in feed waste, with an average monthly feed savings of 135 kg, which translated into a cost savings of about $1,800 over the course of the six-month period. For commercial aquaculture operations, where feed costs frequently account for the majority of operating expenses, this is especially important. Farmers can increase their profit margin and encourage responsible resource management at the same time by reducing feed waste. Furthermore, the overall sustainability of aquaculture operations may be significantly impacted by these cost savings. Optimizing the use of feed, one of the biggest inputs in fish farming, can also lessen the strain on the fishmeal and fish oil industries, helping to conserve marine resources [2]. The flexibility and scalability of our suggested strategy could also be improved by applying this strategy to other fish species and aquaculture markets.
Our feed management system benefited greatly from the addition of LLMs, which offered data-driven, contextually relevant insights and predictions. An important development in aquaculture management is the LLM’s capacity to process intricate datasets, combine data from environmental metrics, and make adjustments in real time. It allows the system to plan for future events based on past growth and feeding patterns in addition to responding to current conditions. This combinatorial method improves on conventional aquaculture techniques and points to a paradigm shift in feeding management toward data-driven approaches. There is potential for creating predictive models at the nascent nexus of artificial intelligence and aquaculture, which could transform farmers’ approaches to feeding schedules by displacing subjective assessments with data-driven decision-making.
Although the study’s findings are encouraging, it should be noted that it has a number of limitations. Since the case study was limited to a single species (Nile tilapia) and was carried out in a controlled setting, it is crucial to confirm these results in a variety of settings and species. In order to evaluate this monitoring system’s wider applicability, future studies should investigate how adaptable it is to different RAS configurations and fish species. Furthermore, because the technology depends on image processing, it needs stable environmental conditions and high-quality camera setups, which could be difficult in some commercial settings. Such technology’s accessibility and affordability will also be crucial to its broad adoption. To further explore the precise relationships between fish behavior and environmental factors outside of controlled settings, more research is also required. Gaining insight into these relationships can aid in improving prediction models, which will ultimately result in even more efficient feeding procedures.
7. Conclusions
In this work, we proposed a thorough approach to fish feeding management that incorporates a number of important variables, including fish behavior, biomass estimates, and water quality, into the process of choosing the ideal amount of feed. A sophisticated Visual Language model, which enables a nuanced understanding of the interactions within the aquaculture environment, was used to estimate biomass and recognize fish behavior. Furthermore, we improved the identification of fish feeding behaviors by integrating optical flow data produced by Flow-Net 2, which offers a more precise and dynamic evaluation of fish activity.
Our study’s findings show that the efficiency and sustainability of feeding practices in recirculating aquaculture systems are greatly increased by the real-time monitoring system that was put in place. Notably, we saw notable increases in feed conversion efficiency, overall cost savings, and fish growth rates. Additionally, the beneficial effects on environmental parameters highlight how advanced technologies, when properly integrated, have the potential to make aquaculture operations more profitable and sustainable. These results make a strong case for the aquaculture industry to implement real-time monitoring systems, which not only increase profitability but also encourage resource conservation. These developments address global issues of food security and environmental stewardship and make a significant contribution to sustainable food production methods.
Notwithstanding the encouraging outcomes, it is important to recognize the limitations of this study. The dependence on particular sensor technologies and data processing algorithms, which might not be generally applicable in all aquaculture settings, is one significant drawback. Furthermore, different fish species and their distinct behavioral patterns may affect the model’s performance, requiring additional validation across a range of species and environments. Implementing real-time monitoring systems can be difficult due to their complexity, especially when it comes to integrating them with the aquaculture infrastructure that already exists and the training that staff members need to properly operate these sophisticated systems.
In order to improve and build upon this work, future research should concentrate on a few important areas. In order to confirm the scalability and adaptability of the suggested methodologies, we first suggest carrying out comprehensive field trials across a larger range of fish species and aquaculture systems. This will assist in assessing the model’s resilience in various settings and guide any modifications required for best results. Furthermore, investigating how artificial intelligence and machine learning techniques can be integrated could improve the process of recognizing fish behavior and allow for more accurate feeding adjustments based on real-time data. Furthermore, it will be essential to look into how using this fish feeding management technique will affect the sustainability of aquaculture as a whole and the health of the ecosystem over the long run. This may involve evaluating the long-term effects on fish welfare, nutrient cycling, and water quality. The objective of sustainable aquaculture practices will ultimately be advanced by working with industry stakeholders to create user-friendly interfaces and educational materials that will enable the wider adoption of these technologies. We can help create aquaculture systems that are more effective, efficient, and ecologically conscious by tackling these constraints and following these future paths.
Author Contributions
D.K. is the sole author of this work, responsible for all aspects of the research, analysis, and manuscript preparation.
Funding
This research received no external funding
Institutional Review Board Statement
This study involving fish in aquaculture was reviewed and approved by the Institutional Review Board (IRB) at Fraunhofer Institute of Optronics, System technique and image Exploitation to ensure compliance with ethical standards and regulations. All procedures involving live animals were conducted in accordance with relevant guidelines to minimize distress and ensure humane treatment.
Informed Consent Statement
Not applicable.
Data Availability Statement
The data used in the experiments can be obtained from the corresponding author upon request.
Acknowledgments
I would like to thank the reviewers for their helpful criticism and perceptive remarks. Their in-depth evaluations have greatly raised the manuscript’s caliber and made the results more understandable. We value the time and energy they invested in reviewing our work. I appreciate your important contributions.
Conflicts of Interest
The authors declare no conflicts of interest.
Abbreviations
The following abbreviations are used in this manuscript:
| VLM | Vision Language Model |
| LLM | Large Language Model |
| ViT | Vision Transformer |
| LIME | Local Interpretable Model-agnostic Explanations |
| UM | Unsharp Masking |
| MSRCR | Multi-Scale Retinex with Color Restoration (MSRCR) |
| MDC | Multidimensional Contrast Limited Adaptive Histogram Equalization |
Appendix A
Appendix A.1
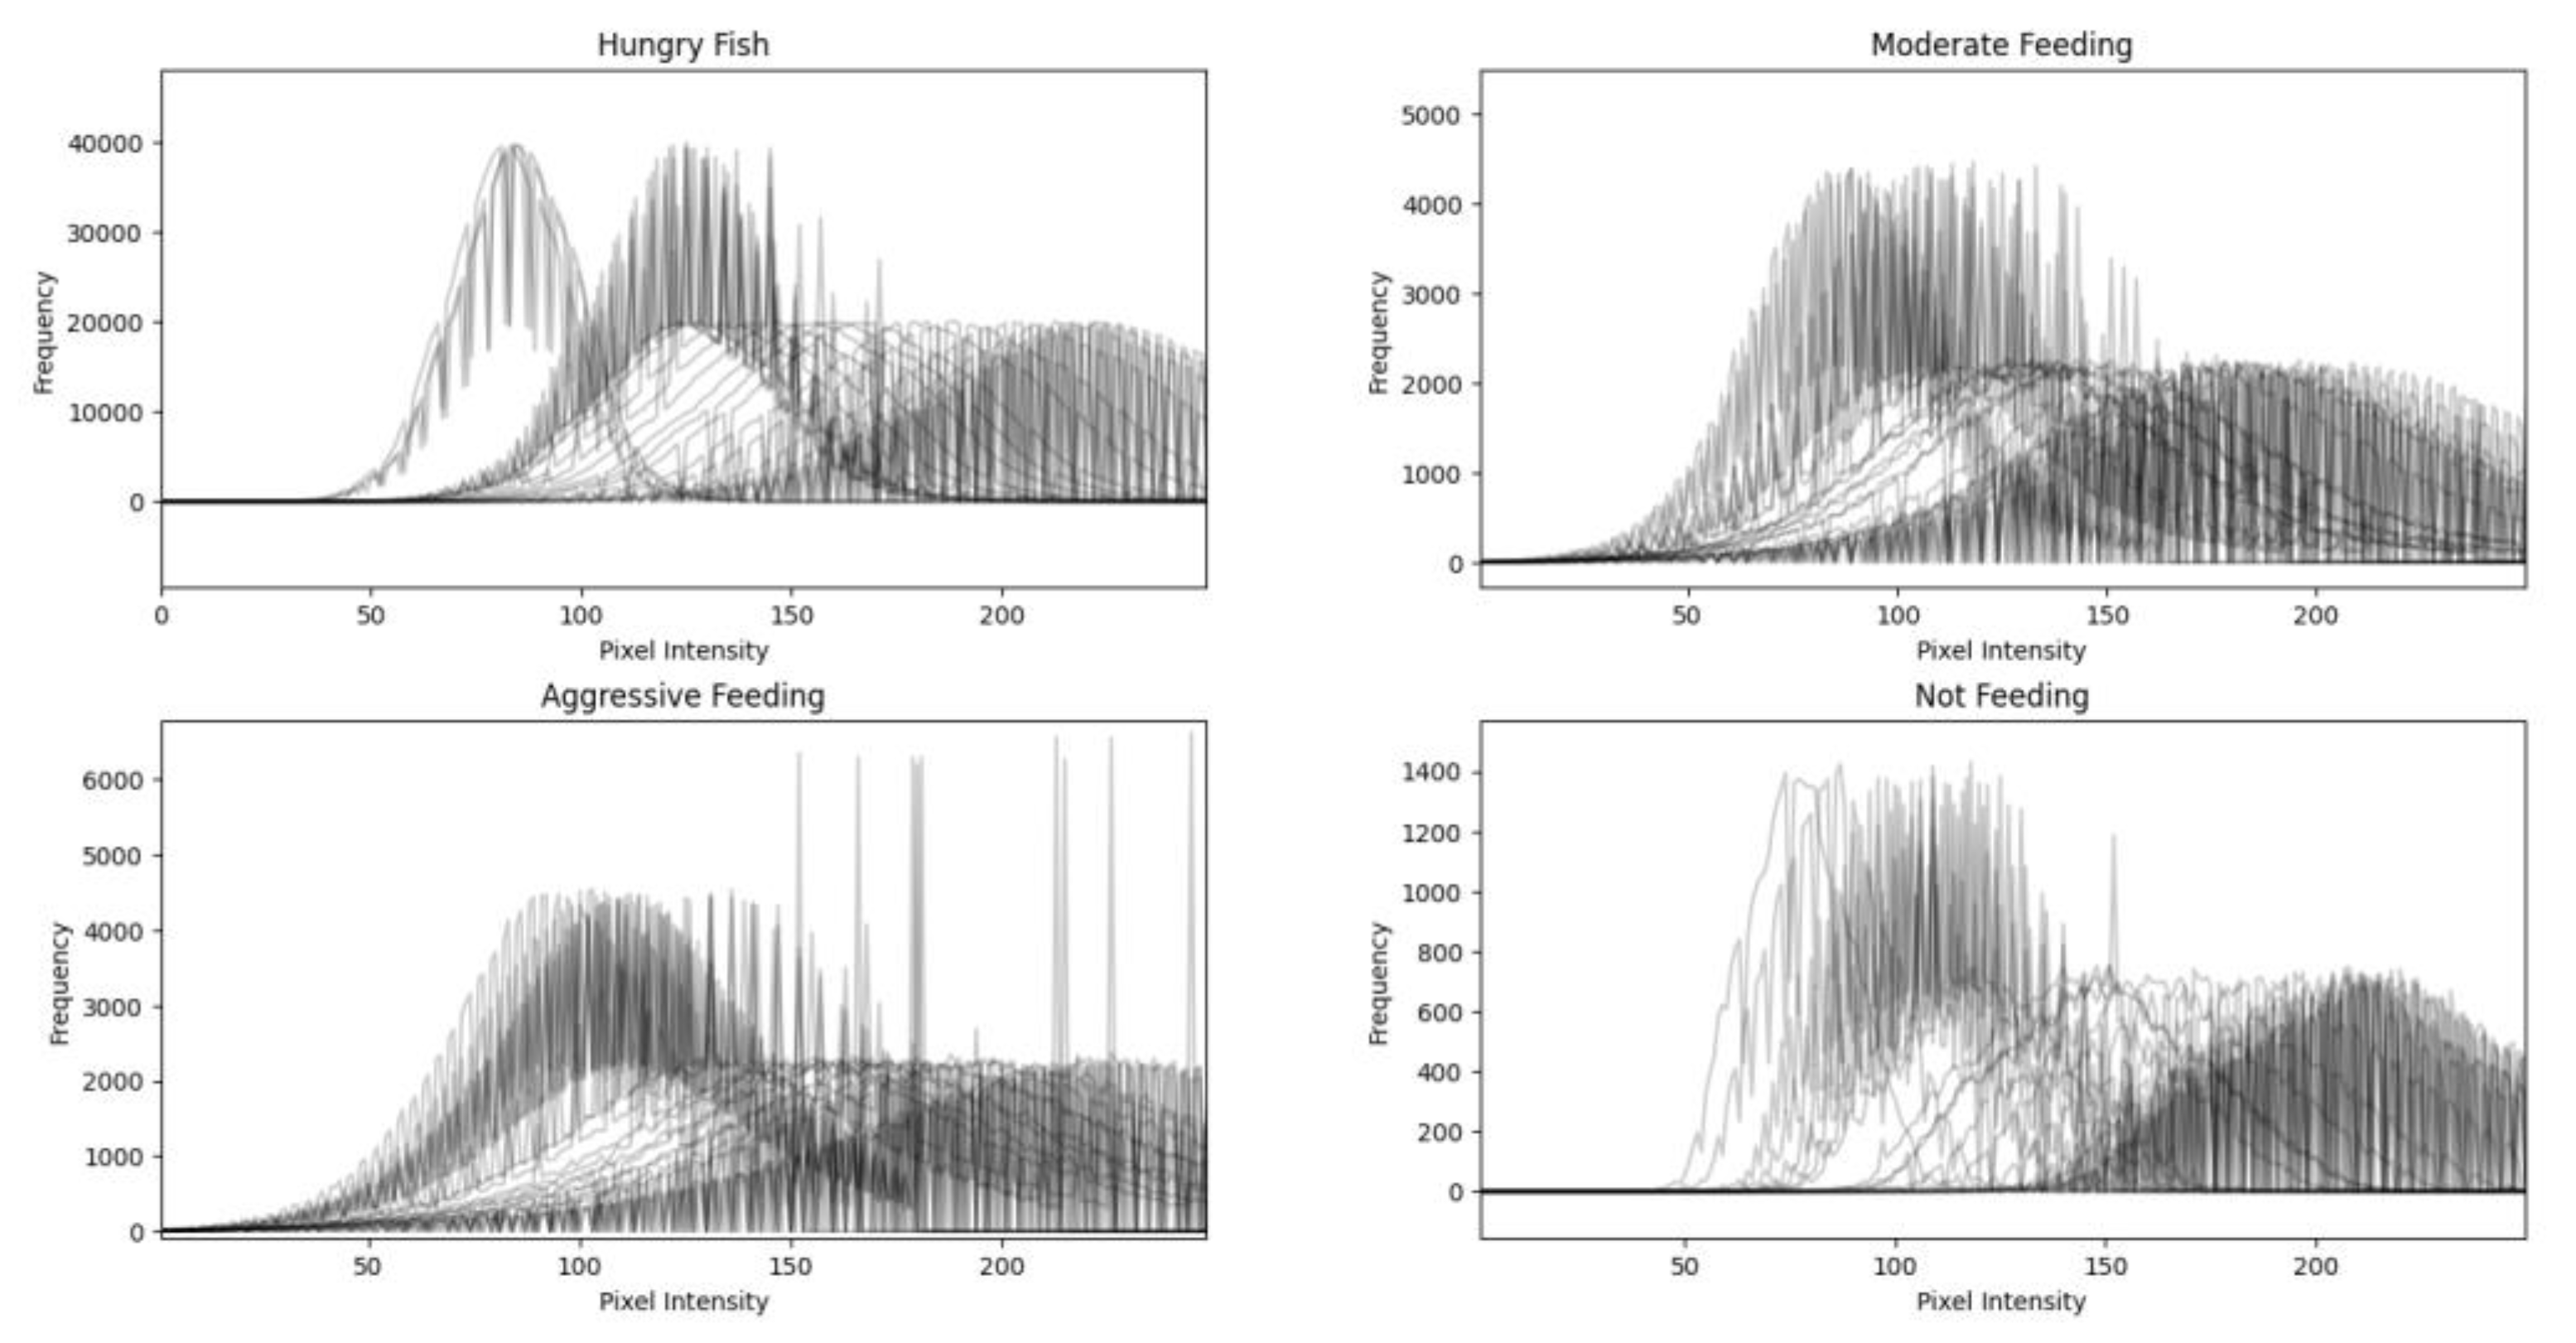
Figure A1 displays the resulting histogram plots for the four classes of fish feeding behavior: hungry fish, moderate feeding, aggressive feeding, and not feeding. The pixel intensity distributions obtained from various images per class are visually represented by the plots. These histograms’ features provide crucial information about the classes’ separability. A class may be easier to classify using machine learning techniques if it exhibits a distinct distribution with little overlap with other classes. Classifiers would probably do well in distinguishing between “aggressive feeding” and “not feeding,” for example, if their histograms differ significantly. On the other hand, a high degree of histogram overlap can suggest classification difficulties. For instance, machine learning models might have trouble correctly classifying images into “hungry fish” and “moderate feeding” classes if the pixel intensity distributions for the two categories are similar. This overlap shows that in order to distinguish between such closely related behaviors, more sophisticated features or models are required.
The significance of feature extraction in the classification process is emphasized by the analysis. Pixel intensity alone might not be enough, particularly when classes show overlapping distributions. Incorporating additional features, such as texture, shape, or contextual information, may enhance the model’s ability to distinguish between different behaviors. Additionally, the outcomes guide the choice of machine learning models. Models that work with high-dimensional data or use sophisticated methods, such as Vision Language models, might be better suited for this classification task given the intricacies shown by the histograms. Lastly, the histograms’ variability highlights the need for a diverse training dataset that encompasses the entire spectrum of potential behaviors within each class. Model robustness and generalization can be greatly enhanced by a well-rounded dataset, which will ultimately result in improved classification performance.
Figure A1.
Histograms depicting the pixel intensity distributions of various fish feeding behaviors: hungry fish, moderate feeding, aggressive feeding, and not feeding. Each subplot illustrates the variability per class, highlighting the potential challenges and separability in classification tasks.
References
- Food and Agriculture Organization (FAO). (2024). The State of World Fisheries and Aquaculture 2024. Food and Agriculture Organization. Available online: https://www.fao.org/fishery/sofia/en.
- Tacon, A. G. J. , & Metian, M. (2013). Feed matters: satisfying the feed demand of aquaculture. Aquaculture, 412-413, 10-13.
- An, D. , Chen, X., Zhang, H., Zhai, H., & Wang, Z. (2021). Application of computer vision in fish intelligent feeding system: A review. Aquaculture Research, 52(9), 12345-12362.
- G. Wang, L. G. Wang, L. Hu, W. Long and L. Jiang, Evolution of Intelligent Feeding System for Aquaculture: A Review,2021 3rd International Conference on Artificial Intelligence and Advanced Manufacture (AIAM), Manchester, United Kingdom, 2021, pp. [CrossRef]
- Adegboye, M. A., Ayo, J. S., Ogunyemi, A. O., & Murtala, L. E. (2020). Incorporating intelligence in fish feeding systems for dispensing feed based on fish feeding intensity. IEEE Access, 8, 94311-94320.
- Johnson, R. E., Chow, T. W., & Wang, C. (2020). Probabilistic models of larval zebrafish behaviour reveal structure on many scales. Current Biology, 30(9), 1796-1804.
- Baker, B. D. , Martinez, C., & Rodriguez, C. (2021). Evaluating feeding strategies in tilapia aquaculture: A study in economic and sustainable practices. Aquaculture, 546, 737267.
- Zhang, L.; Wang, J.; Li, B.; Liu, Y.; Zhang, H.; Duan, Q. A MobileNetV2-SENet-Based Method for Identifying Fish School Feeding Behaviour. Aquac. Eng. 2022, 99, 102288. [Google Scholar] [CrossRef]
- Yang, P.; Liu, Q.Y.; Li, Z. A High-Precision Classification Method for Fish Feeding Behaviour Analysis Based on Improved RepVGG. Preprints 2023, 2023091041. [Google Scholar]
- Naomi Ubina, Shyi-Chyi Cheng, Chin-Chun Chang, Hung-Yuan Chen, (2021) Evaluating fish feeding intensity in aquaculture with convolutional neural networks, Aquacultural Engineering, Volume 94, 2021, 102178, ISSN 0144-8609. [CrossRef]
- Zhou, Chao & Xu, Daming & Chen, Lan & Song, Zhang & Sun, Chuanheng & Yang, Xinting & Wang, Yanbo. (2019). Evaluation of fish feeding intensity in aquaculture using a convolutional neural network and machine vision. Aquaculture. 507. 10.1016/j.aquaculture.2019.04.056.
- Dosovitskiy, A. , Beyer, L., Kolesnikov, A., Weissenborn, D., & Schiele, B. (2020). An image is worth 16x16 words: Transformers for image recognition at scale. Proceedings of the IEEE/CVF International Conference on Computer Vision (ICCV), 2020, 1-10. [CrossRef]
- Zhang, Y., Li, J., & Wang, H. (2024). Advanced deep learning models for feeding behavior analysis using acoustic signals. Journal of Machine Learning Research, 25(1), 1-15. 1). [CrossRef]
- Zeng, Q. , Liu, J., & Xu, H. (2023). Employing Swin Transformers with Acoustic Signals for Real-Time Monitoring of Fish Feeding Behavior. Transactions of the American Fisheries Society, 152(1), 45-57. [CrossRef]
- Liu, J. , Becerra, A. T., Bienvenido-Barcena, J. F., Yang, X., Zhao, Z., & Zhou, C. (2024). CFFI-Vit: Enhanced Vision Transformer for the Accurate Classification of Fish Feeding Intensity in Aquaculture. Journal of Marine Science and Engineering, 12(7), 1132. [CrossRef]
- Radford, J. W. Kim, C. Hallacy, A. Ramesh, G. Goh, S. Agarwal, G. Sastry, A. Askell, P. Mishkin, J. Clark, G. Krueger, and I. Sutskever, “Learning transferable visual models from natural language supervision,” 2021. [Online]. Available online: https://arxiv.org/abs/2103.00020.
- Jia, Y. Yang, Y. Xia, Y.-T. Chen, Z. Parekh, H. Pham, Q. V. Le, Y. Sung, Z. Li, and T. Duerig, “Scaling up visual and vision-language representation learning with noisy text supervision,” 2021. [Online]. Available online: https://arxiv.org/abs/2102.05918.
- Singh, R. Hu, V. Goswami, G. Couairon, W. Galuba, M. Rohrbach, and D. Kiela, “Flava: A foundational language and vision alignment model,” in 2022 IEEE/CVF Conference on Computer Vision and Pattern Recognition (CVPR). IEEE, Jun. 2022, p. 15617–15629. [Online]. [CrossRef]
- J. Li, D. J. Li, D. Li, C. Xiong, and S. Hoi, “BLIP: Bootstrapping languageimage pre-training for unified vision-language understanding and generation,” in Proceedings of the 39th International Conference on Machine Learning, ser. Proceedings of Machine Learning Research, K. Chaudhuri, S. Jegelka, L. Song, C. Szepesvari, G. Niu, and S. Sabato, Eds., vol. 162. PMLR, 17–23 Jul 2022, pp. 12 888–12 900.[Online]. Available: https://proceedings.mlr.press/v162/li22n.
- Brown, T. B. , Mann, B., Ryder, N., Subbiah, M., Kaplan, J., Dhariwal, P., … & Amodei, D. (2020). Language models are few-shot learners. Advances in Neural Information Processing Systems, 33, 1877-1901.
- Chen, P. , Liu, J., Sun, C., & Wu, X. (2023). The role of artificial intelligence in optimizing aquaculture practices: A systematic review. Aquaculture Reports, 26, 101-110.
- Eddy Ilg, Nikolaus Mayer, Tonmoy Saikia, Margret Keuper, Alexey Dosovitskiy, Thomas Brox, (2017) “FlowNet 2.0: Evolution of Optical Flow Estimation with Deep Networks,” in 2017 IEEE Conference on Computer Vision and Pattern Recognition (CVPR), Honolulu, HI, USA, 2017, pp. 1647-1655. [CrossRef]
- Feng, G. , Kan, X., & Chen, M. (2024). A Multi-Step Image Pre-Enhancement Strategy for a Fish Feeding Behaviour Analysis Using Efficientnet. Applied Sciences, 14(12), 5099. [CrossRef]
- S. Parthasarathy and P. Sankaran, “An automated multi Scale Retinex with Color Restoration for image enhancement,” 2012 National Conference on Communications (NCC), Kharagpur, India, 2012, pp. 1-5. [CrossRef]
- V. Stimper, S. Bauer, R. Ernstorfer, B. Schölkopf and R. P. Xian, “Multidimensional Contrast Limited Adaptive Histogram Equalization,” in IEEE Access, vol. 7, pp. 165437-165447, 2019. [CrossRef]
- Song Y, Li C, Xiao S, Xiao H, Guo B. Unsharp masking image enhancement the parallel algorithm based on cross-platform. Sci Rep. 2022 Nov 23;12(1):20175. [CrossRef] [PubMed]
- Zhang, Tianye & Yang, Yuqiao & Liu, Yueyue & Liu, Chenglei & Zhao, Ran & Li, Daoliang & Shi, Chen. (2023). Fully automatic system for fish biomass estimation based on deep neural network. Ecological Informatics. 79. 102399. 10.1016/j.ecoinf.2023.102399.
- Al-Abri, Said & Keshvari, Sanaz & Al Rashdi, Khalfan & Al-Hmouz, Rami & Bourdoucen, Hadj. (2025). Computer vision based approaches for fish monitoring systems: a comprehensive study. Artificial Intelligence Review. 58. 10.1007/s10462-025-11180-3.
- Devlin, J. , Chang, M. W., Lee, K., & Toutanova, K. (2019). BERT: Pre-training of deep bidirectional transformers for language understanding. Proceedings of the 2019 Conference of the North American Chapter of the Association for Computational Linguistics: Human Language Technologies (NAACL-HLT), 4171-4186. [CrossRef]
- Baker, S. , Matthews I. Lucas-Kanade 20 years on: A unifying framework. Int. J. Comput. Vis. 2004;56:221–255. [CrossRef]
- Kazuki FUKAE, Tetsuo IMAI, Kenichi ARAI, Toru KOBAYASHI, Fish School Behaviour Classification for Optimal Feeding Using Dense Optical Flow, IEICE Transactions on Information and Systems, 2023, Volume E106.D, Issue 9, Pages 1472-1479, Released on J-STAGE September 01, 2023, Online ISSN 1745-1361, Print ISSN 0916-8532. [CrossRef]
- Cui, M., Liu, X., Zhao, J., Sun, J., Lian, G., Chen, T., Plumbley, M. D., Li, D., & Wang, W. (2022). Fish feeding intensity assessment in aquaculture: A new audio dataset AFFIA3K and a deep learning algorithm. In Proceedings of the 2022 IEEE 32nd International Workshop on Machine Learning for Signal Processing (MLSP), Xi’an, China, 22–25 August 2022.
- Av. d. Oord, Y. Li, and O. Vinyals, “Representation learning with contrastive predictive coding,” 2018. [Online].
- Kumar, R., Singh, A., & Patel, S. (2023). Understanding fish biomass and behavioral patterns for aquaculture optimization. Journal of Aquatic Sciences, 12(3), 150-165. [CrossRef]
- Goldáraz-Salamero, N. , Blanc, S., Sierra-Perez, J. et al. From food loss and waste to feed: a systematic review of life cycle perspectives in livestock systems. Int J Life Cycle Assess (2025). [CrossRef]
Figure 1.
Challenges in Image-Based Fish Feeding Behaviour Recognition. (a) Example of high water turbidity, which obscures visibility and complicates the detection of fish feeding activities. (b) Illustration of uneven illumination caused by water reflections, resulting in low contrast and making it difficult to distinguish fish and their behaviours against the background.
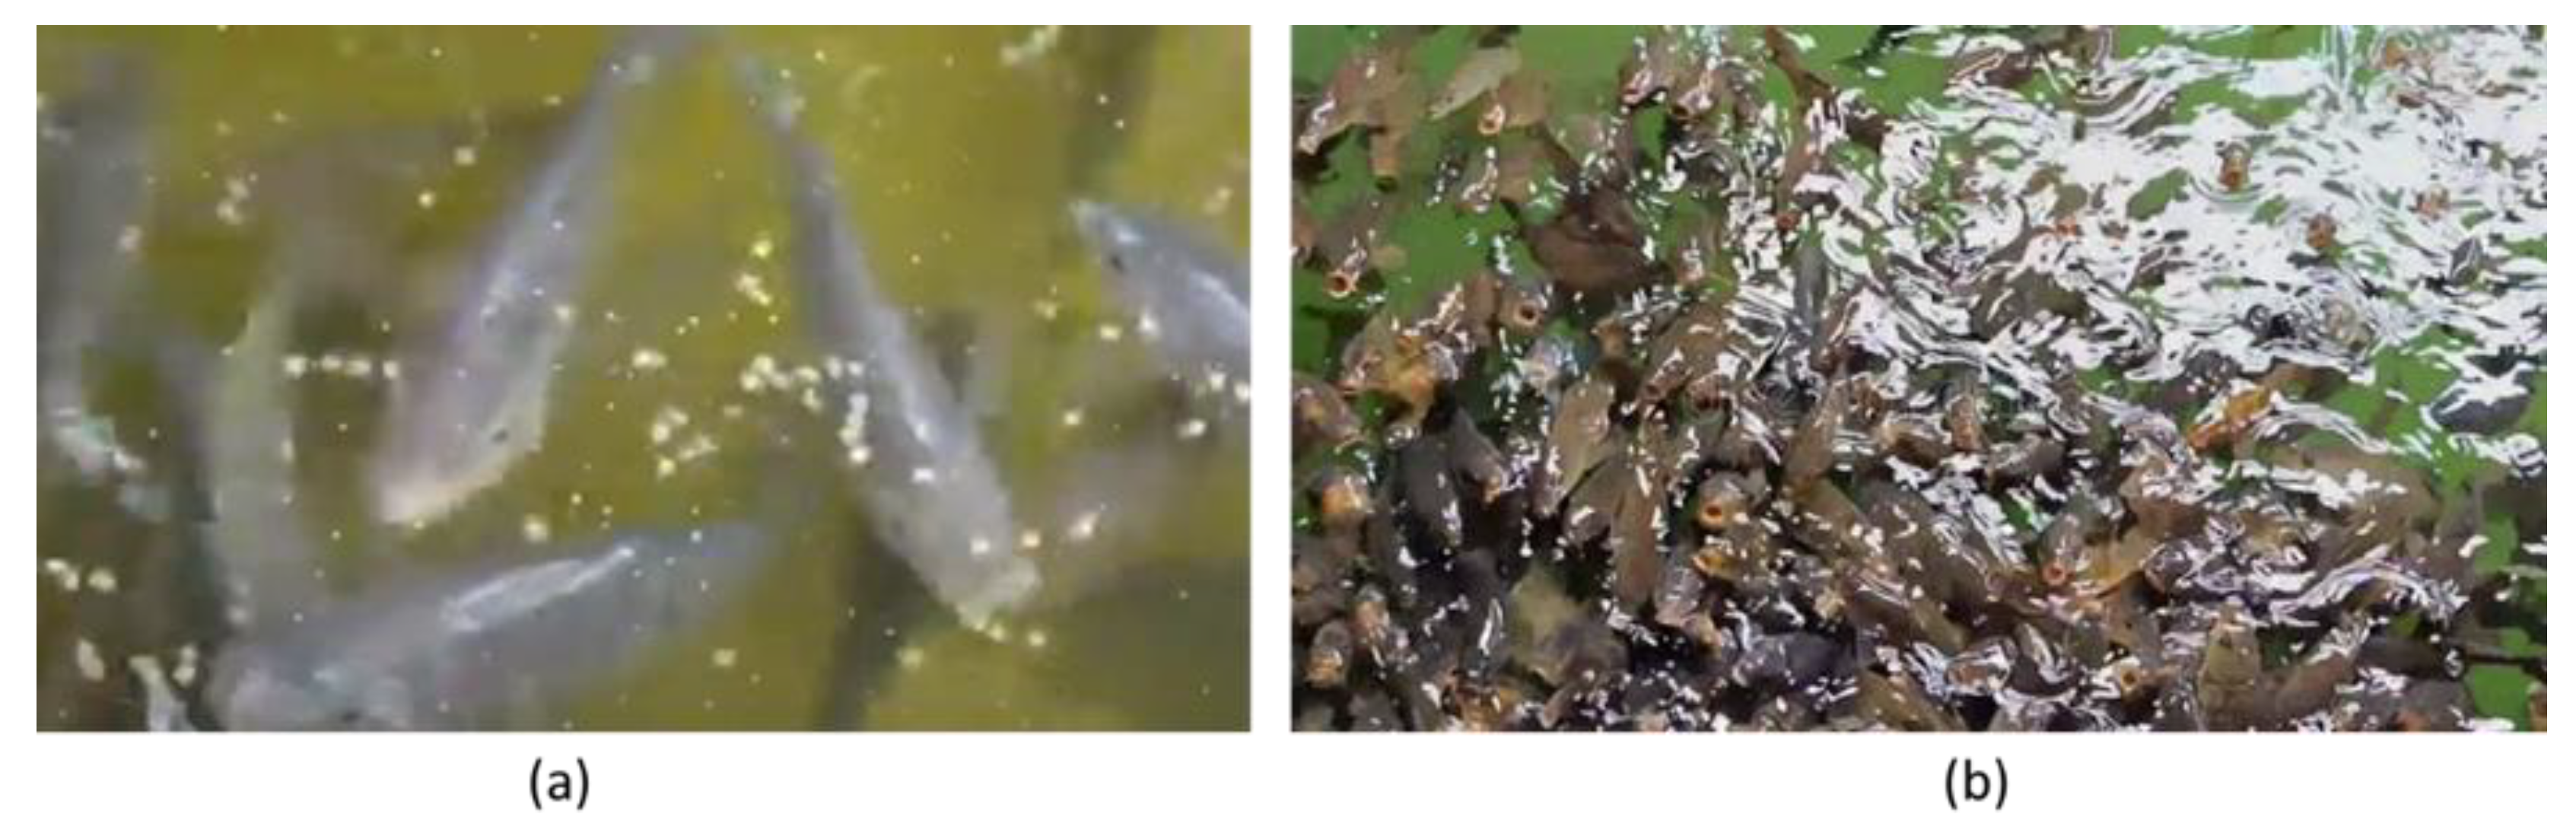
Figure 2.
Experimental Pond Aquaculture Setup. (a) Overview of the concrete ponds designed for efficient fish rearing, featuring optimal water circulation and management. (b) Installation of the automated fish feeder and (c) high-resolution camera system, which are utilized for real-time monitoring of fish feeding behaviours and environmental conditions.
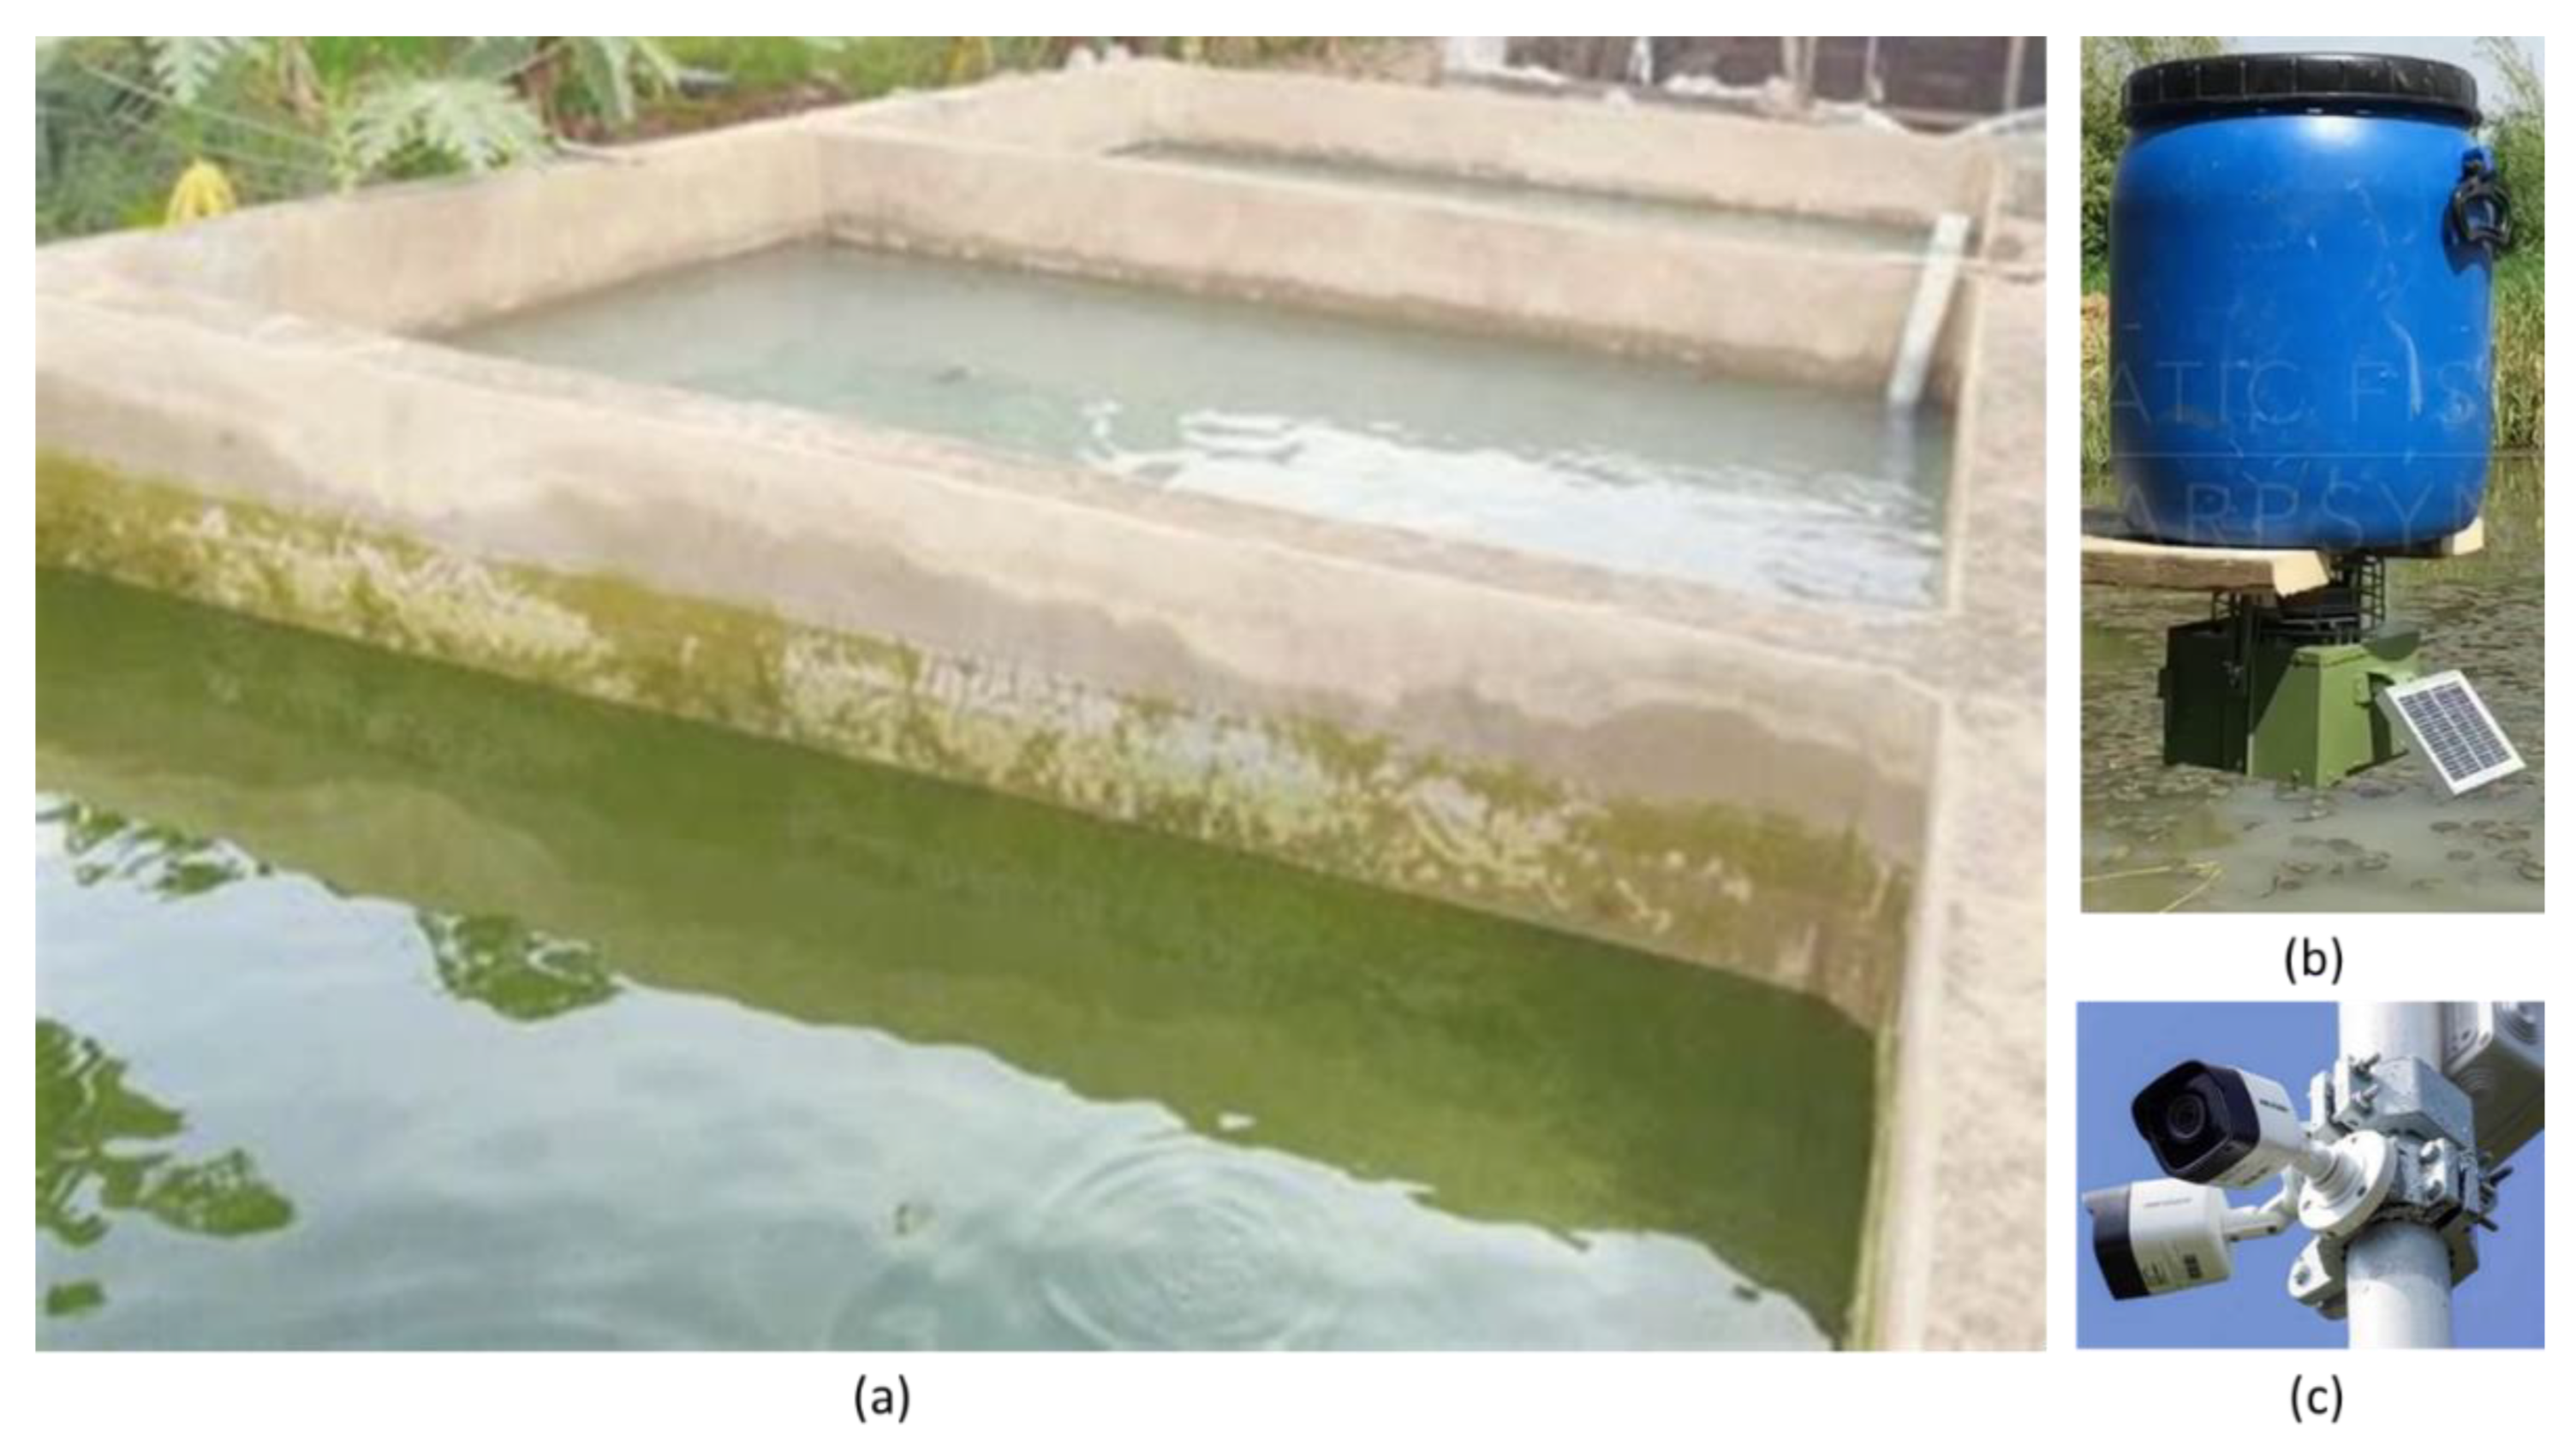
Figure 3.
Example images from the dataset showing different classes (a) fish not eating, (b) hungry fish, (c) moderate feeding, and (d) aggressive feeding..
Figure 3.
Example images from the dataset showing different classes (a) fish not eating, (b) hungry fish, (c) moderate feeding, and (d) aggressive feeding..
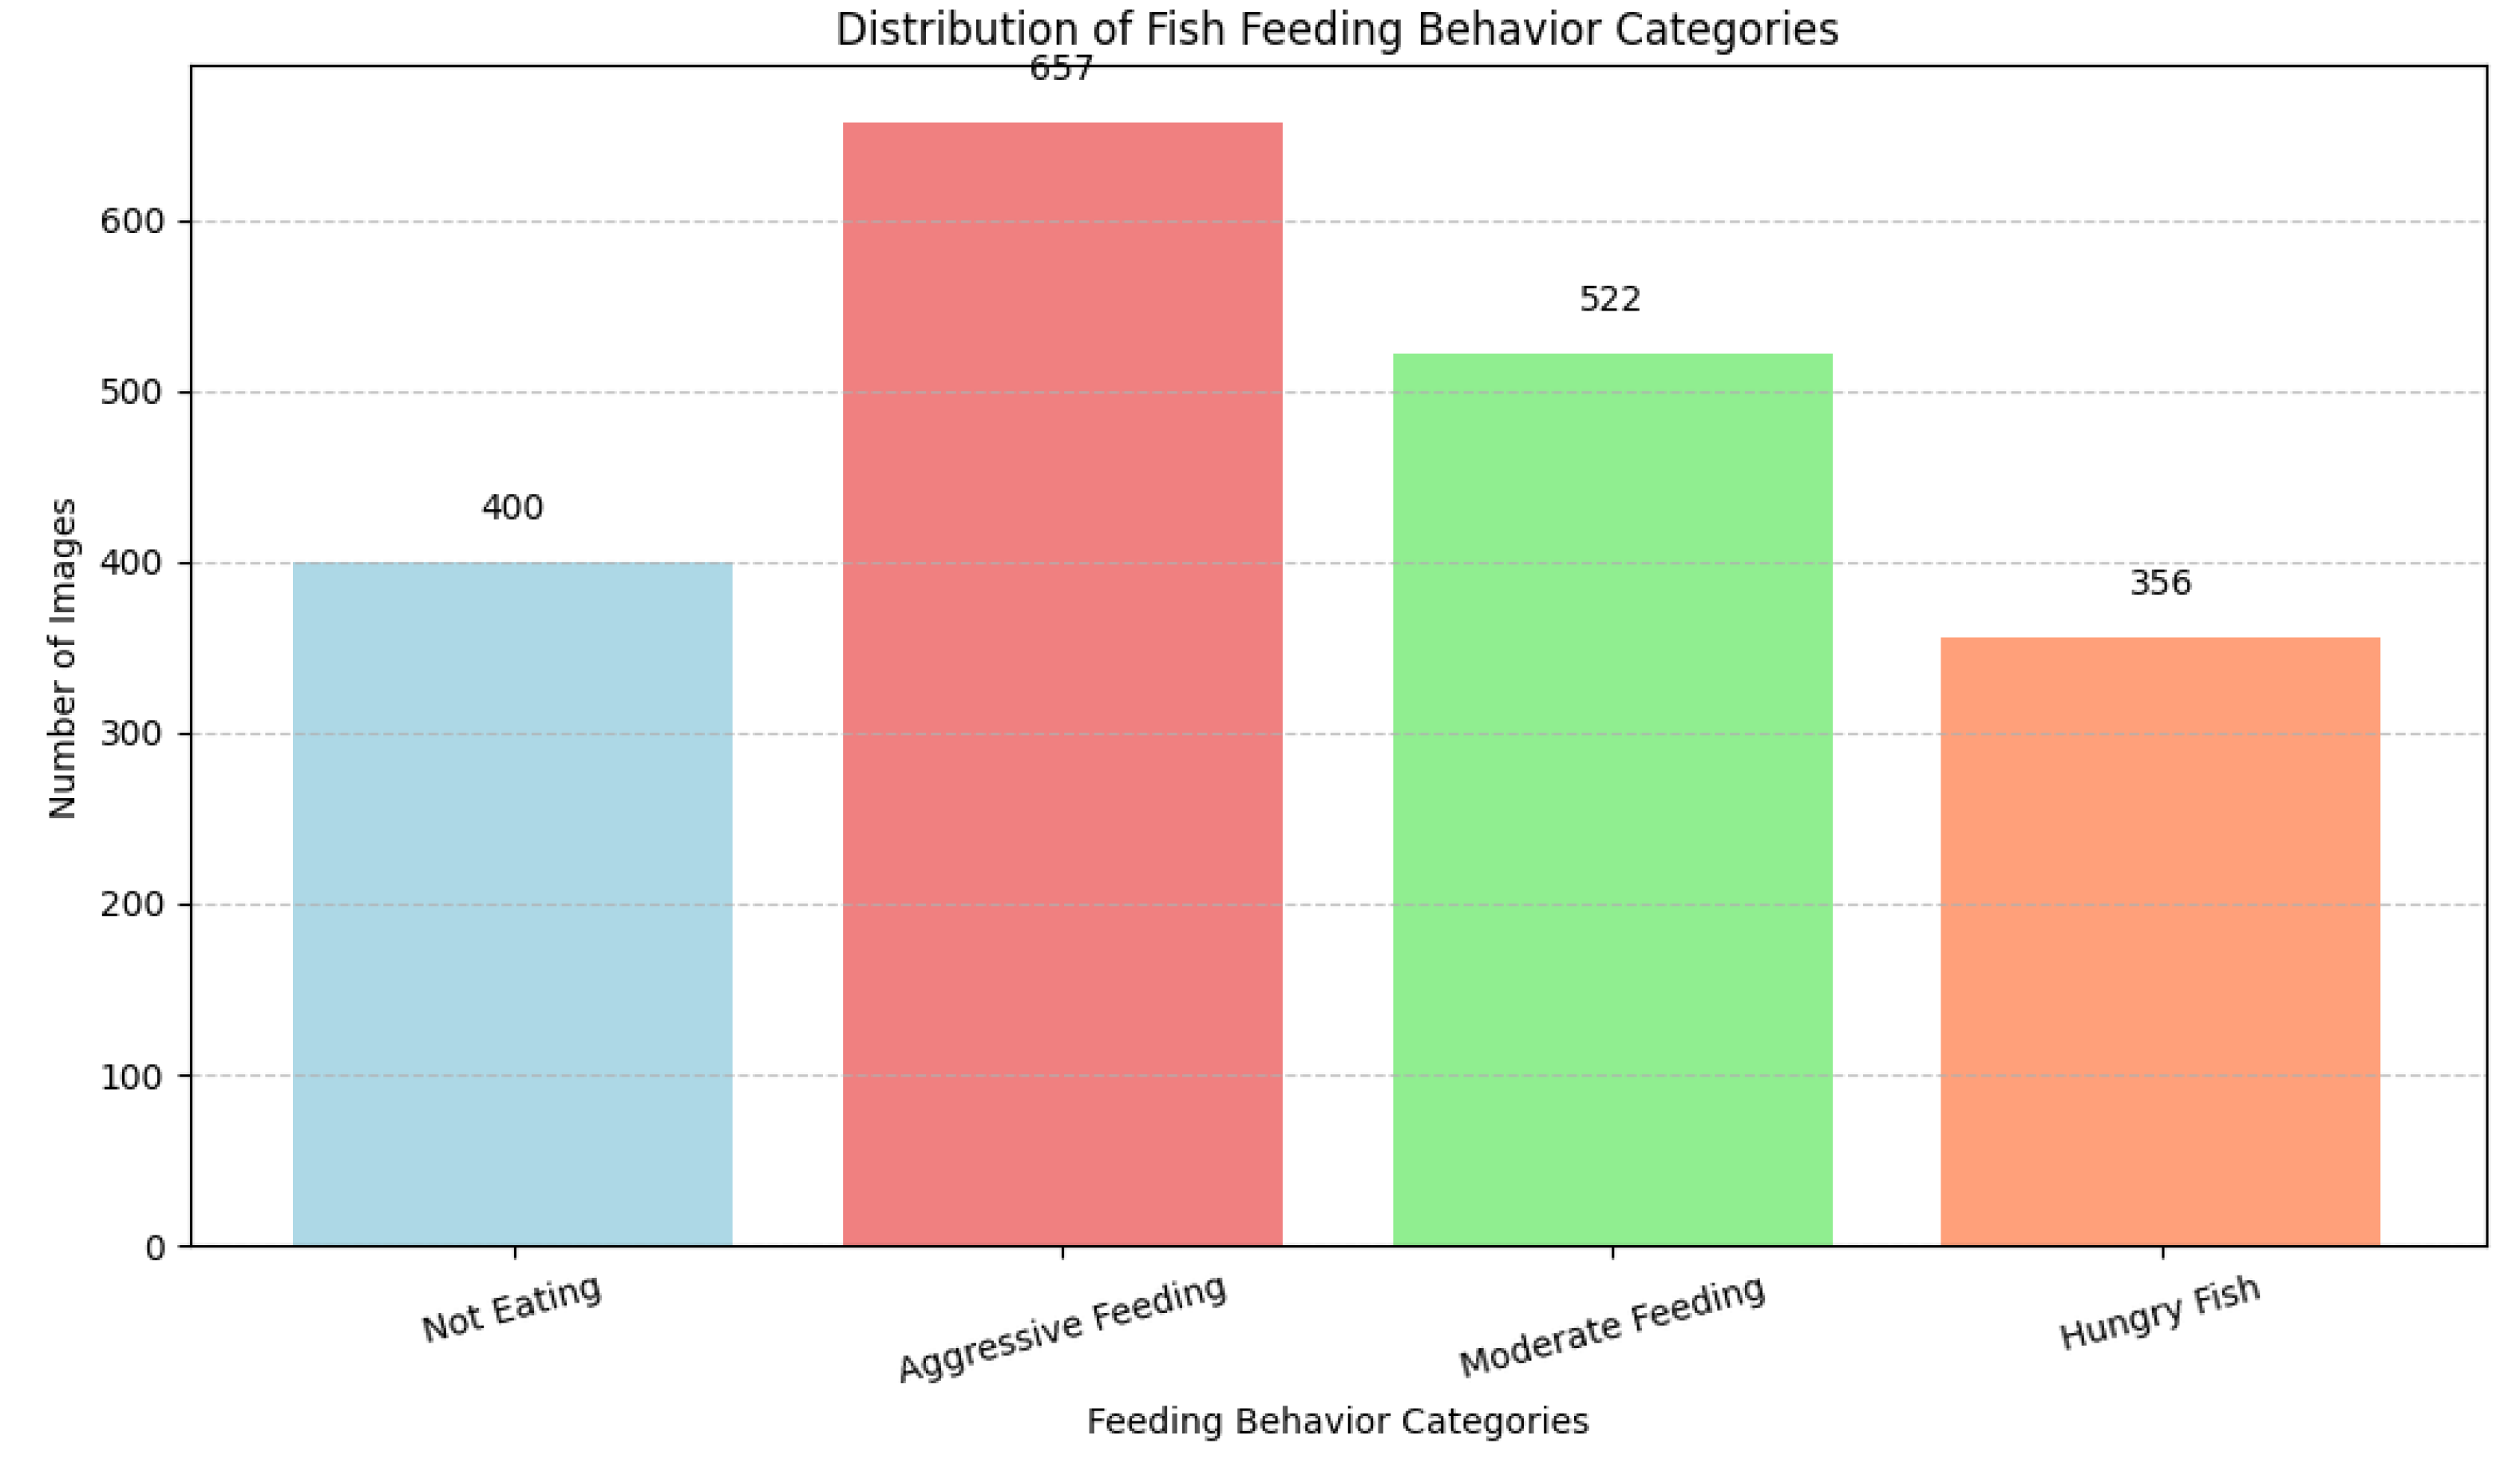
Figure 4.
Integrated Fish Feeding Strategy in Pond Aquaculture. This diagram illustrates the comprehensive approach to optimizing fish feeding by combining fish biomass estimation, continuous monitoring of water quality conditions, and analysis of feeding behaviour. This integrated strategy enhances decision-making and promotes sustainable aquaculture practices.
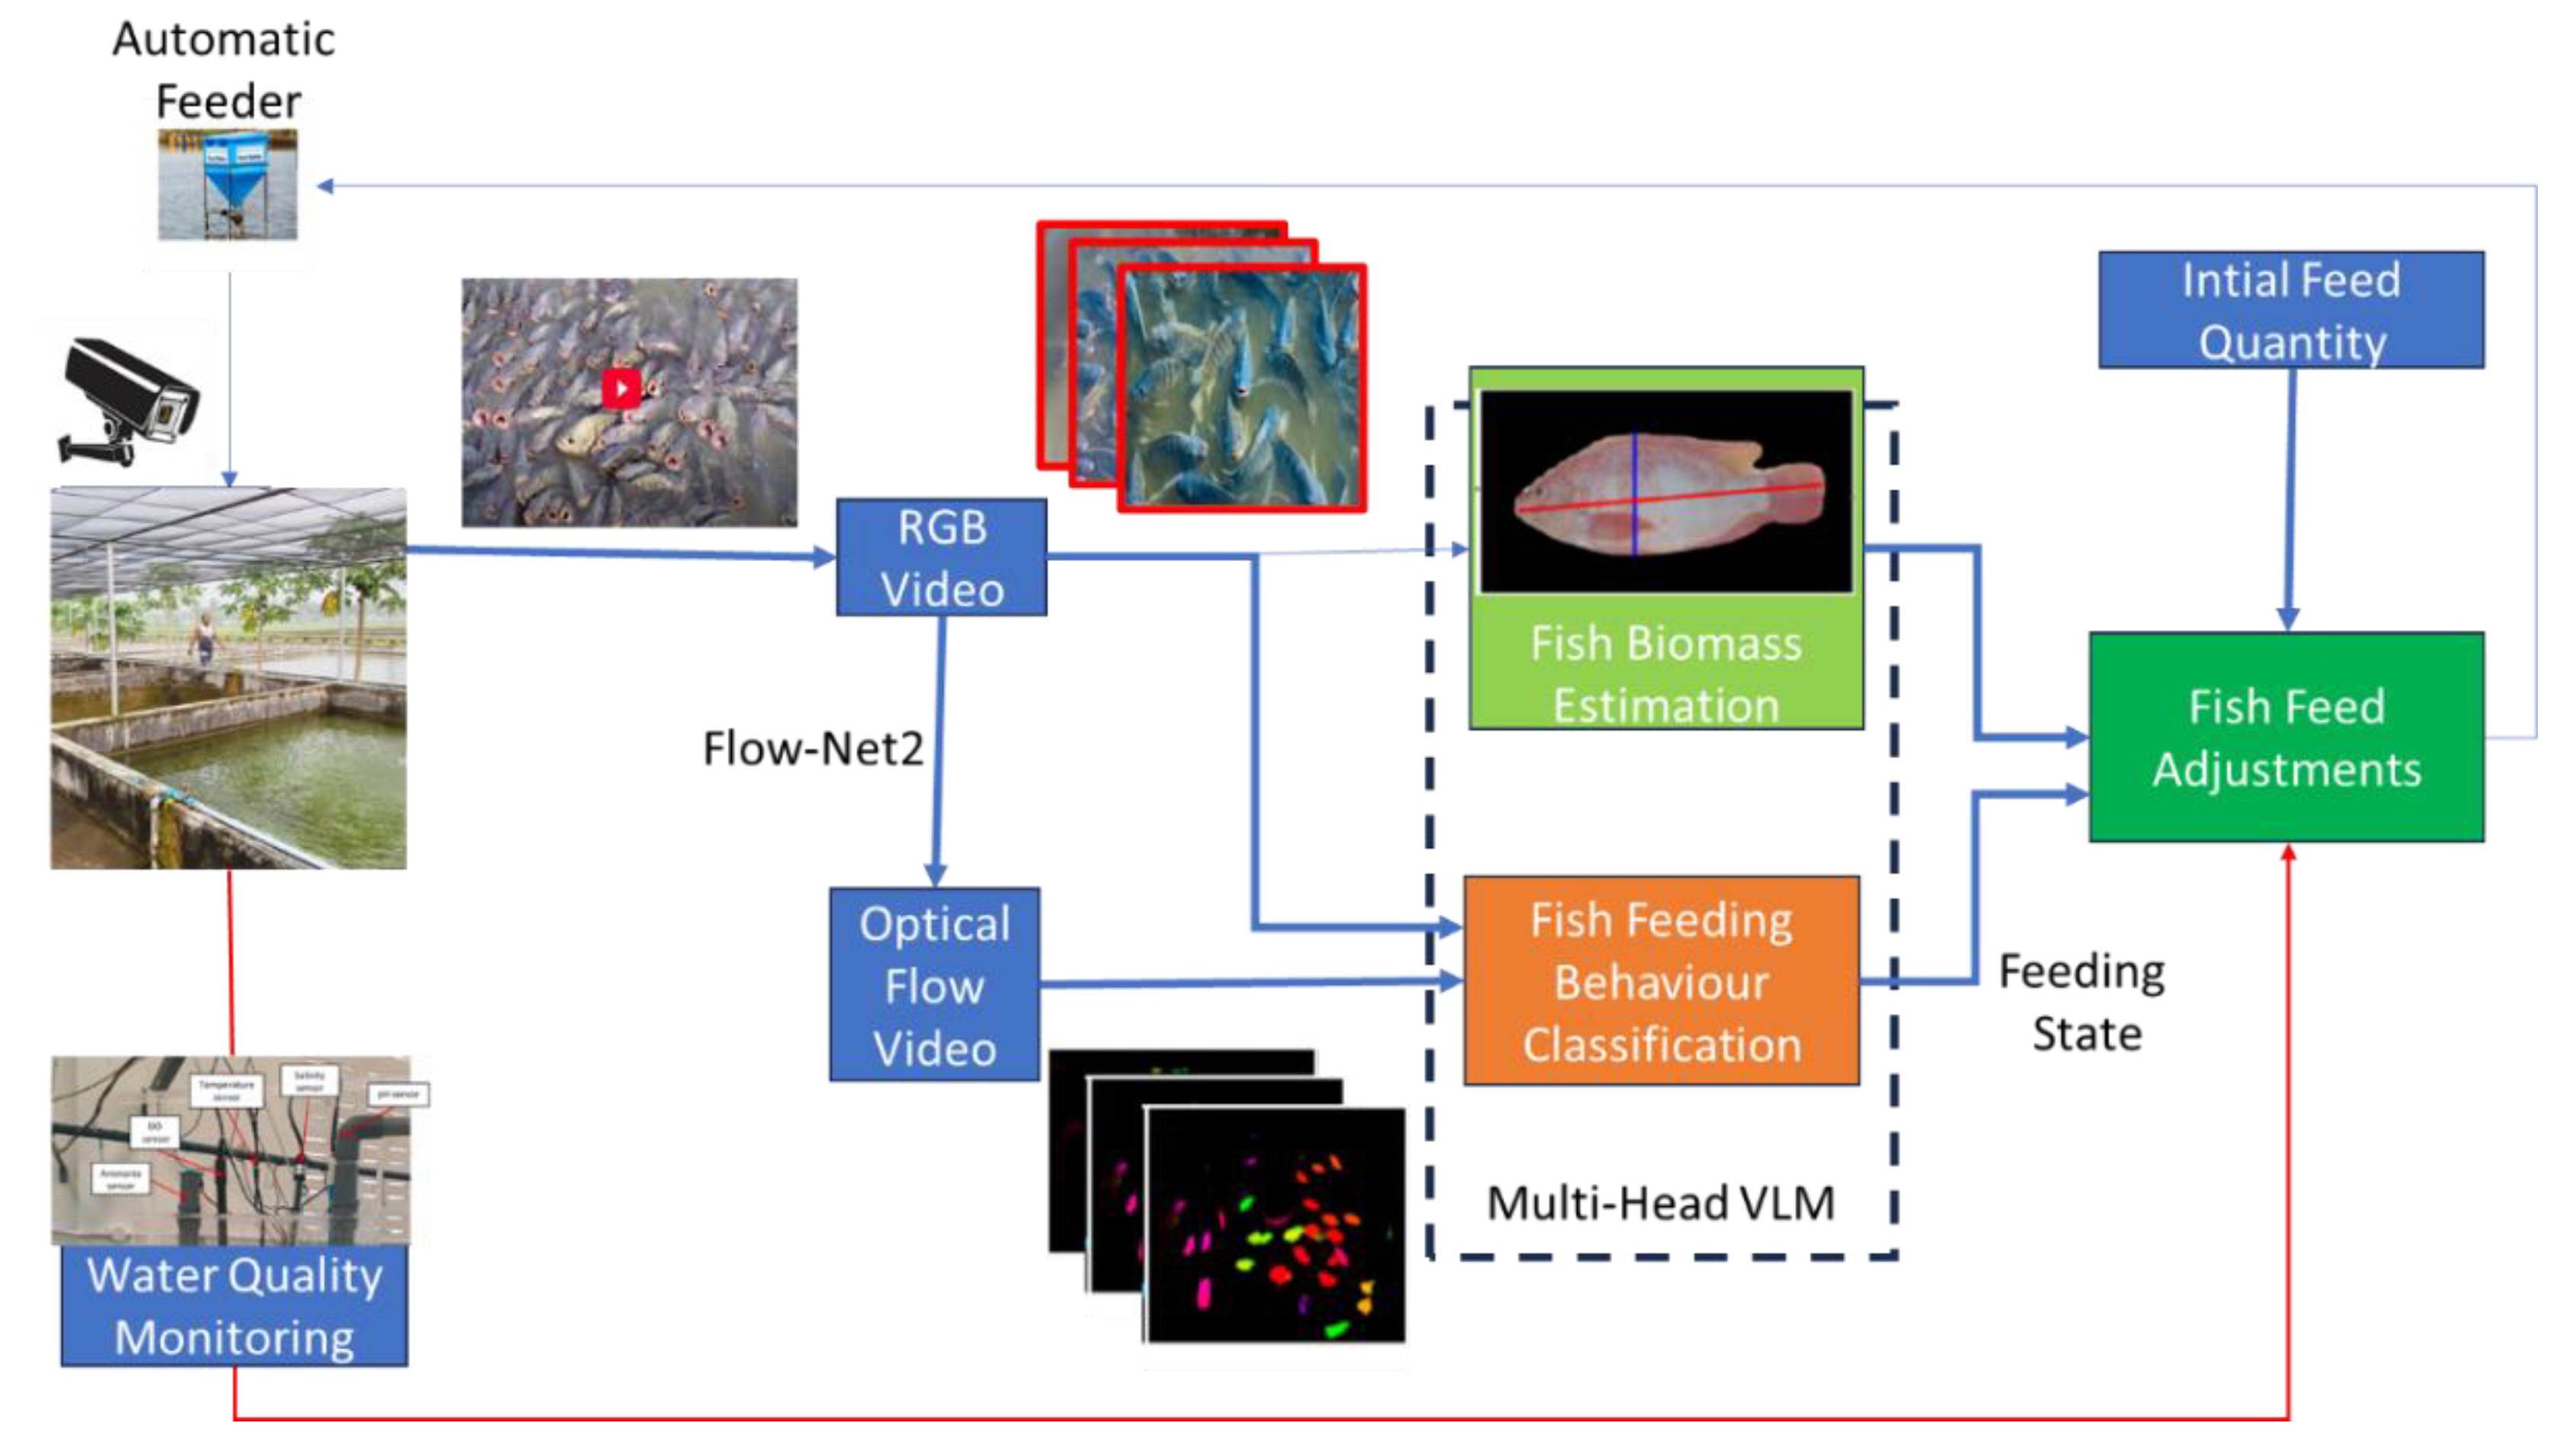
Figure 5.
The optical flow image highlights the movement characteristics of the fish, and the movement direction is represented by the HSV image. (a) and (b) show optical flow data generated from images taken under controlled laboratory conditions, as described by Cui et al. [32], highlighting clear movement patterns. Panels (c) and (d) display optical flow data from a real pond aquaculture environment, capturing the complexities and interactions of fish within a natural setting, including variations in water clarity and environmental obstacles.
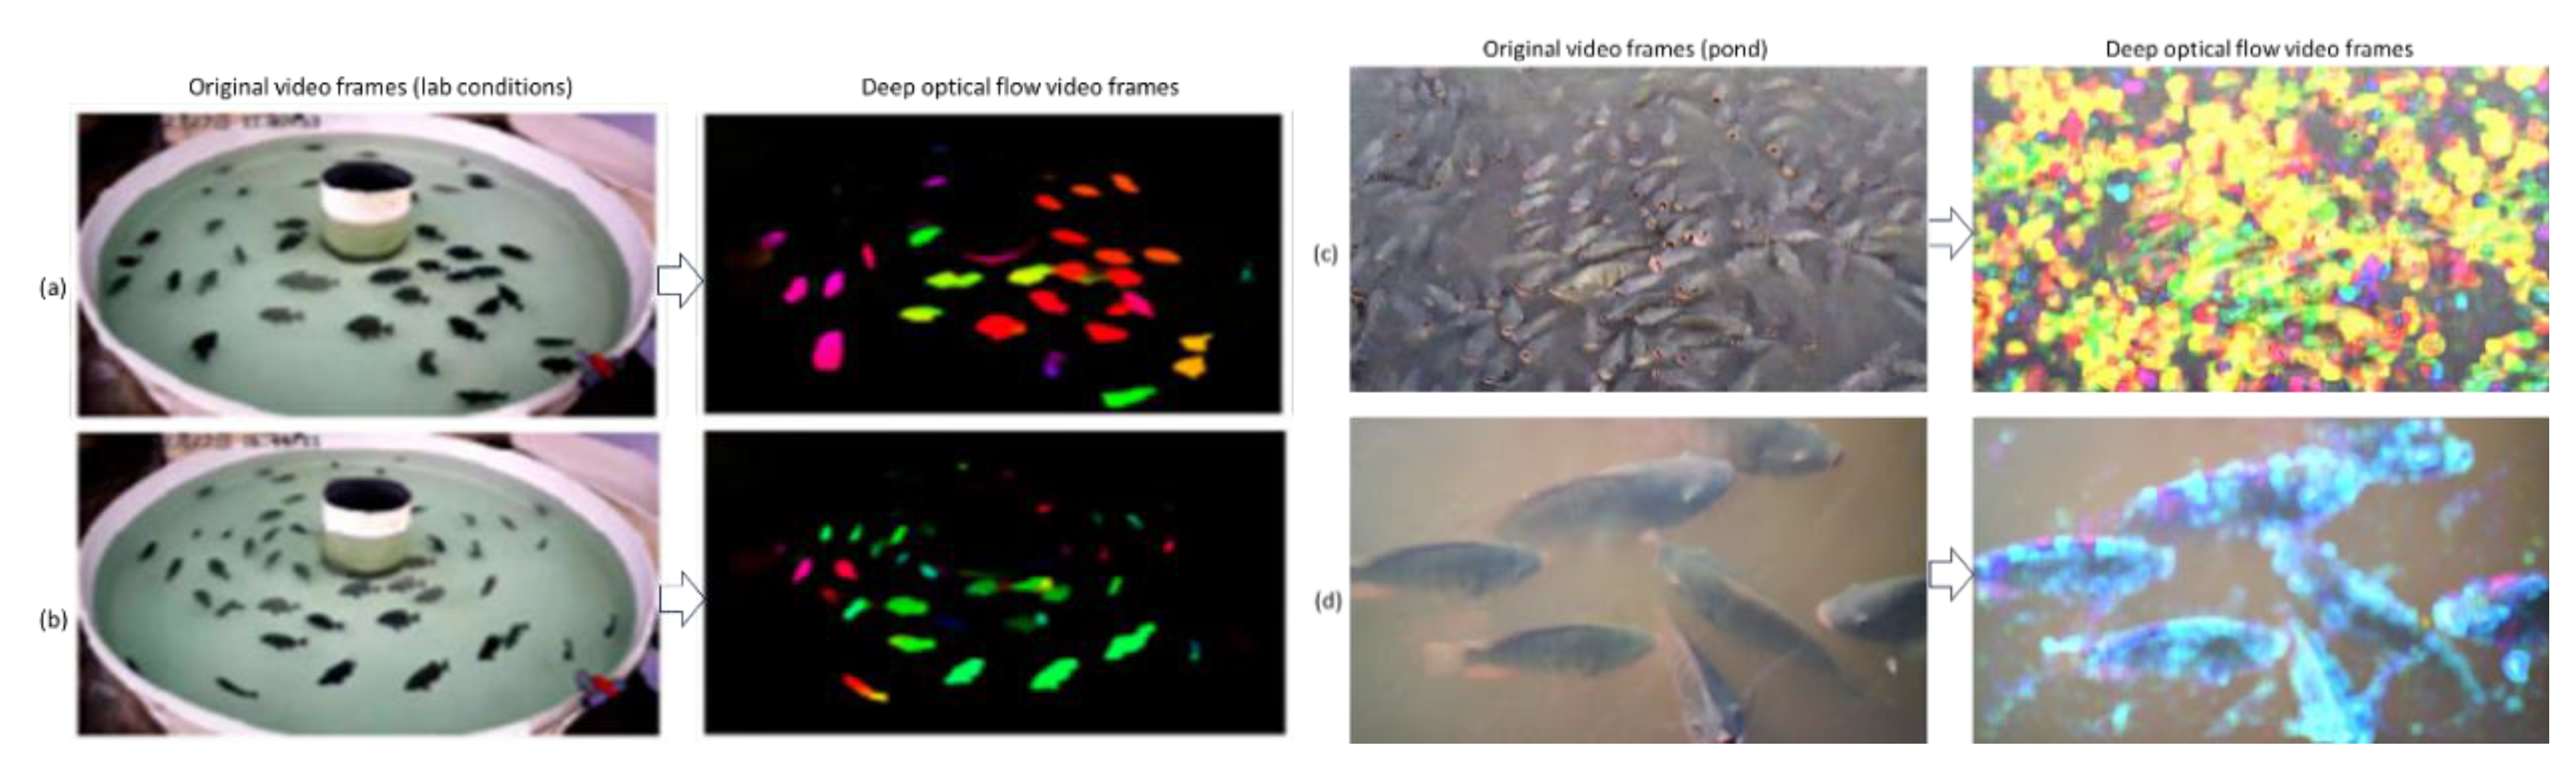
Figure 6.
Dataset of fish feeding behaviour taken by Cui et al. (a,b) represent examples of fish non-feeding behaviour, while (c,d) represent examples of feeding behaviour.
Figure 6.
Dataset of fish feeding behaviour taken by Cui et al. (a,b) represent examples of fish non-feeding behaviour, while (c,d) represent examples of feeding behaviour.
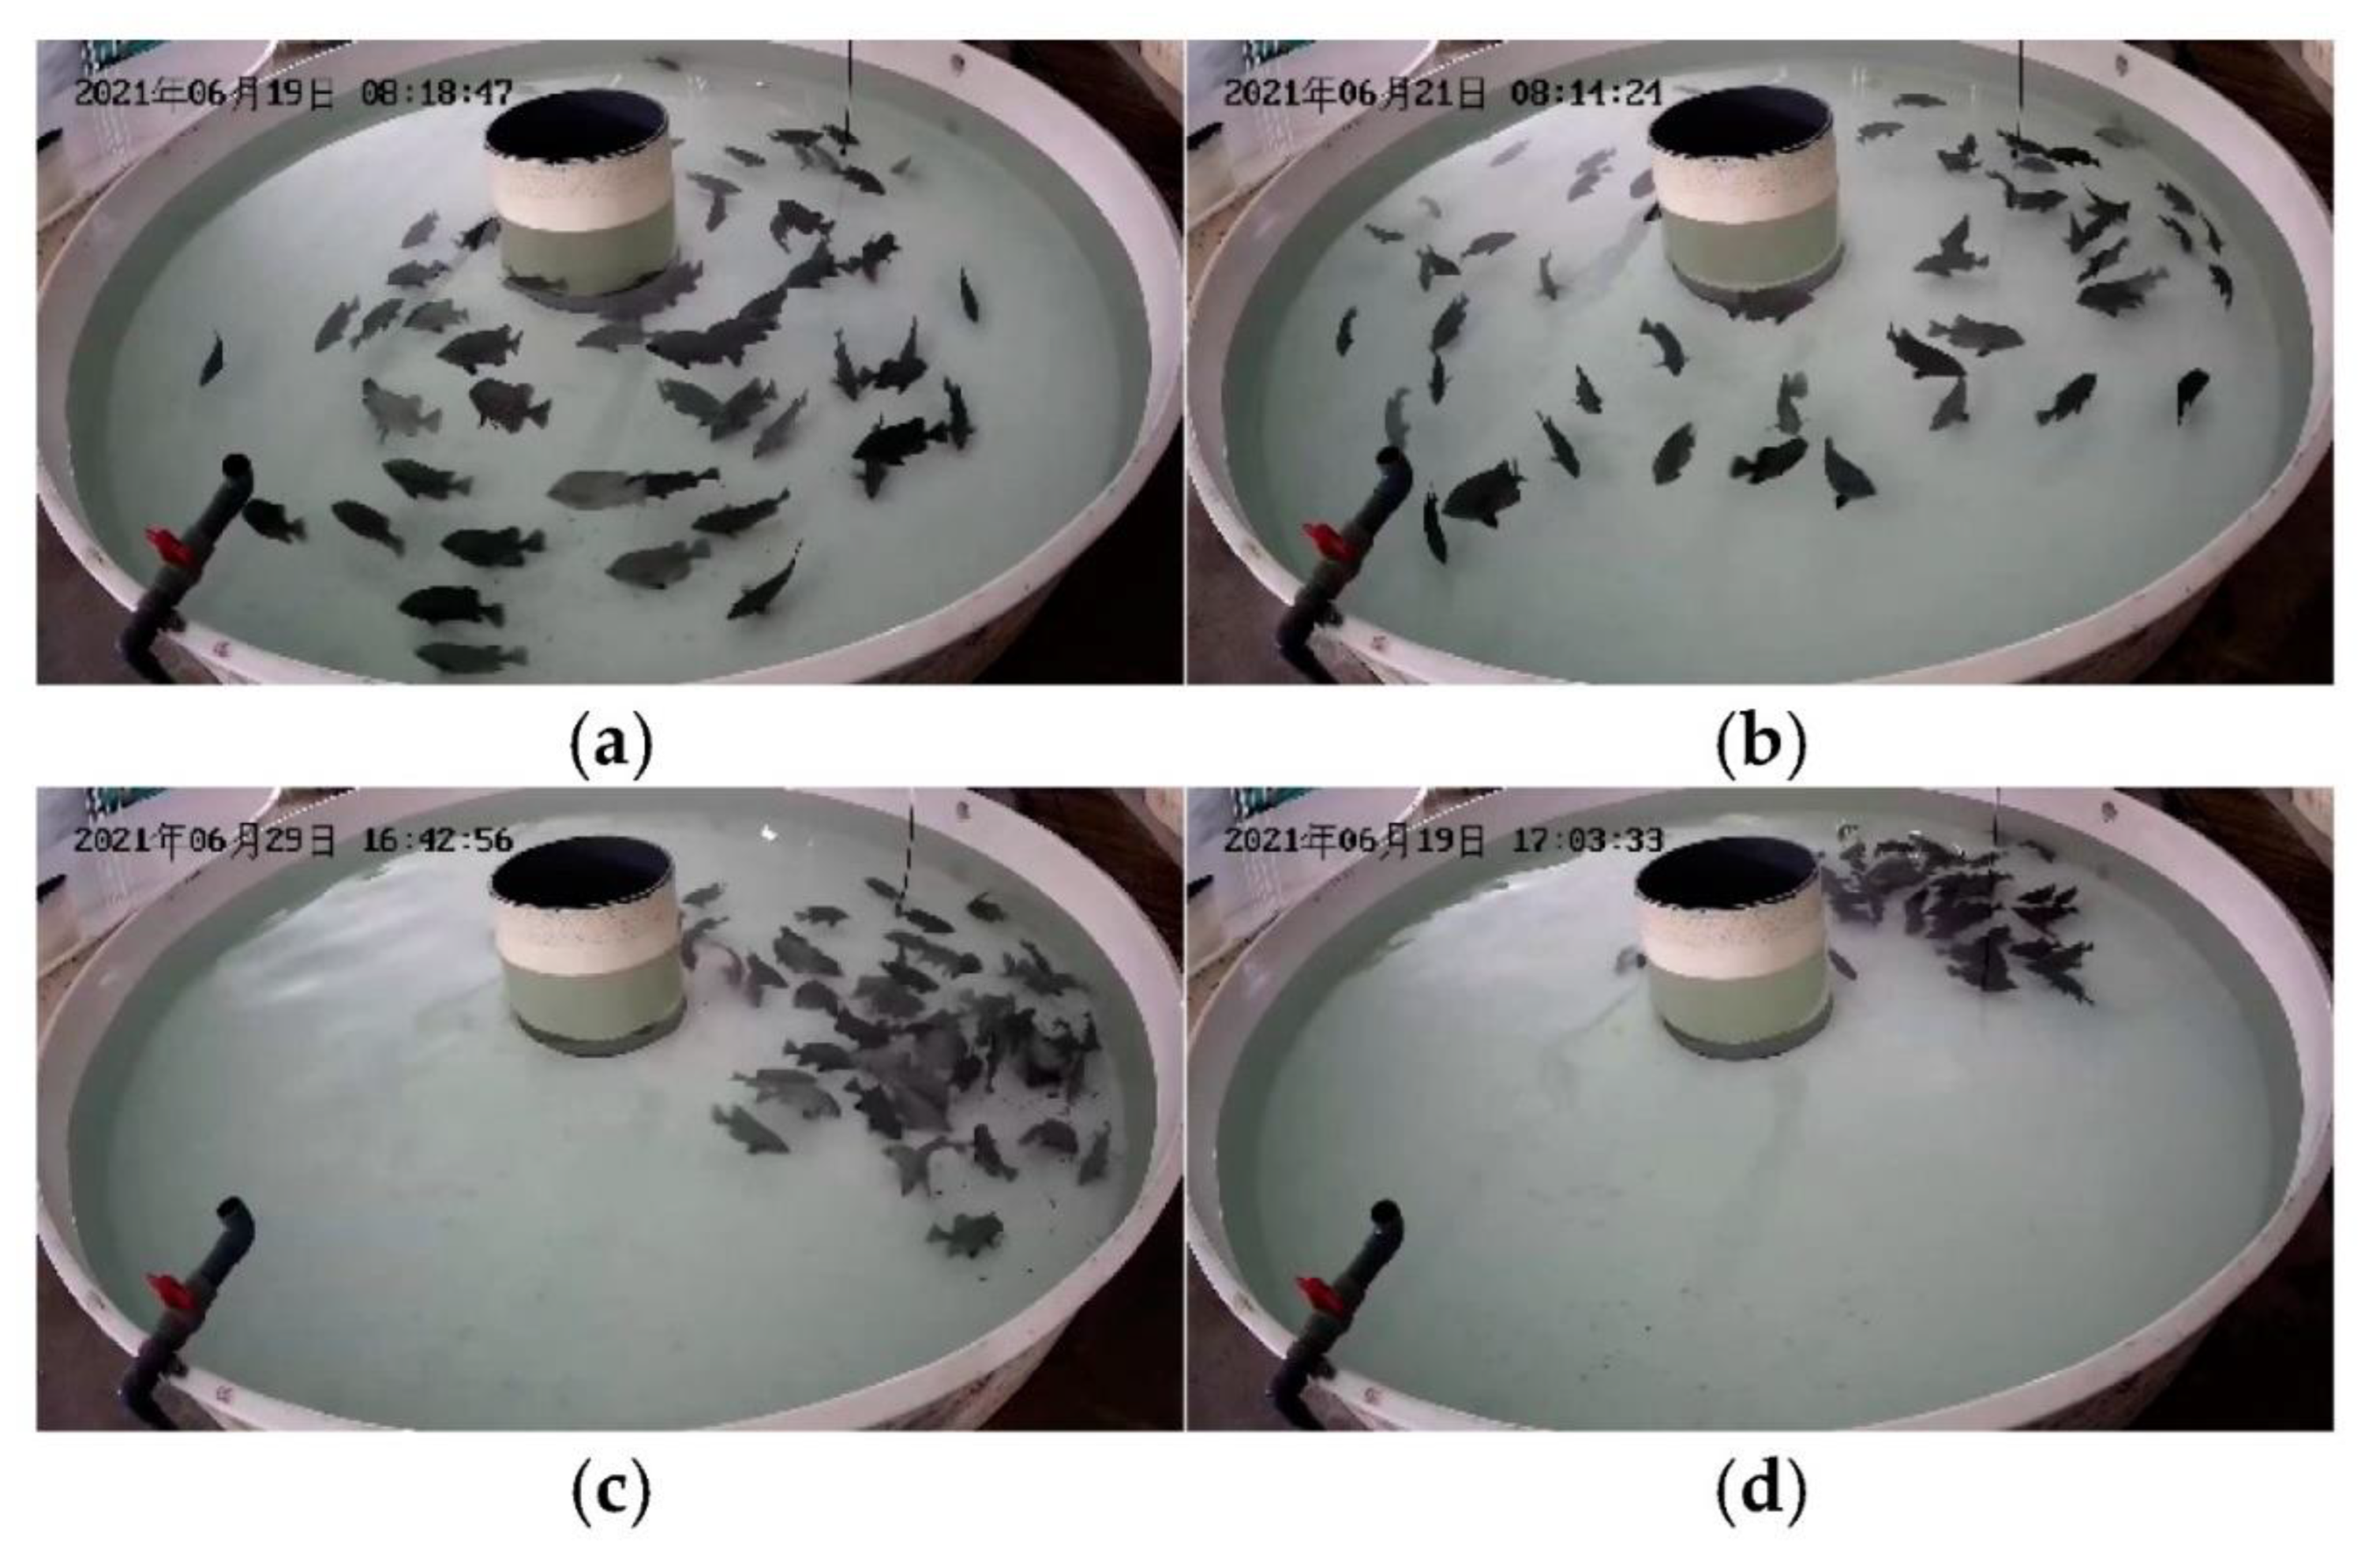
Figure 7.
Dataset of fish feeding behaviour taken von complex environments (a) represents fish not eating, (b) hungry fish, (c) moderate feeding and (d) aggressives feeding.
Figure 7.
Dataset of fish feeding behaviour taken von complex environments (a) represents fish not eating, (b) hungry fish, (c) moderate feeding and (d) aggressives feeding.
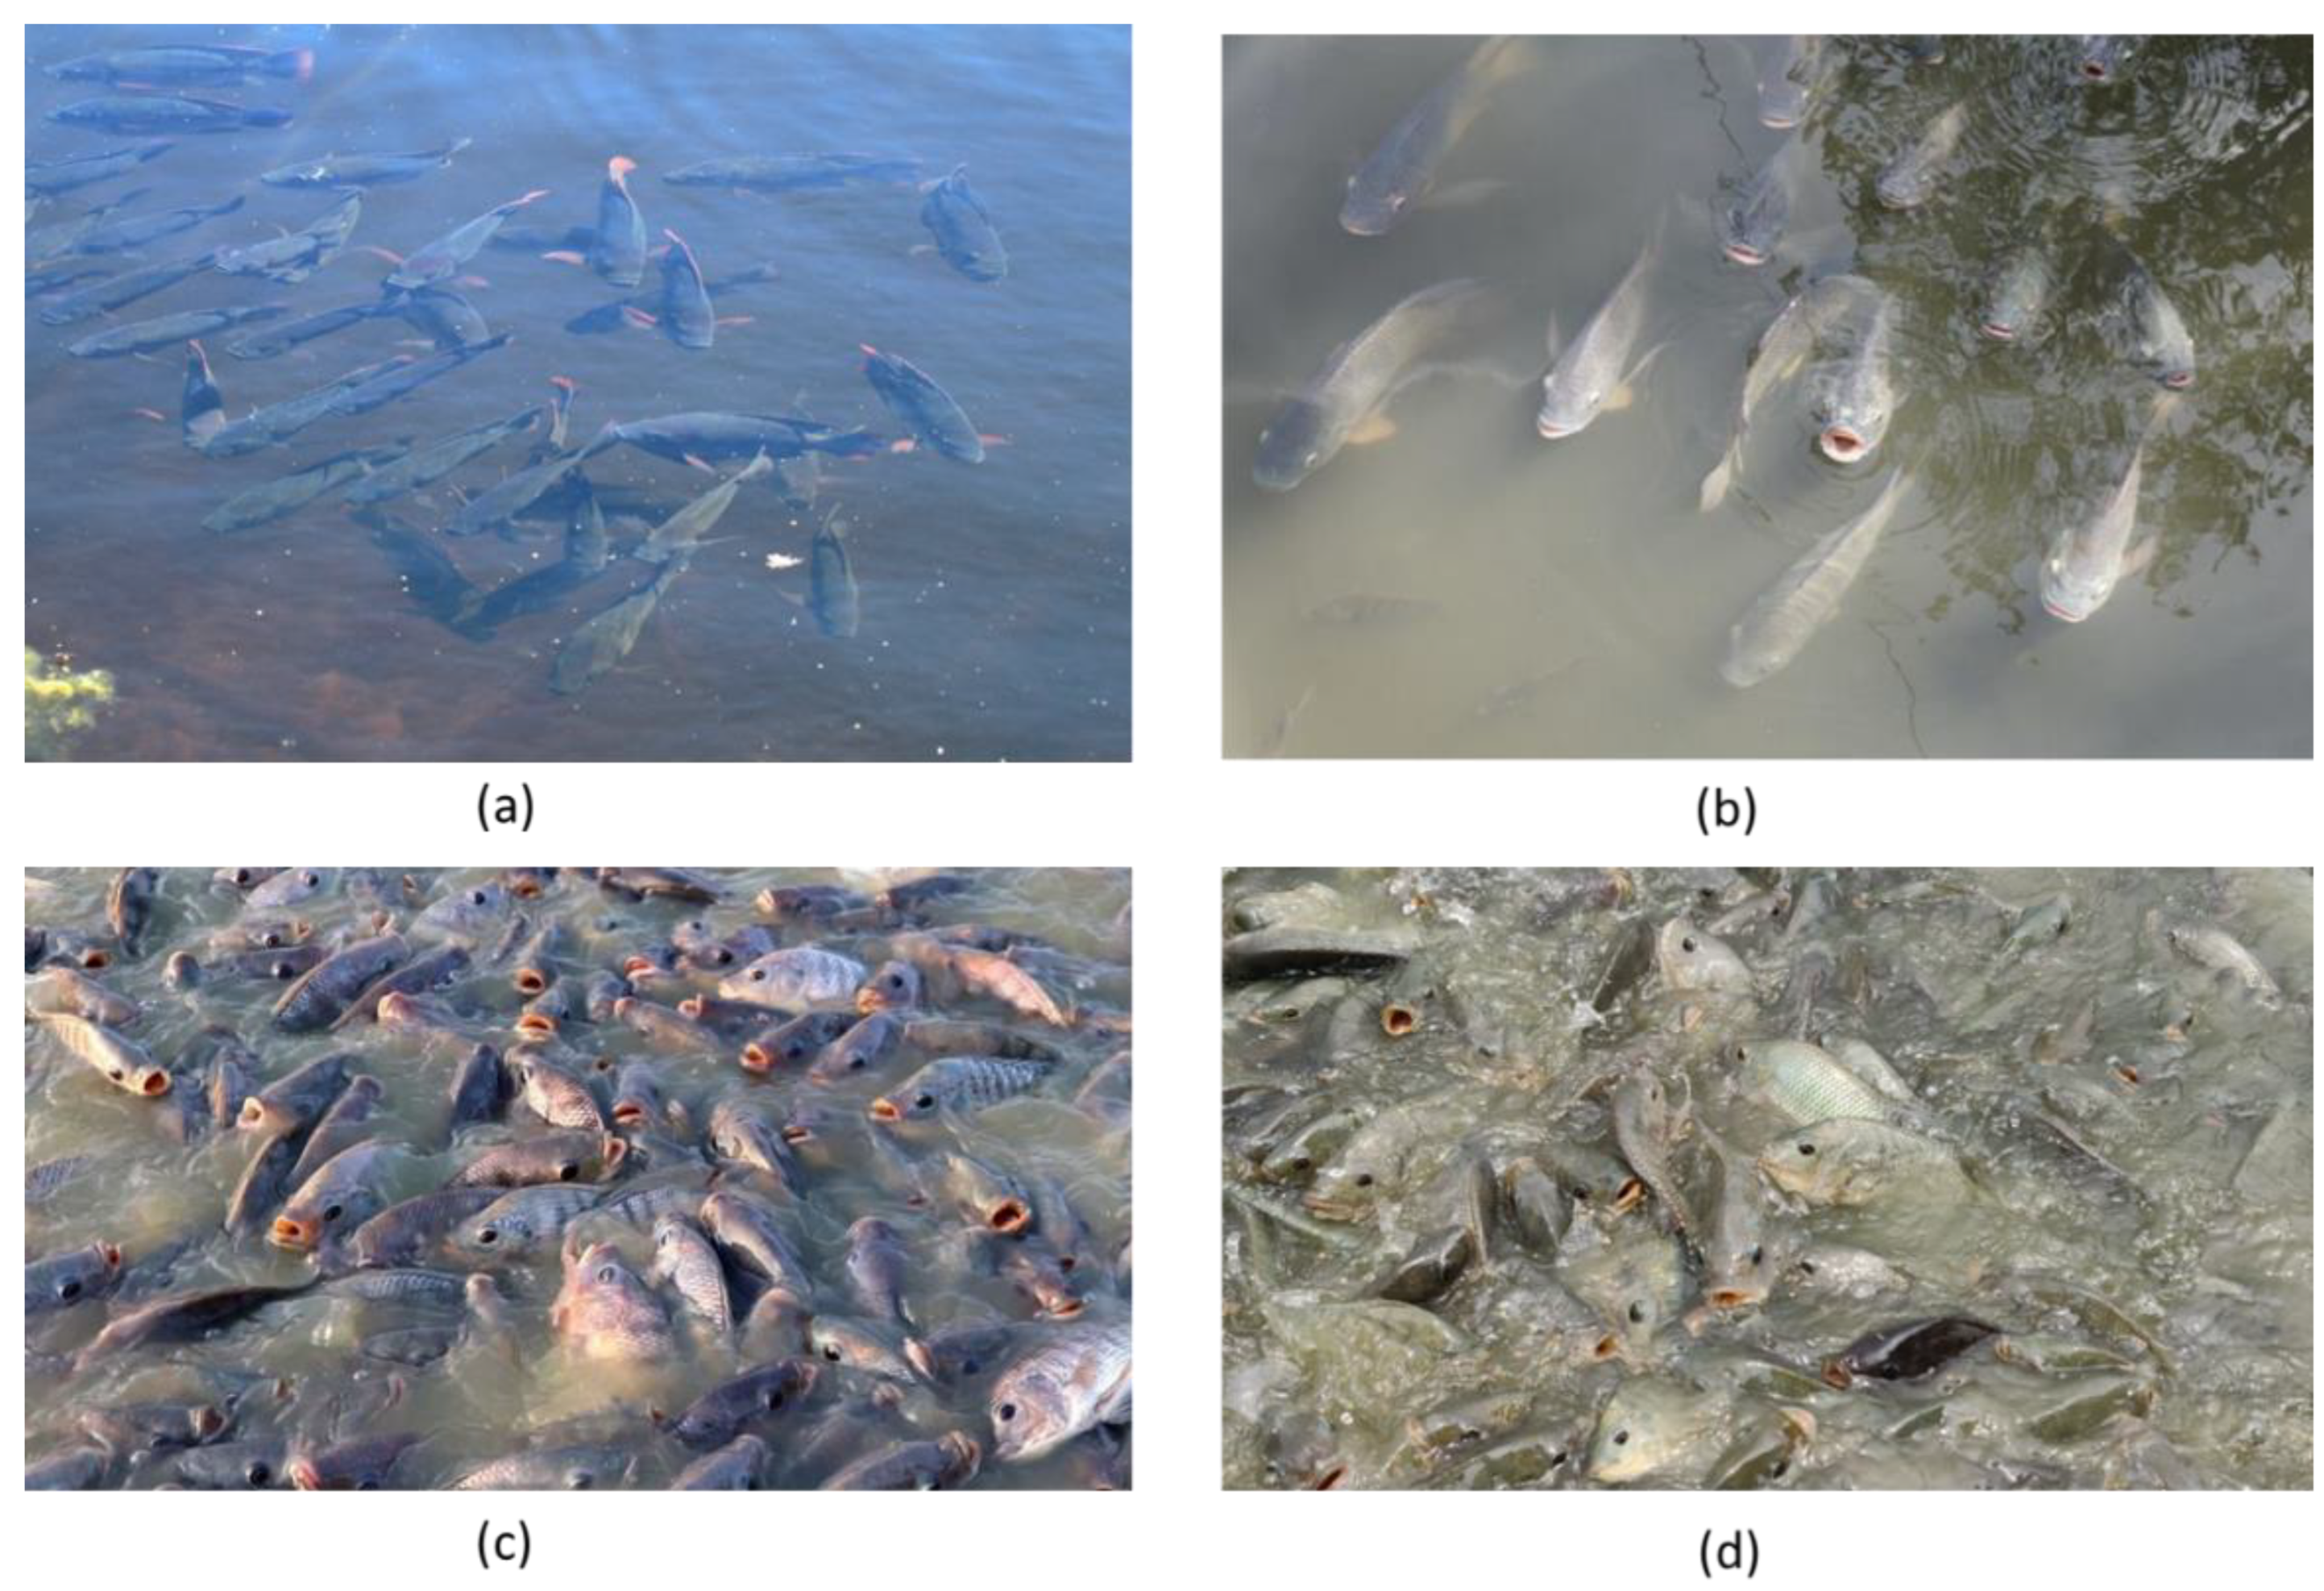
Figure 8.
A detailed illustration of image-text alignment with a prompt template for enriching class information with a common fish feeding behaviour dataset.
Figure 8.
A detailed illustration of image-text alignment with a prompt template for enriching class information with a common fish feeding behaviour dataset.
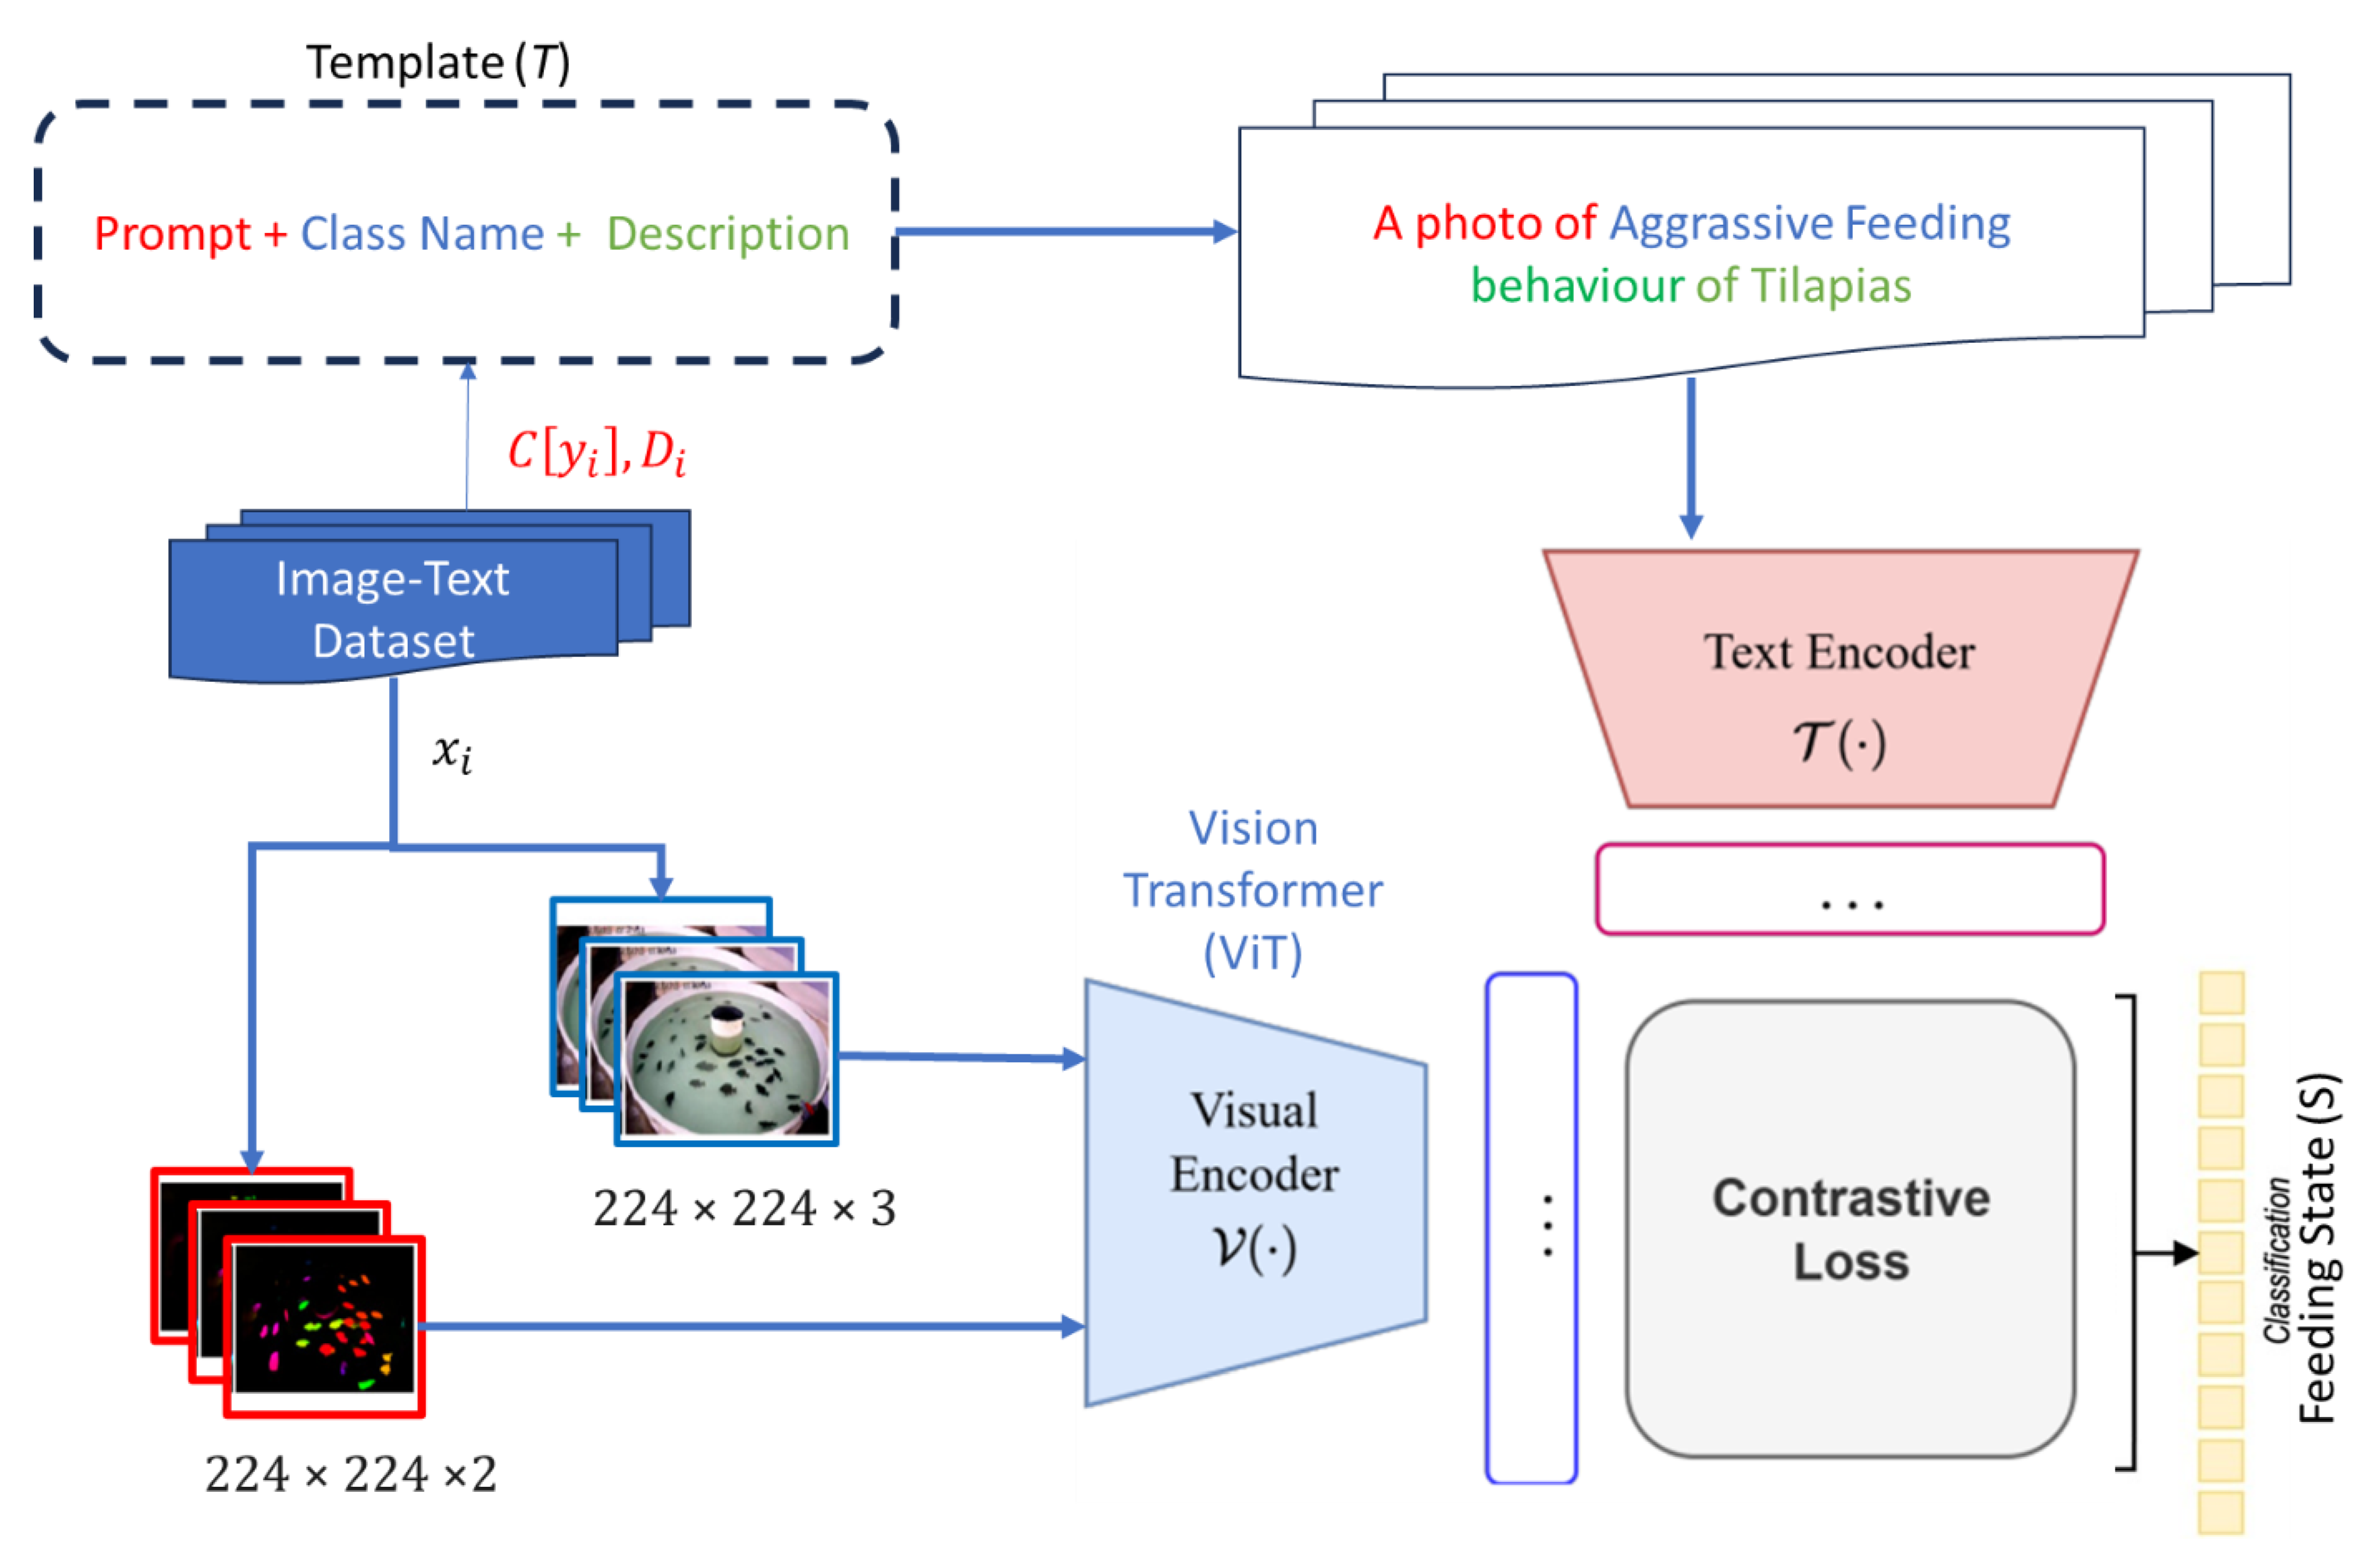
Figure 9.
Examples from the two datasets: (a) the original dataset without enhancements, (b) the enhanced dataset, which features improved image quality, highlighting the differences in clarity and detail.
Figure 9.
Examples from the two datasets: (a) the original dataset without enhancements, (b) the enhanced dataset, which features improved image quality, highlighting the differences in clarity and detail.
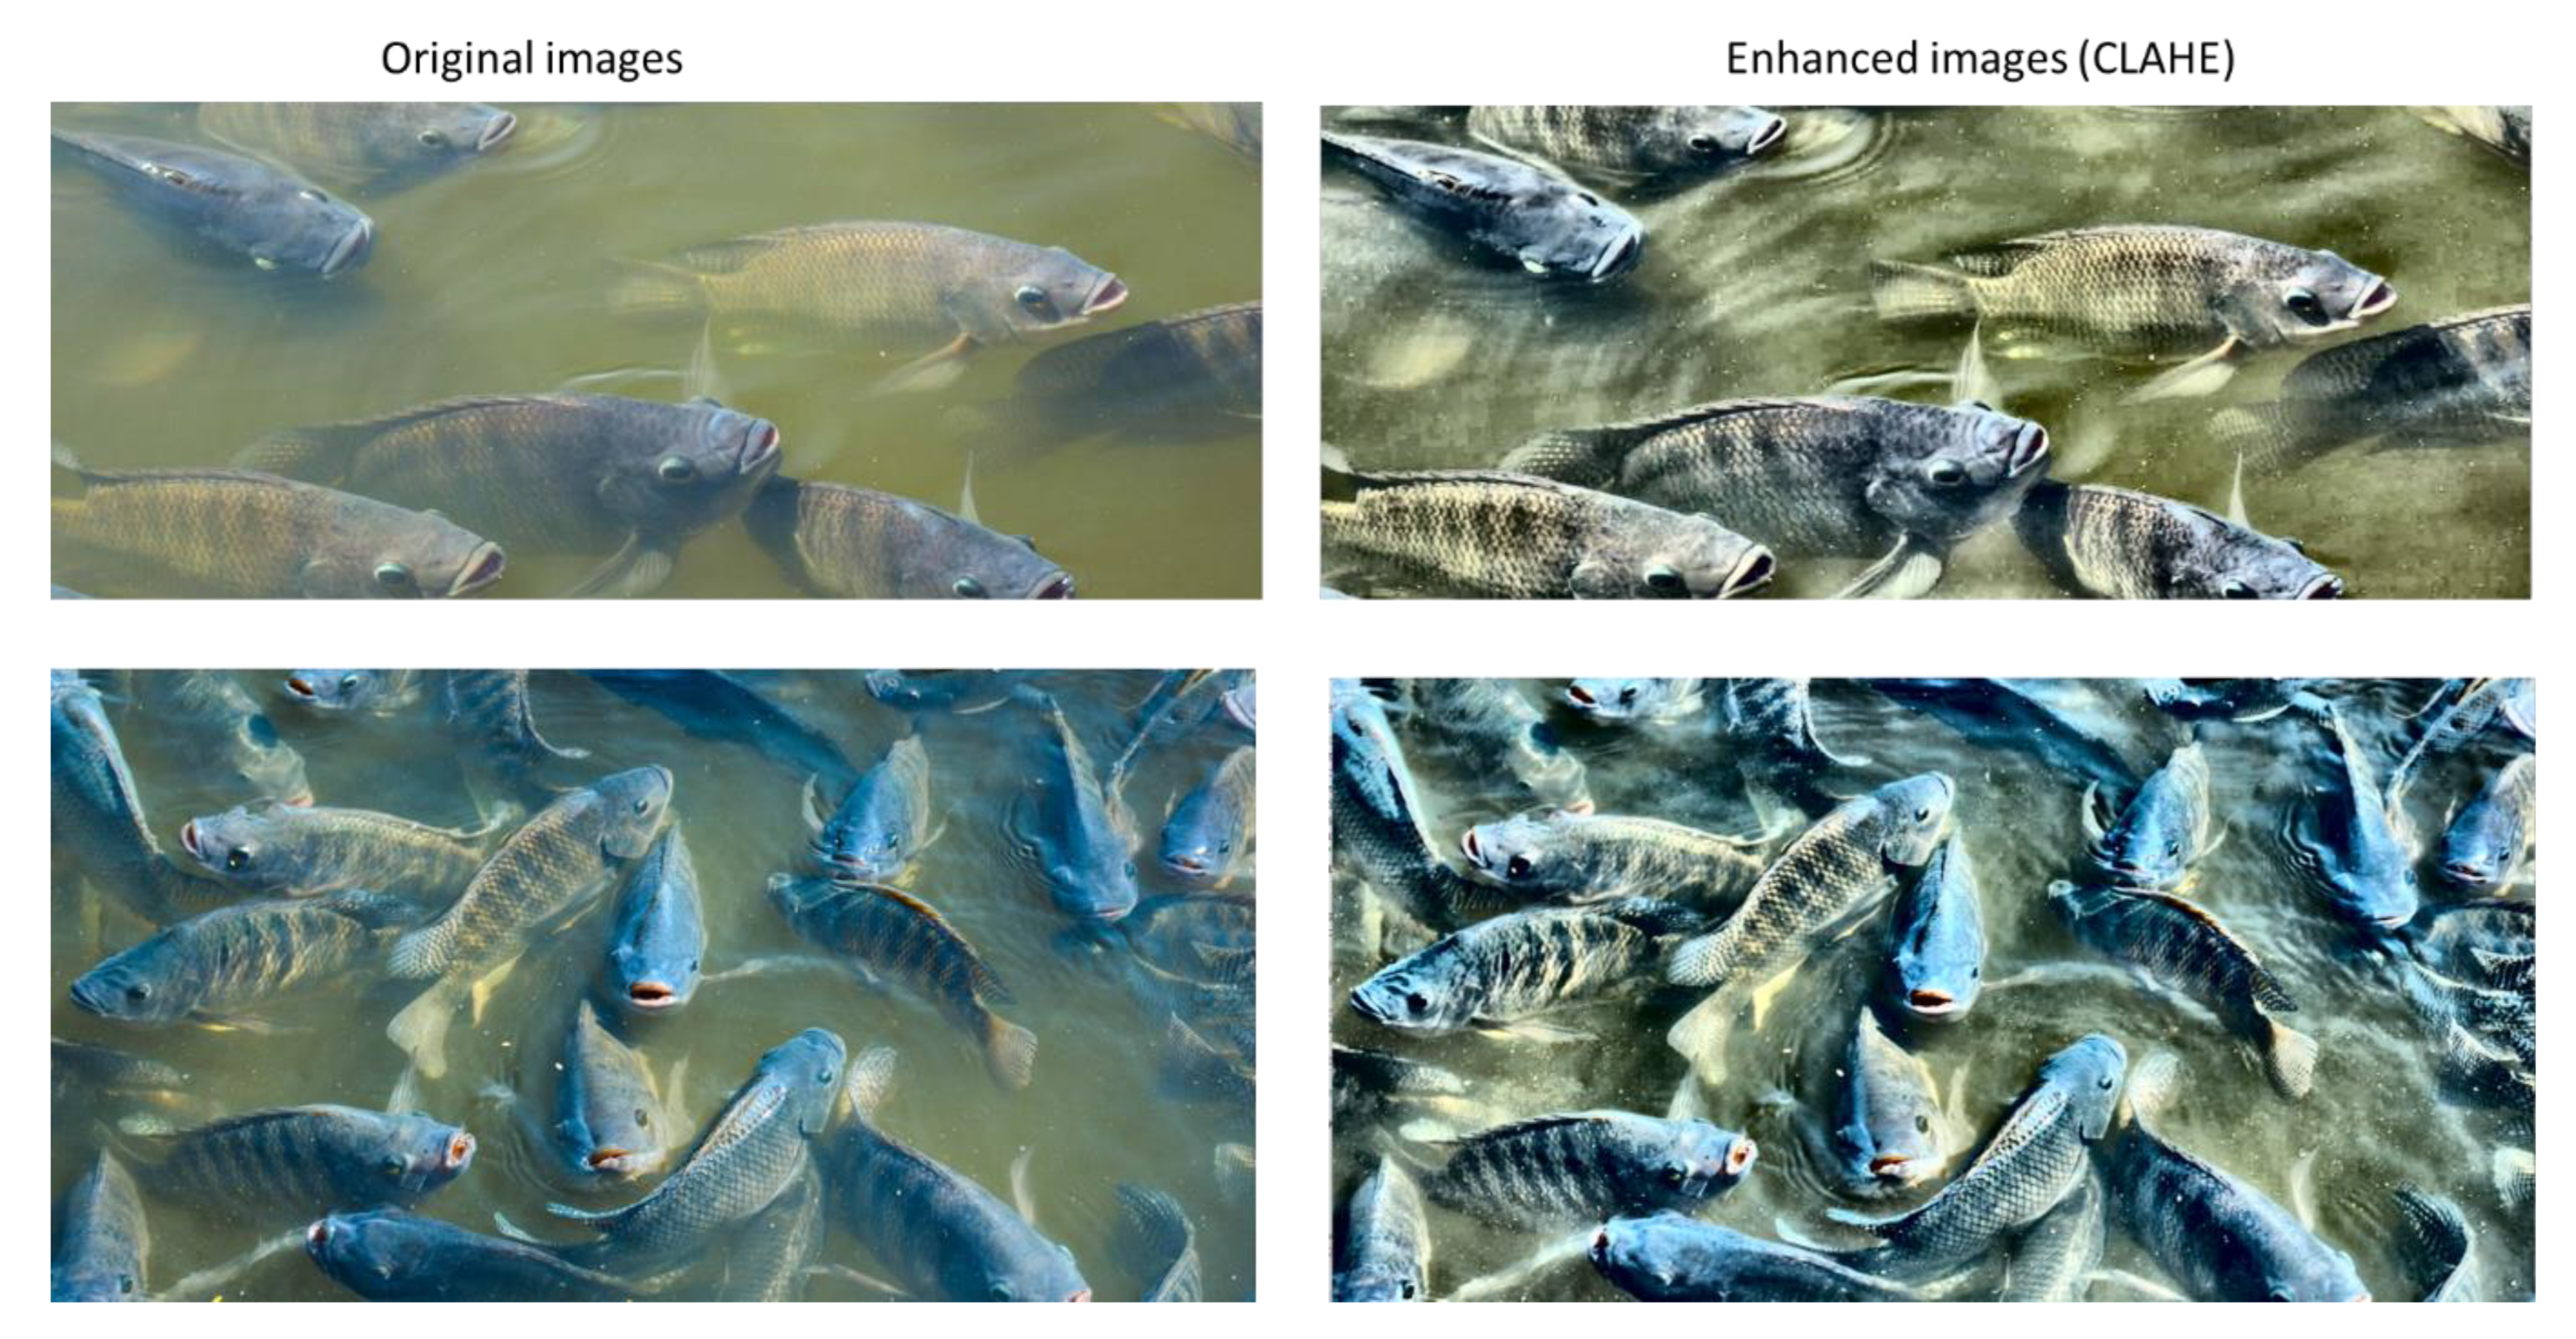
Figure 10.
Confusion Matrix illustrating the model’s classification performance across four categories: Not Feeding, Aggressive Eating, Moderate, and Hungry. Each cell shows the count of true predictions alongside the corresponding percentage of the total instances for that class. High precision and recall values indicate effective model performance, with all classes achieving strong F1-scores.
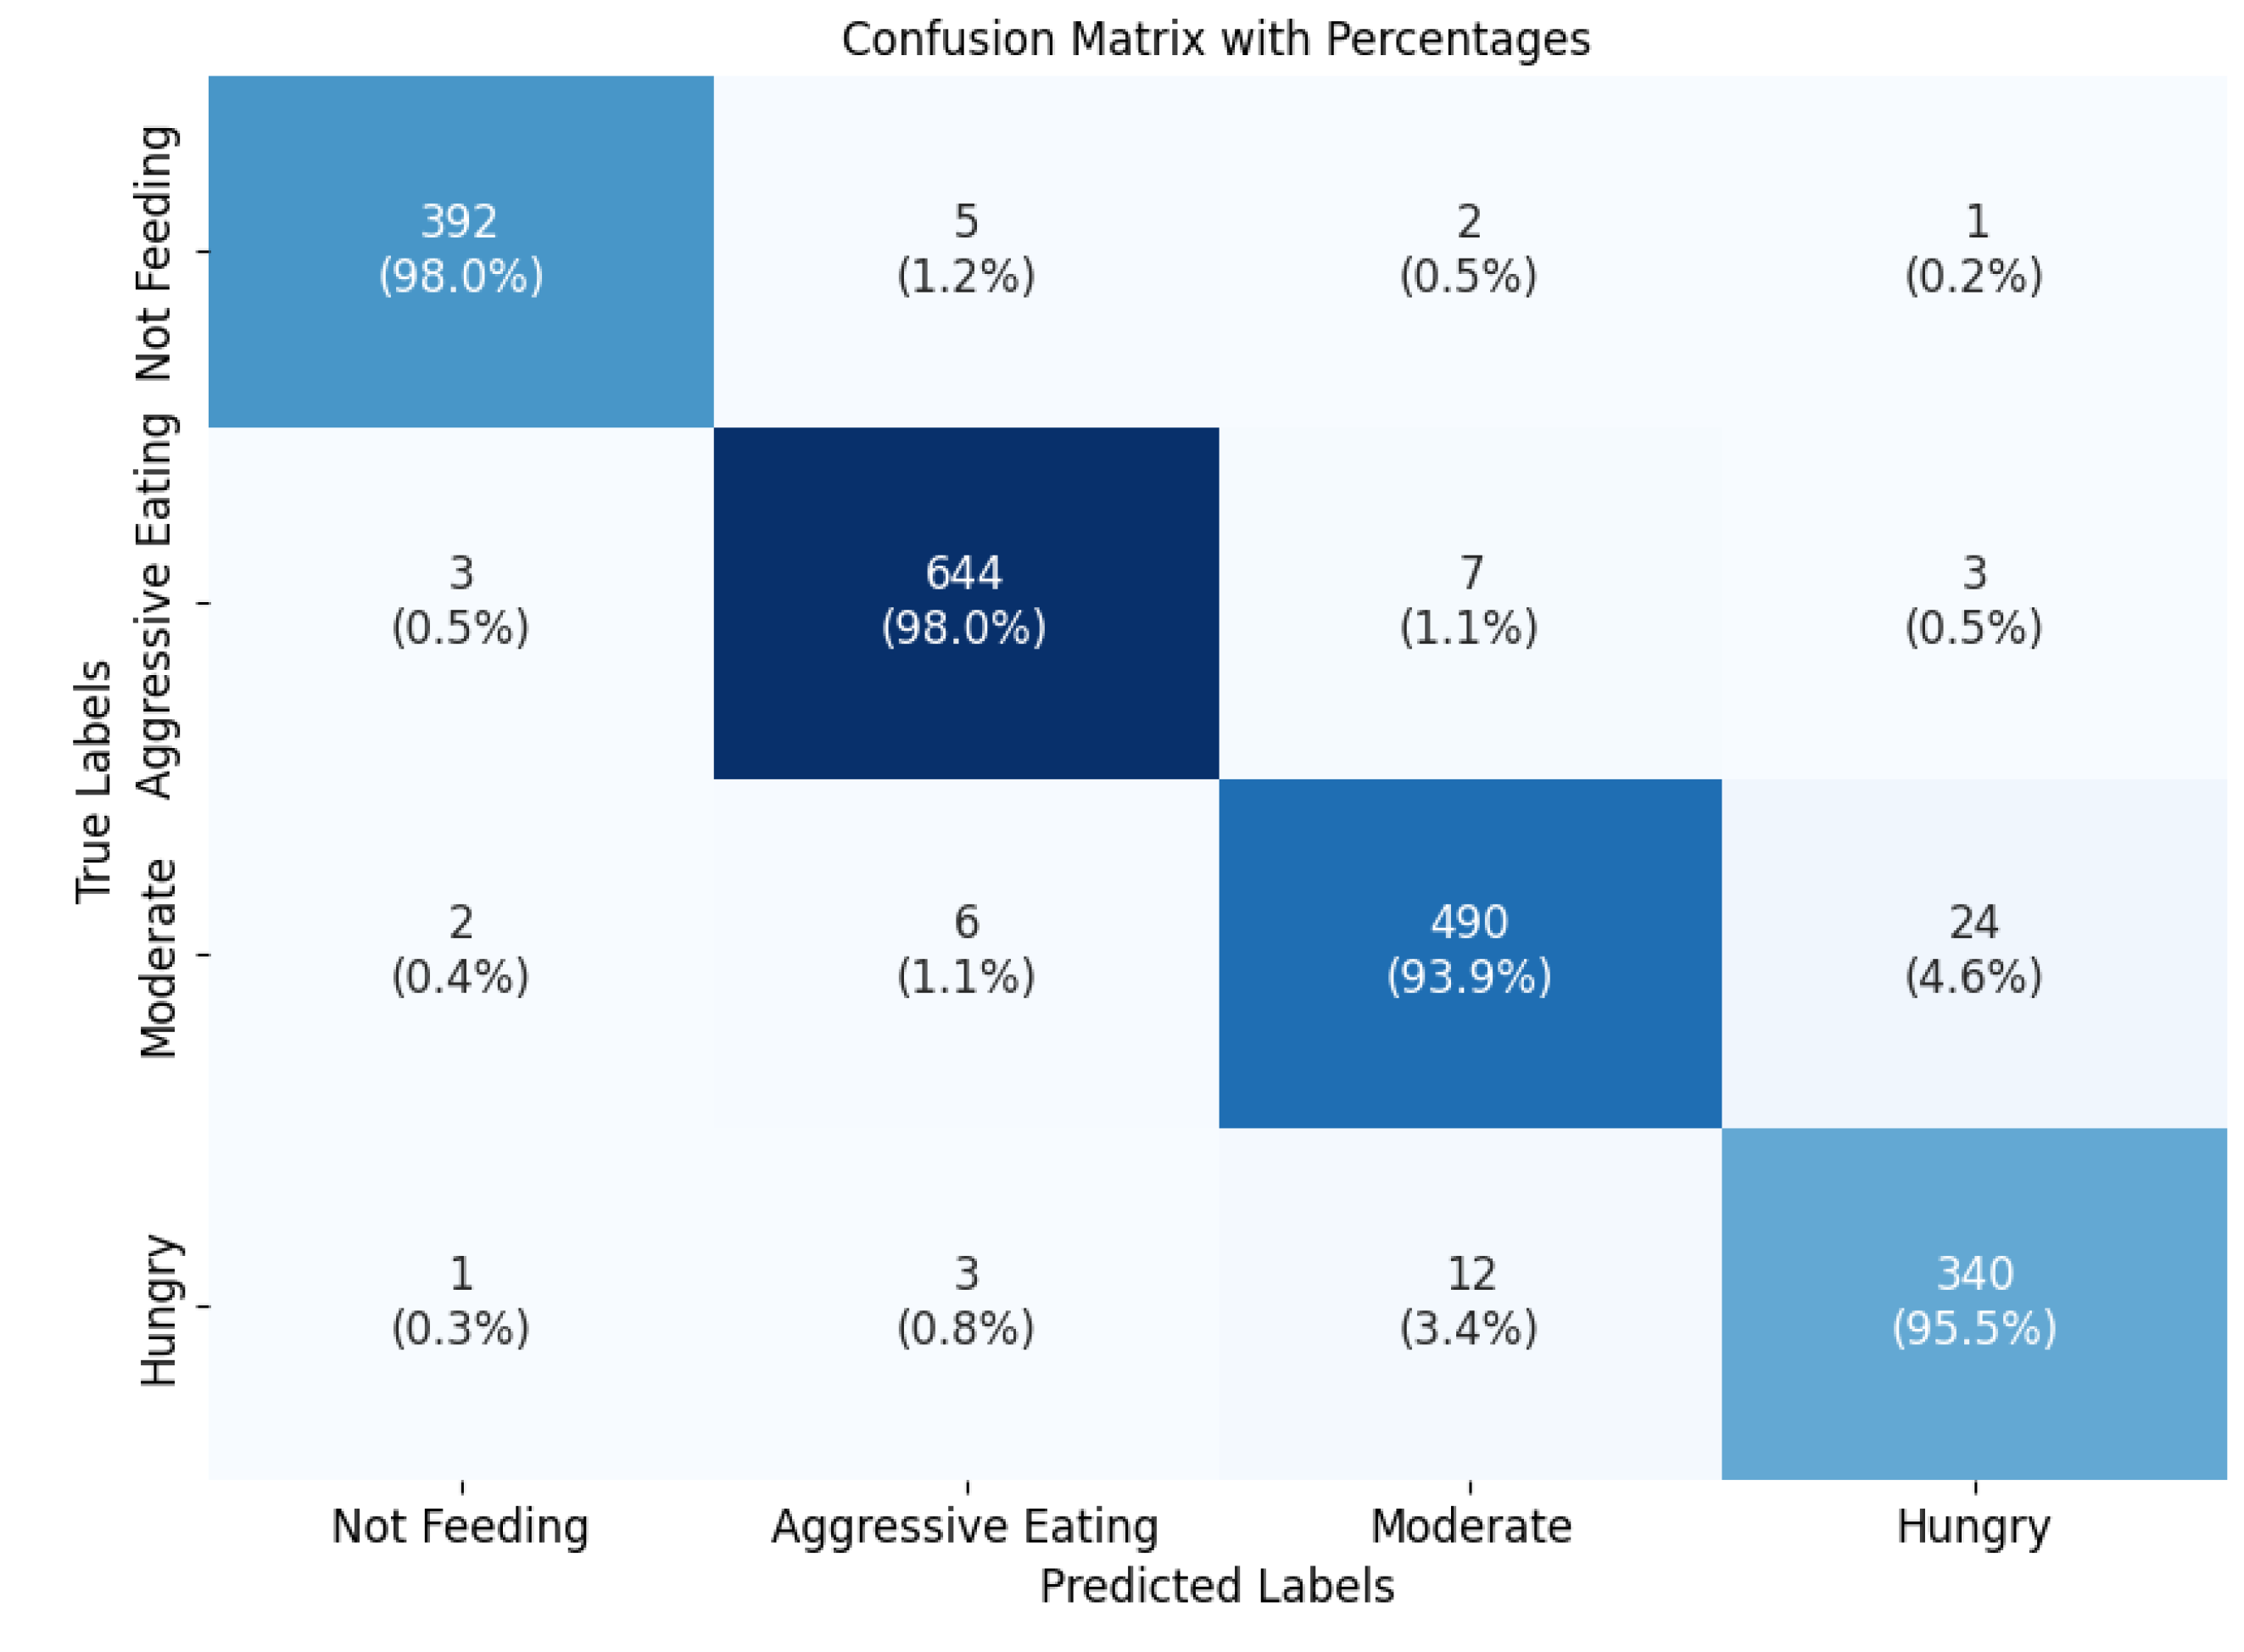
Figure 11.
Visual results of the model’s recognition performance for fish feeding behaviours. This figure showcases a selection of images illustrating the model’s ability to accurately identify various fish feeding behaviours, including examples of successful classifications and instances of misclassification.
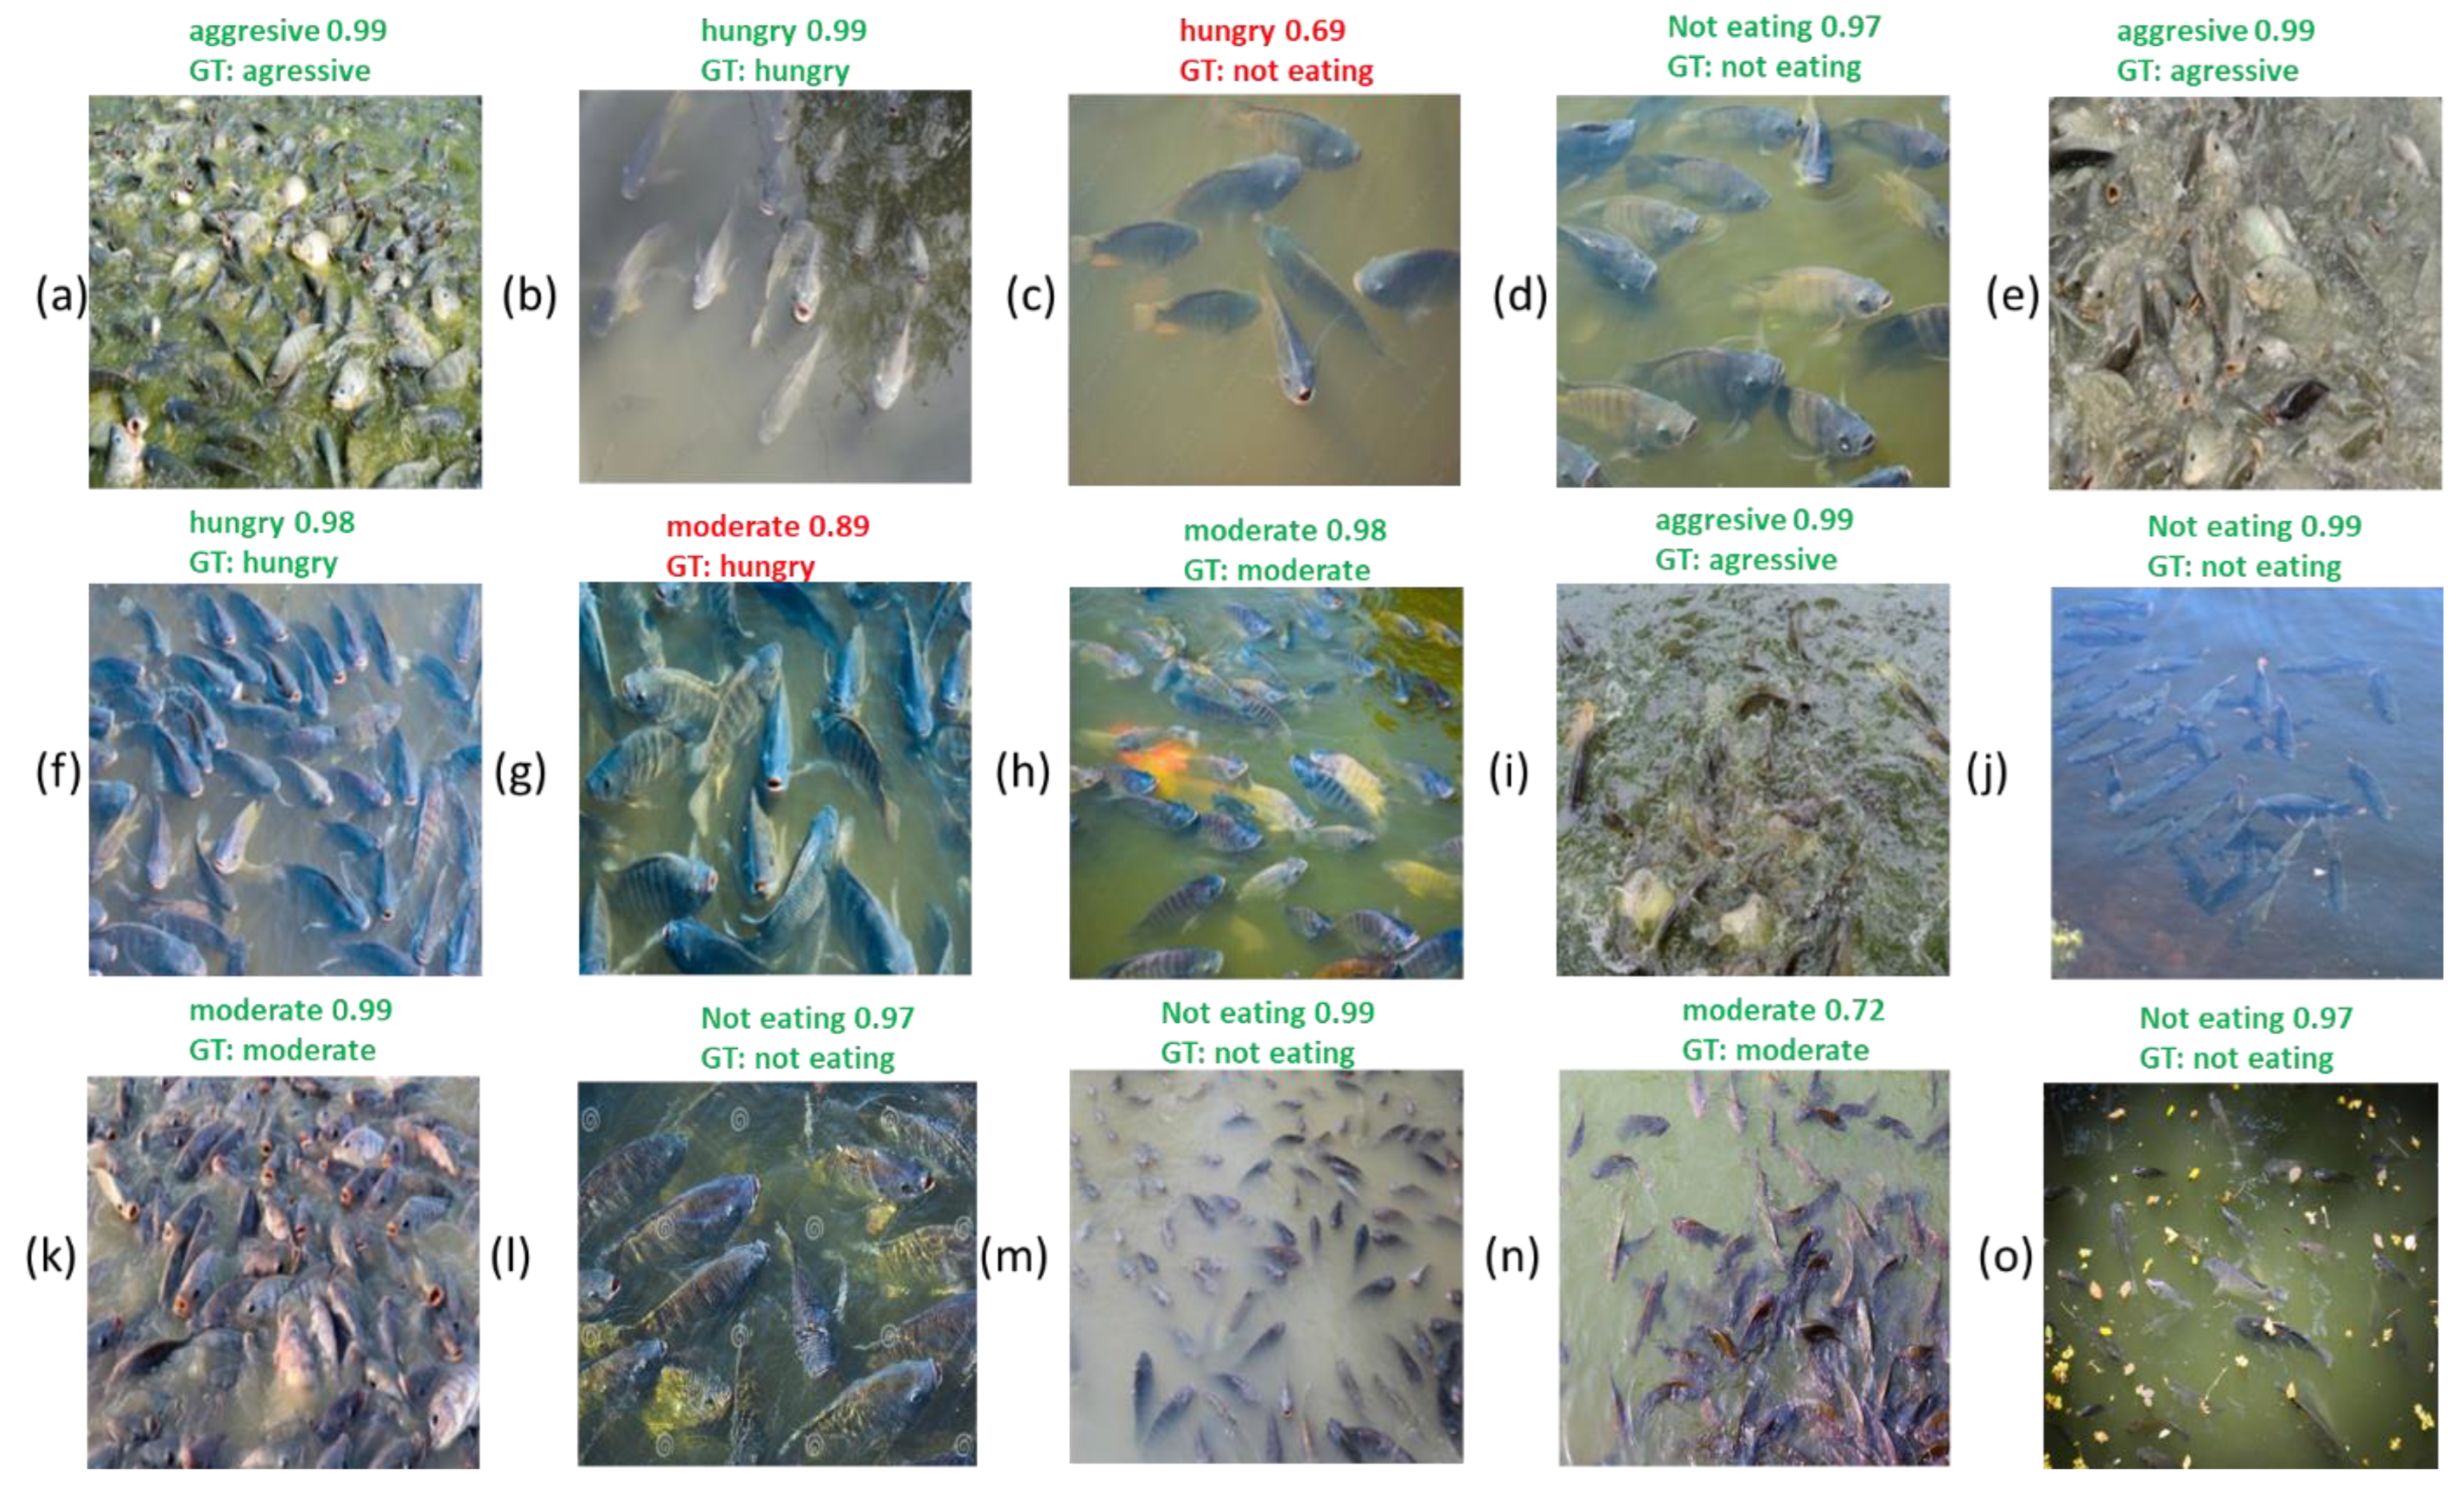
Figure 12.
XAI visualisation generated by LIME for two images misclassified by the VLM model as hungry, where the Ground truths (GT) are moderate and not eating for (a) and (b), respectively. LIME show that the fish head above water and open mouth are features (marked yellow) for a hungry fish.
Figure 12.
XAI visualisation generated by LIME for two images misclassified by the VLM model as hungry, where the Ground truths (GT) are moderate and not eating for (a) and (b), respectively. LIME show that the fish head above water and open mouth are features (marked yellow) for a hungry fish.
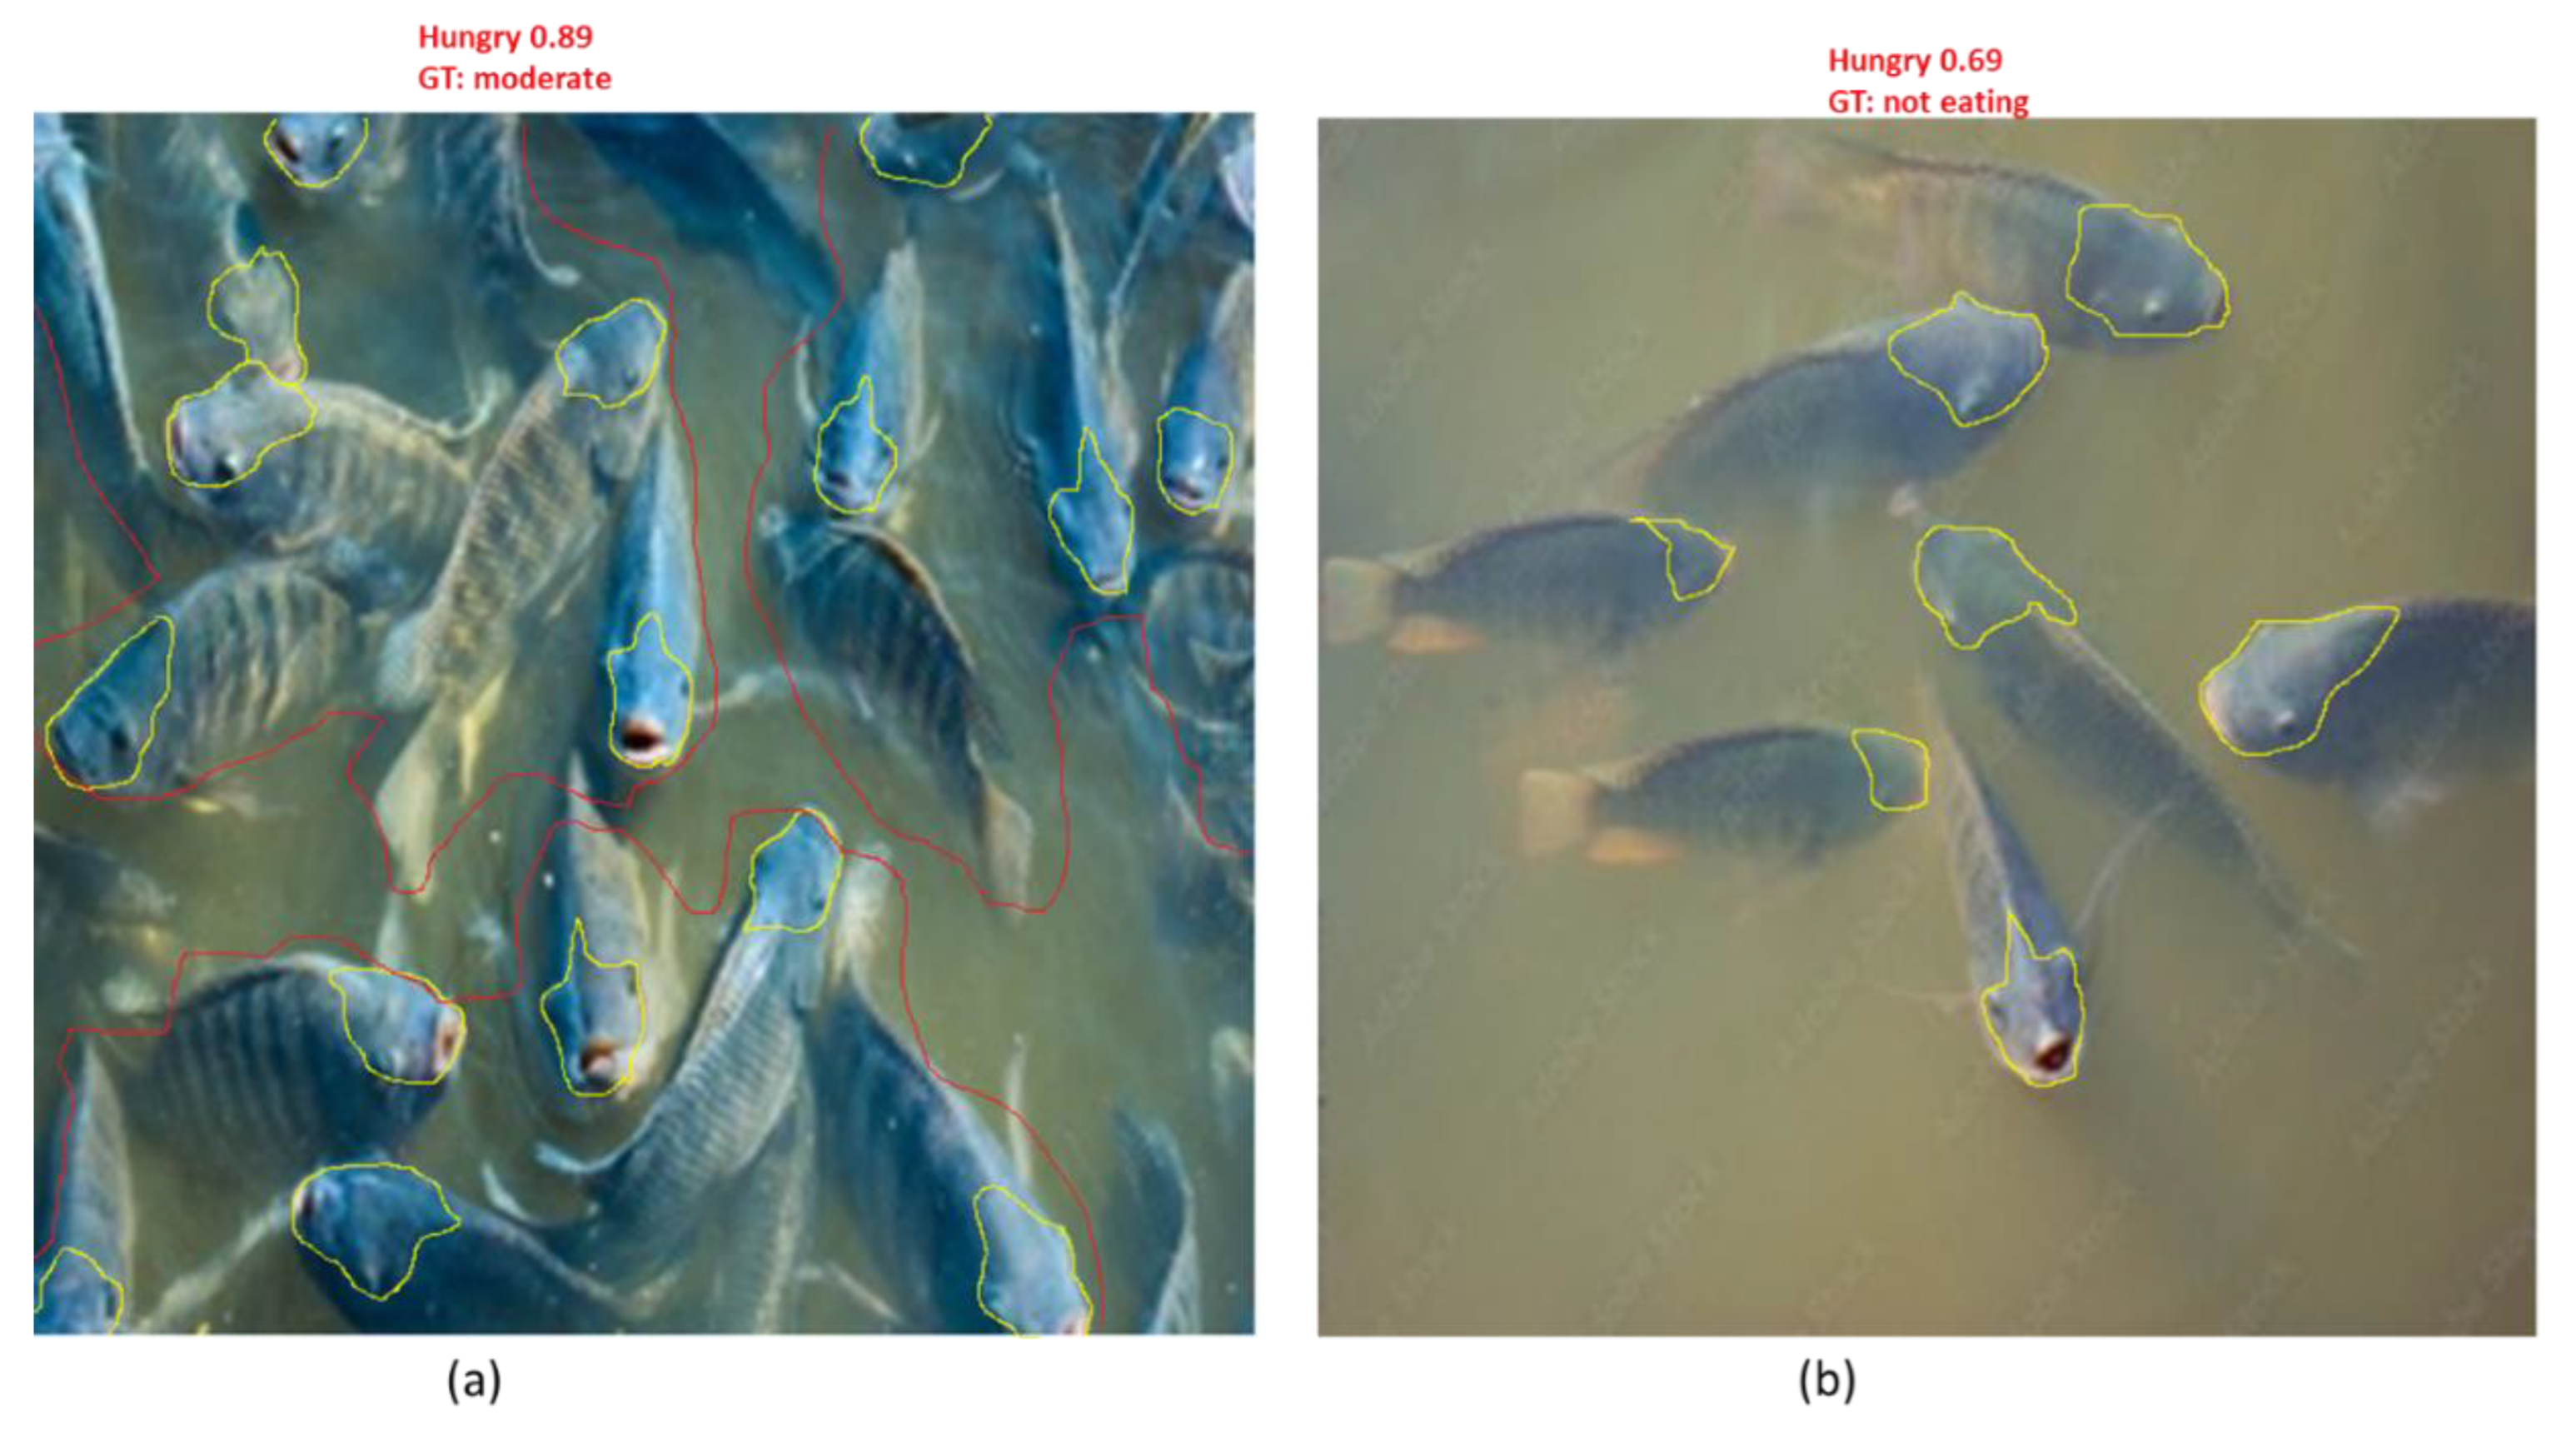

Table 1.
Table summarizing the different fish feeding behaviours, their descriptions, and an illustration of the image for each behaviour:.
Table 1.
Table summarizing the different fish feeding behaviours, their descriptions, and an illustration of the image for each behaviour:.
| Feeding Behaviour | Description | Image |
|---|---|---|
| Hungry Behaviour | “The fish are actively swimming near the surface, showing signs of agitation and increased movement. They frequently dart towards the surface in anticipation of food, often creating small splashes.” | 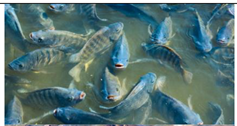 |
| Moderate Feeding | “The fish exhibit steady, deliberate movements as they feed. They are consuming food at a consistent pace, occasionally pausing to observe their surroundings while remaining close to the feeding area.” | 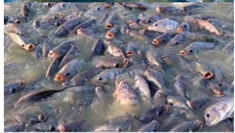 |
| Aggressive Feeding | “The fish display high energy levels, competing aggressively for food. They rapidly chase after food particles, displaying bursts of speed and occasional jumps out of the water as they attempt to seize the food.” | 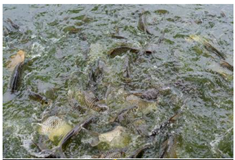 |
| Not Eating | “The fish remain near the bottom of the pond, showing little interest in the food being offered. They swim slowly and seem more focused on their surroundings than on feeding, often ignoring food that is presented.” | 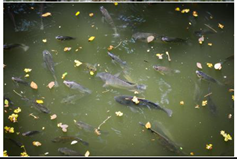 |
Table 2.
Key hyperparamters for the multi-head CLIP model for Bisomass and Fish feeding behaviour recognition.
Table 2.
Key hyperparamters for the multi-head CLIP model for Bisomass and Fish feeding behaviour recognition.
| Hyperparameter | Description | Used Value/Range |
|---|---|---|
| Learning Rate | Initial rate for the optimizer | 1e-4 |
| Batch Size | Number of training examples used in one iteration | 2 |
| Number of Epochs | Total passes over the entire dataset | 20 to 100 |
| Weight Decay | L2 regularization parameter | 1e-4 to 1e-5 |
| Optimizer | Algorithm for training | Adam |
| Loss Function for Biomass | Loss function for biomass estimation | Mean Squared Error (MSE) |
| Loss Function for Behaviour | Loss function for classification | Cross-Entropy Loss/InfoNCE |
| Temperature . | A scaling factor used in the contrastive loss function | 0.7 |
| Dropout Rate | Probability of dropout in layers | 0.3 to 0.5 |
| Learning Rate Scheduler | Schedule for adjusting learning rate | Step Decay, ReduceLROnPlateau |
| Input Image Size | Resized dimensions of input images | 224x224 pixels |
| Hidden Layer Dimensions | Size of hidden layers in task heads | 128 neurons |
| Number of Classification Head Layers | Number of layers in the classification head | 3 layers |
| Activation Function | Non-linear activation function for the heads | ReLU |
| Feature Size | Dimensionality of the output from encoders | 512 |
| Training Strategy | Multi-task training (yes/no) | Yes |
| Data Augmentation Techniques | Techniques applied during training | Random crops, flips, color jittering |
| Early Stopping Patience | Epochs to wait for improvement before stopping | 5 to 10 epochs |
| Cross-validation K | Number of folds for K-fold cross-validation | 5 |
Table 3.
Performance evaluation of the fish feeding recognition model.
| Metric | Not Feeding | Aggressive feeding | Moderate | Hungry | Average |
|---|---|---|---|---|---|
| Precision | 0.97 | 0.98 | 0.96 | 0.95 | 0.965 |
| Recall | 0.95 | 0.97 | 0.94 | 0.93 | 0.965 |
| F1-Score | 0.96 | 0.975 | 0.95 | 0.94 | 0.965 |
| Accuracy | 0.98 | 0.98 | 0.98 | 0.98 | 0.98 |
Table 4.
Daily Fish Growth Rates.
| Parameter | Control Group (Without System) | Experimental Group (With System) |
|---|---|---|
| Average Initial Weight (g) | 30 | 30 |
| Average Final Weight (g) | 250 | 310 |
| Average Daily Gain (g/day) | 1.2 | 1.5 |
| Growth Rate (%) | 317% | 933% |
Table 5.
Feed Savings and Cost Savings.
| Parameter | Control Group | Experimental Group |
|---|---|---|
| Total Feed Consumed (kg) | 4000 | 2900 |
| Feed Saved (kg) | N/A | 1100 |
| Average Cost of Feed ($/kg) | 1.50 | 1.50 |
| Total Feed Cost ($) | 6000 | 4350 |
| Total Cost Savings ($) | N/A | 1650 |
Table 6.
Feed Conversion Ratio (FCR).
| Parameter | Control Group | Experimental Group |
| Total Weight Gain (kg) | 1000 | 1550 |
| FCR | 4.0 | 1.87 |
Table 7.
Environmental Effects.
| Parameter | Control Group | Experimental Group |
|---|---|---|
| Average Ammonia Levels (mg/L) | 1.2 | 0.7 |
| Average Dissolved Oxygen (mg/L) | 5.0 | 6.5 |
| Water Temperature (°C) | 24.5 | 24.5 |
| Algal Growth (1-10 scale) | 7 | 3 |
Table 8.
Summary of Improvements.
| Metric | Improvement (%) |
|---|---|
| Daily Fish Growth | 25% |
| Feed Savings | 27.5% |
| Cost Savings | 27.5% |
| Feed Conversion Ratio | 53% |
| Ammonia Reduction | 41.67% |
| Dissolved Oxygen Improvement | 30% |
| Algal Growth Reduction | 57% |
Table 9.
Results of the ablation studies.
| Component | F1-Score Improvement | Precision Improvement | Accuracy Improvement | Recall Improvement |
|---|---|---|---|---|
| Fine-tuning | +5% | +4% | +6% | +5% |
| Using ViT as Visual Encoder | +7% | +6% | +8% | +7% |
| Effect of Enhanced Images | +6% | +5% | +7% | +6% |
| Enhanced Textual Descriptions | +4% | +5% | +5% | +4% |
Disclaimer/Publisher’s Note: The statements, opinions and data contained in all publications are solely those of the individual author(s) and contributor(s) and not of MDPI and/or the editor(s). MDPI and/or the editor(s) disclaim responsibility for any injury to people or property resulting from any ideas, methods, instructions or products referred to in the content. |
© 2025 by the authors. Licensee MDPI, Basel, Switzerland. This article is an open access article distributed under the terms and conditions of the Creative Commons Attribution (CC BY) license (http://creativecommons.org/licenses/by/4.0/).
Copyright: This open access article is published under a Creative Commons CC BY 4.0 license, which permit the free download, distribution, and reuse, provided that the author and preprint are cited in any reuse.


