
Submitted:
10 July 2025
Posted:
11 July 2025
You are already at the latest version
Abstract
This study examined the challenges associated with unilateral hearing loss (UHL), focusing on speech-in-noise comprehension, spatial hearing, and cognitive effort, and aimed to advance clinical assessments and inform personalized interventions for individuals with UHL. Sixteen adults with UHL and sixteen with normal hearing (NH) completed a mixed-methods assessment, including standardised patient-reported outcome measures, reaction time tasks, speech-in-noise comprehension tests, and head movement tracking. Hearing experiences were evaluated using the Speech, Spatial, and Qualities of Hearing Scale (SSQ12) and the Social Participation Restrictions Questionnaire (SPaRQ). Listening effort was estimated via reaction times during an auditory task, while speech comprehension in noise was assessed using the National Acoustic Laboratories Dynamic Conversation Test (NAL-DCT). Behavioural strategies, such as head movements, were analysed during speech comprehension tasks. Compared to the NH group, participants with UHL showed significantly poorer SSQ12 and SPaRQ scores, longer reaction times in noisy conditions, and moderately reduced speech-in-noise performance, achieved at the expense of greater cognitive exertion. Head movement analysis indicated a compensatory tendency to orient towards the worse ear. A predictive model combining reaction times and self-reported hearing difficulties accounted for 68% of the variance in speech-in-noise comprehension (adjusted R2=0.68, p=0.0002). These findings highlight the impact of UHL on auditory function, cognitive load, and social participation. Ecologically valid measures such as the NAL-DCT and head tracking offer valuable insight into real-world listening challenges. The observed compensatory behaviours suggest the importance of clinical interventions that support spatial orientation strategies to enhance communication and quality of life in individuals with UHL.
Keywords:
unilateral hearing loss (UHL)
; single-sided deafness (SSD)
; real-world assessment
; head movement tracking
; listening effort
1. Introduction
Approximately 7.2% of adults in the general population experience unilateral hearing loss (UHL), sometimes called single-sided deafness (Golub et al., 2018). Various definitions of UHL exist, often specifying different hearing thresholds for the affected ear (see Golub et al., 2018). In this study, UHL is defined as having normal hearing (25 dB hearing level pure tone average, dB HL PTA, across 0.5, 1, 2 and 4 kHz) in one ear, and at least moderate hearing loss (40 dB HL PTA) in the other ear.
The present study aims to characterise the hearing challenges and compensation strategies employed by individuals with UHL in real-world contexts, relative to those with normal hearing (NH). This research builds upon an exploratory study conducted at the National Acoustic Laboratories (Sydney, Australia), that used semi-structured interviews (n=14) and open-ended surveys (n=80) to examine the real-life impact of UHL on adults (Galloway et al., 2019). Findings from that study indicated that UHL significantly affects functional, psychological, and social aspects of life, leading individuals to adopt compensatory strategies such as lip reading, head positioning, and seeking quieter environments.
The primary functional challenges reported by Galloway et al. (2019) were difficulty understanding speech in noisy environments and problems with sound localisation. For instance, one participant noted, “I find it hard to listen when large groups of people are together and talking over each other,” while another stated “I have a hard time telling what direction sound comes from if I can’t see the source of the noise.” Many respondents also reported significant mental fatigue from the increased cognitive effort needed to communicate. This was summarised by one participant’s comment, “By the end of the meal, my brain is usually exhausted from trying to hear everyone.” These findings contribute to the growing body of evidence that unilateral hearing loss detrimentally affects spatial hearing, speech comprehension in noisy environments, and increases cognitive fatigue, consistent with earlier research findings (Hawley et al., 2004; Douglas et al., 2007; Iwasaki et al. 2013; Dwyer et al., 2014; Lucas et al. 2018; Kumpik and King, 2019; Newman et al., 1997; Svobodová et al., 2025; Van Heteren et al., 2025).
In addition to functional impacts, participants in the Galloway et al. (2019) study highlighted psychological and social consequences, including anxiety, fear of further hearing deterioration, and diminished self-esteem. Many expressed concerns about potential social abandonment should their hearing decline further; one participant stated, “I fear my good ear getting bad and all my friends and family slowly dropping me out of their lives.” Social anxiety was common, driven by fears of being judged or misunderstood, leading to feelings of disconnection and depression. For example, a participant noted, “I think the social isolation is the worst. I very rarely socialise in noisy environments as it’s just too stressful and difficult.” These social and psychological effects align with other studies reporting that UHL can increase stress, limit social engagement, and reduce quality of life (Wie et al., 2010; Subramaniam et al., 2005; Dwyer et al., 2014; Iwasaki et al., 2013).
Given the identified functional, psychological, and social impacts of UHL, there is a need for characterising these specific challenges and compensatory mechanisms employed by affected individuals in everyday environments, beyond standard clinical audiology assessments. The specific objectives of this research were:
- To design a new test battery and evaluate its sensitivity to the relevant impacts and compensation strategies reported by UHL individuals, including their speech-in-noise comprehension, cognitive load, head movements in noise, and self-reported hearing experiences.
- To identify the main predictors of speech-in-noise comprehension performance.
Achieving these objectives would be significant for both research and clinical applications. Accurately characterising the impact of UHL can inform targeted interventions and support the development of compensatory tools to improve hearing support strategies. Clinically, identifying the predictors of speech-in-noise comprehension can assist in personalising management, ultimately enhancing communication and quality of life for individuals with UHL.
2. Materials and Methods
2.1. Ethics
The study protocols adhered to World Medical Association’s Declaration of Helsinki on ethical principles for medical research involving human subjects. Approval was granted by the Hearing Australia Human Research Ethics Committee (EC00109, Ref. AHHREC2019-8). Informed consent was obtained from all participants prior to their inclusion in the study.
2.2. Participants
Participants were recruited from the National Acoustic Laboratories (NAL, Sydney, Australia) Research Participants Database (a register of people who have given their consent to be invited to participate in NAL research); Hearing Australia clients (a government-funded hearing service provider); local hearing clinics; staff and students from NAL and Macquarie University (Sydney, Australia); and through advertisements on social media and the Macquarie University campus. The study involved participants with normal hearing (NH) and unilateral hearing loss (UHL).
Inclusion criteria for both groups were: 18 years of age or older and native English speakers. For NH participants, air conduction pure-tone average audiometry (PTA) required a four-frequency hearing threshold average across 0.5, 1, 2 and 4 kHz of 25 dB or better in both ears. For UHL participants, hearing in the better ear met the same criterion as the NH participants, with hearing loss of 40 dB HL or greater in the worse ear across 0.5–4 kHz.
Air- and bone-conduction pure-tone audiometry was measured using the AC40 clinical audiometer (Interacoustics A/S, Middelfart, Denmark) in a soundproof booth. Air-conduction thresholds were estimated at 0.125, 0.25, 0.5, 1, 1.6, 2, 4, and 8 kHz; and bone-conduction thresholds at octave frequencies from 0.25 to 4 kHz.
Sixteen NH (12 females, 18—70 years, mean ± SD = 37.2 ± 19.5 years) and 16 UHL (6 females, 25—75 years, mean ± SD = 51.9 ± 15.6 years) participants met the inclusion criteria and completed the study. In the UHL group, four participants reported that their hearing loss was either congenital or acquired during the first four years of age, four participants in the 4—10 year age range, and the remaining eight participants during their adulthood. One participant presented conductive hearing loss, while the others had sensorineural hearing loss. Eleven UHL participants presented hearing loss in the left ear. The origin of their hearing loss varied among participants, including mumps, meningitis, measles, influenza, Meniere’s disease, acoustic neuroma, otosclerosis, or damaged auditory nerve. Eleven UHL participants presented profound hearing loss (PTA greater than 90 dB HL), three had severe hearing loss (PTA between 71 and 90 dB HL), and two of them had moderate hearing loss (PTA between 40 and 55 dB HL). Participants’ demographic information, their individual hearing profiles, and air- and bone-conducted pure-tone audiometry hearing thresholds are available in Appendix A of the Online Supplemental Materials.
2.3. Experimental Protocol and Data Analysis
Participants attended a single, three-hour appointment at the Australian Hearing Hub (Sydney, Australia). Experimental testing was conducted in a fully anechoic chamber, using an array of 41 speakers spherically distributed in five rows. Figure 1 outlines the sequence of the experimental protocol, which included assessments of the participants’ hearing experience using standardised questionnaires, measurements of cognitive load during speech listening tasks in quiet and noisy background, head movement tracking during a speech-in-noise comprehension task, and self-perceived evaluations of hearing difficulties. The sections below detail the testing protocols and data analysis for these assessments. Data analyses were performed in MATLAB (The Mathworks Inc., Natick, MA), using functions from the ‘Statistics and Machine Learning’ toolbox. Data normality was evaluated via the Lilliefors statistical test, which is used to assess whether a sample comes from a normally distributed population when the population mean and variance are unknown (Lilliefors, 1967). Appendix B of the Online Supplemental Materials provides raw data and custom MATLAB scripts that re-generate figures and perform the statistical analyses presented in the Results section.
Standardised questionnaires. Participants’ self-perceived hearing difficulties and social participation restrictions were measured at home using an online survey prior to attending the test session. These measures comprised the short form of the Speech, Spatial and Qualities of Hearing Scale (SSQ12, Noble et al., 2013) and the Social Participation Restrictions Questionnaire (SPaRQ, Heffernan et al., 2018, 2019). The SSQ12 assesses individuals’ perceived hearing abilities in everyday life, providing insights into the practical impact of hearing on daily interactions and environmental awareness. It measures three key dimensions: (1) speech hearing—to assess the ability to understand speech in various listening conditions, such as in noise or in groups, (2) spatial hearing—to assess perception of sound direction, distance, and movement, helping to gauge how well individuals can locate sounds in their environment, and (3) qualities of hearing—to capture sound clarity, naturalness, and the ability to distinguish between sounds, reflecting the overall quality of auditory experience. The SPaRQ evaluates how hearing difficulties impact a person’s social engagement and sense of inclusion. It measures restrictions in social participation through two main subscales: (1) social behaviour—to assess the extent to which hearing challenges affect behaviours in social settings, such as joining conversations or participating in group activities, and (2) social perceptions—to evaluate the emotional and psychological responses to hearing difficulties in social contexts, including feelings of frustration, embarrassment, or isolation. Both measures were scored using an 11-point visual analogue scale ranging from 0 to 10, where higher scores on the SSQ12 indicate fewer difficulties, while higher scores on the SPaRQ reflect greater social participation restrictions. The scores reported by NH and UHL participants were statistically compared via two-sample t-tests.
Cognitive load. Participants’ cognitive load while listening to speech in noise, also known as listening effort, was quantified via an auditory reaction time (RT) test based on a single task (McGarrigle et al., 2014). Participants were presented a sequence of random monosyllabic digits (i.e., those from 0, pronounced as /oh/, to 10, excluding 7) every 1.5 seconds, and were instructed to press a key as soon as they heard two consecutive ascending digits (i.e., an event), such as 4 followed by 5. Test duration was 2 minutes per run, and a total of 8 events were presented per run. Performance was scored in terms of their reaction time for each positive answer. Digits were presented at 72 dB SPL from two speakers situated in front of the participant, at ±22.5◦ angle. Noise consisted of 8-talker babble noise, delivered from the array of 41 speakers. Three repetitions were tested at different time points of the experimental protocol, being the first one in quiet, and the remaining two at a signal-to-noise ratio (SNR) of 0 dB. Since RT scores did not follow a normal distribution, the effects of Background (i.e., quiet vs. noise) and Hearing (NH vs. UHL) on RT were simultaneously characterised via a generalised linear mixed-effects (GLME, Bolker et al., 2009) model, which offers the advantage of accounting for repeated measures and provide robustness against missing and unbalanced data (McCullagh and Nelder, 1989). In this model, reaction time was treated as the dependent variable, background and hearing conditions as independent variables, and participants as a random effect. As RT scores consisted of positive numbers, a Gamma distribution family was used with as link function, and as inverse link function.
Speech-in-noise comprehension. This was evaluated using the National Acoustic Laboratories Dynamic Conversation Test (NAL-DCT) that assesses listening comprehension in realistic, dynamic settings (Best et al., 2016, 2018). The test used background noise resembling a busy cafeteria, sourced from the Ambisonics Recordings of Typical Environments (ARTE) database (Weisser et al., 2019), played at 72 dB SPL through an array of 41 speakers. Target speech featured a conversation between two Australian English speakers, and its material was obtained from the International English Language Testing System (IELTS) English test. The two talkers were presented from speakers positioned at 45◦ and 22.5◦ azimuth relative to the participants’ worse and better hearing ears, respectively. This asymmetrical setup accentuated the contribution of the worse ear, promoting reliance on binaural cues and encouraging compensatory head orientation, thereby increasing the test’s sensitivity to the hearing impairments in individuals with UHL. For participants with normal hearing, speaker positions were randomised between the two possible configurations (-22.5◦ and 45◦, or 22.5◦ and -45◦). Speech was delivered at 0 dB SNR to simulate an authentic speech-in-noise setting. Participants listened to six conversations in noise (3—4 minutes each). Each conversation was split into three parts, and after each part they were asked 3—4 multiple-choice questions that assessed their comprehension, with a total of 10 questions per conversation, and scores expressed as percentage correct. The first three conversations were included in Set 1 of the experimental protocol, and the remaining three in Set 2. As NAL-DCT scores followed a normal distribution, comprehension performance between the NH and UHL groups was compared using a linear mixed-effects model (LME, Meteyard and Davies, 2020), with NAL-DCT score as the dependent variable, hearing group (NH vs. UHL) as the independent variable, and participants as a random effect.
Head movement tracking. Head movements were measured during the NAL-DCT speech-in-noise comprehension task using the InterSense InertiaCube® 4 (Thales Defense & Security, Inc., Billerica, MA)—a compact inertial measurement unit that tracks three-dimensional orientation and motion with accelerometers, gyroscopes, and magnetometers. To simulate real-world conditions where visual information influences head movement (Hendrikse et al., 2018), blue LEDs on the loudspeakers indicated the real-time active talker’s position. The head tracker was secured on participants’ heads with a headband, and MATLAB software synchronised the audio stimuli with head movement data acquisition, sampled at 44100 Hz. Head movement was analysed with a histogram showing the percentage of time spent at each head orientation angle, with positive angles indicating the better hearing ear. Signal processing steps included (1) downsampling the azimuth orientation data to 4410 Hz, (2) inverting the orientation data for UHL participants with their worse ear on the right, (3) removing the first and last 5 seconds to exclude non-task movements, and (4) creating a histogram with a 2.5◦ resolution. Due to technical issues or calibration errors, 23 files from the NH group and 15 files from the UHL group were excluded from analysis, leaving 154 usable files (i.e., 16 participants/group * 2 groups * 6 files/participant – 23 NH files – 15 UHL files).
Self-report of hearing difficulties. After completing each set of three conversations in the NAL-DCT speech-in-noise comprehension task, participants rated various aspects of their hearing experience using a 10-item survey: (1) How noisy is it? (2) How much of the talker’s speech can you understand? (3) How much does the noise interfere with your ability to listen to the talker/s? (4) Does your hearing restrict your ability to listen to the talker/s? (5) How annoying is this listening environment? (6) How frustrated do you feel? (7) How demanding is it to listen to the talker? (8) How mentally tired do you feel? (9) When the talking moves from one speaker to the other, do you miss the start of what is being said? (10) How confident are you that you can tell where the talker is coming from? Responses were recorded on five-level Likert scales, with higher scores indicating greater hearing difficulties, except for questions 2 and 10, which were reverse-scored. Anchors for each response level of every question are provided in Appendix B of the Online Supplemental Materials. The scores for each set were averaged to produce a single score per group, with comparisons between groups conducted using two-samples -tests.
Predictive model. To address the study’s second research objective, we identified key predictors of speech-in-noise comprehension in the UHL group. We developed several linear regression models using the NAL-DCT score as the outcome variable, with all possible combinations of participants’ reaction time in the noise background condition and averaged scores from up to three questions on the self-perceived hearing handicap survey, and the model providing the best fit in terms of the adjusted-R2 score was selected.
3. Results
3.1. Standardised Questionnaires
Figure 2 presents the mean and standard error of the mean for the global scores and subscales of the SSQ12 and the SPaRQ for the NH and UHL groups. Two-samples t-tests revealed significant differences (p < 0.001) between the two populations for all metrics. NH individuals reported minimal hearing difficulties and social participation restrictions. In contrast, UHL participants reported greater challenges with speech understanding (SSQ12, Speech); sound direction, localisation, and distance perception (SSQ12, Spatial); hearing clarity, naturalness, and effort (SSQ12, Qualities); performing tasks in social contexts due to hearing issues (SPaRQ, Social behaviour); and emotional comfort and confidence (SPaRQ, Social perception).
3.2. Cognitive Load
Figure 3 shows the median reaction times in quiet and two noise background conditions for both groups. The mean of participants’ median reaction times for each condition are shown below the distributions. The effects of background (quiet vs. noise) and group (NH vs. UHL) conditions using the generalised mixed-effects model are shown in Table 1. Background noise increased reaction times by 111 ms (calculated as , ). The UHL group presented reaction times 103 ms longer than the NH group (calculated as , ). Reaction time differences between the two noise conditions were not statistically significant ().
3.3. Speech-in-Noise Comprehension
3.4. Head Movement
Figure 5 shows the combined histogram of head movements during the NAL-DCT speech-in-noise comprehension test for the NH and UHL groups. Positive angles represent head orientation towards the better-hearing ear, while negative angles indicate orientation towards the worse-hearing ear. Vertical green lines show the speaker positions, located at 22.5◦ azimuth on the better ear and 45◦ on the worse ear. On average, NH participants maintained head orientations with a mean ± standard deviation of -4.3◦ ± 10.4◦, while UHL participants showed -36.2◦ ± 20.4◦. This suggests that, despite the asymmetrical speaker placement, NH individuals primarily kept their heads centred, relying on binaural hearing cues for minimal movement. In contrast, UHL participants exhibited greater head tilting towards their poorer ear and had to orient their better ear towards each speaker, resulting in more pronounced head movements.
3.5. Self-Report of Hearing Difficulties
Figure 6 shows responses from the NH and UHL groups to ten questions about their hearing experience during the NAL-DCT speech-in-noise comprehension test. UHL participants reported poorer outcomes across all measures compared to the NH group, including greater perceived noise, reduced speech understanding, increased listening effort and fatigue, and more difficulty with spatial hearing and following conversations.
3.6. Predictive Model
Figure 7 shows the linear regression model predicting the NAL-DCT score (% correct) in the UHL group based on a combination of their reaction time in the noise background condition and their average scores for questions 3 (noise interference), 6 (frustration), and 9 (missing the start of sentences) from the self-report of hearing difficulties survey. The model was statistically significant (), explaining 68% of the variability in NAL-DCT scores (adjusted-R2). Table 3 presents the estimated coefficients of the model, using normalised (z-score) input data. Both reaction time and the selected survey questions made similar contributions to the model, with both effects being statistically significant.
4. Discussion
UHL is a prevalent condition, affecting approximately 7.2% of adults globally (Golub et al., 2018). While traditional audiological evaluations such as pure-tone audiometry provide foundational diagnostic insights, they fail to capture the broader functional, psychological, and social challenges faced by individuals with UHL in real-world environments. This study addresses these gaps by integrating subjective and behavioural measures to comprehensively characterise the hearing deficits, cognitive load, and compensation strategies employed by UHL individuals. Main findings revealed that participants with UHL experienced greater listening effort, poorer speech-in-noise comprehension, and relied on head orientation as a compensatory strategy. These findings highlight critical implications for everyday communication, as the observed reliance on compensatory head movements underscores not only the spatial hearing deficits caused by UHL but also the associated cognitive and social challenges. This emphasizes the importance of designing interventions and communication strategies that account for these adaptations, with the potential to mitigate broader impacts on social participation and quality of life.
A significant strength of this study lies in the ecological validity of its methods. The National Acoustic Laboratories Dynamic Conversation Test (NAL-DCT) was employed to evaluate speech-in-noise comprehension in a realistic, dynamic listening environment. This approach improves upon traditional clinical speech testing by replicating the complex auditory conditions encountered in daily life, such as simultaneous conversations in noisy settings. Additionally, the use of head movement tracking provides a novel perspective on behavioural adaptations, highlighting the active strategies employed by UHL individuals to compensate for their deficits. The integration of these methods facilitates the interpretability of results in real-world contexts, bridging the gap between laboratory findings and everyday experiences.
The results revealed that UHL participants face significant challenges across multiple domains, as shown by their performance on the SSQ12 and SPaRQ questionnaires. The SSQ12 highlighted significant difficulties in speech understanding, spatial hearing, and social participation, consistent with previous findings using the longer SSQ19 questionnaire in UHL populations (Dwyer et al., 2014). Furthermore, the UHL group in this study reported lower SSQ12 global scores (mean = 4.31) than those reported by Dalla Costa et al. (2019) for individuals with mild-to-severe unilateral hearing loss using hearing aids (mean = 7.53), highlighting the potential benefit of amplification. Notably, the present study is the first to apply the SPaRQ questionnaire to a UHL population, providing novel insights into the social and psychological impacts of this group. The findings align with prior research that has shown that UHL negatively affects quality of life, leading to increased social withdrawal, anxiety, and reduced self-esteem (Lucas et al., 2018; Wie et al., 2010).
The cognitive load assessments demonstrated that UHL individuals experience significantly longer reaction times during speech-in-noise tasks, reflecting greater listening effort. While speech-in-noise comprehension scores were not substantially poorer than those of normal-hearing (NH) participants, these performances were achieved at the cost of greater cognitive exertion and the use of compensatory mechanisms, such as increased reliance on their better ear and strategic head movements. This aligns with previous findings by Sarampalis et al. (2009), who demonstrated that even when speech intelligibility remains stable, increased background noise can impose greater cognitive load. Similar findings have been reported in previous studies, which noted the increased cognitive fatigue associated with UHL (Douglas et al., 2007; Newman et al., 1997).
Head movement tracking during the NAL-DCT revealed significant head tilts towards the worse ear among UHL participants, highlighting their reliance on behavioural adaptations to compensate for spatial hearing deficits (Grange and Culling, 2016). UHL participants moved their heads considerably more than NH individuals, often seeking the auditory-optimal position, even to an extent that might be considered socially inappropriate in typical conversational settings. This exaggerated head movement is likely influenced by the experimental setup, which lacked visual cues such as lip reading or facial expressions and removed concerns about social conventions, allowing participants to prioritize auditory input. Interestingly, while UHL participants often tilted their heads towards the worse ear, they did not turn their heads fully to align with the loudspeakers' positions, as described by Brimijoin et al. (2011). Instead, they adopted a compromise position that facilitated switching attention between the two speakers. Additionally, head tracking data revealed that UHL participants frequently returned to a 0° azimuth position, possibly because this was the setup's initial position and might have been perceived as the default or "normal" orientation for recording responses between conversations. These findings emphasize the importance of exploring head movement behaviours in more naturalistic settings with visual and social cues to validate and refine these observations.
A predictive model was developed to estimate speech-in-noise comprehension using a combination of reaction time and responses to three targeted survey questions. This model explained 68% of the variance in performance among UHL participants, underscoring the potential of these tests as a quick and accessible tool for assessing real-world auditory challenges in clinical settings. The model of the brief auditory task followed by targeted questions returns a continuous score reflecting expected speech-in-noise comprehension, which could be used to flag individuals at risk of functional hearing difficulties. The model’s scalability, particularly its potential integration into mobile apps, highlights its potential translational value. By enabling remote assessments, this tool could facilitate early identification of unilateral hearing difficulties, and which could lead to more timely rehabilitation.
Despite these strengths, the study’s modest sample size limits the generalisability of its findings. Larger and more diverse cohorts are needed to look at the repeatability of this study’s findings, validate the predictive model prior to clinical application, and explore individual differences within the UHL population—such as variations between congenital and acquired UHL, or the influence of age at onset. Understanding these factors is crucial for developing personalised recommendations and targeted interventions. Additionally, exploring the impact of UHL on specific subgroups, such as children or older adults, could provide further insights into its developmental and age-related effects.
The findings also have significant implications for rehabilitation. Currently, only 2% of individuals with UHL use hearing aids or assistive devices (Golub et al., 2018), highlighting a critical gap in service uptake. By demonstrating the multifaceted challenges faced by UHL individuals—including increased listening effort, spatial hearing deficits, and reliance on compensatory head movements—this study underscores the need for more comprehensive and accessible interventions. These findings also emphasize the importance of clearly defining the cognitive, social, and perceptual impacts of UHL and linking them to actionable strategies. For instance, auditory-cognitive training programs could target listening effort and working memory demands; rehabilitation protocols might incorporate spatial hearing exercises that leverage compensatory head orientation; and social support interventions could help individuals navigate stigma and build realistic expectations in communication settings. Further, given the observed reliance on head orientation, interventions may also explore non-device strategies such as communication training and environmental modifications, alongside devices like hearing aids or CROS systems, to provide comprehensive, individualised support. The inclusion of subjective and behavioural measures in clinical assessments could further improve awareness among both patients and clinicians, potentially increasing acceptance and use of rehabilitative technologies. By addressing these interconnected dimensions in a systematic and personalized way, future research and clinical practice can better support individuals with UHL in managing the everyday challenges of their condition.
5. Conclusions
The motivation for this study stems from the need to comprehensively understand the functional, psychological, and social challenges experienced by individuals with unilateral hearing loss (UHL). The study revealed that UHL significantly affects speech understanding, spatial hearing, and social behaviours, with participants reporting greater cognitive effort and adopting compensatory head movements. These findings emphasize the multifaceted impact of UHL and underscore the necessity for tailored clinical assessments and interventions to improve quality of life. The study's predictive model offers a promising tool for clinical and remote assessments, paving the way for more accessible and personalised support for individuals with UHL.
Supplementary Materials
The following supporting information can be downloaded at the website of this paper posted on Preprints.org. Appendix A: Demographics and hearing assessments. Appendix B: Figures, tables, and statistical analyses.
Funding
This research was supported by the Australian Government Department of Health, Disability, and Ageing; the Ramón y Cajal grant RYC-2022-037875-I, funded by the Ministerio de Ciencia, Innovación y Universidades del Gobierno de España (MCIU/AEI/10.13039/501100011033) and the European Social Fund Plus (ESF+); and the CNS2024-154207 grant, funded by the Ministerio de Ciencia, Innovación y Universidades del Gobierno de España (MCIU/AEI/10.13039/501100011033).
Acknowledgments
The authors gratefully acknowledge the participation of the volunteers of the study, and Mr. Greg Stewart (National Acoustic Laboratories, Sydney, Australia) for technical assistance in the acoustic calibration of auditory stimuli. Portions of this research were presented at the (i) 3rd e-Conference of the British Society of Audiology online Forum (Barbier et al., 2019), and (ii) 36th World Congress of Audiology, Paris, France (Valderrama et al., 2024). This article has been pre-published upon submission to the journal at [preprint link].
Declaration of conflicting interest
The authors declared no potential conflicts of interest with respect to the research, authorship, and/or publication of this article.
Ethical approval and informed consent
The study protocols adhered to World Medical Association’s Declaration of Helsinki on ethical principles for medical research involving human subjects. Approval was granted by the Hearing Australia Human Research Ethics Committee (EC00109, Ref. AHHREC2019-8). Informed consent was obtained from all participants prior to their inclusion in the study.
Data availability
All raw data, processed data, programming scripts, and other research materials supporting the findings of this study are available upon reasonable request. Correspondence and requests for materials should be addressed to J.T.V.
Author contribution statement
C.B., P.I., J.M., and M.F. conceptualised and designed the study. J.T.V., C.B., P.I. implemented the methodologies. C.B. and P.I. recruited participants and collected data. J.T.V, C.B., P.I., J.M. analysed data. P.I., J.M. and M.F. managed the administrative elements of the project. P.I. and M.F. secured the funding. J.T.V., C.B. and M.F. wrote the original draft of the manuscript. All authors reviewed and approved the final version of the manuscript.
References
- Barbier, C., Incerti, P., Valderrama, J. T., Mejia, J., Ferguson, M. Unilateral hearing loss: Characterising the déficit in real-world environments. British Society of Audiology 3rd e-Conference, online conference (December 4, 2019).
- Best, V., Keidser, G., Freeston, K., Buchholz, J. M. (2016). A dynamic speech comprehension test for assessing real-world listening ability. Journal of the American Academy of Audiology 27, 515—526. [CrossRef]
- Best, V., Keidser, G., Freeston, K., Buchholz, J. M. (2018). Evaluation of the NAL Dynamic Conversations Test in older listeners with hearing loss. International Journal of Audiology 57, 221—229. [CrossRef]
- Bolker, B. M., Brooks, M. E., Clark, C. J., Geange S. W., Poulsen, J. R., Stevens, M. H. H., White, J. S. S. (2009). Generalized linear mixed models: a practical guide for ecology and evolution. Trends in Ecology & Evolution 24, 127—135. [CrossRef]
- Brimijoin, W. O., McShefferty, D., Akeroyd, M. A. (2012). Undirected head movements of listeners with asymmetrical hearing impairment during a speech-in-noise task. Hearing Research 283, 162—168. [CrossRef]
- Dalla Costa, L., dos Santos, S. N., Julio Costa, M. (2019). Unilateral hearing loss and the use of hearing aid: Speech recognition, benefit, self-perception of functional performance and satisfaction. Revista CEFAC—Speech, Language, Hearing Sciences and Education Journal 21, e13918. [CrossRef]
- Douglas, S. A., Yeung, P., Daudia, A., Gatehouse, S., O’Donoghue, G. M. (2007). Spatial hearing disability after acoustic neuroma removal. Laryngoscope 117, 1648—1651. [CrossRef]
- Dwyer, N. Y., Firszt, J. B., Reeder, R. M. (2014). Effects of unilateral input and mode of hearing in the better ear: Self-reported performance using the speech, spatial and qualities of hearing scale. Ear and Hearing 35, 126—136. [CrossRef]
- Galloway, J., Zhang, V., Marnane, J., Hou, S., Stewart, G., Bardy, F. (2019). The Impact of Unilateral Hearing Loss on Adult Life. The Hearing Review 26, 10—14. URL: https://hearingreview.com/inside-hearing/research/impact-unilateral-hearing-loss-adult-life.
- Golub, J. S., Lin, F. R., Lustig, L. R., Lalwani, A. K. (2018). Prevalence of adult unilateral hearing loss and hearing aid use in the United States. Laryngoscope 128, 1681—1686. [CrossRef]
- Grange, J. A., Culling, J. F. (2016). The benefit of head orientation to speech intelligibility in noise. The Journal of the Acoustical Society of America 139, 703—712. [CrossRef]
- Hawley, M. L., Litovsky, R. Y., Culling, J. F. (2004). The benefit of binaural hearing in a cocktail party: Effect of location and type of interferer. The Journal of the Acoustical Society of America 115, 833—843. [CrossRef]
- Heffernan, E., Coulson, N. S., Ferguson, M. A. (2018). Development of the Social Participation Restrictions Questionnaire (SPaRQ) through consultation with adults with hearing loss, researchers, and clinicians: a content evaluation study. International Journal of Audiology 57, 791—799. [CrossRef]
- Heffernan, E., Maidment, D. W., Barry, J., Ferguson, M. A. (2019). Refinement and validation of the Social Participation Restrictions Questionnaire: An application of Rasch analysis and traditional psychometric analysis techniques. Ear and Hearing 40, 328—339. [CrossRef]
- Hendrikse, M. M. E., Llorach, G., Grimm, G., Hohmann, V. (2018). Influence of visual cues on head and eye movements during listening tasks in multi-talker audiovisual environments with animated characters. Speech Communication 101, 70—84. [CrossRef]
- Iwasaki, S., Sano, H., Nishio, S., Takumi, Y., Okamoto, M., Usami, S.-I., Ogawa, K. (2013). Hearing handicap in adults with unilateral deafness and bilateral hearing loss. Otology & Neurology 34, 644—649. [CrossRef]
- Kumpik, D. P., King, A. J. (2019). A review of the effects of unilateral hearing loss on spatial hearing. Hearing Research 372, 17—28. [CrossRef]
- Lilliefors, H. W. (1967). On the Kolmogorov-Smirnov test for normality with mean and variance unknown. Journal of the American Statistical Association 62, 399—402. [CrossRef]
- Lucas, L., Katiri, R., Kitterick, P. T. (2018). The psychological and social consequences of single-sided deafness in adulthood. International Journal of Audiology 57, 21—30. [CrossRef]
- McCullagh, P., Nelder, J. A. (1989). Generalized Linear Models. 2nd Edition (Chapman & Hall / CRC Press, London). ISBN: 0-412-31760-5.
- Meteyard, L., Davies, R. A. I. (2020). Best practice guidance for linear mixed-effects models in psychological science. Journal of Memory and Language 112, 104092. [CrossRef]
- Newman, C. W., Jacobson, G. P., Hug, G. A., Sandridge, S. A. (1997). Perceived hearing handicap of patients with unilateral or mild hearing loss. The Annals of Otology, Rhinology, and Laryngology 106, 210—214. [CrossRef]
- Noble, W., Jensen, N. S., Naylor, G., Bhullar, N., Akeroyd, M. A. (2013). A short form of the Speech, Spatial and Qualities of Hearing scale suitable for clinical use: The SSQ12. International Journal of Audiology 52, 409—412. [CrossRef]
- Sarampalis, A., Kalluri, S., Edwards, B., Hafter, E. (2009). Objective measures of listening effort: Effects of background noise and noise reduction. Journal of Speech, Language, and Hearing Research 52, 1230—1240. [CrossRef]
- Subramaniam, K., Eikelboom, R. H., Eager, K. M., Atlas, M. D. (2005). Unilateral profound hearing loss and the effect on quality of life after cerebellopontine angle surgery. Otolaryngology—Head and Neck Surgery 133, 339—346. [CrossRef]
- Svobodová, V., Profant, O., Syka, J., Tóthová, D., Bureš, Z. The influence of asymmetric hearing loss on peripheral and central auditory processing abilities in patients with vestibular schwannoma. Ear and Hearing 46, 60—70. [CrossRef]
- Valderrama, J. T., Barbier, C., Incerti, P., Mejia, J., Ferguson, M. Towards a comprehensive assessment of unilateral hearing loss. 36th World Congress of Audiology (WCA-2024), Paris, France (September 19–22, 2024).
- Van Heteren, J. A. A., Wendrich, A. W., Peters, J. P. M., Grolman, W., Stokroos, R. J., Smit, A. L. (2025). Speech perception in noise after cochlear implantation for single-sided deafness. JAMA Otolaryngology-Head & Neck Surgery 151, 211—219. [CrossRef]
- Weisser, A., Buchholz, J. M., Oreinos, C., Badajoz-Davila, J., Galloway, J., Beechey, T., Keidser, G. (2019). The Ambisonic Recordings of Typical Environments (ARTE) database. Acta Acustica united with Acustica 105, 695—713. [CrossRef]
- Wie, O. B., Pripp, A. H., Tvete, O. (2010). Unilateral deafness in adults: effects on communication and social interaction. The Annals of Otology, Rhinology, and Laryngology 119, 772—781.
Figure 1.
Sequence of assessments and tasks in the experimental protocol, including cognitive load, speech-in-noise comprehension, head movement tracking, and self-report of hearing difficulties.
Figure 1.
Sequence of assessments and tasks in the experimental protocol, including cognitive load, speech-in-noise comprehension, head movement tracking, and self-report of hearing difficulties.
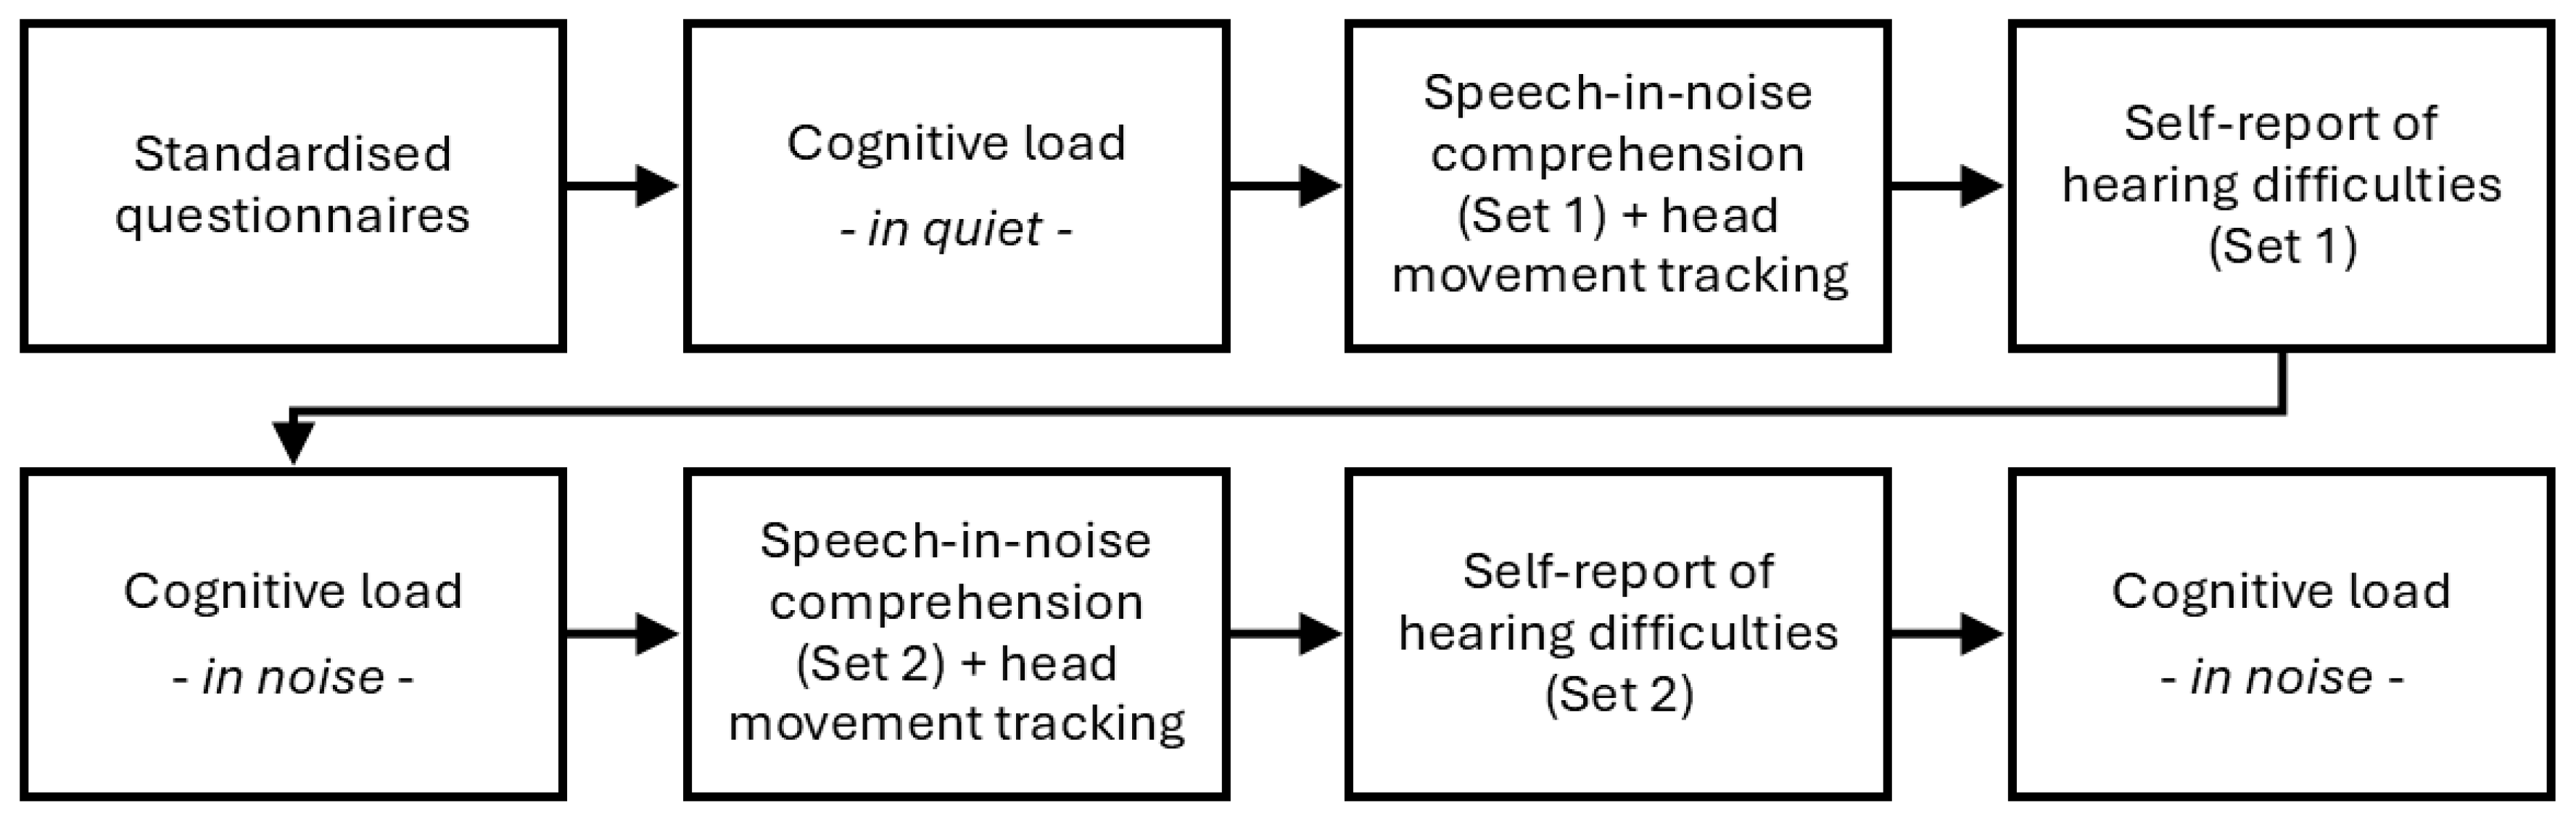
Figure 2.
Mean and standard error of the mean (error bars) for the global score and subscales of the short form of the Speech, Spatial and Qualities questionnaire (SSQ12, left panel) and the Social Participation Restrictions Questionnaire (SPaRQ, right panel) for the normal hearing (NH) and unilateral hearing loss (UHL) groups. *** .
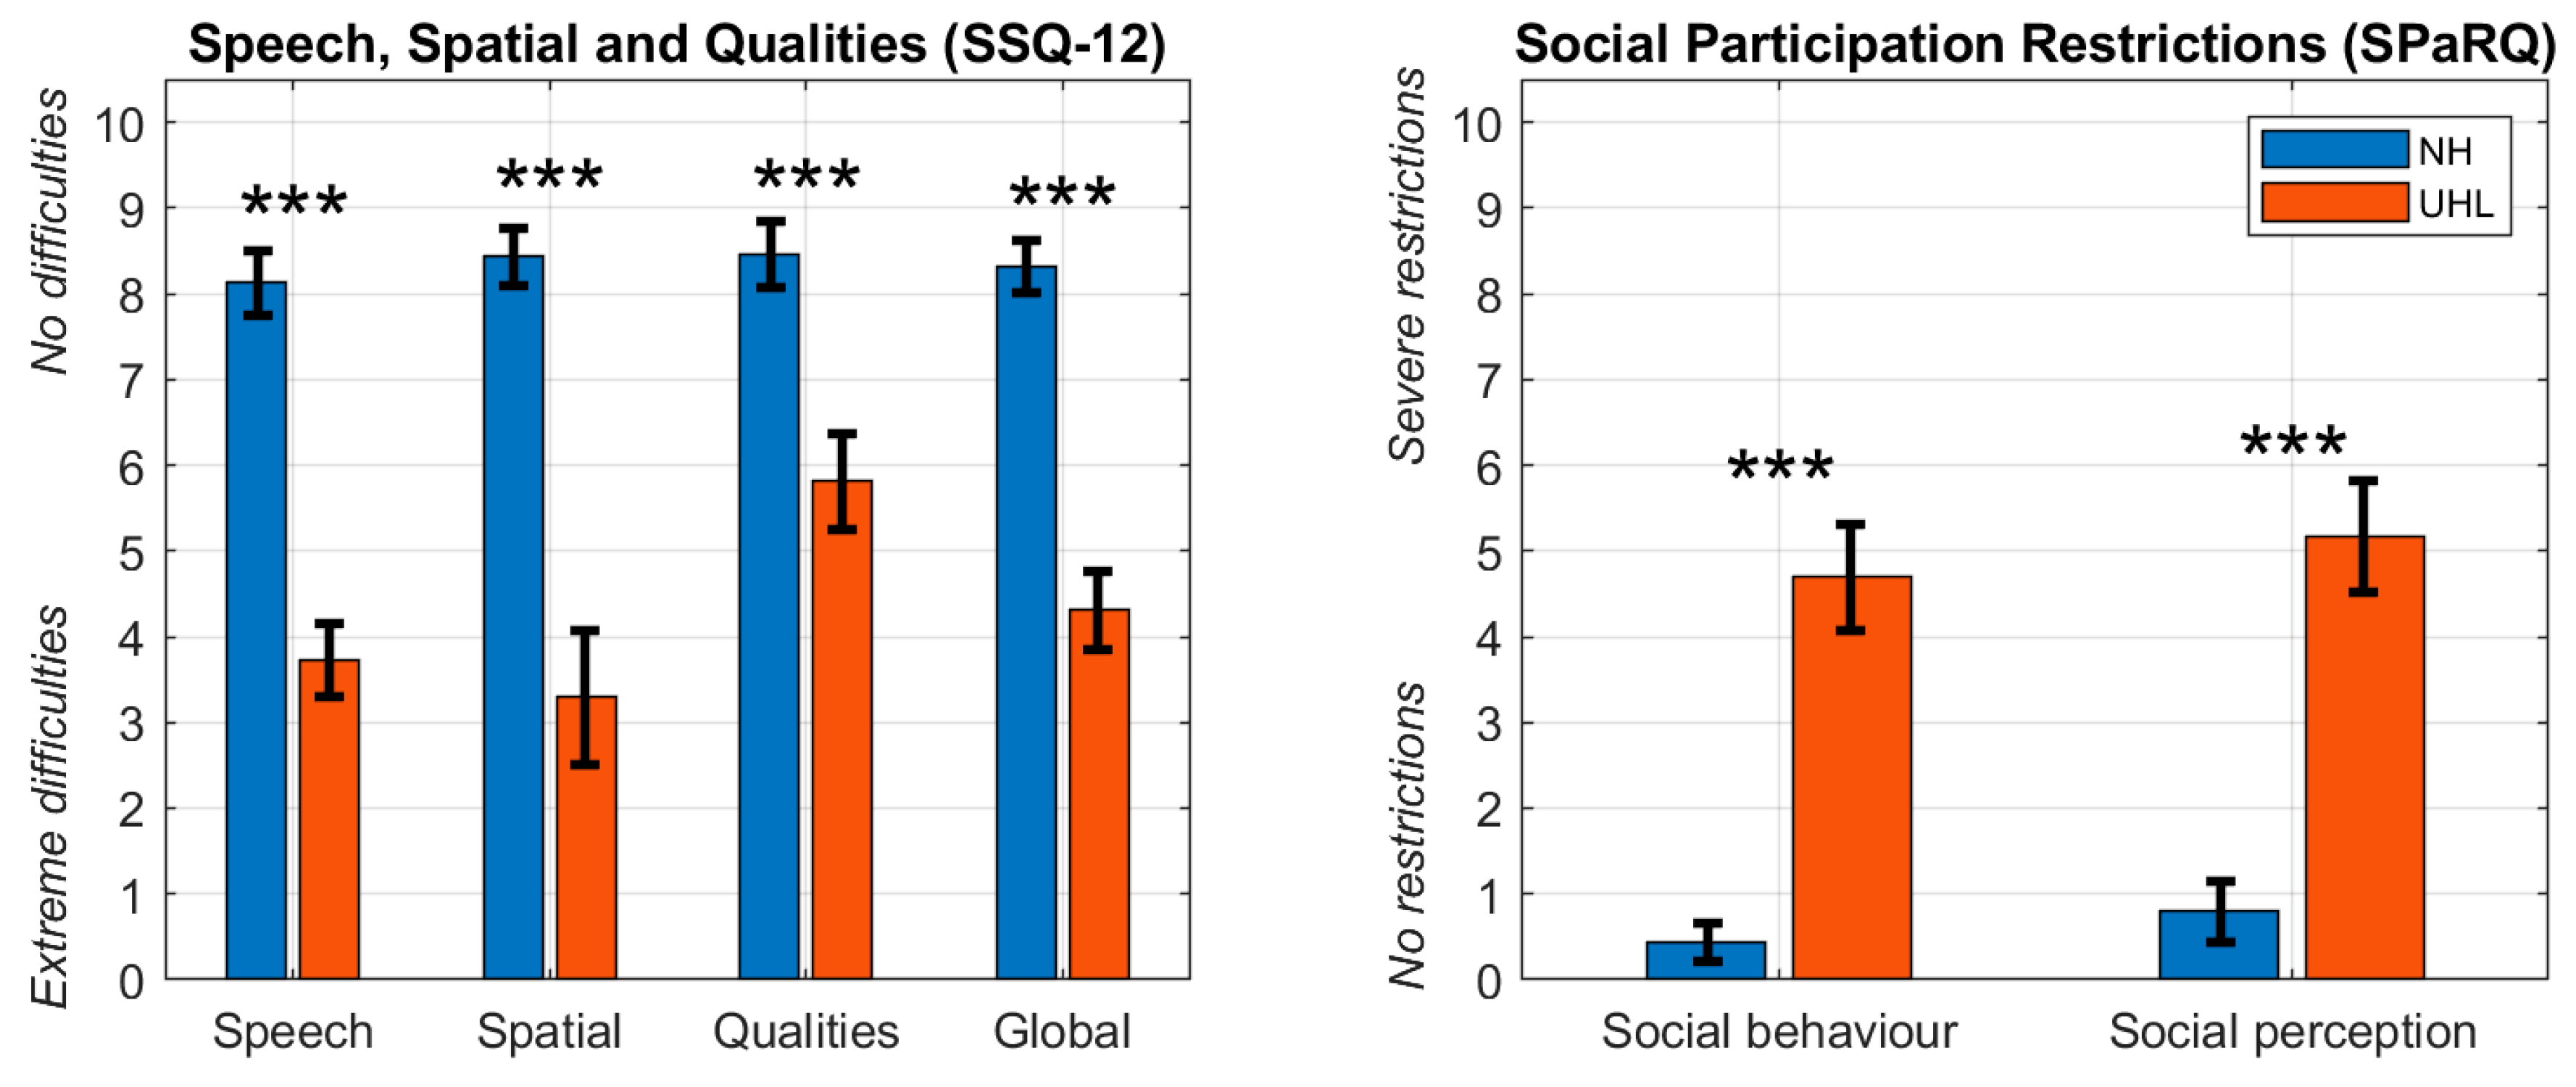
Figure 3.
Median reaction times (ms) for each participant in quiet (Q) and noise (N) conditions for the normal hearing (NH, blue) and unilateral hearing loss (UHL, orange) groups. The mean of participants’ median reaction times is displayed below each distribution. *** .
Figure 3.
Median reaction times (ms) for each participant in quiet (Q) and noise (N) conditions for the normal hearing (NH, blue) and unilateral hearing loss (UHL, orange) groups. The mean of participants’ median reaction times is displayed below each distribution. *** .
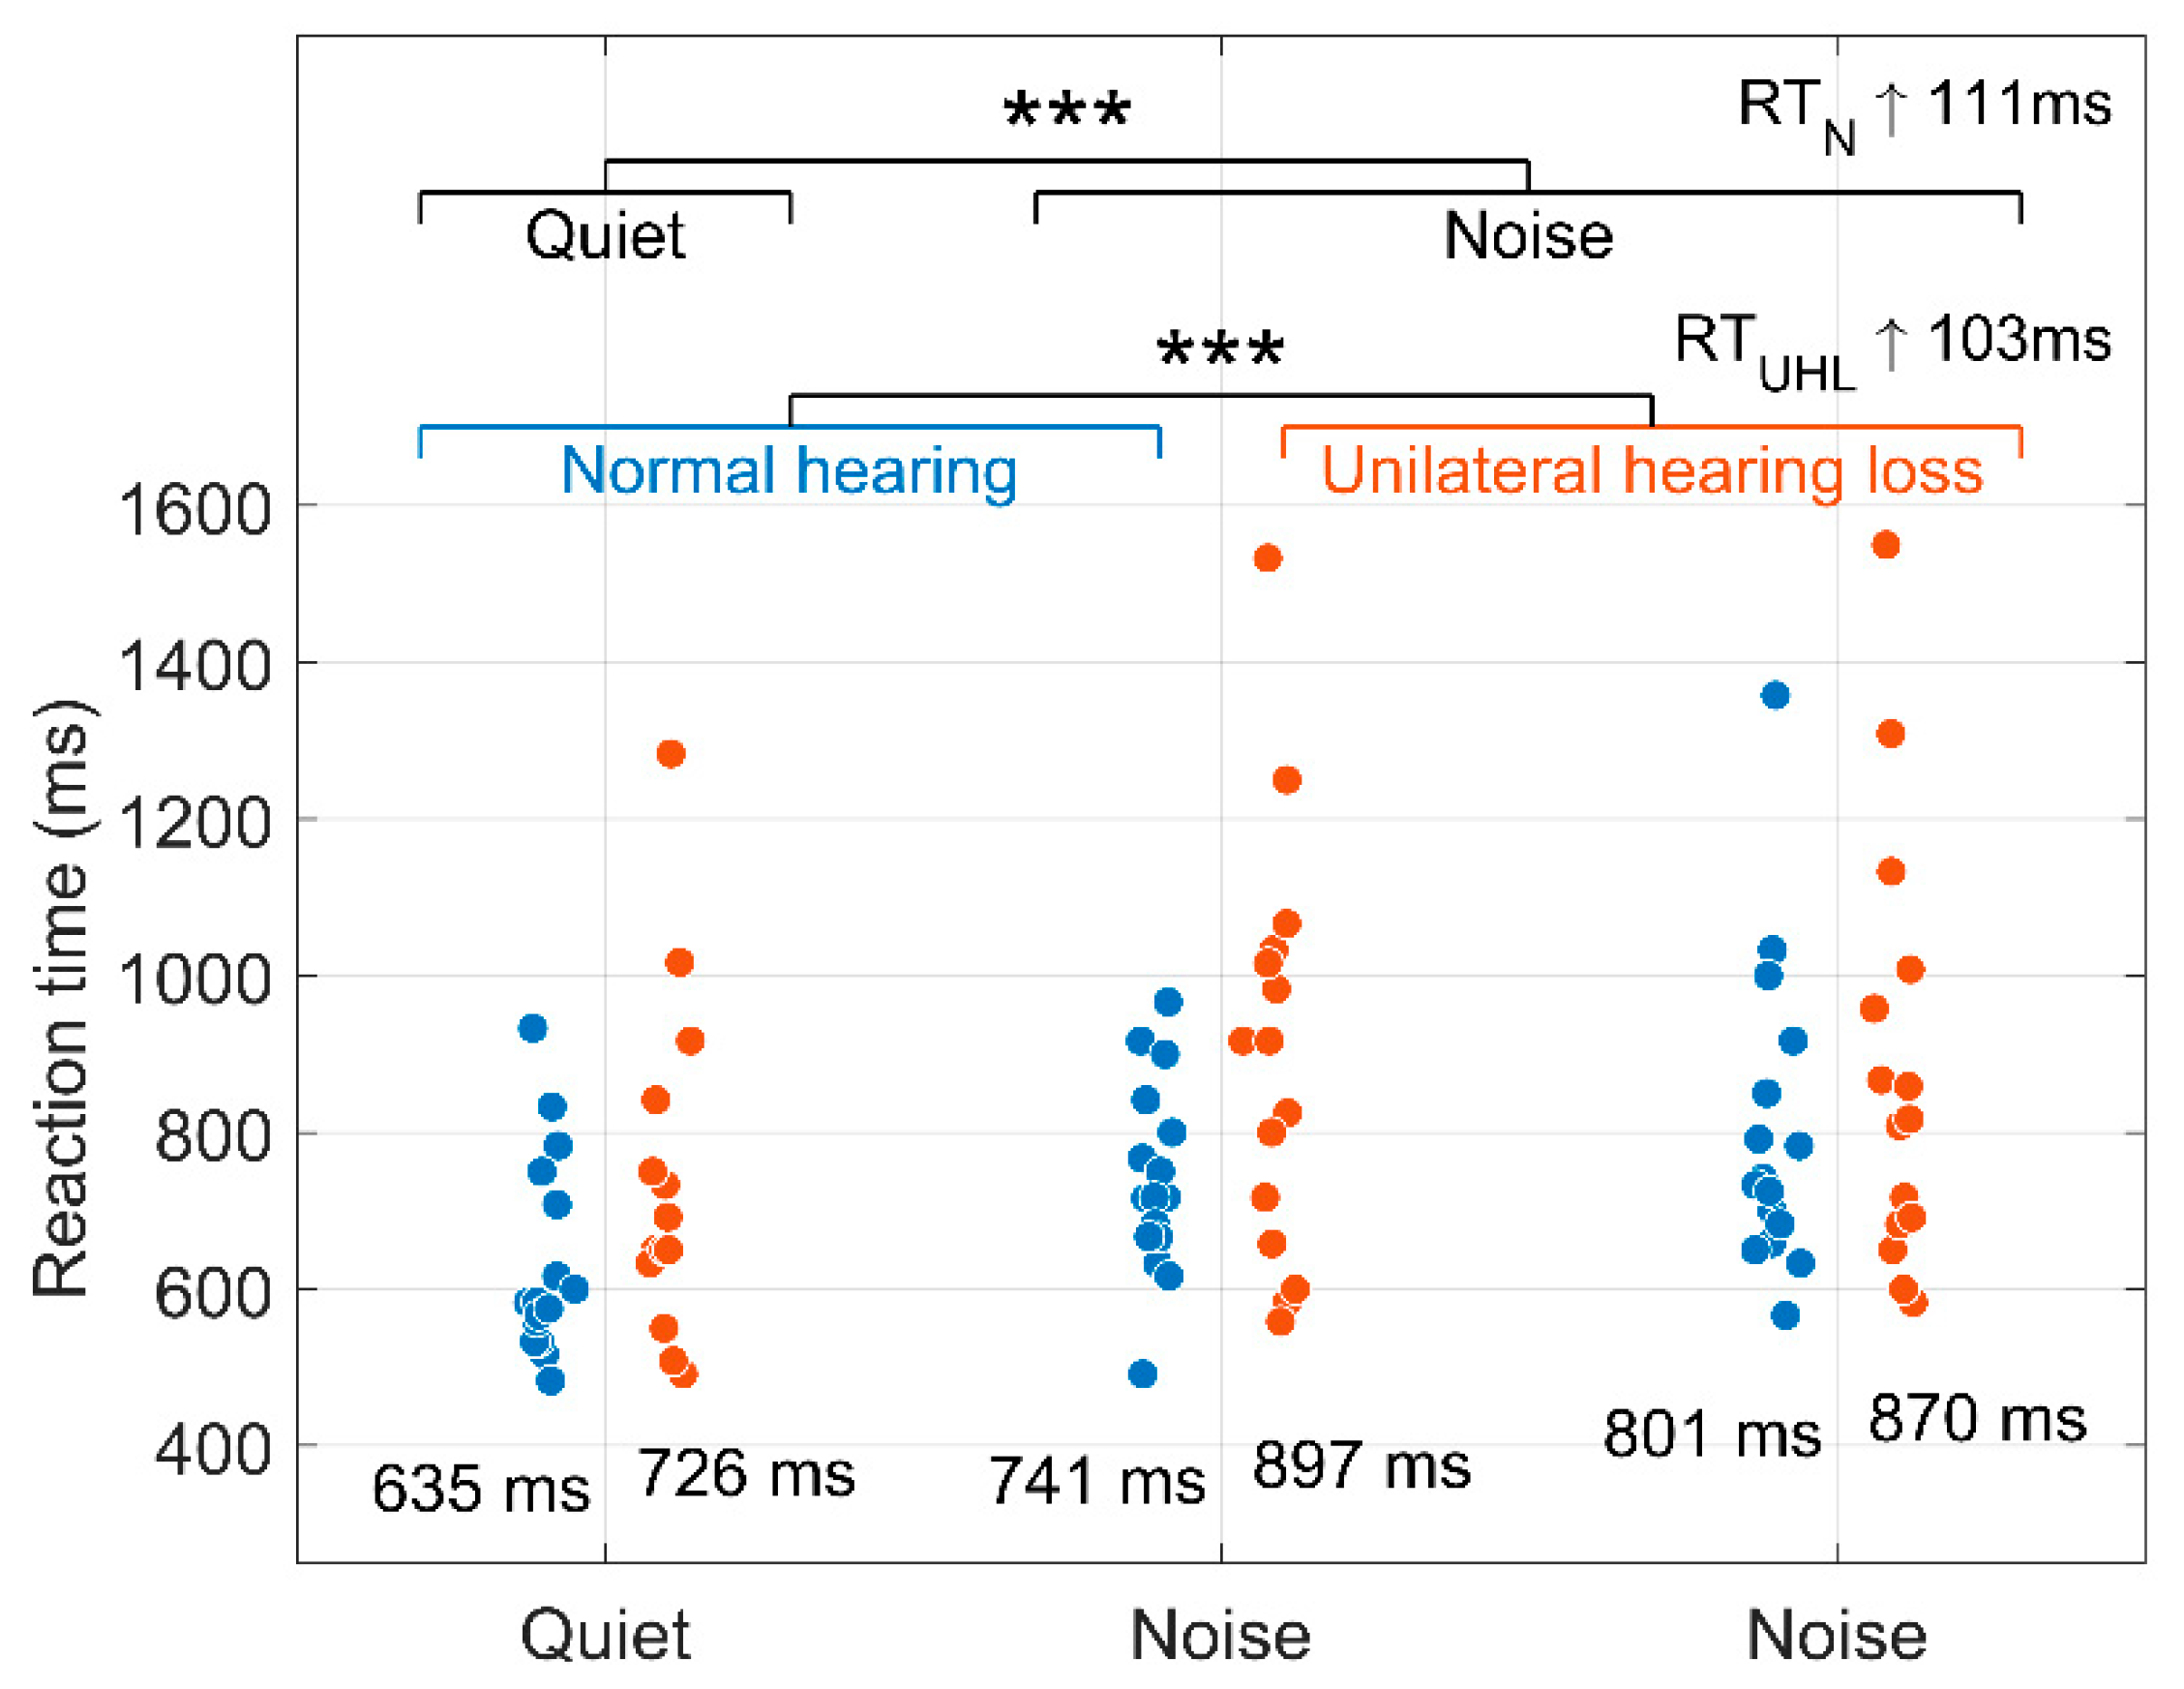
Figure 4.
Speech-in-noise comprehension in terms of the NAL-DCT score (% correct) for the normal hearing (NH) and unilateral hearing loss (UHL) groups. * .
Figure 4.
Speech-in-noise comprehension in terms of the NAL-DCT score (% correct) for the normal hearing (NH) and unilateral hearing loss (UHL) groups. * .
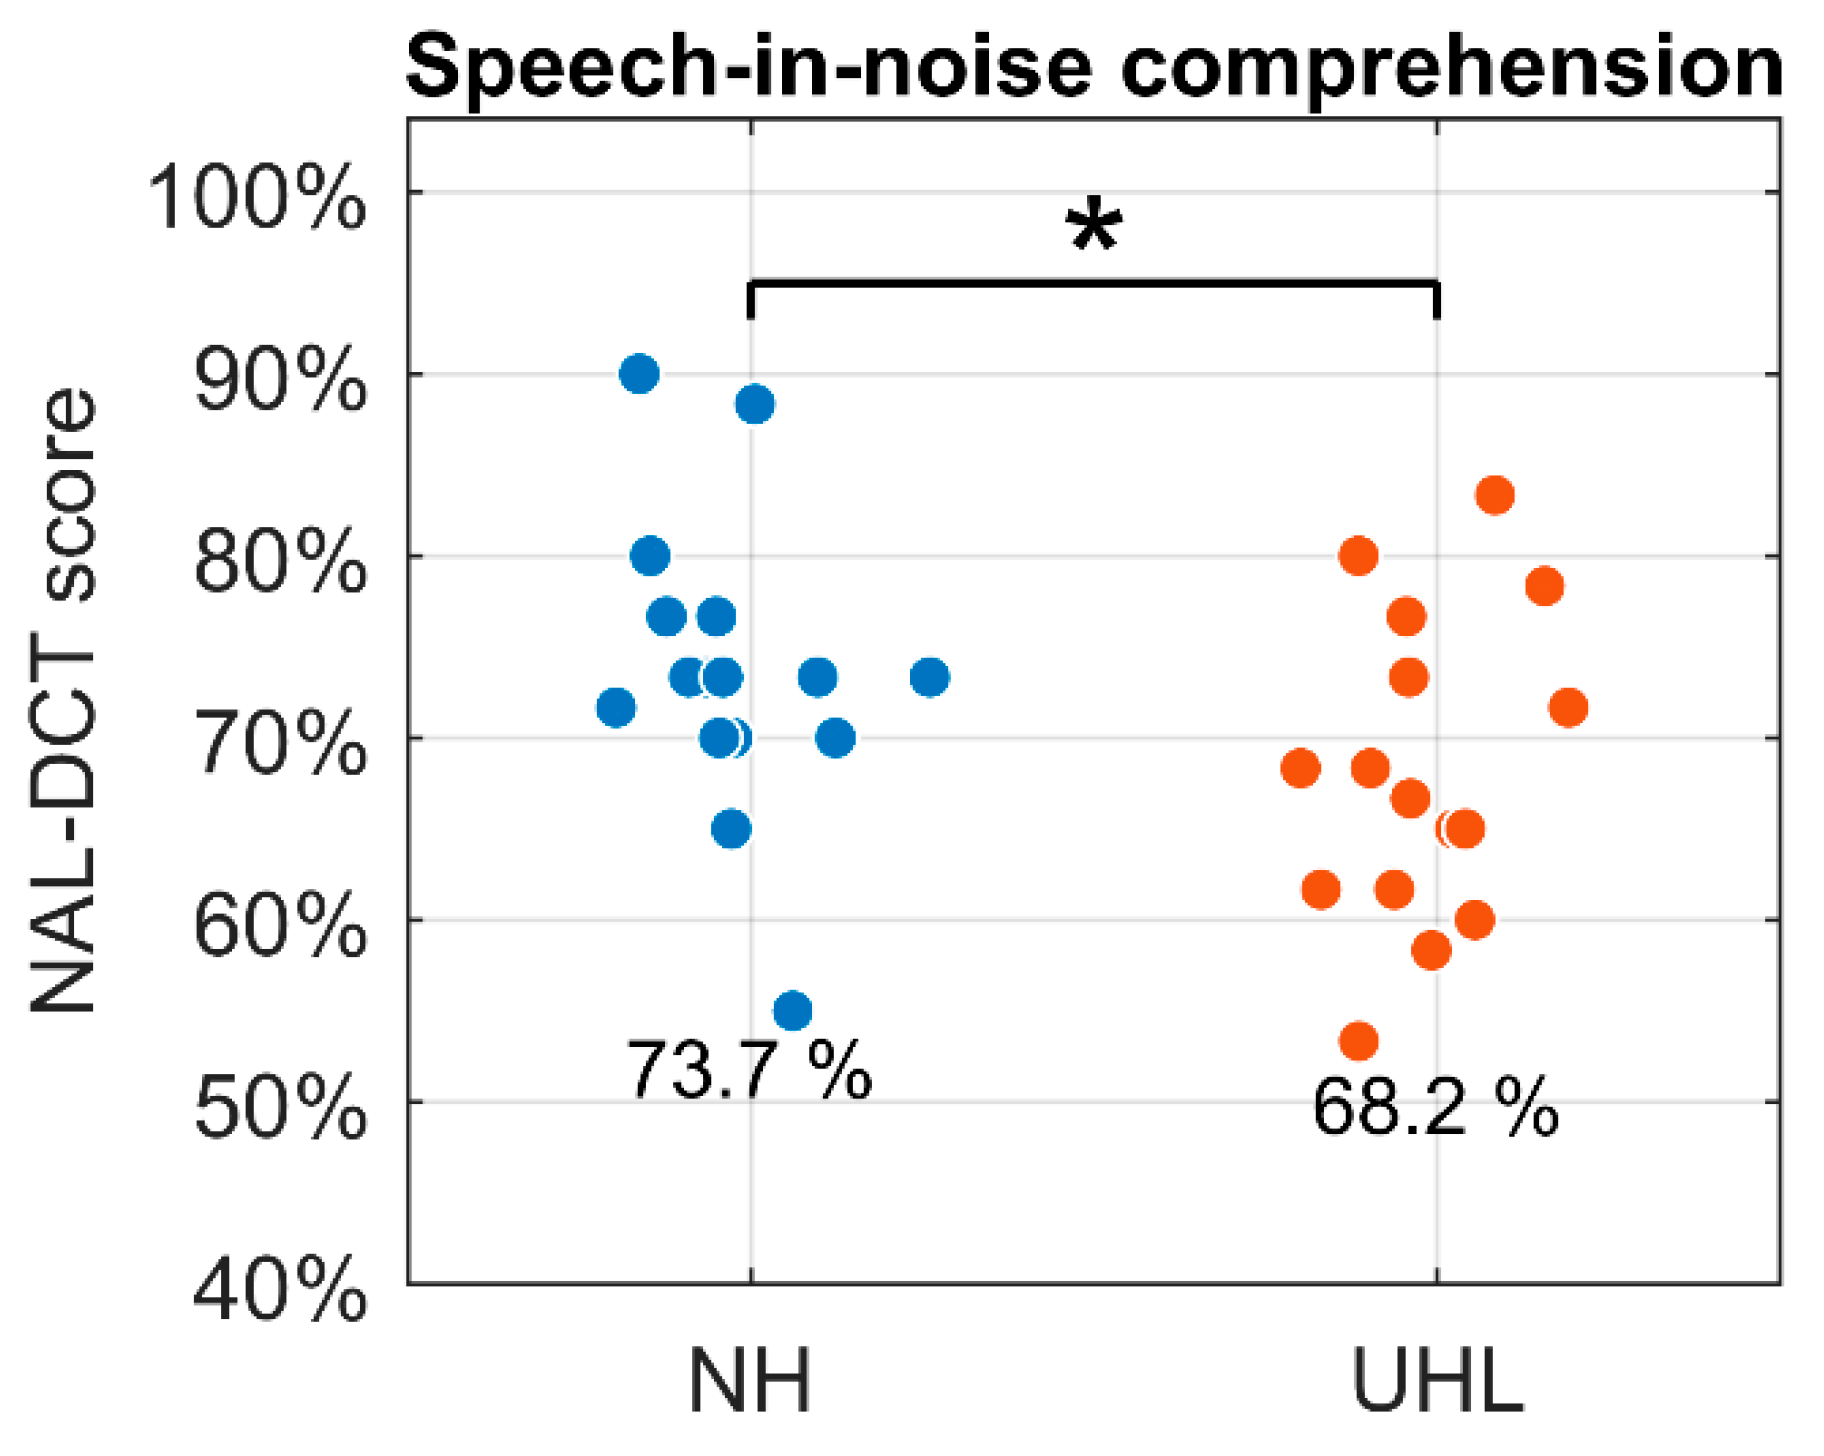
Figure 5.
Combined histogram across head movements during the NAL-DCT test for the normal hearing (NH) and unilateral hearing loss (UHL) groups, showing the percentage of time (%) spent at each head orientation angle (degrees). Positive angles indicate orientation towards the better ear, and negative angles towards the worse ear. Vertical green lines mark the azimuth position of the two speakers in the NAL-DCT test.
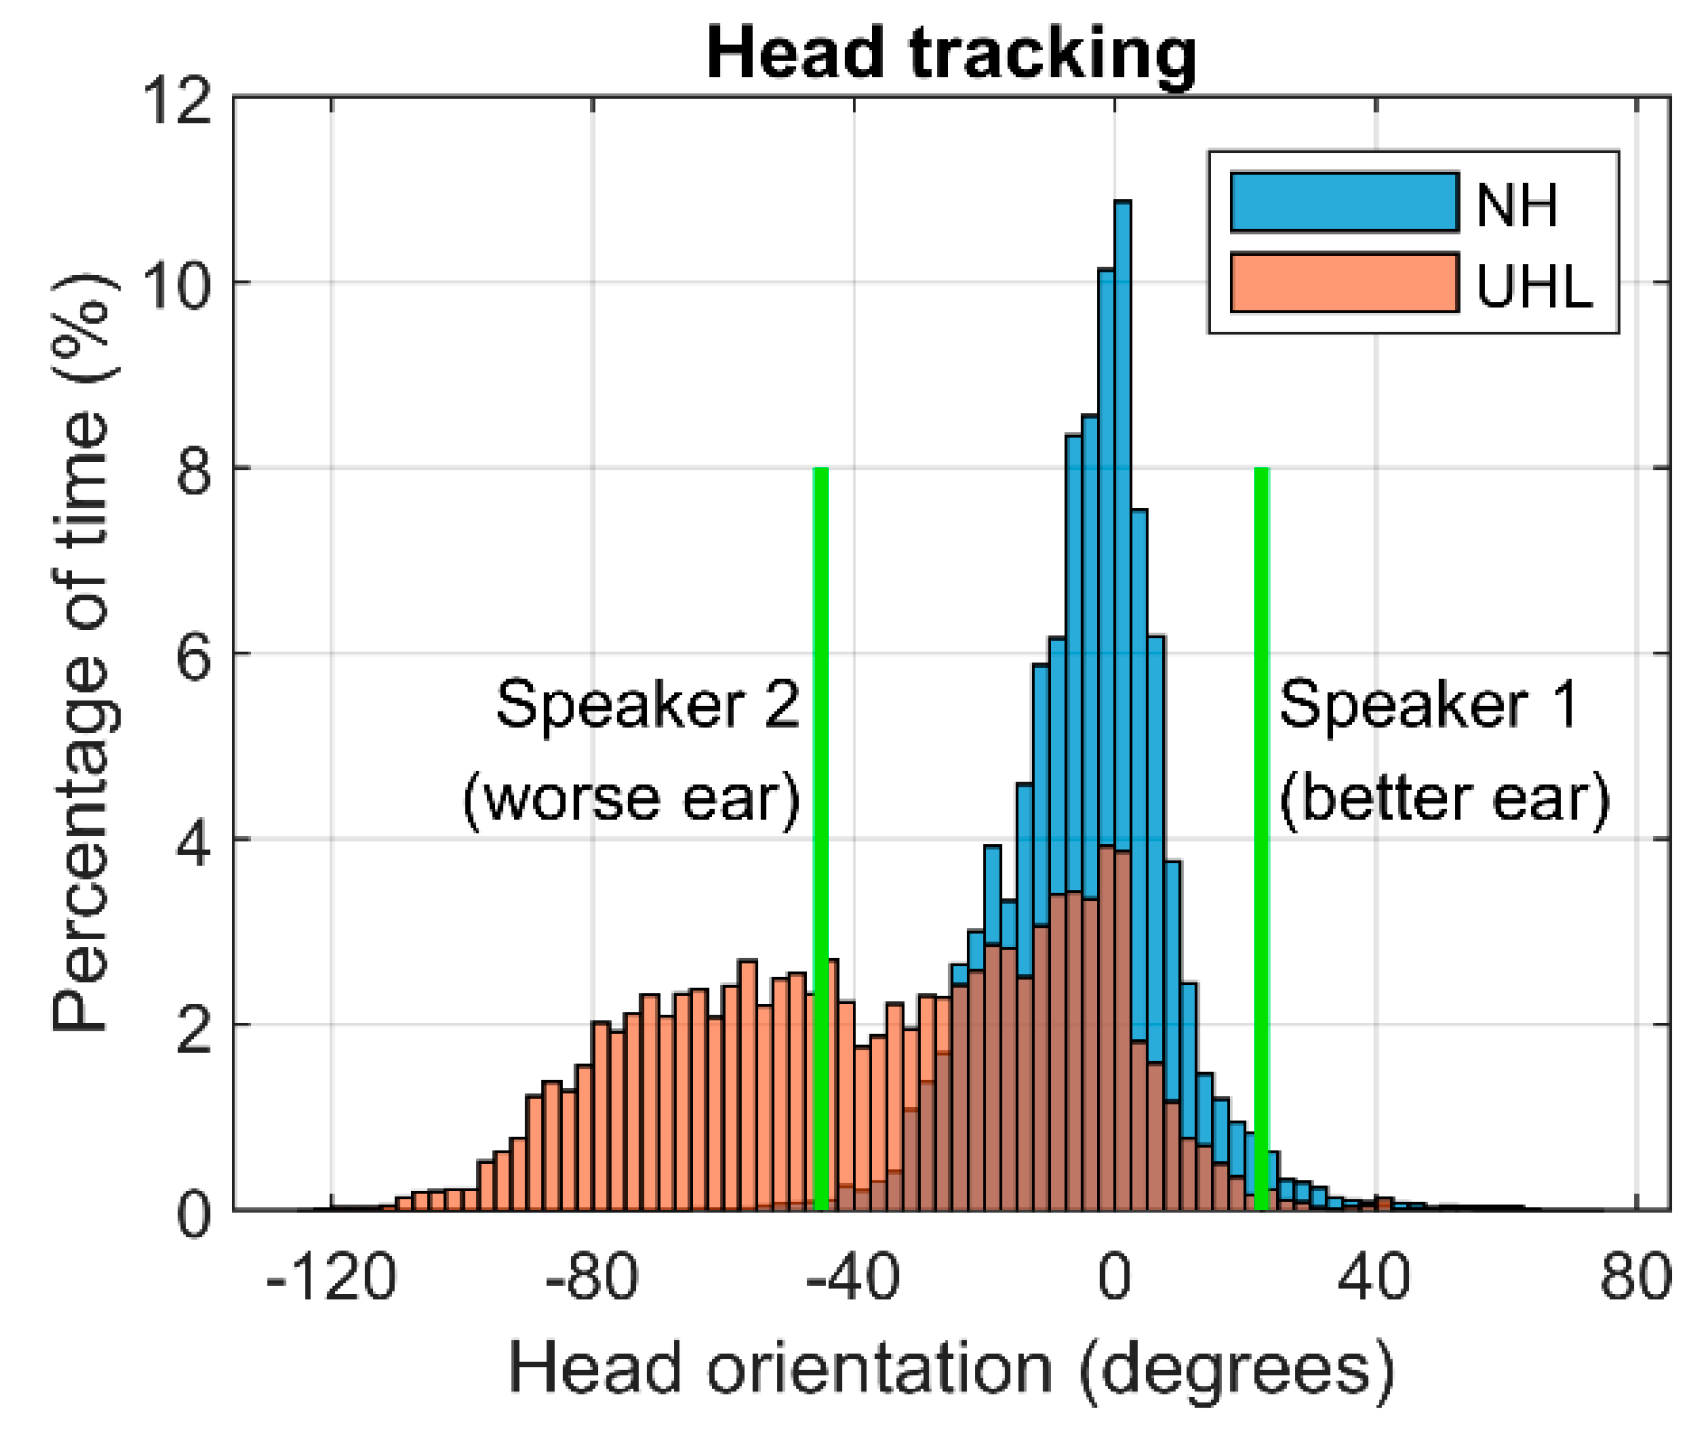
Figure 6.
Mean and standard error of the mean (error bars) for responses to ten questions about participants’ hearing experiences during the NAL-DCT speech-in-noise comprehension test, comparing the normal hearing (NH) and unilateral hearing loss (UHL) groups. The full, original questions and anchors for each response level are provided in Appendix B of the Online Supplemental Materials. * , ** , *** .
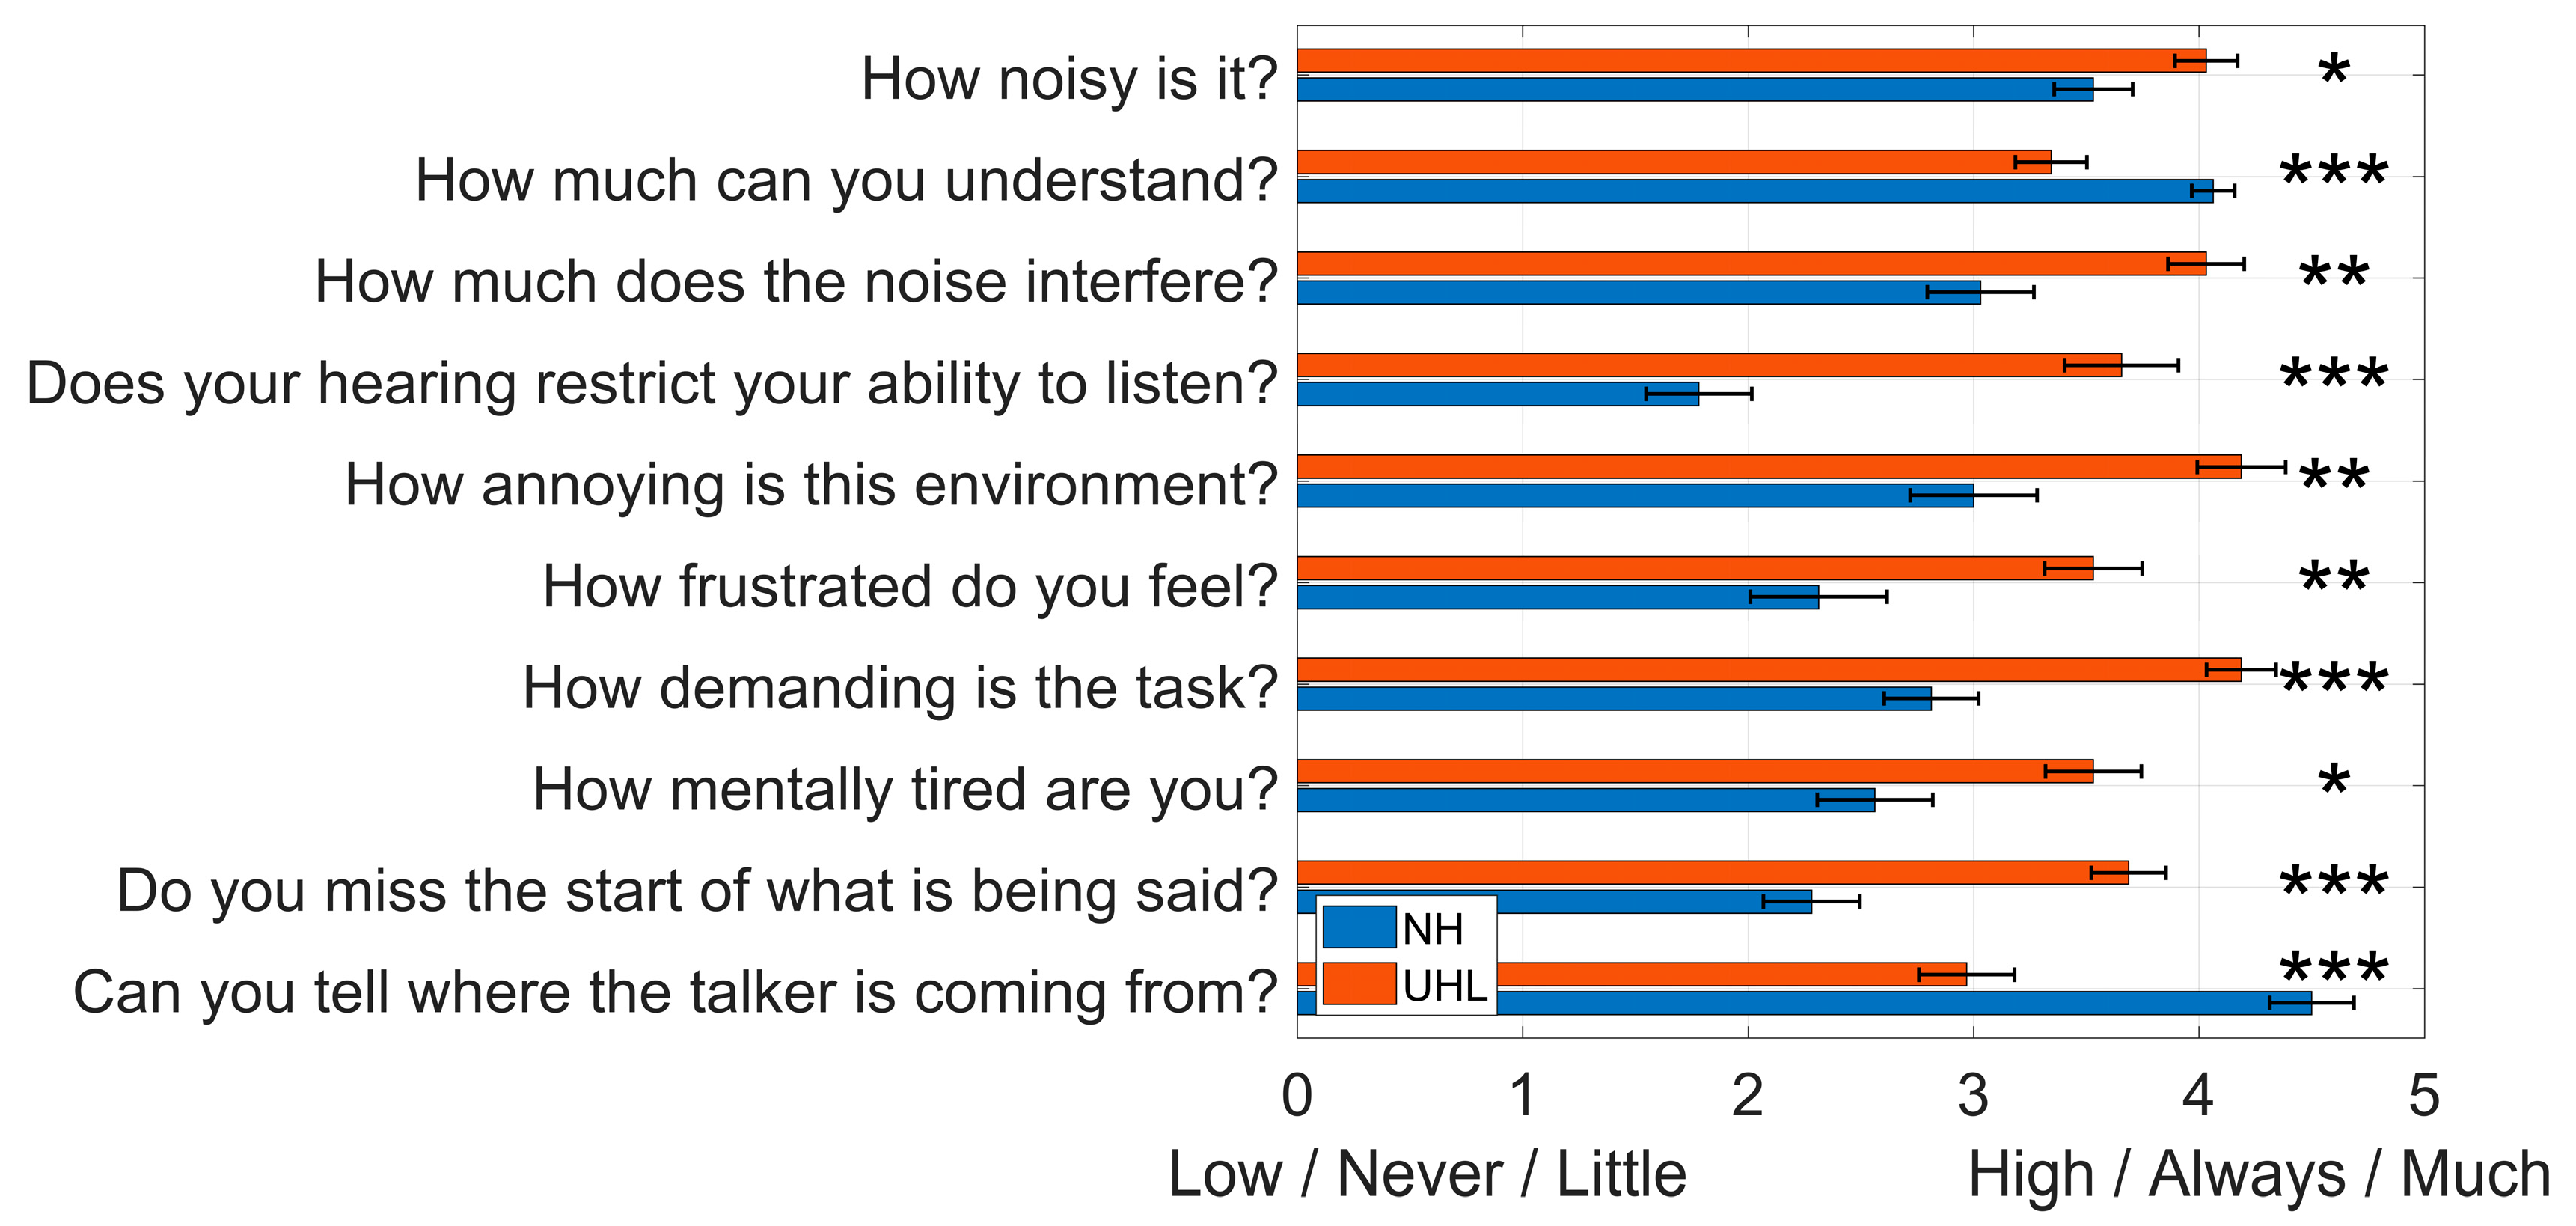
Figure 7.
Linear regression model predicting the NAL-DCT score (% correct) in the UHL group based on a combination of reaction time (RT) in the noise background condition and the mean score for questions 3 (noise interference), 6 (frustration), and 9 (missing the start of sentences) from the self-perceived handicap survey. Dashed lines represent the 95% confidence interval.
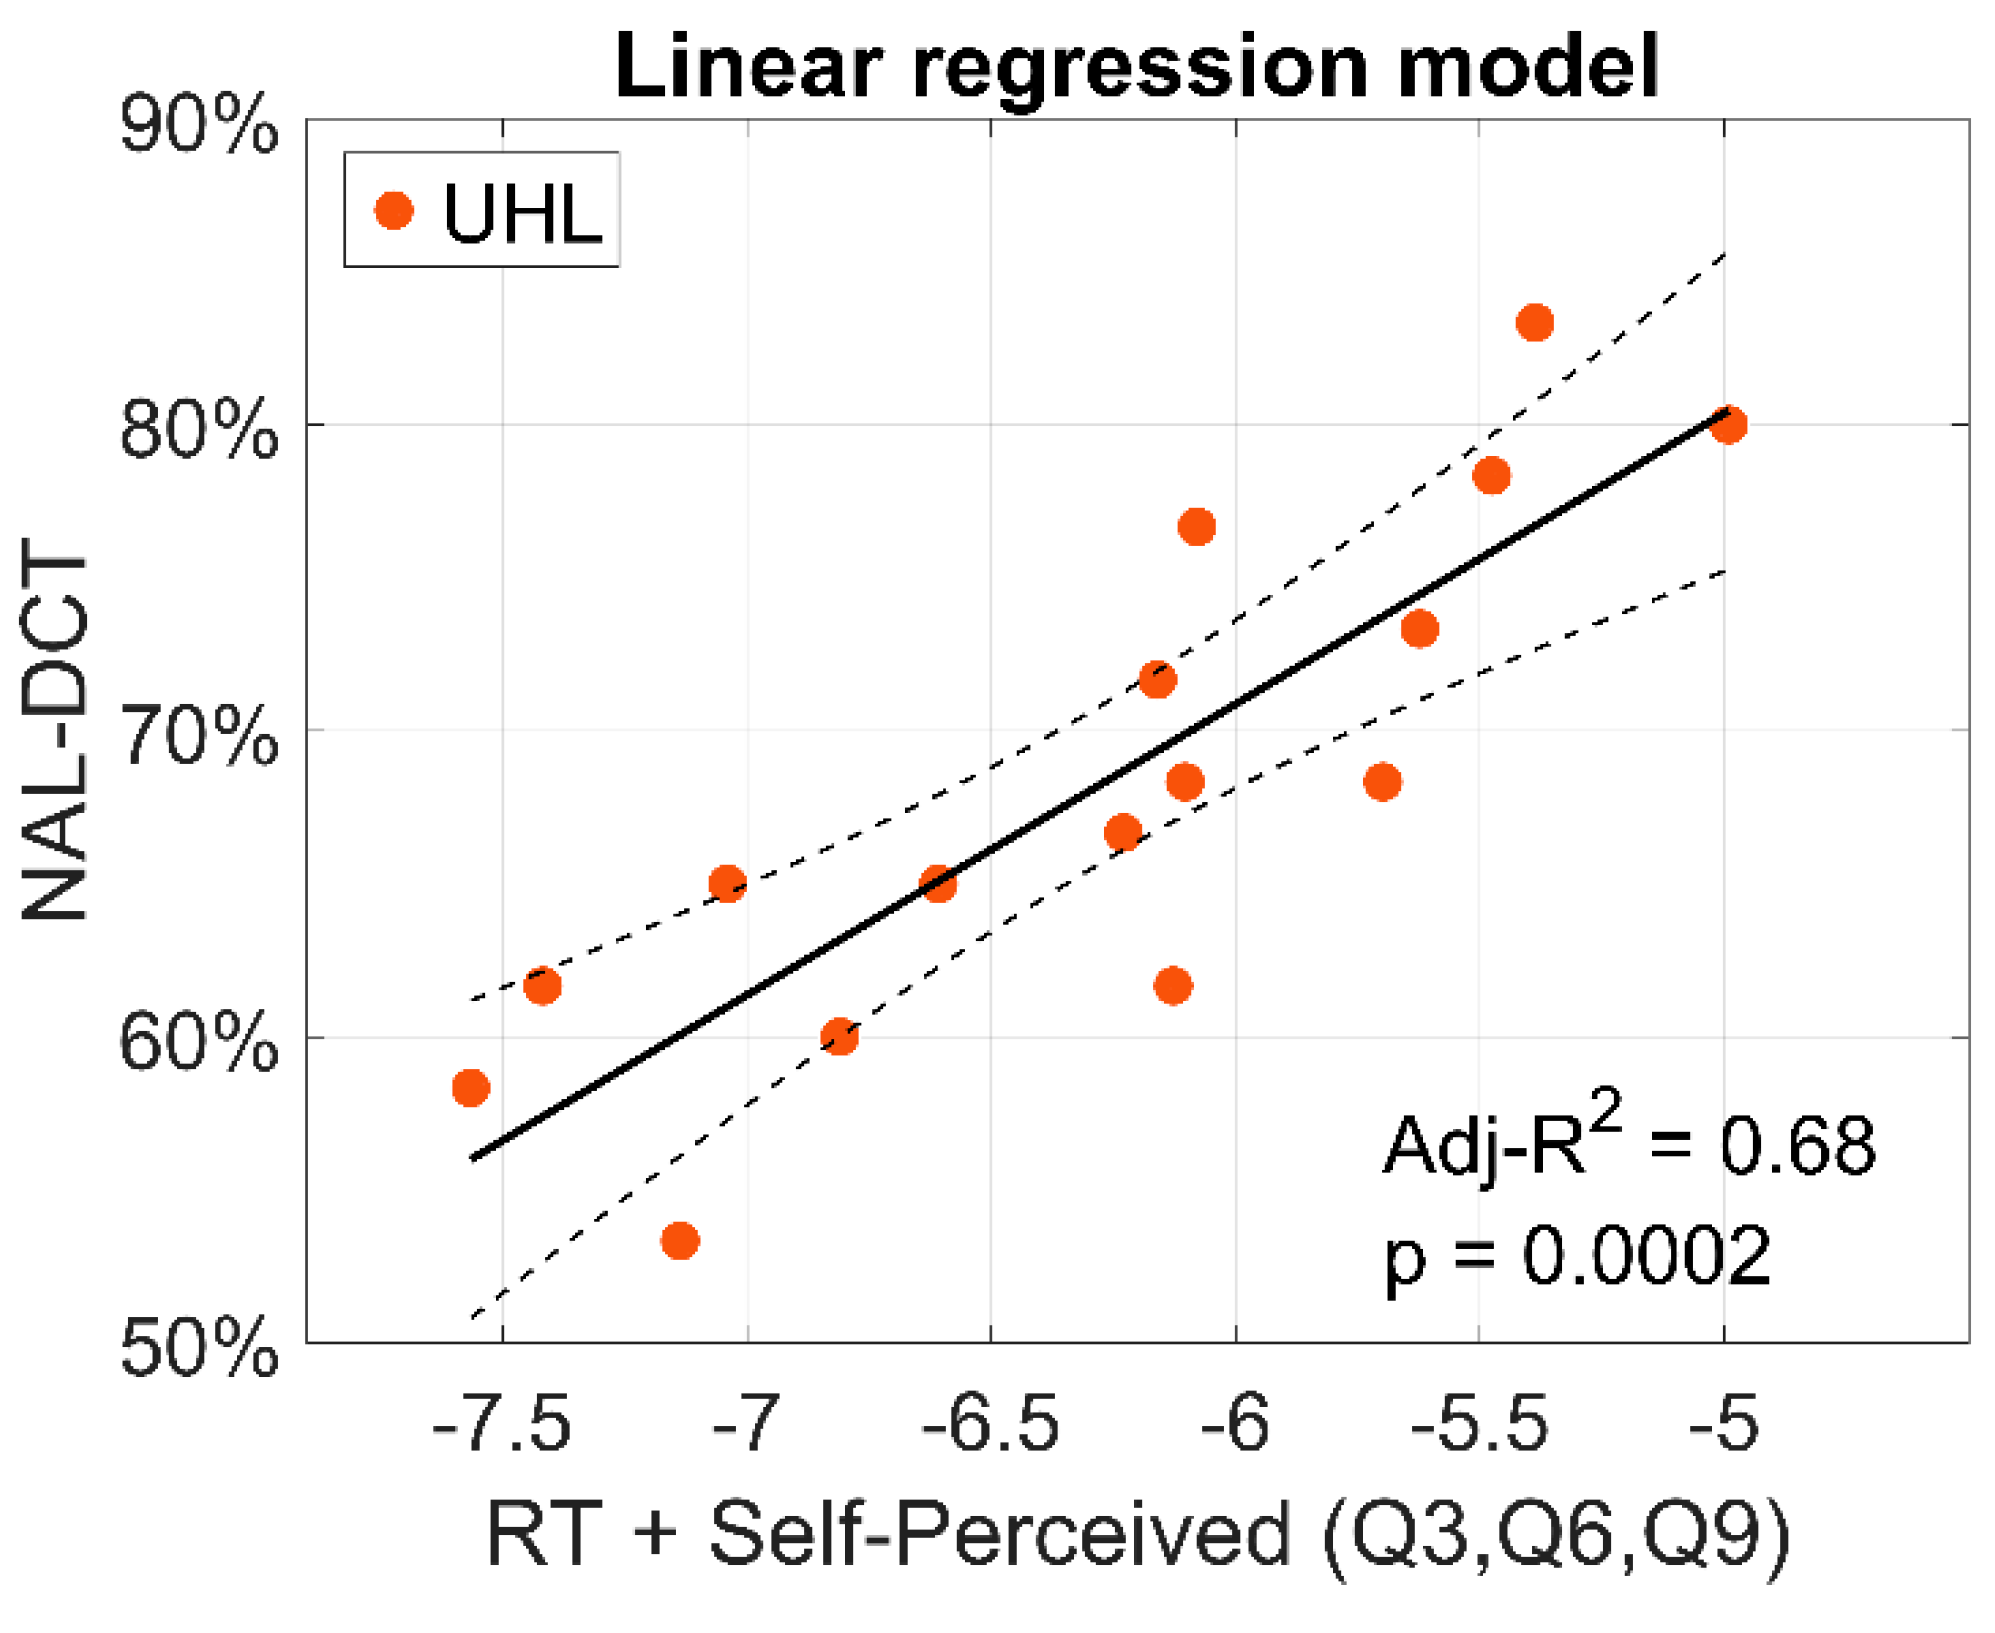

Table 1.
Generalised linear mixed-effects model coefficients for reaction times (ms), with hearing group and noise-background condition as predictor variables and participants as a random effect. The model employed a Gamma distribution with an inverse link function. The Intercept represents the normal hearing group in the ‘Noise’ condition. Number of observations: 392. SE: Standard error; 95% CI: 95% confidence interval.
| Fixed effect | N | |||
| SE | 95% CI | -value | ||
| (Intercept) | 0.0012696 | 3.3291·10-5 | [0.0012041 , 0.001335] | 1.7556·10-133 |
| Quiet | 0.00020917 | 4.5191·10-5 | [0.00012032 , 0.00029802] | 5.0228·10-6 |
| UHL | -0.0001469 | 4.1235·10-5 | [-0.00022797 , -6.5831·10-5] | 0.00041279 |
Table 2.
Linear mixed-effects model coefficients with NAL-DCT score (% correct) as the outcome variable, hearing group as the predictor, and participants as a random effect. The Intercept represents the normal hearing group. SE: Standard error; 95% CI: 95% confidence interval.
Table 2.
Linear mixed-effects model coefficients with NAL-DCT score (% correct) as the outcome variable, hearing group as the predictor, and participants as a random effect. The Intercept represents the normal hearing group. SE: Standard error; 95% CI: 95% confidence interval.
| Fixed effect | SE | 95% CI | -value | |
| (Intercept) | 73.75 | 1.79 | [70.22 , 77.28] | 1.15·10-96 |
| UHL | -5.52 | 2.53 | [-10.51 , -0.53] | 0.0304 |
Table 3.
Estimated coefficients from the linear regression model predicting the NAL-DCT score (% correct) in the UHL group, based on the normalised (z-score) reaction time in the noise background condition and the average scores from questions 3 (noise interference), 6 (frustration), and 9 (missing the start of sentences) from the self-perceived handicap survey.
| Estimate | SE | -Stat | -value | |
| (Intercept) | 68.229 | 1.1902 | 57.325 | 5.1095e-17 |
| Reaction time | -5.9017 | 1.2743 | -4.6313 | 0.00047 |
| Self-perceived (Q3, Q6, Q9) | -5.9827 | 1.2743 | -4.6949 | 0.00042 |
Disclaimer/Publisher’s Note: The statements, opinions and data contained in all publications are solely those of the individual author(s) and contributor(s) and not of MDPI and/or the editor(s). MDPI and/or the editor(s) disclaim responsibility for any injury to people or property resulting from any ideas, methods, instructions or products referred to in the content. |
© 2025 by the authors. Licensee MDPI, Basel, Switzerland. This article is an open access article distributed under the terms and conditions of the Creative Commons Attribution (CC BY) license (http://creativecommons.org/licenses/by/4.0/).
Copyright: This open access article is published under a Creative Commons CC BY 4.0 license, which permit the free download, distribution, and reuse, provided that the author and preprint are cited in any reuse.


