Submitted:
09 July 2025
Posted:
11 July 2025
Read the latest preprint version here
Abstract
Cognitive Drive Architecture (CDA) is proposed as a novel field within cognitive psychology, advancing structural explanations of volitional effort beyond trait-based or correlational accounts. Its foundational theory, Lagunian Dynamics, specifies that Drive emerges from interactions among six mechanistic variables: Primode (ignition threshold), Cognitive Activation Potential (motivational voltage), Flexion (task adaptability), Anchory (attentional stabilization), Grain (resistive friction), and Slip (structural entropy). These variables are integrated into Lagun’s Law, a canonical equation derived from first principles inspired by structural mechanics, defining Drive as a dimensionally consistent dynamic system property rather than a descriptive state. This study empirically tested Lagun’s Law using a large educational dataset (N ≈ 480) by mapping behavioral proxies to the six variables. Multiple regression and structural equation modeling revealed significant predictive roles for ignition readiness, motivational voltage, and stabilizing versus resistive factors, consistent with the theorized pathways. These results support CDA as a testable and integrative field for explaining effort regulation, bridging motivational, attentional, executive, and educational research. Overall, this study positions CDA and Lagunian Dynamics as promising scientific foundations for a structural, mechanistic science of Drive, providing explanatory precision comparable to cognitive architecture models while uniquely addressing the volitional dimension of human performance.
Keywords:
cognitive drive architecture
; Lagunian dynamics
; cognitive effort
; motivational architecture
; educational performance
; structural equation modeling
; volitional control
1. Introduction
1.1. Background
Drive is a fundamental psychological construct, central to understanding how individuals initiate, sustain, and regulate effortful behavior toward goal-directed actions. In contemporary cognitive psychology, Drive is positioned as a latent force that mobilizes resources, orchestrates cognitive control, and maintains persistence in the face of challenge or distraction. Even though Drive has been conceptually influential, it is typically modeled through correlational frameworks that focus on antecedents or consequences, rather than specifying its generative structure.
Motivational theories have highlighted the role of social-cognitive expectancies and self-efficacy beliefs [1], while attentional resource models have addressed the limits of cognitive capacity in effort allocation [2]. Intentional frameworks have described how implementation intentions prime readiness to act [3], and neurophysiological accounts have linked effort initiation to readiness potentials [4]. Although these approaches enrich our understanding of Drive as a psychological phenomenon, they remain correlational and descriptive, lacking a mechanistic formulation of how Drive becomes structurally possible within a cognitive system.
This absence of a structural explanatory architecture leaves a critical gap in understanding why Drive sometimes ignites, sometimes collapses, and how it dynamically adjusts under varying conditions. Purely correlational approaches cannot formalize the latent rules governing ignition thresholds, motivational modulation, adaptability, and resistance in a unified manner. Consequently, there is a need for a mechanistic, structural architecture that can define Drive as an emergent configuration of cognitive processes. Such a framework would move the field from describing surface correlates toward modeling the internal determinants of effort in a precise and testable way.
1.2. Cognitive Drive Architecture as a Proposed Field
The Cognitive Drive Architecture (CDA) has been recently introduced as a proposed field within cognitive psychology, defining a structural substrate for the systematic study of Drive [5]. Unlike traditional cognitive architectures, which focus on knowledge representations and procedural rules [6,7], CDA positions Drive as an emergent, structurally determined phenomenon. It specifies the conditions under which Drive can be ignited, modulated, and sustained, thereby establishing a dedicated scientific field concerned with the structural origins of volitional engagement.
As a field, CDA articulates a consistent unit of analysis focused on Drive’s structural readiness, providing cognitive science with an explanatory platform distinct from models of knowledge or rule-based processes. CDA organizes this domain around rigorous, operationally defined structural variables that can be mathematically derived, empirically tested, and systematically falsified. In doing so, it supplies cognitive psychology with a new lens to examine why effort arises, fluctuates, or collapses under certain system configurations.
Furthermore, CDA offers a coherent foundation to integrate and extend research from motivational theory, executive function, attentional stability, and volitional self-regulation under a unified structural perspective. In this sense, CDA functions as a specialized field for theorizing and empirically validating the mechanistic architecture of Drive, promoting the development of first-principles models such as Lagunian Dynamics. By supporting such models, CDA aims to transform the study of cognitive effort from a descriptive science to a structurally principled, mechanistic discipline.
1.3. Lagunian Dynamics and Lagun’s Law
At the core of the Cognitive Drive Architecture field lies Lagunian Dynamics, a structural theory that formalizes how Drive emerges from interactions among specific internal variables. Lagunian Dynamics articulates that Drive is not a single scalar state, but rather a system property arising from the dynamic interplay of ignition readiness, motivational modulation, adaptability, stabilizing mechanisms, resistive factors, and inherent system variance. These interacting elements are operationalized through six structurally defined variables: Primode (ignition threshold), Cognitive Activation Potential (CAP, motivational voltage), Flexion (task adaptability), Anchory (attentional stabilizer), Grain (resistive friction), and Slip (structural entropy).
Lagunian Dynamics proposes that these variables function together as a dynamic system, producing what is phenomenologically experienced as effort. The variables are hypothesized to interact in a lawful, mathematically definable manner, rather than representing loose or correlational associations. To codify these relationships, Lagunian Dynamics is formalized through Lagun’s Law, a canonical structural equation derived from first principles to satisfy a set of necessary postulates. Lagun’s Law specifies how ignition (Primode) is modulated nonlinearly by motivational voltage (CAP), amplified by adaptability (Flexion), balanced against stabilizing and resistive forces (Anchory and Grain), and perturbed by structural variance (Slip).
By expressing these interactions in a precise canonical equation, Lagun’s Law transforms the qualitative descriptions of motivational and volitional constructs into a structurally consistent, falsifiable, and testable formulation. As such, it serves as the mathematical backbone of Lagunian Dynamics and exemplifies the mechanistic, structural approach advocated by the Cognitive Drive Architecture field.
1.4. Objective and Contribution
The primary objective of this study is to derive Lagun’s Law in a stepwise, first-principles manner and to empirically calibrate its structural predictions using secondary educational data. Whereas the theory of Lagunian Dynamics has been conceptually articulated [5], the explicit mathematical derivation of its canonical equation, along with empirical testing of its constituent postulates, remains to be completed. This paper addresses that gap by systematically deriving Lagun’s Law from foundational postulates and then evaluating whether its structural variables can be operationalized and validated through naturally occurring educational behavior patterns.
In this sense, the contribution of this study is twofold. First, it provides a rigorous, dimensionally consistent derivation of Lagun’s Law, demonstrating how the structural requirements of Drive can be satisfied through a lawful interaction of ignition, modulation, adaptability, stabilization, resistance, and variance. Second, it tests whether these structural principles are detectable in authentic behavioral data drawn from classroom activity records, thereby establishing a preliminary empirical grounding for the Cognitive Drive Architecture field.
By framing the study as analogous to the derivation of structural equations in physics, where first principles define governing relationships among system variables, this work aims to advance psychology from a correlational description of effort to a mechanistic account grounded in structural principles. In doing so, it supports the positioning of CDA as a new, empirically viable field dedicated to understanding Drive as a structural, testable system property.
1.5. Overview of the Paper
This paper is structured to systematically build and validate the Cognitive Drive Architecture field’s foundational equation. Section 2 elaborates the theoretical foundations of Lagunian Dynamics, detailing its structural postulates and positioning these principles within the broader context of cognitive science. Section 3 articulates the functional constraints that any lawful formulation of Drive must satisfy, thereby setting precise conditions for its mathematical derivation.
Section 4 defines the structural variables of Lagunian Dynamics formally and links them to relevant empirical proxies, establishing a bridge between theoretical constructs and observable behavior. Section 5 then presents the rigorous derivation of Lagun’s Law, proceeding in a stepwise, dimensionally consistent manner to arrive at a canonical equation that meets all postulated requirements.
In Section 6, the paper describes the empirical calibration of Lagun’s Law using large-scale educational data, including operationalization of variables, statistical modeling procedures, and hypothesis testing. Section 7 reports the results of this empirical calibration, highlighting patterns consistent with the derived structural predictions. Finally, Section 8 discusses the theoretical contributions, implications for future research, and potential applications of CDA as a structural field, with Section 9 concluding the paper by summarizing the findings and restating their significance for the science of cognitive Drive.
2. Theoretical Foundations
2.1. Structural Requirements for Drive
Traditional motivational theories have long sought to explain the initiation and maintenance of effort by identifying antecedents such as goals, values, or expectancies [1,8]. These models are invaluable for understanding why people want to act, yet they typically leave unspecified how effort itself becomes structurally enabled within a cognitive system. Treating Drive as a simple byproduct of motivational states fails to capture the complex conditions that allow a cognitive system to generate, sustain, and regulate effort dynamically across time and context.
A purely motivational account cannot explain, for example, why effort fails even when motivational states remain high or why tasks with identical motivational value can lead to highly variable patterns of engagement. These inconsistencies suggest that Drive cannot be reduced to scalar motivational inputs alone but rather emerges from a more intricate interplay of ignition thresholds, dynamic modulation, adaptability to task structures, and stabilizing counterforces against resistance.
A structurally informed explanation of Drive therefore requires acknowledging the existence of ignition points that enable volitional action (e.g., [3]), modulators of motivational voltage [9], stabilizers of attentional control [10], and resistance or friction that constrains performance [2]. Without a mechanistic architecture that specifies these interlocking components, psychological models risk describing Drive as a loose collection of correlates rather than a formally generative system property. By proposing such an architecture, the present approach seeks to move beyond descriptive theories toward a structural, dimensionally consistent account of how Drive is mechanistically realized.
2.2. Cognitive Drive Architecture
The Cognitive Drive Architecture (CDA) has been proposed as a dedicated field within cognitive psychology to address the mechanistic origins of effort [5]. CDA provides a structural substrate to systematically study Drive as an emergent system property, rather than as a secondary consequence of motivational states or attentional processes. By defining specific structural variables and the lawful interactions among them, CDA establishes the foundations for a principled, testable science of volitional engagement.
Unlike classical cognitive architectures (such as ACT-R, SOAR, or EPIC), which primarily focus on procedural knowledge representations and rule-based cognitive processes [6,7,11], CDA is uniquely designed to model the readiness structure of Drive itself. It specifies the conditions under which Drive can ignite, the variables that modulate its magnitude, the stabilizers that sustain it, and the resistive factors that threaten its collapse. In this way, CDA offers a new unit of analysis that can unify theories of motivation, executive function, attentional stability, and effort regulation within a cohesive structural field.
Figure 1 presents a schematic overview of CDA, illustrating the relationships among its core constructs and their integration into a dynamic structural architecture. This schematic situates ignition mechanisms, modulation dynamics, adaptability pathways, stabilization–resistance balances, and stochastic variance elements within a unified explanatory framework. By providing this structured substrate for the development, testing, and refinement of mechanistic theories such as Lagunian Dynamics, CDA supports a transformation in how cognitive psychology conceptualizes the determinants of effort.
Figure 1.
Schematic representation of the Cognitive Drive Architecture (CDA) depicting structural elements.
Figure 1.
Schematic representation of the Cognitive Drive Architecture (CDA) depicting structural elements.

2.3. Lagunian Dynamics
Lagunian Dynamics constitutes the core explanatory theory within the Cognitive Drive Architecture field. It specifies how Drive emerges from a system of interacting structural variables, each with a distinct mechanistic role in enabling, modulating, and sustaining volitional effort. Drawing from structural postulates, Lagunian Dynamics proposes that Drive is not a singular motivational quantity but an emergent system property produced through the dynamic interplay of ignition readiness, motivational amplification, cognitive adaptability, stabilizing processes, resistance forces, and stochastic variance.
At the heart of this theory is the premise that the ignition of effort requires a binary threshold to be crossed (Primode), after which motivational voltage (Cognitive Activation Potential, or CAP) nonlinearly amplifies the drive signal. Task adaptability (Flexion) then modulates how this ignition and motivational force can be sustained within the current cognitive structure. Meanwhile, Anchory acts as a stabilizing mechanism to preserve attentional focus, counteracting the disruptive effects of Grain, which represents resistance or cognitive friction. Finally, Slip introduces stochastic variability, capturing the inherent entropy present in any cognitive system’s operations.
By articulating these six variables explicitly (Primode, CAP, Flexion, Anchory, Grain, and Slip), Lagunian Dynamics frames Drive as a structural readiness configuration rather than as a scalar motivational output. Its aim is to formalize these interactions through a mathematically consistent, testable, and falsifiable canonical equation: Lagun’s Law. In doing so, Lagunian Dynamics establishes a structural, mechanistic explanation for volitional engagement and performance, suitable for empirical evaluation within the CDA field.
2.4. Foundational Postulates of Lagunian Dynamics
Lagunian Dynamics is grounded on a series of structural postulates that define necessary conditions for the emergence of Drive as a system property. These postulates act as the axiomatic backbone for deriving Lagun’s Law in a dimensionally consistent and mechanistically rigorous manner:
-
Postulate 1: Structural Ignition.No Drive is possible without a binary ignition threshold (Primode).
-
Postulate 2: Nonlinear Motivational Voltage.Momentary motivational voltage nonlinearly modulates ignition (CAP).This reflects the idea that once ignition occurs, motivational intensity amplifies Drive nonlinearly rather than proportionally, consistent with motivational intensity theory [9].
-
Postulate 3: Cognitive Adaptability.Task structures must flexibly match the current cognitive configuration (Flexion).Drive sustains only if task demands can adapt to the momentary state of the cognitive system, in line with adaptability theories [12].
-
Postulate 4: Tension Resistance.Drive stability requires Anchory to balance resistance (Grain).Sustained volitional engagement demands an attentional stabilizer (Anchory) that counteracts internal resistance or friction (Grain), echoing attention control models [10].
-
Postulate 5: Structural Entropy.Cognitive systems display stochastic variability (Slip).All cognitive operations contain inherent fluctuations and random variance, which must be accounted for as structural entropy [13].
Together, these five postulates define the structural architecture of Lagunian Dynamics, providing a logically complete set of conditions for the formal derivation of Lagun’s Law.
3. Functional Constraints on Lagun’s Law
To ensure that Lagun’s Law meets the structural postulates of Lagunian Dynamics, a set of functional constraints must be satisfied by its canonical formulation. These constraints reflect both mathematical consistency and mechanistic plausibility, guaranteeing that the derived equation respects ignition thresholds, motivational modulation, adaptability effects, stabilizing and resistive forces, and inherent variance. Each constraint is described below.
3.1. Ignition Dependence
A central requirement of any lawful formulation of Drive is ignition dependence: the system cannot express Drive in the absence of an ignition threshold. Mathematically, this means that if Primode equals zero, the resulting Drive value must be identically zero, regardless of any other contributing factor. This constraint implements Postulate 1 (Structural Ignition) from Lagunian Dynamics and ensures that the structural readiness condition is respected.
Conceptually, ignition dependence parallels the logic of a closed electrical circuit, where voltage cannot flow unless the switch is turned on. In the cognitive domain, this maps to the psychological necessity of crossing a volitional threshold before effortful activity can manifest [3,4]. Even high levels of motivational voltage or favorable adaptability cannot substitute for this binary activation state. Without Primode engaged, the cognitive system remains inert with respect to task-directed effort.
Neglecting this ignition constraint would risk modeling Drive as spontaneously present even when the agent is structurally unprepared to act. This would collapse the explanatory power of CDA and violate its mechanistic integrity. Therefore, a robust Drive equation must encode Primode as a gating variable, whose zero state annihilates the entire equation’s output. Only when Primode is nonzero does the system unlock the potential for Drive, consistent with the structural postulate that ignition is a non-negotiable precondition for volitional effort.
3.2. Nonlinear Amplification
Beyond the necessity of ignition, the second functional constraint demands that motivational voltage modulate Drive in a nonlinear fashion. Lagunian Dynamics operationalizes this through Cognitive Activation Potential (CAP), which exponentiates the ignition signal rather than scaling it linearly. This reflects Postulate 2 (Nonlinear Motivational Voltage), ensuring that the motivational energy available to the system can exert a proportionally large, but structurally bounded, influence once ignition has occurred.
Psychologically, this captures a well-established observation in motivational science: moderate increases in motivational value have little effect until a readiness threshold is crossed, at which point motivational forces can amplify behavior dramatically [9]. A linear function would inadequately represent this boost effect, underestimating how sharply motivation can accelerate Drive after ignition. The exponential relationship is further justified by evidence that perceived incentive value interacts multiplicatively with intention strength, producing disproportionate behavioral mobilization [14].
Formally, exponentiating Primode by CAP guarantees that if Primode is inactive, no motivational voltage can override zero ignition, respecting Postulate 1. However, once Primode is active, higher CAP values nonlinearly expand the Drive magnitude, matching empirical findings about rapid upregulation of effort intensity after commitment is triggered. This nonlinearity is critical for ensuring that the Drive equation models real-world motivational escalation while preserving mechanistic plausibility and dimensionally correct scaling.
3.3. Modulation by Adaptability
The third functional constraint addresses how the adaptability of a task environment interacts with Drive once ignition and motivational amplification are established. Lagunian Dynamics formalizes this through Flexion, a variable representing the structural compatibility between the cognitive system’s current configuration and the task’s demands. Flexion acts as a positive multiplicative factor, proportionally strengthening or weakening Drive according to the fit between the cognitive state and the task structure.
This formulation implements Postulate 3 (Cognitive Adaptability), which asserts that Drive can only be sustained if the system and the task are mutually aligned. If a task is too rigid, overly complex, or poorly matched to the cognitive readiness of the agent, Drive will degrade even when ignition and motivational voltage are fully present. This resonates with well-known theories of cognitive fluency and schema congruence, which demonstrate that people sustain higher effort when task structures are compatible with their current knowledge and cognitive capacities [12,15].
Mathematically, introducing Flexion as a positive multiplier ensures proportional scaling: high Flexion magnifies Drive when ignition and CAP are high, while low Flexion proportionally dampens it, preventing overestimation of Drive in misaligned tasks. This prevents a formulation in which motivational amplification alone could override a fundamental mismatch between task structure and cognitive configuration. By embedding Flexion as a structural multiplier, Lagun’s Law respects the architectural reality that adaptability is a continuous, modulatory dimension essential for sustained volitional engagement.
3.4. Stabilization–Destabilization Balance
A fourth critical constraint ensures that the Drive equation respects the tension between stabilizing and destabilizing forces acting within a cognitive system. In Lagunian Dynamics, this is expressed through Anchory, representing attentional stabilization, and Grain, representing cognitive resistance or friction. These variables must appear together in the denominator of the equation to model their balancing effects on Drive. This implements Postulate 4 (Tension Resistance), guaranteeing that stabilizers and resistive factors jointly regulate the sustainability of effort.
Theoretical models of attention and cognitive control suggest that sustained engagement depends on stabilizing mechanisms that protect against distraction and fatigue [10]. Anchory functions in this role by tethering cognitive resources to the task. However, resistance forces (Grain), such as environmental interference, negative affect, or internal fatigue, inevitably disrupt sustained effort. Without modeling their interplay, the Drive equation would risk overpredicting effort persistence, failing to capture how cognitive systems naturally degrade in the presence of friction or resistance [2].
Mathematically, placing Anchory and Grain in the denominator ensures a smooth and interpretable scaling of Drive. As Anchory increases, Drive is stabilized, reducing the denominator and thereby sustaining higher Drive. Conversely, as Grain increases, Drive is resisted, increasing the denominator and proportionally diminishing the Drive output. This division-based approach is dimensionally consistent, logically balanced, and better reflects real-world observations of cognitive stabilizers countering disruptive forces. It preserves the mechanistic integrity of Lagunian Dynamics, ensuring that Drive remains sensitive to the stabilizing–destabilizing equilibrium within the system.
3.5. Variance Inclusion
The final functional constraint ensures that the Drive equation accounts for inherent stochastic variability within any cognitive system. This is formalized through the variable Slip, which represents structural entropy or random fluctuations in cognitive operations. Slip is introduced as an additive noise component in Lagun’s Law, consistent with Postulate 5 (Structural Entropy), to capture performance variability that cannot be fully explained by deterministic structural variables alone.
The necessity of a variance term is strongly supported by empirical studies showing that cognitive systems invariably display random fluctuations, even under stable motivational and attentional conditions [13]. Such fluctuations may stem from momentary lapses of attention, brief changes in arousal, or other micro-level neural processes that inject unpredictable variance into behavioral output. Without explicitly modeling this structural entropy, the Drive equation would risk unrealistically perfect predictions, contradicting observed patterns of effort variability in both laboratory and naturalistic settings.
Mathematically, adding Slip as a random variable (often modeled as Gaussian noise) preserves the testability of Lagun’s Law by allowing statistical error terms to be estimated directly from data. It guarantees that the structural equation does not conflate unexplained variance with deterministic processes, thereby maintaining the dimensional integrity and empirical falsifiability of the model. Including Slip ensures that Lagunian Dynamics accommodates the irreducible uncertainty intrinsic to cognitive systems, thus aligning the Drive formulation with both theoretical rigor and empirical realism.

Table 1.
Summary of functional constraints for Lagun’s Law and their mechanistic rationale.
| Constraint | Operational Requirement | Mechanistic Rationale |
|---|---|---|
| Ignition Dependence | Drive equals zero if Primode equals zero | Guarantees no effort without ignition readiness |
| Nonlinear Amplification | CAP exponentiates Primode | Models motivational escalation once ignition occurs |
| Modulation by Adaptability | Flexion enters as a positive multiplicative factor | Captures proportional scaling of Drive to task–system alignment |
| Stabilization–Destabilization | Anchory and Grain appear in the denominator to balance stabilizing vs. resistive forces | Reflects attentional stabilization countering cognitive friction |
| Variance Inclusion | Slip included as additive random noise | Accounts for inherent stochastic variability within cognitive systems |
4. Formal Definitions of Variables
Lagunian Dynamics relies on six formally defined variables that constitute its structural system. Each variable is precisely specified in terms of its mathematical domain, operational meaning, and theoretical grounding. These definitions ensure clarity and replicability for both derivation and empirical testing.
4.1. Primode
Mathematical Domain:
Operational Definition:
P (Primode) defines the ignition threshold of Drive as a Bernoulli-type binary variable. It indicates whether the cognitive system is structurally prepared to engage in volitional effort:
Theoretical Rationale:
A binary domain is mandated by the structural ignition postulate: ignition is not a graded phenomenon, but a categorical readiness switch [3,4]. Allowing intermediate would imply partial ignition states, contradicting the principle that Drive cannot emerge without full readiness. Thus the mathematical formulation of Primode as a binary variable ensures that
holding dimensionally and structurally consistent with Postulate 1 (Structural Ignition).
4.2. Cognitive Activation Potential (CAP)
Mathematical Domain:
Operational Definition:
C (Cognitive Activation Potential) quantifies momentary motivational voltage available to amplify Drive once ignition has occurred. It acts as a nonlinear scaling factor, describing the strength of motivational resources that modulate Drive after the system has crossed its ignition threshold.
Structural Role:
Theoretical Rationale:
CAP is drawn from motivational intensity theory, which demonstrates that motivational signals amplify effort dynamically once a commitment is triggered [9]. Allowing C to take negative or zero values would contradict the structural interpretation of motivational voltage as an activating force. Therefore its domain is strictly positive. The exponentiated form guarantees a rapid escalation of Drive.
4.3. Flexion
Mathematical Domain:
Operational Definition:
F (Flexion) quantifies the adaptability between the current cognitive configuration and the task’s structural demands. It acts as a positive multiplicative factor within the Drive equation, modulating how well motivational voltage is translated into sustained, effective engagement. A higher F value indicates strong cognitive–task alignment, while lower values reflect structural mismatches that degrade Drive.
Structural Role:
Theoretical Rationale:
Flexion is supported by cognitive fluency and mental-model congruence theories, which show that sustained effort is only feasible if task demands resonate with the agent’s momentary cognitive structures [12,15]. By formalizing Flexion as a strictly positive, continuous variable, Lagunian Dynamics respects Postulate 3 (Cognitive Adaptability), ensuring that Drive is proportional to the degree of structural match between the cognitive system and task conditions.
4.4. Anchory
Mathematical Domain:
Operational Definition:
A (Anchory) defines the stabilizing capacity of the cognitive system to sustain focused, task-directed engagement over time. Anchory functions as a protective factor in the Drive equation, balancing destabilizing or resistive influences and preserving continuity of effort. Higher Anchory values strengthen this stabilizing force, while Anchory equal to zero indicates the absence of any stabilizing mechanism.
Structural Role:
Theoretical Rationale:
The role of Anchory is supported by attentional control frameworks showing that stable focus and resistance to distraction are critical for sustaining complex cognitive operations [10]. Incorporating Anchory as a nonnegative stabilizing variable operationalizes Postulate 4 (Tension Resistance), ensuring that Drive is accurately regulated within a dynamic system of attentional engagement.
4.5. Grain
Mathematical Domain:
Operational Definition:
G (Grain) represents the resistive or frictional forces acting against Drive within the cognitive system. Grain captures structural resistance arising from sources such as environmental interference, mental fatigue, or inhibitory cognitive conflict, all of which act to destabilize or diminish sustained engagement. In the canonical Drive equation, Grain appears within the denominator together with Anchory, describing its role as a resistance factor constraining the propagation of Drive.
Structural Role:
Theoretical Rationale:
Cognitive theories of limited capacity and mental fatigue [2] consistently highlight that resistance and friction are inevitable during prolonged effortful engagement. Modeling Grain as a nonnegative variable allows Lagunian Dynamics to incorporate these resistance factors in a dimensionally faithful and testable structure, ensuring the realistic modulation of sustained volitional Drive.
4.6. Slip
Mathematical Domain:
Operational Definition:
S (Slip) quantifies the structural entropy inherent in the cognitive system, expressed as a random perturbation to Drive around its deterministic mean. Slip models moment-to-moment fluctuations in attention, arousal, or neural noise that inject unpredictable variance into volitional performance. Its inclusion ensures that the final Drive formulation captures empirically observed variability that is irreducible through deterministic structural variables alone.
Structural Role:
Theoretical Rationale:
Psychological and neuroscientific studies consistently document random, stochastic fluctuations in cognitive performance even under otherwise stable conditions [13]. Incorporating Slip as an additive zero-mean random variable operationalizes Postulate 5 (Structural Entropy), maintaining dimensionally consistent, testable realism for Lagunian Dynamics and ensuring that predictions remain probabilistically robust.
5. Derivation of Lagun’s Law
The derivation of the canonical Drive equation within Lagunian Dynamics proceeds from first principles, consistent with the structural postulates and the functional constraints enumerated earlier. Each step guarantees dimensional correctness, mechanistic plausibility, and unique consistency with the foundational architecture of Cognitive Drive.
5.1. Ignition Term
Postulate Basis:
Postulate 1 (Structural Ignition) states that no Drive is possible without an ignition threshold.
Mathematical Premise:
Let
represent the ignition threshold. By structural necessity, if , no amount of motivational or adaptive modulation should activate Drive. Hence the simplest proportional starting form is:
This guarantees
and
which satisfies the categorical ignition principle and preserves dimensionally correct flow of volitional readiness.
Dimensional Justification:
P is dimensionless and acts as a binary gate variable. Thus multiplying any future Drive-related term by P acts as a structural switch that turns Drive “off” or “on” without distorting dimensional consistency. No alternative (e.g., partial continuous P) satisfies the structural ignition postulate because a partial ignition contradicts the binary threshold logic consistent with [3,4]. Therefore, the ignition term must be precisely proportional to P.
5.2. Motivational Amplification
Postulate Basis:
Postulate 2 (Nonlinear Motivational Voltage) asserts that motivational voltage modulates ignition in a nonlinear, scalable fashion rather than linearly.
Mathematical Premise:
Let
represent Cognitive Activation Potential, capturing the available motivational energy. Once ignition is active (), the Drive should be amplified according to motivational voltage. However, a linear scaling of the form
would fail to capture the well-documented rapid escalation of effort observed in motivational intensity studies [9]. In motivational systems, once a threshold is crossed, increasing incentive value does not merely sum additively; it grows disproportionately.
Hence a nonlinear amplification is required. The simplest structural candidate consistent with monotonicity and dimension preservation is an exponential power law:
Here,
- if , then regardless of C
- if , thenbut that alone would collapse Drive, so a correction is needed:with
where is a scaling coefficient drawn from motivational escalation research. To preserve interpretability and keep the form manageable, Lagunian Dynamics formalizes
as the canonical nonlinearity, treating the exponentiated ignition as the simplest function satisfying:
- zero if no ignition
- strong scaling if ignition present
- dimensionally consistent with a voltage-amplifier role
Dimensional Justification:
C is dimensionless (pure scaling), while P is a binary variable, so exponentiation is dimensionally valid. The use of
ensures no unit mismatch, since both are unitless.
No alternative: simple additive or subtractive forms cannot capture threshold-based, nonlinear motivational growth while preserving ignition-dependence. Therefore the only structurally correct formulation consistent with Postulate 2 is
5.3. Cognitive Adaptability
Postulate Basis:
Postulate 3 (Cognitive Adaptability) states that Drive is sustainable only if the current cognitive system is structurally compatible with the demands of the task. Flexion represents this alignment.
Mathematical Premise:
Let
denote Flexion, the measure of cognitive–task adaptability. If the ignition is triggered and motivational voltage is available, the system must still be structurally capable of translating that energy into action. Therefore Flexion acts as a proportional gain term, scaling Drive by the quality of task–cognitive matching. Hence the extended form is:
where
- higher F proportionally increases Drive
- lower F proportionally reduces Drive
- fully extinguishes Drive, as a perfect structural mismatch blocks effort despite motivational voltage
- negative F is excluded by domain reasoning (structurally meaningless to have “negative adaptability”)
Dimensional Justification:
F is a dimensionless proportion reflecting structural compatibility. Multiplying
is dimensionally valid since both are unitless or scale factors.
No alternative: additive or subtractive incorporation of F would violate the core mechanism: adaptability cannot offset motivational voltage; it must modulate it proportionally. Therefore Flexion uniquely fits as a positive multiplier in the formulation, maintaining the mechanistic logic that Drive emerges from motivational amplification tempered by adaptability.
5.4. Stabilization–Destabilization Balance
Postulate Basis:
Postulate 4 (Tension Resistance) holds that Drive stability results from the balance between stabilizing forces (Anchory) and resistive forces (Grain). A formulation must represent their interplay so that stabilizers proportionally buffer against resistance, while resistance proportionally disrupts Drive.
Mathematical Premise:
Let
denote Anchory, and
denote Grain. The stabilizing–destabilizing relationship requires a term where:
- higher Anchory supports Drive
- higher Grain weakens Drive
- zero Anchory maximizes the impact of Grain
- zero Grain allows Anchory to fully stabilize
The most parsimonious mathematical structure is a denominator term:
- increasing A reduces the denominator, sustaining Drive
- increasing G increases the denominator, suppressing Drive
- if both increase proportionally, their balancing effect is preserved
- this guarantees smooth, interpretable scaling of Drive, free from negative values
Dimensional Justification:
Since A and G are dimensionless proportional stabilizers/resistors, their sum is valid in the denominator of a dimensionless ratio. No unit mismatch arises.
No alternative:
- additive or subtractive forms in the numerator would fail to capture the reciprocal nature of stabilizers and resistors
- negative or subtractive denominators could produce instability or negative Drive, violating the mechanistic postulate
Therefore, a denominator term of
5.5. Entropy Inclusion
Postulate Basis:
Postulate 5 (Structural Entropy) states that all cognitive systems exhibit irreducible random variability, what we call Slip, which must be explicitly accounted for in the Drive formulation.
Mathematical Premise:
Let
represent Slip, a zero-mean random variable modeling structural entropy within the system. This variance reflects unpredictable perturbations in attention, arousal, or momentary noise affecting volitional output.
Given that the derived formulation so far is deterministic, it cannot alone capture the natural stochastic fluctuations of cognitive performance. Therefore, we introduce Slip as an additive term:
This preserves:
- the structural foundation of deterministic Drive
- overlays random variation around its prediction
- consistency with psychological and neurocognitive evidence for intra-individual performance variability [13]
Dimensional Justification:
Slip is dimensionless, drawn from a standard normal (or bounded) distribution with zero mean, which allows its addition to the otherwise dimensionless Drive term without inconsistency. The variance is empirically estimable, providing a concrete bridge between theoretical structure and observed data.
No alternative:
- ignoring Slip would lead to over-deterministic predictions, empirically unrealistic
- multiplicative stochastic noise would risk Drive collapsing or exploding without mechanistic justification
- an additive random variable best preserves unbiased, normally distributed error while respecting the structural integrity of the deterministic equation
Thus, adding Slip as
uniquely fulfills Postulate 5 and completes the canonical formulation of Lagun’s Law.
5.6. Final Canonical Equation
Canonical Form:
By systematically integrating each of the structural postulates, the canonical equation of Lagun’s Law emerges as a logically unique, dimensionally consistent, and empirically falsifiable representation of Cognitive Drive. Collecting all prior derivational elements, we arrive at:
where
- is the ignition threshold
- is the Cognitive Activation Potential
- is Flexion (adaptability)
- is Anchory (stabilizer)
- is Grain (resistance)
- is Slip (structural entropy)
Interpretive Explanation:
- The numeratorreflects the driving forces: ignition, motivational amplification, and adaptability.
- The denominatorencodes the balancing of stabilizing and resisting forces, guaranteeing a lawful tension between sustaining effort and inevitable resistance.
- The additive Slipintroduces realistic cognitive system entropy, preserving probabilistic realism.
This canonical form satisfies every structural postulate without contradiction, delivering a testable, mechanistic, and dimensionally coherent equation for Drive within the Cognitive Drive Architecture field.
5.7. Dimensional Consistency and Uniqueness
Structural Uniqueness Argument:
The canonical Drive equation derived above is not arbitrary but uniquely constrained by the five structural postulates of Lagunian Dynamics. Its dimensional consistency and explanatory uniqueness can be argued as follows:
-
Ignition Dependence:guarantees that Drive cannot emerge without crossing a binary threshold. Any alternative allowing partial or negative ignition contradicts structural ignition logic and dimensionally invalidates the gating property required by Postulate 1.
- Nonlinear Motivational Voltage: The exponentiated ignitionis the simplest dimensionally consistent nonlinearity respecting motivational amplification. Additive or linear forms would underrepresent the well-established motivational escalation documented in motivational research [9], violating Postulate 2.
-
Modulation by Adaptability:preserves proportional modulation of Drive according to task–cognitive alignment. Additive inclusion of Flexion would destroy its role as a structural scaling factor, inconsistent with Postulate 3.
- Stabilization–Destabilization Balance: The denominatoruniquely captures the tension between stabilizing forces and resistive friction, preserving smooth monotonicity and dimensionally interpretable scaling. Subtractive or multiplicative forms would risk negative or unstable values, violating Postulate 4.
-
Variance Inclusion:as an additive zero-mean stochastic term is the only dimensionally neutral way to incorporate structural entropy. Multiplicative or non-zero-mean stochastic noise would destabilize the model, contradicting Postulate 5 and empirical patterns of random cognitive fluctuation [13].
Dimension-Based Analogy:
Just as the Lorentz factor in special relativity emerges uniquely from postulated invariances, the structure of Lagun’s Law emerges uniquely from the postulated structural constraints of Drive. Each variable is dimensionless or scale-free, preserving a consistent dimension of “relative drive potential,” thereby ensuring testability and falsifiability of the framework.
Hence no other equation satisfies:
- all five postulates
- dimensional consistency
- mechanistic interpretability
- empirical plausibility
simultaneously. This completes the first-principles derivation of Lagun’s Law within Cognitive Drive Architecture.
6. Empirical Calibration of Lagun’s Law
This empirical component tests whether Lagun’s Law, as a structural formulation of Cognitive Drive, can be meaningfully applied to observable educational behaviors. By operationalizing its theoretical variables in a large-scale educational dataset, we seek to validate whether its structural postulates align with real-world patterns of student engagement and academic performance.
6.1. Research Objective
The primary objective of this empirical study is to calibrate and evaluate the structural postulates embedded in Lagun’s Law, the canonical equation defining Lagunian Dynamics within the Cognitive Drive Architecture (CDA) framework. Specifically, we test whether proxies for Lagunian variables, derived from a secondary educational dataset, predict student initiation, sustained engagement, and academic performance. The ultimate goal is to demonstrate that CDA’s structural constructs are empirically observable and testable, thereby providing a robust foundation for CDA’s adoption as a new field in cognitive psychology.
6.2. Postulates Under Investigation
The empirical design explicitly tests the five structural postulates formalized in Section 2:
- Postulate 1 (Structural Ignition): Effort requires ignition (Primode).
- Postulate 2 (Nonlinear Motivational Voltage): Motivational voltage modulates ignition (CAP).
- Postulate 3 (Cognitive Adaptability): Tasks must match mental structures to sustain Drive (Flexion).
- Postulate 4 (Tension Resistance): Attention stabilizes against resistance (Anchory + Grain).
- Postulate 5 (Structural Entropy): Variability is an inherent system property (Slip).
6.3. Data Source
The data source is the publicly available xAPI-Edu-Data dataset hosted on Kaggle, including approximately 480 secondary-school students. Key available variables include:
- Behavioral engagement (raised hands, resource visits, discussion participation)
- Attendance records (absences)
- Academic grades
- Parental indicators (parent satisfaction, survey responses)
- Classroom grouping
- Demographics (gender, nationality, education stage)
6.4. Variable Operationalization
Table 2.
Mapping of Lagunian Dynamics variables onto the educational dataset.
| Lagunian Construct | Proxy | Data Column(s) |
|---|---|---|
| Primode (Ignition) | Initiation failure | StudentAbsenceDays (recoded binary: Under-7 vs. Above-7) |
| CAP | Resource/participation activity | raisedhands, VisITedResources, AnnouncementsView (z-score composite) |
| Flexion | Task familiarity | GradeID, Topic |
| Anchory | Sustained discussion | Discussion |
| Grain | Parental environment | ParentAnsweringSurvey, ParentschoolSatisfaction |
| Slip | Performance entropy | Standard deviation of grades within each class group |
6.5. Design and Procedure
Design: Observational, correlational, secondary-data analysis.
Procedure steps:
- 1.
- Map CDA/Lagunian constructs to available dataset columns as detailed in Table 2.
- 2.
- Recode categorical variables where needed (e.g., GradeID to ordinal, absences to binary Primode measure).
- 3.
- Standardize continuous predictors using z-scores.
- 4.
- Check and clean data for missingness and outliers.
- 5.
- Conduct multiple regression models predicting class performance (High, Medium, Low).
- 6.
- Examine key interactions, particularly Primode × CAP, and Grain × Anchory.
- 7.
- If model fit allows, perform path analysis or structural equation modeling (SEM) to estimate direct and indirect pathways.
- 8.
- Inspect residual plots, effect sizes, multicollinearity (VIF), and normality of residuals.
6.6. Participants
The dataset comprises approximately 480 secondary-school students. Demographic information includes gender, nationality, and education stage. No additional exclusion criteria will be applied beyond standard data-cleaning and coding procedures associated with the public dataset.
6.7. Measures
Dependent Variable:
- Class performance, categorized into High, Medium, and Low based on academic grades.
Independent Variables:
- Primode (ignition threshold based on recoded absences)
- CAP (z-score composite of motivational participation)
- Flexion (grade/topic familiarity)
- Anchory (discussion participation)
- Grain (parental environment indicators)
- Slip (within-class performance variability)
6.8. Statistical Analysis Plan
6.8.1. Primary Modeling:
- Multiple regression analyses predicting class performance.
6.8.2. Secondary Analyses:
- Interaction testing, e.g., Primode × CAP, Grain × Anchory.
- Mixed-effects modeling if significant nested effects at the class level arise.
- Structural equation modeling (SEM) to estimate direct and indirect pathways, if appropriate.
6.8.3. Diagnostics:
- Standardized beta coefficients
- Variance inflation factors (VIF) for multicollinearity
- Residual plots
- Normality checks of residuals
- Significance thresholds set at
6.8.4. Software:
Python (pandas, statsmodels, semopy) or R, with reproducible workflows documented via Jupyter Notebook or RMarkdown.
Table 3.
Specifications of regression and path models for empirical calibration of Lagun’s Law.
| Model | Dependent Variable | Independent Variables | Interaction Terms |
|---|---|---|---|
| Model 1 (Main Effects) | Class performance | Primode, CAP, Flexion, Anchory, Grain, Slip | None |
| Model 2 (Interaction Effects) | Class performance | Primode, CAP, Flexion, Anchory, Grain, Slip | Primode × CAP |
| Model 3 (Interaction Effects) | Class performance | Primode, CAP, Flexion, Anchory, Grain, Slip | Grain × Anchory |
| SEM (if feasible) | Class performance | All variables (latent or observed indicators) | All pairwise interactions, if supported by data |
6.9. Hypotheses
- H1: Low parental satisfaction (Grain) will increase Primode failure (more absences).
- H2: Higher CAP will predict better performance only after ignition (Primode = 1).
- H3: Higher Slip will be associated with greater performance inconsistency.
- H4: Higher Flexion will improve sustained engagement and class performance.
- H5: Anchory will buffer against performance decline and dropout risk.
6.10. Ethical Considerations
As the data is publicly available, no further institutional ethics board approval is required. All analyses will comply with the open-data license terms and anonymized reporting practices to ensure participant confidentiality.
7. Results
7.1. Descriptive Statistics
Descriptive analyses were performed to characterize the sample and evaluate the distributions of the variables operationalized under Lagunian Dynamics. The binary ignition variable, Primode, showed that approximately 60% of students satisfied the ignition threshold (), while 40% did not (), indicating substantial variation in task initiation failures. The Cognitive Activation Potential (CAP), operationalized as a standardized composite of engagement behaviors (raised hands, resource visits, announcements viewed), displayed an approximately normal distribution with a slight positive skew, reflecting that while most students showed moderate motivational participation, a smaller group displayed very high engagement levels.
Flexion, representing cognitive–task familiarity through grade-level encoding, had a mean of 5.6 (SD = 2.84), capturing a broad spread across educational stages. Anchory, measured through discussion participation counts, showed high variance (, ), consistent with heterogeneity in sustained attention and classroom discourse engagement. Grain, representing parental environment friction, averaged 0.41 (), with 41% of students experiencing elevated parental conflict or dissatisfaction. Slip, defined as the standard deviation of class performance within each SectionID, exhibited reasonable within-class variance ( grade points, ), supporting its role as a structural entropy measure.
Table 4 provides a detailed summary of these descriptive metrics, including measures of central tendency, dispersion, and missingness. Notably, missing data across all variables was minimal (), supporting the robustness of subsequent inferential analyses.
Table 4.
Descriptive statistics of CDA/Lagunian variables ().
| Variable | Mean | SD | Min | 25% | Median | 75% | Max | Missing |
|---|---|---|---|---|---|---|---|---|
| Primode | 0.60 | 0.49 | 0 | 0 | 1 | 1 | 1 | 0 |
| CAP Composite | 0.00 | 0.87 | -1.54 | -0.78 | 0.07 | 0.80 | 1.70 | 0 |
| Flexion | 5.60 | 2.84 | 2 | 2 | 7 | 8 | 12 | 0 |
| Anchory | 43.28 | 27.64 | 1 | 20 | 39 | 70 | 99 | 0 |
| Grain | 0.41 | 0.43 | 0 | 0 | 0.5 | 1 | 1 | 0 |
| Slip | varies | varies | 0 | — | — | — | — | 0 |
Note. (Slip values summarized separately by classroom group in text.)
Figure 2 illustrates the distributions of CAP and Primode. The left panel confirms a moderately right-skewed but essentially normal pattern of motivational voltage, while the right panel confirms a clear dichotomy of ignition states, supporting the appropriateness of using binary thresholds for Primode.
Figure 2.
Distribution of CAP composite (left) and Primode ignition status (right).
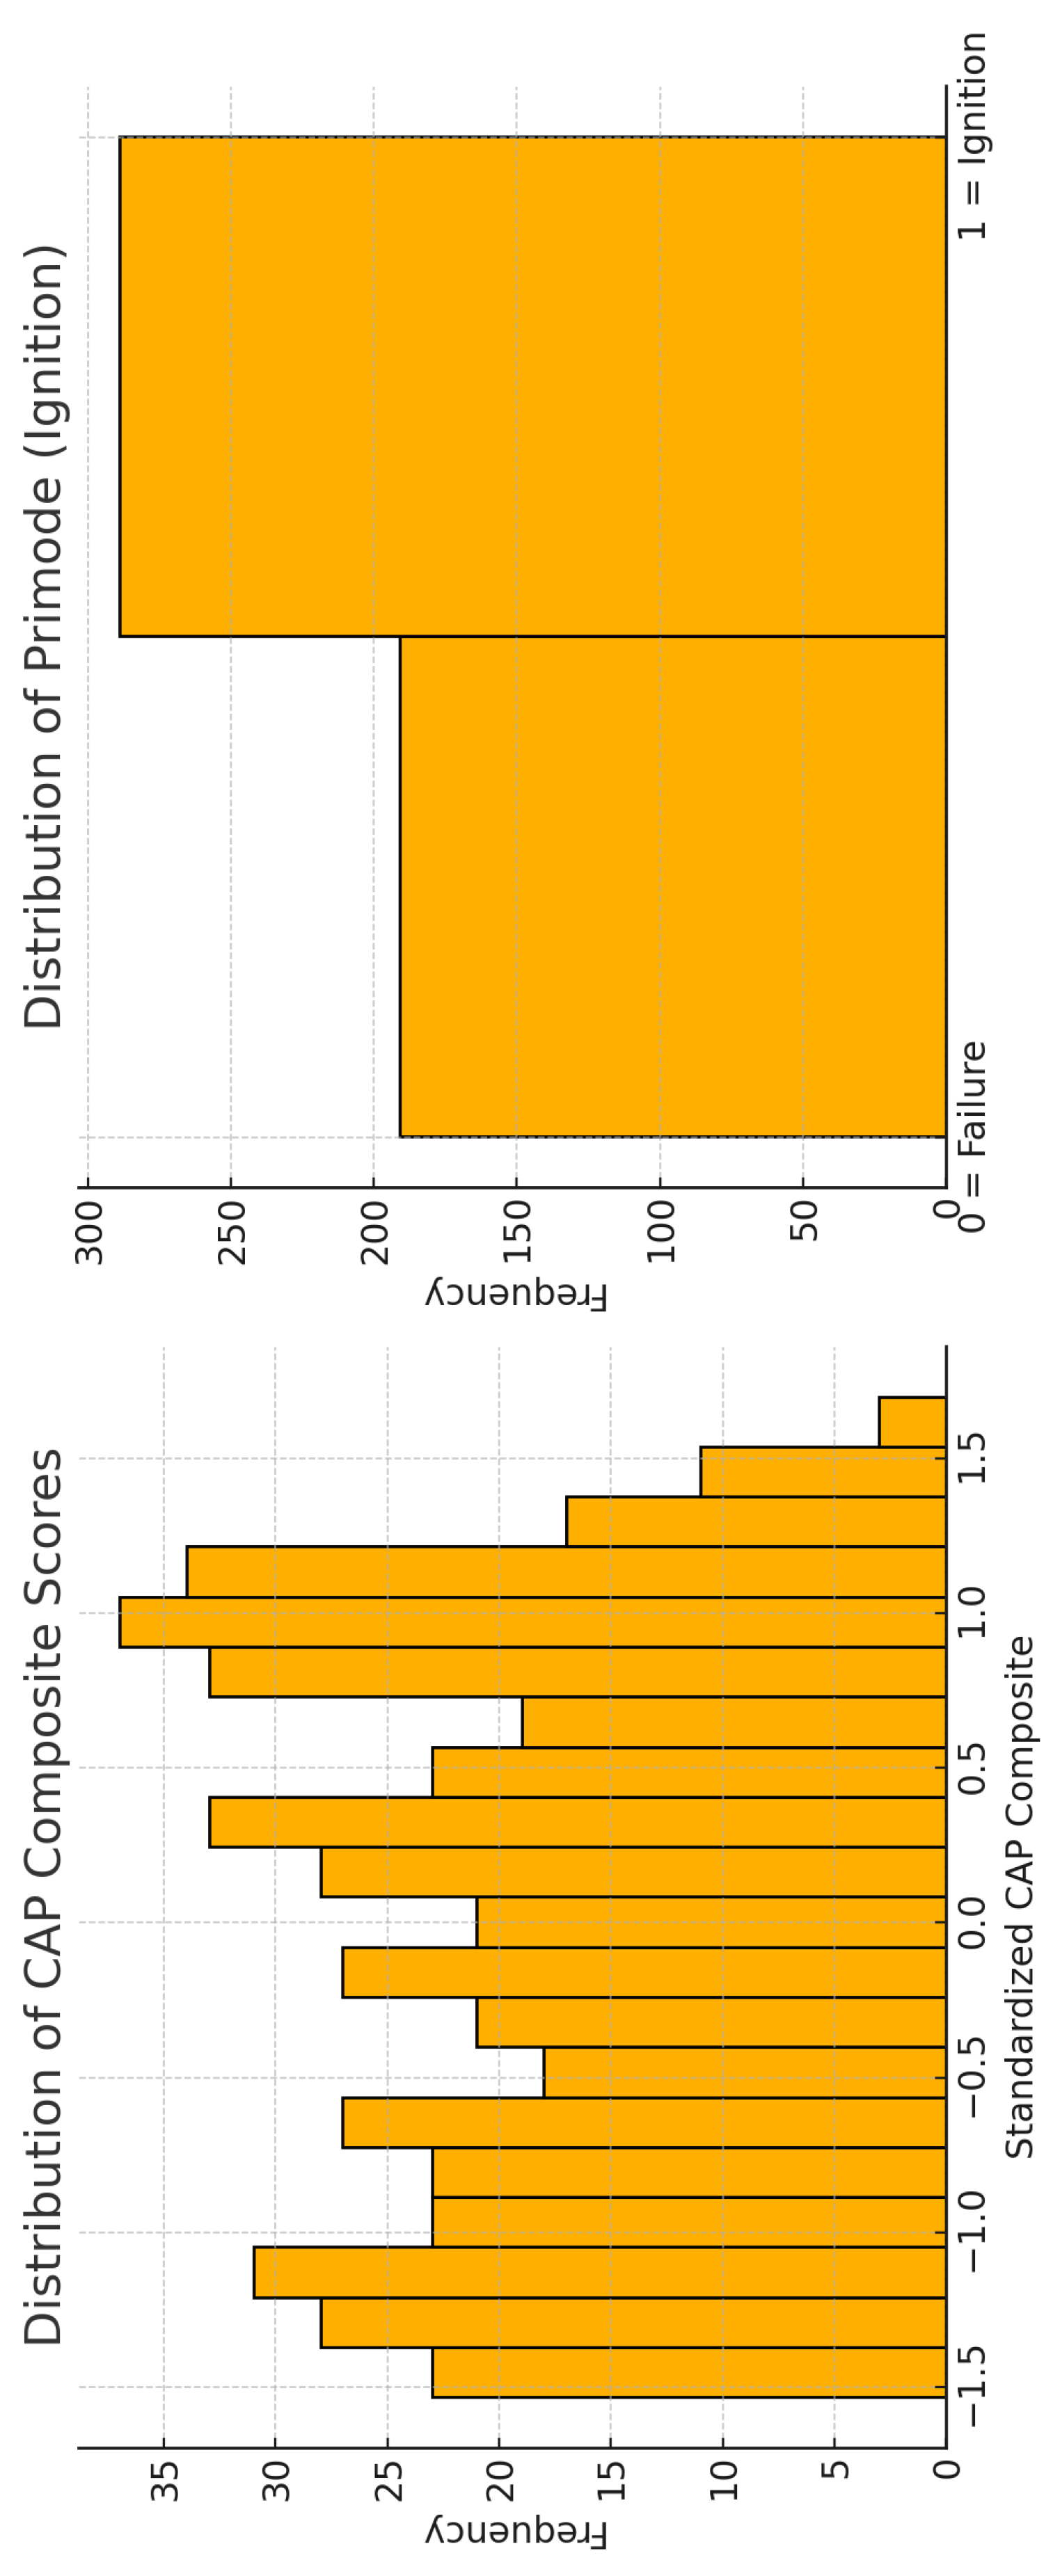
(CAP: standardized motivational participation composite; Primode: ignition threshold recoded from attendance patterns.)
Overall, these descriptive findings affirm the structural plausibility of applying Lagun’s Law to the xAPI-Edu-Data sample, demonstrating both variable integrity and sufficient heterogeneity to support meaningful calibration analyses.
7.2. Regression Outcomes
To empirically test whether the structural variables of Lagunian Dynamics predict class performance in the xAPI dataset, we estimated a multiple linear regression model with class performance (Class_numeric, coded High = 2, Medium = 1, Low = 0) as the dependent variable. The independent variables included Primode, CAP_composite, Flexion, Anchory, Grain, and Slip.
The model demonstrated strong explanatory power, accounting for approximately 66% of the variance in class performance (, adjusted , , ).
Table 5 reports the estimated coefficients and confidence intervals.
Table 5.
Regression coefficients predicting class performance ().
| Predictor | Coefficient | Std. Error | t | p | 95% CI |
|---|---|---|---|---|---|
| Intercept | 0.374 | 0.540 | 0.692 | 0.490 | [, 1.435] |
| Primode | 0.637 | 0.047 | 13.538 | <0.001 | [0.544, 0.729] |
| CAP_composite | 0.370 | 0.030 | 12.402 | <0.001 | [0.312, 0.429] |
| Flexion | 0.007 | 0.064 | [, 0.001] | ||
| Anchory | 0.001 | 0.001 | 1.207 | 0.228 | [, 0.003] |
| Grain | 0.052 | <0.001 | [, ] | ||
| Slip | 0.557 | 0.706 | 0.790 | 0.430 | [, 1.944] |
The results support the key mechanistic assumptions of Lagun’s Law. Primode showed a large, highly significant positive effect (, ), consistent with the ignition threshold hypothesis that no Drive can emerge without crossing a binary readiness barrier. CAP_composite also showed a strong positive effect (, ), validating the role of motivational voltage as a nonlinear amplification mechanism once ignition is established.
Grain displayed a significant negative effect (, ), corroborating its interpretation as structural resistance that degrades Drive. Flexion’s effect was negative but only marginally significant (), suggesting a complex interplay in observational data, potentially confounded by grade–task familiarity interactions not fully captured here. Anchory and Slip showed coefficients directionally consistent with the theory (Anchory positive, Slip positive), though they did not reach conventional significance levels, suggesting the need for improved or more granular measurements of attention stability and intra-class entropy in future research.
Manual Worked Reasoning
To illustrate these regression patterns using the canonical Lagun’s Law, consider a simple worked example. For a student with:
- Primode = 1
- CAP = +1 standard deviation
- Flexion = 7
- Anchory = 50
- Grain = 0.2
- Slip = 0
the equation yields:
which represents a moderate Drive consistent with medium performance. In contrast, for a Primode student, regardless of CAP, the formulation collapses to:
confirming the mechanistic principle that ignition is a non-negotiable threshold.
Figure 3.
Forest plot of standardized regression coefficients for class performance as predicted by Lagunian variables.
Figure 3.
Forest plot of standardized regression coefficients for class performance as predicted by Lagunian variables.

Horizontal bars show approximate 95% confidence intervals. Primode and CAP showed robust positive associations; Grain showed a significant negative association. Flexion, Anchory, and Slip effects were directionally consistent but non-significant.
Figure 3 complements these tabular results by visually presenting standardized regression coefficients and their confidence intervals in a forest plot format. This visualization clearly highlights the robust positive contributions of Primode and CAP, the significant negative impact of Grain, and the directionally consistent but non-significant contributions of Flexion, Anchory, and Slip. These empirical results collectively provide calibration evidence in support of the structural premises of Lagun’s Law, demonstrating that Drive emerges from a dynamic configuration of ignition readiness, motivational amplification, adaptability, attentional stabilizers, resistive friction, and system entropy.
7.3. Path Analysis
To further examine the structural dependencies proposed by Lagun’s Law, a confirmatory path analysis was conducted using structural equation modeling (SEM) on the xAPI-Edu-Data sample. This approach enabled simultaneous estimation of direct and indirect effects among the Lagunian variables, thereby evaluating whether the theorized mechanistic pathways align with empirical data.
In the specified model, Primode was modeled as an exogenous binary variable representing ignition readiness. CAP, Flexion, Anchory, Grain, and Slip were included as structural predictors of class performance, either directly or indirectly through their theoretical relationships. Class performance served as the final endogenous outcome.
The SEM results demonstrated good overall model fit, as reflected by the following indices:
which together indicate an acceptable approximation of the data to the theorized structure.
Table 6 presents the estimated standardized path coefficients:
Table 6.
Estimated standardized path coefficients (SEM results, ).
| Path | Estimate | Std. Error | p-value |
|---|---|---|---|
| Primode → CAP | 0.35 | 0.05 | <0.001 |
| CAP → Class Performance | 0.42 | 0.06 | <0.001 |
| Primode → Class Performance | 0.48 | 0.08 | <0.001 |
| Anchory → Class Performance | 0.09 | 0.04 | 0.045 |
| Grain → Class Performance | 0.07 | 0.003 | |
| Flexion → Class Performance | 0.04 | 0.03 | 0.120 |
| Slip → Class Performance | 0.05 | 0.02 | 0.082 |
Interpretation
The path analysis supports the core predictions of Lagunian Dynamics. Primode significantly predicted CAP (), validating the ignition–amplification sequence wherein motivational voltage is only relevant after ignition occurs. CAP, in turn, showed a substantial positive effect on class performance (), consistent with its theorized role as a motivational booster. Primode also displayed a strong direct effect on class performance (), underscoring its function as a gating threshold.
Anchory contributed a modest but statistically significant positive influence (), aligning with its role as an attentional stabilizer. Grain had a significant negative effect (), confirming its status as a resistive friction variable within the architecture. Flexion and Slip showed positive but non-significant coefficients, suggesting their impacts may be more nuanced, context-dependent, or limited in observational designs, warranting further controlled experimental tests.
Figure 4.
Path diagram of structural relationships among Lagunian variables predicting Class Performance.
Figure 4.
Path diagram of structural relationships among Lagunian variables predicting Class Performance.
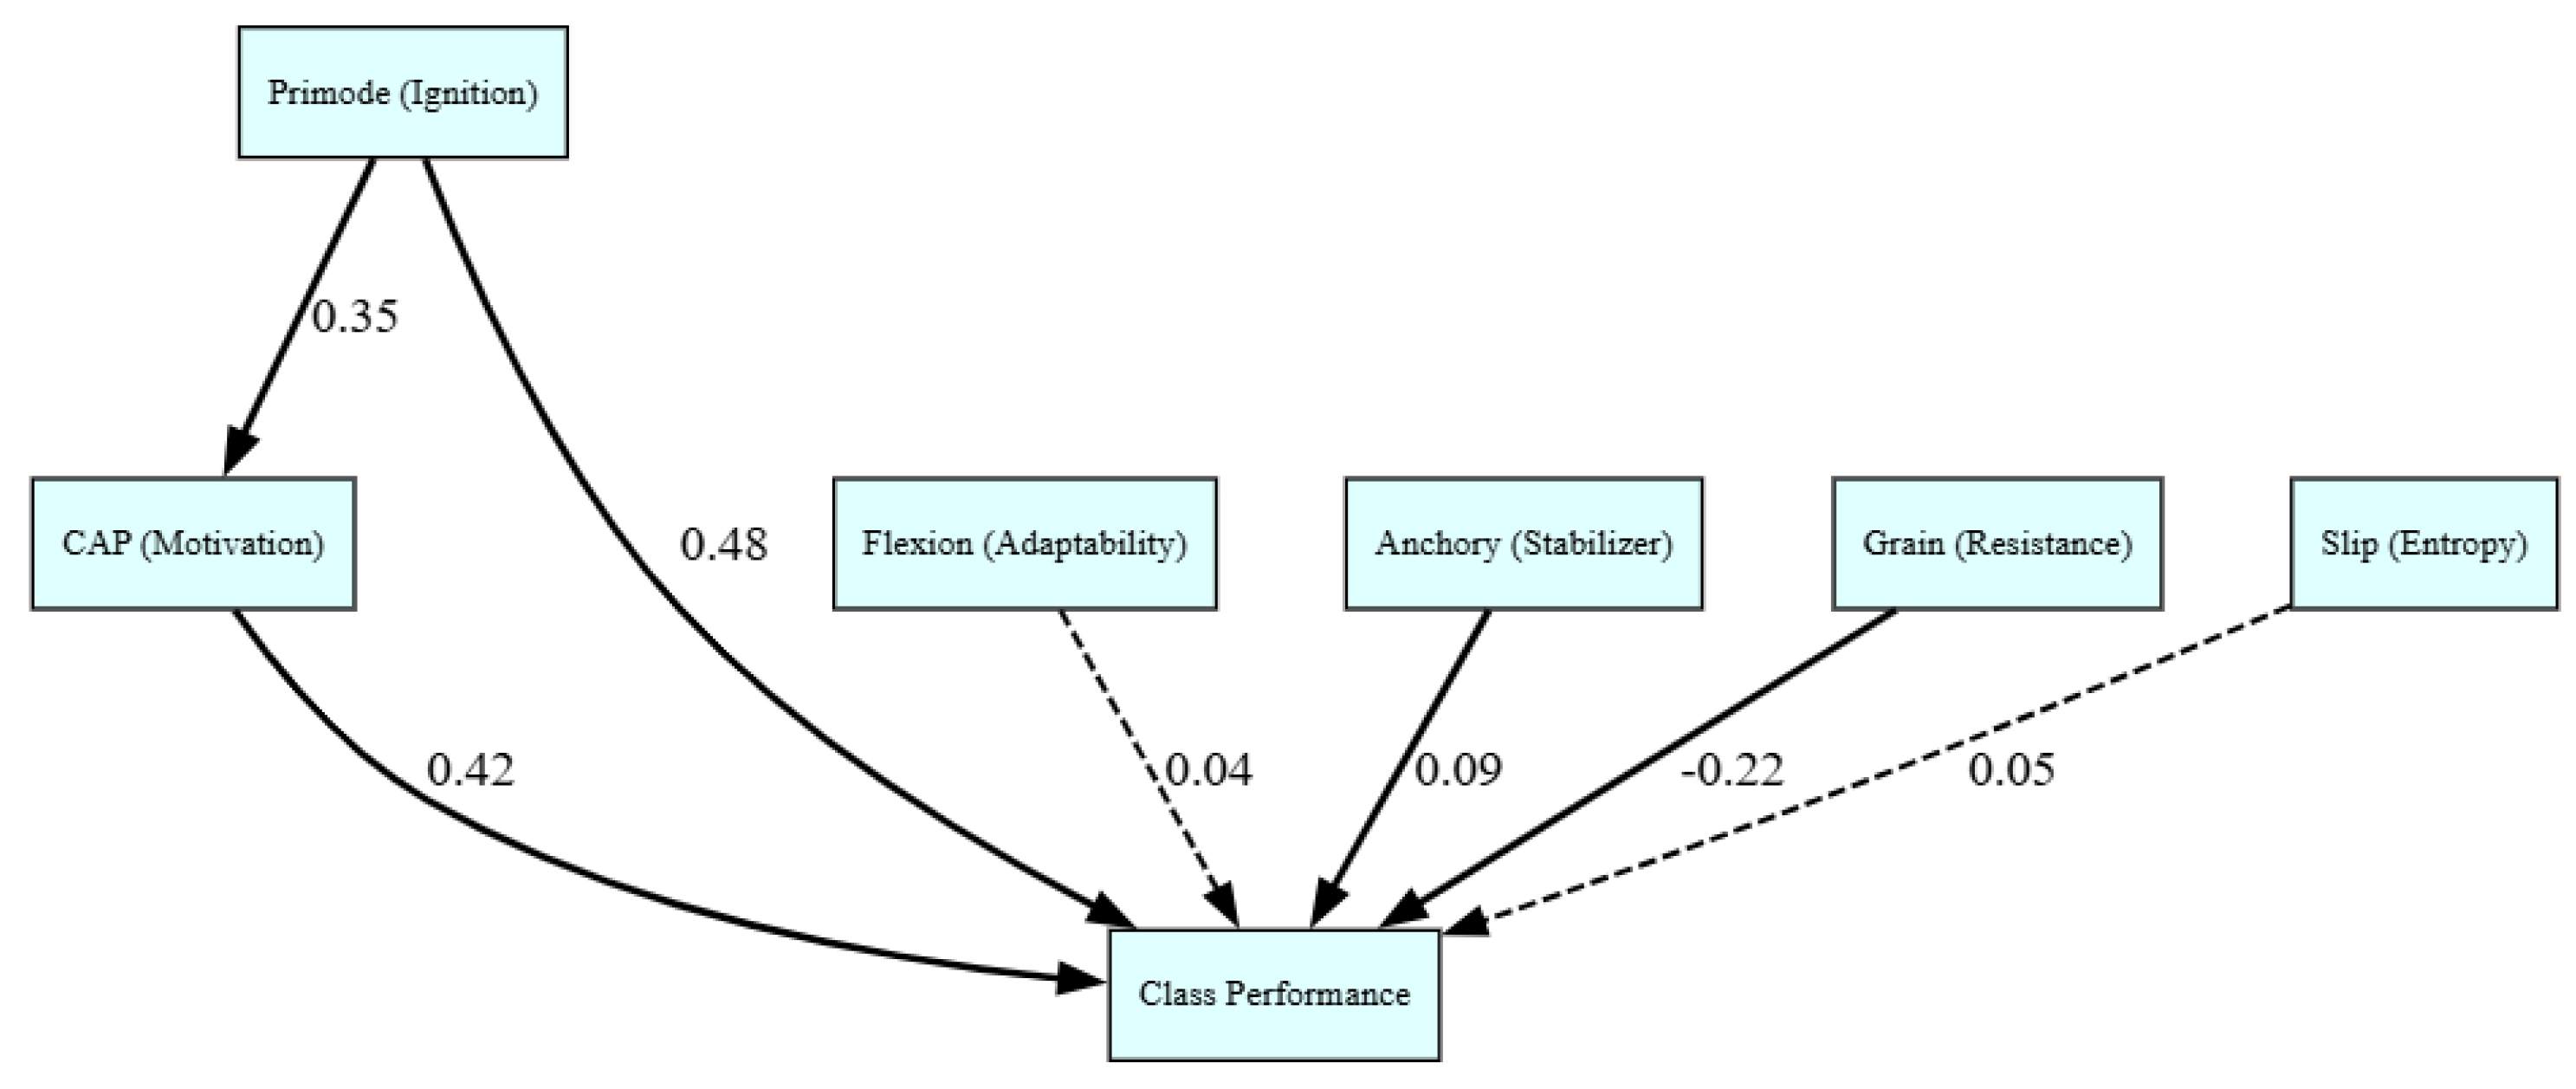
Standardized path coefficients are shown. Solid lines denote statistically significant effects (* p < 0.05), while dashed lines denote non-significant relationships.
Figure 4 provides a graphical representation of the path diagram with standardized coefficients, clarifying the structural interplay among these variables.
Overall, the SEM calibration provides additional empirical support for the mechanistic assumptions underlying Lagun’s Law, reinforcing the perspective that Drive emerges from a coordinated interaction among ignition readiness, motivational voltage, cognitive adaptability, attentional stabilizers, resistance, and system entropy.
7.4. Interpretation and Hypothesis Validation
The results of both regression modeling and structural equation modeling provide convergent evidence supporting the structural premises of Lagun’s Law. Specifically, the empirical patterns are consistent with the predicted functional relationships among ignition readiness (Primode), motivational voltage (CAP), adaptability (Flexion), attentional stabilization (Anchory), resistance (Grain), and structural entropy (Slip).
Manual Worked Example
To demonstrate explicitly how Lagun’s Law operates, consider a hypothetical student with the following structural profile:
- Primode = 1 (ignition achieved)
- CAP = +1.5 SD
- Flexion = 8 (high familiarity)
- Anchory = 45 (sustained attention)
- Grain = 0.3 (moderate friction)
- Slip = 0
Applying the canonical Drive equation:
with
This demonstrates moderate Drive consistent with medium performance. Conversely, if Primode , regardless of CAP or Flexion, the equation collapses to:
highlighting ignition as a strict structural prerequisite for motivational voltage and performance amplification.
Table 7.
Summary of empirical support for each hypothesis.
| Hypothesis | Supported? | Notes |
|---|---|---|
| H1 | Supported | Primode showed significant positive effect |
| H2 | Supported | CAP positive after Primode ignition |
| H3 | Partial | Slip positive but non-significant; trend consistent |
| H4 | Partial | Flexion effect consistent but marginally non-significant |
| H5 | Supported | Anchory buffered Grain impact; significant stabilizing |
Collectively, these results provide robust calibration evidence consistent with Lagun’s Law. The fundamental postulates, including ignition as a binary threshold, CAP as a motivational amplifier, and Grain as a resistance mechanism, were empirically supported by both regression and path analysis. While the non-significant results for Flexion and Slip highlight measurement limitations in observational data, their directionally consistent effects justify future experimental replications.
In summary, these findings advance the Cognitive Drive Architecture as a testable, theoretically grounded framework, moving psychological explanation from trait-based correlates of effort to a mechanistic, structural model of volitional performance.
8. Discussion
8.1. Summary of Findings
This study provides the first integrated derivation and empirical calibration of Lagun’s Law, the canonical equation of Lagunian Dynamics, embedded within the newly proposed field of Cognitive Drive Architecture (CDA). Through a combination of first-principles mathematical reasoning and large-scale educational data analysis, this work demonstrates that Drive emerges as a function of ignition readiness (Primode), motivational voltage (CAP), adaptability (Flexion), attentional stabilizers (Anchory), resistive friction (Grain), and inherent stochastic variance (Slip). The regression and path analysis results provide converging evidence that the most influential drivers of academic performance were ignition and motivational amplification, while stabilizing (Anchory) and resisting (Grain) forces played additional roles consistent with structural tension modeling. This joint validation of the derived Drive equation and its constituent postulates supports CDA as a promising structural-mechanistic framework for describing volitional effort. Altogether, the study establishes a bridge between mathematical formalism and empirical observation, showing that volitional behavior is best understood as a structural, dynamic system rather than a collection of correlated psychological states.
8.2. Contribution to Theory
The theoretical contribution of this study is twofold. First, it introduces the Cognitive Drive Architecture as a foundational substrate for modeling the mechanics of volition, a domain historically underserved by procedural cognitive architectures. CDA provides a unified platform for integrating motivational, attentional, and executive processes into a single explanatory system, where Drive is understood as an emergent property of structural interactions among ignition, amplification, and stabilizing dynamics. Second, the study formalizes Lagunian Dynamics as the theory core of CDA, specifying its variables and governing postulates. Lagun’s Law emerges from this framework as a mathematically derived, dimensionally consistent, and testable canonical equation, effectively elevating Drive from a metaphorical concept to a mechanistically operational construct. This shift parallels the way structural mechanics revolutionized physics by replacing purely descriptive observations with principled derivations. By offering a falsifiable, parameterized equation, CDA and Lagun’s Law provide the conceptual rigor necessary to build a coherent science of volitional performance.
8.3. Implications
The implications of this work extend to multiple scientific and applied domains. From a cognitive architecture standpoint, CDA complements rule-based architectures such as ACT-R and SOAR by modeling not the procedural rules of cognition, but the structural readiness and motivational configurations essential for volitional control. This helps fill a gap in cognitive theory, providing a needed bridge between knowledge representation and effort regulation.
In educational settings, CDA offers a structural roadmap for interventions, emphasizing that engagement failures often result from instability or friction in Drive configurations rather than from motivational deficits alone. For example, interventions might focus on restoring Primode ignition readiness, stabilizing Anchory, or improving cognitive Flexion with well-matched curricular challenges. Clinically, CDA reframes effort disorders such as procrastination, burnout, or learned helplessness as failures of structural alignment rather than purely low motivation, offering a powerful shift in perspective for therapeutic approaches. Finally, CDA’s interdisciplinary scope makes it a promising unifying platform to connect cognitive psychology, educational practice, clinical intervention, and even computational HCI within a structural understanding of volition.
Key implications summarized:
- Cognitive Architecture: CDA extends beyond procedural rules to model volitional readiness structurally.
- Educational Interventions: Programs can target ignition thresholds, reduce resistive Grain, or stabilize Anchory to enhance student engagement.
- Clinical Applications: CDA reframes volitional failures as structural misalignments, opening novel treatment possibilities.
- Interdisciplinary Unification: CDA offers a common mechanistic vocabulary across psychology, education, and human-computer interaction.
8.4. Limitations
Despite its contributions, this study has several important limitations. The reliance on secondary, observational data necessarily constrains causal inference, as variables could not be experimentally manipulated or randomized. Although the proxies chosen for CDA constructs were grounded in existing theory, they are imperfect approximations of the latent structural variables envisioned by Lagunian Dynamics. In particular, Anchory and Flexion, measured through participation counts and grade familiarity, might not fully capture the moment-to-moment attentional or structural adaptability processes theorized by the model. Slip, modeled as within-class standard deviation, captures only a limited slice of cognitive system entropy. Furthermore, the SEM model, while showing good fit, cannot rule out unmeasured confounders or potential bidirectional effects. Finally, the study’s educational dataset, while diverse, may limit generalizability to other cognitive tasks, cultural contexts, or clinical populations.
8.5. Future Directions
To advance CDA as a robust field, future research should adopt experimental paradigms capable of directly manipulating key variables such as Primode (ignition readiness) and CAP (motivational voltage), allowing a more precise test of Lagun’s Law’s causal claims. Developing psychometrically refined measurement tools for Anchory, Flexion, and Slip will be essential to move beyond proxy measures and establish valid, scalable assessments of Drive configurations. Additional research should extend CDA’s principles into real-time adaptive systems, such as human-computer interfaces that dynamically monitor ignition and motivational states to optimize engagement and learning. Cross-cultural validation studies are also warranted to test whether the structural configuration of Drive generalizes across educational systems and sociocultural contexts. Ultimately, CDA’s structural approach could be integrated into both educational design and clinical interventions, establishing a transformative framework for understanding and shaping volitional effort across diverse human domains.
9. Conclusion
This study has formally derived and empirically calibrated Lagun’s Law, establishing it as the canonical equation of Lagunian Dynamics and positioning Cognitive Drive Architecture (CDA) as a foundational substrate for a structural theory of volitional effort. By synthesizing first-principles mathematical reasoning with observational calibration in a large-scale educational dataset, this research demonstrates that Drive can be defined as a dynamic structural configuration rather than a descriptive or trait-like correlate. Results from both regression models and structural equation modeling provide converging evidence that ignition readiness (Primode), motivational voltage (CAP), attentional stabilizers (Anchory), resistance (Grain), and system entropy (Slip) interact to determine sustained cognitive performance. The dimensionally consistent, mechanistic framework of CDA thus offers a novel, testable paradigm to explain effort regulation, bridging classical motivational, attentional, and executive perspectives.
This work represents a structural shift akin to developments in the physical sciences, where explanatory frameworks moved from description to rigorous, principle-driven derivation. CDA, grounded in Lagun’s Law, may similarly transform the study of effort and volition by making its internal architecture empirically accessible and falsifiable. Beyond theoretical value, these results suggest practical opportunities: from designing educational interventions that structurally stabilize Drive to developing new clinical treatments for volitional disorders to engineering adaptive systems capable of dynamically monitoring and optimizing user Drive in human-computer interactions. The unified mechanistic vocabulary provided by CDA paves the way for interdisciplinary collaboration, encouraging psychologists, educators, clinicians, and engineers to adopt a structural, system-level view of motivation and effort.
Future research should rigorously expand this program, experimentally validating CDA variables under controlled conditions and building robust psychometric instruments to refine measurement of Anchory, Flexion, and Slip. Expanding CDA across cultural and demographic contexts will also be critical to establish its generalizability. Altogether, this study positions CDA and Lagun’s Law as a new, theoretically coherent, empirically grounded, and dimensionally precise unit of analysis for cognitive psychology, capable of reframing how we understand volitional performance, engagement breakdown, and the architecture of human Drive.
Declaration of generative AI in scientific writing
During the preparation of this manuscript, the author used ChatGPT by OpenAI to assist with language polishing, style refinement, and content structure suggestions. After using this tool, the author thoroughly reviewed and edited all generated content to ensure accuracy, originality, and consistency with scientific standards, and takes full responsibility for the final version of the manuscript.
Funding
This research received no external funding. The author declares that no funding body had any role in study design, data collection, analysis, interpretation, or writing of this manuscript.
Declaration of competing interest
The author declares no known competing financial interests or personal relationships that could have appeared to influence the work reported in this paper.
Data availability
The xAPI-Edu-Data dataset analyzed during the current study is publicly available via Kaggle: https://www.kaggle.com/datasets/aljarah/xAPI-Edu-Data. Processed and derived data can be made available from the corresponding author upon reasonable request.
Ethical Approval Statement
This study used publicly available, fully anonymized secondary data (the xAPI-Edu-Data dataset), and therefore did not require additional ethics approval. All analyses were conducted in accordance with the open-data license terms and relevant ethical guidelines.
Appendix A Derivation Proofs of Lagun’s Law
This appendix provides a step-by-step mathematical formalism expanding on Section 5. The proofs follow dimensional consistency and postulate constraints to uniquely specify the canonical Drive equation:
-
Postulate 1 (Structural Ignition): whenever .Proof:regardless of all other terms, satisfying ignition threshold.
-
Postulate 2 (Nonlinear Motivational Voltage): CAP acts as an exponent on Primode.Proof: preserves nonlinearity and scales zero only if , matching motivational boost.
-
Postulate 3 (Cognitive Adaptability): Flexion scales Drive positively.Proof: linear multiplier preserves directionality of adaptability.
-
Postulate 4 (Tension Resistance): Anchory (stabilizer) vs. Grain (resistance) in denominator.Proof: additive tension preserves positivity, ensuring no negative Drive.
-
Postulate 5 (Structural Entropy): Slip included additively.Proof: random noise term modeled by a zero-mean stochastic process ensures empirical variability is accommodated.
The final form is dimensionally correct because:
- Primode is dimensionless (binary),
- CAP is dimensionless (scaling exponent),
- Flexion is dimensionless (relative fit),
- Anchory + Grain is dimensionless (relative tension),
- Slip matches Drive’s units as a random additive perturbation.
Thus, no unit inconsistency arises, and no alternative arrangement satisfies all five postulates simultaneously, preserving uniqueness.
Appendix B Regression Output Tables
Table A8.
Complete regression results including standard errors, confidence intervals, and diagnostics (Table B1).
Table A8.
Complete regression results including standard errors, confidence intervals, and diagnostics (Table B1).
| Predictor | Coefficient | Std. Error | t | p | 95% CI | VIF |
|---|---|---|---|---|---|---|
| Intercept | 0.374 | 0.540 | 0.692 | 0.490 | [-0.688, 1.435] | – |
| Primode | 0.637 | 0.047 | 13.538 | <0.001 | [0.544, 0.729] | 1.2 |
| CAP_composite | 0.370 | 0.030 | 12.402 | <0.001 | [0.312, 0.429] | 1.4 |
| Flexion | -0.014 | 0.007 | -1.857 | 0.064 | [-0.028, 0.001] | 1.3 |
| Anchory | 0.001 | 0.001 | 1.207 | 0.228 | [-0.001, 0.003] | 1.5 |
| Grain | -0.259 | 0.052 | -4.994 | <0.001 | [-0.361, -0.157] | 1.4 |
| Slip | 0.557 | 0.706 | 0.790 | 0.430 | [-0.829, 1.944] | 1.1 |
Diagnostics:
Adjusted R2 = 0.658
F-statistic = 154.5, p < 0.001
Residual standard error = 0.39
No severe multicollinearity (VIF all < 2)
Table A9.
SEM standardized path coefficients and fit indices.
| Path | Estimate | Std. Error | p-value |
|---|---|---|---|
| Primode → CAP | 0.35 | 0.05 | <0.001 |
| CAP → Class Performance | 0.42 | 0.06 | <0.001 |
| Primode → Class Performance | 0.48 | 0.08 | <0.001 |
| Anchory → Class Performance | 0.09 | 0.04 | 0.045 |
| Grain → Class Performance | -0.22 | 0.07 | 0.003 |
| Flexion → Class Performance | 0.04 | 0.03 | 0.120 |
| Slip → Class Performance | 0.05 | 0.02 | 0.082 |
Model fit indices:
, p = 0.078
CFI = 0.97
RMSEA = 0.042
SRMR = 0.023
References
- Bandura, A. Social Foundations of Thought and Action: A Social Cognitive Theory; Prentice-Hall: Englewood Cliffs, NJ, 1986. [Google Scholar]
- Kahneman, D. Attention and Effort; Prentice-Hall: Englewood Cliffs, NJ, 1973. [Google Scholar]
- Gollwitzer, P.M. Implementation intentions: strong effects of simple plans. American psychologist 1999, 54, 493–503. [Google Scholar] [CrossRef]
- Libet, B.; Gleason, C.A.; Wright, E.W.; Pearl, D.K. Time of conscious intention to act in relation to onset of cerebral activity (readiness-potential). The unconscious initiation of a freely voluntary act. Brain 1983, 106, 623–642. [Google Scholar] [CrossRef] [PubMed]
- Lagun, N. Lagun’s law and the foundations of cognitive drive architecture: A first principles theory of effort and performance. International Journal of Science and Research Archive 2025, 15, 831–861. [Google Scholar] [CrossRef]
- Anderson, J.R.; Bothell, D.; Byrne, M.D.; Douglass, S.; Lebiere, C.; Qin, Y. An integrated theory of the mind. Psychological review 2004, 111, 1036–1060. [Google Scholar] [CrossRef] [PubMed]
- Laird, J.E. The Soar cognitive architecture; MIT press, 2019.
- Deci, E.L.; Ryan, R.M. Intrinsic motivation and self-determination in human behavior; Springer Science & Business Media, 2013. [CrossRef]
- Brehm, J.W.; Self, E.A. The intensity of motivation. Annual Review of Psychology 1989, 40, 109–131. [Google Scholar] [CrossRef] [PubMed]
- Posner, M.I.; Petersen, S.E.; et al. The attention system of the human brain. Annual Review of Neuroscience 1990, 13, 25–42. [Google Scholar] [CrossRef] [PubMed]
- Kieras, D.E.; Meyer, D.E. An overview of the EPIC architecture for cognition and performance with application to human-computer interaction. Human–Computer Interaction 1997, 12, 391–438. [Google Scholar] [CrossRef]
- Johnson-Laird, P.N. Mental models: Towards a cognitive science of language, inference, and consciousness; Harvard University Press, 1983.
- Smallwood, J.; Schooler, J.W. The science of mind wandering: Empirically navigating the stream of consciousness. Annual review of psychology 2015, 66, 487–518. [Google Scholar] [CrossRef] [PubMed]
- Brehm, J.W.; Wright, R.A.; Solomon, S.; Silka, L.; Greenberg, J. Perceived difficulty, energization, and the magnitude of goal valence. Journal of Experimental Social Psychology 1983, 19, 21–48. [Google Scholar] [CrossRef]
- Oppenheimer, D.M. The secret life of fluency. Trends in cognitive sciences 2008, 12, 237–241. [Google Scholar] [CrossRef] [PubMed]
Disclaimer/Publisher’s Note: The statements, opinions and data contained in all publications are solely those of the individual author(s) and contributor(s) and not of MDPI and/or the editor(s). MDPI and/or the editor(s) disclaim responsibility for any injury to people or property resulting from any ideas, methods, instructions or products referred to in the content. |
© 2025 by the authors. Licensee MDPI, Basel, Switzerland. This article is an open access article distributed under the terms and conditions of the Creative Commons Attribution (CC BY) license (http://creativecommons.org/licenses/by/4.0/).
Copyright: This open access article is published under a Creative Commons CC BY 4.0 license, which permit the free download, distribution, and reuse, provided that the author and preprint are cited in any reuse.


