Submitted:
10 July 2025
Posted:
11 July 2025
You are already at the latest version
Abstract
Cells, with a few exceptions, are the fundamental biological units capable of responding to stimuli, metabolizing, growing, reproducing, and evolving. They are a pivotal example of a complex system, where their agents, proteins, form a network where each of them performs different functions aimed at transporting and transforming energy and resources. From obligate endosymbiont bacteria to neurons, cells can vary in size up to 4 orders of magnitude. This change in size is accompanied by changes in many properties, including rates and components that have the form of scaling relationships but that can be explained by different mechanisms, from simply geometric to optimization. Here we summarize some of the well-known examples of scaling laws in cells and some the their theoretical underpinnings. We conclude that a unified theory to explain the origin of many of these relationships is needed for both pure and applied purposes.
Keywords:
scaling
; cells
Introduction
Cells, with a few exceptions, are the fundamental biological units capable of responding to stimuli, metabolizing, growing, reproducing, and evolving. They are a pivotal example of a complex system, where their agents, proteins, form a network where each of them performs different functions aimed at transporting and transforming energy and resources. From obligate endosymbiont bacteria to neurons, cells can vary in size up to 4 orders of magnitude. This change in size is accompanied by changes in many properties, including rates and components that have the form of scaling relationships but that can be explained by different mechanisms, from simply geometric to optimization. Here we summarize some of the well-known examples of scaling laws in cells and some the their theoretical underpinnings. We conclude that a unified theory to explain the origin of many of these relationships is needed for both pure and applied purposes.
Cells were discovered by Robert Hooke in 1665. After many other further studies and almost two centuries later, a more formal framework known as Cell Theory was suggested by Theodor Schwann in 1839 [1]. This theory proposed three principles: all organisms are made of cells, all existing cells are produced by other living cells, and the cell is the most basic unit of life [2]. Later Cell Theory was combined with detailed molecular perspectives on the cell, including the structure of DNA, the canonical genetic code, and the “Central Dogma” of molecular biology [3], which describes the flow of information with DNA being transcribed into RNA and RNA translated into proteins by the ribosome. Although viewed by many as a theory or accepted paradigm of biology, Crick viewed it as a "grand hypothesis" [4] and indeed this hypothesis, as well as several other paradigms of biology, would subsequently be challenged and revised. For example, recently the largest bacteria was discovered [5], a nucleolus was discovered in an archaeon [6], and a decade ago, the first synthetic cell was built by inserting a genome in a foreign cell, which adopted the new genome and transformed it, adapting its volume and other traits to the new extent of genomic information [7]. Synthetic biologists have argued (quoting Richard Feynman) that “What I cannot create, I do not understand”, and for a complete understanding it is necessary to have a first-principles knowledge of cellular phenomena [8,9,10,11,12].
Traditionally, the development of physical and chemical theories starts with observations about a particular phenomenon up to the point where, after a given amount of data is accumulated, a common pattern is evident. Subsequently, phenomenological mathematical models are often fitted to the data, later leading in some cases to a more fundamental theory based on first principles. This same approach is less common in biology following the molecular revolution which has sought to reveal detailed genetic and molecular mechanisms in single species. However, certain biological histories present cases of an observation-to-theory trajectory. Examples include the temperature dependence of enzymatic rates that was first explained using an exponential Boltzmann function, inspired by statistical mechanics and today known as the Arrhenius equation, [13] and was later derived in the transition state theory [14]. The scaling relationship between metabolic rate and body size was discovered by Kleiber [15] and later theorized by West et al.[16].
Cell Theory is not a theory in the same sense that it is in physics. A theory, and particularly an efficient theory [17], is a framework expressed in the language of mathematics, based on first principles and that makes few assumptions but many predictions that are testable or potentially testable. It is worth mentioning that a theory differs from a mathematical model, which can be a simple phenomenological function not necessarily based on first principles. Different models (and theories) exist for phenomena in cell biology, such as gene expression [18], enzyme kinetics [19], and diffusion [20]. Among these models, scaling relationships pervade the quantitative behaviors that are found in cells. "Scaling" has many meanings, but in this context means how different properties of cells change with cell size. Before explaining the details of how mathematically these look, let’s first explore some of the properties and cells and their scale (range of variation in size).
Structure, Function, Diversity, and the Scale of Cells
Cells are complex adaptive systems, networks of interacting molecules, that perform all processes distinctive of life. They metabolize, grow, reproduce, interact with other cells, and evolve. Cells are delimited from the environment by a lipid membrane, and inside a network of interacting proteins performs, among other, transport and transformation of metabolites that come in and out through the cell. Proteins are polymers that are synthesized from RNA, which is ultimately copied from DNA. Accordingly, cells are mostly composed of five elements: phosphoglycogen, metabolites, proteins, RNA, and DNA. Each prokaryotic cell starts its life at the beginning of the cell cycle and follows an exponential dynamics, together with most of its constituents that are replicated during the cycle; then, most rates during the cycle are highly correlated with the growth rate. Prokaryotic cells have evolved towards a high diversity of structures (or shapes, see below), functions, and sizes [20,21].
In prokaryotes, it is possible to find a wide diversity of functions, i.e., types of metabolisms, going from the autotrophic and phototrophic to the heterotrophic [22]. Typically, these functions are classified according to three criteria: i) how the organism obtains carbon, ii) how it obtains reducing equivalents (hydrogen atoms or electrons), and iii) how it obtains energy. According to this, in the first category, we have auto-, hetero-, and mixotrophic, which obtain carbon from , organic compounds, or both, respectively. In the second category, we have litho- and organotrophic, which obtain reducing equivalents from inorganic and organic compounds, respectively. In the third category, we have photo- and chemotrophic, which obtain energy from light and chemical compounds, respectively. In multicellular eukaryotes, the specialization is more diverse and we can find cells specialized in different functions, e.g. muscle cells (myocytes), osteoblasts, which is one of the cell types found in bones, or hepatocytes, one of the cell types found in the liver.
In terms of cell structures and functioning, there are some differences between eukaryotes and prokaryotes, but there are mostly commonalities. For example, in eukaryotes, a substantial amount of transport of resources and waste products within cells is active, requiring energy to drive the transport [23] whereas, in modern prokaryotes, the transport is mostly via passive processes of diffusion [20]. However, prokaryotes do employ active transport of molecules across the cell membrane, and some prokaryotes carry out pinocytosis/endocytosis, it’s not well understood how and to what degree prokaryotes move these internalized compartments around the cell [24]. Also, there is accumulating evidence over the last few years of the active transport of genetic material within some prokaryotic cells via molecular motors [25]. Another example is that eukaryotes are not the only "multicellular" organisms, as despite prokaryotes being seen as unicellular organisms most of them depend metabolically on others [26] or can form colonies with division of labor [27].
The smallest bacteria are symbiont/host-associated organisms that can have genomes of Kbp (with genes) [28]. One of the well-studied small bacteria includes, for example, the host-associated symbiont Mycoplasma pneumoniae with 0.1 um [29]. Host-associated bacteria have evolved reduced cell sizes and macromolecular components, and lowered process rates due to the loss of genes associated with metabolic functions no longer necessary in the cellular environment of the host [30]. The smallest known natural free-living bacteria is Pelagibacter ubique with a size as small as 0.2 [31,32,33] and the largest, recently discovered, is Thiomargarita namibiensis with a size of up to 2 cm (i.e. , [5]). So just in prokaryotes, we have a range of variation in size from 0.1 to , i.e. , 5 orders of magnitude in variation. Otherwise, the smallest single-celled eukaryote is Ostreococcus tauri with a size of 1 um [34] and among the largest cell eukaryotic cells we have unicellular eukaryote Valonia ventricosa [35] (reaching up to 5 cm) or Caulerpa taxifolia [36] (up to 1 m), the ostrich’s oocyte (with a size of , 18 cm), and neurons (which can be up to 1 meter of length). Then, from the smallest bacteria to the largest eukaryotic cell, there are 5 orders of magnitude. This variation is even higher than the variation found in mammals; the smallest mammal is the Etruscan shrew with a size of 48 mm and the largest is the Blue whale with a size of mm, i.e. 4 orders of magnitude. Also important to mention is that cells have evolved a wide diversity of shapes [37]. In bacteria for example, three very common recognizable shapes are coccus, bacillus, and spirillum; in unicellular eukaryotes, there is also a high diversity including shapes such as that found in the Amoeba, and in differentiated multicellular eukaryotic cells, there is also high specialization associated to particular shapes such as discoidal (red blood cell), cuboidal (skin), or spherical (ovum). This huge variation in cell size is associated with variation in the rates of cell processes and the amount of their components, most of which manifest as size-scaling relationships. A crucial observation that shows that cell size is constrained by its components and, in turn, determines life-history trait rates is the experimental transplantation of the first synthetic genome into a cell of Mycoplasma mycoides [7]. Logically, if genome size determines cell size, we would expect that by adding a small genome (smaller than the original) into a big cell, the cell would adjust to the genome size. This is exactly what occurred in this genome transplantation: a genome half the size (531 kb) of the original size (1079 kb) was transplanted, and not just cell size adjusted to this new genome size, but also other properties, such as doubling time.
In a study of the scaling of fundamental properties of cells across a broad spectrum of sizes, i.e., scaling relationships, Delong et al. (2010) found that the scaling relationships for metabolic rate, maximum growth rate, and production efficiency differed fundamentally between prokaryotes and unicellular eukaryotes [38]. This opens the question of whether the prevalent mechanisms that originate this relationship could be different, or at least the parameter values underlying the same mechanism are different between these two groups. If we want to develop a general theory for the metabolism and the origin of the different scaling laws in these two groups, we should focus on commonalities instead of differences. What these two types of cells have in common is that both are governed by the fundamental laws of thermodynamics and evolution. At the end of this chapter, we will discuss the properties that a general theory for the origin of scaling in cells should have, and which could be the shortest path to it. We will focus primarily on scaling in prokaryotic organisms, but we will also refer to eukaryotes, especially in terms of the different mechanisms that could originate scaling relationships. How do these scaling relationships, such as metabolic rate or growth rate with cell volume [38], emerge in terms of mechanisms, and which mathematical principles account for their deduction? Here we review some examples, models, and outline the challenges in understanding the origin and consequences of scaling relationships in cells.
Scaling Patterns in Cells
The simplest version of a scaling relationship is a power law, which [16,39,40,41,42,43,44,45,46,47] describes a pattern of the form
Where y is some organism quantity, a is a normalisation parameter, x is another predictive quantity of the organism (e.g., body size), and b is the exponent. Both a and b account for the rate of change of y with respect to x. For example, if x doubles in size and if , y will increase by less than a factor of 2, whereas if it will double, but if it will increase by more than a factor of 2. are Eq. 1 is often written logarithmically as , and the parameters fitted using simple linear regression. Scale invariance or self-similarity refers to the property of a function that under re-scalings of the variable x by a factor the function does not change; , which reveals a universality.
Often, scaling relationships emerge from relevant principles that conform to complex systems such as optimization [16,48]. An example of a fundamental example of a scaling relationship applied to cell biology is the application of conventional Euclidean geometry or dimensional analysis to determine how the surface area A of cells should scale with cell volume V, assuming the proportions of the length scales that characterize shape, such as the ratios of the length to the widths of the cells, do not change in a consistent manner with size–that is, assuming that objects do not get thinner, longer, flatter, or more spherical with increasing size. This assumption is called isometry, geometric similitude, or geometric similarity [49]. Under this assumption, and , and so . Under this simple 2/3 surface area scaling law, the volume of a cell should scale as the one-third power of its length (such as diameter), such that if we double the length, the volume will increase by a factor of eight. Many other empirical examples exist, and more importantly, theoretical models that explain their origin. Documenting new scaling relationships presents a frontier that might help us to better understand, model, and predict microbial ecology, bioengineer cells, and even search for life on other worlds. Here we review the current state of scaling in cells, covering both what is known and a few areas of frontier investigation.
In both, unicellular (prokaryotic or eukaryotic), scaling can occur within a population of cells, in which variation in cell size reflects variation in the cells’ phase within their cell cycle, or different types of cells in multicellular organisms, versus across species, where the variation in cell size, rates, and components reflects variation from evolved differences between species. Scaling in cells can include scaling among rates (Rat)/times (Tim), components (Com), and size (Siz) (see examples in Table 1). Based on this, it is possible to distinguish six categories of relationships: rates and rates, components and components, size and size, rates and components, rates and size, and components and size. Some examples across these categories include the relationships between cell size and growth rate -under nutrient limitation-also known as “nutrient growth law” [50], cell size and time of initiation of DNA replication [51], the rate of synthesis of different components—RNA, proteins- during the cell cycle and growth rate [52]. Relationships between the amount of different cell components and size, such as the total amount of RNA, proteins, or the amount of DNA (genome size [53]). This category also includes relationships between cell size and the size of different structures such as organelles (e.g., mitochondria size and cell size; [54]. Below, we will briefly expand on each of these types of relationships.
The relationship between metabolic rate and cell size, typically the rate of entry of oxygen or carbon dioxide (depending on the nature of the organism) in units of grams per second and the volume of a cell, has its mechanistic basis in the fact that volume is related to surface area and the number of molecules that can entry a cell, everything else being constant (density of channels, outside nutrient concentration, among others), will depend on the surface area. The rate at which, oxygen, for example, enters a cell is a direct measure of the rate of the number of other metabolites being transformed such as glucose, given that during the catabolic process of cellular respiration, glucose, and oxygen react to yield carbon dioxide and water, . The change in concentration of glucose in the outside medium could also be a measure of metabolic rate. If an organism can metabolize more substrates, it can also grow faster. So, for example, in heterotrophic prokaryotes, this scaling has an exponent of , in single-celled heterotrophic eukaryotes it is 1, and in multicellular eukaryotes, it is (Wagner et al. 2001, De Long et al. 2010). From that simple logic, many other rates and quantities follow. If a cell can grow faster, it can synthesize and recycle proteins faster, achieve maximum size faster, and reproduce earlier. It is worth mentioning that these rates depend on and interact with environmental conditions such as temperature [68,69].
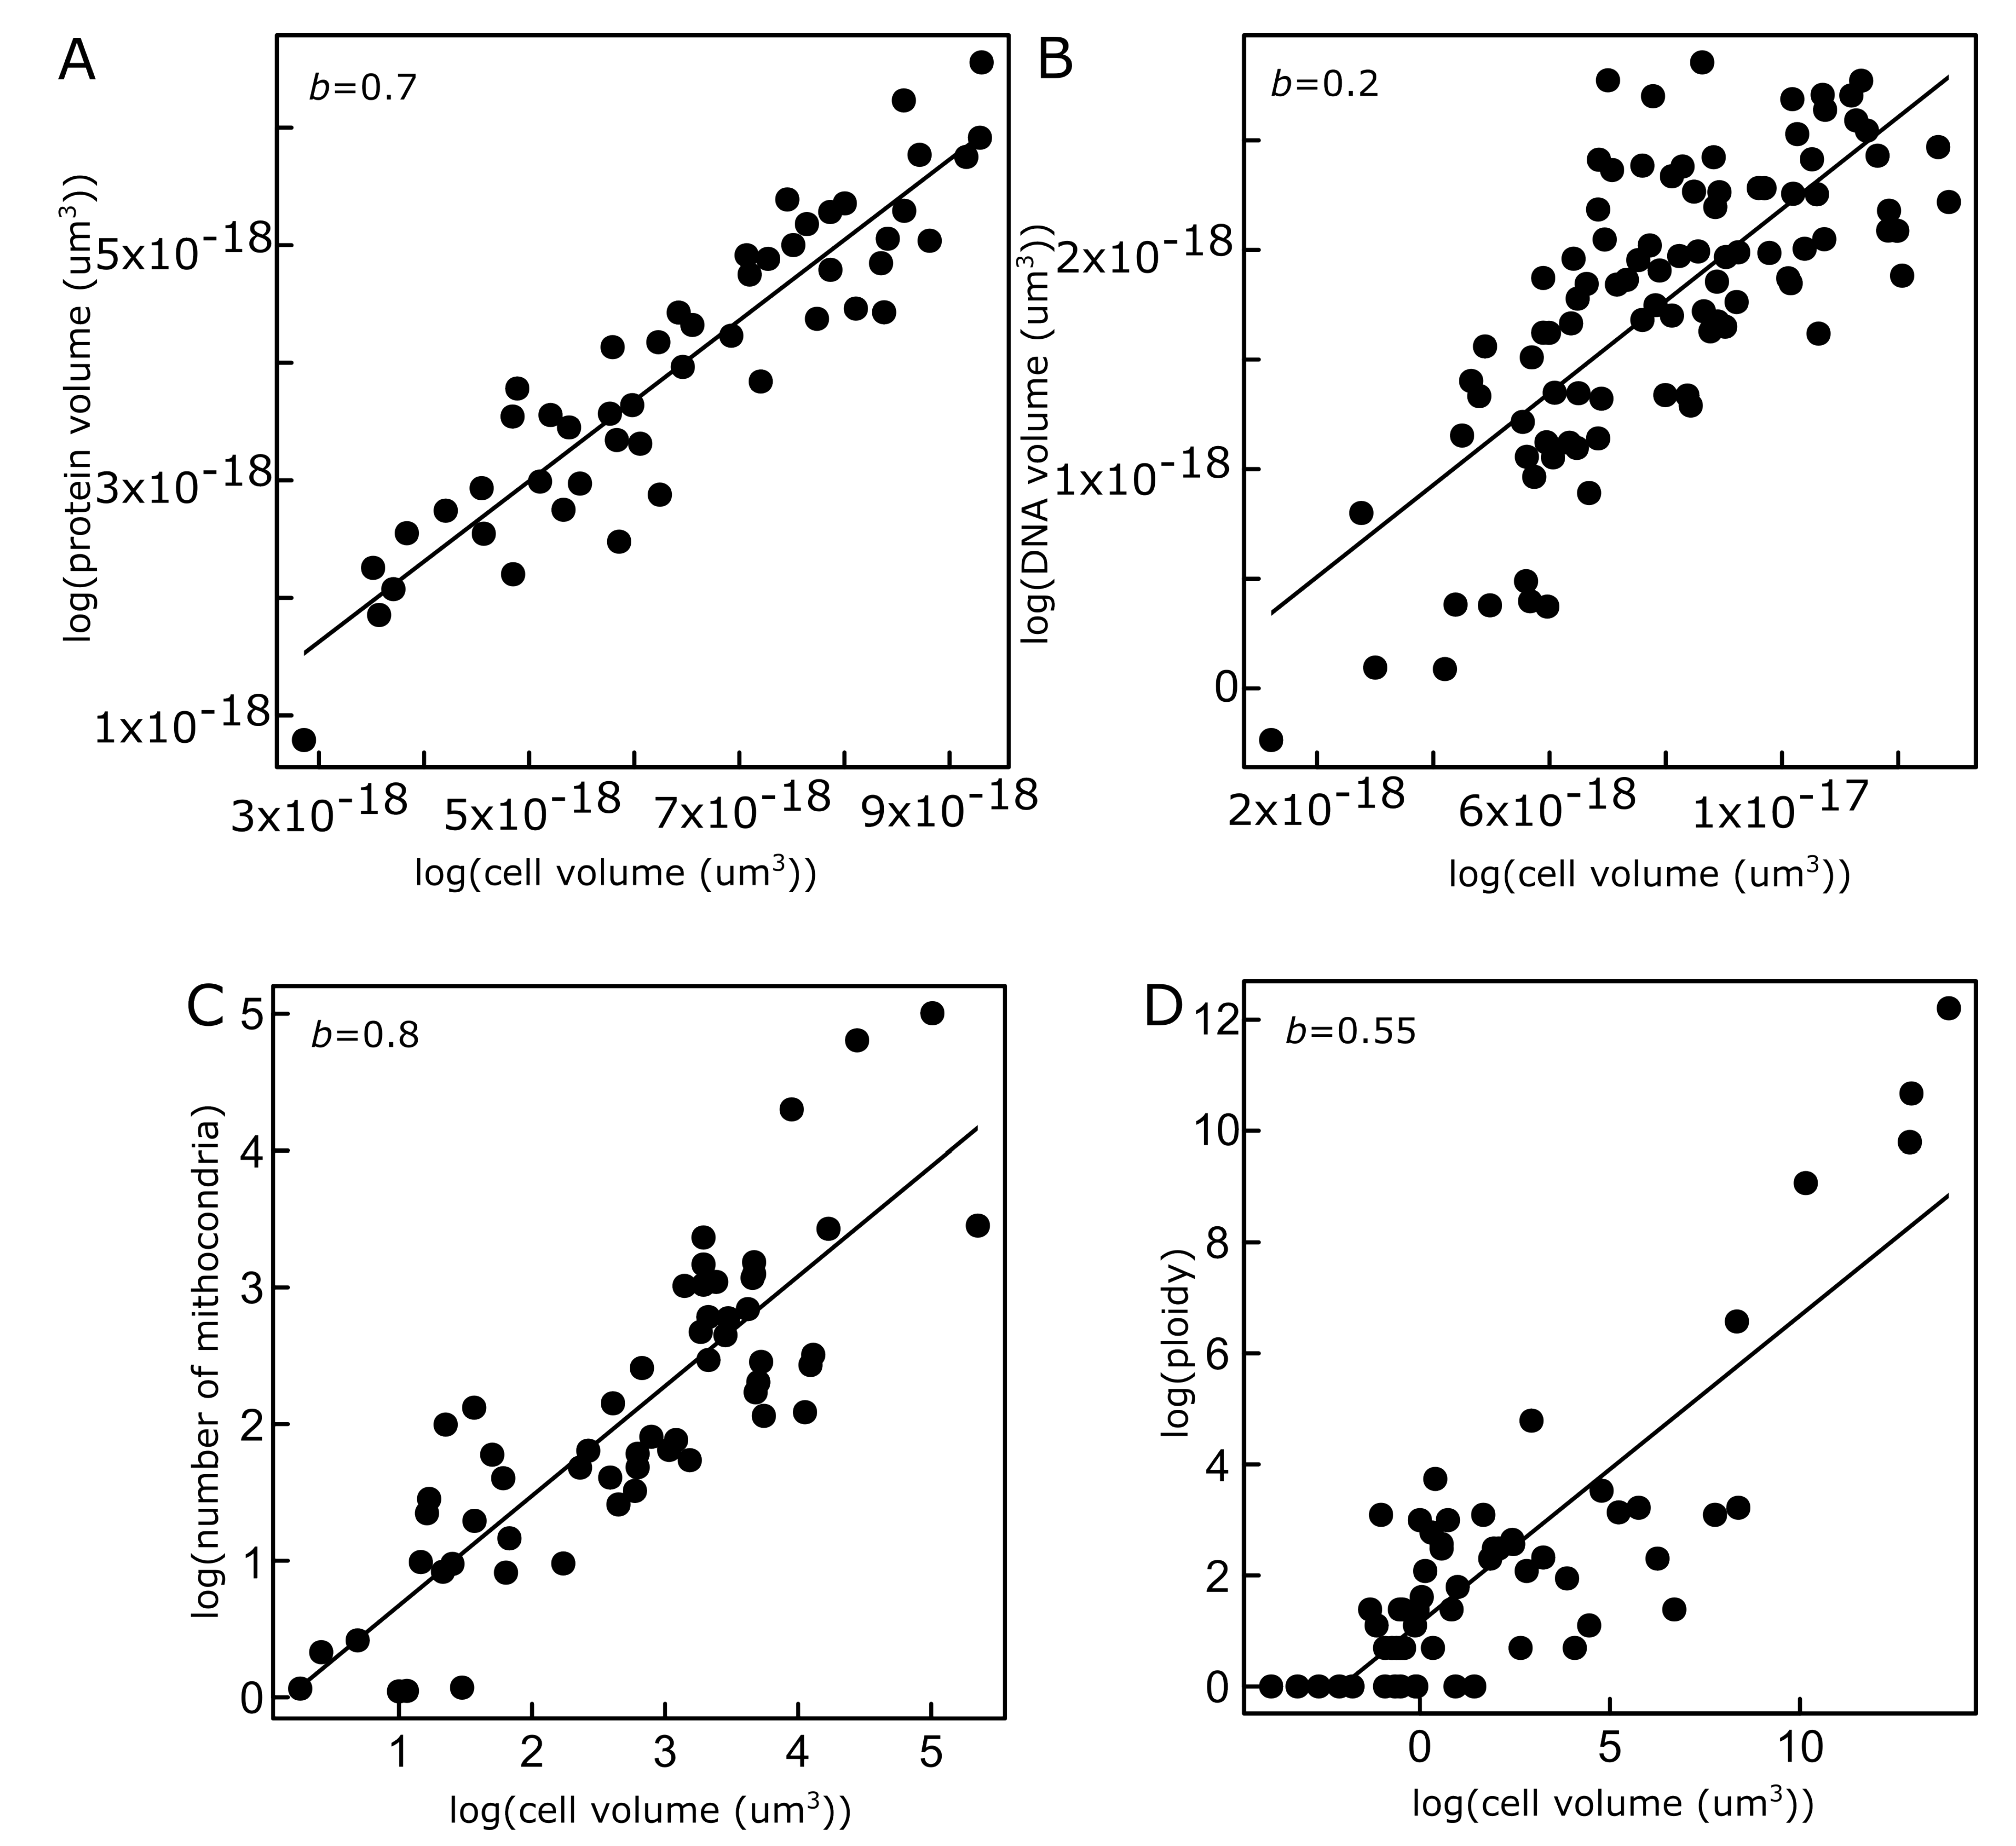
Figure 1.
Examples of scaling relationship between different cell properties and cell volume. (A) proteine volume [55], (B) genome volume[55], (C) number if mithocondria [65], and (D) ploidy[66].
Different process rates inside of cells also scale with each other for the same reasons explained above. For example, protein synthesis scales with growth rate [52]. The relationship between the amount of different cell components is a remarkable pattern that has been studied both inter-specifically but also intra-specifically in experiments. A typical bacterium such as E. coli, for example, is composed mostly of five major biochemical categories of components: proteins, RNA, DNA, membrane components (lipids, lipopolysaccharides, peptidoglycan, glycogen), and metabolite components (including ions and cofactors-inorganic or small organic molecules like ATP that bind enzymes to enable or enhance their activity[70]). There is evidence that most, if not all, of these quantities at any stage of the cell cycle scale with cell volume [53]. The amount of each of these components follows approximately exponential dynamics during the cell cycle on a per capita basis, except for the DNA, which increases approximately to the double, given that it is duplicated. However, it is important not to forget that the DNA itself can increase or decrease during the cell cycle, also due to mutations such as duplications, deletions, or horizontal gene transfer. These mutations can even increase the size by more than double if we consider a mutation such as a genome duplication and horizontal gene transfer in the same cycle.
There are also relationships between the size of different structures, both internal and external, such as organelles [54], flagella/cilia [71]. A plausible explanation for the scaling of these structures is optimization, i.e., the size of those structures must be regulated to minimize or maximize some rate, such as motility.
Beyond this empirical evidence, a relevant question is what is the origin of these relationships? Below we outline some of the theoretical frameworks that explain them.
Models That Predict Scaling Patterns in Cells
The most basic scaling relationships in cells are among structural components. There are predictions for the relationships among length (l/L), (surface) area (a/A), volume (v/V), and mass (m/M) for a spherical (e.g. coccoid) cell or cells whose shape doesn’t change consistently with size, where lowercase letters stand for Euclidean and uppercase letters stand for fractal. The predictions for the scaling of exchange surface areas assuming the optimization of fractal-like internal transportation networks [72], is
This prediction contrasts with the prediction, as described earlier, for external surface areas:
It may also be worth noting that there are alternative predictions for the scaling of external and internal exchange surface areas for cells that change shape with size, have fractal-like external surfaces, or invariant internal metabolic units, and that these strategies can lead to , helping cells to circumvent, at least for some limited size range, quarter-power scaling imposed by transportation constraints [49,57]. For example, the internalization of ATP-producing membranes via the endosymbiosis of mitochondria leads to linear surface area scaling of ATP-producing membranes [49,65]. As long as transport between the mitochondria and the environment is not rate limiting, this provides an explanation for the observation of linear metabolic scaling in heterotrophic cells [38,65].
A fundamental scaling relationship in cells is metabolic rate and size. This relationship emerges mechanistically from Fick’s law of diffusion through a spherical surface [20,55],
Where J is flux (of molecules going from the environment to the interior of the cell, i.e., metabolic flux or rate), , D: is the diffusion constant, R: is the cell radius, and is the internal concentration. This equation predicts a linear scaling of metabolic rate with cell length. However, we note that given that , both in non-linear, there should be a non-linear scaling between J and m, as is shown by empirical data [38] (where the exponent for bacteria is close to 2).
Other models predict, for example, a relationship between cell size (V) and the active ribosome fraction ((); [73].
Challenges and Implications
In the previous sections, we gave some examples of scaling relationships and some of the models that attempt to explain the origin of some of these relationships. However, here we argue that there is still a disconnection between different models in cell biology, as most of them just focus on a single or few relationships, despite the evident connections among cellular processes, from gene expression to transport of metabolites through membranes. Recently there have been some efforts in connecting the dots. Rollin et al. [76], for example, claimed to have developed a model based on physical principles to explain scaling laws in cells. They based on the so-called “Pump and Leak model” to derive the relationships between cell size, dry mass, and nuclear size, which is a good attempt to connect size, rates, and components.
In the spirit of what a unified theory in physics is, it has been defined the concept of an “efficient theory” [17,77]. Above, we defined theory as a mathematical model based on principles and/or assumptions that make testable predictions. More than a theory, an efficient theory is based on a minimal set of assumptions that can make predictions for the largest possible extent of phenomena. An example in biology is metabolic theory, which is based on three principles of the structure of networks and the optimization of transport across this network can predict many different scaling relationships for plant and animal vascular systems [16]. A more general example is the Barabasi-Albert model for networks [78]. Based on just two assumptions, growth and preferential attachment, this model can reproduce the approximate structure of networks of protein interactions and the World Wide Web, among others. A potential unifying principle across systems, and particularly for cells, which might be invoked to develop a general theory of scaling in cells, is optimization. Cells might optimize multiple quantities such as energy, metabolic rate, or growth. In addition to being based on first principles, general theories are expected to be universal. Often this is demonstrated by reexpressing the defining equations of a theory in a dimensionless form, so they are independent of the units of measurement. The methodology for non-dimensionalization often can allow collapsing data from different contexts, which shows that, regarding particular parameter values that can be influenced by other variables, the general form of the dependence is the same, then the model is universal. Examples in biology for this include ontogenetic growth [79], temperature-dependence [80], and cell growth [81].
In cell biology, there are recent studies that have attempted to formalize quantitative laws in this way. For example, the most well-known law in cell biology is Schaeter´s growth [50], which recently was generalized as the “General Growth Law” in a dimensionless form [81],
In Eq. 6, V is cell size, is a constant, is cell cycle duration, is doubling time. This model derived from first principles was expressed in a dimensionless form, , giving the general equation , where is the dimensionless size and is the dimensionless time. This equation makes a data collapse of different curves under different nutrient limitations. This law, however, is not a power law but is exponential. Many other exponential laws exist in cell biology, which opens the possibility to derive power laws, as the combination of two exponential functions gives a power law (see, for example, [82]).
What would a general theory be useful for or what would be its implications and/or applications? Understanding cell biology on a fundamental quantitative and mechanistic basis would help design and build artificial cells, or help predict many different quantitative aspects of cancer progression [83]. For example, scaling laws in genomes could be used as a way to check if the minimum amount of different genomic components conforms to a scaling law. For example, for transcription factors, there is a well-defined scaling with an exponent of 1.65-1.37 [84]. Another example is using the relationship between cell volume and genome size [55], it would be possible to predict the volume of a lipid membrane suitable to contain a genome of a given size [85]. Also, other scaling laws could be used as a guide to predict the expected amount of protein [86] or RNA[53,87] in a cell.
Concluding Remarks
Cell structure, dynamics, and functions manifest in multiple types of scaling relationships involving rates, components, and size. Most of these relationships are empirical patterns, but some models explain their origin from first principles, such as the relationship between metabolic rate and cell size, which is based on the physical laws of diffusion. Other models in cell biology include models for gene expression and protein synthesis, enzyme kinetics, cell growth, and fractal geometry, among others. There have been some attempts to integrate some models to make a unified theory, which is insightful. However, there is still the challenge of developing a general theory under the concept of an efficient theory, i.e., based on a minimal set of principles and assumptions, and explaining as many phenomena as possible for a broad range of scales. Such a theory, should be based on processes that are common to all life, such as fractal geometry, diffusion, and gene expression, and use powerful approaches from physics, engineering, and mathematics to express the model in a dimensionless form, to collapse data from the smallest prokaryote to the largest multicellular cell. Developing such a theory is relevant not just to better understand cell processes on a fundamental, mechanistic, and quantitative basis, but also for many applied purposes. These include the design and build of artificial cells and cancer.
Acknowledgments
NSF Award “Building and Modeling Synthetic Bacterial Cells” (Award Number 1840301), NSF Award “Towards a unified theory of regulatory functions and networks across biological and social systems” (Award Number 2133863), and Center for Mathematical Modelling (CMM), Grant FB210005, BASAL funds for Centers of Excellence from ANID-Chile.
References
- Schwann, T.H. Microscopial Researches into the Accordance in the Structure and Growth of Animals and Plants. Obesity Research 1847, 1, 408–418. [Google Scholar] [CrossRef] [PubMed]
- Mazzarello, P. A unifying concept: the history of cell theory. Nature Cell Biology 1999, 1, E13–E15.
- Piras, V.; Tomita, M.; Selvarajoo, K. Is central dogma a global property of cellular information flow? Frontiers in Physiology 2012, 3, 439. [Google Scholar] [CrossRef] [PubMed]
- Crick, F. What mad pursuit; Basic Books, 2008.
- Volland, J.M.; Gonzalez-Rizzo, S.; Gros, O.; Tyml, T.; Ivanova, N.; Schulz, F.; Goudeau, D.; Elisabeth, N.H.; Nath, N.; Udwary, D.; et al. A centimeter-long bacterium with DNA contained in metabolically active, membrane-bound organelles. Science 2022, 376, 1453–1458. [Google Scholar] [CrossRef] [PubMed]
- Islas-Morales, P.F.; Cárdenas, A.; Mosqueira Santillán, M.J.; Jiménez-García, L.F.; Voolstra, C.R. Ultrastructural and proteomic evidence for the presence of a putative nucleolus in an Archaeon 2023.
- Hutchison III, C.A.; Chuang, R.Y.; Noskov, V.N.; Assad-Garcia, N.; Deerinck, T.J.; Ellisman, M.H.; Gill, J.; Kannan, K.; Karas, B.J.; Ma, L.; et al. Design and synthesis of a minimal bacterial genome. Science 2016, 351, aad6253. [Google Scholar] [CrossRef] [PubMed]
- Wolgemuth, C.W. Does cell biology need physicists? Physics 2011, 4, 4. [Google Scholar] [CrossRef]
- Howard, J. Quantitative cell biology: the essential role of theory. Molecular Biology of the Cell 2014, 25, 3438–3440. [Google Scholar] [CrossRef] [PubMed]
- Gonzalez-Gaitan, M.; Roux, A. When cell biology meets theory. The Journal of Cell Biology 2015, 210, 1041. [Google Scholar] [CrossRef] [PubMed]
- Phillips, R. Theory in biology: Figure 1 or Figure 7? Trends in cell biology 2015, 25, 723–729. [Google Scholar] [CrossRef] [PubMed]
- Kowalewski, J. Mathematical Models in Cellular Biophysics. PhD thesis, KTH, 2007.
- Arrhenius, S. Über die Reaktionsgeschwindigkeit bei der Inversion von Rohrzucker durch Säuren. Zeitschrift für physikalische Chemie 1889, 4, 226–248. [Google Scholar] [CrossRef]
- Eyring, H. The activated complex in chemical reactions. The Journal of Chemical Physics 1935, 3, 107–115. [Google Scholar] [CrossRef]
- Kleiber, M. Body size and metabolic rate. Physiological reviews 1947, 27, 511–541. [Google Scholar] [CrossRef] [PubMed]
- West, G.B.; Brown, J.H.; Enquist, B.J. A general model for the origin of allometric scaling laws in biology. Science 1997, 276, 122–126. [Google Scholar] [CrossRef] [PubMed]
- Marquet, P.A.; Allen, A.P.; Brown, J.H.; Dunne, J.A.; Enquist, B.J.; Gillooly, J.F.; Gowaty, P.A.; Green, J.L.; Harte, J.; Hubbell, S.P.; et al. On theory in ecology. BioScience 2014, 64, 701–710. [Google Scholar] [CrossRef]
- Chen, T.; He, H.L.; Church, G.M. Modeling gene expression with differential equations. In Biocomputing’99; World Scientific, 1999; pp. 29–40.
- Michaelis, L.; Menten, M.L.; et al. Die kinetik der invertinwirkung. Biochem. z 1913, 49, 352. [Google Scholar]
- Schulz, H.N.; Jørgensen, B.B. Big bacteria. Annual Reviews in Microbiology 2001, 55, 105–137. [Google Scholar] [CrossRef] [PubMed]
- Levin, P.A.; Angert, E.R. Small but mighty: cell size and bacteria. Cold Spring Harbor perspectives in biology 2015, 7, a019216. [Google Scholar] [CrossRef] [PubMed]
- Jr., J.P. Bacterial Metabolism. Medical Microbiology. 4th edition. 1996, p. Chapter 4.
- Agrawal, A.; Scott, Z.C.; Koslover, E.F. Morphology and transport in eukaryotic cells. Annual Review of Biophysics 2022, 51, 247–266. [Google Scholar] [CrossRef] [PubMed]
- Mignot, T.; Shaevitz, J.W. Active and passive mechanisms of intracellular transport and localization in bacteria. Current Opinion in Microbiology 2008, 11, 580–585. [Google Scholar] [CrossRef] [PubMed]
- Allemand, J.F.; Maier, B.; Smith, D.E. Molecular motors for DNA translocation in prokaryotes. Current Opinion in Biotechnology 2012, 23, 503–509. [Google Scholar] [CrossRef] [PubMed]
- Zelezniak, A.; Andrejev, S.; Ponomarova, O.; Mende, D.R.; Bork, P.; Patil, K.R. Metabolic dependencies drive species co-occurrence in diverse microbial communities. Proceedings of the National Academy of Sciences 2015, 112, 6449–6454. [Google Scholar] [CrossRef] [PubMed]
- Mizuno, K.; Maree, M.; Nagamura, T.; Koga, A.; Hirayama, S.; Furukawa, S.; Tanaka, K.; Morikawa, K. Novel multicellular prokaryote discovered next to an underground stream. Elife 2022, 11, e71920. [Google Scholar] [CrossRef] [PubMed]
- Martínez-Cano, D.J.; Reyes-Prieto, M.; Martínez-Romero, E.; Partida-Martínez, L.P.; Latorre, A.; Moya, A.; Delaye, L. Evolution of small prokaryotic genomes. Frontiers in Microbiology 2015, 5, 742. [Google Scholar] [CrossRef] [PubMed]
- Waites, K.B.; Talkington, D.F. Mycoplasma pneumoniae and its role as a human pathogen. Clinical Microbiology Reviews 2004, 17, 697–728. [Google Scholar] [CrossRef] [PubMed]
- Bobay, L.M.; Ochman, H. The Evolution of Bacterial Genome Architecture. Frontiers in Genetics 2017, 8. [Google Scholar] [CrossRef] [PubMed]
- Morris, R.M.; Rappé, M.S.; Connon, S.A.; Vergin, K.L.; Siebold, W.A.; Carlson, C.A.; Giovannoni, S.J. SAR11 clade dominates ocean surface bacterioplankton communities. Nature 2002, 420, 806–810. [Google Scholar] [CrossRef] [PubMed]
- Rappé, M.S.; Connon, S.A.; Vergin, K.L.; Giovannoni, S.J. Cultivation of the ubiquitous SAR11 marine bacterioplankton clade. Nature 2002, 418, 630–633. [Google Scholar] [CrossRef] [PubMed]
- Zhao, X.; Schwartz, C.L.; Pierson, J.; Giovannoni, S.J.; McIntosh, J.R.; Nicastro, D. Three-Dimensional Structure of the Ultraoligotrophic Marine Bacterium “Candidatus Pelagibacter ubique”. Applied and Environmental Microbiology 2017, 83. [Google Scholar] [CrossRef] [PubMed]
- Courties, C.; Vaquer, A.; Troussellier, M.; Lautier, J.; Chrétiennot-Dinet, M.J.; Neveux, J.; Machado, C.; Claustre, H. Smallest eukaryotic organism. Nature 1994, 370, 255–255. [Google Scholar] [CrossRef]
- Alves, A.M.; Gestinari, L.M.d.S.; Moura, C.W.d.N. The family Valoniaceae (Chlorophyta) in the state of Bahia, Brazil: Morphological aspects and geographical distribution. Hidrobiológica 2010, 20, 171–184. [Google Scholar]
- Meinesz, A.; Hesse, B. Introduction of the tropical alga Caulerpa taxifolia and its invasion of the northwestern Mediterranean. Oceanologica acta. Paris 1991, 14, 415–426. [Google Scholar]
- Young, K.D. The selective value of bacterial shape. Microbiology and molecular biology reviews 2006, 70, 660–703. [Google Scholar] [CrossRef] [PubMed]
- DeLong, J.P.; Okie, J.G.; Moses, M.E.; Sibly, R.M.; Brown, J.H. Shifts in metabolic scaling, production, and efficiency across major evolutionary transitions of life. Proceedings of the National Academy of Sciences 2010, 107, 12941–12945. [Google Scholar] [CrossRef] [PubMed]
- Brown, J.H.; West, G.B. Scaling in biology; Oxford University Press on Demand, 2000.
- West, G.B.; Brown, J.; Enquist, B. Scaling in biology: patterns and processes, causes and consequences. Scaling in biology 2000, 87, 112. [Google Scholar]
- Rau, A. Biological scaling and physics. Journal of Biosciences 2002, 27, 475–478. [Google Scholar] [CrossRef] [PubMed]
- Spence, A.J. Scaling in biology. Current Biology 2009, 19, R57–R61. [Google Scholar] [CrossRef] [PubMed]
- Ghosh, A. Scaling laws. Mechanics Over Micro and Nano Scales 2011, pp. 61–94.
- West, G.B.; Brown, J.H. The origin of allometric scaling laws in biology from genomes to ecosystems: towards a quantitative unifying theory of biological structure and organization. Journal of Experimental Biology 2005, 208, 1575–1592. [Google Scholar] [CrossRef] [PubMed]
- Whitfield, J. In the Beat of a Heart: Life, Energy, and the Unity of Nature; Washington, DC: Joseph Henry Press, 2006. [CrossRef]
- Ribeiro, F.L.; Pereira, W.R. A Gentle Introduction to Scaling Laws in Biological Systems. arXiv preprint arXiv:2105.01540, arXiv:2105.01540 2021.
- Yang, V.C.; Holehouse, J.; Kempes, C.P.; Hyejin, Y.; Arroyo, J.I.; Redner, S.; West, G.B. Scaling Laws for Function Diversity and Specialization Across Socioeconomic and Biological Complex Systems. 2022; https://arxiv.org/abs/2208.06487v2. [Google Scholar]
- Rinaldo, A.; Rigon, R.; Banavar, J.R.; Maritan, A.; Rodriguez-Iturbe, I. Evolution and selection of river networks: Statics, dynamics, and complexity. Proceedings of the National Academy of Sciences 2014, 111, 2417–2424. [Google Scholar] [CrossRef] [PubMed]
- Okie, J.G. General models for the spectra of surface area scaling strategies of cells and organisms: fractality, geometric dissimilitude, and internalization. The American Naturalist 2013, 181, 421–439. [Google Scholar] [CrossRef] [PubMed]
- Schaechter, M.; Maaløe, O.; Kjeldgaard, N.O. Dependency on medium and temperature of cell size and chemical composition during balanced growth of Salmonella typhimurium. Microbiology 1958, 19, 592–606. [Google Scholar] [CrossRef] [PubMed]
- Donachie, W.D. Relationship between cell size and time of initiation of DNA replication. Nature 1968, 219, 1077–1079. [Google Scholar] [CrossRef] [PubMed]
- Balakrishnan, R.; Mori, M.; Segota, I.; Zhang, Z.; Aebersold, R.; Ludwig, C.; Hwa, T. Principles of gene regulation quantitatively connect DNA to RNA and proteins in bacteria. Science 2022, 378. [Google Scholar] [CrossRef] [PubMed]
- Basan, M.; Zhu, M.; Dai, X.; Warren, M.; Sévin, D.; Wang, Y.P.; Hwa, T. Inflating bacterial cells by increased protein synthesis. Molecular Systems Biology 2015, 11, 836. [Google Scholar] [CrossRef] [PubMed]
- Rafelski, S.M.; Viana, M.P.; Zhang, Y.; Chan, Y.H.M.; Thorn, K.S.; Yam, P.; Fung, J.C.; Li, H.; Costa, L.d.F.; Marshall, W.F. Mitochondrial network size scaling in budding yeast. Science 2012, 338, 822–824. [Google Scholar] [CrossRef] [PubMed]
- Kempes, C.P.; Wang, L.; Amend, J.P.; Doyle, J.; Hoehler, T. Evolutionary tradeoffs in cellular composition across diverse bacteria. The ISME Journal 2016, 10, 2145–2157. [Google Scholar] [CrossRef] [PubMed]
- Loferer-Krossbacher, M.; Klima, J.; Psenner, R. Determination of bacterial cell dry mass by transmission electron microscopy and densitometric image analysis. Applied and Environmental Microbiology 1998, 64, 688–694. [Google Scholar] [CrossRef] [PubMed]
- Ojkic, N.; Serbanescu, D.; Banerjee, S. Surface-to-volume scaling and aspect ratio preservation in rod-shaped bacteria. Elife 2019, 8, e47033. [Google Scholar] [CrossRef] [PubMed]
- Ignatiades, L. Size scaling patterns of species richness and carbon biomass for marine phytoplankton functional groups. Marine Ecology 2017, 38, e12454. [Google Scholar] [CrossRef]
- Finkel, Z.; Follows, M.; Irwin, A. Size-scaling of macromolecules and chemical energy content in the eukaryotic microalgae. Journal of Plankton Research 2016, 38, 1151–1162. [Google Scholar] [CrossRef]
- Cael, B.; Cavan, E.L.; Britten, G.L. Reconciling the size-dependence of marine particle sinking speed. Geophysical Research Letters 2021, 48, e2020GL091771. [Google Scholar] [CrossRef]
- Lynch, M.; Trickovic, B.; Kempes, C.P. Evolutionary scaling of maximum growth rate with organism size. Scientific Reports 2022, 12, 22586. [Google Scholar] [CrossRef] [PubMed]
- Dao, M.H. Reassessment of the cell surface area limitation to nutrient uptake in phytoplankton. Marine Ecology Progress Series 2013, 489, 87–92. [Google Scholar] [CrossRef]
- Gray, W.T.; Govers, S.K.; Xiang, Y.; Parry, B.R.; Campos, M.; Kim, S.; Jacobs-Wagner, C. Nucleoid size scaling and intracellular organization of translation across bacteria. Cell 2019, 177, 1632–1648. [Google Scholar] [CrossRef] [PubMed]
- Niklas, K.J.; Hammond, S.T. Biophysical effects on the scaling of plant growth, form, and ecology. Integrative and Comparative Biology 2019, 59, 1312–1323. [Google Scholar] [CrossRef] [PubMed]
- Okie, J.G.; Smith, V.H.; Martin-Cereceda, M. Major evolutionary transitions of life, metabolic scaling and the number and size of mitochondria and chloroplasts. Proceedings of the Royal Society B: Biological Sciences 2016, 283, 20160611. [Google Scholar] [CrossRef] [PubMed]
- Gonzalez-de Salceda, L.; Garcia-Pichel, F. The allometry of cellular DNA and ribosomal gene content among microbes and its use for the assessment of microbiome community structure. Microbiome 2021, 9, 1–8. [Google Scholar] [CrossRef] [PubMed]
- Lynch, M.; Marinov, G.K. Membranes, energetics, and evolution across the prokaryote-eukaryote divide. elife 2017, 6, e20437. [Google Scholar] [CrossRef] [PubMed]
- Gillooly, J.F.; Brown, J.H.; West, G.B.; Savage, V.M.; Charnov, E.L. Effects of size and temperature on metabolic rate. science 2001, 293, 2248–2251. [Google Scholar] [CrossRef] [PubMed]
- Price, P.B.; Sowers, T. Temperature dependence of metabolic rates for microbial growth, maintenance, and survival. Proceedings of the National Academy of Sciences 2004, 101, 4631–4636. [Google Scholar] [CrossRef] [PubMed]
- R, M. What is the total number of protein molecules per cell volume? A call to rethink some published values. Bioessays 2013, 35, 1050–5. [Google Scholar]
- Chan, Y.H.M.; Marshall, W.F. Scaling properties of cell and organelle size. Organogenesis 2010, 6, 88–96. [Google Scholar] [CrossRef] [PubMed]
- West, G.B.; Brown, J.H.; Enquist, B.J. The Fourth Dimension of Life: Fractal Geometry and Allometric Scaling of Organisms. Science 1999, 284, 1677–1679. [Google Scholar] [CrossRef] [PubMed]
- Bertaux, F.; Von Kügelgen, J.; Marguerat, S.; Shahrezaei, V. A bacterial size law revealed by a coarse-grained model of cell physiology. PLoS Computational Biology 2020, 16, e1008245. [Google Scholar] [CrossRef] [PubMed]
- Scott, M.; Gunderson, C.W.; Mateescu, E.M.; Zhang, Z.; Hwa, T. Interdependence of cell growth and gene expression: origins and consequences. Science 2010, 330, 1099–1102. [Google Scholar] [CrossRef] [PubMed]
- Scott, M.; Klumpp, S.; Mateescu, E.M.; Hwa, T. Emergence of robust growth laws from optimal regulation of ribosome synthesis. Molecular Systems Biology 2014, 10, 747. [Google Scholar] [CrossRef] [PubMed]
- Rollin, R.; Joanny, J.F.; Sens, P. Physical basis of the cell size scaling laws. Elife 2023, 12, e82490. [Google Scholar] [CrossRef] [PubMed]
- Krakauer, D.C.; Collins, J.P.; Erwin, D.; Flack, J.C.; Fontana, W.; Laubichler, M.D.; Prohaska, S.J.; West, G.B.; Stadler, P.F. The challenges and scope of theoretical biology. Journal of Theoretical Biology 2011, 276, 269–276. [Google Scholar] [CrossRef] [PubMed]
- Barabási, A.L.; Albert, R. Emergence of scaling in random networks. Science 1999, 286, 509–512. [Google Scholar] [CrossRef] [PubMed]
- West, G.B.; Brown, J.H.; Enquist, B.J. A general model for ontogenetic growth. Nature 2001, 413, 628–631. [Google Scholar] [CrossRef] [PubMed]
- Arroyo, J.I.; Díez, B.; Kempes, C.P.; West, G.B.; Marquet, P.A. A general theory for temperature dependence in biology. Proceedings of the National Academy of Sciences 2022, 119, e2119872119. [Google Scholar] [CrossRef] [PubMed]
- Si, F.; Li, D.; Cox, S.E.; Sauls, J.T.; Azizi, O.; Sou, C.; Schwartz, A.B.; Erickstad, M.J.; Jun, Y.; Li, X.; et al. Invariance of initiation mass and predictability of cell size in Escherichia coli. Current Biology 2017, 27, 1278–1287. [Google Scholar] [CrossRef] [PubMed]
- van Nimwegen, E. Scaling laws in the functional content of genomes. Trends in Genetics 2003, 19, 479–484. [Google Scholar] [CrossRef] [PubMed]
- Chignola, R.; Sega, M.; Stella, S.; Vyshemirsky, V.; Milotti, E. From single-cell dynamics to scaling laws in oncology. Biophysical Reviews and Letters 2014, 9, 273–284. [Google Scholar] [CrossRef]
- Yang, V.C.; Kempes, C.P.; Redner, S.; Arroyo, J.I.; West, G.B.; Youn, H. How much regulation do we need from genomes to society? arXiv preprint arXiv:2409.02884v2 2025.
- Rothschild, L.J.; Averesch, N.J.; Strychalski, E.A.; Moser, F.; Glass, J.I.; Cruz Perez, R.; Yekinni, I.O.; Rothschild-Mancinelli, B.; Roberts Kingman, G.A.; Wu, F.; et al. Building synthetic cells-from the technology infrastructure to cellular entities. ACS Synthetic Biology 2024, 13, 974–997. [Google Scholar] [CrossRef] [PubMed]
- Arroyo, J.I.; Kempes, C. An algorithm for predicting per-cell proteomic properties. bioRxiv 2024, pp. 2024–12.
- Lynch, M.; Marinov, G.K. The bioenergetic costs of a gene. Proceedings of the National Academy of Sciences 2015, 112, 15690–15695. [Google Scholar] [CrossRef] [PubMed]

Table 1.
Examples of scaling relationships in cells.
| Rel. | Type | Exponent | Taxa | Ref. |
|---|---|---|---|---|
| Metabolic rate (W) vs. cell size (g) | Rate-Size | 1.96 | Prok. | [38] |
| Amount of RNA vs. cell growth rate | Comp.-Rate | NC | Prok. | [52] |
| Genome size (bp) vs. cell mass (g) | Comp.-Size | 0.24 | Prok. | [44] |
| Proteome size () vs. cell vol. () | Comp.-Size | 0.7 | Bac. | [55] |
| Ribosomes vol. () vs. cell vol. () | Comp.-Size | 0.73 | Bac. | [55] |
| DNA vs. RNA | Comp.-Comp. | NC | Prok. | [52] |
| Dry weight (fg) vs. volume () | Size-Size | 0.86 | Bac. | [56] |
| (Surface) area () vs. volume () | Size-Size | 0.66/0.66 | Bac. | [57] |
| Carbon content () vs. volume () | Comp.-Size | 0.93 | Euk. | [58] |
| Carbon content () vs. volume () | Comp.-Size | 0.78 | Euk. | [59] |
| Dry weight () vs. volume () | Size-Size | 0.82 | Euk. | [59] |
| Protein () vs. volume () | Comp.-Size | 0.83 | Euk. | [59] |
| Lipid () vs. volume () | Comp.-Size | 0.8 | Euk. | [59] |
| Carbohydrate () vs. volume () | Comp.-Size | 0.93 | Euk. | [59] |
| Chemical energy () vs. volume () | Comp.-Size | 0.83 | Euk. | [59] |
| Sinking speed (m/d) vs. diameter (mm) | Rate-Size | 0.63 | Euk. | [60] |
| Max. growth rate vs. cell mass | Rate-Size | -0.025 | Prok. | [61] |
| Max. growth rate vs. cell mass | Rate-Size | 0.292 | Prok. | [38] |
| Max. growth rate vs. cell mass | Rate-Size | -0.112 | Unicel. Euk. | [38] |
| Carbon production rate vs. cell volume | Rate-Size | 0.88 | Unicel. Euk. | [62] |
| Avg. swimming speed vs. cell volume | Rate-Size | 0.3 | Unicel. Euk. | [61] |
| Sp. Avg.nucleoid area vs. average cell SA | Size-Size | 0.6 | Prok., Euk. | [63] |
| Surface area vs. cell volume | Size-Size | 0.71 | Prok., Euk. | [64] |
| Carbon content (mass) vs. cell volume | Comp.-Size | 0.84 | Prok., Euk. | [64] |
| DNA content vs. cell volume | Comp.-Size | 0.74 | Mul. Euk | [64] |
| Total mitoc. volume vs. cell volume | Comp.-Size | 1.01 | Euk. | [65] |
| N. of 16/18S ribos.gene vs. cell volume | Comp.-Size | 0.66 | Prok., Euk. | [66] |
| N. of ATP synthase complexes vs. cell SA | Comp.-Size | 1.26 | Prok., Euk. | [67] |
In the table “Comp.” indicates component which is a count or concentration of an object.
Disclaimer/Publisher’s Note: The statements, opinions and data contained in all publications are solely those of the individual author(s) and contributor(s) and not of MDPI and/or the editor(s). MDPI and/or the editor(s) disclaim responsibility for any injury to people or property resulting from any ideas, methods, instructions or products referred to in the content. |
© 2025 by the authors. Licensee MDPI, Basel, Switzerland. This article is an open access article distributed under the terms and conditions of the Creative Commons Attribution (CC BY) license (http://creativecommons.org/licenses/by/4.0/).
Copyright: This open access article is published under a Creative Commons CC BY 4.0 license, which permit the free download, distribution, and reuse, provided that the author and preprint are cited in any reuse.


