
Submitted:
10 July 2025
Posted:
11 July 2025
You are already at the latest version
Abstract
Under the influence of global climate change, extreme weather events have become more frequent, and earth and rockfill dams often encounter unconventional working conditions such as sudden changes in reservoir water levels during operation. These abrupt changes are characterized by their strong suddenness and rapid rate of change, which can be challenging for traditional numerical analysis methods due to slow modeling and time-consuming calculations, presenting certain limitations. Therefore, an approach has been developed that integrates seepage monitoring data into the failure probability analysis and early warning methods for earth and rockfill dams. Based on the model's prediction results, dynamic safety warning indicators for the effect of single measurement points on earth and rockfill dams under sudden reservoir water level changes have been quantitatively designed. A risk probability function reflecting the relationship between the residuals of seepage monitoring effects and the risk rate has been constructed to calculate the risk rate of single measurement points for dam seepage effects. By employing the Copula function, which considers the differences and correlations in monitoring effect amounts across different parts of the dam, the single-point seepage risk rates are elevated to multi-point seepage risk rate analysis. This enables the quantification of the overall seepage risk rate of dams under sudden reservoir water level changes. Case study results show that safety model has high prediction accuracy. The joint risk rate of the dam based on the Copula function can simultaneously consider spatial correlations and individual differences among multiple measurement points, effectively reducing the interference of randomness in the calculation of single-point risk rates. This method successfully achieves the dynamic transformation of actual seepage effect measurements into risk rates, providing theoretical basis and technical support for the operational management and safety monitoring of earth and rockfill dams during emergency events.
Keywords:
sudden change in water level
; earth-rock dam
; copula function
; risk rate quantification
; residuals
1. Introduction
In recent years, due to the impact of global climate change, the frequency [1], intensity [2], duration, and impact range [3] of various extreme climate events have been increasing. The safety issues of earth-rock dam engineering under unconventional conditions such as sudden changes in reservoir water levels have become important subjects that urgently need research. Addressing these issues is of great significance for ensuring the safe and efficient operation of earth-rock dam engineering and for disaster prevention and mitigation.
Extensive engineering experience [4,5] indicates that the failure and destruction of earth-rock dams is a progressive development process that transitions from gradual changes to abrupt failures, exhibiting certain precursors to destruction. If abnormal monitoring signal values can be detected in advance, it will enable a comprehensive understanding of the operational risks of earth-rock dams, providing favorable support for the safety and long-term service of dam projects [6,7]. Currently, many experts and scholars both domestically and internationally are researching the safety of earth-rock dam projects. For instance, MOHARRAMI et al. [8] studied the impact of the horizontal drainage capability of the upstream slope of earth-rock dams on slope stability under conditions of rapid water level decline. MOELLMANN et al. [9] considered the effects of transient seepage within the dam body and employed finite element analysis to determine the probability of instability of the dam slope under declining reservoir levels. With the advancements in monitoring of earth-rock dams in data generation [10], collection [11], storage [12], and processing capabilities [13], monitoring data analysis and early warning technologies [12] have developed rapidly. Tang et al. [14] established a risk assessment model for earth-rock dams using a Bayesian network combined with the maximum expectation algorithm, identifying three key factors influencing dam failure. Assaad et al. [15] utilized neural network algorithms to assess the potential hazard levels of dams in the United States, providing a more efficient rapid prediction model for dam safety managers. Zhu et al. [16] developed an adaptive differential evolution algorithm combined with a fuzzy clustering iterative method to evaluate the similarities in life loss during dam failure incidents and validated its effectiveness through case studies. These theories and methods effectively address common issues in traditional risk warning mechanisms for earth-rock dams, such as false alarms, insufficient foresight, and delays in warning feedback, laying a foundational basis for the safety monitoring and long-term service of dam projects. However, abrupt changes in reservoir water levels and other unconventional conditions exhibit strong suddenness and significant variability, leading to non-linear evolution characteristics and dynamic time-varying properties in the risk rates of earth-rock dam operations. Furthermore, due to differences in the timing and location of load applications, modeling and analyzing only single measurement points may overlook the correlations of the entire dam structure and the differences among various monitoring points. The key scientific problem that needs to be resolved is how to accurately characterize and provide quick warnings for the risk rates of earth-rock dams under abrupt reservoir water level changes. The Copula function [17,18,19], as a joint distribution function capable of depicting the correlation characteristics of random variables and the overall data structure among these variables, offers advantages such as simplicity and strong generalization ability. By utilizing the Copula function to calculate the operational risk rates of earth-rock dams under abrupt reservoir water level fluctuations, we can simultaneously consider the structural differences and data correlations among measurement points, thereby achieving real-time quantification of the overall risk rate of earth-rock dams under these conditions.
In-situ monitoring data encompass comprehensive safety information for earth-rock dams over time, effectively reflecting their structural conditions and the characteristics of the loads they experience. This study integrates seepage monitoring data into the failure probability analysis and early warning methods for earth-rock dams. Based on the model's prediction results, safety warning indicators for earth-rock dams under abrupt reservoir water level changes are quantitatively designed. By constructing a risk probability function that reflects the relationship between the residuals of seepage monitoring effects and the risk rates, the single-point risk rate of the seepage effect quantities can be calculated. Abrupt reservoir water level changes lead to different responses in various parts of the dam, and by incorporating the Copula function, we consider the differences and correlations in monitoring effects across different parts of the dam. This approach extends the analysis from single-point seepage risk rates to multi-point seepage risk rates, thereby achieving the quantification of the overall seepage risk rate of the earth-rock dam under abrupt reservoir water level changes. This provides a theoretical basis and technical support for the operational management and safety monitoring of earth-rock dam projects during emergency situations.
2. Seepage Safety Monitoring Model and Risk Rate Quantification for Earth-Rock Dams
Traditional risk rate analysis of hydraulic structures is mostly based on the limit state of the structure to construct a functional function [20,21], without combining engineering monitoring data for targeted extraction. If engineering monitoring information can effectively reflect the operational status of the project, it can be used to construct a seepage safety monitoring model for earth-rock dams based on the characteristics of earth-rock dam seepage. The residual sequence between the model fitting value and the measured value is obtained, and the probability distribution function of the residual value is constructed to determine the seepage risk rate, achieving the quantification of the risk rate for single monitoring points of earth-rock dam seepage monitoring effect quantities.
2.1. Seepage Safety Monitoring Model for Earth-Rock Dams
Analysis of the measured data from the piezometer water levels in earth-rock dams indicates [22,23] that they are mainly influenced by upstream and downstream water levels , rainfall , and the time-varying permeability characteristics of the dam material. A schematic diagram of the influencing factors is shown in Figure 1. Due to the seepage time lag between the reservoir water level and the piezometer water level, the piezometer water level lags behind the reservoir water level, with the upstream water level component represented by the previous reservoir water level . The downstream water level component uses the water level on the day of monitoring as a factor. During rainfall, due to the time lag of rainwater infiltration into the dam body, the previous rainfall amount is used as a factor. The time-dependent component comprehensively reflects the structural particle changes in the dam body caused by variations in soil moisture content over time, as well as other trend changes influenced by time. A combination of polynomial and logarithmic functions is selected to construct the expression for the seepage safety monitoring model of the earth-rock dam as follows:
In the equation, H represents the water level; is the average reservoir water level for the i days preceding the monitoring day; is the downstream water level on the monitoring day; is the previous rainfall amount; t is the cumulative number of days from the monitoring day to the first measurement day, and =t/100 ; c1 and c2 are the fitting coefficients for the time-effect factors; d is the constant term.
2.2. Quantification of Seepage Risk Rate at Single Measurement Points
The seepage safety monitoring model for earth-rock dams describes the correlation between seepage monitoring effect quantities and various influencing factors. Based on statistical principles, if the seepage monitoring effect quantity is treated as a random variable and follows a normal distribution, then the corresponding residuals of the regression model will also follow a normal distribution. For the residuals of the seepage monitoring effect quantities, under a given significance level , they represent a low-probability event [24,25]. Specifically, if the measured values significantly deviate from the mean of the normal distribution of fitted values when the earth-rock dam is operating normally, it indicates that the dam is currently in an abnormal state, and there exists a certain probability of structural failure. Therefore, the difference between the measured values and the fitted values of the seepage monitoring quantity reflects the deviation of the measurement point's operational state from conventional operating conditions, meaning that the residual values contain monitoring information characterizing seepage abnormalities at that measurement point. Thus, the residual values are expressed as a probability distribution function to quantify the likelihood of failure at that measurement point, achieving the risk rate quantification of seepage monitoring effect quantities for a single measurement point in the earth-rock dam. Using the monitoring information such as reservoir water level , rainfall , and time as input variables for the combined model, the residual series of the model fitting values and measured values is obtained. By constructing the probability distribution function of the residual values, the risk rate of seepage at the measurement point is characterized, enabling the risk rate quantification of seepage monitoring effect quantities at a single measurement point in the earth-rock dam [26].
The risk rate function expression for a single seepage monitoring point of the earth-rock dam is:
Where: is the risk rate of the monitoring point effect quantity; K is the risk rate coefficient; is the predicted value of the effect quantity; is the measured value of the effect quantity; is the residual standard deviation. According to statistical principles and safety monitoring theory, there exists , where R is the design allowable value in the dam safety criterion; and the seepage measured value follows a normal distribution, so there , , whereare the upper and lower limits of the monitoring index.
3. Quantitative Analysis of Earth-Rock Dam Risk Rate Based on Copula Functions
Traditional risk rate analysis for hydraulic structures largely relies on constructing limit state functions based on structural performance, and has not yet effectively combined project monitoring data for targeted extraction. Effectively interpreting engineering monitoring information would directly reflect the operational characteristics of the project. By constructing a risk probability function that reflects the relationship between the residuals of seepage monitoring effects and risk rates, the single-point risk rate of seepage effect quantities in earth-rock dams can be calculated. Incorporating the Copula function allows us to consider the differences and correlations in monitoring effect quantities across various parts of the dam, thereby enhancing the analysis from single-point seepage risk rates to multi-point seepage risk rates. This approach facilitates the quantification of the overall seepage risk rate of earth-rock dams under abrupt reservoir water level changes.
3.1. Risk Rate Quantification Analysis for Earth-Rock Dams Based on Copula Function
The Copula function was first proposed by Sklar [27] in 1959 and applied to financial risk calculation. It has since been widely used in hydrological flood and geotechnical parameter uncertainty calculation fields. It has shown strong model generalization ability in constructing joint probability distribution functions. According to Copula theory, any multidimensional joint distribution function can be decomposed into several marginal distribution functions and a Copula function, where the Copula function uniquely describes the correlation structure between the marginal distributions. Let the joint distribution function of a d-dimensional random vector be, and the marginal distribution functions be , and C be the Copula function characterizing the correlation between the random vectors , then the joint distribution of the d-dimensional vector can be expressed as:
Therefore, the risk rate quantification model for earth-rock dams essentially combines the risk rate functions of multiple monitoring points by utilizing Copula functions, thereby constructing an overall risk rate analysis model for the dam. In this model, the risk rate function of each individual monitoring point serves as the marginal distribution function, while the risk rate function of multiple monitoring points constitutes the joint distribution function.
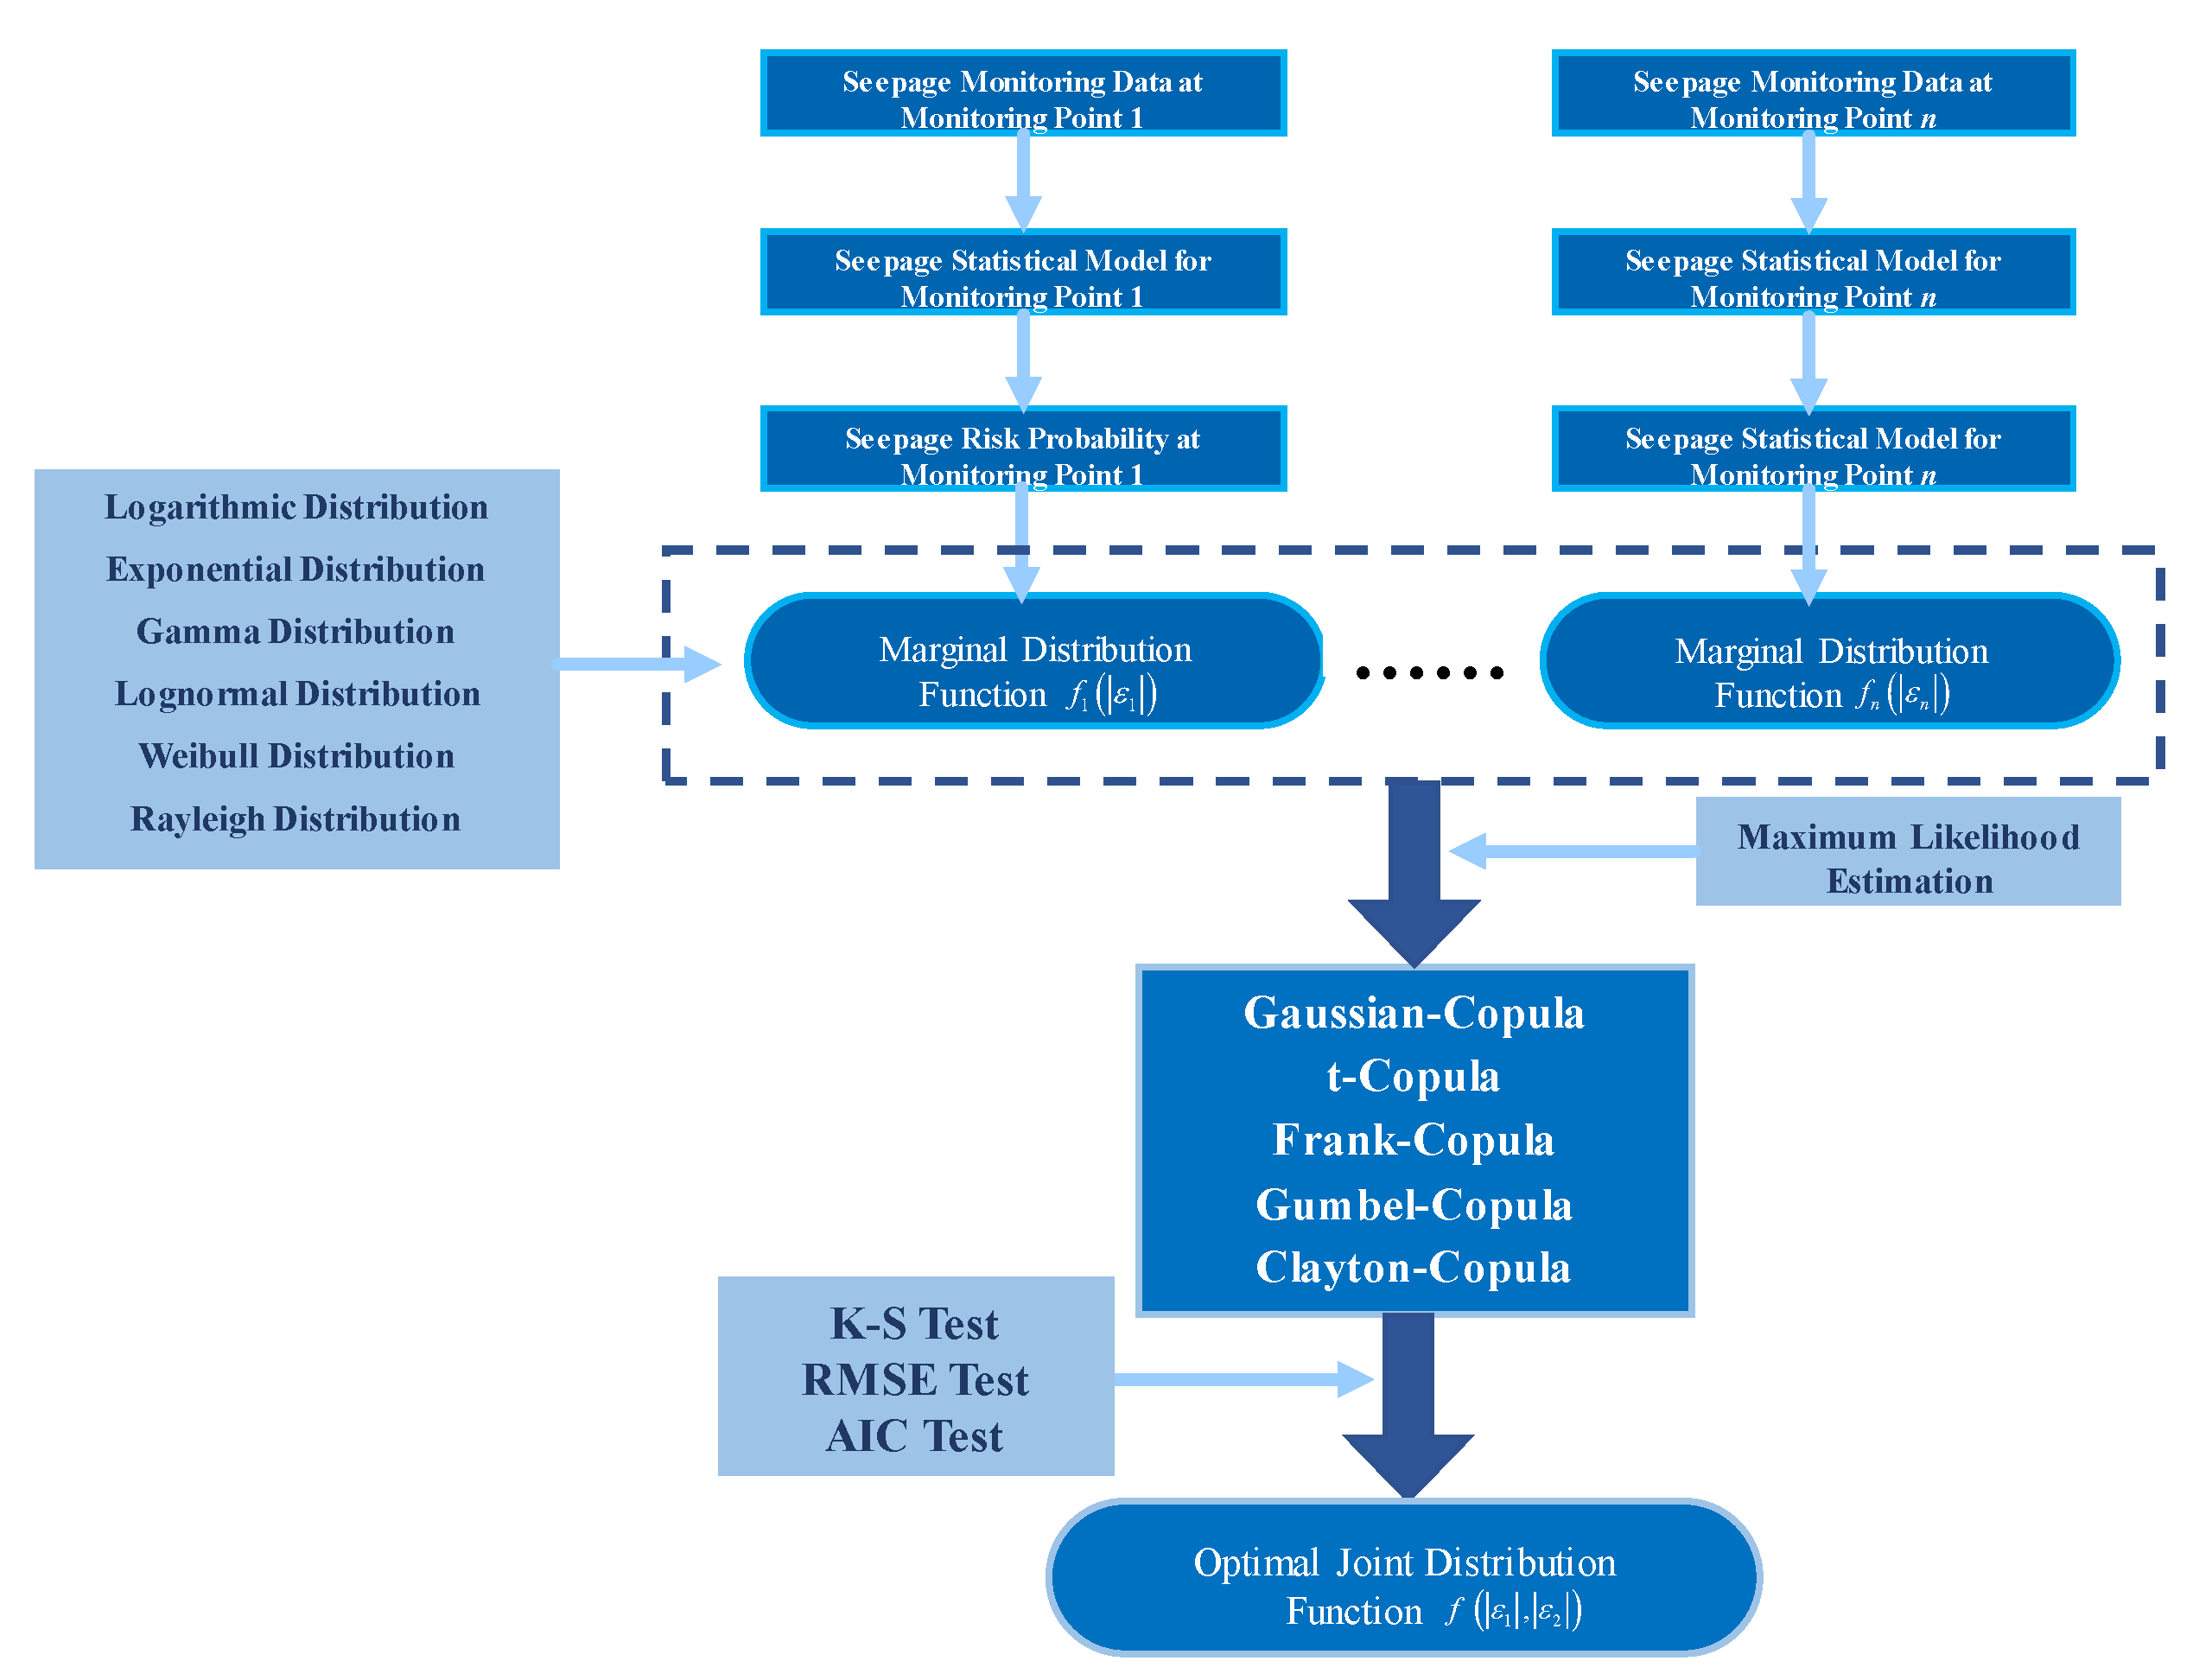
Based on Copula function theory [28], the potential marginal distribution functions for the risk rates at each monitoring point of the earth-rock dam are selected. The data structure is then evaluated using three statistical parameters: the Kolmogorov-Smirnov (K-S) test, the Root Mean Square Error (RMSE), and the Akaike Information Criterion (AIC). This process helps determine the optimal Copula function for analyzing the overall seepage risk rate of the earth-rock dam. Six commonly used distributions, namely Normal, Lognormal, Gamma, Weibull, Exponential, and Rayleigh, are selected as possible marginal distributions for each monitoring data. The probability density functions and parameters of the selected six marginal distributions are shown in Table 1.
Based on the determined marginal distribution functions of each measurement point, a quantification model for the overall risk rate of the earth-rock dam is constructed. Five common Copula functions (i.e., Gaussian Copula, t-Copula, Frank Copula, Gumbel Copula, and Clayton Copula) are used to construct the joint distribution functions. The parameters for the selected Copula functions are estimated using the maximum likelihood estimation method [28], and the structure of the data is tested with three statistical parameters to determine the optimal Copula function expression for the joint distribution function. This allows for further calculation of the overall risk rate of the earth-rock dam.
3.2. Quantification Process of Operation Risk Rate for Earth-Rock Dams Under Sudden Changes in Reservoir Water Levels
Based on the above, the steps for calculating the overall risk rate of seepage in earth-rock dams under sudden changes in reservoir water levels are as follows:
(1) Based on the seepage monitoring data of earth-rock dams under rapid reservoir water level changes, construct a seepage safety monitoring model for single monitoring points of earth-rock dams, and determine the marginal probability density function of the seepage risk rate of monitoring points by fitting the difference between the measured value and the fitting value.
(2) Use the maximum likelihood estimation method (MLE) to perform parameter estimation for the optimal Copula function.
(3) Employ the K-S test, Root Mean Square Error (RMSE), and Akaike Information Criterion (AIC) to assess the data structure and select the optimal Copula function.
(4) Establish the seepage risk rate model for the earth-rock dam based on the Copula function and calculate the overall risk rate of the dam.
(5) Define the risk rate thresholds for each level of damage based on the building classification; if the risk rate does not exceed the threshold, the structure is considered safe; if it exceeds the threshold, it is deemed unsafe.
Figure 5.
Flow chart for calculating the operational risk rate of earth-rock dams under rapid reservoir water level changes.
Figure 5.
Flow chart for calculating the operational risk rate of earth-rock dams under rapid reservoir water level changes.
4. Early Warning Methods for Earth-Rock Dams Under Sudden Changes in Reservoir Water Levels
4.1. Risk Rate Early Warning for Earth-Rock Dams
During the construction and operation of earth-rock dams, there are always two states: reliable (safe, applicable, durable) and unreliable (unsafe, inapplicable, non-durable). To correctly reflect the working state of the earth-rock dam, a functional function is usually used for description.
If the basic random factors of the earth-rock dam are, the functional function is Z, the resistance random factor is R, and the load effect random factor is S, then the functional function can be expressed as:
When Z>0, it indicates a reliable state; when Z<0, it indicates an unreliable state; and when Z=0, it indicates a limit state, where Z-R-S=0 is called the limit state equation, representing the boundary between the reliable and unreliable states of the earth-rock dam, which is a threshold for the working state of the earth-rock dam. The "Unified Standard for Reliability Design of Hydraulic and Hydroelectric Engineering Structures (GB 50199—2013)" [29] defines the target reliability and allowable risk rate for different safety levels of hydraulic and hydroelectric engineering, as shown in Table 2. This method defines the failure probability by setting different safety level reliabilities, and this paper uses it as the basis for early warning of the risk rate of earth-rock dams.
4.2. Single Measurement Point Early Warning
Dynamic early warning for single measurement points in earth-rock dams is generally based on historical monitoring data of the point experiencing adverse conditions. Warning indicators are proposed for coping with such conditions by assessing and predicting the capability of withstanding potential loads based on the point’s past ability to endure applied loads, thus determining the alarm values and extreme values of monitoring effect quantities under those loads. At the same time, the reliability indicators in the standards serve as limit state indicators that ensure the structure's continuous load-bearing capacity during its service life. Falling below this standard indicates the termination of the structure's lifespan. Typically, hydraulic engineering failures do not occur at this limit state; rather, during a certain service period, the engineering reliability index may fall below the target reliability. However, after appropriate repairs, the structure's reliability can meet the requirements again. Therefore, to provide a safety warning for the operational state of earth-rock dam projects and to timely reinforce and eliminate risks, it is often necessary to apply a reduction to the target reliability index used in practical engineering. Here, is defined as the target reliability index for assessing the state of an in-service earth-rock dam project, and a reduction factor is selected based on "The Theory and Application of Engineering Structural Reliability" [30]. In distinguishing between the safe state and the warning state for single measurement points in earth-rock dam projects, the reliability index is set as the target reliability for the distribution of measured values, generating a primary control line for the measured value distribution, with a corresponding allowable risk rate of ; this is designated as a Type I warning indicator. When the single measurement point reaches the warning state or emergency state, the reliability index is set as the target reliability for the distribution of measured values, creating a secondary control line for the measured value distribution, with a corresponding allowable risk rate of ; this is designated as a Type II emergency indicator.
Figure 6.
Schematic Diagram of Dynamic Early Warning Method for Single Measurement Points in Earth-Rock Dams Under Sudden Changes in Reservoir Water Levels.
Figure 6.
Schematic Diagram of Dynamic Early Warning Method for Single Measurement Points in Earth-Rock Dams Under Sudden Changes in Reservoir Water Levels.
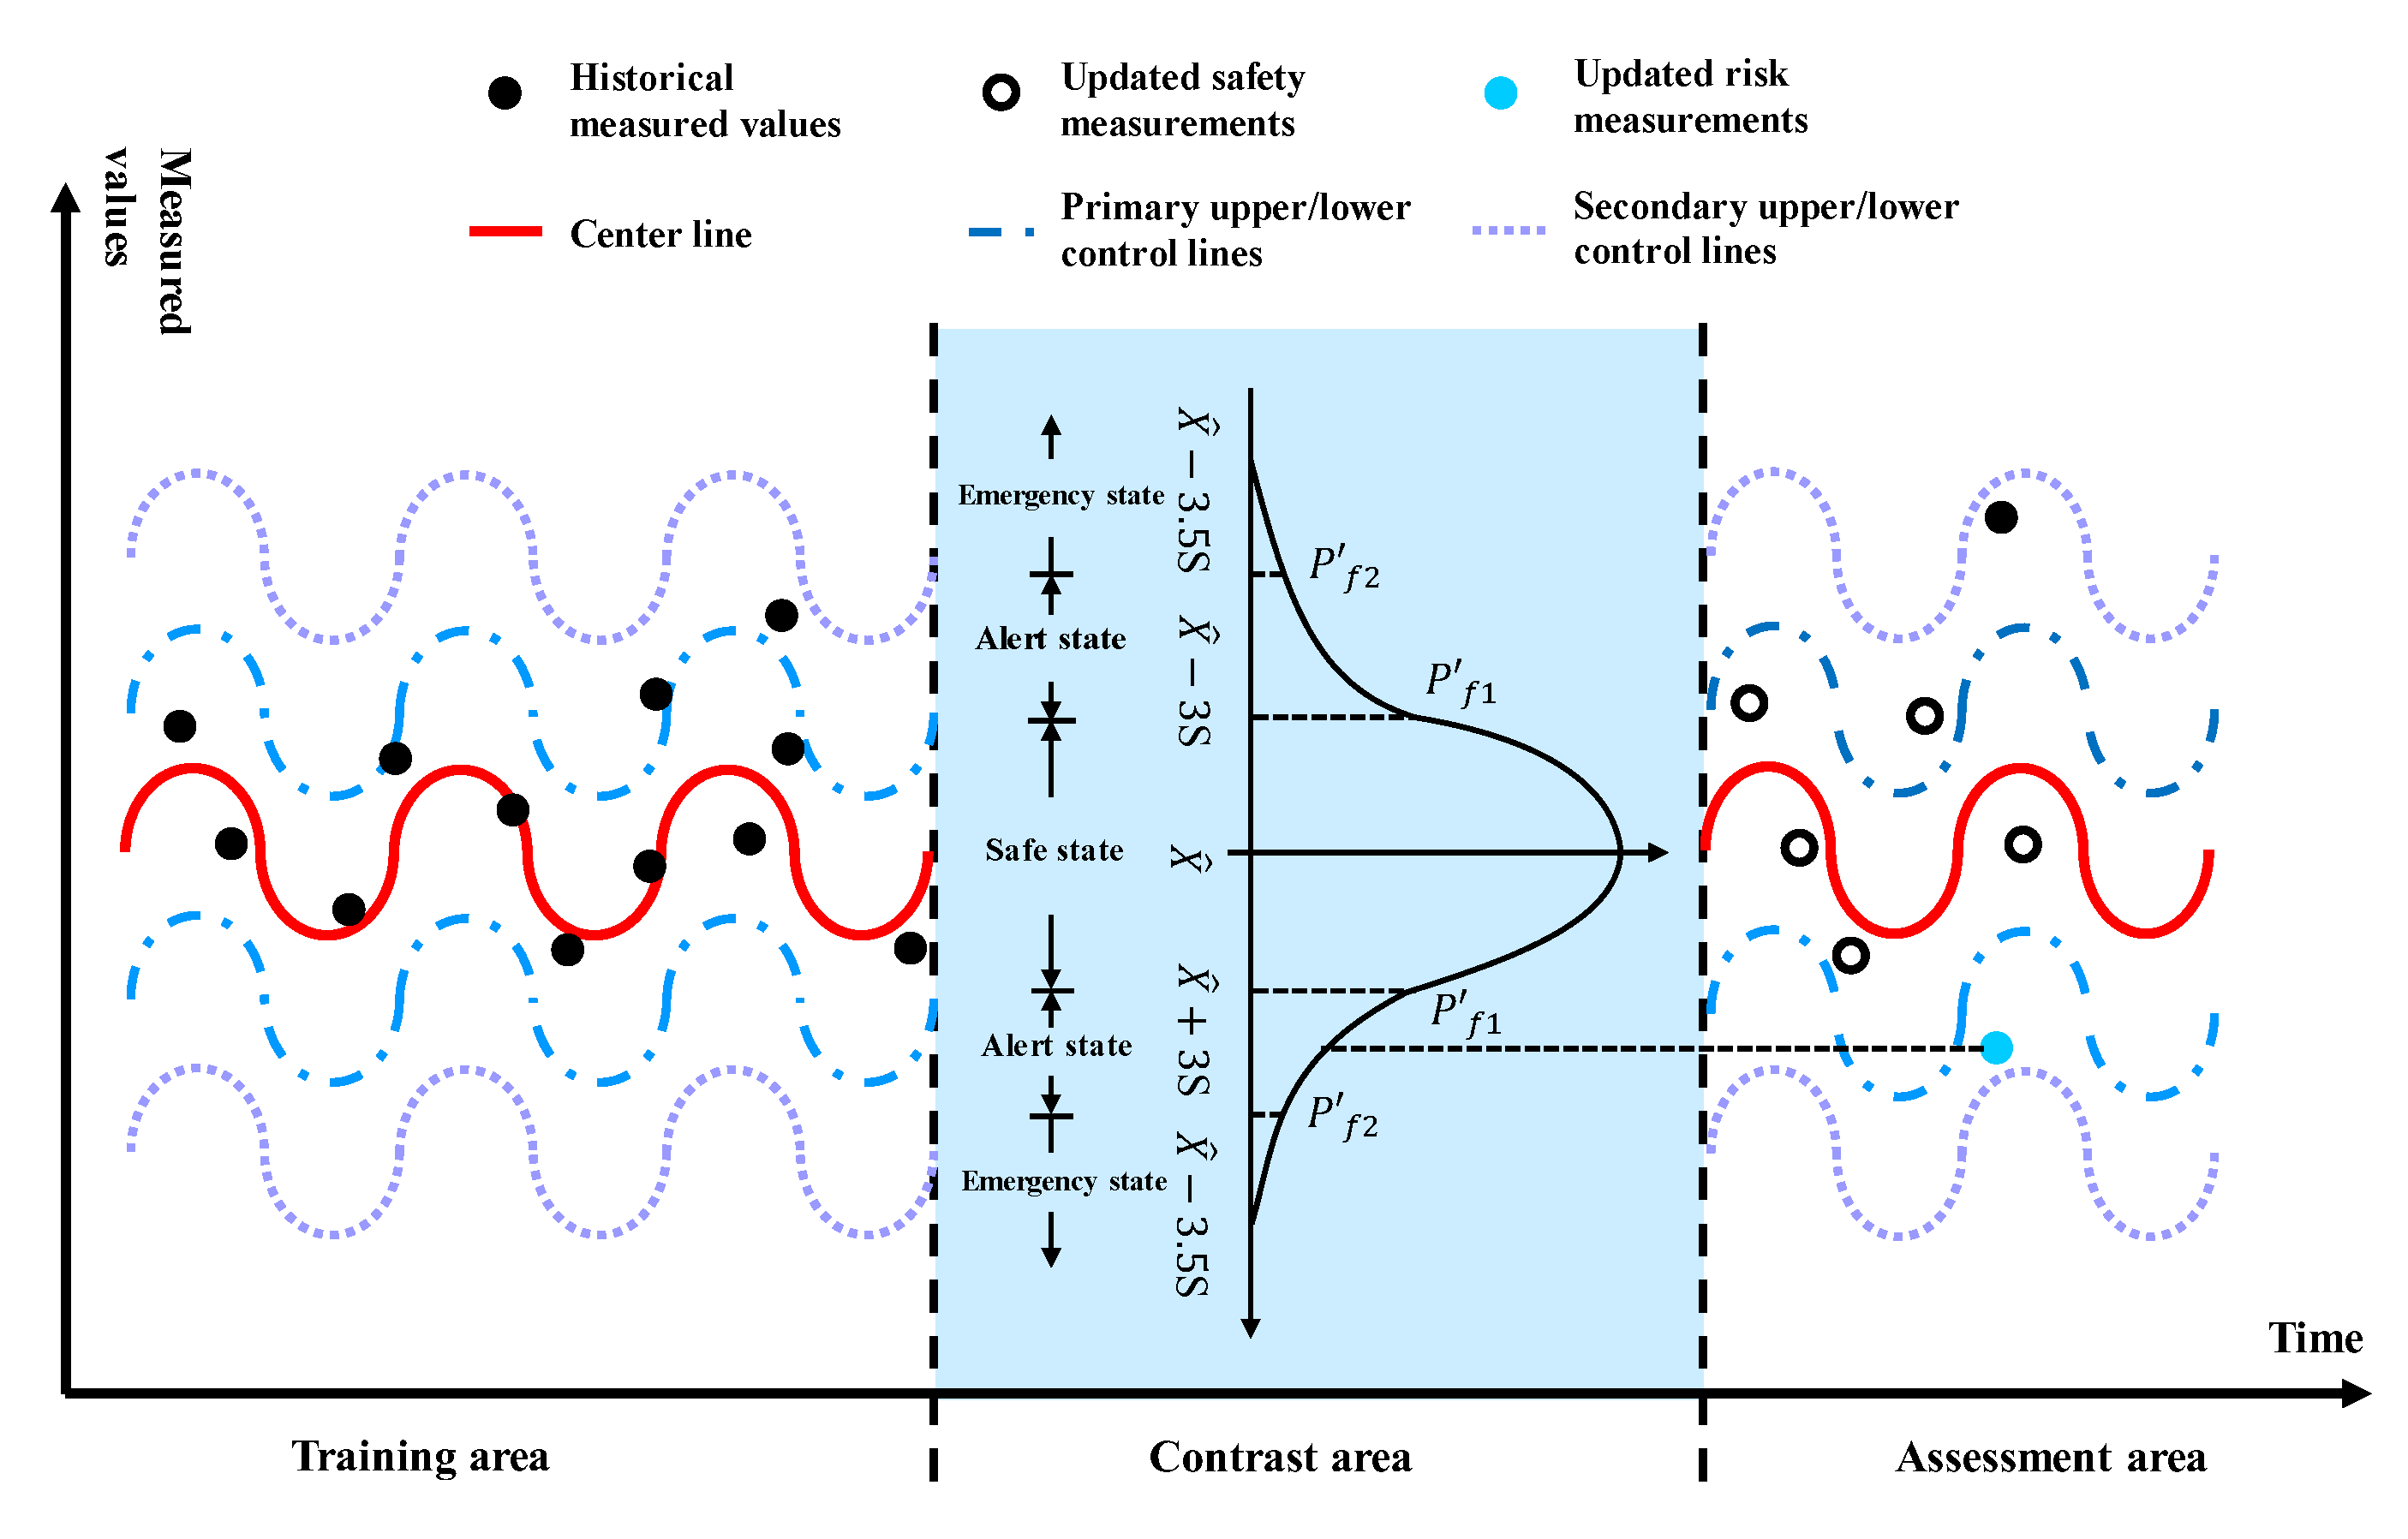
(1) Training Zone. Assume there is a series of measurement points in a certain area, where n is the temporal length. A model is established for the measurement point as described in Section 2, yielding the correlation coefficient R and standard deviation S. The historical measurement values of the point and the model fitting values are input into the training zone of the model shown in Figure 6.
(2) Judgment Zone. As the measured values are updated, the actual measured value of the point, along with the corresponding upstream water level, downstream water level, rainfall, and time, are input. The updated measurement value of the point and the model prediction values are input into the judgment zone of the model shown in Figure 6.
(3) Comparison Zone. Based on the model fit values , a central line is generated, and combined with the confidence interval method and the target reliability indicators corresponding to the two-level warning indicators and , the upper and lower control lines for the slope safety monitoring values are generated. The first-level control line is denoted as , and the second-level control line as . Additionally, by calculating the real-time risk rates of the measurement point values, the real-time risks and statuses of the measurement points can be assessed. The first type of warning indicator corresponds to the real-time risk rate calculated when the measurement value distribution meets the target reliability , the second type of emergency indicator corresponds to the real-time risk rate calculated when the measurement value distribution meets the target reliability.
5. Application Example
The maximum height of a certain earth-rock dam is 35.5 m, with a crest elevation of 181.80 m and a wave-dissipation wall crest elevation of 183.00 m. The crest width is 7.0 m, with a design flood level corresponding to a 100-year return period at 177.89 m, resulting in a storage capacity of 548 million m3. The check flood level for a 5000-year return period corresponds to a water level of 180.82 m, resulting in a storage capacity of 680 million m3. The seepage monitoring layout diagram of the earth-rock dam and the schematic diagram of the earth-rock dam cross-section are shown in Figure 7 and Figure 8.
The seepage monitoring data from the reservoir between July 23, 2010, and May 12, 2017, is selected as the training set, while the seepage monitoring data from May 19, 2017, to July 31, 2020, is used as the test set. The ratio of the training set to the test set is 4:1. The test set data (from May 19, 2017, to July 31, 2020) includes two segments of rapid water level rises and one segment of rapid water level decline. This representative data demonstrates the effectiveness of the quantitative risk rate assessment and early warning methods for earth-rock dams under abrupt reservoir water level changes. The environmental conditions of the reservoir and the water levels of the piezometers are shown in Figure 9.
5.1. Dynamic Warning for Earth-Rock Dams Under Sudden Changes in Reservoir Water Level
Based on the seepage monitoring data of the earth-rock dam, seepage statistical models for each monitoring point are constructed. The models are fitted using the least squares method to obtain the model fitting values and residuals, as shown in Figure 5a. The correlation coefficients and standard deviations of the models are shown in Table 3.
Figure 5.
Measured values, fitting values, and corresponding residuals of the piezometric tubes in the earth-rock dam.
Figure 5.
Measured values, fitting values, and corresponding residuals of the piezometric tubes in the earth-rock dam.
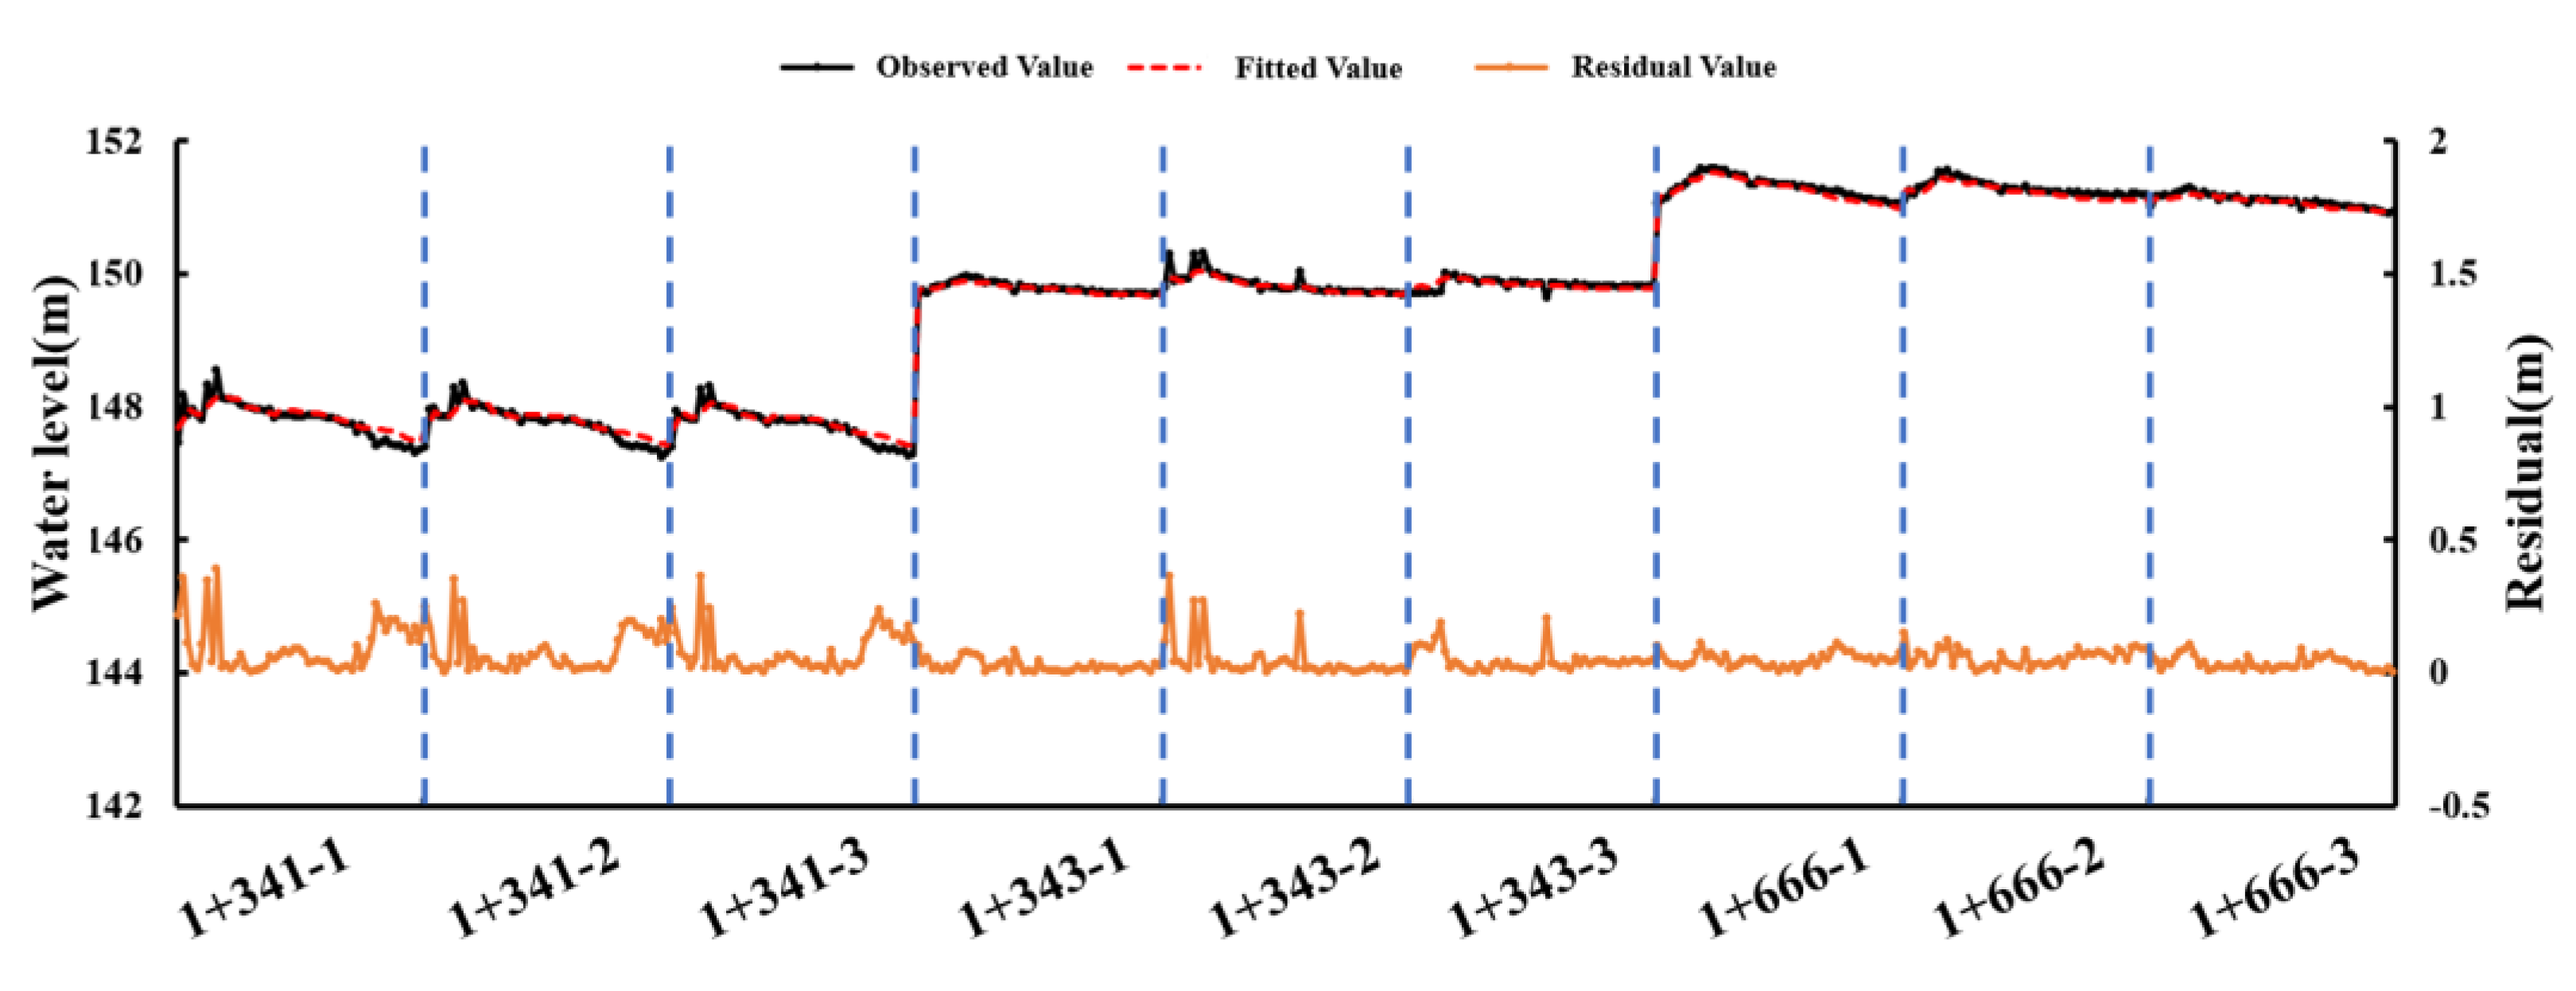
From the results presented in Table 3, it can be inferred that the overall accuracy of the model is high. The constructed statistical model is capable of effectively simulating the dynamic variations of piezometric water levels, which indicates that the selection of factors is reasonable.
The safety monitoring model for earth-rock dams demonstrates high accuracy, with fitting results that are authentic and reliable. This aids in enhancing the effectiveness and credibility of establishing dynamic warning indicators and risk rate quantification based on model fitting results. It can realistically reflect the seepage field of an earth-rock dam under the combined load effect of sudden reservoir water level changes, and it can also provide monitoring and warning for areas without installed measurement points. Based on the seepage fitting values at each measurement point obtained from the hybrid neural network model, primary and secondary control lines are sequentially generated according to the method described in Section 4.2 for dynamic warning at measurement points 1+141-1, 1+143-1, and 1+666-1 on the dam, as shown in Figure 13.
From the Figure 13, it can be observed that the historical measurement values, fitted values, updated measurement values, and predicted values for each monitoring point generally fall within the envelope area of the first-level upper and lower control lines. At this time, the state of the earth-rock dam and the predicted results of the safety monitoring model are quite similar, indicating that the model can reasonably describe the safety state of the dam under both rapid water level decline and rise conditions. This suggests that the model is well-constructed and possesses strong generalization capabilities. During this period, there were two instances of rapid water level rise and one instance of rapid water level decline. During the rapid water level rise phase, all monitoring points exhibited a contraction state within the first and second control line areas. Conversely, during the water level decline phase, the process lines of the monitoring points showed a more relaxed state in relation to the first and second control lines. Additionally, the rates of change in the piezometric water levels at each monitoring point were inconsistent, which is attributed to the spatial variability of the permeability coefficients and parameter uncertainty at each seepage monitoring point. This variability led to different response rates to the rising and falling water levels. The results obtained align with the fundamental principles and objective facts regarding seepage changes in earth-rock dams under abrupt reservoir water level changes, effectively interpreting engineering monitoring information and intuitively reflecting the operational characteristics of the project.
5.2. Risk Rate Analysis Model for Single Measurement Points in Earth-Rock Dams
Based on the model fitted values and measured values, a residual sequence was obtained, and the corresponding risk rate for each individual monitoring point was calculated. Six commonly used kernel density non-parametric distributions—Normal, Lognormal, Gamma, Weibull, Exponential, and Rayleigh—were selected as potential marginal distributions for the risk rate data at each monitoring point. Parameter estimation was performed for the risk rate at each monitoring point, and the distribution fitting curves for the risk rate of each monitoring point were plotted based on the probability density functions of each distribution, as shown in Figure 14.
The K-S test is used to evaluate whether the random variable (X) follows the selected marginal distribution. A smaller K-S test statistic indicates a better fit between the random variable (X) and the distribution. The parameters to be estimated for the single-point risk rate marginal distribution function of monitoring point 1+341-1, along with the K-S test results, are presented in Table 4. According to the test parameters of various assumed distributions and the results of the K-S test, the minimum K-S test statistic for monitoring point 1+341-1 is 0.0742, with corresponding parameters ( = 1.0541) and ( = 0.0887). Therefore, the optimal marginal distribution probability function for monitoring point 1+341-1 is determined to be a Gamma distribution. Due to space limitations, the K-S test values for the remaining monitoring points are also used to select the best marginal distributions.
Limited by space, the calculation of the real-time risk rate for monitoring point 1+341-1 is shown in Figure 15, while the remaining monitoring points are calculated and integrated into subsequent steps. From Figure 15, it can be observed that high risk rates mainly occur during abrupt changes in reservoir water levels. For example, on July 20, 2018, the risk rate exceeded 0.9, indicating a sudden rise in reservoir water levels. This suggests that the dam is affected by the rising reservoir water level, putting the earth-rock dam in a loaded state. Under the immense thrust of water, the overall stability of the earth-rock dam decreases, resulting in a higher probability of failure. On October 11, 2019, there was a sudden drop in reservoir water levels, and the risk rate also exceeded 0.9. In this case, the earth-rock dam is normally in a stable seepage phase at the regular water level. When the water level drops suddenly, the upstream dam loses the pressure from the water, making it susceptible to landslides. Thus, the risk rate of the earth-rock dam is higher during sudden water level declines. Consequently, the significant fluctuations in the rate of change in reservoir water levels are the primary factors contributing to the increased real-time risk rate of the earth-rock dam. When the reservoir water level remains relatively stable, the calculated risk rates based on the prototype monitoring data are lower. There are two reasons for this situation: first, the seepage safety monitoring model is quite sensitive to changes in reservoir water levels, and the impact of the water level influencing factor in the model is significant, resulting in higher risk rates during sudden changes compared to more stable phases. Additionally, the dam experiences disturbances during rapid changes in water load and unloading rates, making the safety margin of the earth-rock dam lower during these periods than during stable water level operations, which is also one of the factors leading to higher risk rates.
5.3. Real-Time Seepage Risk Rate Quantification Model for Earth-Rock Dams Under Sudden Changes in Reservoir Water Levels
After determining the marginal distribution functions for each single variable, based on the overall risk rate calculation process for earth-rock dams, the best joint distribution function is selected to calculate the parameters and of each joint distribution function. Compare their K-S test values, ERMSE, and values to obtain the parameters and evaluation metrics of each Copula function (Table 5).
The AIC value can simultaneously account for the goodness of fit and simplicity of the random variable (X), representing the relative amount of information loss for the candidate joint distribution functions. Therefore, the one with the minimum value is considered the optimal joint distribution function. The RMSE reflects the difference between the theoretical probability of the selected joint distribution function and the empirical probability of the sample data; the smaller the difference, the better the fit. Comparing the parameters to be estimated for each Copula function and the results of various test indicators, the minimum values corresponding to the K-S test, RMSE, and AIC are 0.0124, 0.0314, and 0.4412, respectively. The corresponding parameter for these values is 0.1281, indicating that the best joint probability distribution function is the Frank Copula function. Additionally, Gauss Copula and conventional weights are used as comparisons to calculate the risk rates at sections 1+141, 1+143, and 1+666, as shown in Figure 16.
For a given set of multivariate samples, the optimal form of the Copula function for its marginal distribution is uncertain. As a non-parametric estimation method, it fits and computes based solely on the distribution patterns of the raw samples. From Figure 16a-c, it can be observed that the time series curve of the joint risk rate obtained from the Frank Copula function is essentially the same as that from the Gaussian Copula method. This confirms that the former is a reasonable joint probability distribution function for multiple monitoring points. In contrast, the joint risk rate calculated using the objective weighting method is significantly higher than that obtained from the two Copula function methods. This is because the objective weighting method utilizes fixed weights for each monitoring point and does not account for different variations under various loads and conditions. As noted earlier, abrupt changes in reservoir water levels and other unconventional conditions exhibit strong suddenness and significant variability, with the risk rates of earth-rock dam operations displaying nonlinear evolution characteristics and dynamic time-varying properties. By incorporating the Copula function to consider the spatial correlations and individual differences in the monitoring effects across various parts of the dam, the interference from the randomness of individual monitoring points can be effectively reduced, thereby achieving the dynamic conversion of measured seepage effects and risk rates under sudden reservoir water level changes. When most monitoring points simultaneously exhibit high risk rates, it is likely that the earth-rock dam is in an abnormal operating state, potentially facing extreme loads or structural damage not covered by the existing observational data. Therefore, the observed overall risk rate may be elevated, necessitating further monitoring and verification of the causes of these anomalies.
Figure 17 shows the process of the overall operational risk rate of the earth-rock dam under sudden changes in reservoir water level. It can be observed that as time and water levels change, the operational risk rate of the earth-rock dam exhibits an increasing trend. According to the "Unified Standard for Reliability Design of Water Conservancy and Hydroelectric Engineering Structures (GB 50199—2013)," this earth-rock dam is classified as a Grade I structure, with a corresponding Type II damage risk rate of 1.34×10^-5. Therefore, it can be concluded that the dam is currently in a relatively safe state, with reasonable seepage monitoring at all measurement points and no significant abnormalities.
6. Conclusions
In response to the frequent occurrences of extreme climate phenomena and the inability to quantify the operational risk rates of earth-rock dams in real-time under sudden changes in reservoir water levels, this paper incorporates seepage monitoring data into the failure probability analysis and early warning methods for earth-rock dams. A quantification model and early warning method for the operational risk rate of earth-rock dams are constructed based on Copula function theory. By combining engineering case studies, the effectiveness of the model is validated, leading to the following conclusions:
(1) By constructing a risk probability function that reflects the relationship between the residuals of seepage monitoring effects and risk rates, the single-point risk rate of seepage effect quantities in earth-rock dams is calculated. Incorporating the Copula function considers the spatial correlations and individual differences in monitoring effects across various parts of the dam, effectively reducing the interference from the randomness of individual monitoring points. This approach achieves the dynamic conversion of measured seepage effects and risk rates under abrupt reservoir water level changes, effectively interpreting engineering monitoring information and intuitively reflecting the real-time operational characteristics of the project.
(2) Two types of warning indicators are quantitatively designed for the alert status of earth-rock dams under sudden water level changes. A dynamic warning method for monitoring effect quantities at a specific earth-rock dam is proposed based on the confidence interval method, indicating that the first and second control lines of the dam are in a contracted state during abrupt water level changes. Quantitative analysis of the overall risk rate of the earth-rock dam based on Copula function theory shows that high-risk periods primarily occur during rapid fluctuations in reservoir water level rates, with the overall risk rate decreasing as the number of monitoring points increases. It is advised to pay close attention to changes in reservoir water levels during operational management and to minimize the rate of water level fluctuations whenever possible.
Acknowledgments
This research has been supported by the National Natural Science Foundation of China, Grant/Award Number: U2243244, U2243223, U24A20171, Graduate Thesis Foundation of Nanjing Hydraulic Research Institute, Grant/Award Number: Yy724004, Special Fund for Basic Scientific Research of Central Public Research Institutes Grant/Award Number: Y722005, Y723005.
References
- Newman, R.; Noy, I. The Global Costs of Extreme Weather that are Attributable to Climate Change. SSRN Electronic Journal. 2022. [Google Scholar] [CrossRef]
- Nanditha, J.S.; Kushwaha, A.P.; Singh, R.; Malik, I.; Solanki, H.; Chuphal, D.S.; Dangar, S.; Mahto, S.S.; Vegad, U.; Mishra, V. The Pakistan Flood of August 2022: Causes and Implications. Earth’s Future 2023, 11. [Google Scholar] [CrossRef]
- Gao, C.S.; Hu, J. Impact of climate change on safety of water infrastructures and response measures. China Water Resources 2024, 60–67. [Google Scholar]
- Ye, W.; Ma, F.H.; Hu, J.; et al. Seepage behaviors of inclined wall dams under drought-flood abrupt alternation[J]. Chinese Journal of Geotechnical Engineering 2018, 40, 1923–1929. [Google Scholar] [CrossRef]
- Yan, C.; Tu, J.; Li, D.; Guo, S.; Liang, H. The Failure Mechanism of Concrete Gravity Dams considering Different Nonlinear Models under Strong Earthquakes. Shock and Vibration. 2021. [Google Scholar] [CrossRef]
- Tang, X.; Chen, A.; He, J. Optimized variable selection of Bayesian network for dam risk analysis: A case study of earth dams in the United States. Journal of Hydrology. 2023, 617, 129091–129091. [Google Scholar] [CrossRef]
- Su, H.; Li, J.; Wen, Z.; Fu, Z. Dynamic non-probabilistic reliability evaluation and service life prediction for arch dams considering time-varying effects. Applied Mathematical Modelling. 2016, 40, 6908–6923. [Google Scholar] [CrossRef]
- Moharrami, A.; Hassanzadeh, Y.; Salmasi, F.; Moradi, G.; Moharrami, G. Performance of the horizontal drains in upstream shell of earth dams on the upstream slope stability during rapid drawdown conditions. Arabian Journal of Geosciences. 2013, 7, 1957–1964. [Google Scholar] [CrossRef]
- Axel Moellmann, P.A. Vermeer, M. Huber, A probabilistic finite element analysis of embankment stability under transient seepage conditions, Georisk: Assessment and Management of Risk for Engineered Systems and Geohazards. 2011, 5, 110–119. [CrossRef]
- Ye, W.; Ma, F.H.; Hu, J.; et al. Centrifugal model tests on danger incubation and catastrophic process of inclined wall dams under drought-flood abrupt alternation[J]. Chinese Journal of Geotechnical Engineering 2023, 45, 2100–2109. [Google Scholar] [CrossRef]
- Li, B.; Yang, J.; Hu, D. Dam monitoring data analysis methods: A literature review. Structural Control and Health Monitoring. 2019, 27. [Google Scholar] [CrossRef]
- Rico, J.; Barateiro, J.; Juan, M.T. Applying advanced data analytics and machine learning to enhance the safety control of dams, Springer, New York ; London, 2011.
- Kang, F.; Liu, J.; Li, J.; Li, S. Concrete dam deformation prediction model for health monitoring based on extreme learning machine. Structural Control and Health Monitoring. 2017, 24, e1997. [Google Scholar] [CrossRef]
- Ma, J.; Cheng, J.C.P.; Jiang, F.; Chen, W.; Wang, M.; Zhai, C. A bi-directional missing data imputation scheme based on LSTM and transfer learning for building energy data. Energy and Buildings. 2020, 216, 109941. [Google Scholar] [CrossRef]
- Assaad, R.; El-adaway, I.H. Evaluation and Prediction of the Hazard Potential Level of Dam Infrastructures Using Computational Artificial Intelligence Algorithms. Journal of Management in Engineering. 2020, 36, 04020051. [Google Scholar] [CrossRef]
- Zhu, Y.; Niu, X.; Gu, C.; Dai, B.; Huang, L. A Fuzzy Clustering Logic Life Loss Risk Evaluation Model for Dam-Break Floods. Complexity. 2021, 1–15. [Google Scholar] [CrossRef]
- Nelsen, R.B. An introduction to copulas, Springer, New York ; London, 2011.
- He, M.; Li, H.; Xu, J.; Wang, H.; Xu, W.; Chen, S. Estimation of unloading relaxation depth of Baihetan Arch Dam foundation using long-short term memory network. Water Science and Engineering. 2021, 14, 149–158. [Google Scholar] [CrossRef]
- Wang, S.; Liu, Y.; Zhou, H.; Zhang, Y.; Wu, Z.; Yang, Q. Experimental study on failure process of arch dam based on acoustic emission technique. Engineering Failure Analysis. 2019, 97, 128–144. [Google Scholar] [CrossRef]
- Li, B.; Yang, J.; Hu, D. Dam monitoring data analysis methods: A literature review, Structural Control and Health Monitoring. 2019, 27. [CrossRef]
- Kim, J.; Moon, N. BiLSTM model based on multivariate time series data in multiple field for forecasting trading area. Journal of Ambient Intelligence and Humanized Computing. 2019. [Google Scholar] [CrossRef]
- Li, Z.; Hu, Z.; Lin, G.; Li, J. A scaled boundary finite element method procedure for arch dam-water-foundation rock interaction in complex layered half-space. Computers and Geotechnics. 2021, 141, 104524–104524. [Google Scholar] [CrossRef]
- Xu, Q.; Zhang, T.; Chen, J.; Li, J.; Li, C. The influence of reinforcement strengthening on seismic response and index correlation for high arch dams by endurance time analysis method. Structures. 2021, 32, 355–379. [Google Scholar] [CrossRef]
- Lin, P.; Guan, J.; Peng, H.; Shi, J. Horizontal cracking and crack repair analysis of a super high arch dam based on fracture toughness. Engineering Failure Analysis. 2019, 97, 72–90. [Google Scholar] [CrossRef]
- Niu, J.T.; Jiang, L.; Deng, Z.P.; et al. Real-time risk rate model for deformation of ultra-high arch dams based on prototype monitoring data[J]. Journal of Water Resources and Water Engineering 2021, 32, 166–174. [Google Scholar]
- Gu, C.S.; Wu, Z.R. Dam and dam foundation safety monitoring theories and methods and their applications, Hohai University Press, Nanjing, 2006.
- Van Vliet, B. Abe Sklar’s “FONCTIONS DE REPARTITION A N DIMENSIONS ET LEURS MARGES”: The Original Document and an English Translation. SSRN Electronic Journal. 2023. [Google Scholar] [CrossRef]
- Chen, W.X.; Yang, R.; Xie, M. Maximum likelihood estimator of scale parameter under perfect and imperfect Median ranked set sampling design[J]. Acta Mathematicae Applicatae Sinica 2020, 43, 572–583. [Google Scholar]
- Hu, J.; Ma, F.; Wu, S. Nonlinear finite-element-based structural system failure probability analysis methodology for gravity dams considering correlated failure modes. Journal of Central South University. 2017, 24, 178–189. [Google Scholar] [CrossRef]
- Li, Y.; Bao, T.; Chen, H.; Zhang, K.; Shu, X.; Chen, Z.; Hu, Y. A large-scale sensor missing data imputation framework for dams using deep learning and transfer learning strategy. Measurement. 2021, 178, 109377–109377. [Google Scholar] [CrossRef]
Figure 1.
Schematic Diagram of Contributing Factors to the Statistical Model of Piezometer Water Levels in Earth-Rock Dams.
Figure 1.
Schematic Diagram of Contributing Factors to the Statistical Model of Piezometer Water Levels in Earth-Rock Dams.
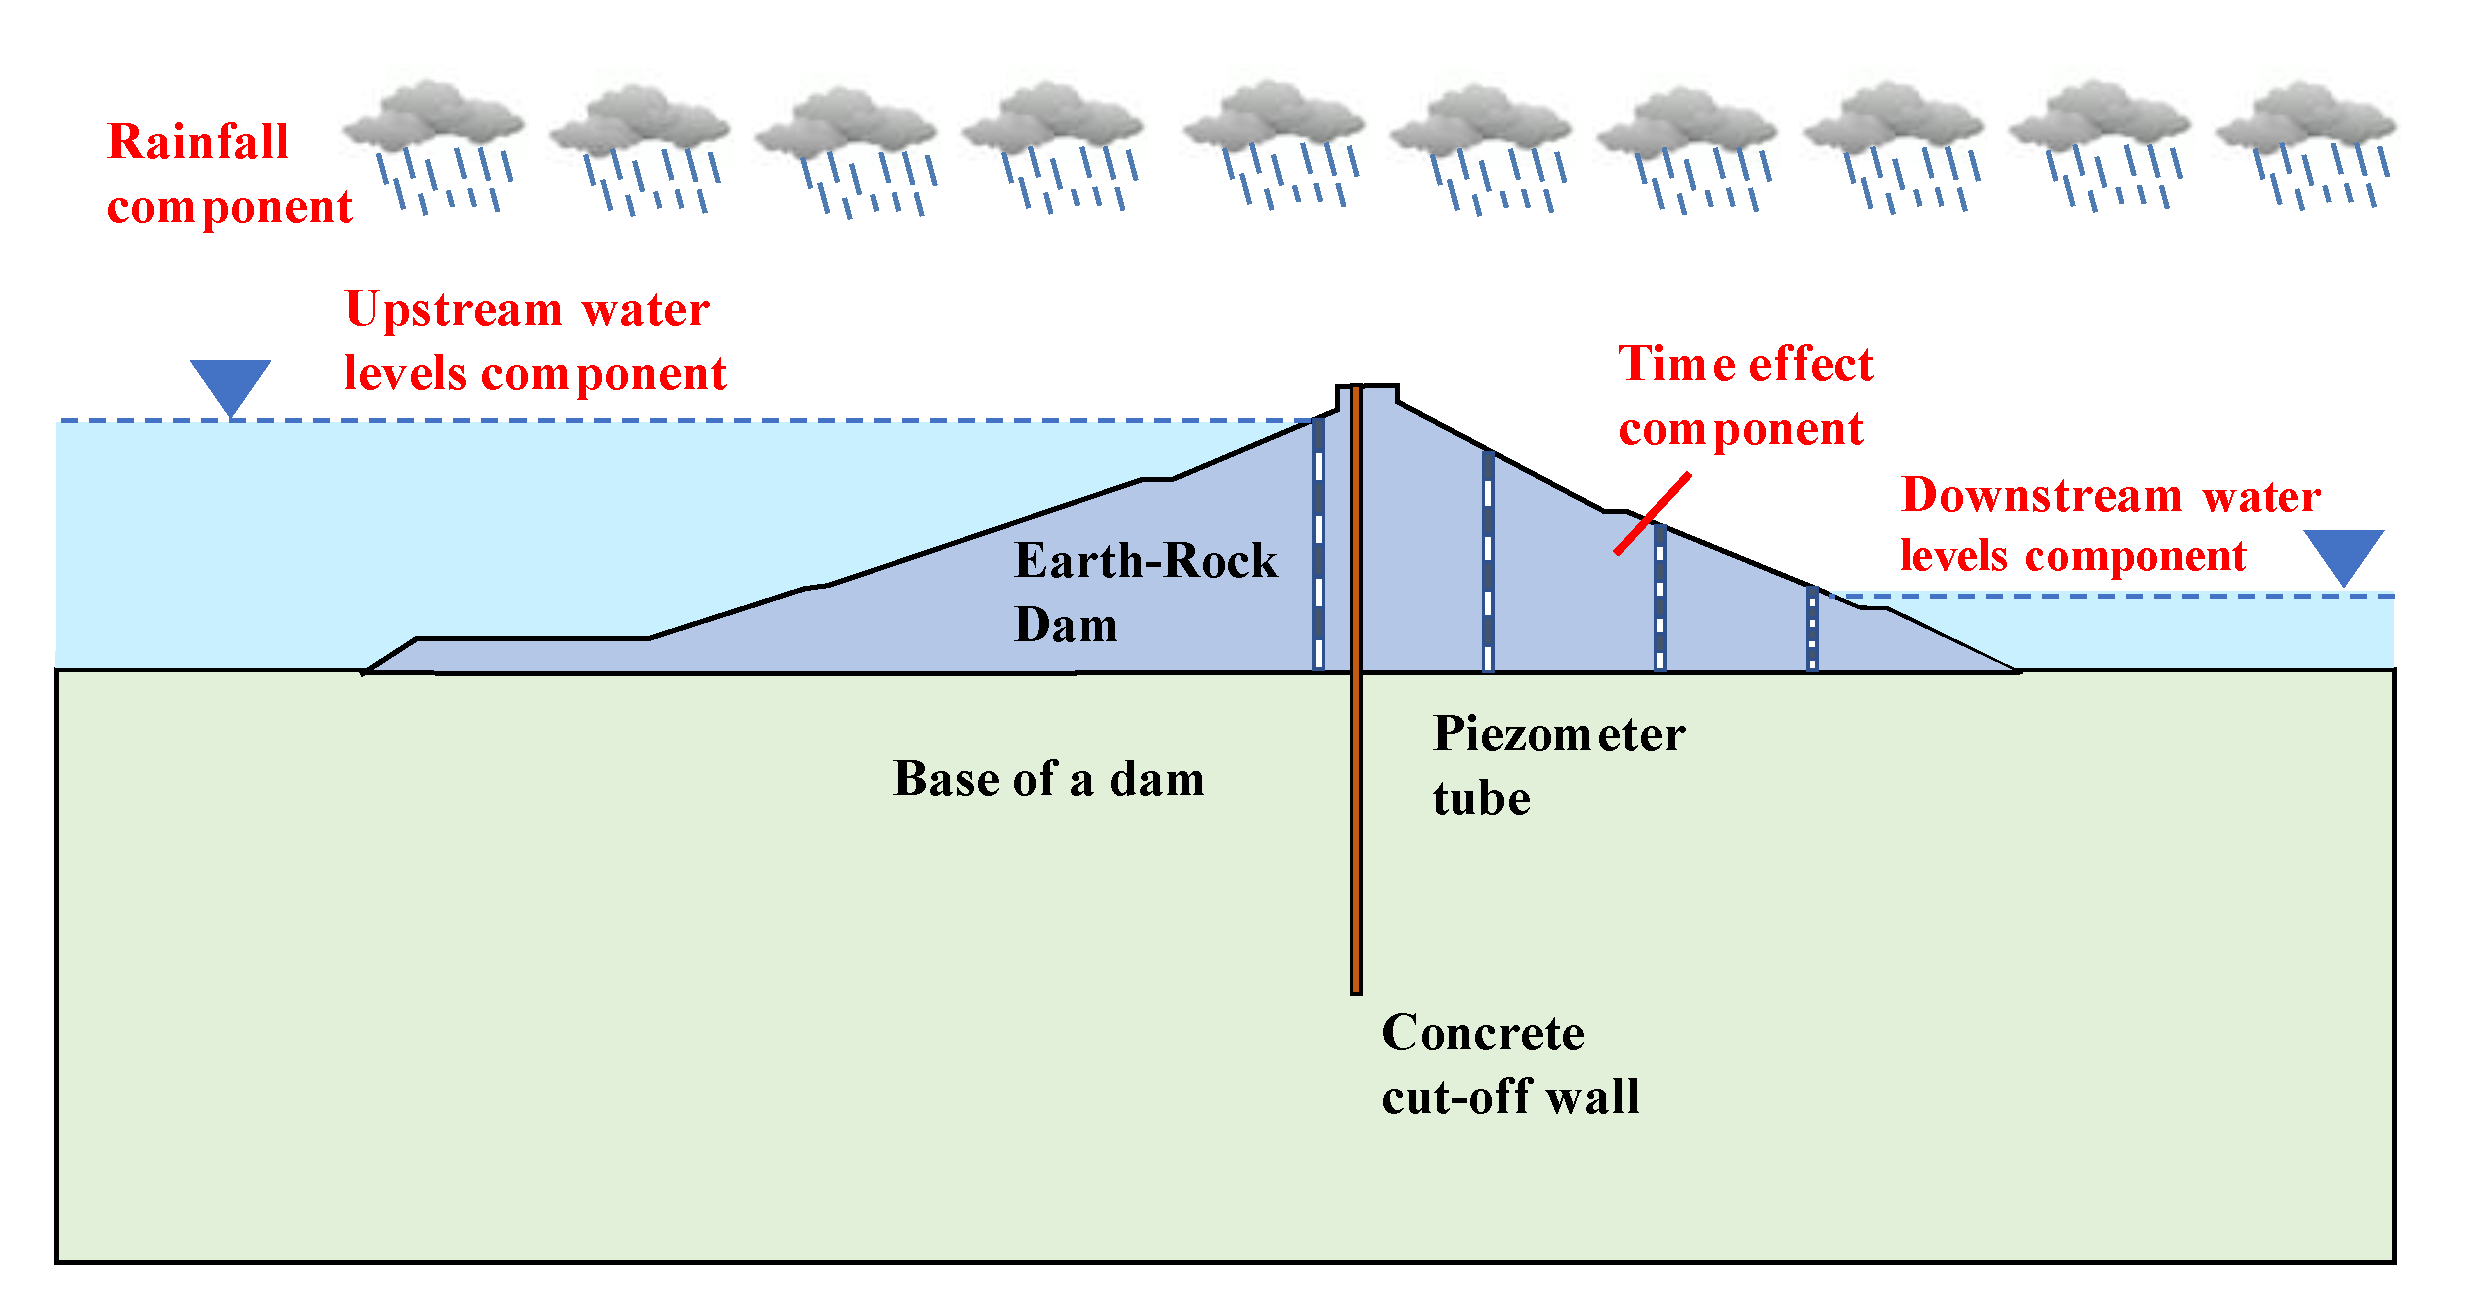
Figure 7.
Schematic Diagram of Seepage Monitoring Point Arrangement for Earth-Rock Dam.
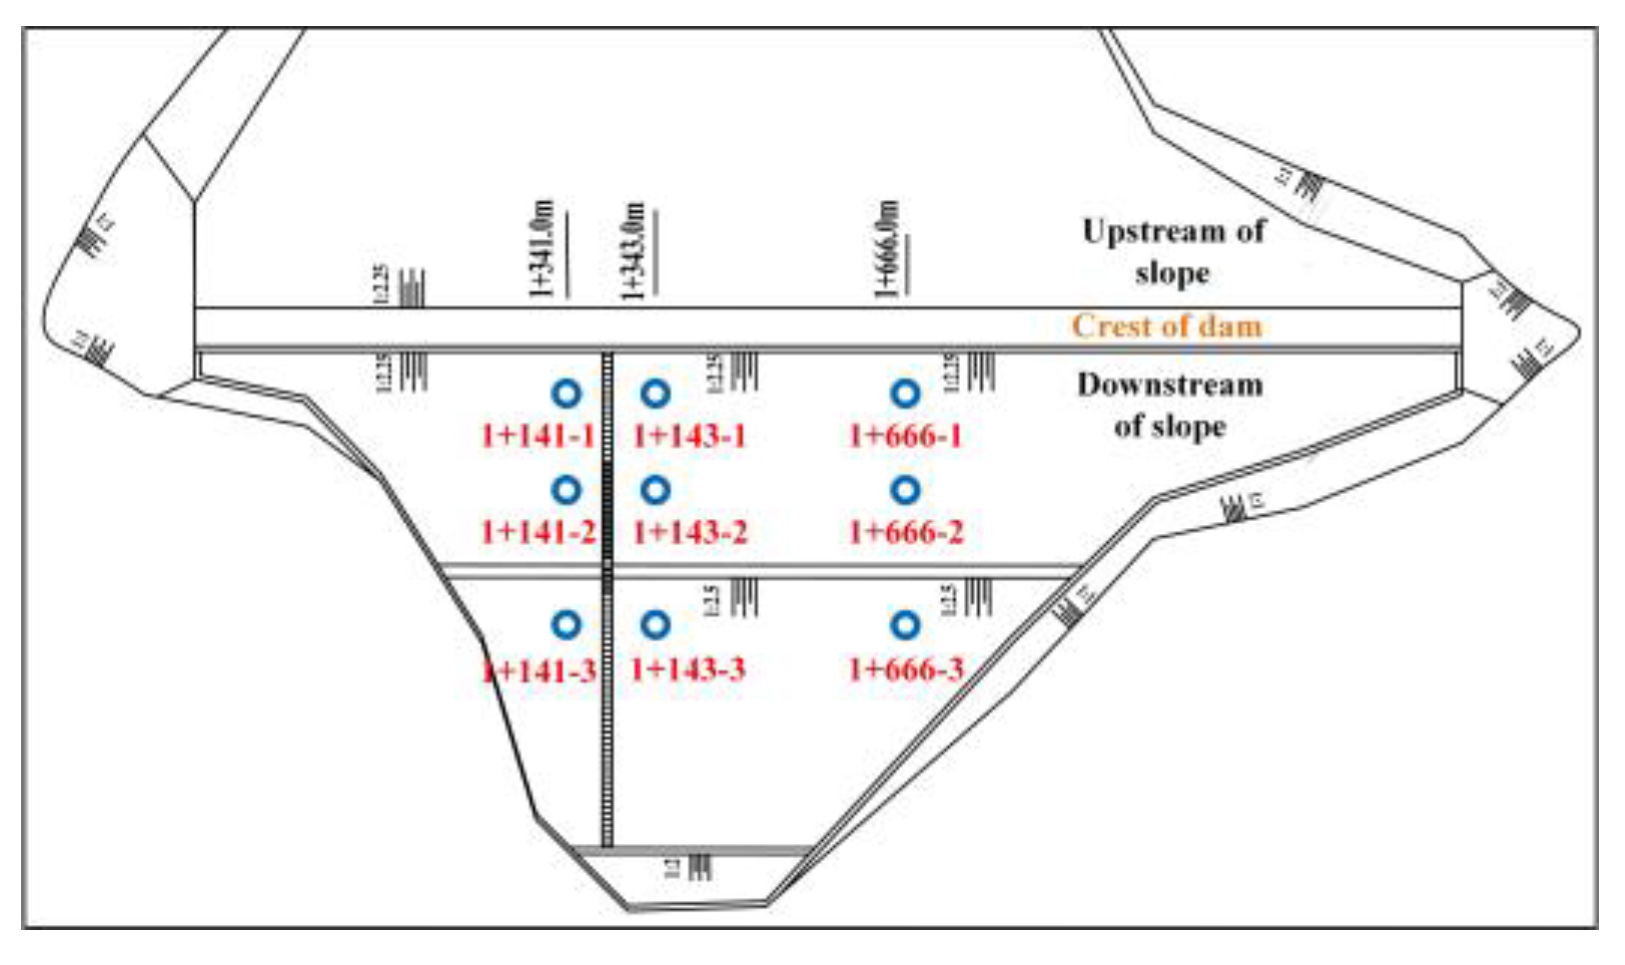
Figure 8.
Schematic Diagram of Earth-Rock Dam Cross-Section.
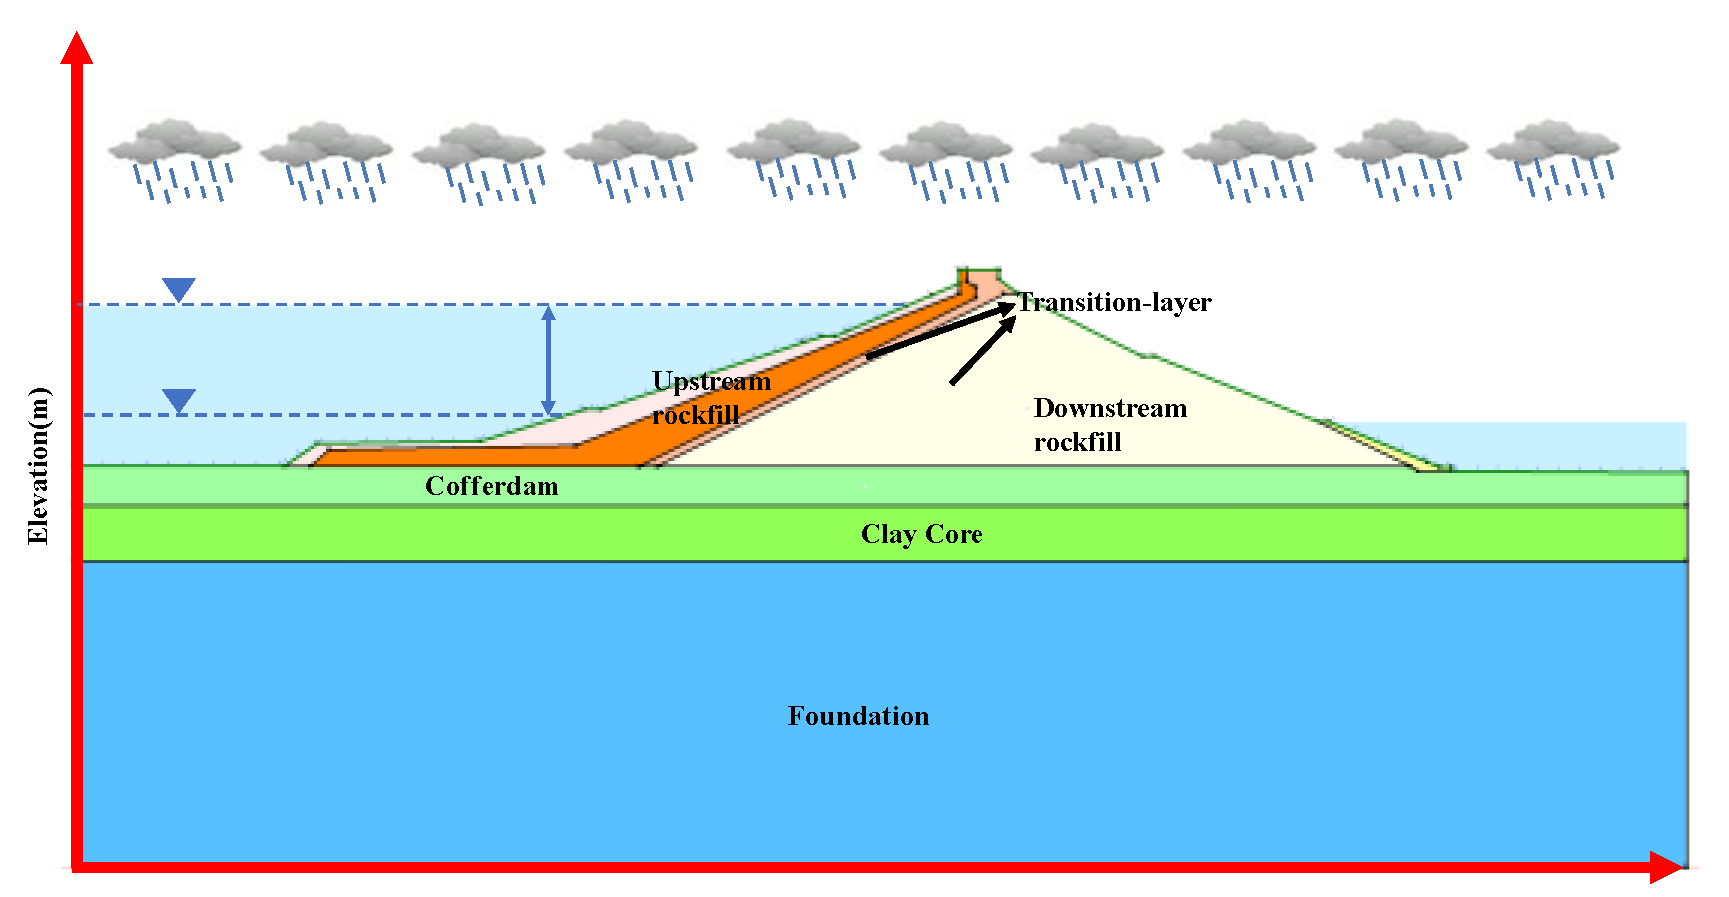
Figure 9.
Environmental Conditions of the Earth-Rock Dam and Piezometric Water Levels at Monitoring Points.
Figure 9.
Environmental Conditions of the Earth-Rock Dam and Piezometric Water Levels at Monitoring Points.
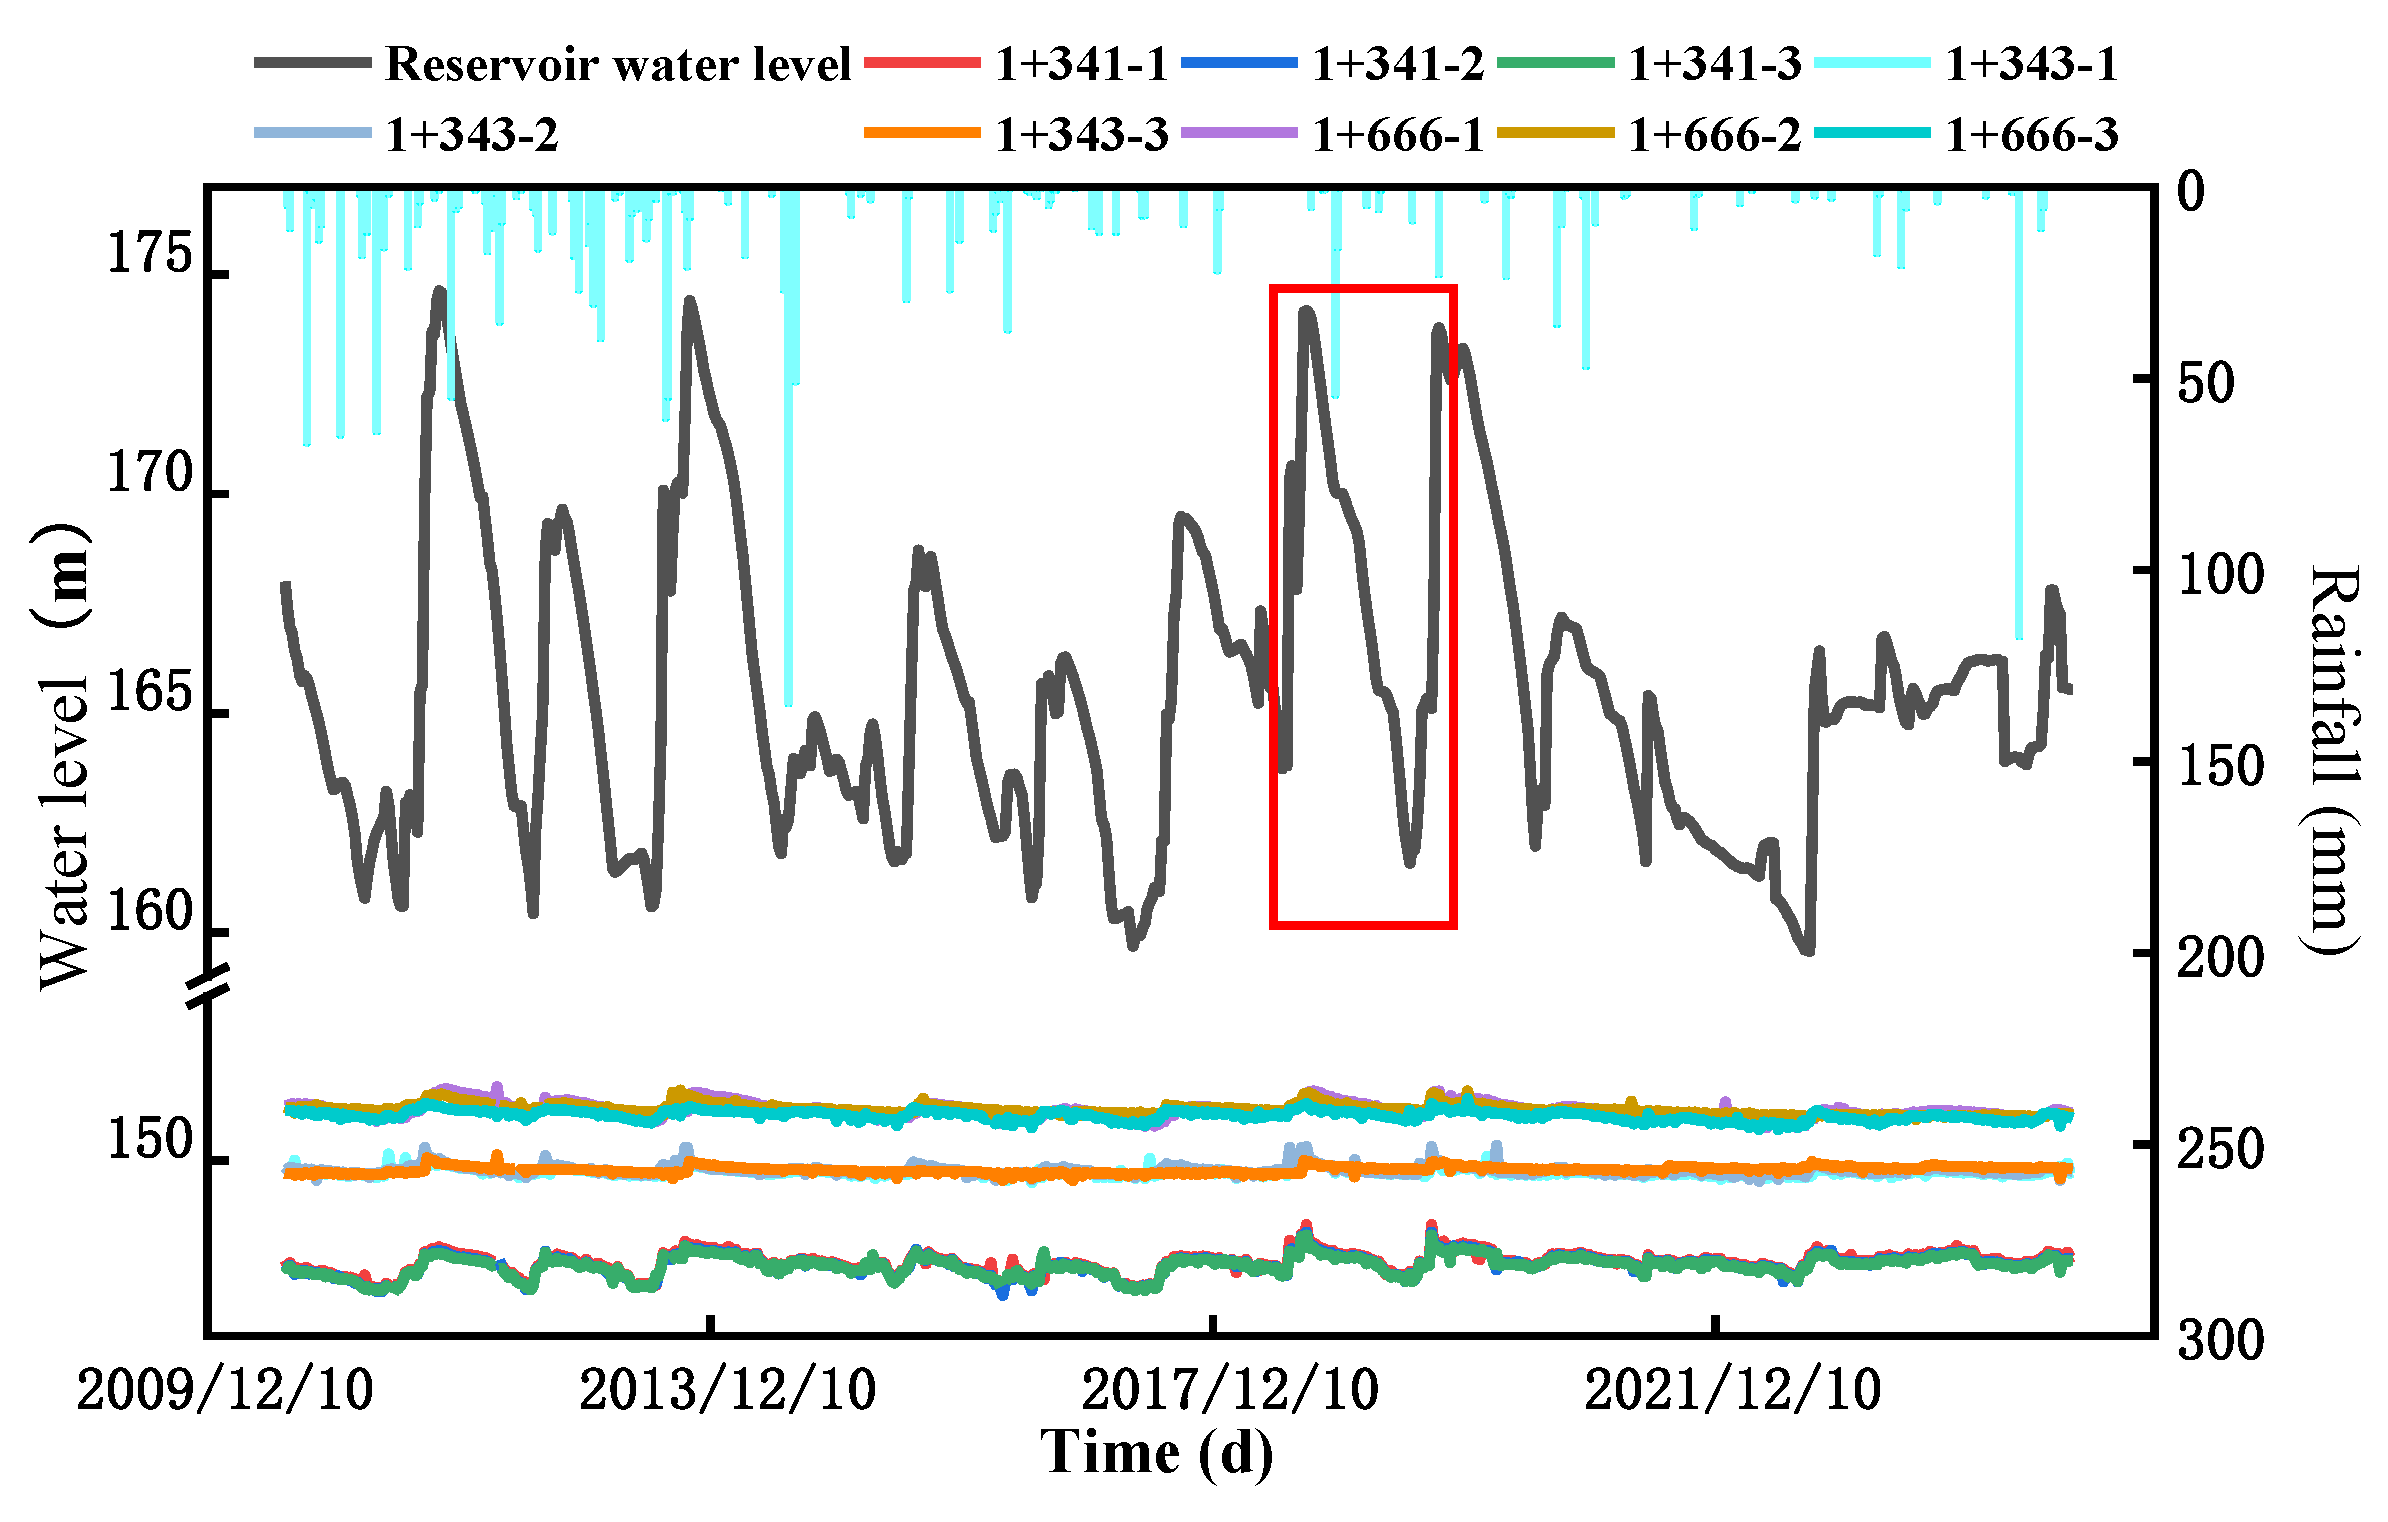
Figure 13.
Dynamic Warning Diagram for Measurement Points 1+141-1, 1+143-1, and 1+666-1 on the Earth-Rock Dam.
Figure 13.
Dynamic Warning Diagram for Measurement Points 1+141-1, 1+143-1, and 1+666-1 on the Earth-Rock Dam.
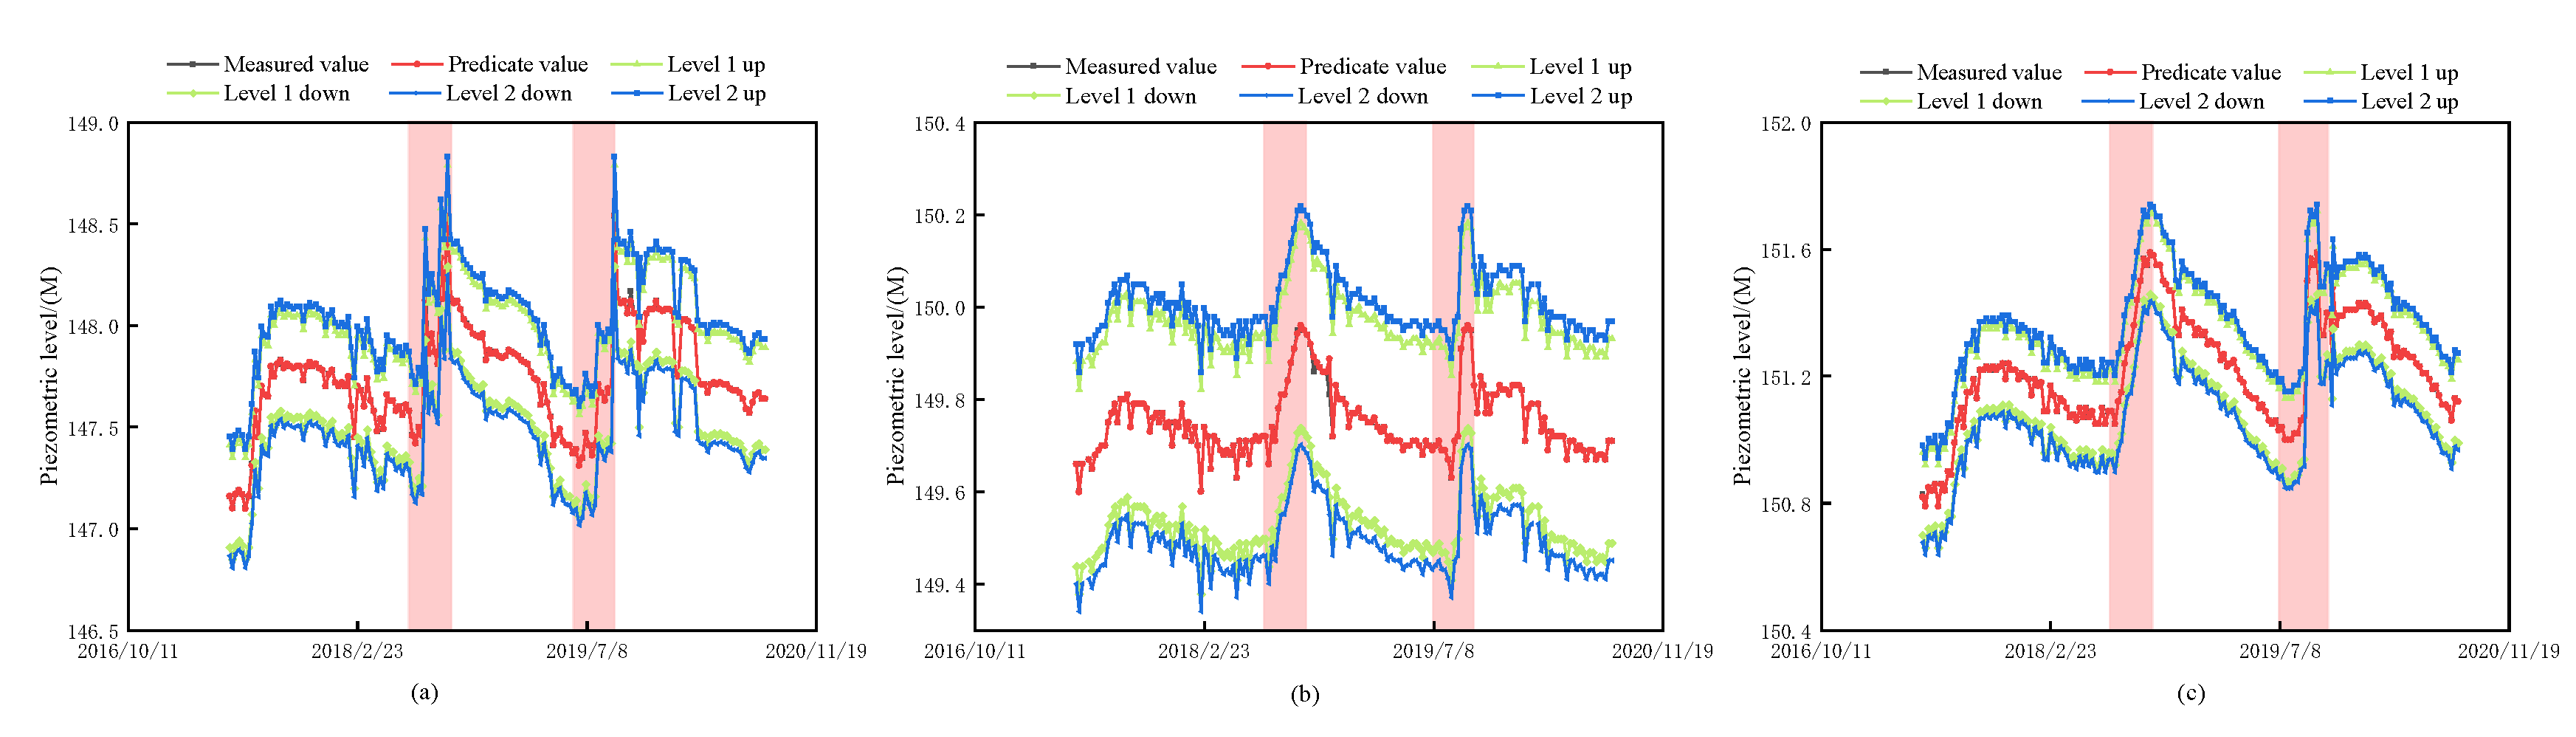
Figure 14.
Fitted Distribution Curves of Seepage Risk Rates for Single Measurement Points.
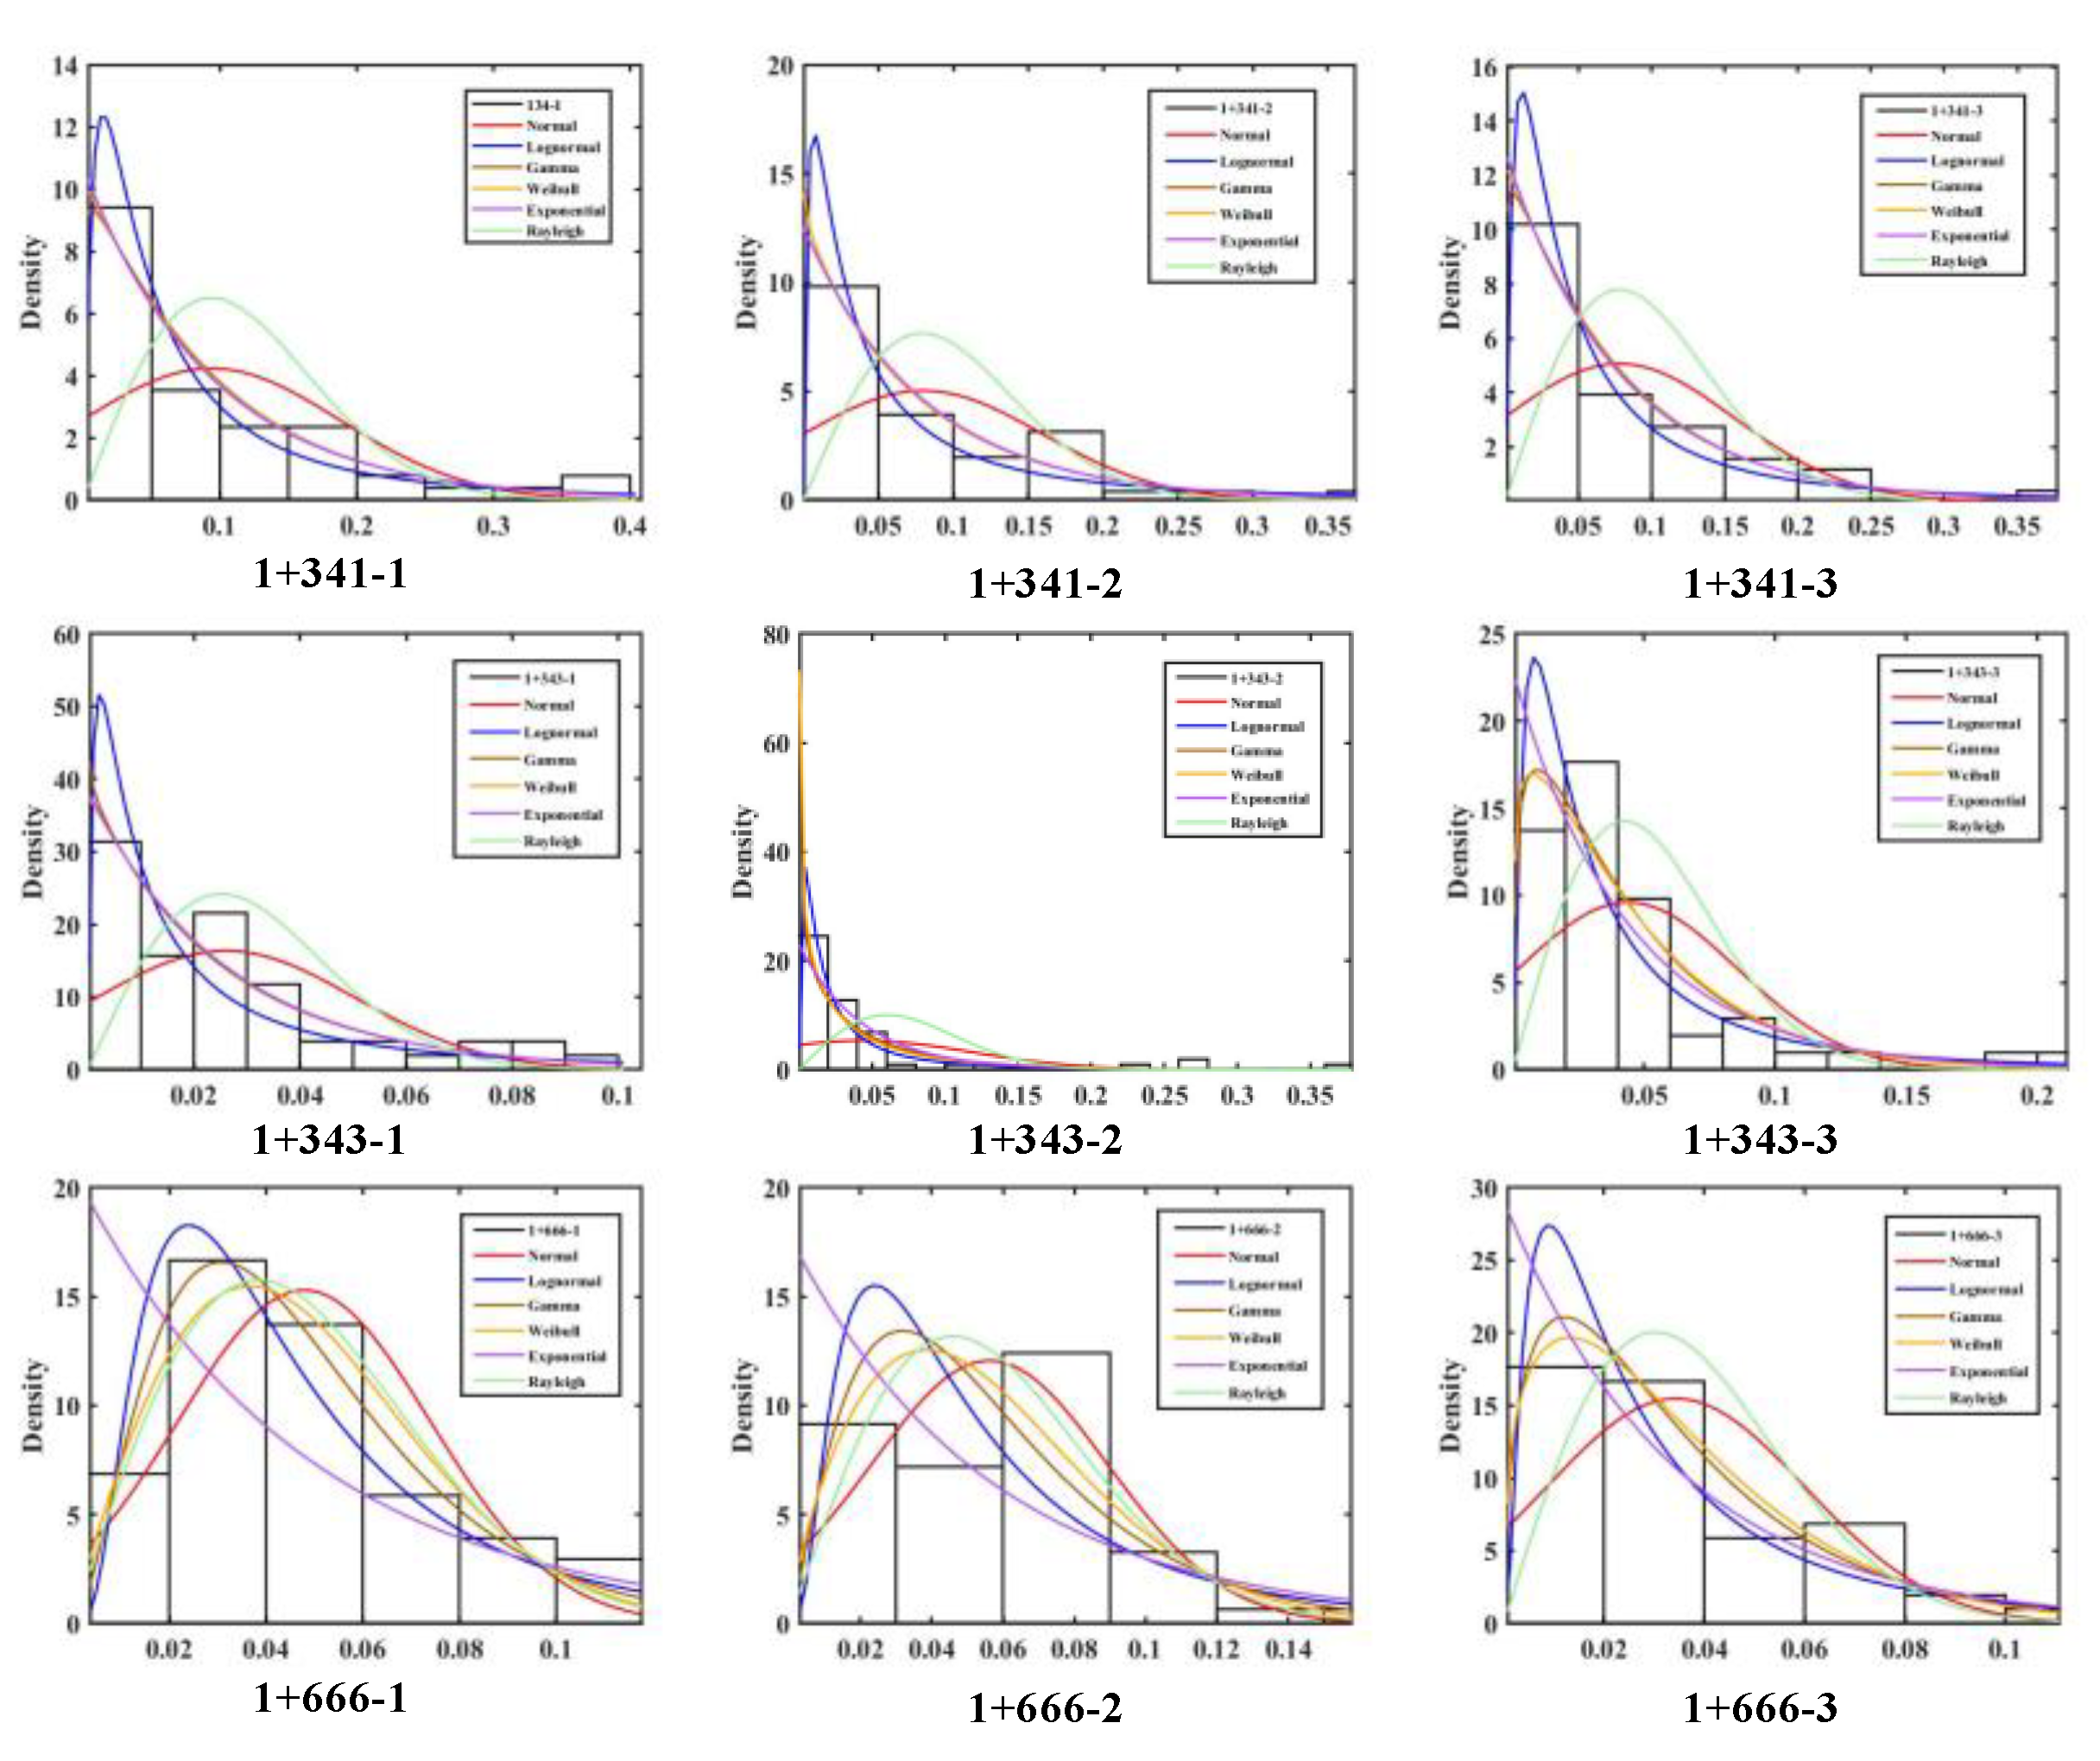
Figure 15.
Real-Time Risk Rate for Measurement Point 1+341-1 Based on Observational Data.
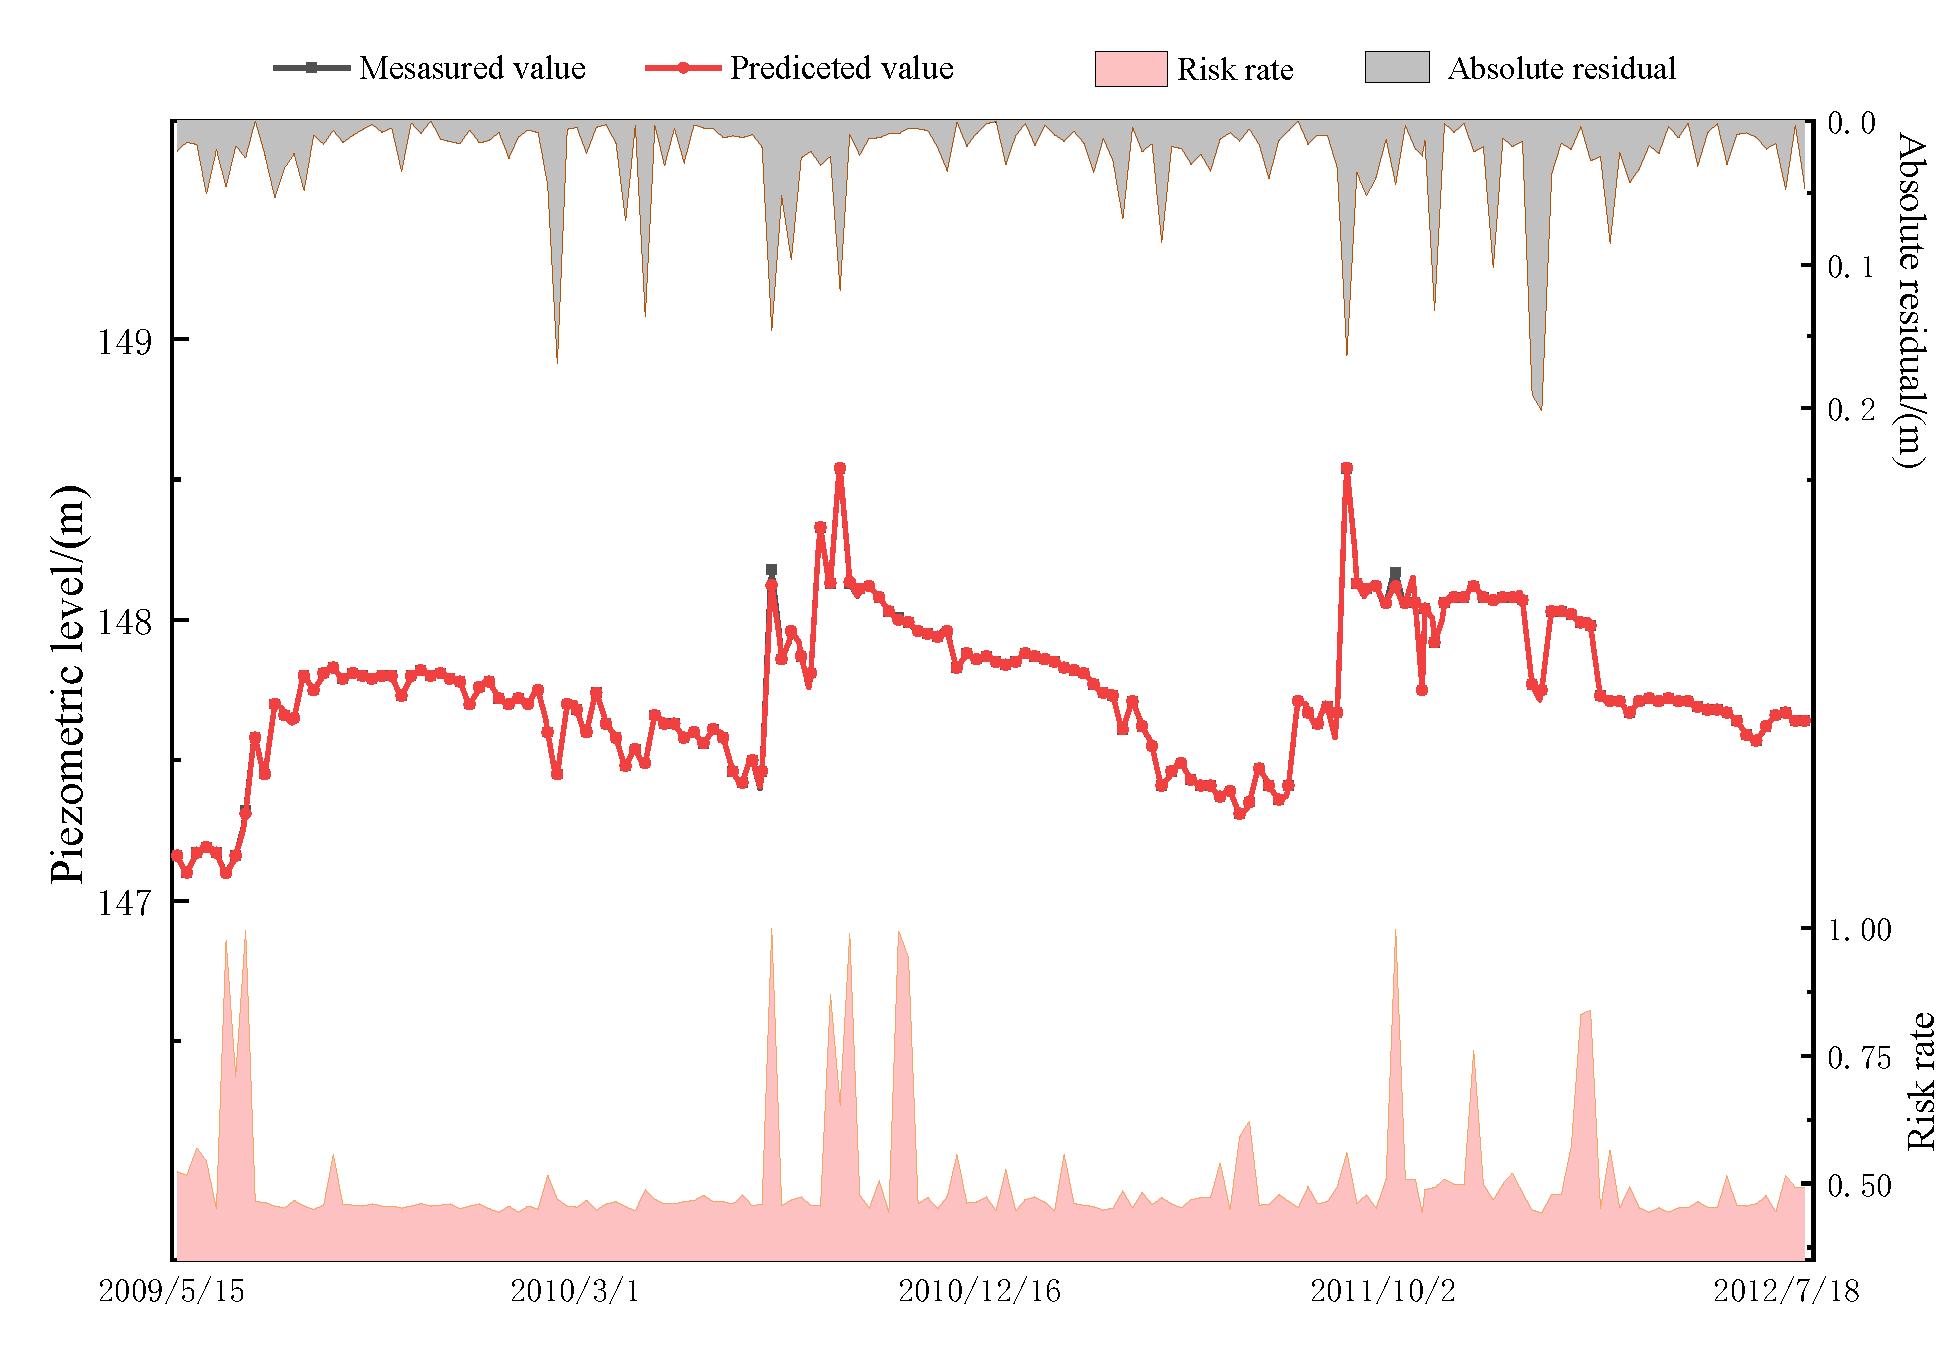
Figure 16.
Real-Time Risk Rates for Sections 1+141, 1+143, and 1+666.
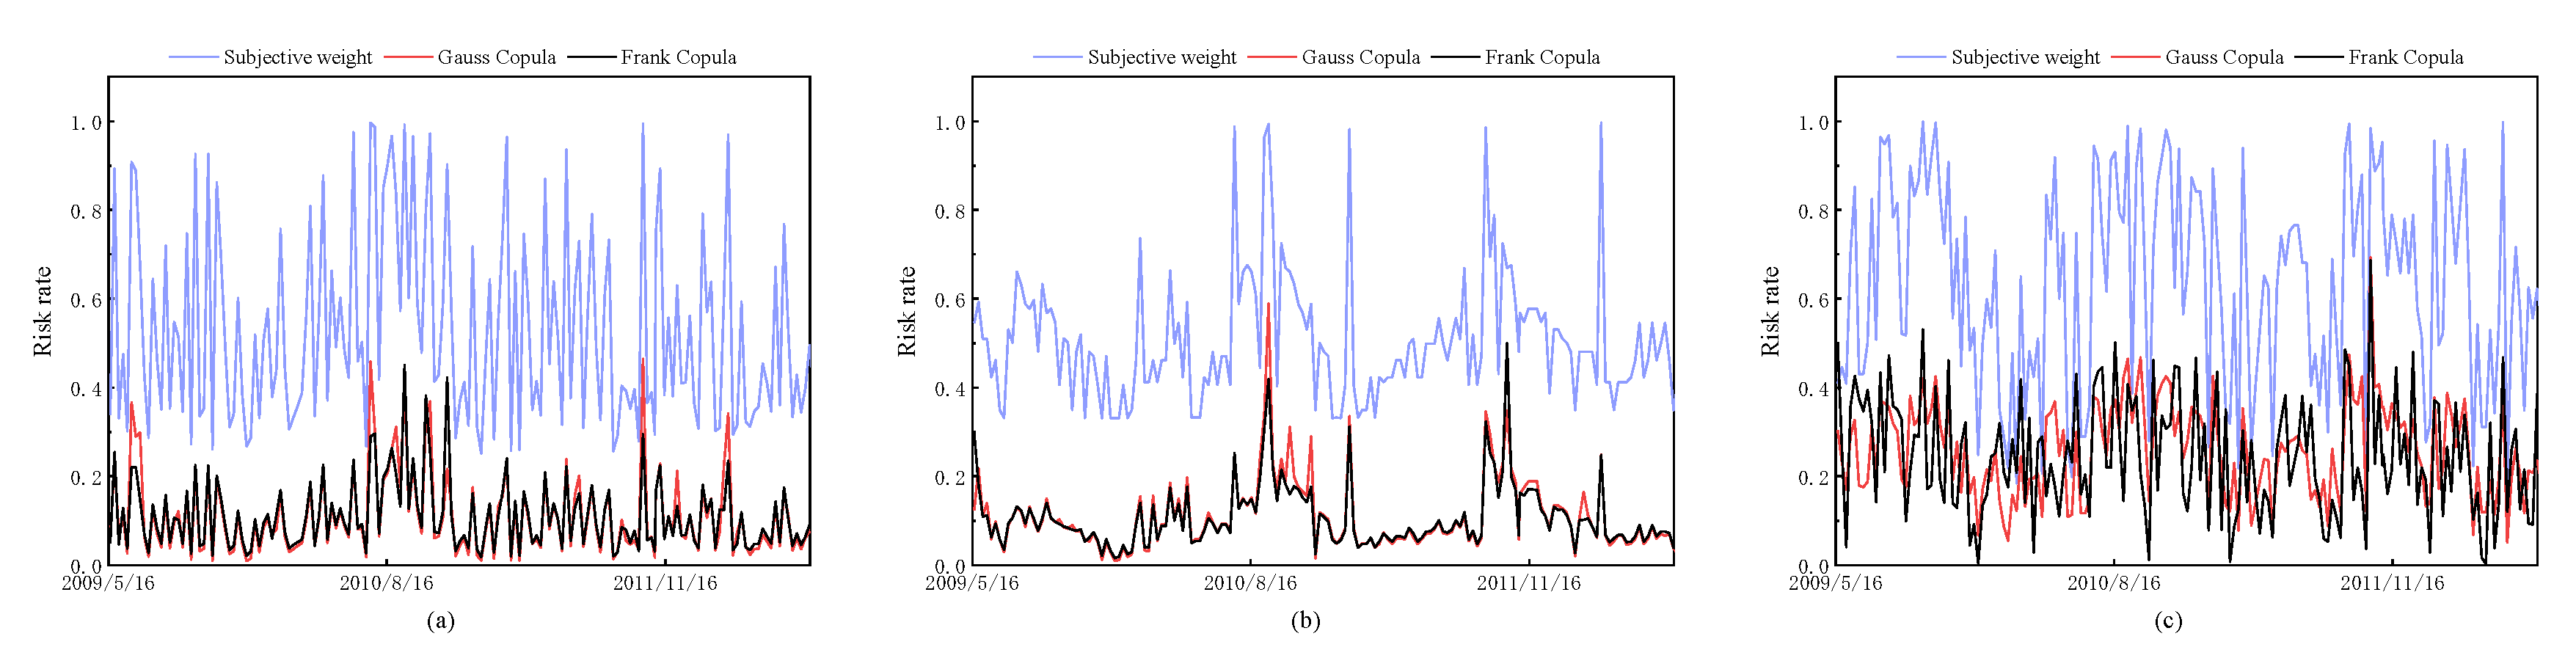
Figure 17.
Operational Risk Rate of the Earth-Rock Dam Under Sudden Changes in Reservoir Water Level.
Figure 17.
Operational Risk Rate of the Earth-Rock Dam Under Sudden Changes in Reservoir Water Level.
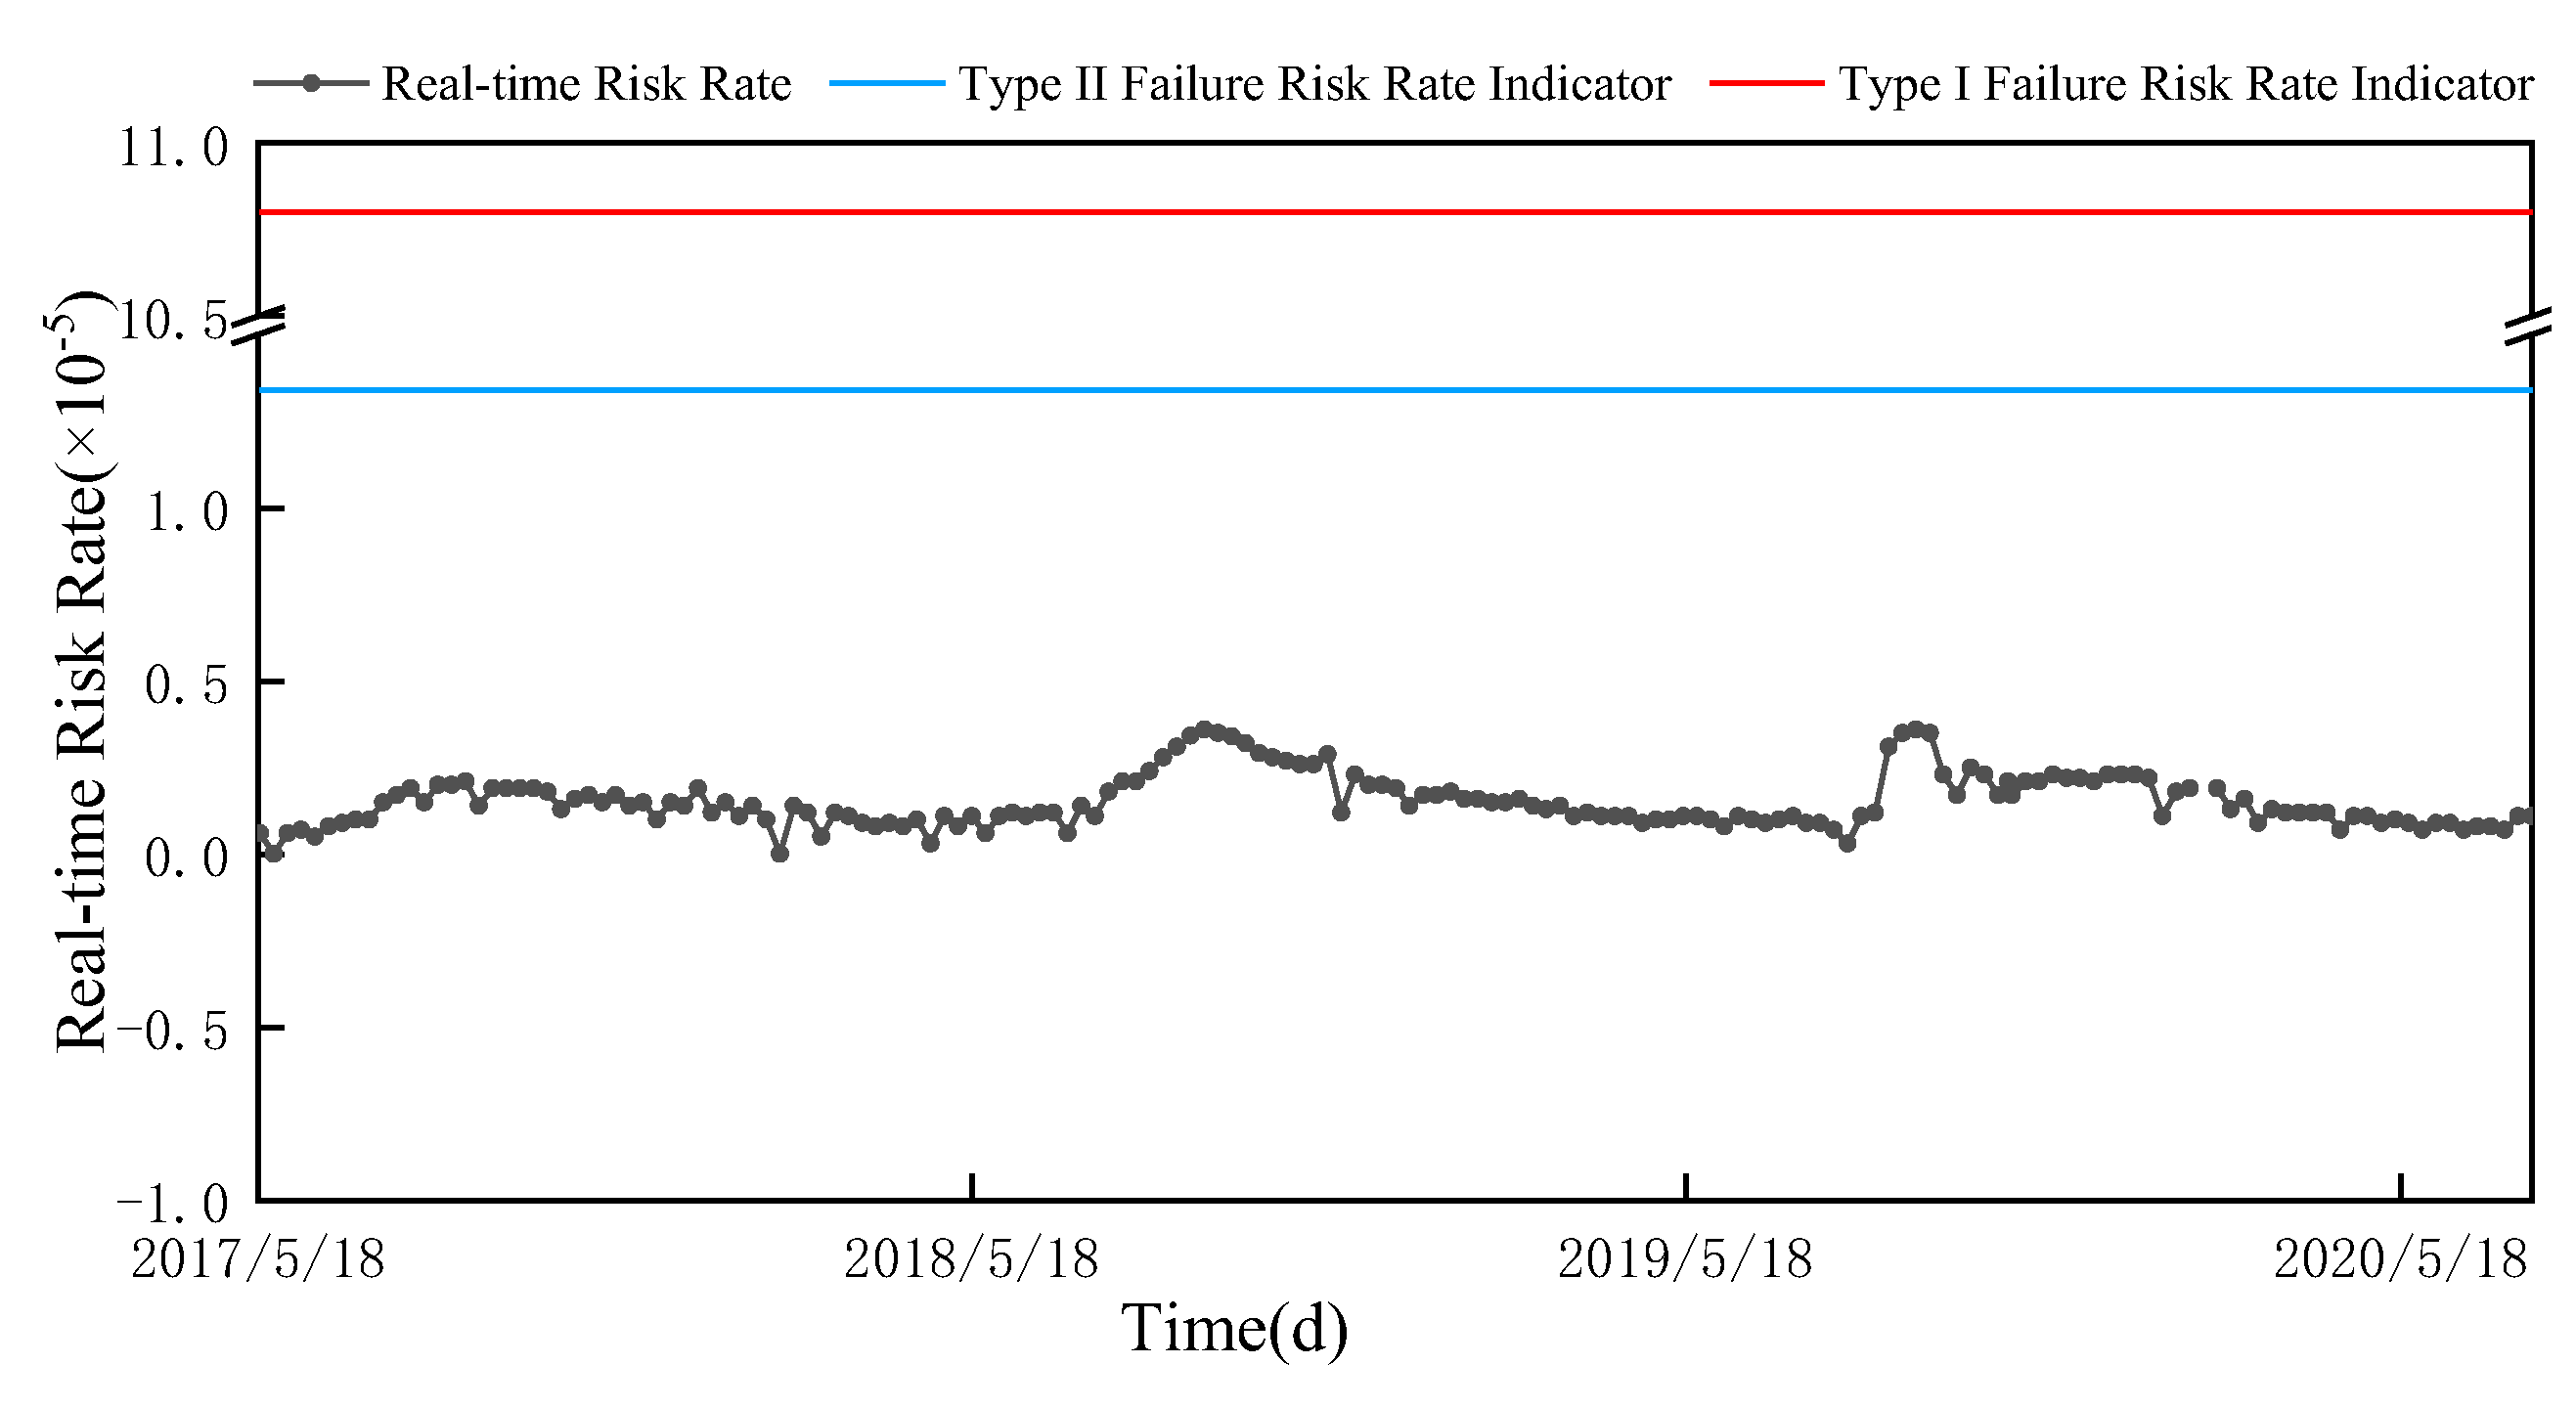

Table 1.
Selected marginal distribution probability density functions and parameters.
| Distribution Type | Probability Density Function | |
|---|---|---|
| Normal | ||
| Lognormal | ||
| Gamma | ||
| Weibull | ||
| Exponential | ||
| Rayleigh |
Table 2.
Target reliability and failure probability for different levels of hydraulic and hydroelectric engineering.
Table 2.
Target reliability and failure probability for different levels of hydraulic and hydroelectric engineering.
| Structural Safety Level | Level I | Level II | Level III | |||
|---|---|---|---|---|---|---|
| Indicator Measurement | Reliability Index | Allowable Risk Rate | Reliability Index | Allowable Risk Rate | Reliability Index | Allowable Risk Rate |
| Type I Failure | 3.7 | 1.08×10⁻⁴ | 3.2 | 6.87×10⁻⁴ | 2.7 | 3.47×10⁻³ |
| Type II Failure | 4.2 | 1.34×10⁻⁵ | 3.7 | 1.08×10⁻⁴ | 3.2 | 6.87×10⁻⁴ |
Table 3.
Coefficient of multiple correlation and standard deviation of the statistical model for the earth-rock dam's piezometric tubes.
Table 3.
Coefficient of multiple correlation and standard deviation of the statistical model for the earth-rock dam's piezometric tubes.
| Section | Monitoring Point | Multiple Correlation Coefficient | Standard Deviation |
|---|---|---|---|
| 1+341 | 1+341-1 | 0.956 | 0.181 |
| 1+341-2 | 0.962 | 0.177 | |
| 1+341-3 | 0.968 | 0.170 | |
| 1+343 | 1+343-1 | 0.976 | 0.068 |
| 1+343-2 | 0.982 | 0.103 | |
| 1+343-3 | 0.989 | 0.054 | |
| 1+666 | 1+666-1 | 0.978 | 0.157 |
| 1+666-2 | 0.983 | 0.106 | |
| 1+666-3 | 0.987 | 0.084 |
Table 4.
Parameters to Be Estimated for Marginal Distribution Functions and Results of K-S Test Values.
Table 4.
Parameters to Be Estimated for Marginal Distribution Functions and Results of K-S Test Values.
| Monitoring Point | Distribution Type | Monitoring Point | ||
|---|---|---|---|---|
| 1+341-1 | Normal | 0.093 5 | 0.171 5 | |
| Lognormal | -2.913 8 | 1.154 5 | 0.074 2 | |
| Gamma | 1.0541 | 0.088 7 | 0.087 9 | |
| Weibull | 0.094 1 | 1.013 8 | 0.082 5 | |
| Exponential | 0.093 5 | 0.0777 | ||
| Rayleigh | 0.094 2 | 0.3473 | ||
Table 5.
Estimated parameters and test indicators of each Copula function.
| Distribution Type | of Copula Function | K-S Test Value | ERMSE | ||
|---|---|---|---|---|---|
| Gaussian | 1.000 0 | -0.019 2 | 0.086 4 | 0.087 5 | 1.572 1 |
| t | 1.000 0 | -0.030 2 | 0.098 9 | 0.099 4 | 1.646 4 |
| Frank | 0.1281 | 0.012 4 | 0.031 4 | 0.441 2 | |
| Gumbel | 1.005 7 | 0.135 4 | 0.117 8 | 1.975 8 | |
| Clayton | 0.001 4 | 0.208 1 | 0.193 3 | 2.135 4 | |
Disclaimer/Publisher’s Note: The statements, opinions and data contained in all publications are solely those of the individual author(s) and contributor(s) and not of MDPI and/or the editor(s). MDPI and/or the editor(s) disclaim responsibility for any injury to people or property resulting from any ideas, methods, instructions or products referred to in the content. |
© 2025 by the authors. Licensee MDPI, Basel, Switzerland. This article is an open access article distributed under the terms and conditions of the Creative Commons Attribution (CC BY) license (http://creativecommons.org/licenses/by/4.0/).
Copyright: This open access article is published under a Creative Commons CC BY 4.0 license, which permit the free download, distribution, and reuse, provided that the author and preprint are cited in any reuse.


