
Submitted:
09 July 2025
Posted:
10 July 2025
You are already at the latest version
Abstract
The prevalence of hyperuricemia, a metabolic disturbance associated with elevated serum uric acid (UA), is increasing worldwide. High UA is closely related to increased risk for chronic renal disease, diabetes, abnormal lipid metabolism and abnormal gut microbiota. However, the effects of high UA on patients with diabetes and dyslipidemia and the mechanisms underlying these effects remain unexplored. This study aimed to develop a novel diabetic model of hyperuricemia and dyslipidemia in hamsters to evaluate the effects of high UA on glucolipid metabolism, renal injury and the gut microbiota. Our results indicated that a low-dose streptozotocin and diet-induced diabetic hamster model with hyperuricemia and dyslipidemia was successively established by the combination of intragastric potassium oxonate (PO) and adenine, the intake of fructose water and high-fat/cholesterol diet. PO treatment and a high-fat/cholesterol diet had synergistic effects on increasing UA, urea nitrogen, and creatinine levels, hepatic XOD activity, PAI-1 and TGF-β expressions, and the relative abundance of Lleibacterium, causing the moderate tubular degeneration, tubular atrophy, inflammatory cell infiltration, urate deposition, protein casts, and accelerated renal injury in diabetic hamsters. High UA was closely related to decreased antioxidant capacity; decreased renal VEGF expression; increased acetic acid content; decreased butyric, propanoic, and isobutyric acid levels; decreased Firmicutes to Bacteroidetes (F/B) ratios; and altered epithelial integrity and structure of the gut microbiota in diabetic hamsters. However, elevated UA levels alone had negligible effects on serum glucose, insulin, weight loss, organ indices, intestinal flora richness and bacterial community diversity in diabetic hamsters. High UA levels in diabetic hamsters with hyperuricemia and dyslipidemia were positively associated with Bacteroides, unclassified _f_Ruminococcaceae, Candidatus_Saccharimonas, norank_f_Muribaculaceae, Prevotellaceae_NK3B31_group, and Prevotelaceae_UCG-001 levels and negatively associated with Helicobacterium. Therefore, each intestinal microbe associated signaling pathway affecting UA metabolism and the health of the animal host still needs to be identified in future studies to identify new drug targets for the treatment of hyperuricemia and dyslipidemia in patients with diabetes.
Keywords:
hamsters
; uric acid
; glucolipid metabolism
; gut microbiota
; dyslipidemia
1. Introduction
As the end-product of purine catabolism, uric acid (UA), which is most excreted by the kidney, is degraded by urate oxidase and hepatic enzymes to allantoin in most mammals [1]. Due to the evolutionary disruption of the gene encoding urate oxidase in humans, overproduction or underexcretion of UA leads to hyperuricemia [2]. The prevalence of hyperuricemia is greater than 20% in USA and 13.3% in China [3,4]. Many epidemiologic studies strongly suggest that high serum UA is closely related to an increased risk of chronic kidney disease, diabetes, and abnormal lipid metabolism [5-7]. Moreover, accumulating scientific evidence shows a close association of the onset and progression of hyperuricemia and alterations in the prevalence, distribution, and structural transformation of the intestinal microbiota [8]. Many clinical investigations have indicated that diabetes is often accompanied by dyslipidemia and hyperuricemia [9]. However, the effects of high UA on patients with diabetes and dyslipidemia and the underlying mechanisms have not been fully investigated.
Some researchers have shown that elevated UA levels are related to diabetes. Findings from Bhole and De Cosmo et al. indicated that high UA levels and hyperuricemia were significantly related to an increased risk of developing type 2 diabetes and insulin resistance, respectively [10,11]. Compared with no hyperuricemia, five-year prospective cohort study from China revealed that incident hyperuricemia and remittent hyperuricemia were associated with a 48% and 35% greater risks, respectively, for the development of diabetes [12]. Jie et al. demonstrated that UA promoted pancreatic β-cell death, but UA alone was insufficient to induce diabetes [13]. Moreover, many epidemiological investigations have indicated that serum UA levels are positively correlated with lipid profiles in adult populations, and that hyperuricemia may be a risk factor for lipid metabolic disorders [14,15]. There is currently limited knowledge regarding the mechanism underlying diabetes with hyperuricemia and dyslipidemia at present. An important barrier is the lack of suitable animal diabetic models that can faithfully replicate the pathologic features of patients with ddiabetes, hyperuricemia, and hyperlipidemia.
Recently, UA has gained prominence as a key factor in multifactorial renal diseases, including acute renal injury and chronic renal disease [16]. Hyperuricemia has deleterious effects, including gout, nephrolithiasis, and renal damage [17]. Increasing evidences have indicated that lipid abnormalities contribute to glomerulosclerosis and progressive renal disease [18]. Diabetes also contributes to glomerular damage, renal arteriosclerosis, and atherosclerosis in the progression of kidney damage. [19]. Therefore, glycolipid metabolic disorders can result in cell apoptosis, lipid accumulation, mitochondrial damage, oxidative stress, and renal tubular epithelial cell injury. To our knowledge, there is limited information regarding the effects of high UA on kidney injury in patients with diabetes and dyslipidemia.
The gut microbiota, a complex microbial community colonizing the intestines, regulates many metabolic processes in the host including energy homeostasis, glucose metabolism and lipid metabolism [20]. Moreover, the gut microbiota is crucial for regulating UA metabolism, and dysregulation of the gut microbiota can disrupt UA homeostasis, leading to hyperuricemia [8]. The intricate relationship between UA metabolism and the gut microbiota involves a bidirectional interaction that can influence both the host’s gut environment and UA levels. Liu et al. identified 46 species of UA-degrading bacteria spanning four phyla: Actinobacteria, Proteobacteria, Clostridia and Firmicutes, within the repository of human intestinal bacteria [21]. The composition of the gut microbiota is related to lipid metabolism, which is regulated mainly by nutrients, including fatty acids and sugars [22]. Intestinal flora imbalance also affects bile acid metabolism, intestinal permeability, the inflammatory response, and insulin resistance (IR), which are strongly correlated with diabetes [23]. Therefore, the role of high UA levels on the intestinal flora in patients with diabetes and the confounding factors of abnormal glucose and lipid metabolism must be determined.
Appropriate animal models are the foundation for further investigations of disease pathogenesis and new drug development. Several animal models, including rats and mice, have been established to explore the regulatory mechanisms underlying human metabolic diseases, such as hyperuricemia, dyslipidemia and diabetes [24,25]. Hyperuricemia can be induced using potassium oxonate (PO) which inhibits uricase activity in rodents [25]. The findings of Kobayashi et al. revealed that db/db mice presented significant obesity and fasting hyperglycemia when fed a high-fat diet (21% fat and 0.15% cholesterol) within 42 days of age, which is a good model for diabetic dyslipidemia [26]. As an antibiotic that causes pancreatic islet β-cell destruction, low-dose streptozotocin (STZ) is widely used to induce diabetes in mice and rats [27]. Compared with mice and rats, hamsters are better at reproducing hyperlipidemia, which is very similar to the hepatic lipid metabolism and cholesteryl ester transfer protein activities of humans [28]. The effects of dietary cholesterol on blood lipid profiles are similar between hamsters and humans.
Therefore, this study aimed to establish a novel diet-induced diabetic model with hyperuricemia and dyslipidemia in Golden Syrian hamsters to investigate the biochemical and histological changes, and evaluate the effects of high UA on glucolipid metabolism, renal injury and the gut microbiota in hamsters. Furthermore, the synergistic effects of hyperuricemia, hyperlipidemia, and diabetes were explored in hamsters. These findings may provide novel insights into the interaction effects of multiple risk factors on metabolic syndrome in humans.
2. Materials and Methods
2.1. Animal Experimental Design
Forty-two healthy male Golden Syrian hamsters (10 weeks old, 163 ± 7.43 g) were obtained from Vital River Laboratory Animal Technology Company (Beijing, China). All animals were raised in a standard environment (temperature: 20-24℃, relative humidity: 45-55% and light‒dark cycles: 12 h) with freely accessible food and water. The animal experiments were approved by the Institutional Animal Care and Use Committee (IACUC)-Zhejiang Academy of Agricultural Sciences (2022ZAASLA58). Streptozotocin (STZ, >98% purity, CAS: 18883-66-4) was purchased from Sigma-Aldrich Chemical Company and dissolved in 0.05 M citrate buffer (pH 4.5). Potassium oxonate (PO, >98% purity, CAS: 2207-75-2) and adenine (>99% purity, CAS: 73-24-5) were purchased from Shanghai Macklin Biochemical Technology Co., Ltd. and resuspended in a 0.5% sodium carboxymethylcellulose (CMC-Na) solution. Commercial standard rodent chow, and a high-fat/cholesterol (15% fat, 0.5% cholesterol) diet were provided by Keao Xieli (Tianjin) Feed Co., Ltd.
Diabetes was induced in thirty hamsters by the intraperitoneally injection of STZ (30 mg/kg) once daily for 3 consecutive days. After ten days, 24 hamsters with a fasting blood glucose (Glu) concentration (>12 mmol/L) were randomly divided into 4 groups (n = 6): the DC group, standard diet; DHF group, high-fat/cholesterol diet; DHU group, intragastric administration of PO (350 mg/kg/d) and adenine (150 mg/kg/d) with a standard diet and 5% fructose water; and DHFU group, intragastric administration of PO (350 mg/kg/d) and adenine (150 mg/kg/d) with a high-fat/cholesterol diet and 5% fructose water. Twelve normal hamsters were randomly divided into two groups (n = 6): the CHF group, high-fat/cholesterol diet; and C group, standard diet. Hamsters in the C, DC, DHF and CHF groups were intragastrically administered the same volume of CMC-Na water (0.5%). The experimental animal design is presented in Figure 1.
2.2. Measurements of Body Weight (BW), Organ Index, and Serum Biochemical Indicators
The hamsters were anesthetized using isoflurane before they were sacrificed and weighed. Tissues (kidney and liver) were sampled and weighed for organ index calculation (the ratio of the kidney and liver weights to the BW), which is an important indicator of visceral health. Blood samples from the venous retroorbital plexus of hamsters were collected, centrifuged for 15 min at 3000 × g and stored at -20℃. Serum UA, Glu, total cholesterol (TC), triglyceride (TG), creatinine (CRE), urea nitrogen (BUN), alkaline phosphatase (ALP), aspartate transaminase (AST) and alanine transaminase (ALT) levels and were detected using an automatic biochemistry analyzer (Leidu Life Technology, Shenzhen, China). Insulin was assayed with a rat insulin ELISA kit (BlueGene Biotech Co., Ltd., Shanghai, China).
2.3. Measurement of Liver Xanthine Oxidase (XOD) and Kidney Antioxidant Parameters
At the experimental endpoint, liver and kidney tissues were dissected quickly and parts of the two tissues were frozen in liquid nitrogen and stored at -80 ℃ for further XOD and antioxidant parameter analysis. XOD, total superoxide dismutase (T-SOD), glutathione peroxidase (GPX-PX) and malondialdehyde (MDA) were detected using commercial assay kits (Nanjing Jian Cheng Bioengineering Institute, China).
2.4. Renal Histological analysis
The right kidney was placed in 4% paraformaldehyde solution for 48 hours. After trimming and tissue processing, kidney tissue was embedded in paraffin, and cut into 5 μm thick sections for hematoxylin and eosin (H&E) and PAS staining. Finally, histopathological observations were performed using a microscope (Leica DM2500, Wetzlar, Germany).
2.5. Total RNA Extraction and Quantitative polymerase chain reaction (qPCR)
A portion of the kidney tissue was removed from the killed hamsters and quickly placed in liquid nitrogen for total RNA extraction using with RNA extraction reagents (Servicebio, Wuhan, China). cDNA was reverse transcribed from 2 μg of total RNA with a first strand cDNA synthesis kit (Servicebio, Wuhan, China). The transcript levels of the target genes (TNF-α, SREBP-1c, PAI-1, IL-6, TGF-β, and VEGF) were evaluated by qPCR with 2 × SYBR Green qPCR Master Mix (Servicebio, Wuhan, China). β-actin was used as a reference to normalize the mRNA levels of the chosen genes. The relative expression of the target genes was calculated using the 2-ΔΔCt method. All primer sequences are listed in Table 1.
2.6. Fecal SCFA measurement
SCFA levels were detected using methods from Li et al. with minor modifications [29]. Briefly, 100 mg of thawed fecal sample was added to 1.0 mL of water and 0.2 mL of crotonic acid–metaphosphoric acid mixture (64.6 mg of crotonic acid and 2.5 g of metaphosphoric acid dissolved in 10.0 mL of water) and then acidified for 24 hours at -40℃. The mixture was centrifuged at 4℃ for 3 min at 13000 × g, filtered through a 0.22 μm PVDF filter, and injected into a gas chromatograph (Shimadzu, Japan) for determination of the SCFAs under the following conditions: inlet and FID detector temperatures of 250℃ and a carrier gas flow rate of 20 mL/min with a 10:1 split ratio. In addition, the column temperature began at 80℃, gradually increased to 190℃ (10℃/min) with a hold for 0.5 minutes, and then increased to 240℃ (40℃/min) with a hold for 4 minutes. Crotonic acid was used as the internal standard.
2.7. Gut Microbiota Analysis
At the experimental endpoint, fresh fecal samples from all the hamsters were collected and immediately stored at -80℃ for 16S rRNA gene sequencing. The DNA of the fecal samples was extracted using a fecal genome DNA extraction kit (Tiangen Biotech Co., Ltd., Beijing, China). The V3-V4 variable region of the 16S rRNA gene was subsequently amplified using bacterial primers (341F 5'-CCTAYGGGRBGCASCAG-3' and 806R 5'-GGACTACNNGGGGTATCTAAT-3'). The purified PCR products were used for library construction and sequenced on the Illumina NovaSeq PE250 platform. The raw sequences were quality filtered with Fastp software (v 0.19.6) and merged using Flash software (v 1.2.11). The qualified sequences were subsequently denoised using the DADA2 plugin in QIIME2 (v 2020.2) to obtain amplicon sequence variants (ASVs).
2.8. Statistical Analysis
All results are presented as the means ± standard deviations (SDs). GraphPad Prism 8.0 (CA, USA) and SPSS 22.0 (IBM, USA) were used for graphical presentation and statistical analysis. A one-way ANOVA coupled with Tukey’s test was used to determine significant differences in multiple groups. The p value cutoff was set as 0.01 or 0.05.
3. Results
3.1. Induction of diabetes, hyperuricemia and dyslipidemia in hamsters
In response to intraperitoneal injection of low-dose STZ, the animals presented a significant increase in serum Glu and a decrease in insulin levels (Figure 2A,B). The diabetic hamsters were then intragastrically administered 350 mg/kg/d PO, 150 mg/kg/d adenine and 5% fructose water for 4 weeks, and the serum UA levels in the PO treatment groups (446.5±25.18μmol/L in the DHU group and 499.5±56.56μmol/L in the DHFU group) were significantly higher than those in the DC and DHF groups (240.6±20.86 and 319.3±44.51μmol/L, respectively), indicating that the diabetic hamsters in the PO treatment groups developed severe hyperuricemia (Figure 2C). Moreover, the serum UA level detected in the DHFU group was significantly greater than that detected in the DHU group (P < 0.05). In hamsters fed a high-fat/cholesterol diet (CHF, DHF and DHFU), the serum TG and TC levels significantly increased in comparison with those in the C and DC groups, indicating that hamsters in the DHF and DHFU groups developed severe dyslipidemia (Figure 2D,E). However, there were no marked differences in TG or TC levels between the DHF and DHFU groups. The blood samples from the DHFU group had a milky appearance with high serum UA, Glu, TG and TC levels (499.5±56.56μmol/L, 16.9±2.81 mmol/L, 120.0±27.14 and 72.9±16.62 mmol/L, respectively),indicating the successful establishment of a hamster model of diabetes, hyperuricemia, and dyslipidemia.
3.2. Effects of high UA on BW and Organ Index in diabetic hamsters
As shown in Figure 3A, the BWs of the DHU and DHFU groups (139.0±9.0 g and 134.7±14.9 g) were significantly lower than those of the C group (153.2±5.1 g) and CHF group (164.0±14.9 g) (P < 0.01). However, no significant differences in BW were found among the DHF, DHU and DHFU groups. Elevated UA alone (induced by PO) had a negligible effect on weight loss in diabetic hamsters. The BW of hamsters in the CHF group (164±14.9 g) was significantly greater than that in the DHF (144.7±5.5 g), DHU (139.0±9.0 g) and DHFU (134.7±14.9 g) groups (P < 0.01). Figure 3B shows that the kidney indices of all diabetic groups were greater than those of the C and CHF groups (P < 0.01). However, no marked differences in the kidney indices were detected among the diabetic groups. The liver index of the DHFU group (6.12%±0.52%) was significantly greater than those of the C, CHF, DC and DHU groups (P < 0.01). Elevated UA alone had a negligible effect on the organ indices of diabetic hamsters.
3.3. Effects of high UA on CRE, BUN, ALT, AST and ALP in diabetic hamsters
As important clinical indices of renal function, elevated CRE levels likely indicate impaired kidney function and elevated BUN levels are detected in the decompensation period of renal insufficiency [30]. As enzyme biomarkers, serum ALT, AST, and ALP levels are used to evaluate the structural integrity of and damage to the liver. An increase in these indicators suggests that hepatocytes are damaged to a certain extent. Figure 4A shows that the CRE levels in the DHFU and DHF groups (920.1±106.32 and 665.1±71.0 μmol/L, respectively) were significantly greater than those in the C, DC and DHU groups (P < 0.01). Figure 4B shows that the CRE level in the DHFU group was significantly greater than that in the DHF group (P < 0.01). The BUN level (32.8±6.3 mg/dL) in the DHFU group was significantly greater than that in the C and DHU groups. Figure 4C shows that the ALT level in the DHFU group (200.1 ±27.55 U/L) was significantly greater than that in the C and DC groups, and no significant differences in ALT were found between the CHF and DHFU groups. The AST (414.3±23.47 U/L) and ALP (2 17.9±34.34 U/L) levels in the DHFU group were obviously greater than those in the C, CHF, DC, DHF, and DHU groups (P < 0.01) (Figure 4D,E).
3.4. Effects of high UA on Liver and Kidney Enzyme Levels to Analyze Oxidative Stress in diabetic hamsters
Hepatic XOD is a flavoprotein that catalyzes the oxidation of hypoxanthine and xanthine to UA, and inhibition of XOD activity can decrease the production of UA [31]. T-SOD, GSH-PX and MDA play important roles in oxidative stress in animals. As shown in Figure 5A, PO treatment increased the XOD activity of the liver in the DHFU group compared with that in the C, CHF, DC, and DHU groups (P < 0.01). A high-fat/cholesterol diet (administered to the CHF, DHF, and DHFU groups) induced increased liver XOD activity when compared to that in the C group (P < 0.01). Moreover, liver XOD activity in the DHFU group was greater than that in the DHF group, indicating that both high-UA and high-fat/cholesterol diets had synergistic effects on increasing liver XOD activity in diabetic hamsters. As shown in Figure 5B–D, when UA was increased by PO induction, hamsters in the DHFU group developed oxidative stress with increased MDA and decreased T-SOD and GSH-PX.
3.5. Effects of high UA on renal histology in diabetic hamsters
Histological observation of the kidney tissues from each group of hamsters via PAS and H&E staining is shown in Figure 6A,B. There were no obvious glomerular changes in nondiabetic animals (C and CHF groups), and diabetic animals presented with glomerular mesangial cells and mesangial matrix proliferation, especially in the DHFU group (indicated by the black arrows in Figure 6A). Figure 6B shows that the epithelial cells of the renal tubules were intact and clear and that the renal interstitial structure was normal in the nondiabetic groups (C and CHF). However, the renal tubules in diabetic animals presented varying degrees of damage. The renal damage of the animals in the DC and DHF groups was minimal, with only renal tubule dilation, degeneration, and protein casts observed (indicated by the black star). Slight tubule dilation and protein casts were observed in the renal tissues (indicated by the black star) in the DHU group, and urate deposition and inflammatory cell infiltration were also found (indicated by the blue arrows). Notably, the renal tissue in the DHFU group was the most severely damaged, with moderate tubular degeneration, tubular atrophy, inflammatory cell infiltration, urate deposition, and protein casts (indicated by the blue arrows).
3.6. Effects of high UA on renal gene expression in diabetic hamsters
In the DHFU group, TNF-α mRNA expression was significantly upregulated compared with that in the nondiabetic groups (C and CHF groups), DC, and DHU groups (Figure 7A). However, no marked differences in TNF-α mRNA expression were detected between the DHFU and DHF groups (P > 0.05). SREBP-1c mRNA expression in the DHFU and DHF groups was significantly greater than that in the DC group, whereas SREBP-1c mRNA expression was not significantly different between the DHFU and DHF groups (Figure 7B). Figure 7C shows that PAI-1 mRNA expression in the DHFU group was also significantly upregulated compared with that in the other five groups (C, CHF, DC, DHF and DHU groups). Figure 7D shows that renal IL-6 mRNA expression in the DHFU group was markedly upregulated compared with that in the other four groups (C, CHF, DC, and DHU groups). Compared with that in the DHF and DHU groups, the renal mRNA expression of TGF-β in the DHFU group was significantly greater (Figure 7E). Figure 7F shows that there was no significant change in renal VEGF mRNA expression in any group (P > 0.05).
3.7. Evaluation of the high UA effects on fecal SCFAs in diabetic hamsters
Fecal SCFAs, including acetic acid, butyric acid, isobutyric acid, and propionic acid, were detected using GC–MS. As shown in Figure 8A, the fecal acetic acid content in the DHFU group was significantly greater than that in the other groups (C, CHF, DC, DHF, and DHU groups) (P < 0.01). The butyric acid content in the four diabetic groups (DC, DHF, DHU, and DHFU groups) was significantly lower than that in the CHF and C groups, however, the butyric acid content did not differ among the DC, DHU, and DHFU groups (Figure 8B). Figure 8C shows that the isobutyric acid content in the two high-UA groups (DHU and DHFU groups) was significantly lower than that in the other four groups (C, CHF, DC, and DHF groups), and no significant differences in isobutyric acid content were detected between the DHU and DHFU groups. As shown in Figure 8D, the propanoic acid content in the DHFU group was significantly lower than that in the other diabetic groups (P < 0.01).
3.8. Evaluation of the high UA effects on the gut microbiota in diabetic hamsters
As shown in Figure 9A, the diversity analysis indicated that the Chao index in the DHF group was significantly greater that in the CHF, DC and DHU groups (P < 0.05). The Chao index reflects richness, indicating that a high-fat/cholesterol diet in diabetic hamsters could significantly increase the richness of the intestinal flora. However, the Chao index of the DHU group was not different from that of the corresponding control groups (C and DC groups), indicating that elevated UA induced by PO treatment hardly improved the richness of the intestinal flora. The Shannon index reflects the diversity of bacterial communities, and there were no significant differences among the groups (P > 0.05) (Figure 9B), indicating that both PO treatment and the high-fat/cholesterol diet did not affect the intestinal flora diversity in hamsters. When the differences in the distribution of microbial communities were compared through principal coordinate analysis (PCoA) and nonmetric multidimensional scaling (NMDS), the results revealed that the gut microbiota structure in the fecal samples changed in diabetic hamsters with hyperuricemia and dyslipidemia, as the DHFU group presented different clusters of samples than the other groups (C, CHF, DC and DHF groups) (Figure 9C,D). After PO administration, the clusters in the DHU and DHUF groups were obviously separated from those in the DC and DHF groups, indicating that high-UA-induced PO treatment could also alter the structure of the gut microbiota.
As shown in Figure 10A, a total of 10 microorganisms with the highest abundance at the phylum level, mainly Firmicutes (Bacillota) and Bacteroidetes (Bacteroidota), were present in the fecal samples of all the groups. A greater abundance of Bacillota and a lower abundance of Bacteroidota were detected in the CHF and DHF groups than in the DC group (P < 0.05 or 0.01), whereas PO administration diminished this trend (Figure 10B,C), indicating that elevated UA had the opposite effect of the intake of high-fat/cholesterol in altering the gut microbiota at the phylum level in diabetic hamsters. An increasing ratio of Firmicutes to Bacteroidetes (F/B) was more likely to cause obesity [32]. Compared with those of normal hamsters, the average F/B values of hyperuricemic hamsters (DHU and DHFU groups) were significantly lower (P < 0.01). However, there was no significant difference in the F/B value between normal diabetic hamsters (DC group) and hyperuricemic hamsters (DHU and DHFU groups), indicating that high UA induced by PO treatment has a negligible effect on obesity in diabetic hamsters.
As shown in Figure 11A, the dominant bacteria among the top 20 microorganisms at the genus level in terms of abundance in hamster feces mainly included norank_f_Muribaculaceae, norank_o_Clostridia_UCG-014, Allobaculum, unclassified_f_Lachnospiraceae, lleibacterium, and norank_f_Eubacteriaceae. As shown in Figure 11B, the enrichment of norank_f_Muribaculaceae in diabetic hamsters was elevated in the high UA group (DHU group) by PO treatment, whereas the dietary high-fat/cholesterol clearly decreased the enrichment of norank_f_Muribaculaceae. The enrichment of norank_o_Clostridia_UCG-014 did not significantly differ among all the groups (P > 0.05), indicating that elevated UA caused by PO treatment had no effect on its enrichment (Figure 11C). Figure 11D shows that the enrichment of Allobaculum in the CHF group was significantly greater than that in all the diabetic groups (P < 0.01). However, no significant difference in the enrichment of unclassified _f_Lachnospiraceae was found among all the groups, indicating that high UA elevated by PO had no effect on its enrichment (Figure 11E). Figure 11F shows that the enrichment of lleibacterium in the DHFU group was significantly greater than that in the DC, DHF, and DHU groups (P < 0.01), indicating that PO treatment and dietary high-fat/cholesterol feeding had synergistic effects on increasing its enrichment. Figure 11G shows that the enrichment of noran_f_Eubacteriaceae in the CHF group significantly increased in all diabetic groups (P < 0.01).
As shown in Figure 12A,B, LDA effect size (LEfSe) analysis (LDA score > 3) revealed that the characteristic microbiotas of the normal hamsters (C group) were p_Bacillota, c_Bacilli, f_Lactobacillaceae, f_norank_o_Clostridia_vadinBB60_group, o_Lactobacillates, o_Clostridia_vadinBB60_group, g_Lactobacillus, g_norank_o_Clostridia_vadinBB60_group, g_Family_XIII_UCG-001, and g_Litchfieldia at the phylum and genus levels. The characteristic microbiota of the diabetic hamsters (DC group) included o_Bacteroidales, p_Bacteroidota, c_Bacteroidia, g_norank_f_Muribaculaceae, f_Ruminococcaceae, f_Muribaculaceae, g_CAG-352, g_helicobacter, o_Campylobacterales, and f_Helicobacteraceae at the phylum and genus levels. The characteristic microbiota of the DHFU group included g_lleibacterium, f_Defluviitaleaceae, g_Defluviitaleaceae_UCG-001, g_Faecalibaculum, c_Coriobacteriia, o_Coriobacteriales and f_Atopobiaceae. In addition, Spearman’s correlation analysis revealed that the abundance of lleibacterium, the dominant bacterium in the DHFU group, was positively correlated with the TG, TC, CRE, BUN, ALT, AST, XOD, and acetic acid levels and negatively correlated with the ALP, T-SOD, GSH-PX, isobutyric acid, and propanoic acid levels (Figure 12C). Moreover, Spearman’s correlation analysis revealed that the UA levels in hamsters were positively associated with Bacteroides, unclassified _f_Ruminococcaceae, Candidatus_Saccharimonas, norank_f_Muribaculaceae, Prevotellaceae_NK3B31_group, and Prevotellaceae_UCG-001 levels, and negatively associated with Helicobacter levels.
4. Discussion
Currently, rodents and birds are generally used to establish hyperuricemic models. UA metabolism and formation are similar between birds and humans, although the differences between birds and human germ-lines limit their widespread use [33]. Most animal models of hyperuricemia are established in rodents, including rats and mice, which have advantages such as the ease of feeding, administration, and reproduction. To our knowledge, an animal model of hyperuricemia in golden hamsters has not been reported. Based on the evolutionary loss of uricase in humans and its secretion in rodents, the commonly used animal model of hyperuricemia should eliminate the difference in uricase between humans and model animals to better simulate the rise of human blood UA levels. PO, a selectively competitive inhibitor of uricase, can substantially increase the concentration of UA. Adenine is a form of nitrogen with a final metabolite of UA [24]. In some studies, PO was commonly used in combination with adenine to establish mouse models of hyperuricemia. Cui et al. administered PO and adenine orally for 4 weeks to induce hyperuricemia-related chronic renal dysfunction in mice [34]. Xiao et al. used PO and adenine for 3 weeks to induce hyperuricemic rats [35]. The metabolism of fructose activates adenosine monophosphate deaminase, enhances inosine production and purine degradation, and causes high UA [36]. Wang et al. established hyperuricemic mice by administering 15% fructose solution for 8 weeks [37]. In this study, the combination of PO with adenine and high-fructose intake was used to establish a hamster model of hyperuricemia with significantly elevated serum UA levels.
Our findings revealed that the body weights of the four diabetic model groups slightly decreased during the 4 weeks of modeling. Compared with those in normal hamsters, the UA levels were elevated in the two PO-treated groups, with the most significant increase observed in DHFU hamsters. Notably, both PO treatment and high-fat/cholesterol diets had synergistic effects on increasing serum UA levels in diabetic hamsters developing hyperuricemia, which was in accordance with a previous report that elevated TG or TC levels were positively associated with hyperuricemia in 298,891 participants in a study from China in 2024 [38]. Moreover, the DHFU group developed severe hypertriglyceridemia and hypercholesterolemia with markedly elevated serum TG and TC levels, which is similar to the finding of a previous study [39]. Increased dietary cholesterol absorption from the small intestine may lead to hypercholesterolemia in hamsters. Moreover, increased exogenous dietary triglyceride absorption or decreased TG uptake in peripheral tissues may attribute to the development of severe hypertriglyceridemia in hamsters. Findings from Wardhana et al. indicated that high UA levels lead to oxidative stress by increasing reactive oxygen species production, resulting in reduced insulin sensitivity and production from pancreatic islet cells [40]. Our experiments revealed that elevated UA levels were not positively related to high Glu and low insulin levels in STZ-induced diabetic animals, indicating that high UA and dietary fat/cholesterol had nonsynergistic effects on increasing serum Glu levels in diabetic hamsters. Compared with the above studies, our diabetic hamster model with severe hyperuricemia, hypertriglyceridemia, and hypercholesterolemia replicates the physiological features of some specific population groups at the early stage of diabetes.
Our results revealed that significant differences in BW were not present among the four diabetic groups, indicating that elevated Glu levels, not high-fat/cholesterol diets or high UA levels, caused greater BW loss. Compared with those in normal hamsters, the most significant increase in the kidney index was observed in the DHFU group, indicating that high UA and lipid levels synergistically promoted severe damage to the kidney in diabetic animals, which is consistent with the results of significant renal hypertrophy in hyperuricemic rats reported by Cheng et al [24]. However, a comparison of the liver indices of the DHF (most significantly high) and DHU (significantly low) groups revealed that dietary high-fat/cholesterol, not high UA, played a leading role in causing severe liver damage in diabetic hamsters. Li’s study of hyperuricemic rat models revealed that the UA level was not significantly correlated with the Cre or BUN levels [41]. Our results also revealed that the BUN and Cre levels in DHU group were not significantly different from those in the DC group. However, the BUN and Cre levels in the DHFU groups were greater than those in the DHU and DHF groups, indicating that the synergistic effects of high UA and dietary high-fat/cholesterol may accelerate renal injury in diabetic hamsters. The serum AST, ALT, and ALP levels in the DHFU group were greater than those in the DHU and DHF groups, which also indicates that the synergistic effects of high UA and high-fat/cholesterol in diabetes caused more severe liver damage. Our results revealed that the hepatic XOD levels in hamsters fed a high-fat/cholesterol diet were significantly greater than those in the corresponding groups (C, DC and DHU groups), which was attributed to high TG and TC levels, increasing hepatic XOD activity. Moreover, the DHFU group had a significantly greater hepatic XOD level than that in the DHF group, indicating that the synergistic effects of high UA and high TG/TC increased the activity of XOD in the setting of diabetes. Recent studies have also shown that increased serum UA directly promotes oxidative stress [42]. Sha et al. reported the significantly low expression levels of GSH-PX and T-SOD and high expression levels of MDA in the kidneys of a rat model of diabetic nephropathy [43]. Our findings of decreased GSH-PX and T-SOD and increased MDA in the DHFU group also revealed that the antioxidant capacity of the hamster body was weakened, indicated by oxidative damage, which may stimulate renal inflammation and damage.
Findings from Fan’s clinical investigation indicated that high UA levels in patients with nephropathy are associated with glomerulosclerosis and tubulointerstitial injury [44]. Our study revealed that high UA levels lead to renal injury in diabetic hamsters with tubular degeneration and atrophy, which is in agreement with the histopathological features of renal biopsies from hyperuricemic individuals. However, no obvious glomerulosclerosis was found in diabetic hamsters with hyperuricemia, which may be due to the experimental period and the age of the hamsters. In humans, severe renal injury often occurs at the late stage of the progression of hyperuricemia. Notably, the severity of renal injury in the DHFU group was significantly greater than that in the DC, DHF and DHU groups, indicating that high UA levels accelerated renal injury in diabetic hamsters with dyslipidemia. The UOX-KO rats prepared by Wu et al. using the uricase (UOX) gene knockout presented renal swelling and polycystic changes at 56 days of age, interstitial urate crystal deposition, dilation and fibrosis of renal tubules, fibrosis of glomeruli, and infiltration of macrophages at 112 days of age [45]. In our study, the pathological features of diabetic hamsters with hyperuricemia and dyslipidemia include crystal deposition and renal tubular dilation, degeneration and atrophy, which are similar to those observed in UOX-KO rats, although no fibrotic damage was observed.
Abrass et al. reported that lipids can stimulate mesangial cells to proliferate, produce excess basement membrane material and cause the development of sclerotic glomerular lesions [46]. In agreement with Abrass’s study, we also reported that the TNF-α, SREBP-1c, PAI-1, IL-6, and TGF-β mRNA levels were significantly increased in diabetic hamsters with dyslipidemia. However, hyperuricemic diabetic hamsters presented significantly increased PAI-1 mRNA levels, which contributed to diabetic nephropathy by regulating TGF-β and renal extracellular matrix production. In our study, the PAI-1 and TGF-β mRNA levels in the DHFU groups were significantly greater than those in the DHF and DHU groups, indicating that the synergistic effects of high UA and a high-fat/cholesterol diet on renal gene expression of PAI-1 and TGF-β may accelerate renal injury in diabetic hamsters. No significant differences in the IL-6, SREBP-1c, or TNF-α mRNA levels were detected between the DHFU and DHF groups, indicating that the renal mRNA expression of these genes is affected mainly by lipid accumulation, not high UA. Increased expression of VEGF in the kidney was found in a db/db mice model of type 2 diabetes [47]. However, in our results, renal VEGF expression in the DHFU, DHF, and DHU groups was not upregulated, and even slightly decreased, which is in agreement with the findings of human diabetic nephropathy. Findings from another study revealed that the expression levels of VEGF mRNA and protein significantly decreased, which showed that a lack of VEGF, rather than an excess of VEGF, caused the progression of human diabetic nephropathy [48].
As the link between host homeostasis and the microbiota, SCFAs play vital roles in regulating glucolipid metabolism, immunity, and intestinal development [49]. Acetic acid is a net product of carbohydrate fermentation in most anaerobic bacteria, whereas butyric and propionic acids are produced from carbohydrate or protein fermentation by a distinct subset of bacteria. Findings from Kindt et al. indicated that the intestinal flora promoted liver fatty acid metabolism by providing a high level of acetate to synthesize stearate and palmitate [50]. Moreover, dietary fructose activated the Ack pathway, which is involved in acetic acid generation, triggering the bacterial stress response and further promoting phage production [51]. In our study, the significantly high content of acetic acid in diabetic hamsters with hyperuricemia and dyslipidemia have been caused by a high-fat/cholesterol and high- fructose water diet. As a main energy source for colon epithelial cells, butyric acid plays a crucial role in maintaining the health and integrity of the intestinal mucosa [52]. Butyrate and propionate prevent obesity induced by diet and regulate intestinal hormones [53]. Li et al. reported that the contents of butyric and propanoic acids in fecal samples from hyperuricemic mice were significantly lower than those in samples from normal mice [52]. In agreement with Li’s results, decreased butyric, propanoic and isobutyric acid levels in diabetic hamsters with hyperuricemia indicated that high UA could affect the gut microbiota and epithelial integrity in diabetic hamsters.
Previous studies have shown that renal dysfunction in patients with diabetes is closely related to dysbiosis of the intestinal flora [54]. Dysbiosis is generally attributed to a decreased proportion of multiple probiotics and increased pathogenic bacteria. Liang et al. reported that a high-fat/cholesterol diet may affect the gut microbiota, resulting in a sharp decrease in microbial richness and diversity in mice [55]. Inconsistent with Liang’s findings, we found that high-fat/cholesterol diets decreased the richness of the intestinal flora in normal hamsters but increased the richness of the intestinal flora in diabetic hamsters according to the Chao index. Moreover, the Chao and Shannon indices revealed that the intestinal flora richness and diversity of bacterial communities in diabetic hamsters with hyperuricemia were unrelated to elevated UA. However, Ness et al reported that high gut microbial diversity was related to low UA in patients with hyperuricemia [56]. In this study, NMDS and PCoA revealed that the gut microbiota structure in diabetic hamsters with hyperuricemia and dyslipidemia was altered, which may account for the synergistic effects of UA and a high-fat/cholesterol diet on the gut microbiota structure in the setting of diabetes. Firmicutes and Bacteroidetes constitute most microbiota in the human gastrointestinal tract at the phylum level [57]. Moreover, the F/B ratio is a critical indicator of intestinal homeostasis, and a decreased F/B ratio alleviates endotoxemia, inflammation and intestinal permeability [57]. Our study indicated that the relative abundance of Firmicutes decreased and the abundance of Bacteroidetes increased in diabetic hamsters, accompanied by a significant decrease in the F/B value, in agreement with Wang’s results that the F/B value in patients with diabetic nephropathy was significantly lower than that in the healthy population. In hyperuricemic hamsters, some dominant bacteria at the genus level (norank_o_Clostridia_UCG-014, norank_f_Muribaculaceae, unclassified_f_Lachnospiraceae and noran_f_Eubacteriaceae) were not significantly altered compared with those in normal diabetic hamsters. In a mice model with Alzheimer’s disease, Allobaculum is related to improved metabolic health and prolonged lifespan in response to caloric restriction [58]. In our study, the enrichment of Allobaculum in hamsters fed a high-fat/cholesterol diet was significantly reduced after PO treatment, indicating that high UA decreased the metabolic health of diabetic hamsters. Wang et al. reported an increased relative abundance of Lleibacterium in mice fed high-fat diet and speculated that Lleibacterium might be relate to the cause of hyperlipidemia [59]. Our results revealed that the relative abundance of Lleibacterium increased in diabetic hamsters with hyperuricemia and dyslipidemia, indicating that Lleibacterium may be involved in enzymes that participate in lipid and purine metabolism.
The gut–kidney axis and intestinal permeability change, leading to dysregulation of the intestinal flora [60]. Moreover, changes in the intestinal flora may also be associated with diet, drug use, and lifestyle in patients with diabetes. The intricate relationship between UA metabolism and the gut microbiota involves a bidirectional interaction that can influence both the host’s gut environment and UA levels [8]. Our results indicated that the characteristic microbiota in the DHFU group obviously changed, suggesting that alterations in the gut environment affect gut barrier function. We also detected more Lleibacterium in diabetic hamsters with hyperuricemia and dyslipidemia, indicating that Lleibacterium was positively correlated with lipid metabolic disorders and renal function indicators. However, the role that Lleibacterium plays in diabetic renal injury remains unclear. Yuan et al reported that the serum UA level in children with hyperuricemia was positively related to the genera Streptococcus, Morganella, and Actinomyces and negatively related to the genera Parabacteroides, Oscillospira, Faecalibacterium, Bilophila, Alistipes and Phascolarctobacterium [61]. In our study, UA levels in diabetic hamsters with hyperuricemia and dyslipidemia were positively associated with Bacteroides, unclassified _f_Ruminococcaceae, Candidatus_Saccharimonas, norank_f_Muribaculaceae, Prevotellaceae_NK3B31_group, and Prevotelaceae_UCG-001 and negatively associated with Helicobacter, which might be attributed to species differences, STZ induction, and a high-fat/cholesterol diet. Moreover, unclassified_f_Ruminococcaceae and Prevotellaceae_UCG-001 have also been shown to be related to the production of SCFA [62,63]. More studies are needed to explain how high UA levels affect animal host health through each of these gut flora-associated signaling pathways.
In conclusion, a diabetic hamster model with severe hyperuricemia and dyslipidemia was successively established, and it replicates the physiological and pathological features of specific patients at the early stage of diabetes. The combination of PO treatment and a high-fat/cholesterol diet had synergistic effects on increasing serum UA levels in the setting of diabetes. There was a very low correlation between high UA levels and high Glu and low insulin levels in diabetic hamsters induced using STZ. Elevated UA alone had a negligible effect on weight loss and the organ index in diabetic hamsters, whereas high UA and a high-fat/cholesterol diet had synergistic effects on increasing the BUN and Cre levels and accelerating renal injury in diabetic hamsters. Moreover, the synergistic effects of high UA and high-fat/cholesterol diets caused more severe liver damage and significantly increased the activity of hepatic XOD in diabetic hamsters. The antioxidant capacity of diabetic hamsters with hyperuricemia and dyslipidemia was decreased, causing some oxidative damage, which may further stimulate renal inflammation and damage. Together, high UA and a dietary high-fat/cholesterol diet increase the renal gene expression of PAI-1 and TGF-β to accelerate renal injury in diabetic hamsters. The slight decrease in renal VEGF expression in diabetic hamsters with hyperuricemia and dyslipidemia was similar to that in human diabetic nephropathy. The significantly high content of acetic acid in diabetic hamsters with hyperuricemia and dyslipidemia may be caused by a high-fat/cholesterol diet and the intake of fructose water. Decreased butyric, propanoic and isobutyric acid levels in hyperuricemic hamsters also indicated that high UA could affect the gut microbiota and epithelial integrity in diabetic hamsters. The intestinal flora richness and diversity of bacterial communities in diabetic hamsters with hyperuricemia were weakly correlated with high UA, whereas the gut microbiota structure was altered in diabetic hamsters with hyperuricemia and dyslipidemia, which might be attributed to the synergistic effects of high UA and a high-fat/cholesterol diet. A significant decrease in the F/B value in diabetic hamsters with hyperuricemia and dyslipidemia was consistent with that in patients with diabetic nephropathy. PO treatment significantly reduced the enrichment of Allobaculum bacteria in hamsters fed a high-fat/cholesterol diet, indicating that elevated UA affects the health of diabetic hamsters. The relative abundance of Lleibacterium significantly increased in diabetic hamsters with hyperuricemia and dyslipidemia. Serum UA levels in diabetic hamsters with hyperuricemia and dyslipidemia were positively associated with Bacteroides, unclassified _f_Ruminococcaceae, Candidatus_Saccharimonas, norank_f_Muribaculaceae, and Prevotellaceae_NK3B31_group, Prevotelaceae_UCG-001 and negatively associated with Helicobacter.
Author Contributions
L.H.: Conceptualization, Methodology, Data curation, Formal analysis, Writing – original draft. M.M.: Investigation, Data curation, Formal analysis. Q.L.: Methodology, Data curation, Writing – original draft. J.C.: Investigation, Data curation. R.L: Conceptualization, Methodology, Writing – review & editing, Supervision, Project administration. All authors have read and approved the final manuscript.
Funding
Public Welfare Technology Application Research of Zhejiang Province of China provided support to this research (No. LTGD23C040006).
Institutional Review Board Statement
The animal experimental protocol was approved by the Laboratory Animal Welfare and Ethics Committee of Zhejiang Academy of Agricultural Sciences (Approval No. 2022ZAASLA58).
Informed Consent Statement
Not applicable.
Data Availability Statement
The raw data is available by the corresponding author upon request.
Conflicts of Interest
All authors declare no conflict interest.
References
- Schlesinger, N. Dietary factors and hyperuricaemia. Curr Pharm Des 2005, 11, 4133–4138. [Google Scholar] [CrossRef] [PubMed]
- Chen, X.; Burdett, T.C.; Desjardins, C.A.; Logan, R.; Cipriani, S.; Xu, Y.; Schwarzschild, M.A. Disrupted and transgenic urate oxidase alter urate and dopaminergic neurodegeneration. Proc Natl Acad Sci U S A 2013, 110, 300–305. [Google Scholar] [CrossRef]
- Chen-Xu, M.; Yokose, C.; Rai, S.K.; Pillinger, M.H.; Choi, H.K. Contemporary Prevalence of Gout and Hyperuricemia in the United States and Decadal Trends: The National Health and Nutrition Examination Survey, 2007-2016. Arthritis Rheumatol 2019, 71, 991–999. [Google Scholar] [CrossRef]
- Song, J.; Jin, C.; Shan, Z.; Teng, W.; Li, J. Prevalence and Risk Factors of Hyperuricemia and Gout: A Cross-sectional Survey from 31 Provinces in Mainland China. J Transl Int Med 2022, 10, 134–145. [Google Scholar] [CrossRef] [PubMed]
- Ni, Q.; Lu, X.; Chen, C.; Du, H.; Zhang, R. Risk factors for the development of hyperuricemia: A STROBE-compliant cross-sectional and longitudinal study. Medicine (Baltimore) 2019, 98, e17597. [Google Scholar] [CrossRef]
- Li, L.; Yang, C.; Zhao, Y.; Zeng, X.; Liu, F.; Fu, P. Is hyperuricemia an independent risk factor for new-onset chronic kidney disease?: A systematic review and meta-analysis based on observational cohort studies. BMC Nephrol 2014, 15, 122. [Google Scholar] [CrossRef]
- Zhang, S.; Zhang, Y.; Lin, S.; Zhang, S.; Qiu, M. Hyperuricemia as a possible risk factor for abnormal lipid metabolism in the Chinese population: a cross-sectional study. Ann Palliat Med 2021, 10, 11454–11463. [Google Scholar] [CrossRef] [PubMed]
- Lu, X.; Zhao, Y.; Wu, S.; Xing, Y.; Fang, Y.; Xing, H.; Pei, M.; Li, J.; Qiao, Y.; Tian, Y.; et al. Gut microbiota and hyperuricemia: From mechanisms to therapeutic strategies. EJMO 2025, 9(2), 61–77. [Google Scholar] [CrossRef]
- Samsu, N. Diabetic Nephropathy: Challenges in Pathogenesis, Diagnosis, and Treatment. Biomed Res Int 2021, 2021, 1497449. [Google Scholar] [CrossRef]
- Bhole, V.; Choi, J.W.J.; Kim, S.W.; de Vera, M.; Choi, H. Serum uric acid levels and the risk of type 2 diabetes: a prospective study. Am J Med 2010, 123, 957–961. [Google Scholar] [CrossRef]
- De Cosmo, S.; Viazzi, F.; Pacilli, A.; Giorda, C.; Ceriello, A.; Gentile, S.; Russo, G.; Rossi, M.C.; Nicolucci, A.; Guida, P.; et al. Serum Uric Acid and Risk of CKD in Type 2 Diabetes. Clin J Am Soc Nephrol 2015, 10, 1921–1929. [Google Scholar] [CrossRef]
- Liu, J.; Tao, L.; Zhao, Z.; Mu, Y.; Zou, D.; Zhang, J.; Guo, X. Two-Year Changes in Hyperuricemia and Risk of Diabetes: A Five-Year Prospective Cohort Study. J Diabetes Res 2018, 2018, 6905720. [Google Scholar] [CrossRef] [PubMed]
- Lu, J.; He, Y.; Cui, L.; Xing, X.; Liu, Z.; Li, X.; Zhang, H.; Li, H.; Sun, W.; Ji, A.; et al. Hyperuricemia Predisposes to the Onset of Diabetes via Promoting Pancreatic beta-Cell Death in Uricase-Deficient Male Mice. Diabetes 2020, 69, 1149–1163. [Google Scholar] [CrossRef]
- Ali, N.; Rahman, S.; Islam, S.; Haque, T.; Molla, N.H.; Sumon, A.H.; Kathak, R.R.; Asaduzzaman, M.; Islam, F.; Mohanto, N.C.; et al. The relationship between serum uric acid and lipid profile in Bangladeshi adults. BMC Cardiovasc Disord 2019, 19, 42. [Google Scholar] [CrossRef] [PubMed]
- Peng, T.-C.; Wang, C.-C.; Kao, T.-W.; Chan, J.Y.-H.; Yang, Y.-H.; Chang, Y.-W.; Chen, W.-L. Relationship between hyperuricemia and lipid profiles in US adults. Biomed Res Int 2015, 2015, 127596. [Google Scholar] [CrossRef] [PubMed]
- Pasalic, D.; Marinkovic, N.; Feher-Turkovic, L. Uric acid as one of the important factors in multifactorial disorders--facts and controversies. Biochem Med (Zagreb) 2012, 22, 63–75. [Google Scholar] [CrossRef]
- Susic, D.; Frohlich, E.D. Hyperuricemia: A Biomarker of Renal Hemodynamic Impairment. Cardiorenal Med 2015, 5, 175–182. [Google Scholar] [CrossRef]
- Ruan, X.Z.; Varghese, Z.; Moorhead, J.F. An update on the lipid nephrotoxicity hypothesis. Nat Rev Nephrol 2009, 5, 713–721. [Google Scholar] [CrossRef]
- Kaur, A.; Sharma, G.S.; Kumbala, D.R. Acute kidney injury in diabetic patients: A narrative review. Medicine (Baltimore) 2023, 102, e33888. [Google Scholar] [CrossRef]
- Sonnenburg, J.L.; Backhed, F. Diet-microbiota interactions as moderators of human metabolism. Nature 2016, 535, 56–64. [Google Scholar] [CrossRef]
- Liu, Y.; Jarman, J.B.; Low, Y.S.; Augustijn, H.E.; Huang, S.; Chen, H.; DeFeo, M.E.; Sekiba, K.; Hou, B.-H.; Meng, X.; et al. A widely distributed gene cluster compensates for uricase loss in hominids. Cell 2023, 186, 4472–4473. [Google Scholar] [CrossRef]
- Basnet, T.B.; Gc, S.; Basnet, R.; Fatima, S.; Safdar, M.; Sehar, B.; Alsubaie, A.S.R.; Zeb, F. Interaction between gut microbiota metabolites and dietary components in lipid metabolism and metabolic diseases. Access Microbiol 2023, 5, acmi000403. [Google Scholar] [CrossRef]
- He, F.-F.; Li, Y.-M. Role of gut microbiota in the development of insulin resistance and the mechanism underlying polycystic ovary syndrome: a review. J Ovarian Res 2020, 13, 73. [Google Scholar] [CrossRef] [PubMed]
- Cheng, J.X.L.; Yang, L.; Cheng, L.; Chi, F.S.; Tang, L.; Tan, J. Experimental Study on Preparation of Hyperuricemia Rat Model by Five Methods. Journal of Guangzhou University of Traditional Chinese Medicine 2021, 38, 2456–2461. [Google Scholar] [CrossRef]
- Dhouibi, R.; Affes, H.; Salem, M.B.; Moalla, D.; Marekchi, R.; Charfi, S.; Hammami, S.; Sahnoun, Z.; Jamoussi, K.; Zeghal, K.M.; et al. Creation of an adequate animal model of hyperuricemia (acute and chronic hyperuricemia); study of its reversibility and its maintenance. Life Sci 2021, 268, 118998. [Google Scholar] [CrossRef] [PubMed]
- Kobayashi, K.; Forte, T.M.; Taniguchi, S.; Ishida, B.Y.; Oka, K.; Chan, L. The db/db mouse, a model for diabetic dyslipidemia: molecular characterization and effects of Western diet feeding. Metabolism 2000, 49, 22–31. [Google Scholar] [CrossRef]
- Furman, B.L. Streptozotocin-Induced Diabetic Models in Mice and Rats. Curr Protoc 2021, 1, e78. [Google Scholar] [CrossRef]
- Wang, P.R.; Guo, Q.; Ippolito, M.; Wu, M.; Milot, D.; Ventre, J.; Doebber, T.; Wright, S.D.; Chao, Y.S. High fat fed hamster, a unique animal model for treatment of diabetic dyslipidemia with peroxisome proliferator activated receptor alpha selective agonists. Eur J Pharmacol 2001, 427, 285–293. [Google Scholar] [CrossRef]
- Li, B.; Evivie, S.E.; Lu, J.; Jiao, Y.; Wang, C.; Li, Z.; Liu, F.; Huo, G. Lactobacillus helveticus KLDS1.8701 alleviates d-galactose-induced aging by regulating Nrf-2 and gut microbiota in mice. Food Funct 2018, 9, 6586–6598. [Google Scholar] [CrossRef]
- Akimoto, T.; Ito, C.; Kato, M.; Ogura, M.; Muto, S.; Kusano, E. Reduced hydration status characterized by disproportionate elevation of blood urea nitrogen to serum creatinine among the patients with cerebral infarction. Med Hypotheses 2011, 77, 601–604. [Google Scholar] [CrossRef]
- Simon-Giavarotti, K.A.; Giavarotti, L.; Gomes, L.F.; Lima, A.F.; Veridiano, A.M.; Garcia, E.A.; Mora, O.A.; Fernandez, V.; Videla, L.A.; Junqueira, V.B.C. Enhancement of lindane-induced liver oxidative stress and hepatotoxicity by thyroid hormone is reduced by gadolinium chloride. Free Radic Res 2002, 36, 1033–1039. [Google Scholar] [CrossRef]
- Ussar, S.; Fujisaka, S.; Kahn, C.R. Interactions between host genetics and gut microbiome in diabetes and metabolic syndrome. Mol Metab 2016, 5, 795–803. [Google Scholar] [CrossRef] [PubMed]
- Wang, L.; Li, J.; Wang, B.; Yin, X.; Wei, J.; Qiu, H. Progress in modeling avian hyperuricemia and gout (Review). Biomed Rep 2025, 22, 1. [Google Scholar] [CrossRef] [PubMed]
- Cui, D.L.; Liu, S.Y.; Tang, M.H.; Lu, Y.Z.; Zhao, M.; Mao, R.W.; Wang, C.S.; Yuan, Y.J.; Li, L.; Chen, Y.N.; et al. Phloretin ameliorates hyperuricemia-induced chronic renal dysfunction through inhibiting NLRP3 inflammasome and uric acid reabsorption. Phytomedicine 2020, 66. [Google Scholar] [CrossRef] [PubMed]
- Xiao, B.X.; Ma, W.J.; Zheng, Y.; Li, Z.; Li, D.; Zhang, Y.J.; Li, Y.H.; Wang, D. Effects of resveratrol on the inflammatory response and renal injury in hyperuricemic rats. Nutr Res Pract 2021, 15, 26–37. [Google Scholar] [CrossRef]
- Zhang, C.W.; Li, L.J.; Zhang, Y.P.; Zeng, C.C. Recent advances in fructose intake and risk of hyperuricemia. Biomedicine & Pharmacotherapy 2020, 131, 11079. [Google Scholar] [CrossRef]
- Wang, H.N.; Mei, L.; Deng, Y.; Liu, Y.H.; Wei, X.Q.; Liu, M.; Zhou, J.R.; Ma, H.; Zheng, P.Y.; Yuan, J.L.; et al. DM9218 ameliorates fructose-induced hyperuricemia through inosine degradation and manipulation of intestinal dysbiosis. Nutrition 2019, 62, 63–73. [Google Scholar] [CrossRef]
- Fang, Y.C.; Mei, W.D.; Wang, C.X.; Ren, X.; Hu, J.; Su, F.; Cao, L.; Tavengana, G.; Jiang, M.F.; Wu, H.; et al. Dyslipidemia and hyperuricemia: a cross-sectional study of residents in Wuhu, China. Bmc Endocr Disord 2024, 24, 2. [Google Scholar] [CrossRef]
- He, L.; Hao, L.; Fu, X.; Huang, M.; Li, R. Severe hypertriglyceridemia and hypercholesterolemia accelerating renal injury: a novel model of type 1 diabetic hamsters induced by short-term high-fat / high-cholesterol diet and low-dose streptozotocin. BMC Nephrol 2015, 16, 51. [Google Scholar] [CrossRef]
- Wardhana, W.; Rudijanto, A. Effect of Uric Acid on Blood Glucose Levels. Acta Med Indones 2018, 50, 253–256. [Google Scholar] [PubMed]
- Li, Y.Y.Z., H. Y.;Wu, L.Y.; Mo, X.W.; Li,J. Establishment and study of a hyperuricemia rat model. Acta Lab Anim Sci Sin 2019, 27, 747–752. [Google Scholar] [CrossRef]
- Esen, A.M.; Akcakoyun, M.; Esen, O.; Acar, G.; Emiroglu, Y.; Pala, S.; Kargin, R.; Karapinar, H.; Ozcan, O.; Barutcu, I. Uric acid as a marker of oxidative stress in dilatation of the ascending aorta. Am J Hypertens 2011, 24, 149–154. [Google Scholar] [CrossRef] [PubMed]
- Sha, J.; Sui, B.; Su, X.; Meng, Q.; Zhang, C. Alteration of oxidative stress and inflammatory cytokines induces apoptosis in diabetic nephropathy. Mol Med Rep 2017, 16, 7715–7723. [Google Scholar] [CrossRef]
- Fan, S.; Zhang, P.; Wang, A.Y.; Wang, X.; Wang, L.; Li, G.; Hong, D. Hyperuricemia and its related histopathological features on renal biopsy. BMC Nephrol 2019, 20, 95. [Google Scholar] [CrossRef] [PubMed]
- Wu, M.; Ma, Y.; Chen, X.; Liang, N.; Qu, S.; Chen, H. Hyperuricemia causes kidney damage by promoting autophagy and NLRP3-mediated inflammation in rats with urate oxidase deficiency. Dis Model Mech 2021, 14. [Google Scholar] [CrossRef] [PubMed]
- Abrass, C.K. Cellular lipid metabolism and the role of lipids in progressive renal disease. Am J Nephrol 2004, 24, 46–53. [Google Scholar] [CrossRef]
- Ziyadeh, F.N.; Hoffman, B.B.; Han, D.C.; Iglesias-De La Cruz, M.C.; Hong, S.W.; Isono, M.; Chen, S.; McGowan, T.A.; Sharma, K. Long-term prevention of renal insufficiency, excess matrix gene expression, and glomerular mesangial matrix expansion by treatment with monoclonal antitransforming growth factor-beta antibody in db/db diabetic mice. Proc Natl Acad Sci U S A 2000, 97, 8015–8020. [Google Scholar] [CrossRef]
- Lindenmeyer, M.T.; Kretzler, M.; Boucherot, A.; Berra, S.; Yasuda, Y.; Henger, A.; Eichinger, F.; Gaiser, S.; Schmid, H.; Rastaldi, M.P.; et al. Interstitial vascular rarefaction and reduced VEGF-A expression in human diabetic nephropathy. J Am Soc Nephrol 2007, 18, 1765–1776. [Google Scholar] [CrossRef]
- Martin-Gallausiaux, C.; Marinelli, L.; Blottiere, H.M.; Larraufie, P.; Lapaque, N. SCFA: mechanisms and functional importance in the gut. Proc Nutr Soc 2021, 80, 37–49. [Google Scholar] [CrossRef]
- Kindt, A.; Liebisch, G.; Clavel, T.; Haller, D.; Hormannsperger, G.; Yoon, H.; Kolmeder, D.; Sigruener, A.; Krautbauer, S.; Seeliger, C.; et al. The gut microbiota promotes hepatic fatty acid desaturation and elongation in mice. Nat Commun 2018, 9, 3760. [Google Scholar] [CrossRef]
- Oh, J.-H.; Alexander, L.M.; Pan, M.; Schueler, K.L.; Keller, M.P.; Attie, A.D.; Walter, J.; van Pijkeren, J.-P. Dietary Fructose and Microbiota-Derived Short-Chain Fatty Acids Promote Bacteriophage Production in the Gut Symbiont Lactobacillus reuteri. Cell Host Microbe 2019, 25, 273–284.e276. [Google Scholar] [CrossRef]
- Li, Y.; Li, H.; Wang, R.; Yu, Y.; Liu, X.; Tian, Z. Protective effect of sodium butyrate on intestinal barrier damage and uric acid reduction in hyperuricemia mice. Biomed Pharmacother 2023, 161, 11456. [Google Scholar] [CrossRef] [PubMed]
- Lin, H.V.; Frassetto, A.; Kowalik, E.J., Jr.; Nawrocki, A.R.; Lu, M.M.; Kosinski, J.R.; Hubert, J.A.; Szeto, D.; Yao, X.; Forrest, G.; et al. Butyrate and propionate protect against diet-induced obesity and regulate gut hormones via free fatty acid receptor 3-independent mechanisms. PLoS One 2012, 7, e35240. [Google Scholar] [CrossRef]
- Cheng, G.; Liu, Y.L.; Guo, R.; Wang, H.N.; Zhang, W.J.; Wang, Y.Y. Molecular mechanisms of gut microbiota in diabetic nephropathy. Diabetes Res Clin Pr 2024, 213, 111726. [Google Scholar] [CrossRef] [PubMed]
- Liang, H.J.; Jiang, F.L.; Cheng, R.Y.; Luo, Y.T.; Wang, J.N.; Luo, Z.H.; Li, M.; Shen, X.; He, F. A high-fat diet and high-fat and high-cholesterol diet may affect glucose and lipid metabolism differentially through gut microbiota in mice. Exp Anim Tokyo 2021, 70, 73–83. [Google Scholar] [CrossRef] [PubMed]
- Ness, C.; Svistounov, D.; Solbu, M.D.; Petrenya, N.; Boardman, N.; Ytrehus, K.; Jenssen, T.G.; Holmes, A.; Simpson, S.J.; Zykova, S.N. Gut Microbiome Diversity and Uric Acid in Serum and Urine. Kidney International Reports 2025, 10, 1683–1693. [Google Scholar] [CrossRef]
- Singh, P.; Rawat, A.; Alwakeel, M.; Sharif, E.; Al Khodor, S. The potential role of vitamin D supplementation as a gut microbiota modifier in healthy individuals. Sci Rep 2020, 10, 21641. [Google Scholar] [CrossRef]
- Cox, L.M.; Schafer, M.J.; Sohn, J.; Vincentini, J.; Weiner, H.L.; Ginsberg, S.D.; Blaser, M.J. Calorie restriction slows age-related microbiota changes in an Alzheimer's disease model in female mice. Sci Rep 2019, 9, 17904. [Google Scholar] [CrossRef]
- Wang, Y.; Li, H.C.; Ren, Y.C.; Wang, Y.Q.; Ren, Y.P.; Wang, X.W.; Yue, T.L.; Wang, Z.L.; Gao, Z.P. Preparation, model construction and efficacy lipid-lowering evaluation of kiwifruit juice fermented by probiotics. Food Biosci 2022, 47, 101710. [Google Scholar] [CrossRef]
- Liu, J.; Guo, M.; Yuan, X.; Fan, X.; Wang, J.; Jiao, X. Gut Microbiota and Their Metabolites: The Hidden Driver of Diabetic Nephropathy? Unveiling Gut Microbe's Role in DN. J Diabetes 2025, 17, e70068. [Google Scholar] [CrossRef]
- Yuan, X.; Chen, R.; Zhang, Y.; Lin, X.; Yang, X. Altered Gut Microbiota in Children With Hyperuricemia. Front Endocrinol (Lausanne) 2022, 13, 848715. [Google Scholar] [CrossRef] [PubMed]
- He, X.; Li, W.; Chen, Y.; Lei, L.; Li, F.; Zhao, J.; Zeng, K.; Ming, J. Dietary fiber of Tartary buckwheat bran modified by steam explosion alleviates hyperglycemia and modulates gut microbiota in db/db mice. Food Res Int 2022, 157, 111386. [Google Scholar] [CrossRef] [PubMed]
- Ou, Y.; Guo, Y.; Chen, M.; Lu, X.; Guo, Z.; Zheng, B. Gut microbiome-serum metabolic profiles: insight into the hypoglycemic effect of Porphyra haitanensis glycoprotein on hyperglycemic mice. Food & function 2023, 14, 7977–7991. [Google Scholar] [CrossRef]
Figure 1.
Experimental animal design.
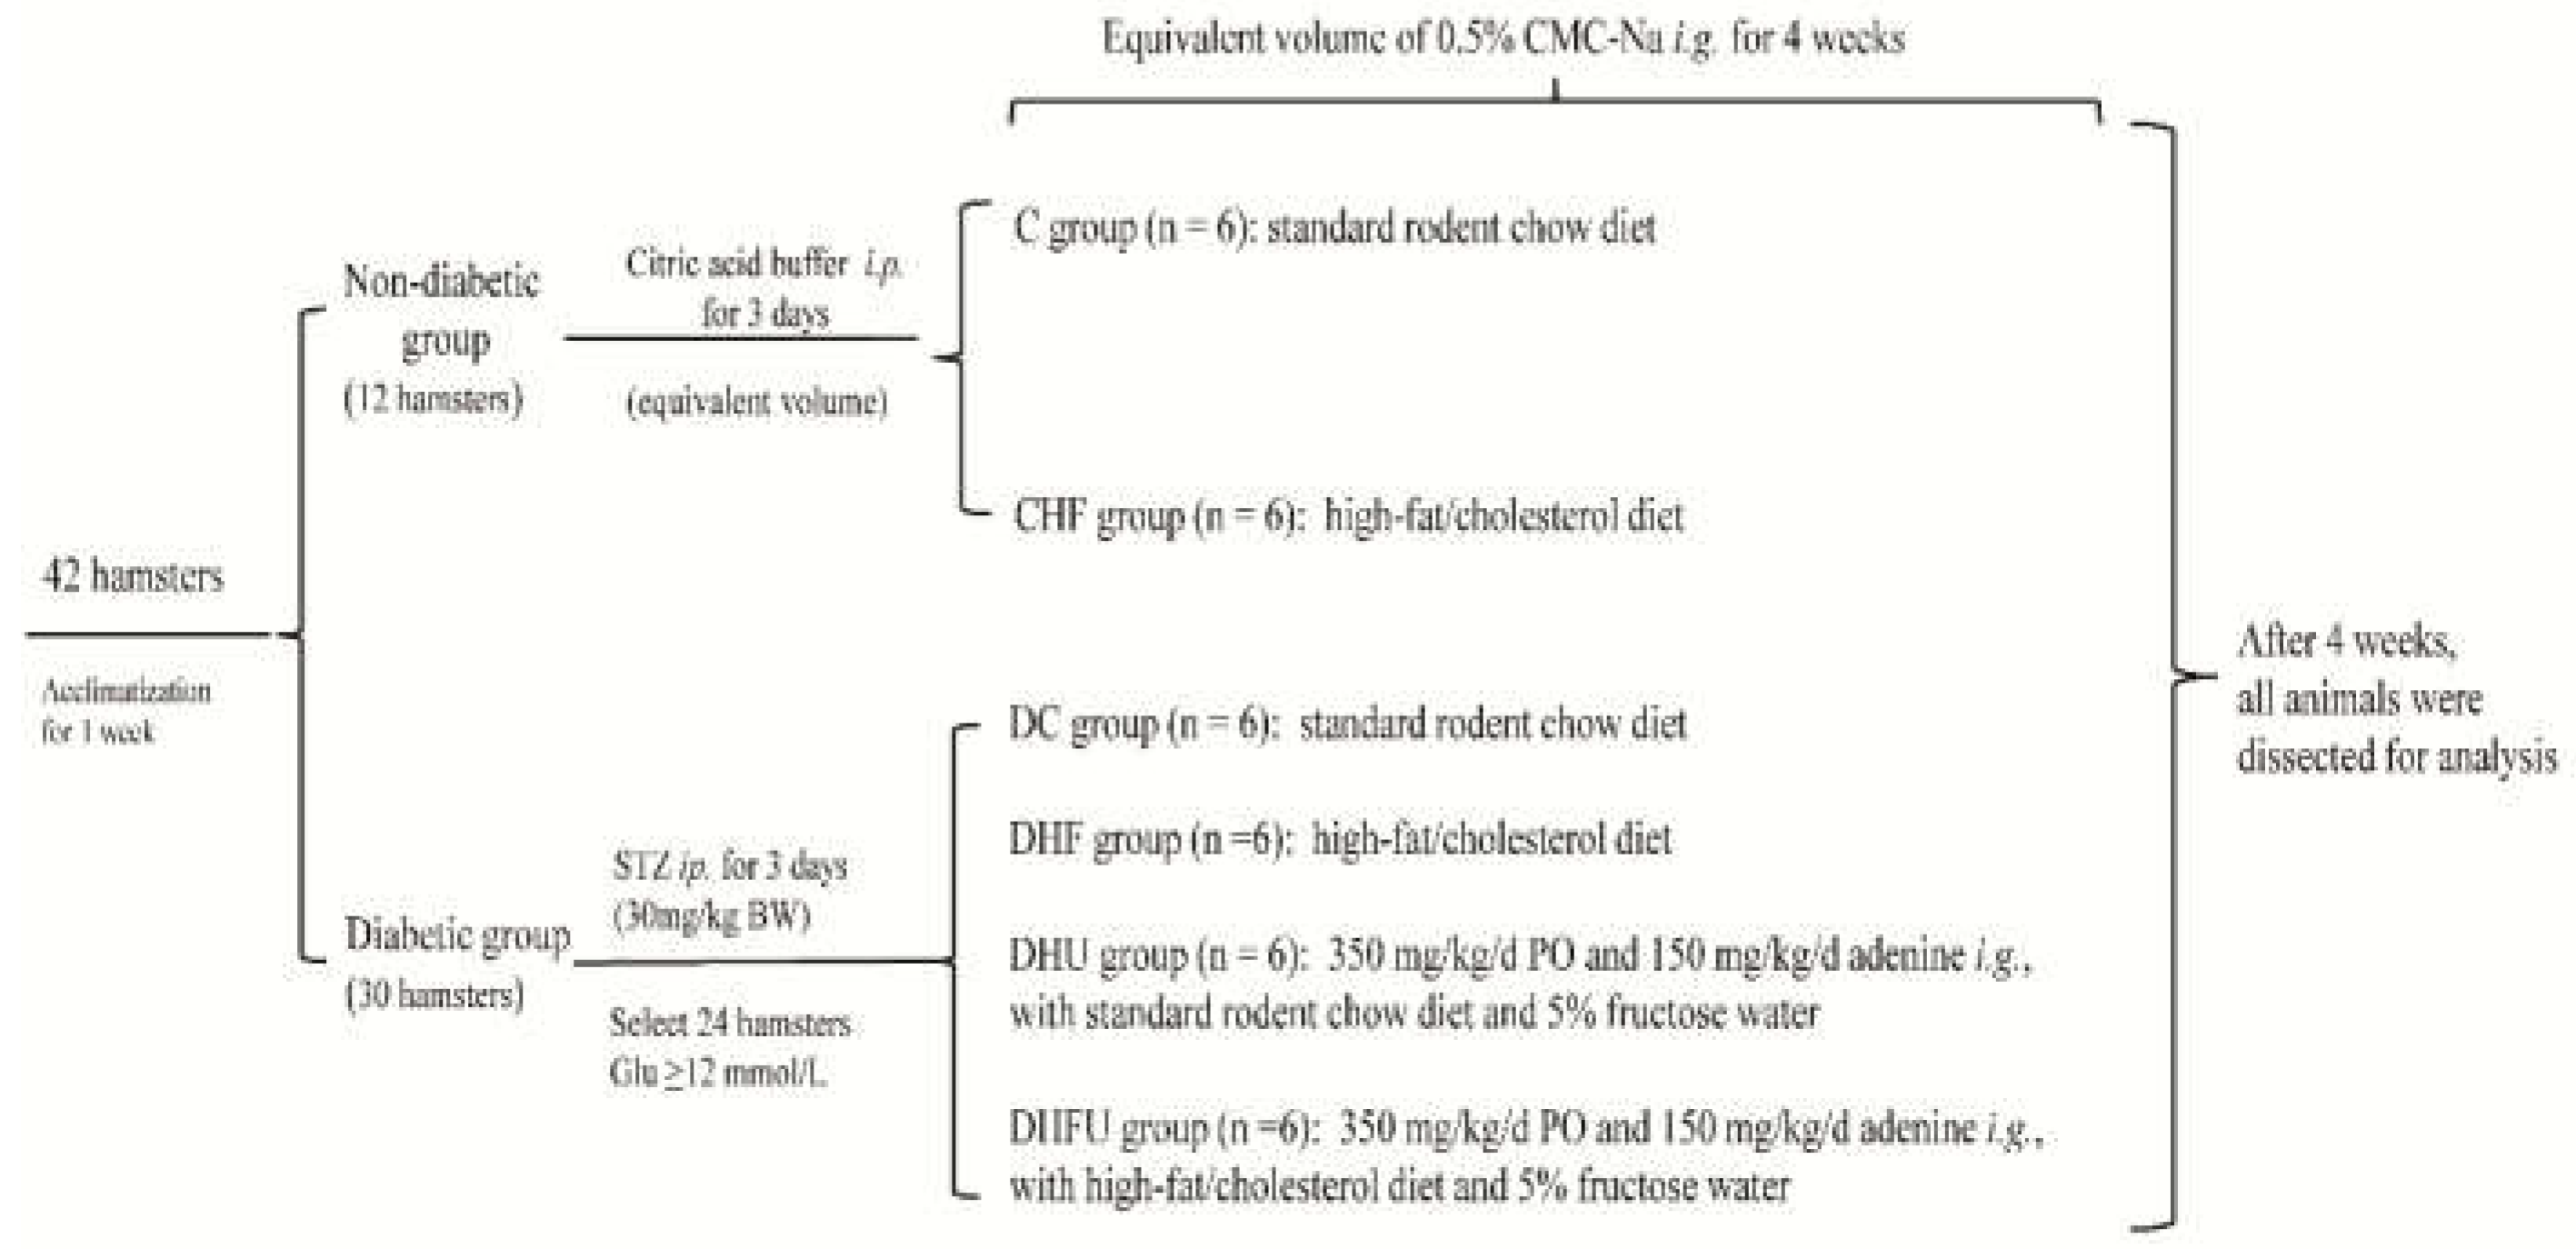
Figure 2.
Serum levels of glucose (A), insulin (B), uric acid (C), TG(D) and TC (E) in the different groups (n=6). * p < 0.05, ** p < 0.01.
Figure 2.
Serum levels of glucose (A), insulin (B), uric acid (C), TG(D) and TC (E) in the different groups (n=6). * p < 0.05, ** p < 0.01.
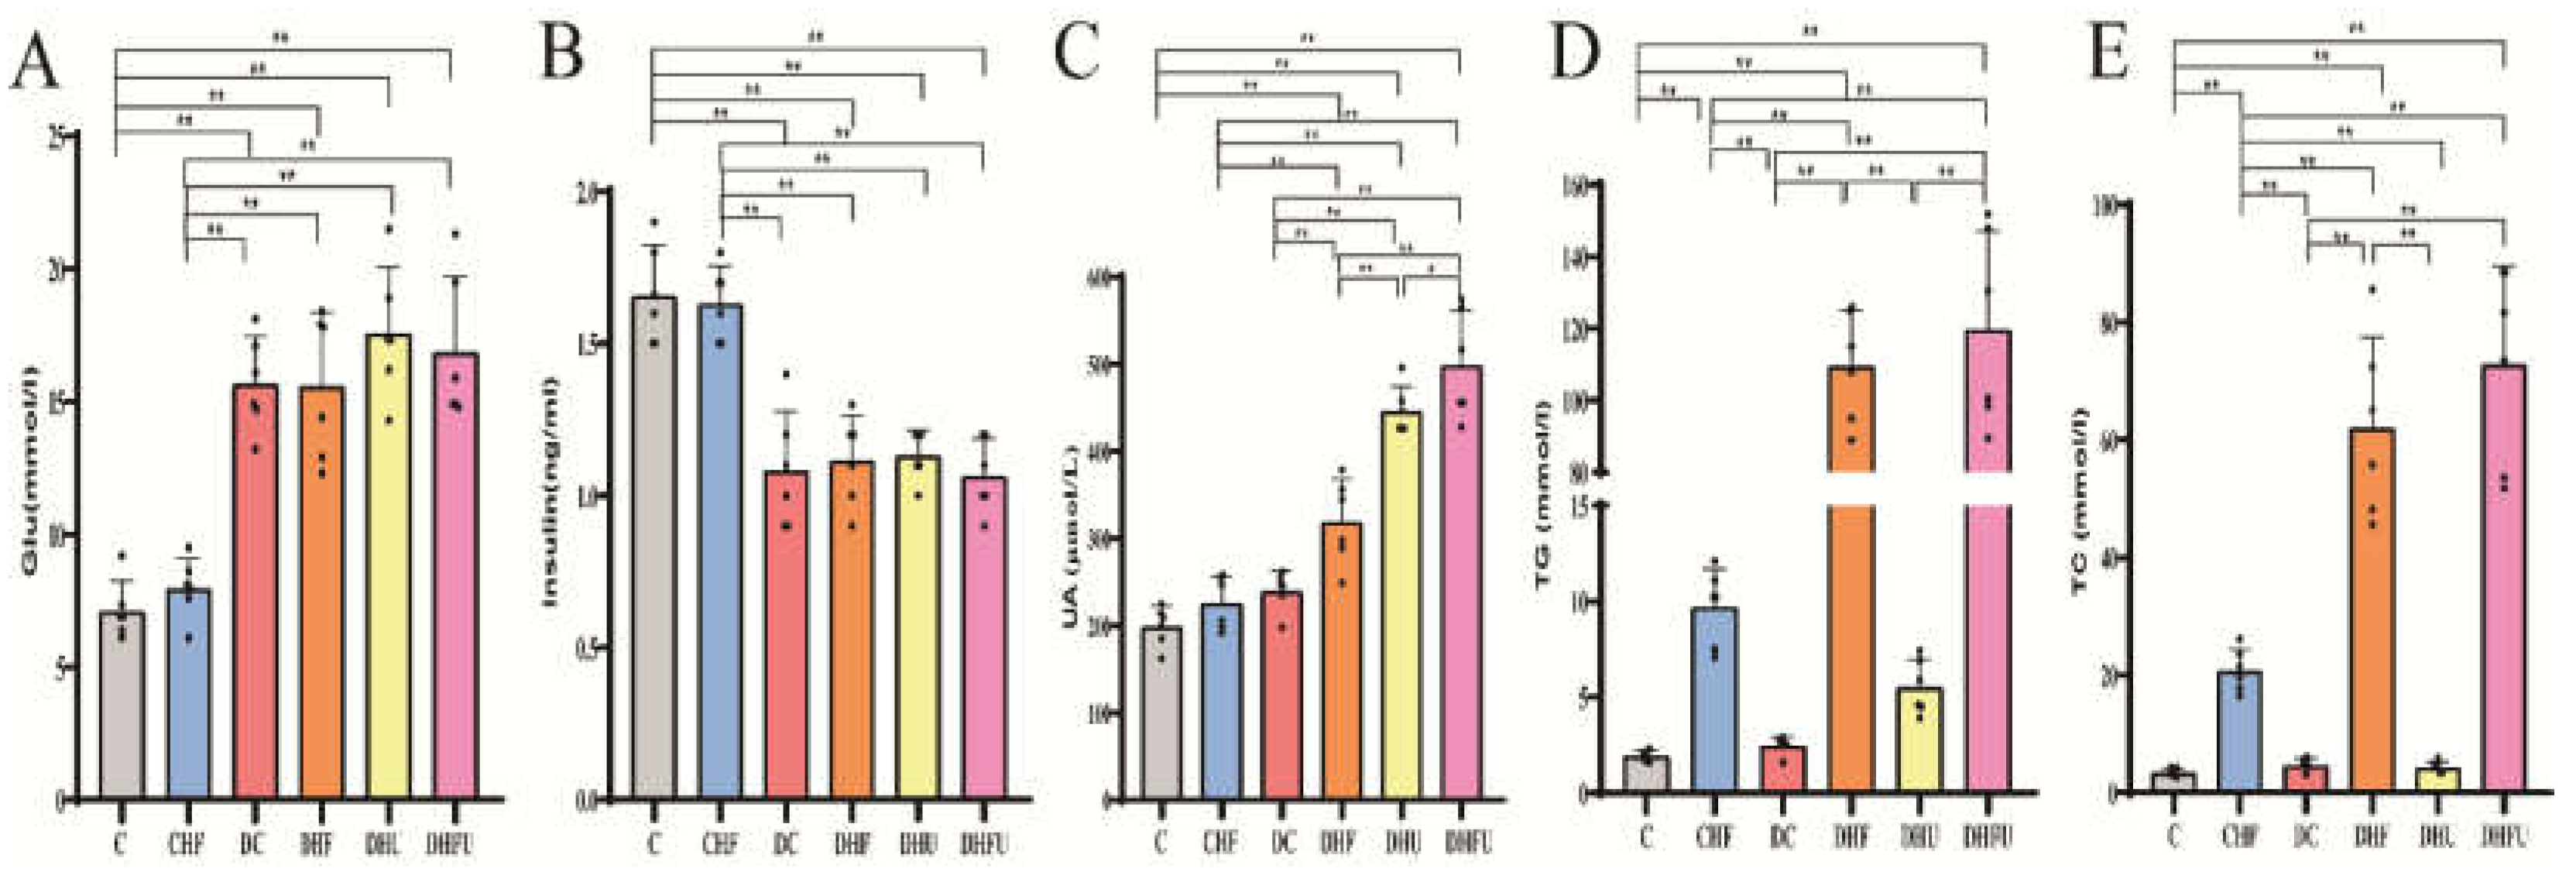
Figure 3.
BW (A), kidney index (B), and liver index (C) of the different groups tested after drug administration (n=6). *p < 0.05, **p < 0.01.
Figure 3.
BW (A), kidney index (B), and liver index (C) of the different groups tested after drug administration (n=6). *p < 0.05, **p < 0.01.
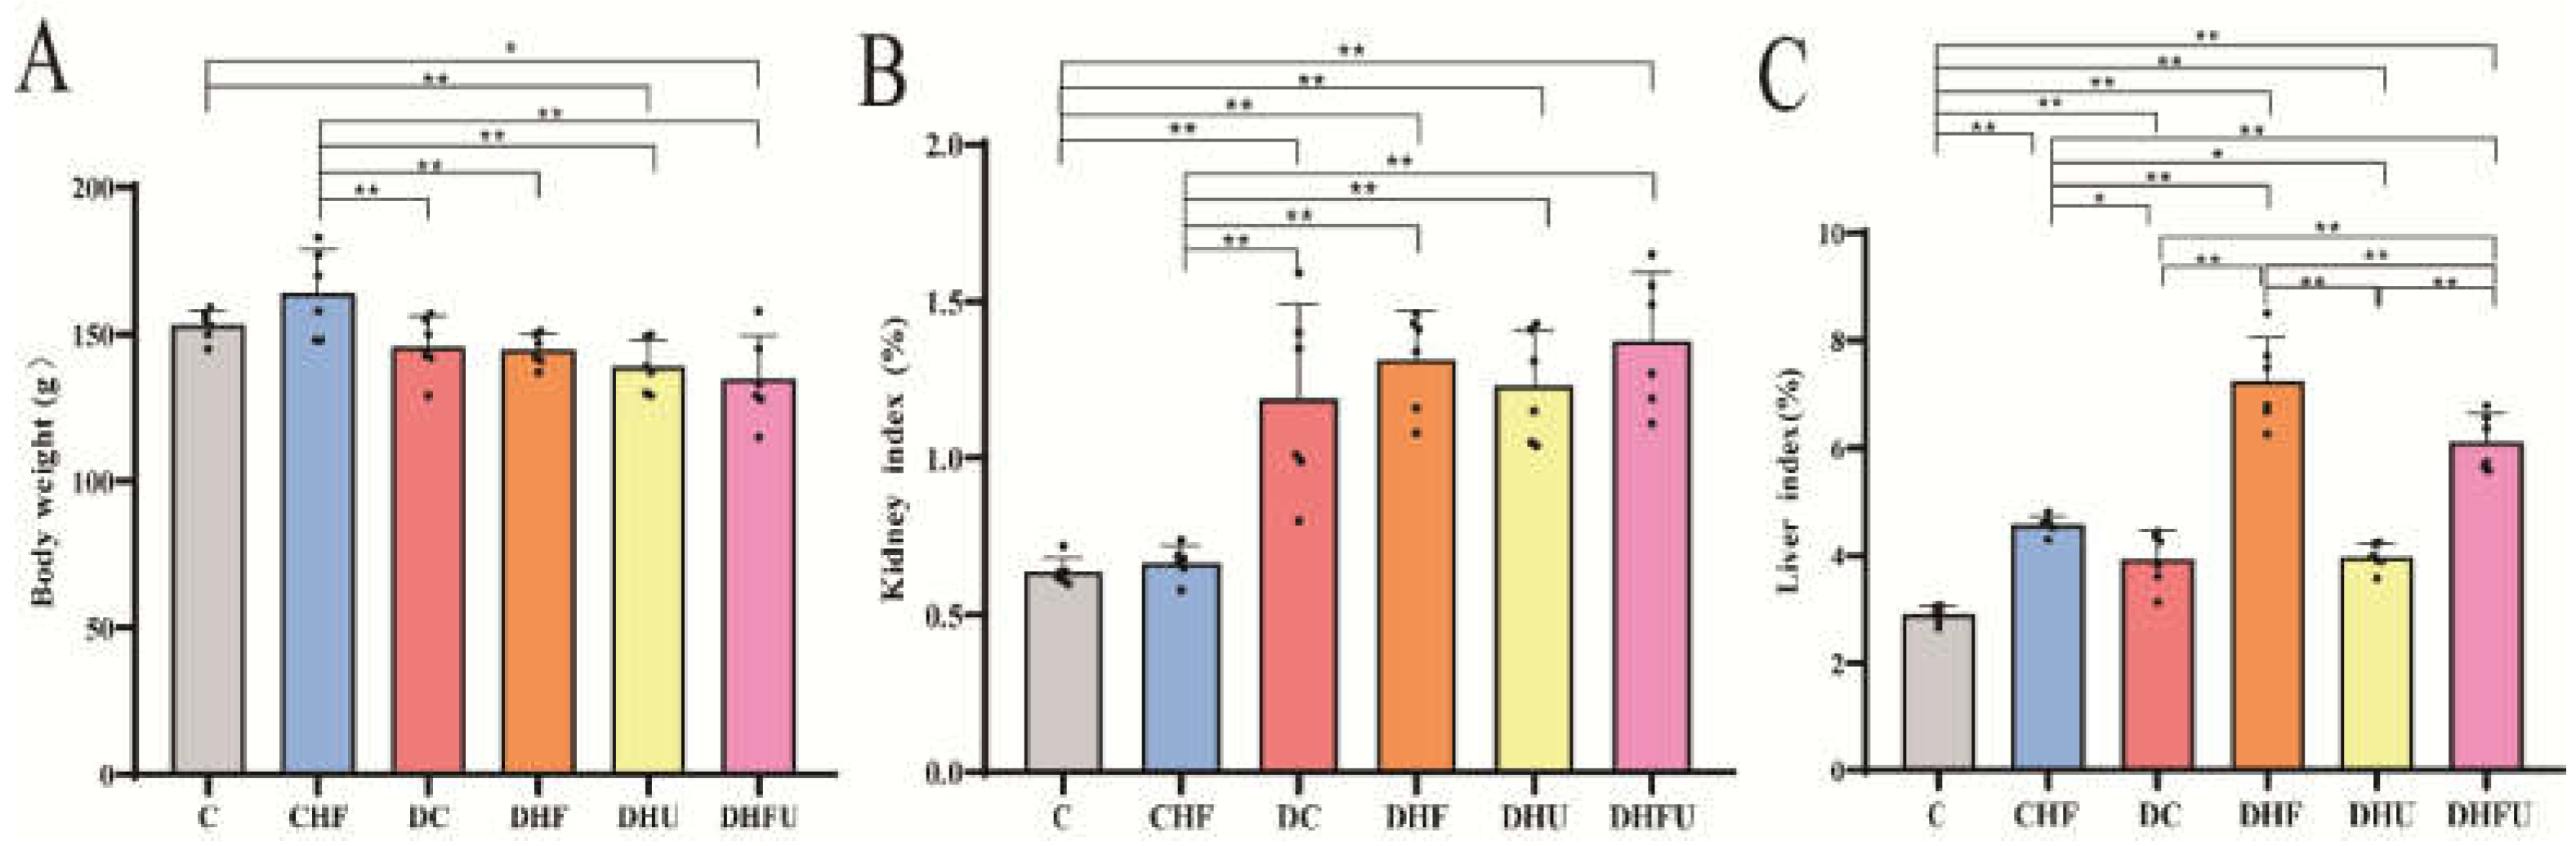
Figure 4.
CRE (A), BUN (B), ALT (C), AST (D), and ALP (E) levels in the different groups after drug administration (n=6). *p < 0.05, **p < 0.01.
Figure 4.
CRE (A), BUN (B), ALT (C), AST (D), and ALP (E) levels in the different groups after drug administration (n=6). *p < 0.05, **p < 0.01.
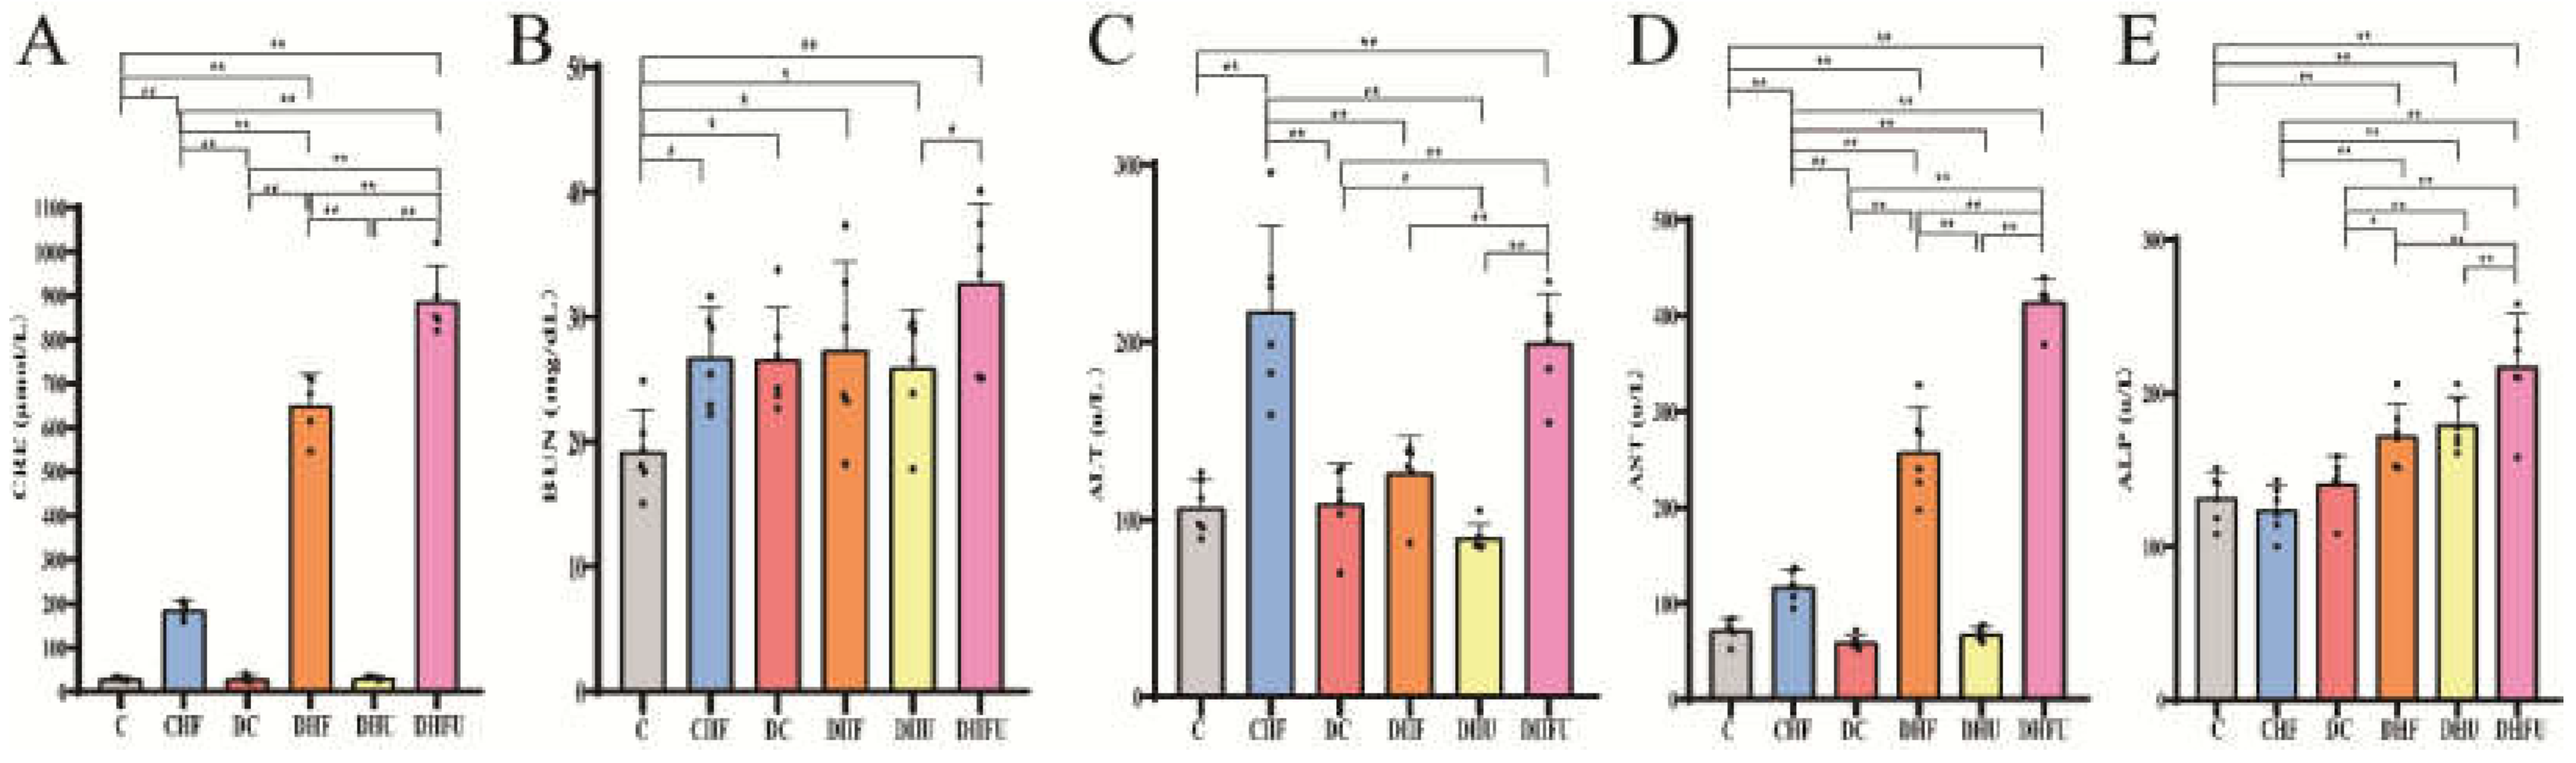
Figure 5.
XOD(A), T-SOD (B), MDA (C) and GSH-PX (D) of the different groups tested after drug administration (n=6) . *p < 0.05, **p < 0.01.
Figure 5.
XOD(A), T-SOD (B), MDA (C) and GSH-PX (D) of the different groups tested after drug administration (n=6) . *p < 0.05, **p < 0.01.
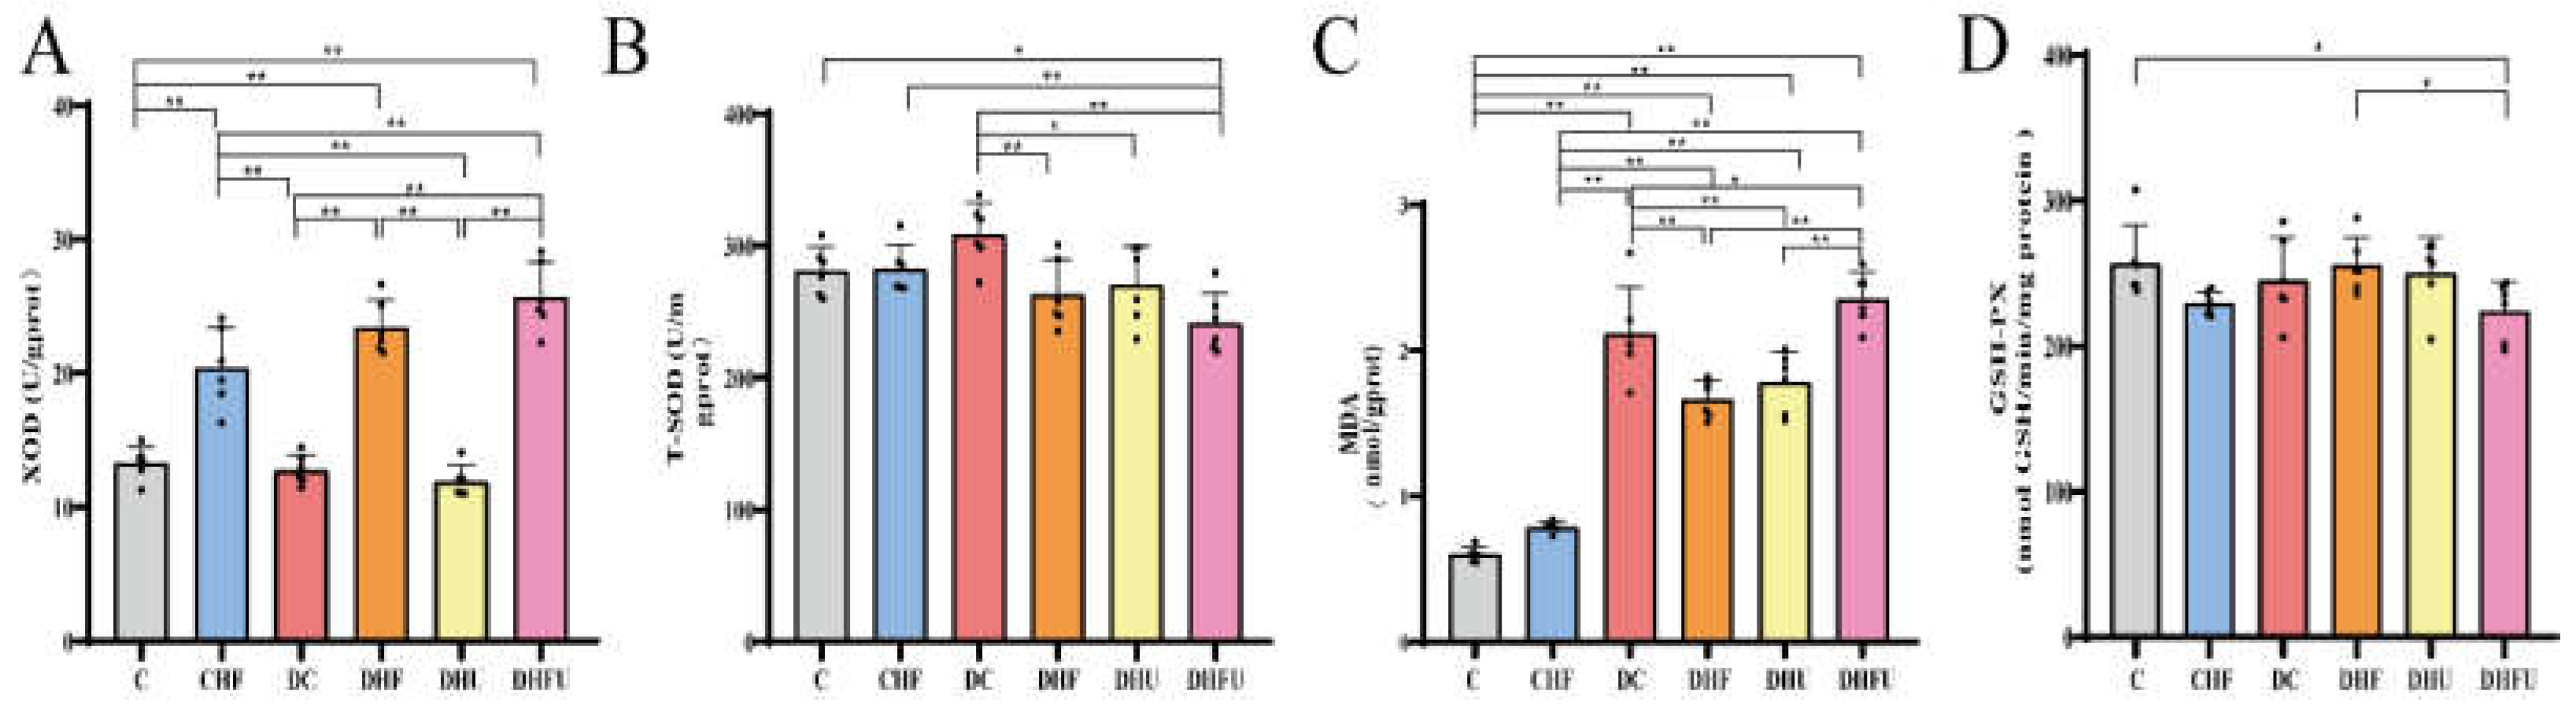
Figure 6.
Microscopic observation of the kidney using PAS staining (A, 400X) and H&E staining (B, 200X). Note: black arrows indicate glomerular mesangial cells and mesangial matrix proliferation, black stars indicate renal tubular dilatationand casts, and blue arrows indicate urate deposition and inflammatory cell infiltration.
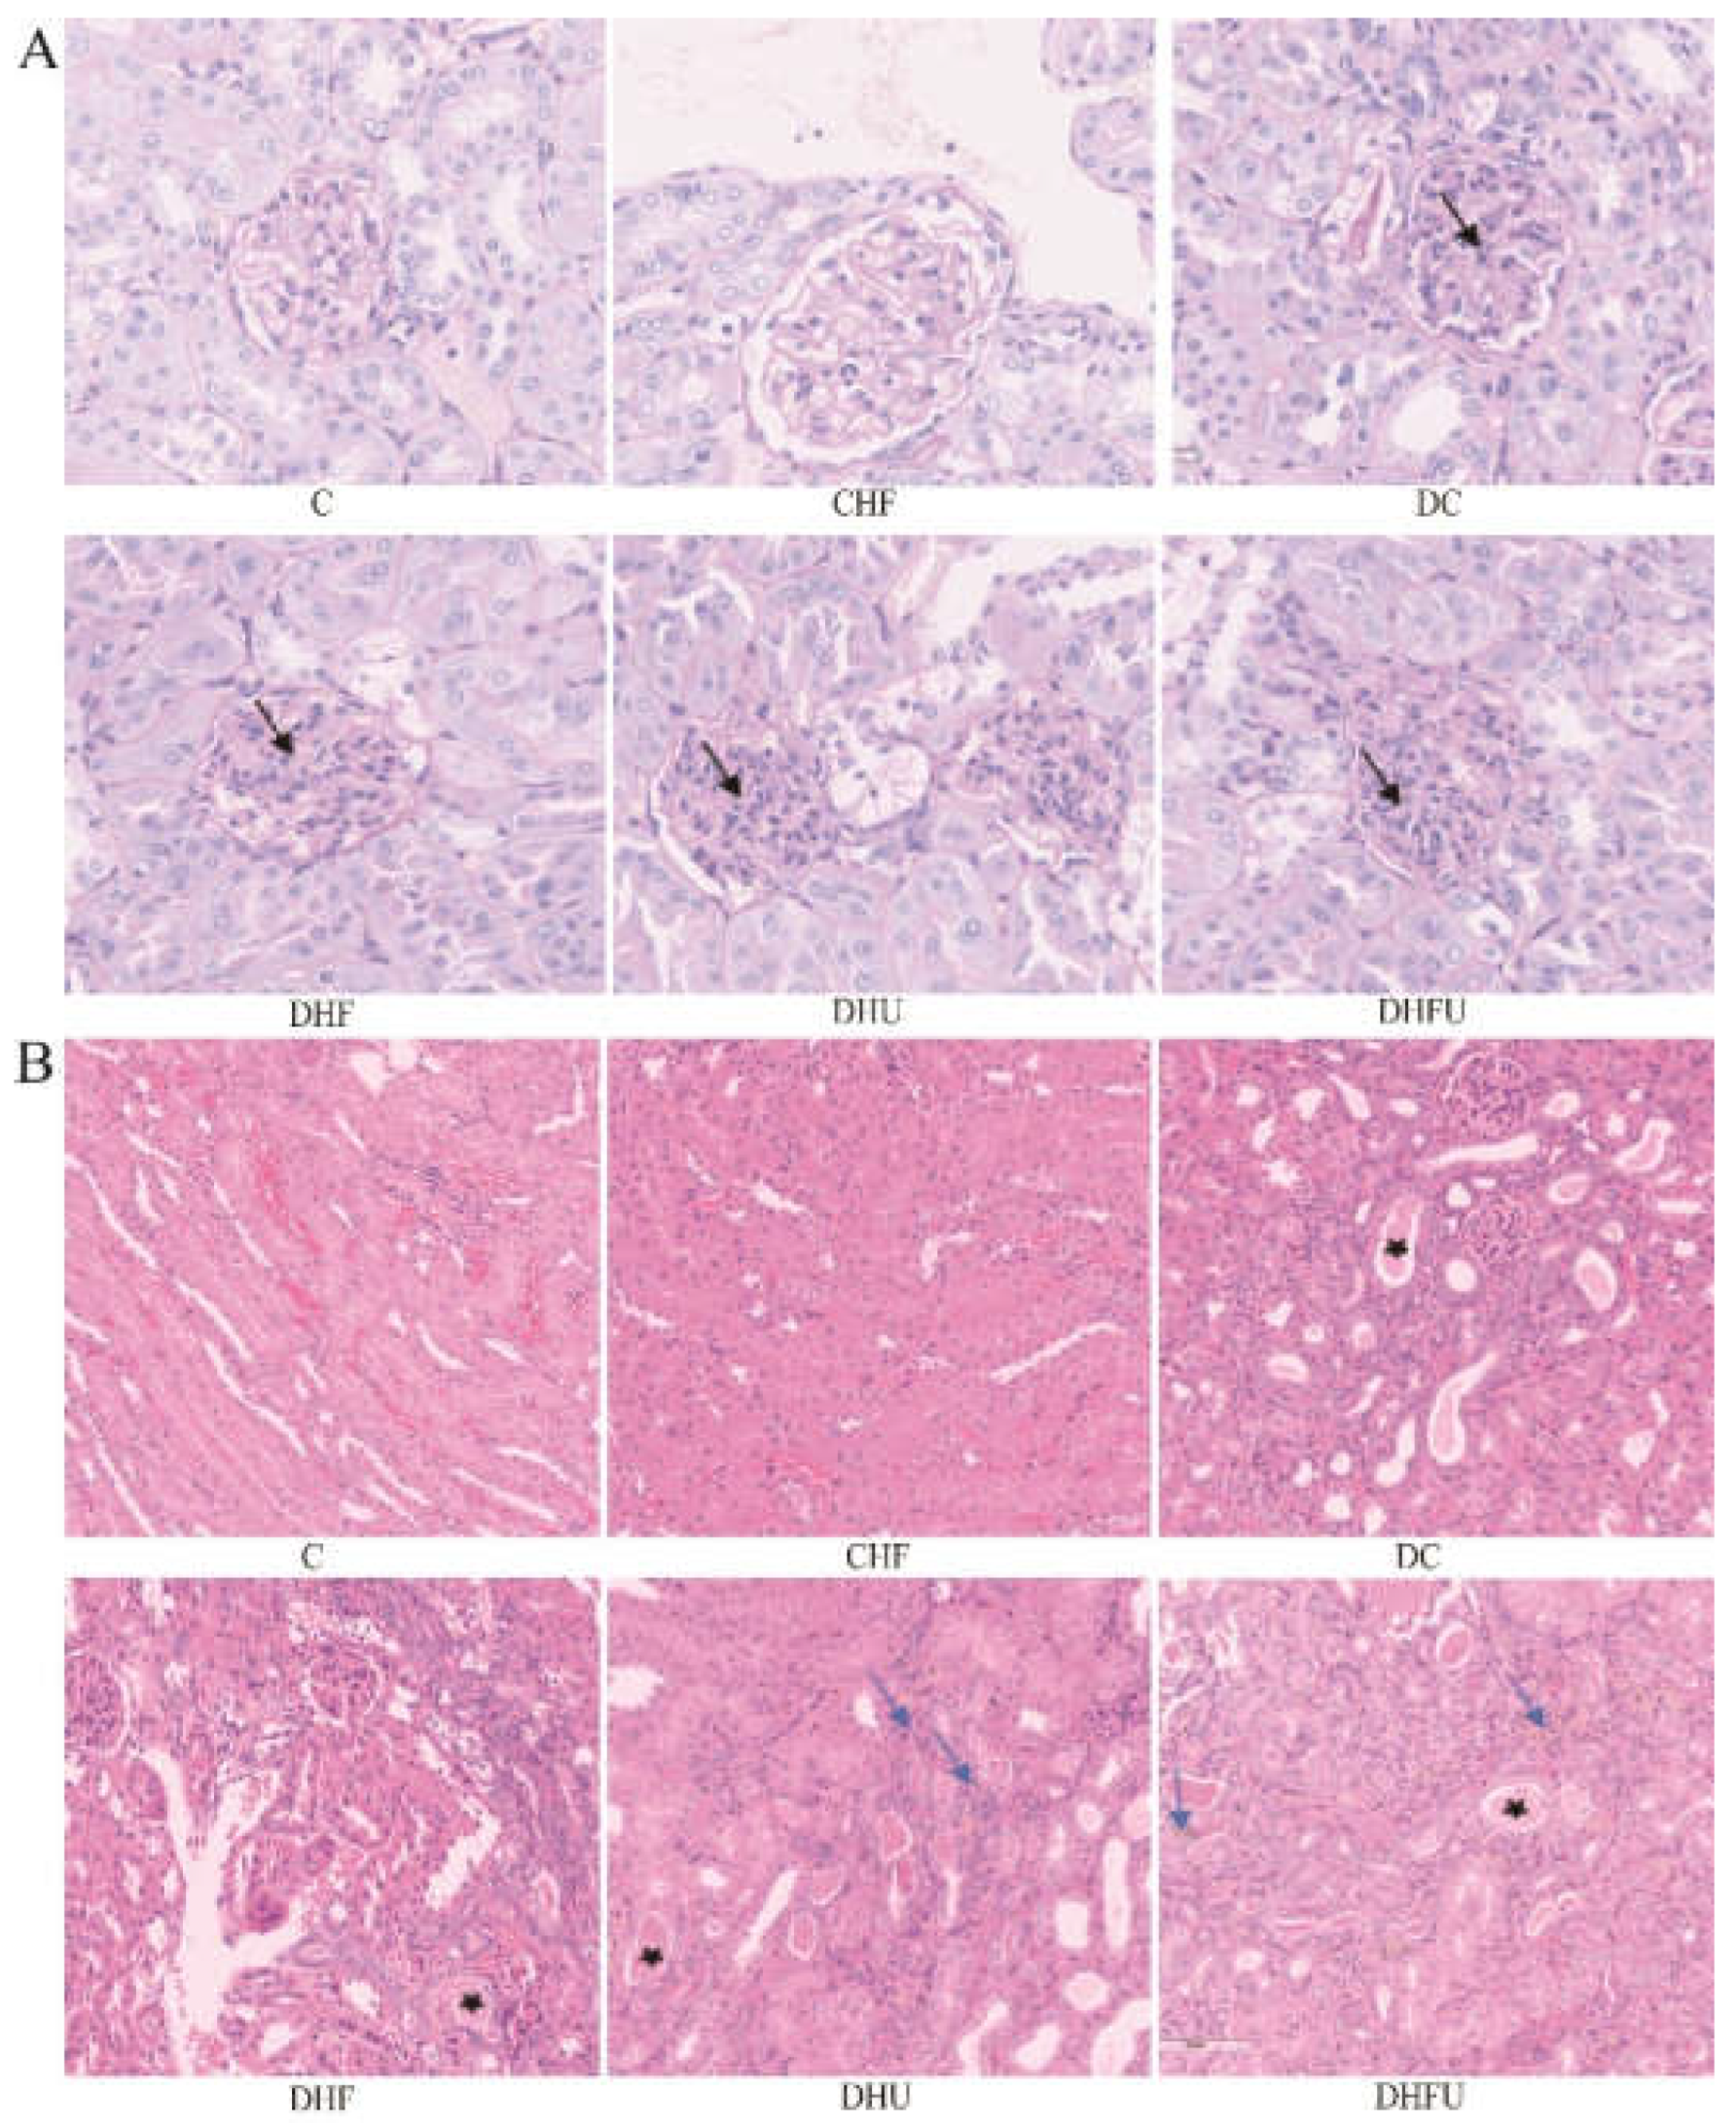
Figure 7.
Effects of high UA on renal injury-related gene expression (n=6). *p < 0.05, **p < 0.01.
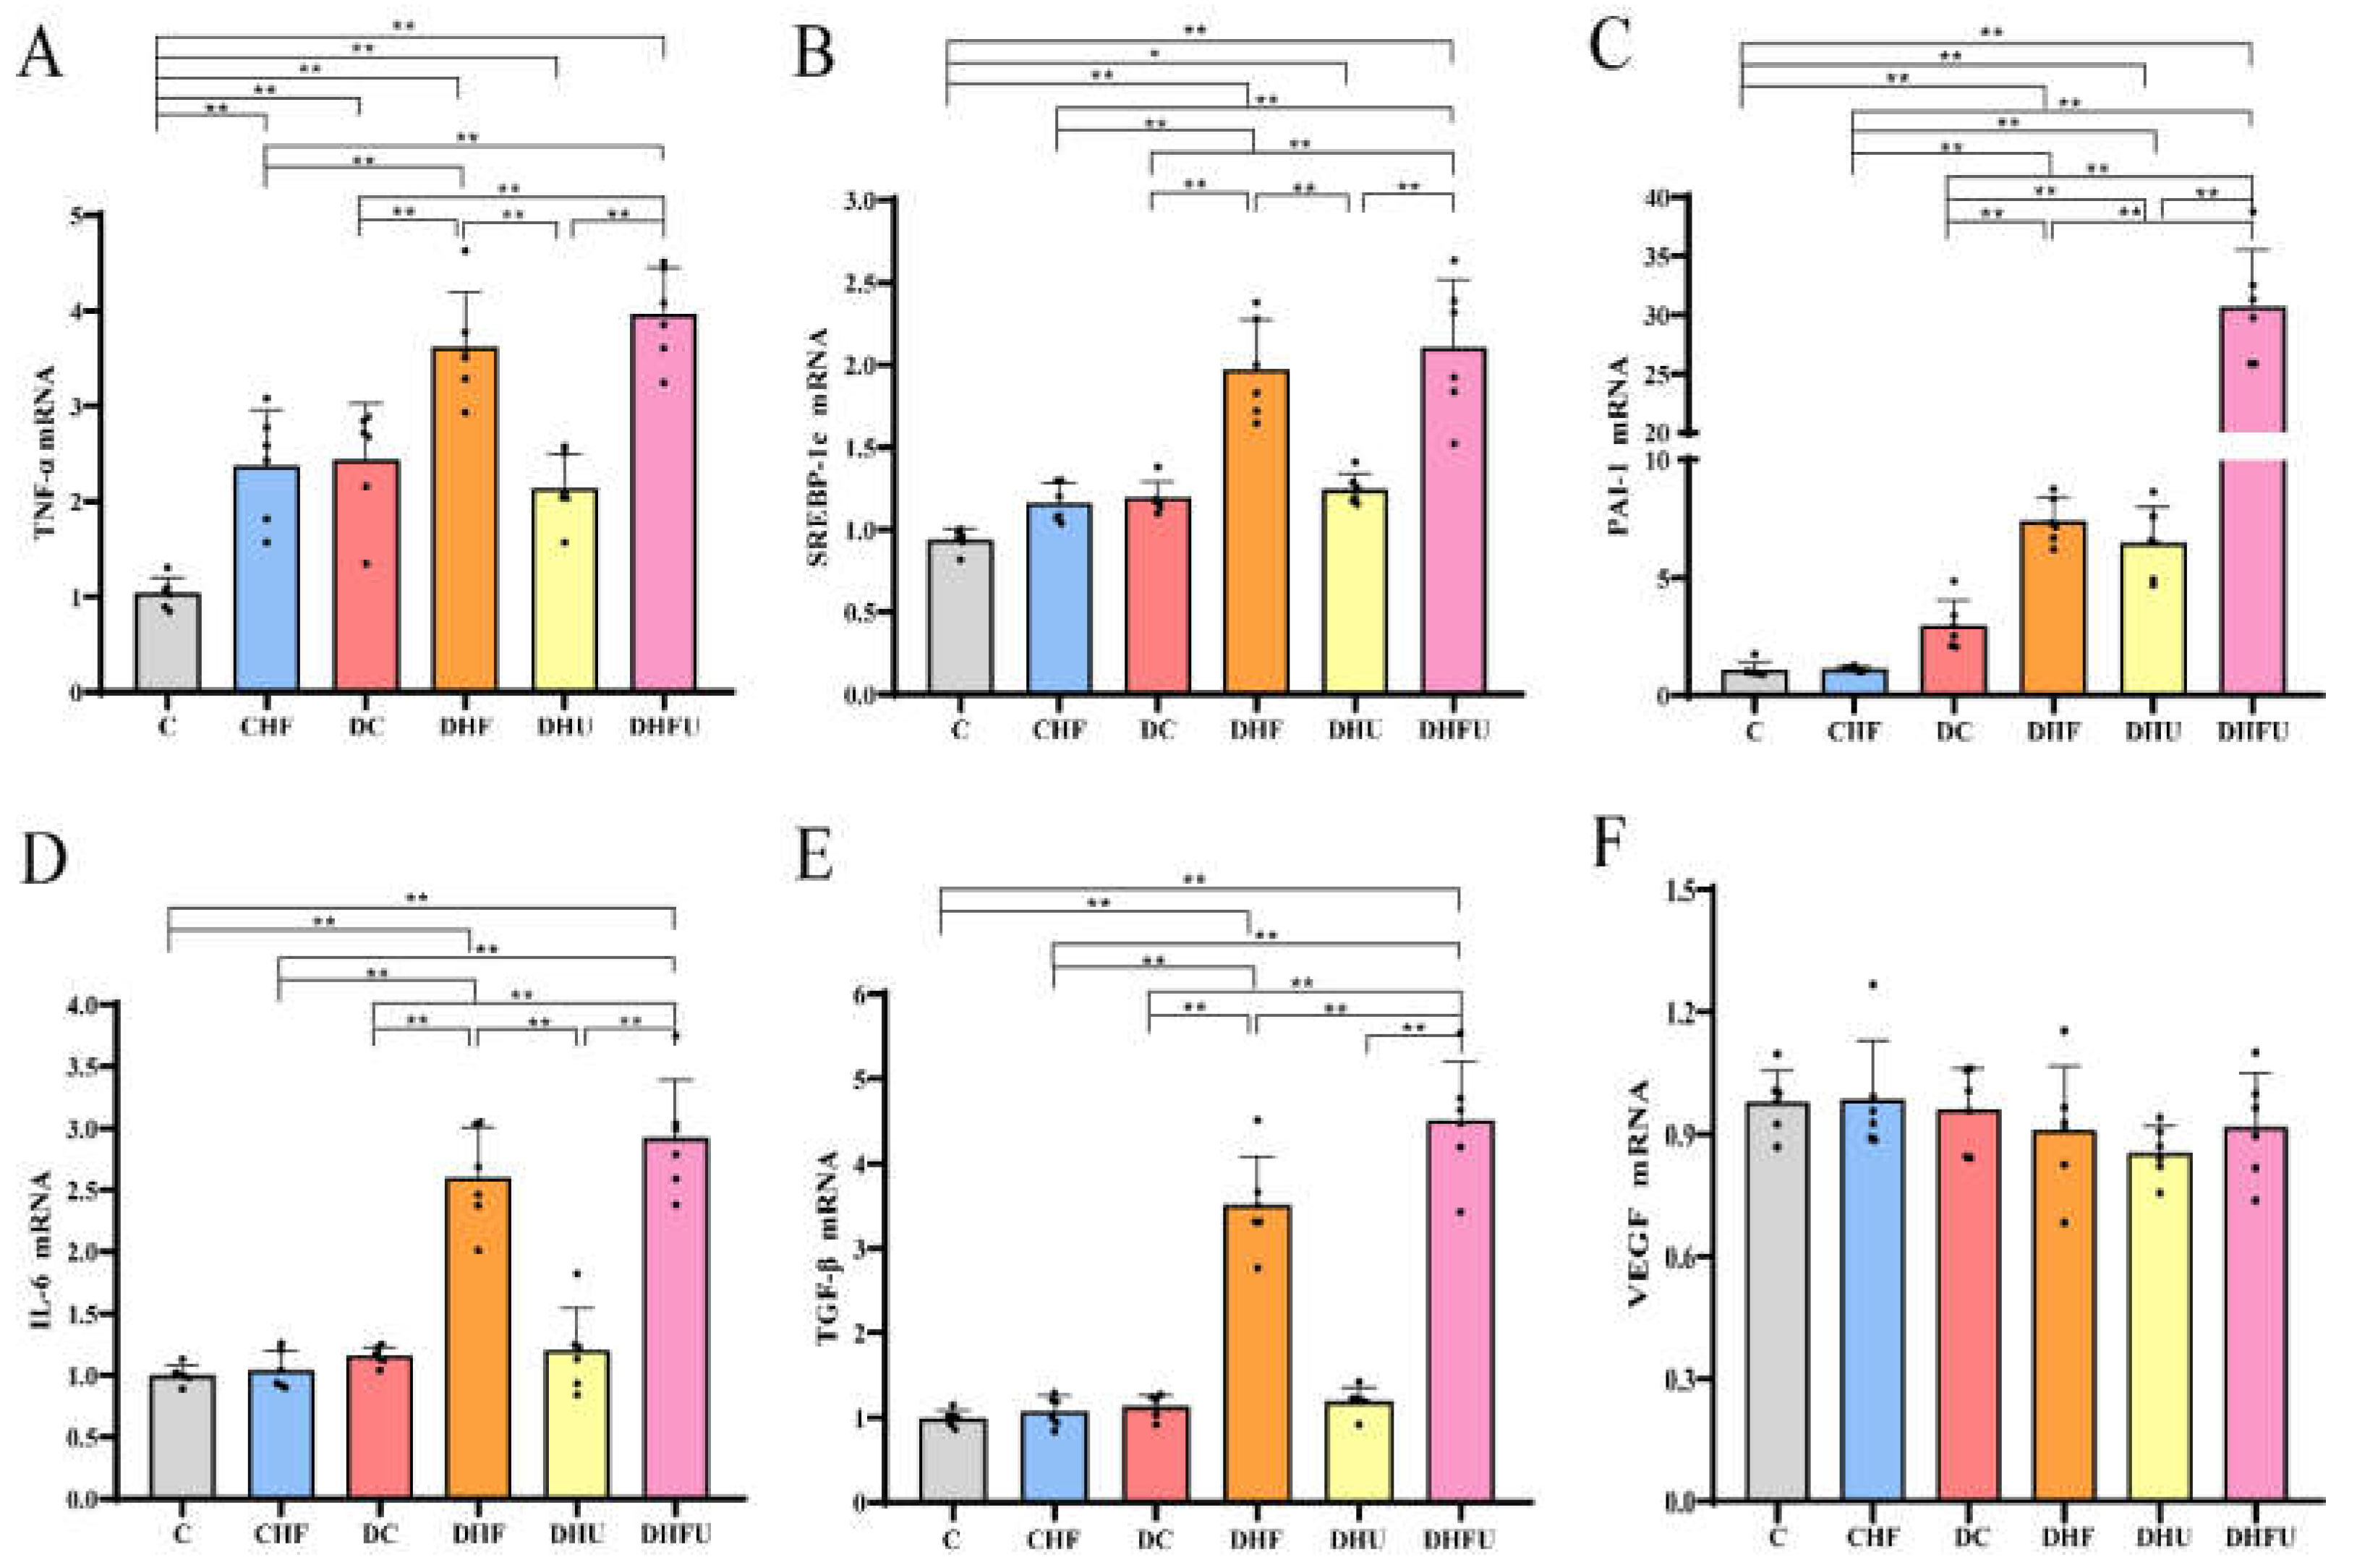
Figure 8.
Effects of high UA concentrations on fecal SCFA levels in diabetic hamsters. (n=6). *p < 0.05, **p < 0.01.
Figure 8.
Effects of high UA concentrations on fecal SCFA levels in diabetic hamsters. (n=6). *p < 0.05, **p < 0.01.
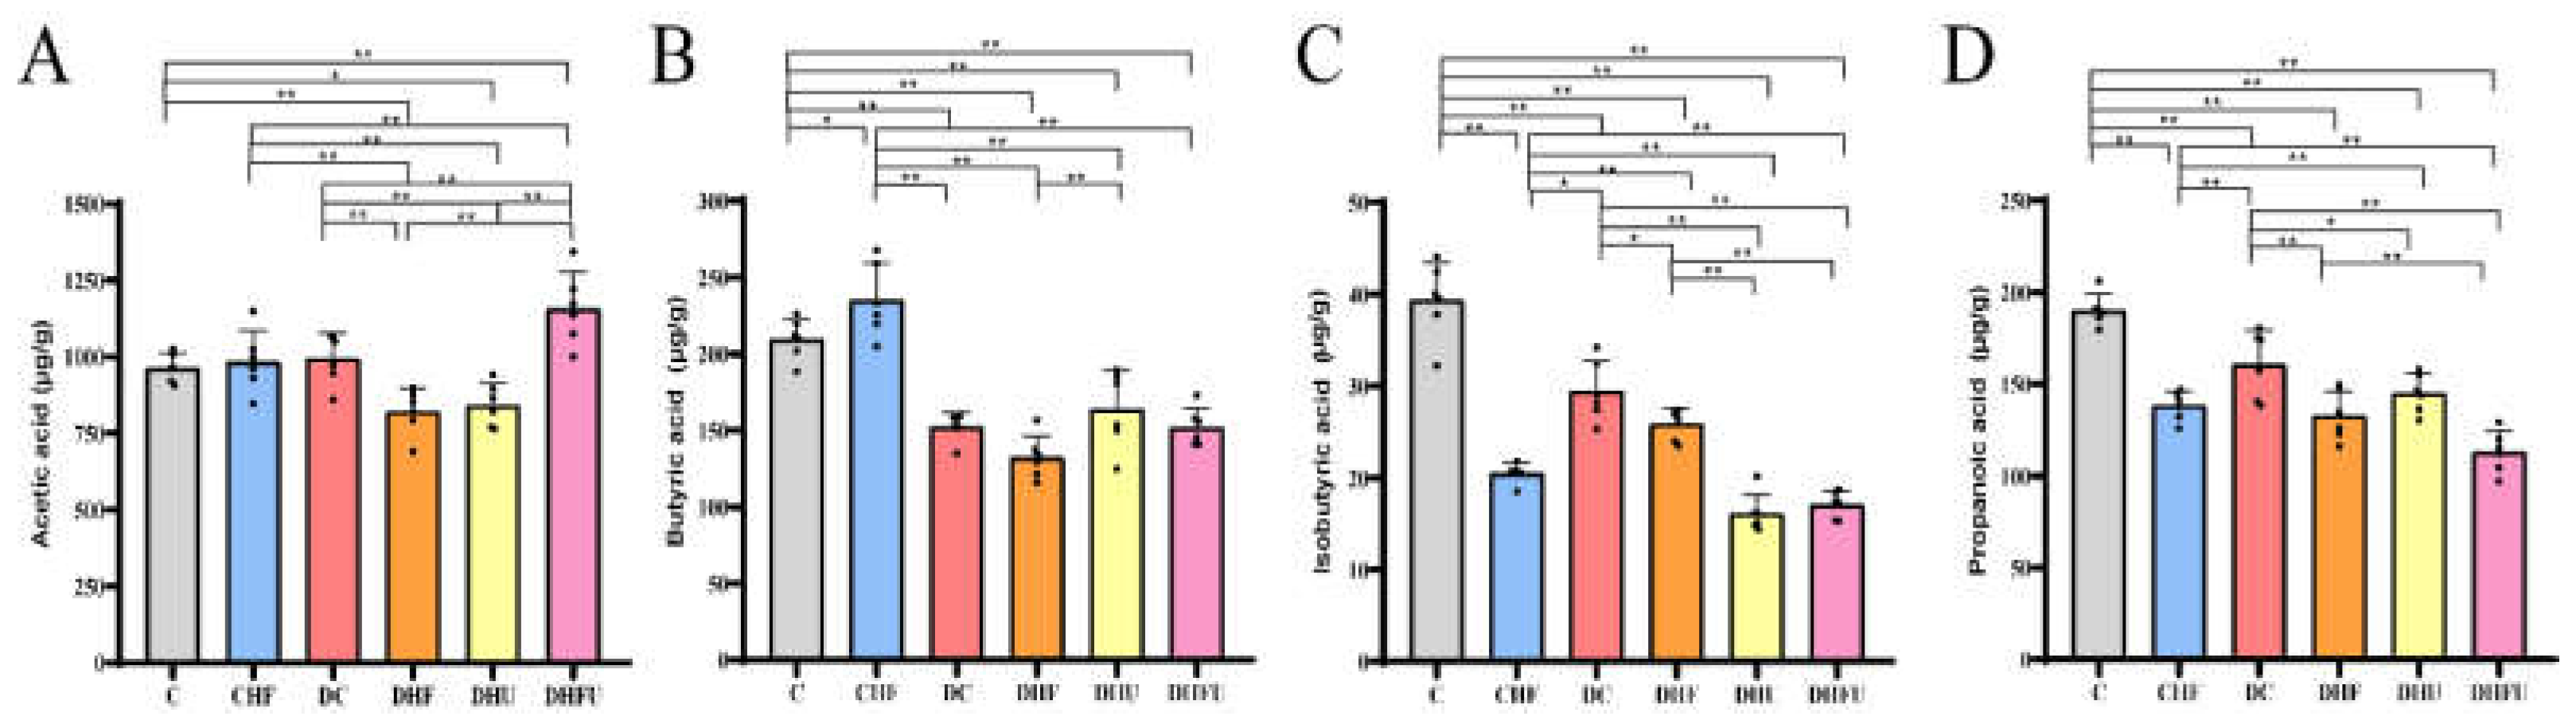
Figure 9.
Effects of high UA concentrations on gut microbiota diversity in hamsters. (A) Chao index, (B) Shannon index, (C) PCoA and (D) NMDS. *P < 0.05.
Figure 9.
Effects of high UA concentrations on gut microbiota diversity in hamsters. (A) Chao index, (B) Shannon index, (C) PCoA and (D) NMDS. *P < 0.05.
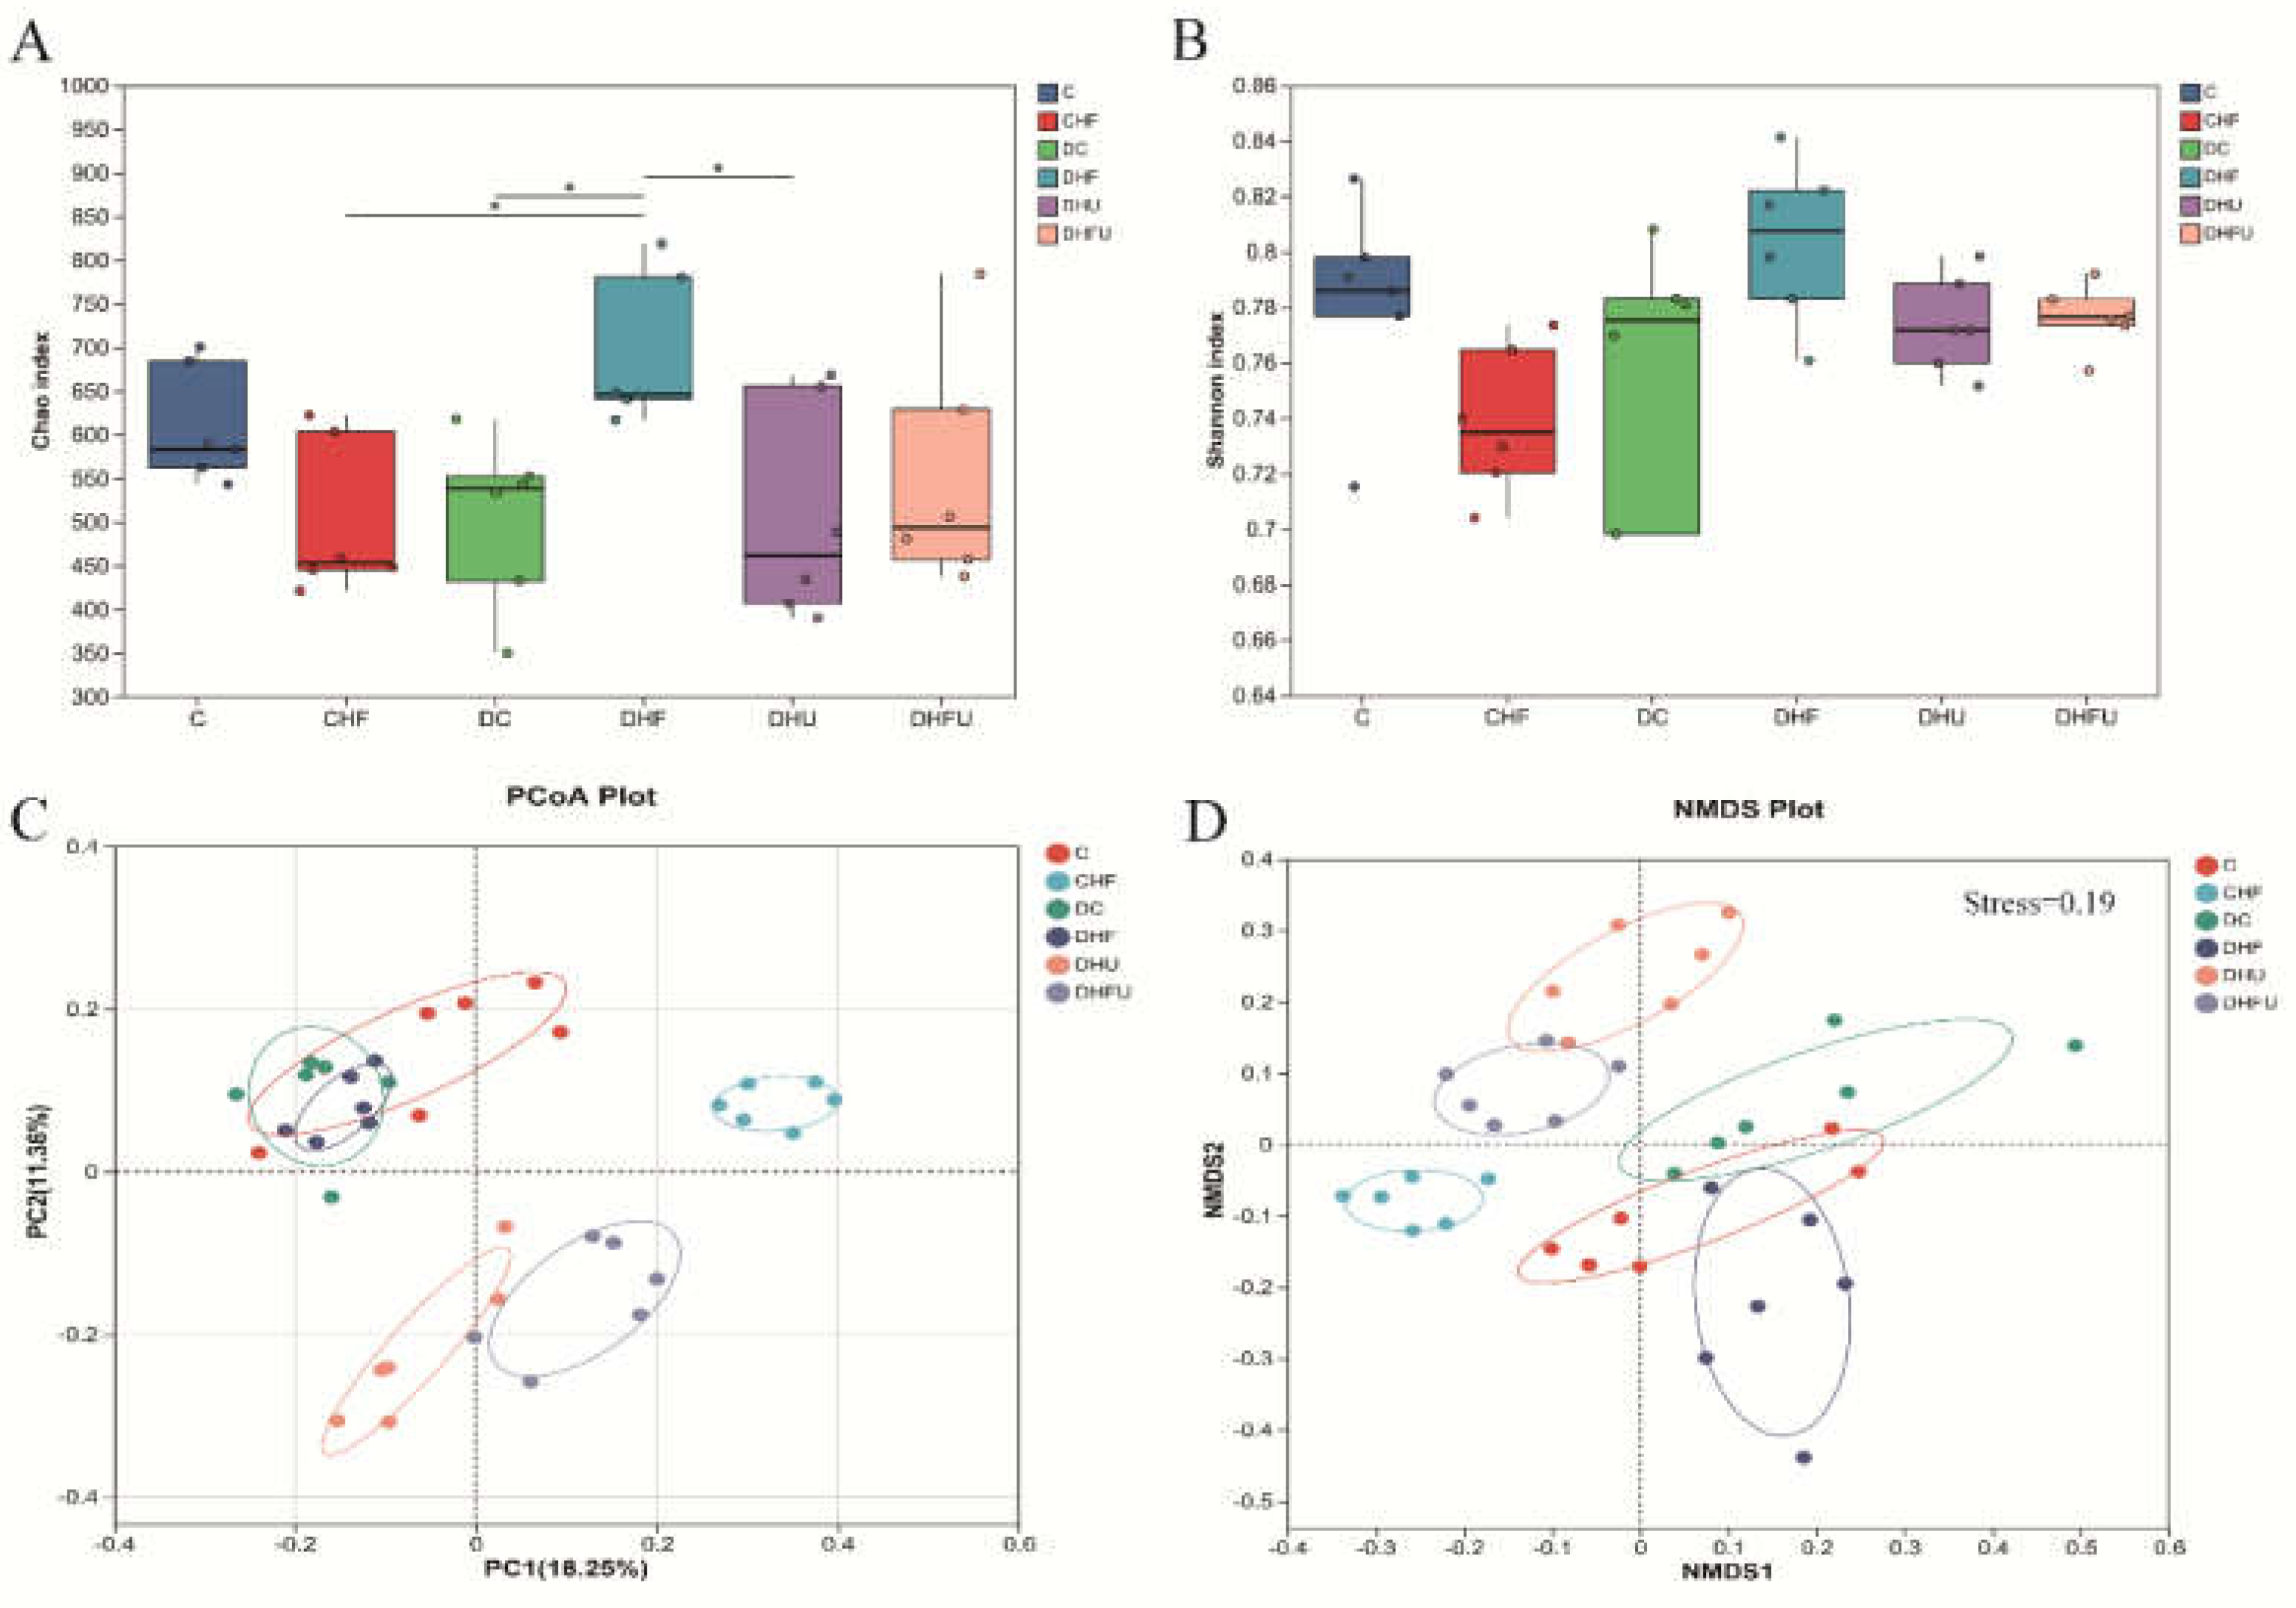
Figure 10.
Effects of high UA on the components of the gut microbiota in hamsters at the phylum level. (A) Relative abundance of the gut microbiota; differences in (B) Bacillota and (C) Bacteroidota among groups; (D) ratio of Firmicutes (Bacillota) to Bacteroidetes (Bacteroidota). *p < 0.05, **p < 0.01.
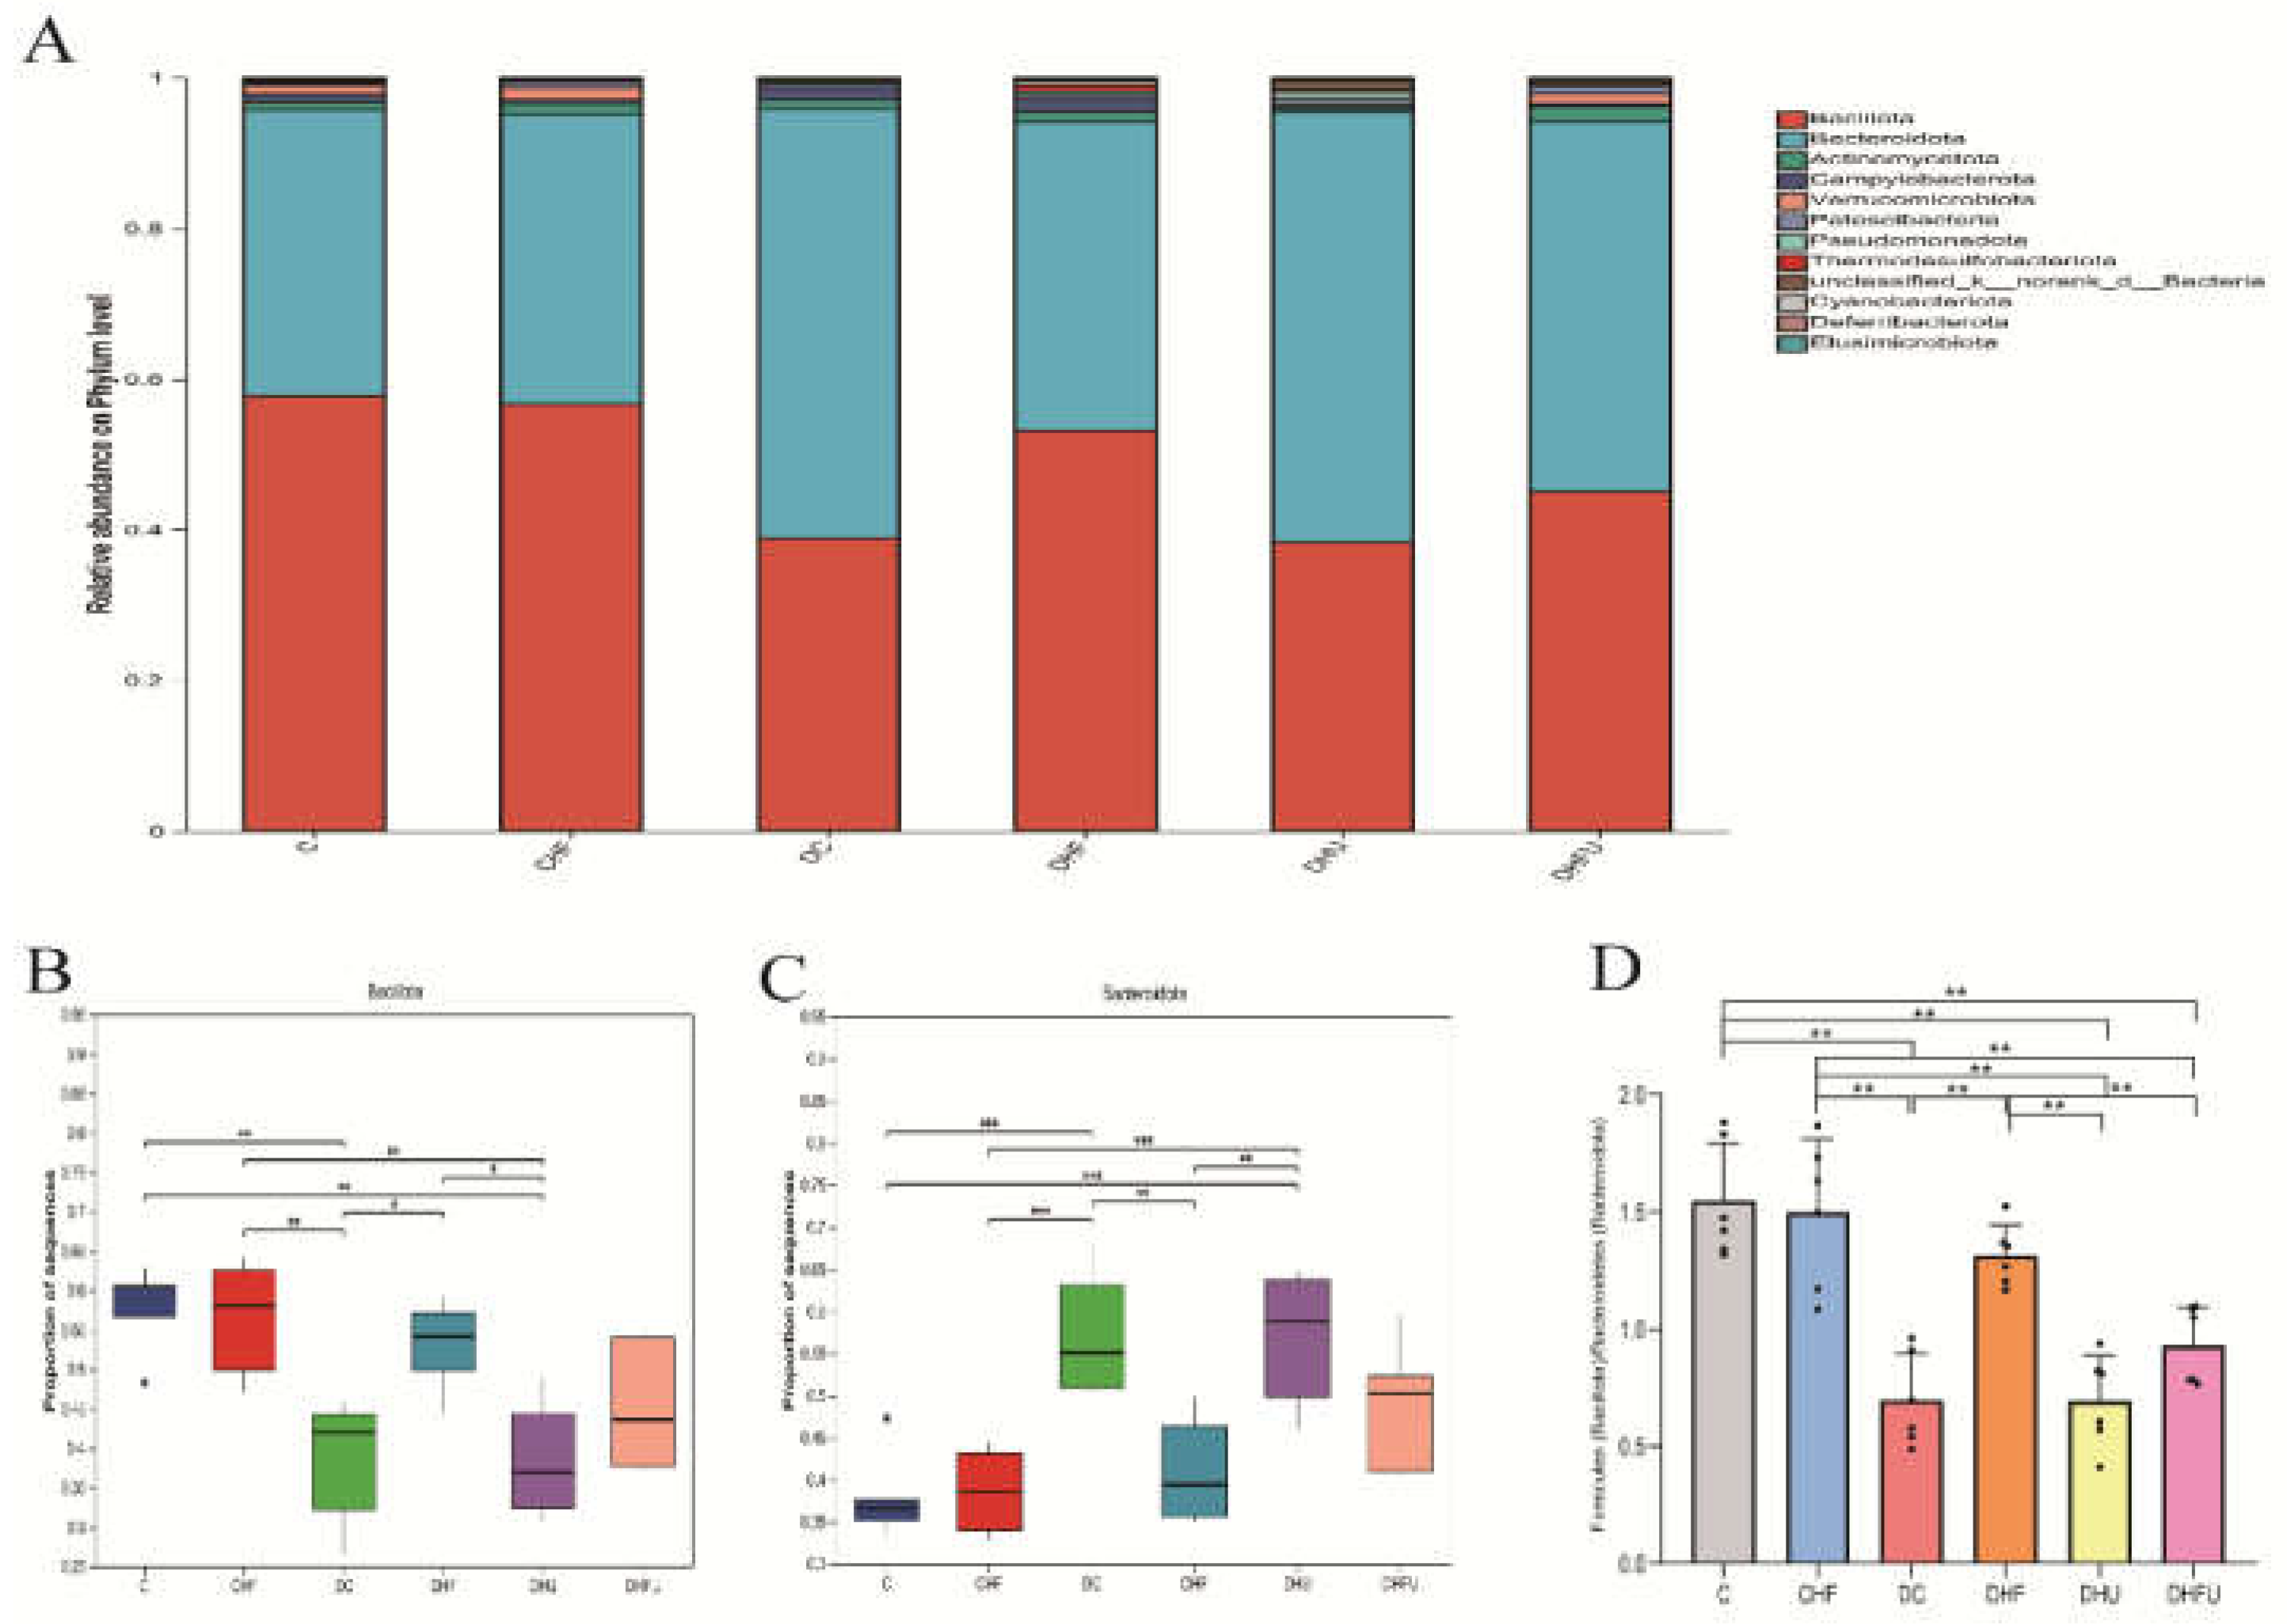
Figure 11.
Effects of high UA on the components of the gut microbiota in hamsters at the genus level. (A) Relative abundance of the gut microbiota; (B-G) Relative abundance of the top six species. *P < 0.05 and **P < 0.01.
Figure 11.
Effects of high UA on the components of the gut microbiota in hamsters at the genus level. (A) Relative abundance of the gut microbiota; (B-G) Relative abundance of the top six species. *P < 0.05 and **P < 0.01.
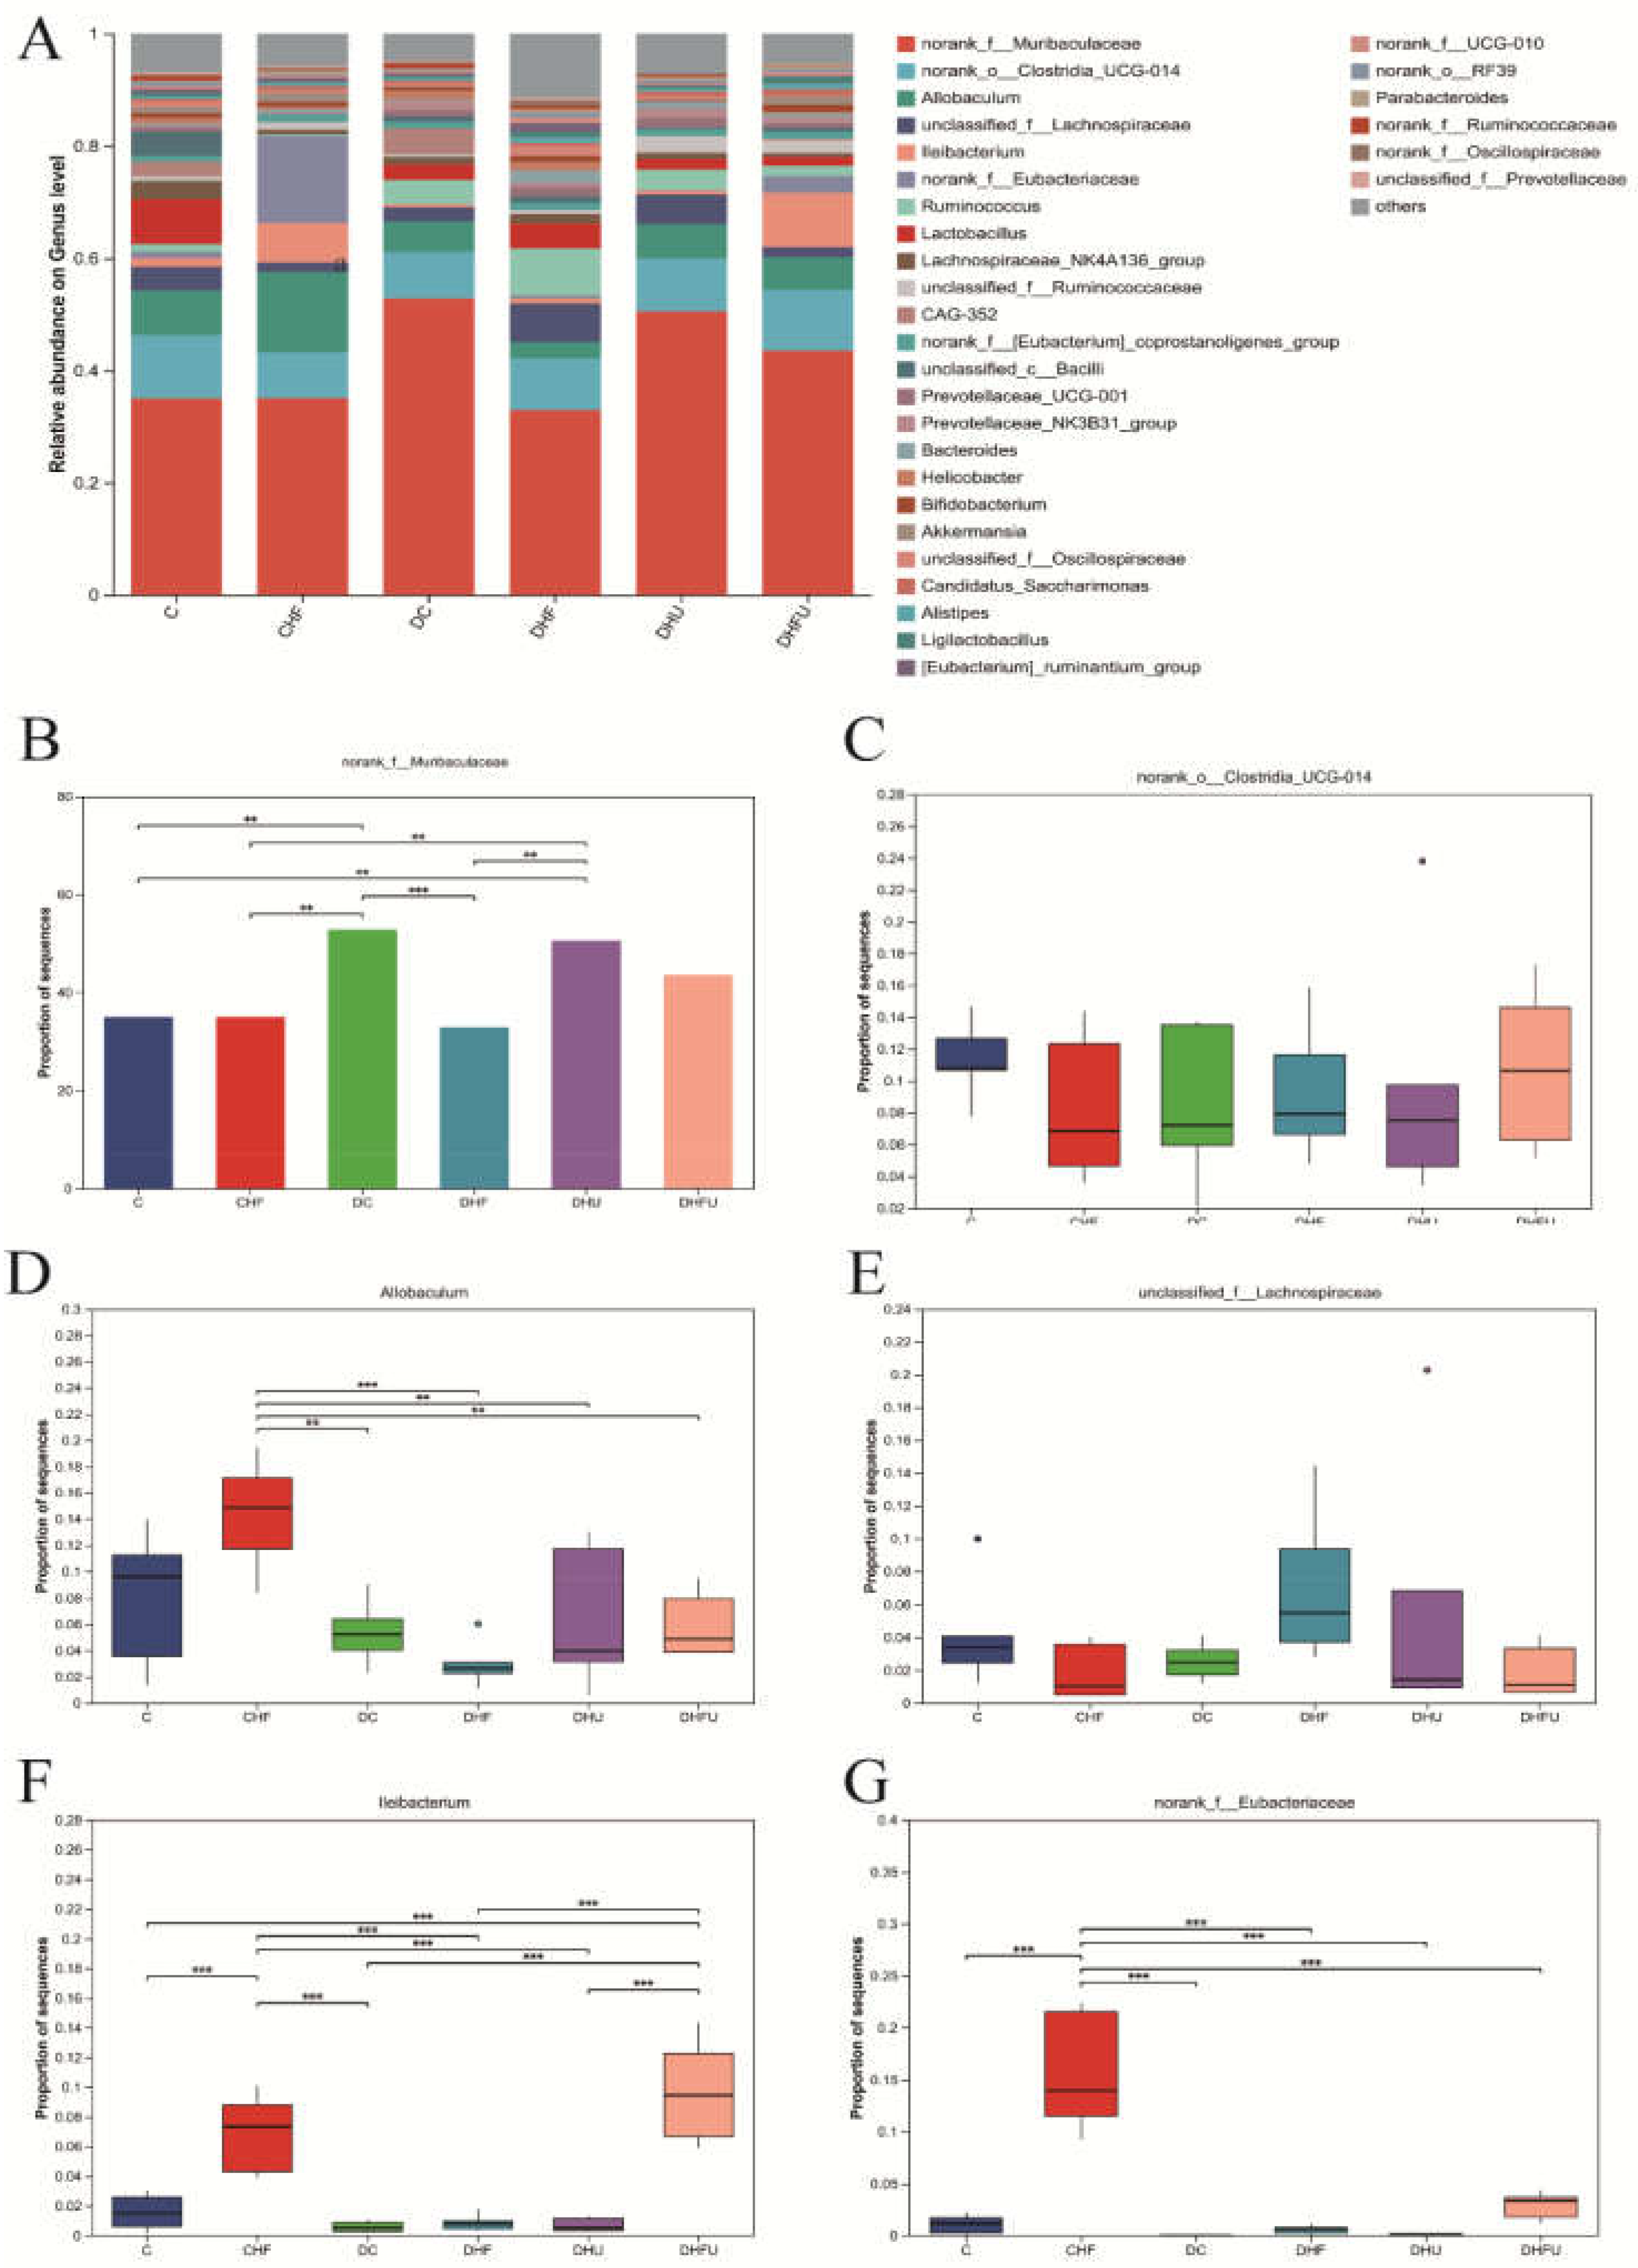
Figure 12.
LEfSe analysis and correlation analysis. (A) LDA discriminant bar graph; (B) Evolutionary branching graph; (C) Correlations between the abundance of the gut microbiota and metabolic indicators in hamsters; red-white-blue color: positive correlation-no correlation-negative correlation. *P < 0.05, **P < 0.01.
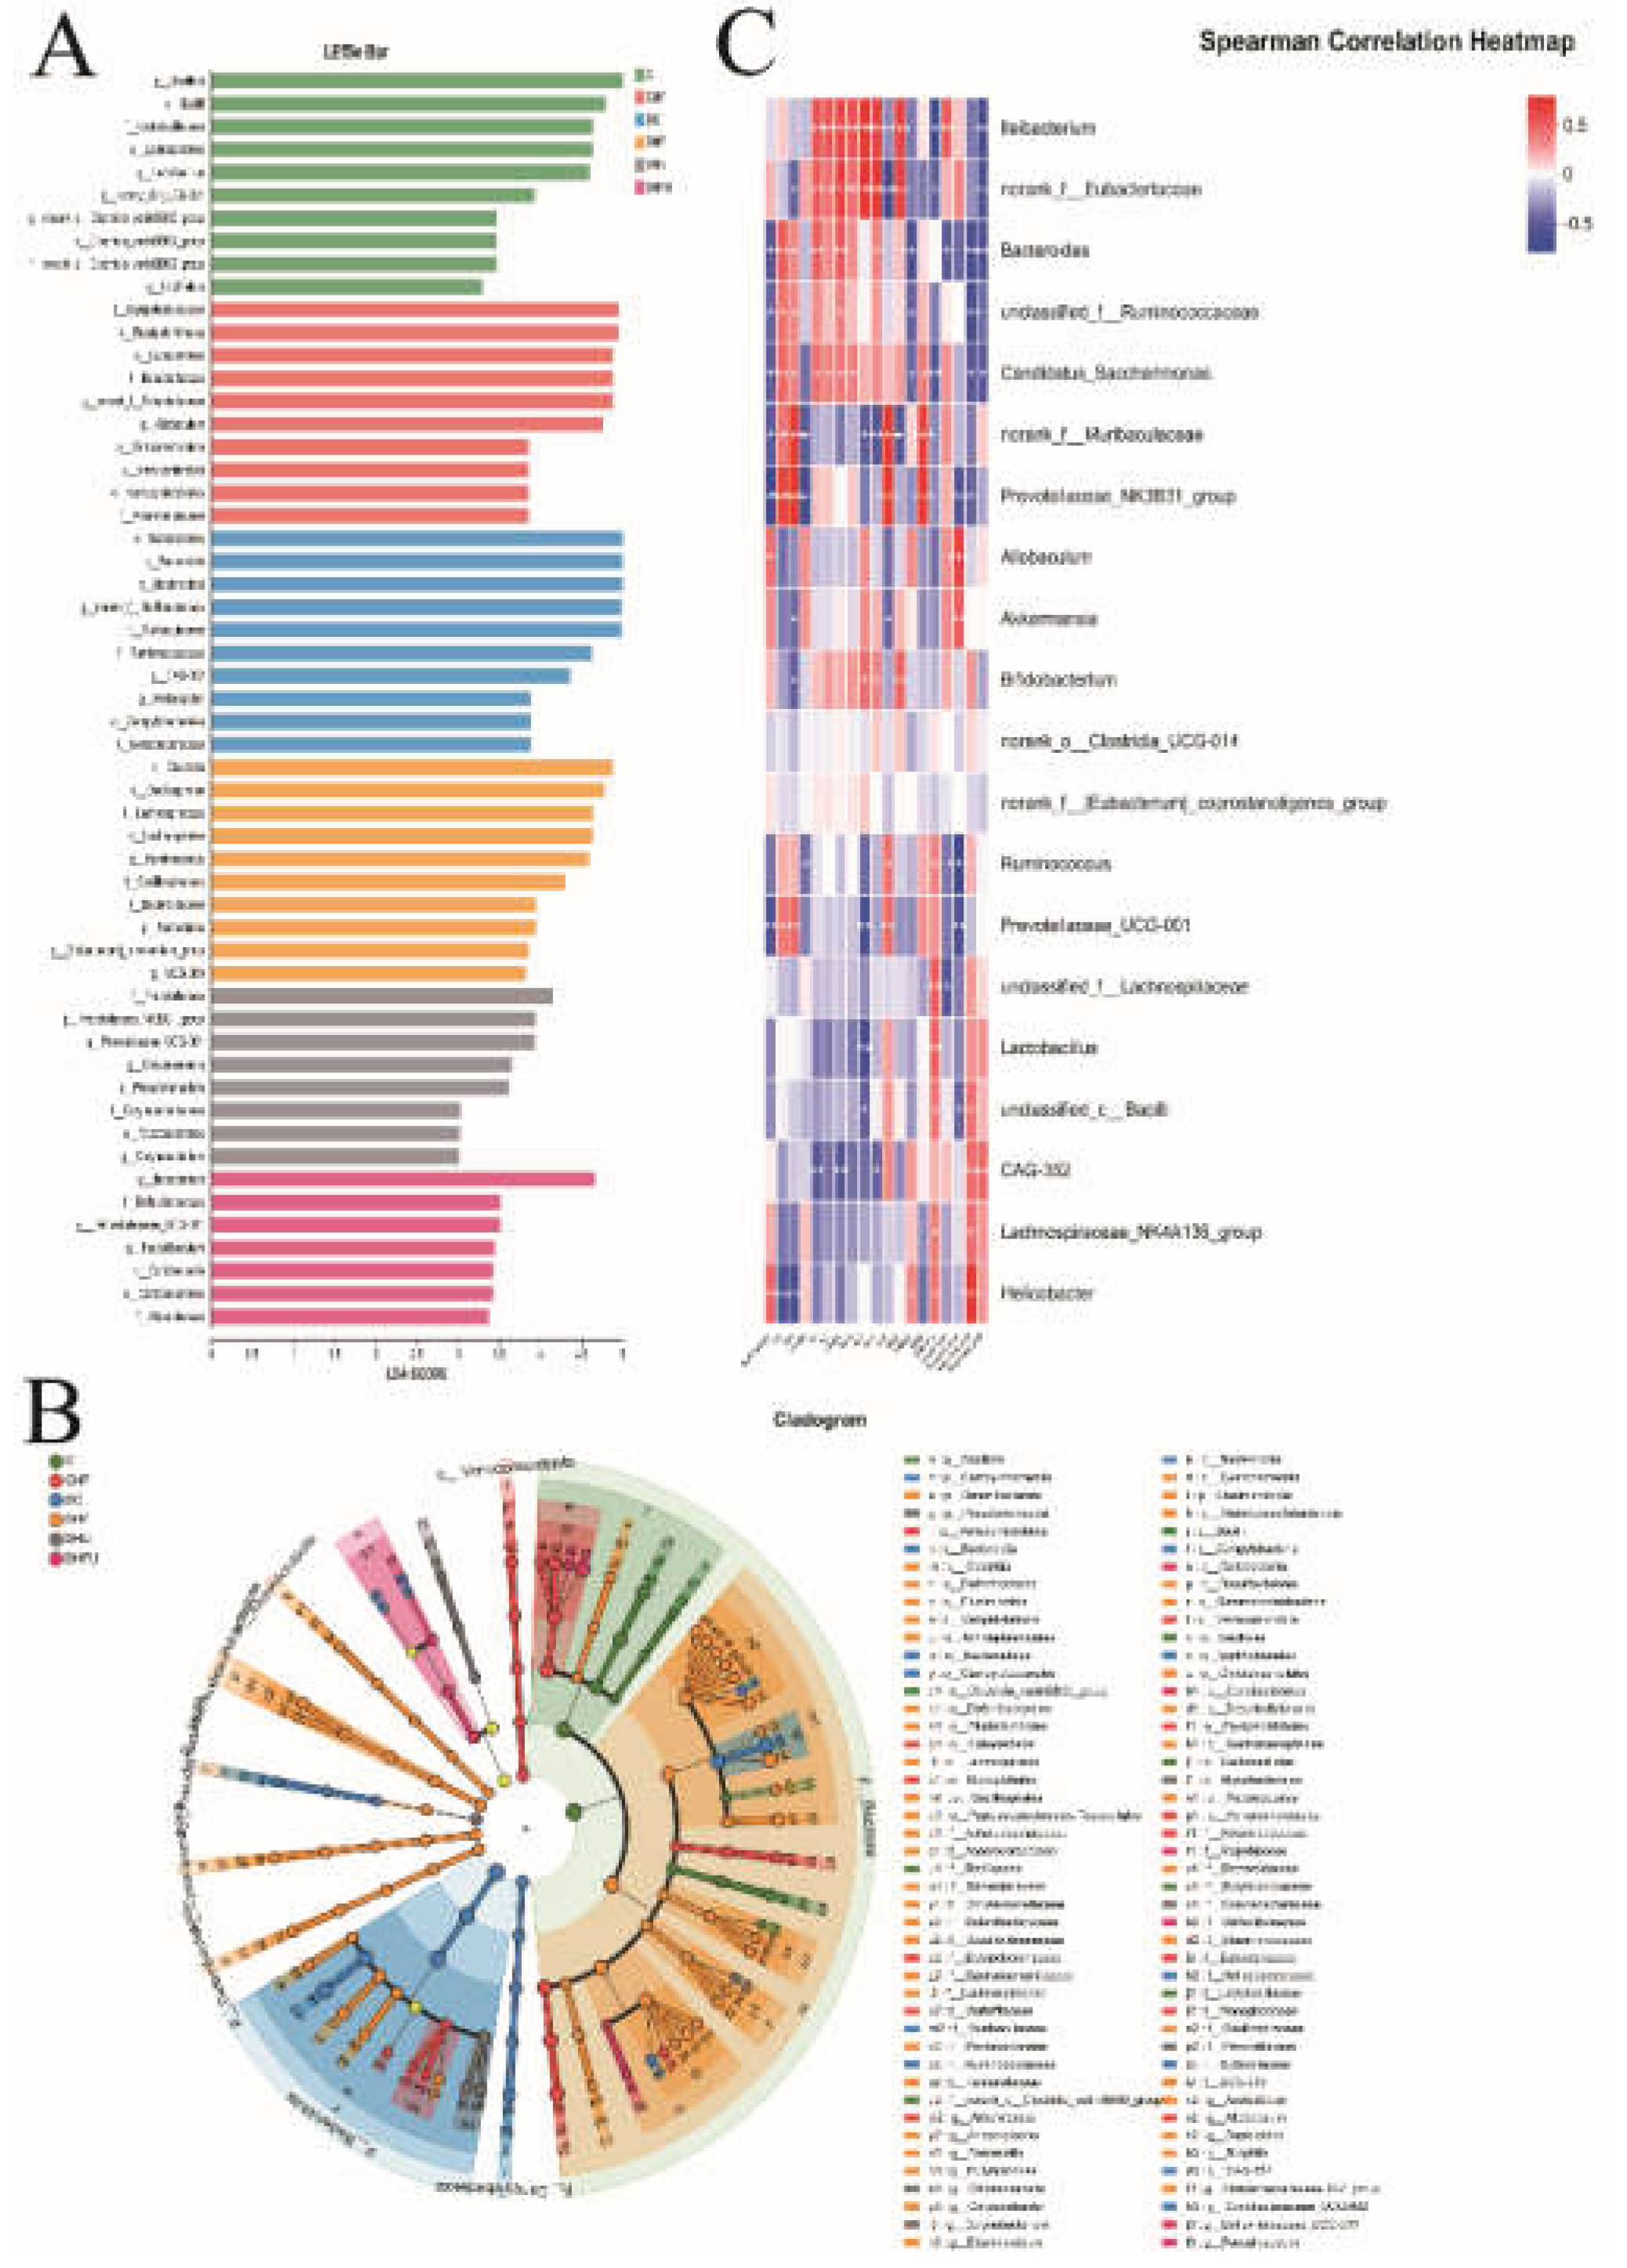

Table 1.
Primer sequences of targeted genes for qPCR.
| Genes | Forward | Reverse |
| TNF-α | AACCTCCTGTCCGCCATCAA | GCACTGAGTCGGTCACCTTTC |
| SREBP-1c | GCTGCTGACAACGGTAAAAACA | CCAGTCTATGGATGGGCAGTTT |
| PAI-1 | CCGTGGAACCAGAACGAGATT | TGATCATACCTCTGGTGTGCCTC |
| IL-6 | CAAGTCGGAGGTTTGGTTACATATG | CATTGTCCATACAGCCAGGGTT |
| TGF-β | TGACAGCAAAGACAACGCACTC | TGGAGCTGAAGCAGTAGTTGGTG |
| VEGF | CCTGGCTTTACTGCTGTACCTCC | CAATAGCTGCGCCGGTAGAC |
| β-actin | CTTTCTTCGCCGCTCCACA | TGACAATGCCGTGTTCAATGG |
Note: TNF-α (tumor necrosis factor-α), SREBP-1c (sterol regulatory element binding protein-1c), PAI-1 (plasminogen activator inhibitor-1), IL-6(interleukin-6), TGF-β (transforming growth factor-β), and VEGF (vascular endothelial growth factor).
Disclaimer/Publisher’s Note: The statements, opinions and data contained in all publications are solely those of the individual author(s) and contributor(s) and not of MDPI and/or the editor(s). MDPI and/or the editor(s) disclaim responsibility for any injury to people or property resulting from any ideas, methods, instructions or products referred to in the content. |
© 2025 by the authors. Licensee MDPI, Basel, Switzerland. This article is an open access article distributed under the terms and conditions of the Creative Commons Attribution (CC BY) license (http://creativecommons.org/licenses/by/4.0/).
Copyright: This open access article is published under a Creative Commons CC BY 4.0 license, which permit the free download, distribution, and reuse, provided that the author and preprint are cited in any reuse.


