Submitted:
10 July 2025
Posted:
11 July 2025
You are already at the latest version
Abstract
Quantum hydrodynamic theory (QHT) provides a computationally efficient alternative to time-dependent density functional theory for simulating plasmonic nanostructures, but its predictive power depends critically on the choice of ground-state electron density and energy functional. We present OF-PGSLN, a scalable and accurate QHT framework that integrates orbital-free (OF) density functional theory with a Laplacian-level kinetic energy functional (PGSLN). We calibrate the model using density functional theory and time-dependent density functional theory for sodium jellium nanospheres, determining optimal parameters to reproduce both ground-state density and localized surface plasmon resonances. Our results show that OF-PGSLN accurately captures the size-dependent localized surface plasmon energies and oscillator strengths with less computational cost. We further apply the method to sodium nanodimers and find that the commonly used linear superposition of single-sphere density becomes inaccurate at sub-nanometer gaps. In contrast, OF-PGSLN captures critical interaction-induced changes in electron density and optical response. This approach overcomes key limitations of existing QHT models by enabling accurate and stable simulations for arbitrary nanostructures beyond simple geometries. Overall, OF-PGSLN provides a scalable, accurate, and generalizable framework for quantum plasmonic simulations, offering a powerful tool for modeling complex nanostructures.
Keywords:
quantum hydrodynamic theory
; orbital-free density functional theory
; energy functional
; plasmonic nanostructure
1. Introduction
Plasmonic nanostructure systems are at the forefront of nanoscience research and have found applications across a wide range of fields [1,2,3,4,5,6,7], including enhanced solar energy conversion [8,9], biomedical applications [10,11,12], surface-enhanced Raman scattering [13,14], plasmon rulers with ultrahigh sensitivity [15], plasmonic photocatalysis [16], plasmonic nanoantennas [17], sensors [18], plasmon lasers [19], and nano-optical tweezers [20], among others. As the size of nanodevices continues to shrink, quantum effects become increasingly significant and cannot be neglected [21,22,23,24]. The classical Drude model, based on the local response approximation, is no longer sufficient to accurately describe these systems, making the development of new simulation methods an urgent need.
Quantum hydrodynamic theory (QHT) offers a promising solution [25,26,27,28,29,30]. It provides results consistent with time-dependent density functional theory (TDDFT) for simple metals while requiring significantly fewer computational resources and supporting large-scale nanostructure modeling [25,26]. However, two major challenges must be addressed for its practical application. The first concerns the determination of the ground-state electron density, which serves as the critical input for optical response calculations. While density functional theory (DFT) or analytical models are typically used to compute ground-state density [25,26,27] , DFT becomes computationally prohibitive for large structures, and analytical models are limited to simple geometries such as spheres or infinite plates.To overcome these limitations, we choose using orbital-free (OF) DFT to calculate the ground-state density [28,29,30,31]. OFDFT can be viewed as a simplified, self-consistent Kohn–Sham-like equation considering only the lowest eigenvalue, making it suitable for implementation within the finite element method and enabling integration with QHT for efficient numerical calculations.
The second challenge lies in the accuracy and numerical stability of QHT, which depend on the form and parameters of the energy functional. A widely adopted approach is to use the Thomas Fermi–von Weizsäcker (TFvW) kinetic energy functional in combination with local density approximation (LDA) exchange–correlation (XC) terms [25,27,28,30]. However, TFvW often leads to non-convergent results, manifesting as spurious high-frequency peaks sensitive to the simulation domain size.To address this, a modified Laplacian-level kinetic energy functional, known as PGSLN, has been introduced and shown to significantly improve stability and accuracy when combined with model ground-state density [26]. To further extend its applicability, we propose the OF-PGSLN method, which integrates OFDFT-derived ground-state density with the PGSLN functional.
In this study, we first calibrate the energy functional form and parameters of OF-PGSLN by comparing the ground-state density against DFT and the optical response against TDDFT. We then demonstrate the capability of OF-PGSLN to model complex nanostructures by examining the optical response of nanodimers. In particular, for small interparticle gaps, OF-PGSLN captures significant differences in both the ground-state density and optical properties compared to the simple linear superposition model, which neglects interparticle interactions.In summary, we develop a QHT-based simulation framework that is both accurate and stable for arbitrary nanostructure modeling. The remaining part of this paper is organized as follows: Section 2 presents the theoretical framework; Section 3 details the DFT-based calibration of the ground-state energy functional; Section 4 calibrates the optical response functional using TDDFT and verifies generality using nanospheres of various sizes; Section 5 applies OF-PGSLN to nanodimers with different gap sizes and compares with the model ground-state approach; and Section 6 concludes the work.
2. Model and Method
The conventional linearized QHT response is governed by the following equations in the frequency domain [25,26,27,28,29,30]:
Here, is the scattered field for the free electron and is the incident field. In this work, plane waves incident perpendicular to the z-axis are used. c is the speed of light in vacuum. and are the vacuum permittivity and permeability. and e are the electron mass and charge (in absolute value). represents the phenomenological damping rate. In this paper, we choose , which can provide corresponding oscillator strength in line with TDDFT [26]. is the plasma frequency with being the spatially dependent ground-state (equilibrium) electron density. can be obtained by adopting a first-order perturbation approach where the perturbed density is taken as , with being a small (by assumption) first-order dynamic perturbation. Where the energy functional is given by
Here, is the XC functional, while is the noninteracting kinetic energy functional. Most recently [26], the noninteracting kinetic energy functional depending on the Laplacian of the electronic density has been proposed, which has the form
with and . The kinetic energy density is approximated as the sum of the von Weizsäcker (vW) , the Pauli-Gaussian (PG) , the Laplacian (L) , and a modified term :
where
In the above equations, is the TF kinetic energy functional with the Hartree energ and the coefficient . The other coefficients are , , , and . is the reduced Laplacian, which is very large for small density. It is emphasized that the Vw term near the metal surface plays a major role, and the parameter controls the magnitude of the spill out effect. The parameters and are and . is a parameter, which can be used to tuning the energy position of the Bennett state. It is in order to have the same Bennett peak position as that obtained from the TDDFT calculations for a Na jellium nanosphere with 1074 electrons when using DFT dengsity [26].
The other undefined in Eq. (2) is the XC functional . As is stated in Ref. [28], an exact expression for is not known in general, and it is not easy to calculate it numerically either. The most familiar one is the LDA, where no density gradients are considered. The Gunnarson and Lundqvist(GL) LDA XC functional is widely used [28]. The functional derivative with respect to the density n reads:
Here, . Another LDA XC functional is the Perdew-Zunger(PZ) LDA parametrization, which is also used both for Na and Ag [25,26]. It reads:
in which
with , , and . In addition, Wigner (WG) LDA XC funcitomal adopted in the Ref. [27,30] on work function is also considered. As follows,
Since the XC potential does not have a direct microscopic representation, its explicit form remains ambiguous. In DFT, the choice of XC potential is crucial, as it significantly affects the predicted ground state properties. However, in the context of QHT, the influence of the XC potential—particularly on ground state characteristics—remains poorly understood, with limited systematic investigation to date. To address this gap, the present work aims to systematically examine how different forms of the XC potential impact ground state properties within the QHT framework.
To solve the scattering field formulation within the linearized hydrodynamic model (Equations (1)), one must first find the ground-state electronic density . It can be solved by the static equation of QHT as follows,
The static electric field is solved self-consistently with the Poissonequation:
Substituting Eq. (11) into the static equation yields,
where is the chemical potential. At this time, the vW kinetic energy functional can be regarded as an approximate kinetic energy operator, and the function of vW can be approximated with , and the approximate Schrödinger equation can be obtained,
Where . The ground state density can be obtained by Equations (11) and (13), a method also known as OFDFT. And the QHT can also be reformulated within the Time-Dependent OFDFT [29]. For the ground state density, the use of the TFvW kinetic energy functional is sufficient to solve the problem.
3. Energy Functional Required for Accurate Ground State Density in OFDFT
First, it is necessary to determine the appropriate energy functional for calculating the ground state density. In this section, we compute the distribution of a jellium slab using QHT based on Equations (11) and (13), and compare it with DFT results. For the DFT calculations, the ground state density of an infinite slab in the plane was obtained using the open-source software Octopus. The results are stable when the slab thickness in the z direction exceeds , where [32,33].
Figure 2(a) illustrates how the coefficient affects the calculated work function when using three representative XC potentials: WG (black line), GL (red line), and PZ (blue line). The horizontal dashed line denotes the reference value obtained from the DFT calculation (). Taking the WG XC potential as an example, the work function increases from to as increases, intersecting the reference line at , which is consistent with Ref. [27]. Similarly, the GL and PZ curves intersect the DFT reference line at and , respectively. These results indicate that matching the DFT work function requires different values depending on the chosen XC potential. Figure 2(b) shows the effective potential , normalized by the chemical potential , for the respective values determined above. The effective potentials obtained from all three functionals converge around , and the corresponding work functions align well with the DFT result. Therefore, to reproduce the DFT-calculated work function, the optimal values for WG, GL, and PZ are 0.43, 0.48, and 0.60, respectively. The results demonstrate that the work function is significantly influenced by : a larger leads to a stronger electron spill-out effect and an increase in the work function. Additionally, the choice of XC potential also contributes to variations in the work function.
Figure 1.
Schematic diagram of the system. The slab is infinite in the plane, modeled using a jellium background with . The study focuses on the ground state density and work function in the z direction.
Figure 1.
Schematic diagram of the system. The slab is infinite in the plane, modeled using a jellium background with . The study focuses on the ground state density and work function in the z direction.

Figure 2.
(a) Work function as a function of the coefficient using WG (black), GL (red), and PZ (blue) XC potentials. The horizontal dashed line represents the DFT reference value. The intersection points with the DFT reference are at , , and , respectively. (b) Effective potentials corresponding to these intersections, normalized by .

The ground state electron density near the metal surface plays a critical role in excited-state calculations. Figure 3 presents the normalized ground state density at the surface of the infinite slab, using for normalization. Figure 3(a) shows the ground-state density computed using three XC functionals, each with a value of that reproduces the same work function as obtained by DFT. Specifically, the values used are for WG (black), for GL (red), and for PZ (blue). Although these functionals yield consistent work functions, their surface electron density differ significantly. The density derived from WG () and GL () decay more rapidly near the surface compared to the DFT result, while the PZ () result shows close agreement with DFT. This suggests that the decay rate of the ground-state density is primarily governed by the coefficient , which modulates the electron spill-out effect. A larger leads to greater electron spill-out and a slower decay of surface density.Figure 3(b) explores the impact of XC potentials on the ground state density using a fixed for all three functionals. The results show that, under the same , the choice of XC potential has little influence on the surface electron density. Thus, the surface density is primarily determined by rather than the specific form of the XC potential.
These results collectively show that in QHT, the calculated work function is influenced by both and the XC potential, while the surface ground state density is predominantly affected by alone. Among the tested functionals, PZ with provides both an accurate work function and a ground state density profile that best agrees with DFT.
4. Energy Functional Required for Accurate Optical Response in QHT
In the previous section, we established that using the PZ with energy functional within QHT produces work functions and ground state density that are consistent with DFT results. In this section, TDDFT results are used as a reference to study the appropriate energy functionals for excited states.We calculate the absorption cross section (normalized by ) of a jellium sphere under plane wave illumination, as is illustrated in Figure 4. The absorption cross section is given by
where and are the electric field and polarization, respectively.
4.1. Optical Response Calibration by TDDFT
To extract the resonance features, we follow the spectral fitting procedure described in Ref. [26], where only the first localized surface plasmon (LSP) peak is fitted. As an example, Figure 5 shows the normalized absorption cross section for a nanosphere with 1074 electrons. The fitted curve accurately reproduces the first LSP response.
For excited-state calculations, we use the PGSLN kinetic energy functional. In practice, the LSP response inside the nanosphere is primarily governed by the TFVW component. Therefore, to accurately capture the LSP energy, it is sufficient to determine the appropriate parameter in the excited-state functional.
To compare with the TDDFT benchmark data and ensure consistency with previous work [26], we use 13 jellium nanospheres with electron numbers ranging from 338 to 6174. For calibration, we select three representative nanospheres: a small (1074 electrons), medium (2048 electrons), and large (6174 electrons) sphere. Figure 6(a) shows how the LSP energy varies with the coefficient for the three spheres. The results indicate that the LSP energy increases approximately linearly with . For instance, in the 1074-electron sphere, increasing from 0.80 to 1.00 raises the LSP energy from to , yielding a linear slope of . For the 2048 and 6174-electron spheres, the slopes are and , respectively. These results demonstrate that the LSP energy is sensitive to —a higher results in greater LSP energy due to enhanced electron spill-out. However, the slope of this increase is smaller for larger spheres, suggesting that the spill-out effect becomes less significant as the system size increases. Figure 6(b) presents the average relative error in LSP energy (compared to TDDFT results) for the three nanospheres as a function of . The minimum error occurs between and , with both yielding comparable accuracy. To maintain consistency with the ground state calibration, is selected for subsequent excited-state calculations.
4.2. LSP Energy and Corresponding Oscillator Strength of Different Sizes
In the previous section, the excited-state energy functional was determined using three representative nanospheres. To further validate the accuracy and generalizability of our method across a broader range of sizes, Figure 7 presents the LSP energies and corresponding oscillator strengths for nanospheres of various sizes, as is calculated using OF-PGSLN (red lines) and is compared with TDDFT results (black lines) from Ref. [26].
Figure 7(a) shows the LSP energies for nanospheres with electron numbers ranging from 338 to 6174. The OF-PGSLN results exhibit excellent agreement with TDDFT, with an average absolute error of . This error is slightly larger than that obtained using the DFT ground state density (), but consistent with the results based on the model ground state density reported in Ref. [26].Figure 7(b) displays the corresponding oscillator strengths, normalized to the classical local-response approximation value . The average error across all 13 nanospheres is 0.021, which is slightly lower than the value obtained using the DFT ground state density (0.029), but higher than that of the model ground state density (0.008), as reported in Ref. [26].
These results demonstrate that the OF-PGSLN approach yields LSP energies and oscillator strengths in good agreement with TDDFT across a wide range of nanosphere sizes. In comparison with methods based on the DFT or model ground state density, OF-PGSLN makes a slightly larger error in oscillator strength than the model density, but performs better than the DFT-based method. For LSP energy, the accuracy of OF-PGSLN is comparable to that obtained using the model ground state density.In conclusion, both the ground and excited-state energy functionals in OF-PGSLN have been calibrated taking DFT and TDDFT results as references. Subsequent validation across nanospheres of varying sizes confirms that the LSP energy and oscillator strength predicted by OF-PGSLN exhibit smaller mean errors relative to TDDFT. A key advantage of the OF-PGSLN approach is its ability to bypass the computational complexity of DFT, while maintaining accuracy and enabling generalization to other physical systems.
5. Validity and limitations of Linear Superposition Approximation in Nanodimers
In the previous section, we demonstrated that the OF-PGSLN ground state density enables accurate predictions of both the LSP energy and oscillator strength in sodium nanospheres. We now extend this analysis to a dimer system composed of two sodium jellium spheres, each containing 1074 electrons. This system provides a platform for evaluating the validity of a linear superposition of ground state density across varying interparticle distances. Specifically, we assess the performance of the OF-derived ground state density in comparison with that obtained from a linear superposition of model ground state density for different gap sizes.
We begin with the small-gap regime, where strong quantum effects emerge due to significant wavefunction overlap. As shown in Figure 8(a), at , the absorption spectrum based on the model density (red line) exhibits a marked redshift in the first LSP peak relative to the spectrum obtained using the OF density (black line), with a difference of . To elucidate the source of this discrepancy, Figure 8(b) presents the ground state electron density at the center of the dimer. The OF result yields a minimum density of , whereas the model result gives a significantly lower value of . This underestimation arises from the model’s neglect of essential quantum mechanical effects—namely electron–electron repulsion, Fermi pressure, and quantum confinement—which become critical in the strongly coupled regime. These findings reveal the breakdown of the linear approximation at short distances and emphasize the necessity of using the OF ground state density when modeling closely spaced nanostructures.
In contrast, the large-gap regime corresponds to a situation in which the electron density of the two nanospheres remain largely non-overlapping, and mutual interactions are minimal. As illustrated in Figure 9(a), at , the absorption spectra calculated from both the model density (red line) and the OF density (black line) are nearly identical, differing by only in LSP energy. This agreement is further supported by Figure 9(b), which shows the minimum electron densityat the dimer center: for the model density and for the OF density. The small discrepancy confirms the validity of the linear superposition approximation in the weakly coupled regime. Notably, this approximation offers a practical advantage: for systems comprising many nanostructures, individual ground state density can be precomputed and linearly combined, significantly reducing computational cost without sacrificing accuracy.
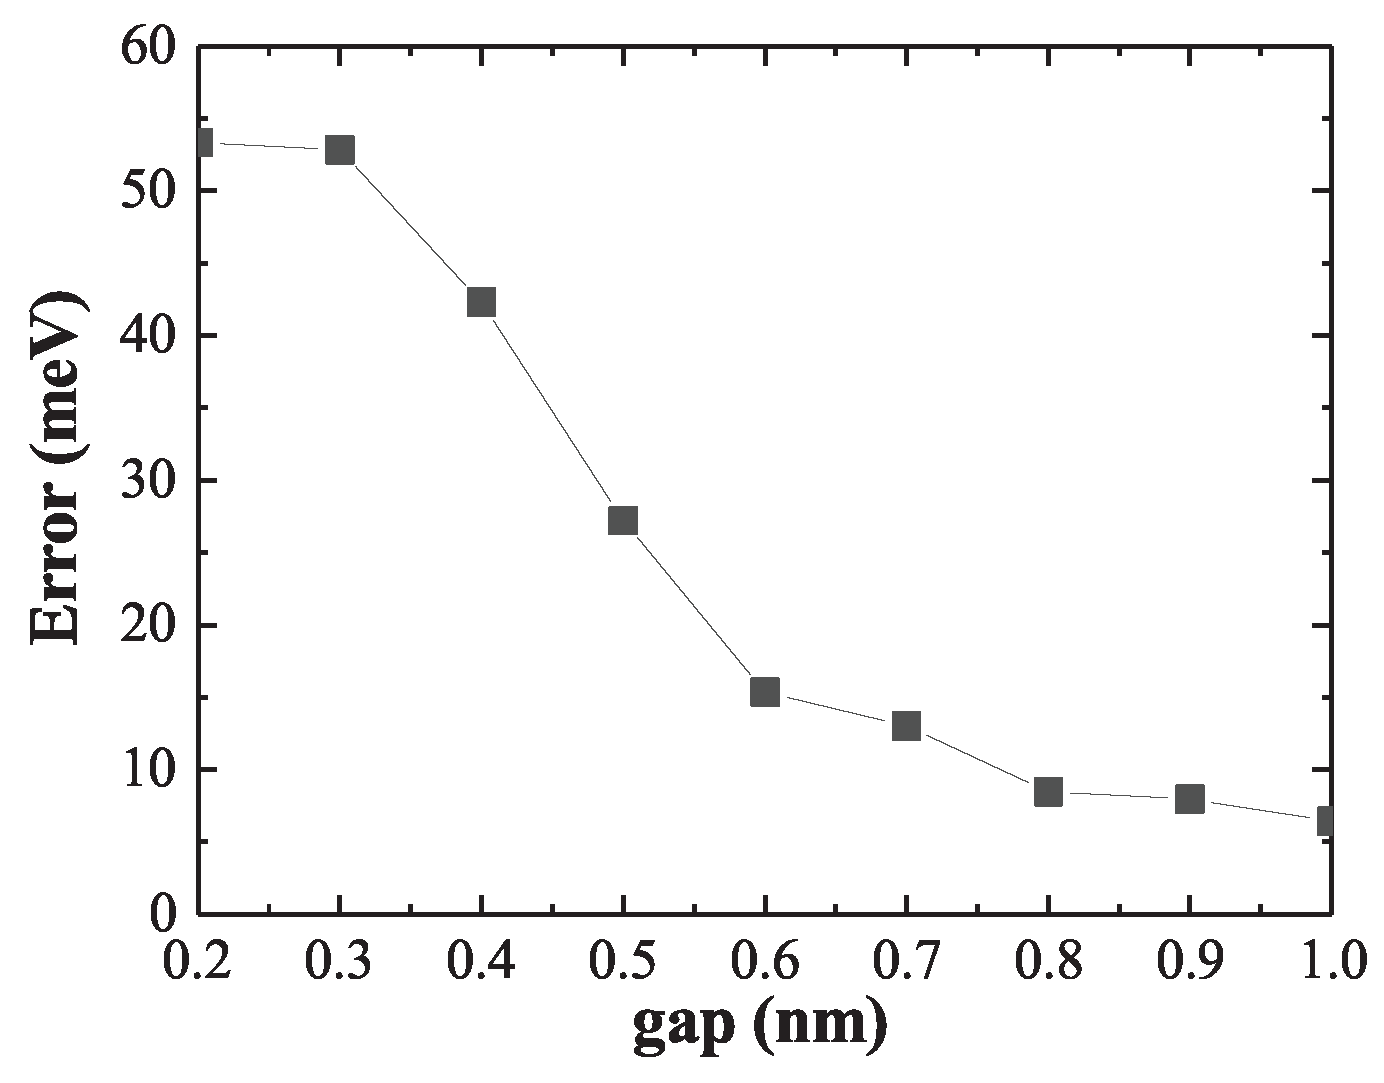
To quantitatively evaluate the performance of the linear approximation across different interparticle separations, Figure 10 plots the LSP energy error as a function of dimer gap. While the error remains below for gaps larger than , it increases sharply below , saturating at approximately in the strongly coupled regime. These results highlight the dual nature of the linear superposition approach: it fails under strong coupling but becomes a powerful and efficient modeling tool when the constituent nanostructures are sufficiently separated. This strategy is especially advantageous for simulating large nanoparticle assemblies, where reusing precomputed ground state density can drastically reduce computational overhead.
6. Conclusions
In this work, we developed OF-PGSLN, a QHT framework that integrates OFDFT for ground-state density with a Laplacian-level kinetic energy functional (PGSLN) for excited-state dynamics. The key conclusions are as follows:Using DFT as a benchmark, we determined that the PZ XC functional with yields the most accurate ground-state properties, including work functions and surface electron density. For excited states, calibrating against TDDFT, we found that enables precise reproduction of LSP resonances. Across sodium nanospheres with , the average errors in resonance energy and oscillator strength are only and , respectively. We further applied the method to nanodimers, demonstrating that while the linear superposition model suffices at large gaps (), it fails to capture critical density redistribution at small gaps (), leading to significant errors—up to —which OF-PGSLN accurately resolves. By enabling stable, geometry-independent ground-state calculations and suppressing spurious spectral features through PGSLN, our approach provides a reliable and efficient platform for modeling quantum optical responses in complex nanostructures, with broad applicability to next-generation plasmonic and nanophotonic devices.
Author Contributions
Conceptualization, Methodology, data curation, Visualization, and writing-original draft, Q. H; writing, review and editing, R. L, X. S, X. W, H. Y and Y. H. Funding acquisition, X. S, H. Y and Y. H. All authors have read and agreed to the published version of the manuscript.
Funding
This work was supported by the National Natural Science Foundation of China (12464049) and the Scientific Research Fund of Hunan Provincial Education Department (24C0254, 22A0373).
Conflicts of Interest
The authors declare no conflicts of interest.
References
- Wen, S.S.; Huang, Y.G.; Wang, X.Y.; Liu, J.; Li, Y.; Quan, X.E.; Yang, H.; Peng, J.Z.; Deng, K.; Zhao, H.P. Bound state and non-Markovian dynamics of a quantum emitter around a surface plasmonic nanostructure. Opt. Express 2020, 28, 6469–6489. [Google Scholar] [CrossRef] [PubMed]
- Karanikolas, V.; Thanopulos, I.; Paspalakis, E. Strong coupling regime and bound states in the continuum between a quantum emitter and phonon-polariton modes. Opt. Express 2021, 29, 23408–23420. [Google Scholar] [CrossRef] [PubMed]
- Tian, M.; Huang, Y.G.; Wen, S.S.; Wang, X.Y.; Yang, H.; Peng, J.Z.; Zhao, H.P. Level shift and decay dynamics of a quantum emitter around a plasmonic nanostructure. Phys. Rev. A 2019, 99, 053844. [Google Scholar] [CrossRef]
- Varguet, H.; Díaz-Valles, A.A.; Guérin, S.; Jauslin, H.R.; Colas des Francs, G. Collective strong coupling in a plasmonic nanocavity. J. Chem. Phys. 2021, 154, 084303. [Google Scholar] [CrossRef] [PubMed]
- Ming, T.; Zhao, L.; Yang, Z.; Chen, H.; Sun, L.; Wang, J.; Yan, C. Strong Polarization Dependence of Plasmon-Enhanced Fluorescence on Single Gold Nanorods. Nano Lett. 2009, 9, 3896–3903. [Google Scholar] [CrossRef] [PubMed]
- Curto, A.G.; Volpe, G.; Taminiau, T.H.; Kreuzer, M.P.; Quidant, R.; van Hulst, N.F. Unidirectional Emission of a Quantum Dot Coupled to a Nanoantenna. Science 2010, 329, 930–933. [Google Scholar] [CrossRef] [PubMed]
- Xu, D.; Wang, X.Y.; Huang, Y.G.; Ouyang, S.L.; He, H.L.; He, H. Position-dependent property of resonant dipole—dipole interaction mediated by localized surface plasmon of an Ag nanosphere. Chin. Phys. B 2015, 24, 024205. [Google Scholar] [CrossRef]
- Suljo, L.; Phillip, C.; Ingram, D.B. Plasmonic-metal nanostructures for efficient conversion of solar to chemical energy. Nature Mater. 2011, 10, 911–921. [Google Scholar] [CrossRef]
- Cushing, S.K.; Wu, N. Progress and Perspectives of Plasmon-Enhanced Solar Energy Conversion. Journal of Physical Chemistry Letters 2016, 7, 666–675. [Google Scholar] [CrossRef] [PubMed]
- Min, H.; Jingyi, C.; Zhi-Yuan, L.; Leslie, A.; Hartland, G.V.; Xingde, L.; Manuel, M.; Younan, X. Gold nanostructures: engineering their plasmonic properties for biomedical applications. Chem. Soc. Rev. 2006, 35, 1084–1094. [Google Scholar] [CrossRef] [PubMed]
- Huang, X.; Jain, P.K.; El-Sayed, I.H.; El-Sayed, M.A. Plasmonic photothermal therapy (PPTT) using gold nanoparticles. Lasers Med. Sci. 2007, 23, 217. [Google Scholar] [CrossRef] [PubMed]
- Sundaresan, S.M.; Fothergill, S.M.; Tabish, T.A.; Ryan, M.; Xie, F. Aptamer biosensing based on metal enhanced fluorescence platform: A promising diagnostic tool. Appl. Phys. Rev. 2021, 8, 041311. [Google Scholar] [CrossRef]
- Yang, Y.X.; Chu, J.P. Cost-effective large-area Ag nanotube arrays for SERS detections: effects of nanotube geometry. Nanotechnology 2021, 32, 475504. [Google Scholar] [CrossRef] [PubMed]
- Schlücker, S. Surface-Enhanced Raman Spectroscopy: Concepts and Chemical Applications. Angewandte Chemie International Edition 2014, 53, 4756–4795. [Google Scholar] [CrossRef] [PubMed]
- Wen, C.; Zhang, S.; Qian, D.; Xu, H. Probing of sub-picometer vertical differential resolutions using cavity plasmons. Nat. Commun. 2018, 9, 801. [Google Scholar] [CrossRef] [PubMed]
- Zhang, X.; Chen, Y.L.; Liu, R.S.; Tsai, D.P. Plasmonic photocatalysis. Rep. Prog. Phys. 2013, 76, 046401. [Google Scholar] [CrossRef] [PubMed]
- Giannini, V.; Fernández-Domínguez, A.I.; Heck, S.C.; Maier, S.A. Plasmonic Nanoantennas: Fundamentals and Their Use in Controlling the Radiative Properties of Nanoemitters. Chem. Rev. 2011, 111, 3888–3912. [Google Scholar] [CrossRef] [PubMed]
- Lee, Y.Y.; Kim, R.M.; Im, S.W.; Balamurugan, M.; Nam, K.T. Plasmonic metamaterials for chiral sensing applications. Nanoscale 2020, 12, 58–66. [Google Scholar] [CrossRef] [PubMed]
- Oulton, R.F.; Sorger, V.J.; Zentgraf, T.; Ma, R.M.; Gladden, C.; Dai, L.; Bartal, G.; Zhang, X. Plasmon lasers at deep subwavelength scale. Nature 2009, 461, 629–632. [Google Scholar] [CrossRef] [PubMed]
- Juan, M.L.; Righini, M.; Quidant, R. Plasmon nano-optical tweezers. Nature Photon. 2011, 5, 349–356. [Google Scholar] [CrossRef]
- Scholl, J.A.; Koh, A.L.; Dionne, J.A. Quantum plasmon resonances of individual metallic nanoparticles. Nature 2012, 483, 421–427. [Google Scholar] [CrossRef] [PubMed]
- Zhou, Z.K.; Liu, J.; Bao, Y.; Wu, L.; Png, C.E.; Wang, X.H.; Qiu, C.W. Quantum plasmonics get applied. Prog. Quant. Electron. 2019, 65, 1–20. [Google Scholar] [CrossRef]
- Zhu, W.; Esteban, R.; Borisov, A.G.; Baumberg, J.J.; Nordlander, P.; Lezec, H.J.; Aizpurua, J.; Crozier, K.B. Quantum mechanical effects in plasmonic structures with subnanometre gaps. Nat. Commun. 2016, 7, 11495. [Google Scholar] [CrossRef] [PubMed]
- Esteban, R.; Borisov, A.G.; Nordlander, P.; Aizpurua, J. Bridging quantum and classical plasmonics with a quantum-corrected model. Nat. Commun. 2012, 3, 825. [Google Scholar] [CrossRef] [PubMed]
- Ciracì, C.; Della Sala, F. Quantum hydrodynamic theory for plasmonics: Impact of the electron density tail. Phys. Rev. B 2016, 93, 205405. [Google Scholar] [CrossRef]
- Baghramyan, H.M.; Della Sala, F.; Ciracì, C. Laplacian-Level Quantum Hydrodynamic Theory for Plasmonics. Phys. Rev. X 2021, 11, 011049. [Google Scholar] [CrossRef]
- Yan, W. Hydrodynamic theory for quantum plasmonics: Linear-response dynamics of the inhomogeneous electron gas. Phys. Rev. B 2015, 91, 115416. [Google Scholar] [CrossRef]
- Toscano, G.; Straubel, J.; Kwiatkowski, A.; Rockstuhl, C.; Evers, F.; Xu, H.; Asger Mortensen, N.; Wubs, M. Resonance shifts and spill-out effects in self-consistent hydrodynamic nanoplasmonics. Nat. Commun. 2015, 6, 7132. [Google Scholar] [CrossRef] [PubMed]
- Della Sala, F. Orbital-free methods for plasmonics: Linear response. The Journal of chemical physics 2022, 157. [Google Scholar] [CrossRef] [PubMed]
- Zhou, Q.; Li, W.; He, Z.; Zhang, P.; Chen, X.W. Quantum hydrodynamic model for noble metal nanoplasmonics. Physical Review B 2023, 107, 205413. [Google Scholar] [CrossRef]
- Constantin, L.A.; Fabiano, E.; Della Sala, F. Performance of semilocal kinetic energy functionals for orbital-free density functional theory. Journal of chemical theory and computation 2019, 15, 3044–3055. [Google Scholar] [CrossRef] [PubMed]
- Luo, H.; Hackbusch, W.; Flad, H.J.; Kolb, D. Fully self-consistent Hartree-Fock calculation of jellium slabs: Exact treatment of the exchange operator. Physical Review B—Condensed Matter and Materials Physics 2008, 78, 035136. [Google Scholar] [CrossRef]
- Lang, N.; Kohn, W. Theory of metal surfaces: work function. Physical Review B 1971, 3, 1215. [Google Scholar] [CrossRef]
Figure 3.
Normalized ground state density obtained using different energy functionals. (a) for WG (black), for GL(red), and for PZ yield consistent work functions with DFT; DFT result shown in green. (b) WG, GL, and PZ functionals with fixed . While significantly affects the decay of surface density, the XC potential has negligible influence.
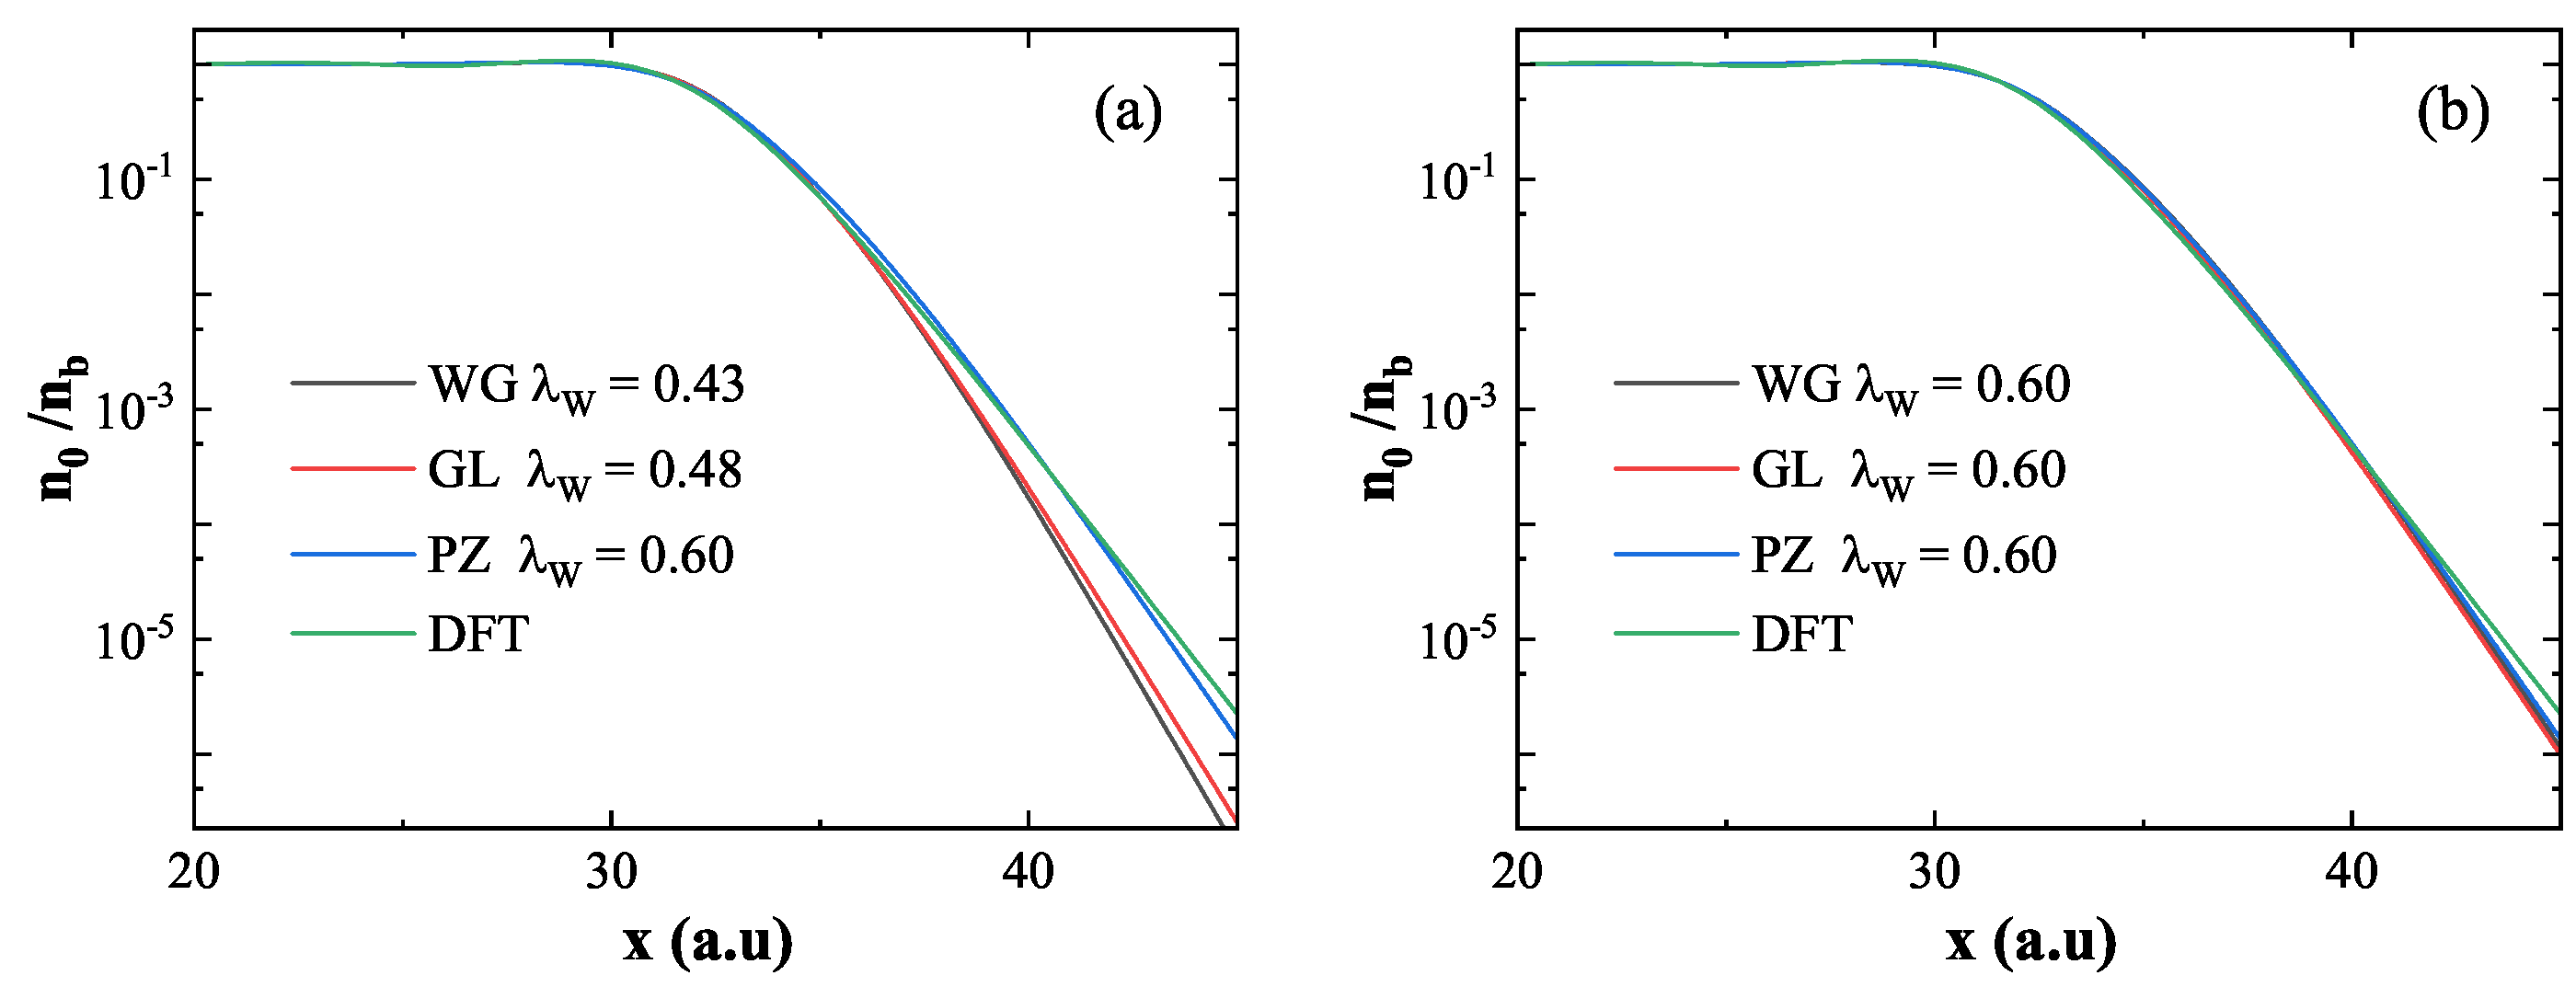
Figure 4.
Schematic diagram of the calculation setup. A plane wave is incident perpendicular to the z-axis. The absorption cross section of sodium jellium nanospheres is evaluated using the gel model.
Figure 4.
Schematic diagram of the calculation setup. A plane wave is incident perpendicular to the z-axis. The absorption cross section of sodium jellium nanospheres is evaluated using the gel model.
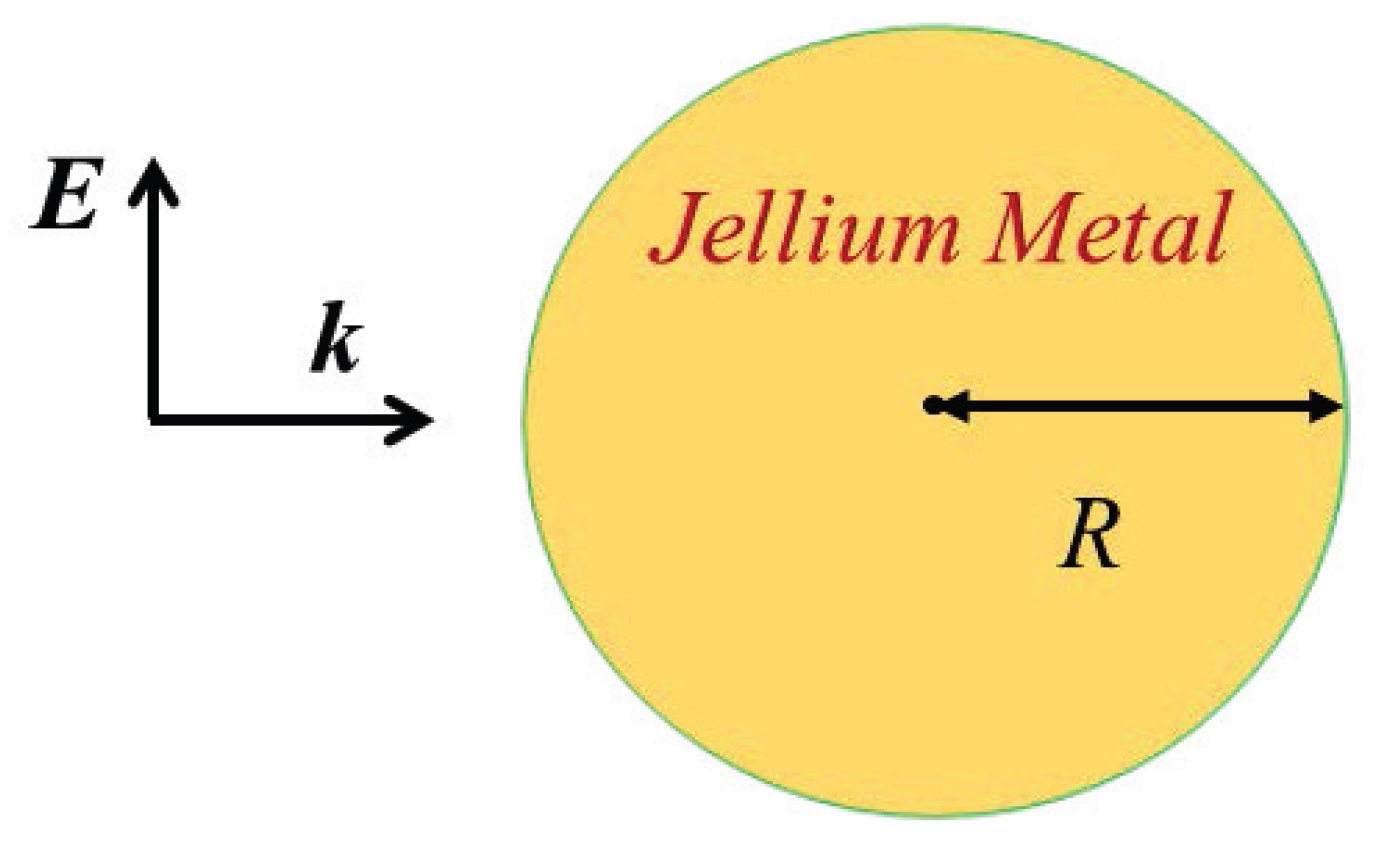
Figure 5.
Normalized absorption cross section (log scale) for a Na jellium nanosphere with 1074 electrons. Solid line: QHT result; dotted line: fitted LSP peak using the method in Ref. [26]. Only the first LSP resonance is considered.
Figure 5.
Normalized absorption cross section (log scale) for a Na jellium nanosphere with 1074 electrons. Solid line: QHT result; dotted line: fitted LSP peak using the method in Ref. [26]. Only the first LSP resonance is considered.
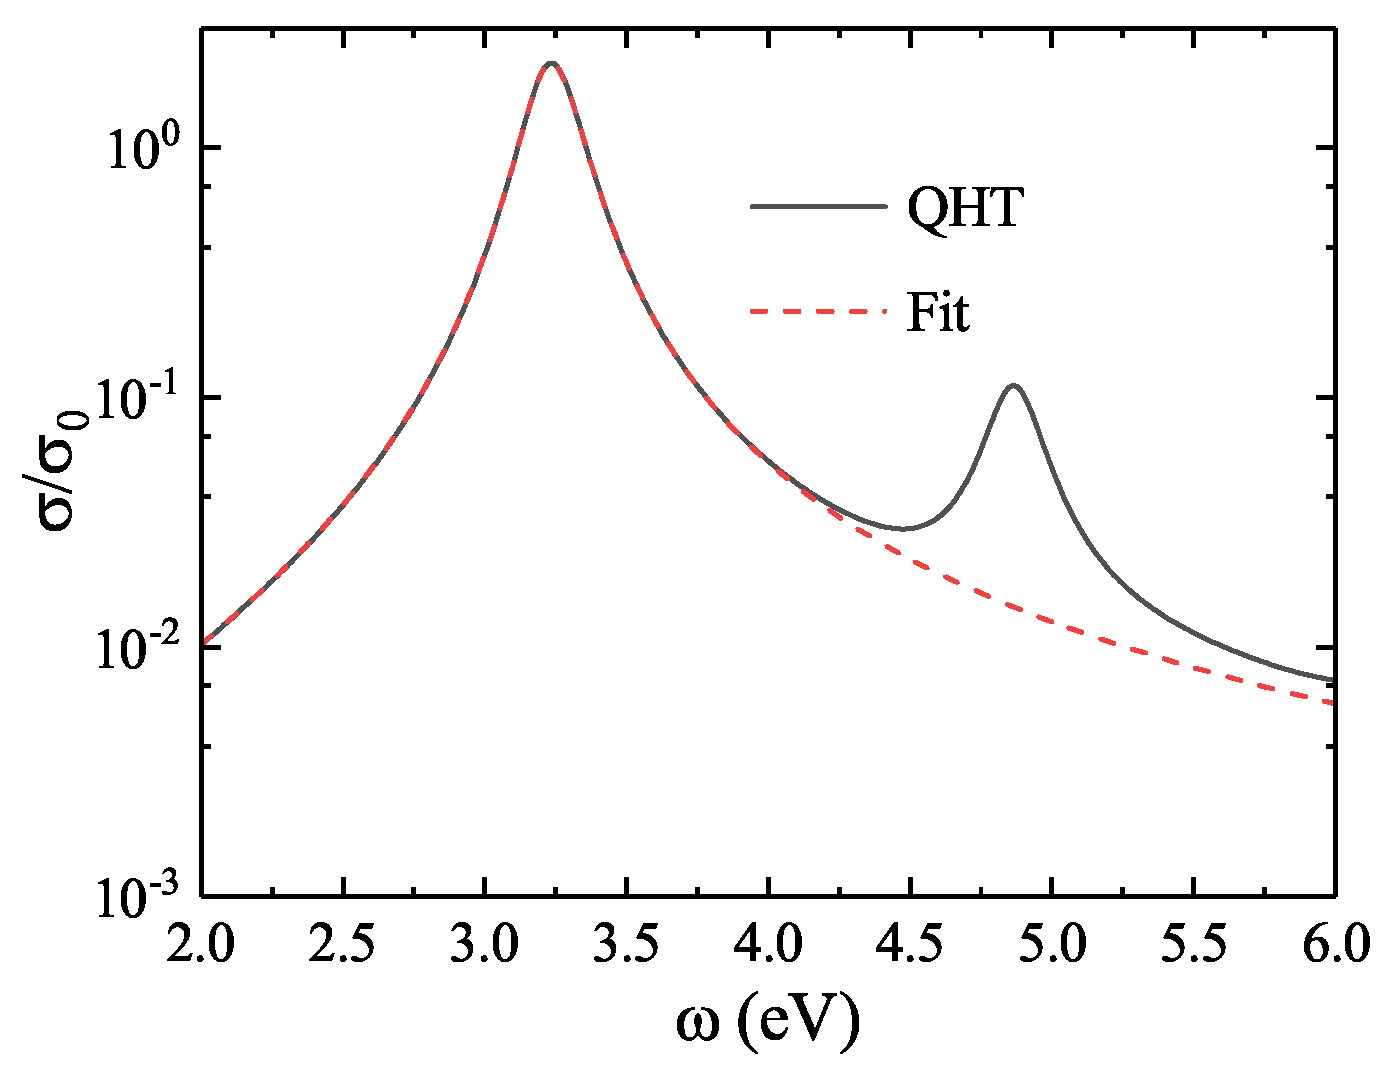
Figure 6.
(a) LSP energy as a function of the coefficient for nanospheres with 1074 (red squares), 2048 (blue circles), and 6174 (black triangles) electrons. All exhibit linear increases in LSP energy with increasing . (b) Average error in LSP energy (relative to TDDFT results) for the three nanospheres. The minimum error occurs near .
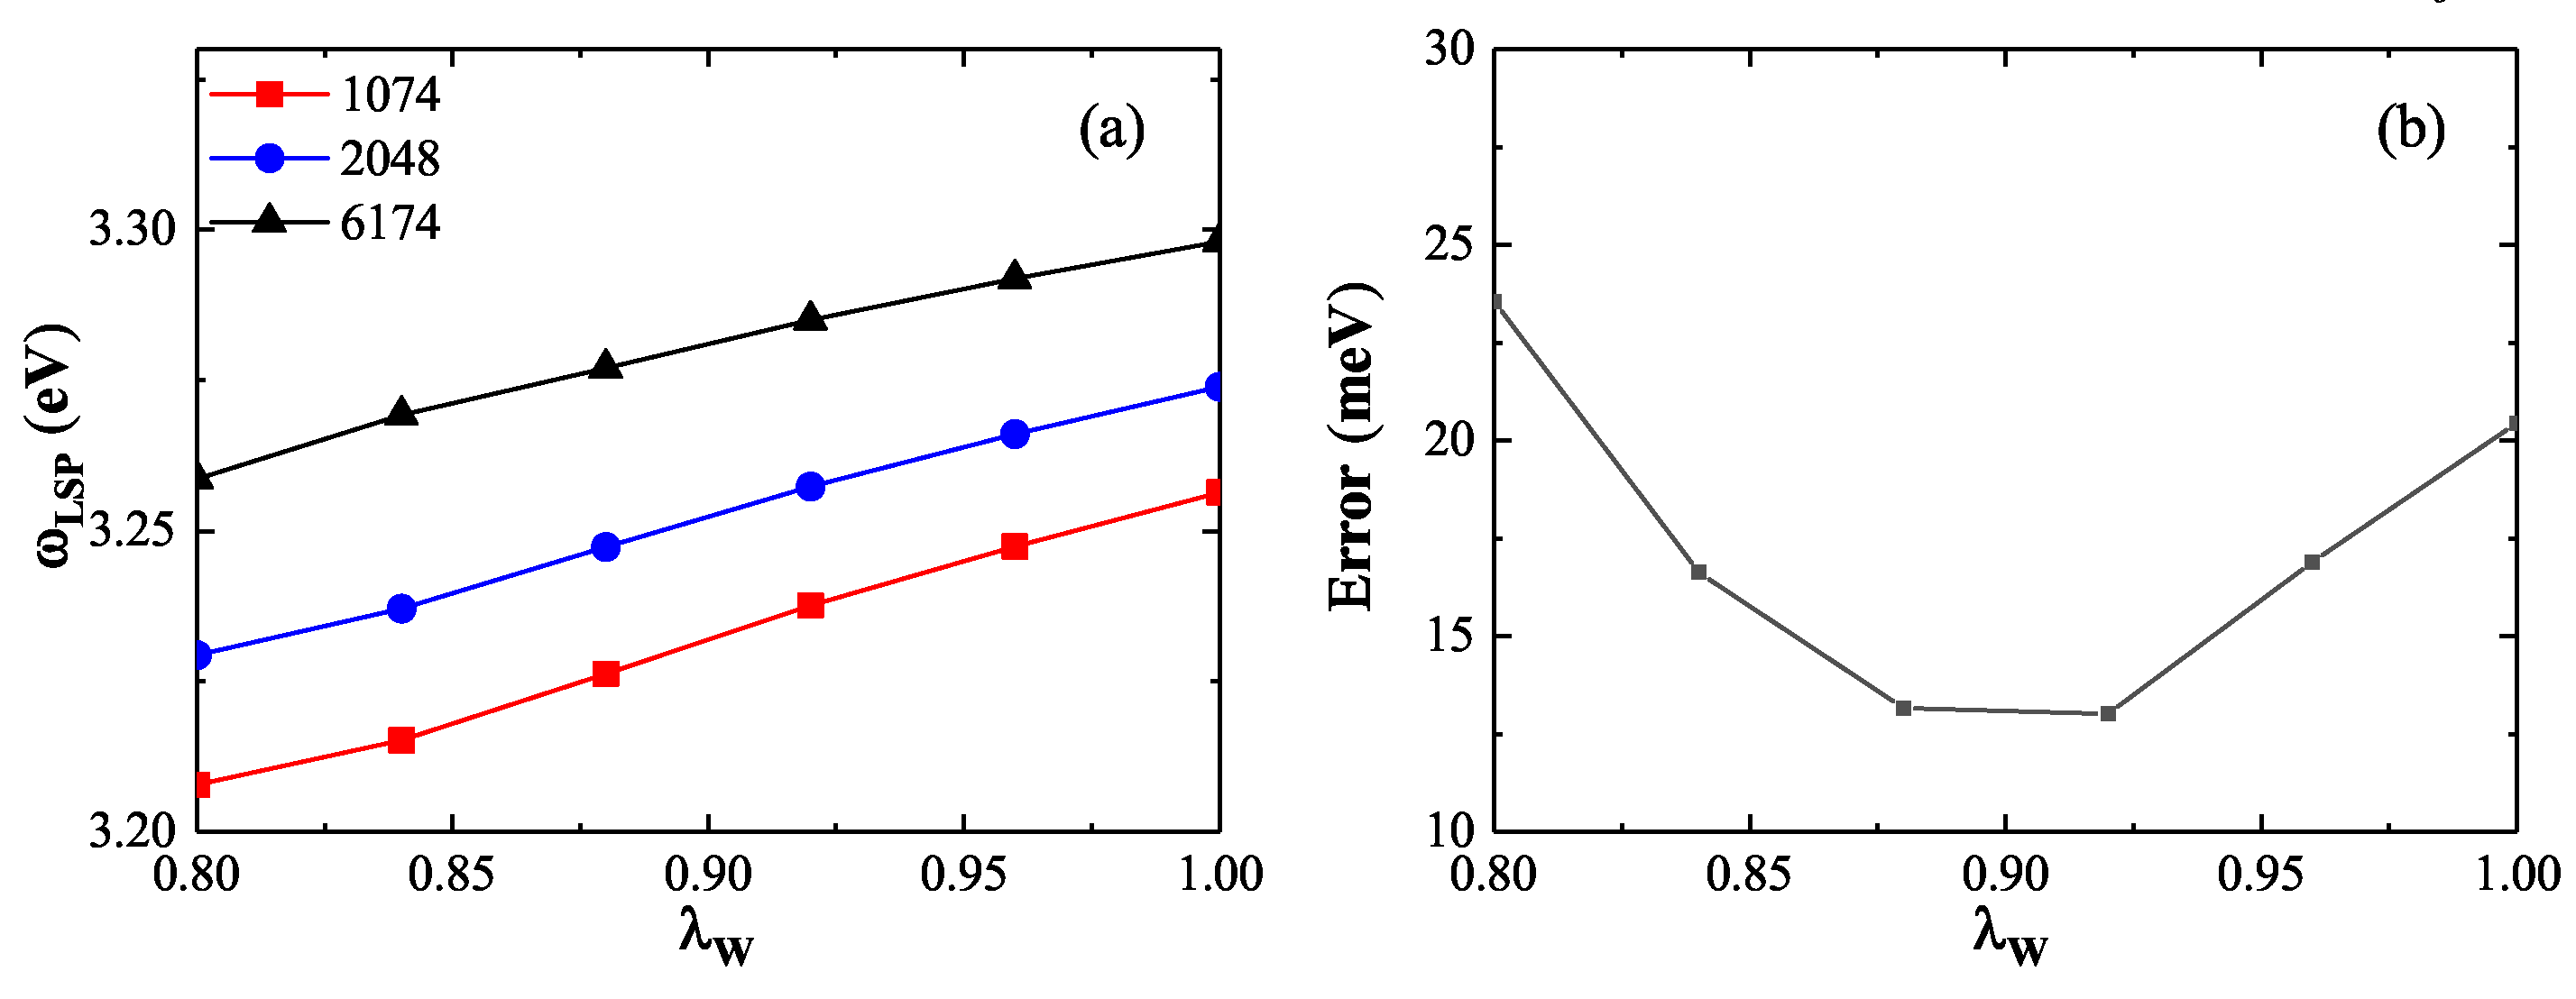
Figure 7.
(a) LSP energy and (b) corresponding oscillator strength for nanospheres of various sizes calculated by QHT (red lines) compared with TDDFT reference values (black lines). The QHT results show excellent agreement with TDDFT across the full range of nanosphere diameters.
Figure 7.
(a) LSP energy and (b) corresponding oscillator strength for nanospheres of various sizes calculated by QHT (red lines) compared with TDDFT reference values (black lines). The QHT results show excellent agreement with TDDFT across the full range of nanosphere diameters.
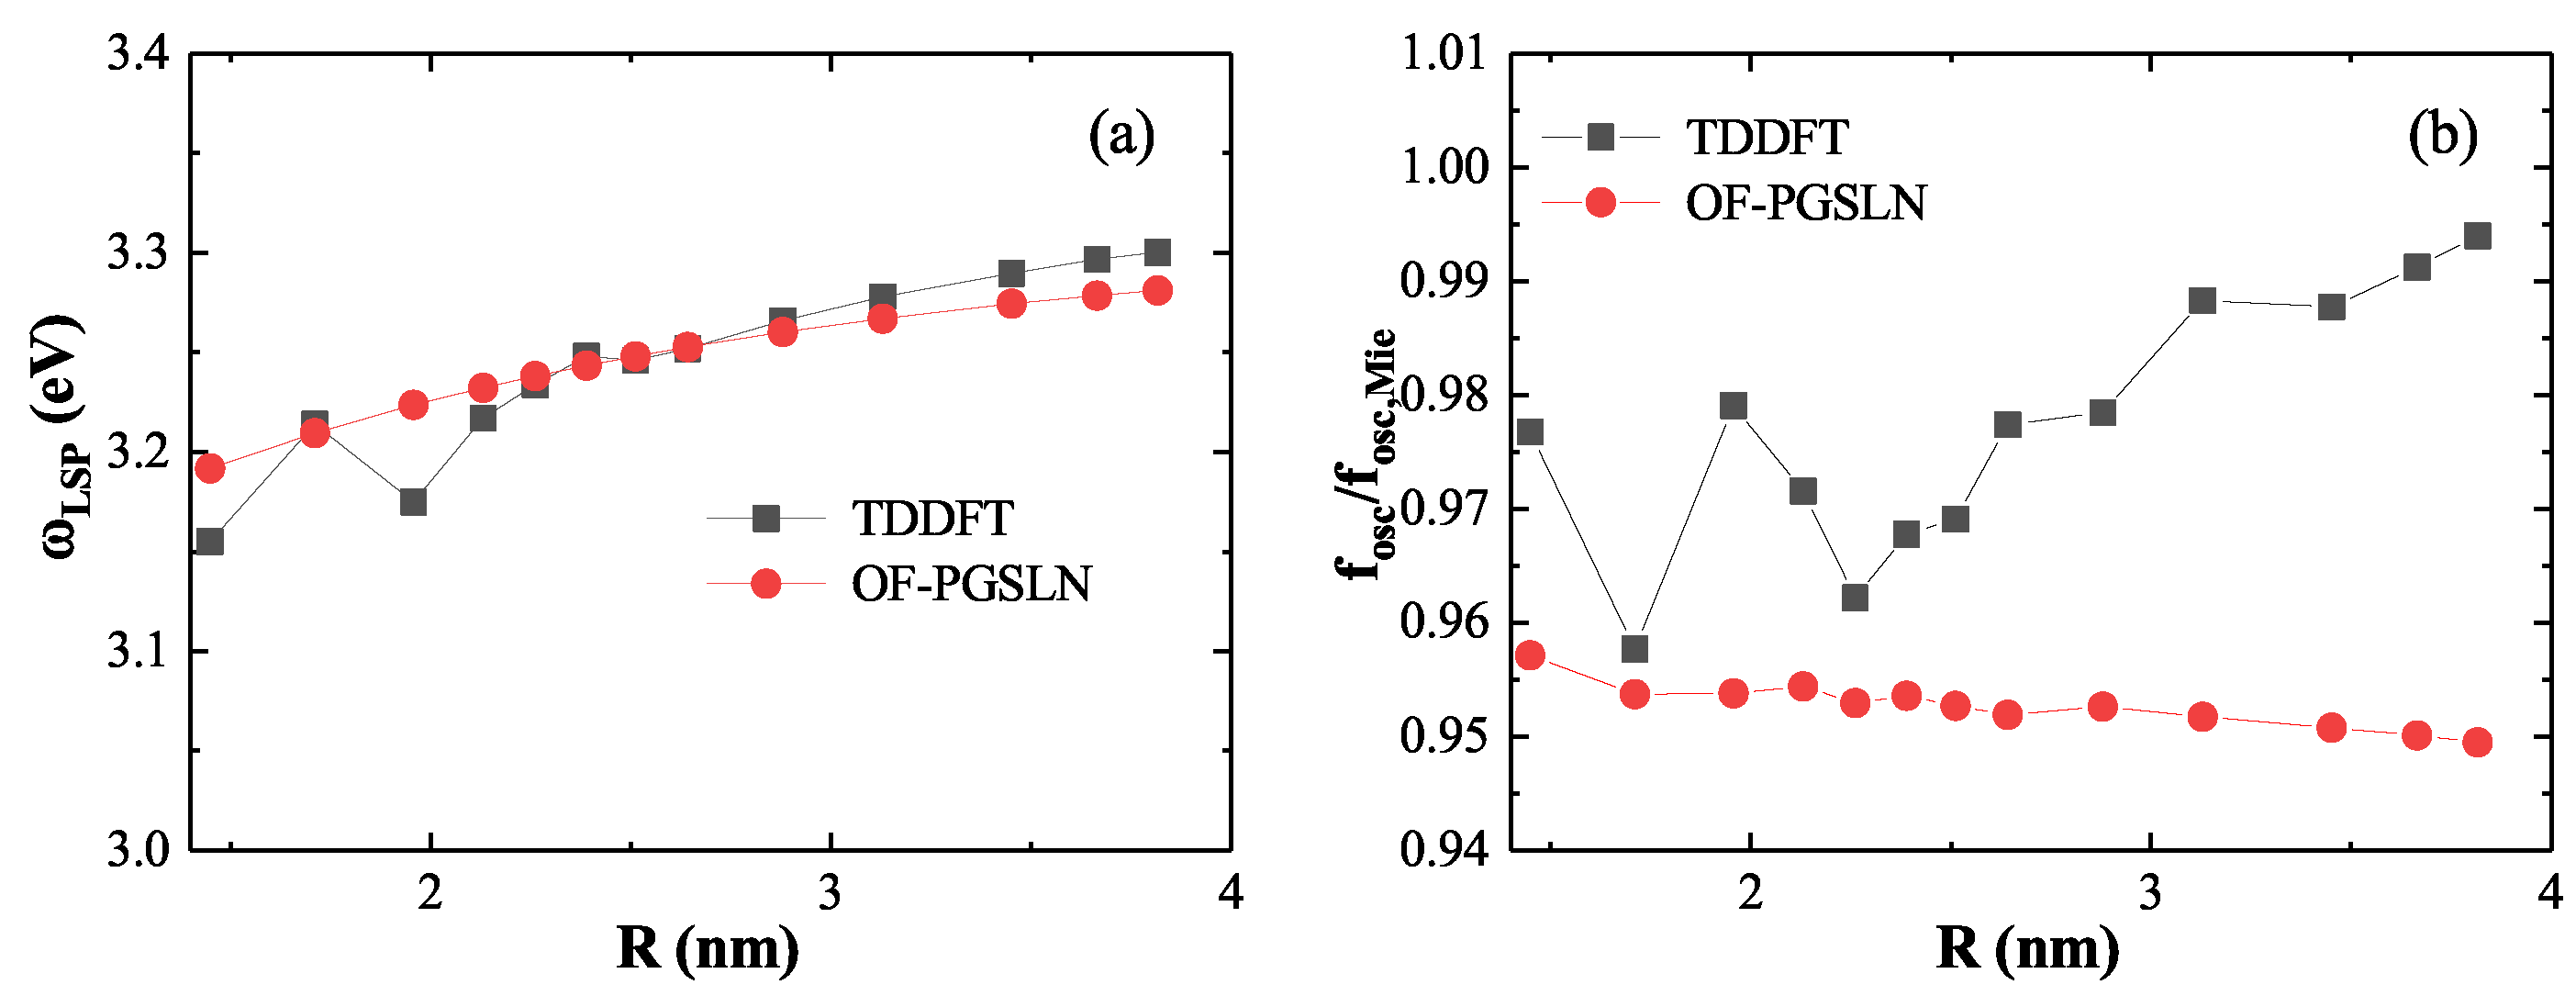
Figure 8.
Breakdown of the linear superposition approximation at short distances (). (a) Absorption spectra computed using model density (red) and OF density (black), showing a significant redshift in the LSP peak when using the linear superpositio. (b) Ground state electron density at the dimer center, where the linear superposition approximation underestimates the density due to neglected quantum effects.
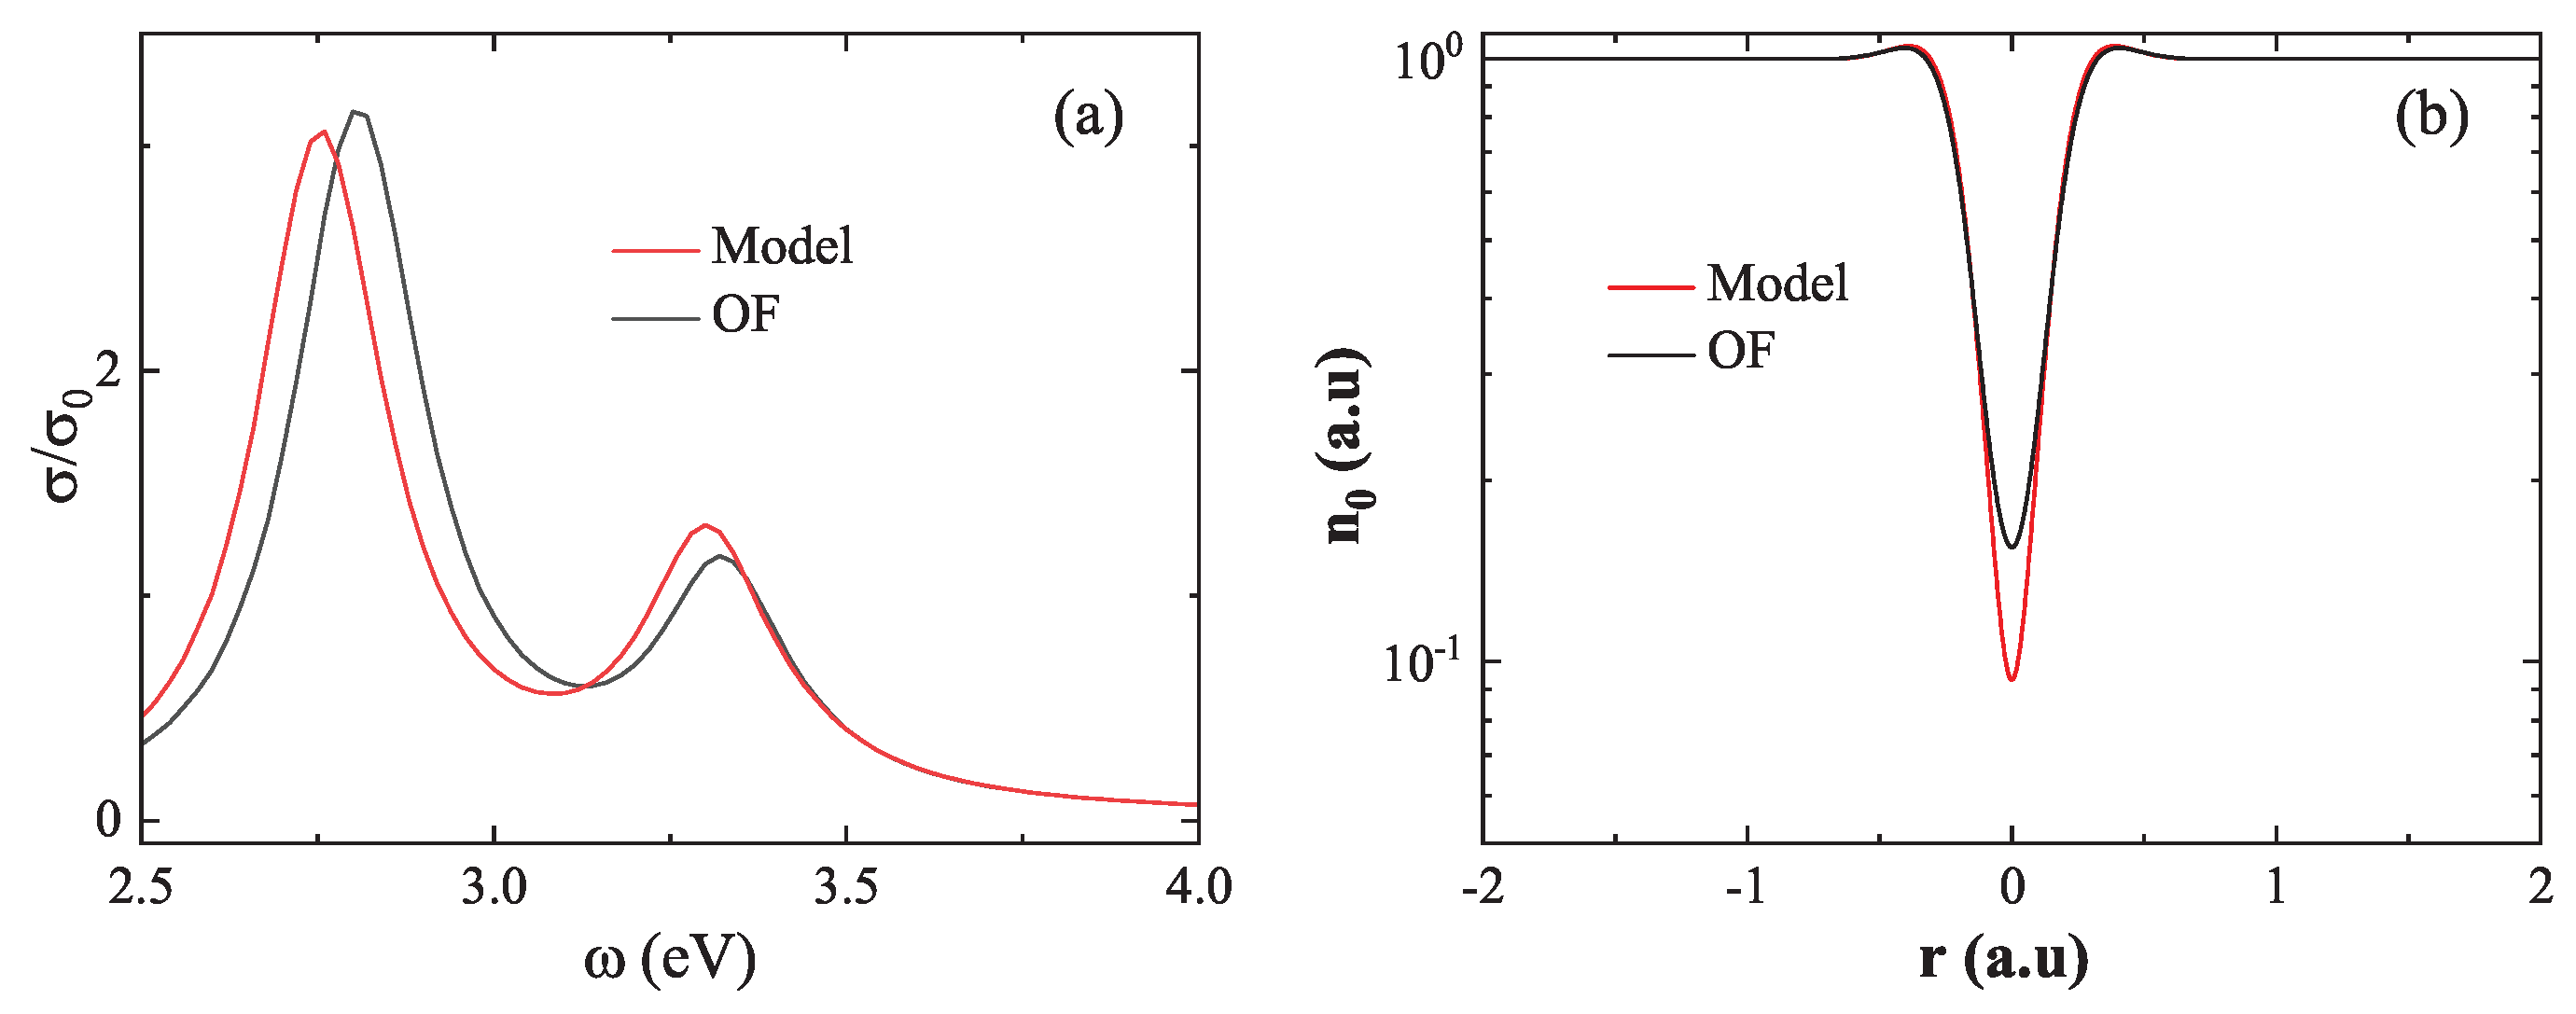
Figure 9.
Validation of the linear superposition approximation at large distances (). (a) Absorption spectra computed from model density (red) and OF density (black) show excellent agreement. (b) Ground state electron density at the dimer center, revealing only a minor difference between the two methods.
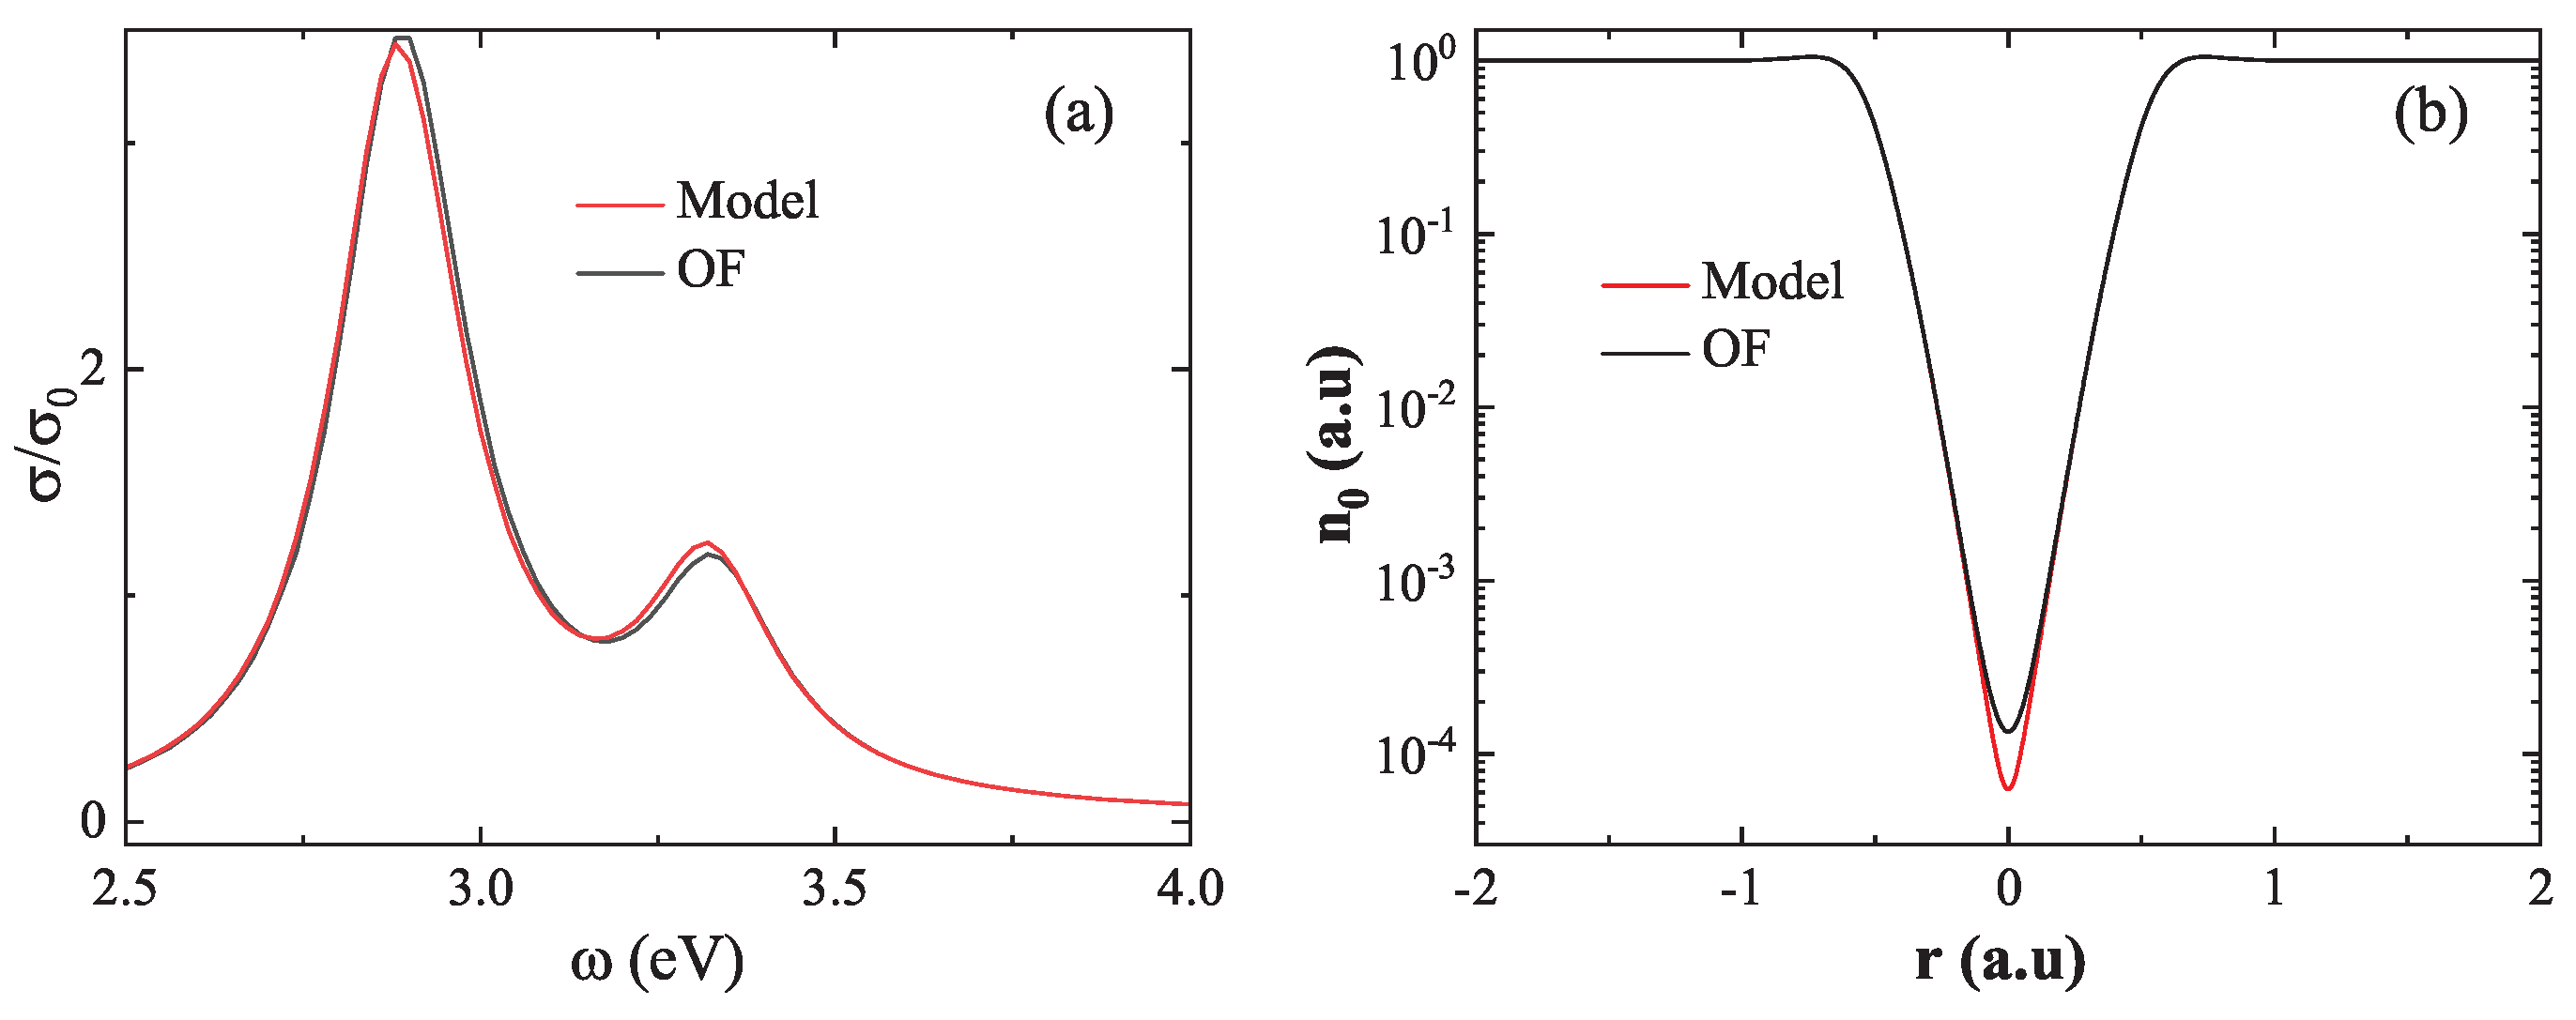
Figure 10.
LSP energy error between model and OF density as a function of dimer gap. The error remains small at large separations but increases rapidly below , signaling the breakdown of the linear superposition approximation in the strong-coupling regime.
Figure 10.
LSP energy error between model and OF density as a function of dimer gap. The error remains small at large separations but increases rapidly below , signaling the breakdown of the linear superposition approximation in the strong-coupling regime.
Disclaimer/Publisher’s Note: The statements, opinions and data contained in all publications are solely those of the individual author(s) and contributor(s) and not of MDPI and/or the editor(s). MDPI and/or the editor(s) disclaim responsibility for any injury to people or property resulting from any ideas, methods, instructions or products referred to in the content. |
© 2025 by the authors. Licensee MDPI, Basel, Switzerland. This article is an open access article distributed under the terms and conditions of the Creative Commons Attribution (CC BY) license (http://creativecommons.org/licenses/by/4.0/).
Copyright: This open access article is published under a Creative Commons CC BY 4.0 license, which permit the free download, distribution, and reuse, provided that the author and preprint are cited in any reuse.


