
Submitted:
08 July 2025
Posted:
09 July 2025
You are already at the latest version
Abstract
The growing need for cooling, combined with the environmental concerns surrounding conventional mechanical vapour compression (MVC) systems, has accelerated research for sustainable cooling solutions driven by low-grade heat. Single-stage dual-bed adsorption chillers (ADCs) using silica gel and water offer a promising approach due to their continuous cooling output, lower complexity, and use of environmentally safe working fluids. However, limitations in their performance, specifically in Coefficient of Performance (COP), cooling capacity (Qcc), and waste heat recovery efficiency (ηᴇ), necessitate improvement through optimisation. This study employs regression-based objective functions and optimizes ten decision variables using the Grey Wolf Optimizer (GWO) and its multi-objective variant (MOGWO). Results showed COP values between 0.5123 and 0.6859 and Qcc values from 12.45 to 20.73 kW. A one-at-a-time sensitivity analysis revealed non-linear and non-monotonic impacts of variables, confirming the physical realism of the MOGWO model. The framework effectively enhances ADC performance and low-grade heat utilization.
Keywords:
adsorption chiller
; multi-objective optimization
; grey wolf optimizer (GWO)
; MOGWO
; coefficient of performance (COP)
; cooling capacity (Qcc)
; waste heat recovery efficiency (ηₑ)
; parametric analysis
; sensitivity analysis
; low-grade thermal systems
1. Introduction
In the 21st century, air conditioning has become a necessity rather than a luxury. In hot, humid regions, people rely on air conditioning to alleviate the effects of high temperatures and maintain thermal comfort indoors, to reduce heat-related health risks (such as heat stroke, heat syncope), especially among vulnerable groups [1,2,3].
However, the widespread use of air-conditioners has a significant impact on global energy consumption. According to a report from the International Institute of Refrigeration (IIR), the refrigeration and air-conditioning (RAC) sector already consumes approximately 20 % of the world's total electricity, and space cooling alone accounts for over 8 % of worldwide electricity usage [4]. Under the International Energy Agency (IEA) “Baseline Scenario,” space cooling alone has the potential to triple electricity demand, and IIR further projects electricity consumption to more than double by 2050 [5]. This is largely due to rising AC ownership in emerging economies (India, China, Indonesia) and hotter ambient temperatures [5] In addition, the escalating rate in the world economy predicts a 2% to 3% yearly increment in electricity demand by 2030 [6].
Globally, the mechanical vapour compression (MVC) systems are the prevalent refrigeration and air conditioning (RAC) systems employed for cooling. MVC systems require a high quality of energy to run the compressor and initiate the cooling process (Moran, 2014; Yunus Cengel, 2014) and typically use HFC/HCFC refrigerants with high ozone-depletion and global-warming potential [7,8]. Current sector emissions from the refrigeration and air conditioning (RAC) account for 4.14 GtCO2eq, representing 7.8% of total global GHG emissions [9]. Without intervention, RAC-related CO₂ emissions are estimated to double due to their significant environmental footprint, with 63% stemming from indirect power-sector emissions and 37% global-warming impact from direct refrigerant leakages [4].
While increasing SEER standards provides some mitigations to enhance the efficiency of MVC systems, many air conditioners currently available operate at only one-third of the efficiency of the best available technology, leaving the remaining two-thirds underutilized [5]. These drawbacks of MVC systems and energy issues highlight the pressing requirement for a more radical, energy-efficient, and sustainable cooling alternative.
The adsorption cooling chiller is the most promising technology alternative to conventional high-energy-consuming MVC systems. Adsorption chillers, particularly multi-bed configurations, have emerged as a promising solution. They are entirely or partly powered by low-grade energy sources like waste heat from industries, solar, biomass, etc., for heating and cooling applications [8], offering advantages such as the utilization of environmentally benign refrigerants [10], durability, quiet operation, lower energy demands and use of simple controls Also, adsorption cooling systems can harness low-grade heat sources such as waste heat (which is usually discharged into the environment) or solar power (which is renewable) as heat sources, making them environmentally friendly [11].
Despite growing interest, suboptimal performance indicators like low Coefficient of Performance (COP), Specific Cooling Power (SCP) and sensitivity to operational parameters like variations in temperature, flow rates, and working fluids have held back wide-scale deployment of ADC.
Addressing these hurdles requires a robust approach to optimize the performance of single-stage dual-bed adsorption chillers and potentially extend the findings to complex bed adsorption chillers in the future.
Optimization techniques like single and multi-objective optimization employing advanced algorithms to investigate parametric interactions systematically can serve as potential approaches to enhance performance metrics and design criteria of adsorption chillers. Optimisation techniques are methods for finding optimal designs using computational approaches, and multi-objective optimisation deals with problems with more than one objective, where multiple solutions exist due to the conflicting nature of these objectives. Consequently, engineering problems encountered in real-life scenarios are usually multi-objective and fit the scope of multi-objective optimisation applications [12].
Multi-Objective Optimization is crucial in engineering applications like adsorption chillers and allows for the simultaneous consideration of multiple objectives, leading to a set of optimal solutions that represent various trade-offs between competing goals. Multi-objective optimization requires specific approaches: a priori, a posteriori, and progressive methods. A priori combines objectives into a single objective, while a posteriori maintains a multi-objective formulation.
Advancements in optimization algorithms include Mirjalili’s [12] improvement of multi-objective challenges in engineering by enhancing the Ant Lion Optimizer (ALO) to create the Multi-Objective Ant Lion Optimizer (MOALO) as a promising alternative to tackle a wide range of optimization challenges. Nadimi-Shahraki et al [13] also developed a novel variant of the grey wolf optimizer (GWO), referred to as the gaze cues learning-based grey wolf optimizer (GGWO). Application of GGWO to various engineering optimization problems showed its practical applicability in real-world scenarios against several benchmark functions and other optimization algorithms, demonstrating its superior efficiency and effectiveness. Krzywanski et al. [14] provided valuable insight into optimizing energy conversion by using genetic algorithms and artificial neural networks to create a non-iterative model that optimizes cooling capacity under varying load conditions for a Tri-bed twin-evaporator adsorption chiller. This novel approach helped identify optimal parameters that used low-temperature heat sources to effectively maximize the ADC's cooling output. This optimized model can serve as a useful tool for engineers when integrated into multigeneration systems to provide a quick and effective means of optimization without the need for extensive empirical experiments. Thus, making it a viable option for more complex numerical and analytical methods. Modifications in control software, such as changes in the sequence of switching valves, optimization of switching and cycle allocation, were reported to significantly improve COP by enabling heat recovery and mass regeneration. Interestingly, these changes can be implemented without altering the hardware, making them a cost-effective solution for the performance enhancement of adsorption chillers. Also, the overall stability of the system and lifespan of the chiller's operational qualities, like vibrations and noise improved after the modifications [15,16] . Furthermore, longer adsorption and desorption cycle times significantly improved the ADC's COP and cooling capacity, whereas switching times showed less impact on performance [16]. Another nature-inspired meta-heuristic optimization algorithm is the Whale Optimization Algorithm (WOA) proposed by Mirjalili and Lewis in 2016 [17]. The WOA’s performance was validated and benchmarked on six engineering design problems and twenty-nine optimization test functions.
These insights illustrate how optimization algorithms have been progressively adapted to meet the diverse needs of various engineering fields. As highlighted in this section, the evolution of optimization algorithms underscores their broad applicability across various engineering domains. Therefore, employing these algorithms in optimization of ADCs can extend the operational life and stability of the ADC system.
Although the Grey Wolf Optimizer (GWO), a nature-inspired metaheuristic, is widely applied in various optimisation contexts, it remains unexplored in the design, configuration, and operational optimisation of a single-stage dual-bed adsorption chiller. This study employs GWO to demonstrate the algorithm's efficacy in improving the coefficient of performance (COP), cooling capacity (Qcc), and waste heat recovery efficiency, and offers a comparative analysis of hand-tuned parameter sets against single-objective GWO and its multi-objective approach, MOGWO.
A handful of optimization techniques are displayed in Figure 1 [18] Meta-heuristic algorithms fall into five categories: swarm intelligence-based algorithms, bio-inspired algorithms, evolutionary algorithms, nature-inspired algorithms, and physics-based algorithms. Genetic Algorithm (GA) proposed by Holland [19] in 1992, it is the most recognised evolutionary class of algorithms, which was justified in Darwin’s evolution theory. This GA was used in real-world control system optimization by [20]. Other examples of evolutionary algorithms are Genetic Programming (GP), Differential Evolution (DE) [21], Biogeography-Based Optimizer (BBO) [22], Evolutionary Programming (EP) [23]. Artificial Immune System, Bacterial Foraging Optimization (BFO) and others are part of bio-stimulated algorithms [18]. GWO [24] falls under the swarm intelligence-based algorithms and is inspired by the social dominant hierarchy of grey wolves and their social hunting mechanism, like the intelligent behaviour of the other “swarms” under the swarm-based intelligence group, like the particle swarm [25] which is one of the commonly used optimizations, the Ant colony [18], Cuckoo search [26] and Firefly algorithms [27].
Adsorption cooling systems have been researched and proposed as a promising alternative to fossil fuel-consuming, high electrical energy-demanding VCSs.
Appraisals from the International Institute of Refrigeration in Paris have shown that refrigeration and air conditioning processes alone consume 20% of commercial and household energy. In contrast, only 80% of the total electricity generated worldwide is used for other electricity-demanding processes. These figures emphasise the urgent need for a sustainable alternative, such as ADCs capable of offsetting the significant global warming, ozone-depleting, and energy-intensive MVC paradigm [9].
Replacing even 50% of the current sales of MVC units with ADC systems could significantly save carbon credits and reduce energy consumption [28]. Among the modes of operation of adsorption processes, fixed-bed adsorption is the most employed. It could be only one bed or a combination of several adsorption/desorption beds in a complex system to increase the COP [29,10].
The single-stage, dual-bed adsorption chiller (ADC) is the most common basic laboratory-scale configuration. A major advantage of the single-stage, dual-bed configuration over the other bed fixtures is its ability to produce a continuous cooling effect [30].
Nevertheless, many variations of the basic ADC have been developed, studied and proposed to improve the performance of the adsorption chiller [31]. Multibed systems have been reported to reduce temperature fluctuations in the chilled water outlet and improve the usage of waste heat for waste heat ADCs [32,33,34,35]. Adding heat and mass recovery processes to the ADC has also been shown to improve the COP and cooling capacity of the ADC [36,37,38,39,40,41].
Table 1 summarises recent studies on two-bed, three-bed, and recovery-enhanced adsorbers, highlighting key performance indicators (KPIs).
Adsorption is a surface phenomenon that usually occurs between solid phases and gases in cooling applications. Certain solid phases (e.g., porous solids like clay, silica gel, etc.) can attract gas molecules onto their surfaces. Such solids are referred to as adsorbents, and the gas molecules they adsorb or surfaces on which adsorption occurs are termed adsorbates [50]. The adsorption process is exothermic, so energy is released during the process; thus, continuous cooling of the adsorbent bed is required during the adsorption process to remove the heat of adsorption. On the other hand, desorption is the process of removing adsorbents from the exterior of an adsorbate. It involves the application of heat to desorb the adsorbate from the surface of the adsorbent either by a reduction in pressure or an increment in temperature [7].
Silica gel is frequently employed as an adsorbent in ADCs due to its low desorption temperature, affordability, and environmentally friendly nature [51,52]. Also, it has an expansive specific surface area, which makes it effective at capturing substantial volumes of refrigerant vapour [53]. Water is the common refrigerant used in ADCs, due to its high latent heat and the self-evident environmental benefits. Therefore, the silica gel/water working pair is widely used for commercial, numerical and experimental studies of ADCs [54,55,56]. Zeolite/water [57], activated carbon/ethanol, activated carbon/methanol pairs, composites [58,59], selective water sorbents (SWS)–water [60,61] and Metal-organic frameworks (MOFs) [62,63] are other alternative adsorbent/adsorbate working pairs for ADCs.
Single-stage dual-bed ADCs typically use silica gel-water pairs due to their compatibility with low-temperature heat sources, such as waste heat below 100°C. Parameters like cycle time and heat exchanger capacity can be adjusted to optimize the performance of such ADCs [42,64].
Metaheuristics are high-level, stochastic global search techniques that can efficiently find good solutions in combinatorial optimization to find a range of feasible solutions, leveraging advanced optimisation methods [65]. Metaheuristic optimization of single-stage dual-bed adsorption chillers using waste heat is a promising approach to improve the efficiency and performance of cooling systems that use low-grade thermal energy
There have been many applications of metaheuristic optimization in different areas of the operation of adsorption chillers. A metaheuristic framework using particle swarm optimization (PSO) for material screening and operating optimization of adsorption-based heat pumps was proposed to evaluate different operation temperature intervals with emphasis on minimizing heat supply cost while maximizing performance to identify optimal temperature sets and adsorbents. Results showed a quick and intuitive assessment of multiple operation variables and design [66].
Genetic algorithms and neural networks have been shown to provide a non-iterative technique that yields fast and precise results to optimize the overall performance and cooling capacity of ADCs with a maximum relative error of less than ±10% between measured and calculated data. Such approaches are most suitable for studying the operating parameters on the cooling capacity of complex systems like tri-bed twin-evaporator chillers [67]
A global optimization method, like the particle swarm optimization was used to determine the optimum cycle time for a single-stage ADC, improving both the COP and specific cooling capacity [68]. Also, the augmented group search optimization (AGSO) algorithm was used to optimize the loading of multi-chiller plants. Higher convergence speed corresponded to lower energy consumption by avoiding local minima and addressing the hurdles of conventional group search optimization methods [69].
An improved nature-inspired firefly algorithm (IFA) performed better than the conventional method in minimizing the energy consumption of a multi-chiller system when it was applied to optimize chiller loading. Based on the characteristics of fireflies, the partial loading ratio of each chiller was optimized to improve energy conservation [70].
Factors such as heat exchanger parameters and adsorbent mass allocation can significantly impact the cooling capacity of ADCs. A study by Khan et al and Farid et al confirms the positive influence of optimization in improving cooling capacity [71,72].
For performance and efficiency, factors such as adsorbent mass allocation and heat exchanger parameters influence the cooling capacity of these systems. Optimising these factors can significantly improve cooling capacity, as demonstrated in various studies [73,74].
The COP and cooling capacity showed significant improvement when the ratio between the allocation of adsorption/desorption cycle times was optimised for a two-bed silica gel/water-based chiller [75].
To understand the impact of adsorbent characteristics on chiller performance, dynamic investigations on methanol adsorption in loose grain configurations and compact adsorbent layers were optimized to increase the effectiveness and speed of the adsorption process [76].
Theoretical investigations into the allocation of adsorption and desorption cycle times have shown that optimising the ratio between these modes can significantly improve system performance in terms of cooling capacity and coefficient of performance (COP). For instance, a two-bed silica gel/water-based chiller demonstrated improved performance by reducing the ratio of desorption to adsorption times [77].
For material and working fluid selection, optimal methanol-MOF pairs for adsorption-driven heat pumps and chillers were identified through high-throughput computational screening of metal-organic frameworks (MOFs), which enabled the selection of suitable working fluids and adsorbents to enhance the coefficient of performance (COP) and working capacity. High-throughput computational screening of metal-organic frameworks (MOFs) has been used to identify optimal methanol-MOF pairs for adsorption-driven heat pumps and chillers. This approach helps in selecting promising adsorbents and suitable working fluids, enhancing the system's working capacity and COP [75].
Furthermore, recent studies have explored the optimization of single-stage two-bed adsorption chillers, which can utilize low-grade waste heat or solar energy for cooling applications. Researchers have developed lumped parameter models to analyze and optimize chiller performance, considering factors such as cycle time, adsorbent thickness, and operating temperatures [78,79].
Advanced optimization approaches have been proposed, including simultaneous optimization of operational and material parameters [80] and the use of artificial neural networks for performance prediction and optimization [81]. These studies have focused on improving key performance indicators such as cooling capacity (CC) and coefficient of performance (COP). For instance, an optimum cooling capacity of 5.95 kW was reported for an optimized two-bed silica gel–water ADC [82]. Also, a three-bed adsorption chiller yielded an enhanced maximum cooling capacity of 12.7 kW and a COP of 0.65 through optimization of the chiller by genetic algorithms and neural networks [14].
Despite the numerous advances in metaheuristic optimization, most optimizations are targeted at enhancing the thermodynamic cycle-time allocations, material selection, and multi-bed configurations, with a few on the simultaneous optimization of all key decision variables (temperatures, mass flows, UA’s) for a single-stage dual-bed ADC under low-grade waste-heat applications [80,82]. Therefore, there remains a lack of comprehensive multi-objective optimization frameworks that:
- Simultaneously optimize COP, Qcc, and waste-heat recovery efficiency (ηₑ) in a single-stage dual-bed silica-gel/water ADC,
- Validate decision variables (inlet temperatures, mass flows, UA’s) against experimentally supported ranges, and
- Perform sensitivity analysis on reciprocal-transformed objectives to ensure thermodynamic realism across the operating window.
To address this gap, the present study will:
- Develop a novel MOGWO-based approach for optimizing a single-stage dual-bed adsorption chiller.
- Optimize the Coefficient of Performance (COP), cooling capacity (Qcc), and waste heat recovery efficiency (ηₑ).
- Conduct a one-at-a-time (OAT) sensitivity analysis to quantify how key decision variables influence each objective.
2. Materials and Methods
The single-stage dual-bed ADC described in this paper is according to the study by Papoutsis et al [83]. The main components, as shown in Figure 2, are an evaporator, two adsorbent beds, and a condenser. The condenser and evaporator are connected to the adsorbent by valves (VA–VD), and the adsorbent beds are the fin and tube heat exchangers with adsorbent materials packed between their fins to improve heat exchange.
In Mode A, valves VA and VD are closed, and VB and VC remain open. Adsorbent Bed 1 connects with the evaporator to initiate the adsorption-evaporation process. The chilled water supplies heat to the adsorbate (water) to boil in the evaporator at a low pressure while reducing the temperature. This causes adsorption of the refrigerant vapours from Bed 1. Heat rejected during the adsorption process is sent to the cooling water circuit. Simultaneously, the desorption-condensation process also happens in Bed 2 and the condenser. Heat is supplied to Bed 2 to desorb the refrigerant collected in the adsorbent material, sending the heat of condensation to the cooling water circuit. Modes A and B can alternate as an adsorber or desorber according to the opening and closing of the valves and pressure gains or losses.
Based on the system description in Figure 2 and Section 3.1, the three linear regression equations used as objective functions for the single-stage dual-bed adsorption chiller are as follows:
- Maximise COP: For adsorption cycles, COP is a key performance indicator calculated by estimating the cooling and heating within the evaporator and condenser, respectively. The formula for the chiller's COP can be expressed as in equation (1) [64].
= half cycle time
= chilled water mass flow rate
= specific heat capacity of water
= chilled water inlet temperature
= chilled water outlet temperature
= hot water inlet temperature
= hot water outlet temperature
The linear regression equation of COP for the single-stage dual-bed ADC is shown in equation 2, according to [83] as:
with adjusted where,
= cooling water inlet temperature
= mass flow rate of hot water
= cooling water mass flow rate of bed
= cooling water mass flow rate of condenser
= adsorbent bed overall thermal conductance
= evaporator overall thermal conductance
= condenser overall thermal conductance
- 2.
- Maximize Cooling Capacity (): Cooling capacity is another primary indicator of adsorption chiller performance. Qcc is defined in equation 3 as [16]:
The linear regression representation of Qcc for the single-stage dual-bed ADC is defined according to [84] as equation 4:
with adjusted
- 3.
- Maximize waste heat recovery efficiency (): Effective heat recovery strategies are pivotal in enhancing the efficiency of ADCs, and heat recovery is shown to influence the overall system performance [85]. Thus, is defined as a performance indicator for the single-stage dual-bed adsorption chiller according to [84] by equation 5:
The regression equation for is represented by equation 8 [84] as:
With adjusted
Based on the objective functions from equations (2), (4) and (6), the decision variables and bounds are presented in Table 2.
These decision variables are selected based on their coefficients [79]. A glance at the adjusted R2 values of for COP, for Qcc and for described in the regression analysis equations for the selected decision variables, suggest that the selected equations provide a good fit for the data. Comparatively, the high adjusted R-squared values across all three objective functions (COP, Qcc, and ηe) confirm the suitability of the chosen equations for modelling the relationships between the variables.
2.1. Greywolf Optimization (GWO)
This study employs the GWO, a novel swarm-intelligence algorithm inspired by the grey wolves' social dominance hierarchy and hunting strategy to find optimal solutions for optimisation problems [86]. In the GWO framework, the best-performing solution is designated alpha (α), signifying the top rank in the wolf’s social structure. The subsequent two best solutions are designated beta (β) and delta (δ), respectively, and the remaining solutions are labelled omega (ω). The α, β, and δ wolves lead the hunting process, with the ω wolves following their lead to find the global optimum. Greywolves begin encircling their prey during hunting by employing the equations shown below [24].
Equation (7) shows how the position vector, of grey wolves is calculated.
Where,
= current iteration
= coefficient vector
= position vector
= position vector of the prey
The wolf’s position at the next step, is then updated according to equation (8) as,
where,
= coefficient vector
This update adjusts the wolf's position to the prey's position and the calculated vector , influencing the encircling behaviour.
Equations (9) and (10) are employed to calculate the coefficient vectors and , respectively.
Components and contain random values between 0 and 1 and decrease linearly from 2 to 0 during the iterative optimisation process. GWO algorithm generates a random set of solutions when optimisation starts. The algorithm then saves the top three solutions and updates the positions of the remaining search agents to their optimum solutions. When the termination criteria are met, the alpha solution’s location and value define the global optimum. Equations (11) to (13) calculate how far away the search agent is from the three leader wolves. , , and represent the distance and direction of the current search agent (wolf) to the alpha (α), beta (β), and delta (δ) wolves, respectively. is the current position of search agent and is a coefficient vector. and are the positions of the alpha, beta, and delta wolves.
Equations (14) to (16) use the distance from each of the three top wolves to calculate a probable next position for the search. Thus, these equations update the position based on the leaders. , and denote the next position of the search agent according to the influence of the alpha, beta, and delta wolves, respectively. , and are coefficient vectors.
Equation (17) determines the final position of the search agent by finding the average of , and at the next iteration, to balance the influence of the alpha, beta, and delta wolves.
The optimisation methodology followed by this study and the general GWO optimisation flow chart for a single objective optimisation is illustrated in Figure 3 and Figure 4.
In energy systems, a problem could have multiple conflicting objective functions. In such instances, a multi-objective optimisation approach can be used to simultaneously generate a set of alternative feasible solutions. These solutions are referred to as Pareto Front Optimal or non-dominated solutions. Figure 5 illustrates the flowchart for the multi-objective GWO technique. To adapt the standard GWO algorithm for multi-objective optimisation (MOGWO), two extra elements are included: the archive, to store the Pareto optimal solutions that are non-dominated. A leader selection mechanism, which chooses the alpha and beta wolves from the archive to head and direct the search.
3.3. Mathematical Formulation
The Grey Wolf Optimizer (GWO) is mathematically formulated according to equations (18) to (20) to maximize the thermodynamic performance of a single-stage dual-bed silica gel–water ADC. These equations serve as a basis for implementing the GWO algorithm to individually improve each performance indicator.
The single-objective optimisation of the Coefficient of Performance (COP) is expressed as:
Similarly, the optimisation of Cooling Capacity (Qcc) is defined as:
The objective function for Waste Heat Recovery Efficiency (ηe) is written as:
The multi-objective optimization problem combines the three objectives as equation (21):
Equations (18) – (21) are subject to the following variable constraints:
[oC]
[oC]
[oC]
[kg/s]
[kg/s]
[kg/s]
[kg/s]
[W/K]
[W/K]
[W/K]
ChatGPT (OpenAI) was utilised in a limited capacity to clarify specific technical concepts and assist with minor debugging in MATLAB during the algorithm implementation and sensitivity analysis. All outputs were thoroughly reviewed and validated by the authors to maintain academic integrity, originality and accuracy.
3. Results
3.1. Single-Objective Optimization
The core single-objective grey wolf optimization algorithm implemented in this study was adapted from the original work by Mirjalili et al [24] which is available online. The algorithm was tailored to the characteristics of the three objective functions, the selected decision variables and implemented on the MATLAB platform using a 64-bit operating system, an x64-based processor, 8GB RAM 12th Gen Intel(R) Core (TM) i7-1255U CPU @ 1.70 GHz laptop.
3.1.1. Coefficient of Performance (COP) Maximization
To identify the conditions for maximum COP, the GWO algorithm was used to solve Equation (2) with the decision variables and values from Table 2. The resulting data in Table 3 presents the control strategies identified based on the direction of the decision variables. To achieve the optimal COP of 0.69695, the following control strategies were identified based on the direction of decision variables:
- Increasing , , , , and ;
- Maintaining a lower value for ;
- Moderate values for and .
3.1.2. Cooling Capacity (Qcc) Maximization
To identify the conditions for maximum COP, the GWO algorithm was used to solve Equation (4) with the decision variables and values from Table 2. To achieve a maximum Qcc of 20.76 kW, the following variable adjustments depicted in Table 4 are required:
- Maximizing , , , , , and
- Minimizing and
- Moderating
3.1.3. Waste Heat Recovery Efficiency (ηe) Maximization
To identify the conditions for maximum COP, the GWO algorithm was used to solve Equation (4) with the decision variables and values from Table 2. To achieve a maximum Qcc of 20.76 kW, the following variable adjustments depicted in Table 4 are required:
- Maximizing , , , , , and
- Minimizing and
- Moderating
3.1.4. Analysis of the Single-Objective Optimization Results
Table 6 presents a concise overview of the findings from Section 4. It illustrates the trend of the decision variables under each single-objective optimization case. An upward arrow (↑) indicates that the variable increases at optimality, a downward arrow (↓) means it decreases, while (≠) denotes that the trend is in conflict across the objective functions.
3.2. Multi-Objective Optimization
The multi-objective grey wolf optimization algorithm implemented in this study was adapted from the original work by Mirjalili [88] which is available online. The algorithm was tailored to the characteristics of the three objective functions, the selected decision variables and implemented on the MATLAB platform using a 64-bit operating system, an x64-based processor, 8GB RAM 12th Gen Intel(R) Core (TM) i7-1255U CPU@ 1.70 GHz laptop. The set values of the hyperparameters are provided in Table 7.
The MOGWO algorithm generated 100 sets of non-dominated solutions. The Pareto front from the simultaneous optimization of all three objective functions representing the best trade-offs is shown in Figure 6. Each solution on the Pareto front offers a potential trade-off, with the final selection dependent on the decision maker's priorities. The relationships between the objective functions—COP, Qcc, and ηe—were explored through three pairwise scenarios. The resulting overall Pareto front for these three objectives is shown in Figure 6. For clarity and to highlight key interactions, two two-dimensional Pareto fronts derived from these results are subsequently analyzed.
Figure 6 illustrates the achievable performance limits and the inherent trade-offs between COP, cooling capacity, and waste heat recovery efficiency. The Pareto front guides the decision-maker in identifying and selecting the most suitable operating points that could lead to improvement across the three objectives. The colour gradient on the surface indicates that attaining higher Qcc requires a compromise on COP and may lead to a lower waste heat recovery efficiency. Additionally, a compromise on the potential Qcc and the amount of waste heat recovered is necessary to achieve a higher COP. The colour gradient also illustrates how eta varies across the Pareto front, confirming that achieving greater eta necessitates operating the chiller within specific ranges of Qcc and COP, which may require a sacrifice in one or both areas.
The two-dimensional Pareto front shown in Figure 7 shows an inherent negative correlation between maximizing the chiller's energy efficiency (COP) and its ability to recover waste heat (ηe). The close grouping of the grey wolves around the Pareto front suggests that the MOGWO algorithm effectively found the optimal trade-off solutions for these two objectives. Based on the relative significance of COP and ηe, decision-makers must select a point along this Pareto front. They will tilt towards the left side of the Pareto front if their specific application requires energy savings and reduced operational cost, but not higher waste heat recovery efficiency. On the other hand, if optimizing the use of waste heat (higher ηe) is more important, they would lean towards a solution on the right side of the Pareto front, understanding that the ADC's COP will be reduced. Middle-range solutions represent a compromise between these two objectives.
The two-dimensional Pareto front depicted in Figure 8 reveals a strong positive relationship between the Coefficient of Performance (COP) and the Cooling Capacity (Qcc). From Figure 8, operating the ADC at a solution that yields a higher Qcc corresponds to a higher COP. This observed positive correlation is a desirable trait for system performance, reflecting the fundamental thermodynamic and operational characteristics of a single-stage, two-bed ADC.
The two-dimensional Pareto front in Figure 9 shows a clear negative correlation between Cooling Capacity (Qcc) and Waste Heat Recovery Efficiency (ηe). Although the mid-range of both objectives seems to have a slightly sparser distribution, the non-dominated solutions form a rather smooth and distinct curve that effectively represents the ideal trade-offs between Qcc and ηe. The black dots (representing the individual grey wolf search agents) are densely concentrated around the Pareto front, indicating the algorithm converges toward the best trade-off solutions. A solution that leans left will be most preferable if the decision-maker's top priority is to maximize waste heat recovery, even at the expense of Qcc. If a high cooling capacity is more important, a solution on the right side of the Pareto front is ideal, understanding that the waste heat recovery efficiency will be lower. whereas a solution in the middle represents a compromise between these two objectives.
To validate the MOGWO results, benchmark data from Chua, Ng & Saha [31,89] for a two-bed, single-stage silica-gel/water ADC (= 90 °C, = 25 °C) is used as the baseline against which the Pareto-optimal solutions were compared.
Table 8 presents COP ranges, cooling capacities (Qcc), waste-heat recovery efficiencies (ηₑ), and boundary condition details for the MOGWO Pareto-optimal results in comparison to Chua, Ng, and Saha’s model. As indicated in Table 8, the COP values for the MOGWO Pareto-optimal range from 0.5123 to 0.6859, exceeding Chua, Ng & Saha’s range of 0.50 to 0.65 for a two-bed silica-gel/water ADC at = 90 °C, = 25 °c. In contrast to Chua et al.’s cooling capacity values, which range from 6 to 10 kW under similar conditions, the Qcc for the MOGWO spans from 12.45 to 20.73 kW. Although Chua et al. did not specifically mention ηₑ, they qualitatively stated that approximately 10 to 12% of the supplied heat becomes useful cooling at of 90 °C and of 25 °C. Meanwhile, the MOGWO front yielded ηₑ values of approximately 0.0824 to 0.1248 (8.24 to 12.48 %), which closely aligns with that benchmark. This validates consistent trends among improvements in COP, Qcc, and ηₑ.
3.3. Sensitivity
Sensitivity analysis (SA) was used to assess how each decision variable influenced the COP, Qcc and ηₑ. The goal was to test the robustness of the MOGWO model and identify the range of parameters with major impact on the ADC system’s behaviour [90,91]. The impact of each decision variable was isolated using the One-at-a-Time (OAT) approach to eliminate confounding interactions. All other variables were kept at their baseline values while each variable was changed across three representative levels: the lower bound, midpoint and upper bound of its design range. The OAT approach is simple, reliable and complements MOGWO since it allows post-optimisation perturbation testing of optimal solutions [92]. The MOGWO algorithm framework was modified for each sensitivity analysis, maintaining the hyperparameters as listed in Table 7. Twenty independent MOGWO runs were performed to guarantee statistically stable Pareto fronts [93,94]. Cubic polynomial fits were used to extract the cloud of Pareto-optimal points for the objectives generated after each run. These trends were plotted as Qcc against COP, ηₑ against COP and ηₑ against Qcc. Results from each plot were thoroughly presented and discussed.
3.3.1. Effects of Varying Hot Water Inlet Temperature
Figure 10 describes the sensitivity of hot-water inlet temperature on the system performance. Plot (a) shows a stratified trend. The optimal thermal performance is observed at 65 °C (blue) while both COP and moderately decline at 80 °C (orange) and are significantly reduced at 95 °C (yellow). Plot (b) reveals an improvement in at 95 °C despite COP peaking at 65 °C. Plot (c) shows a thermodynamic trade-off as reduces with increasing but performs better at higher . The trend observed in plot (a) shows that the COP does not increase monotonically with hot water temperatures, and the ideal hot water temperature for optimizing COP is often around 80°C, as supported by Chang et al. [95] and Marlinda et al. [96]. Interestingly, the trend in (b) and (c) suggests that a higher hot water inlet temperature improves . This can be attributed to better thermal energy absorption at higher driving temperatures and an increase in hot water and adsorption cooling water temperatures (∆T), resulting in faster and more efficient heat transfer. This makes the chiller absorb more heat from the waste source [97,98].
3.6.2. Effects of Varying Cooling Water Inlet Temperature
Figure 11 displays three subplots illustrating the effects of varying the cooling water inlet temperature. In Plot (a), the ADC’s performance deteriorates as increases from 29 °C (orange) to 36 °C (yellow), shifting the points downward and to the left, while lower inlet temperatures (22 °C, blue) correspond to higher COP and . Conversely, Plot (b) reveals a slight decline in both performance metrics as increases indicating a reduction in the effectiveness of heat rejection. Plot (c) demonstrates a mild trade-off as increasing slightly improve but deteriorates . These patterns are consistent with Alsarayreh et al., who attributed elevated exergy losses and decreased heat rejection efficiency as the cause of decreasing performance metrics (COP, ) at increasing recooling temperatures [99].
3.3.3. Effects of Varying Chilled Water Inlet Temperature
Figure 12 presents three subplots illustrating the effects of varying chilled water inlet temperature. In Plot (a), both COP and decline as increases from 10 °C (blue) to 20 °C (yellow), with the lowest yielding the best thermal performance.
Plot (b) shows a similar downward trend for , with declining in tandem with increasing . This suggests a consistent reduction in waste heat recovery efficiency. Plot (c) further supports these observations, as and are both high at the lowest , indicating a clear disadvantage of operating at higher . These trends align with the findings from Elsheniti et al. and Sah et al. [100,101] who reported that reducing the chilled water inlet temperature enhances the evaporators' driving potential. This boosts the vapour uptake capacity and improves the overall ADC performance.
3.3.4. Effects of Varying Bed Cooling Water Mass Flow Rate
Figure 13 illustrates the effects of varying the adsorbent bed cooling water mass flow rate. Plot (a) shows that increasing from 0.8 kg/s (red) to 2.2 kg/s (blue) reduces both and COP compared to better performance observed at lower . Plot (b) shows a relatively stabilised that slightly declines as increase, with the 0.8 kg/s (red) line above the others. Plot (c) reinforces the effects of higher on and . The red curve still shows superior performance compared to the green and blue, just like plot (b). The concept of optimal operating conditions [102,103] is prevalent for , as the trends from plots (a) to (c) indicate that increasing cooling water mass flow rates beyond a threshold is disadvantageous to the ADC’s system performance. Baudouy (2014) confirms that increasing fluid velocity beyond a certain limit might increase pumping power and pressure drops, which could reduce net system efficiency [104,105] .
3.3.5. Effects of Varying Hot Water Mass Flow Rate
Figure 14 shows the effects of varying the hot water mass flow rate. Plot (a) exhibits the highest COP and at the lowest flow rate of 0.8 kg/s (red). Performance degrades steadily as increases to 1.5 kg/s (green) and 2.2 kg/s (blue), although there is a consistent upward trend across all levels. For Plot (b), the red dots (0.8 kg/s) are clustered around the upper band, while the blue (2.2 kg/s) are concentrated at the lower values. This shows a systematic decline in as increases. Plot (c) captures a performance trade-off. Although thermal input increases at higher , it does not proportionally improve and . These trends from plots (a), (b) and (c) confirm the existence of an optimal operating for ADCs [106]. Overly high raises entropy generation, limits internal heat transfer, increases heat imbalance between adsorbent layers and tends to worsen the overall system efficiency [48,102]. This finding supports a moderate , which is represented as 1.5 kg/s from Figure 14.
3.3.6. Effects of Varying Chilled Water Mass Flow Rate
Figure 15 explores the influence of varying the chilled water mass flow rate on system performance. In plot (a), the progressive downward and leftward shift of the blue (1.4 kg/s) cluster reveals how both the COP and are impaired at high values. The best performance for COP and occurs from 0.2 to 0.8 kg/s. In plot (b), the COP and moderately increase at higher and rapidly decline at 0.2 kg/s compared to 0.8 kg/s. A characteristic trade-off is observed in plot (c). Lower (red) retains a substantial portion of input heat as useful work to enhance both and , but the midrange flow (green) balances the performance of and . Thermodynamically, although higher enhances convective heat transfer [107] it could reduce the temperature gradient and increase parasitic energy input [108,109]. This could lead to initial improvements in heat transfer but diminishing efficiency above a certain threshold. This is consistent with the observed MOGWO results, where both lower and higher flows diminish ηₑ, but a mid-range hot-water flow maximises both COP and .
3.3.7. Effects of Varying Condenser Cooling Water Mass Flow Rate
Figure 16 illustrates the effects of varying the condenser cooling water mass flow rate. In plot (a), the red cluster and curve (0.8 kg/s) show a consistent positive slope and increased COP and The green (1.5 kg/s) and blue (2.2 kg/s) curves slightly flatten, indicating reduced performance at elevated . A non-linear trend is observed in plot (b) as higher suppresses although initially improving COP to some extent. Plot (c) shows an overlapping green and blue lines, with the red (0.8 kg/s) displaying a higher for a given . The overlapping green and blue lines indicate may not improve tremendously above moderate . The diminishing returns of increasing fluid flow are supported by (Al-Waaly et al., 2025 and [110]. Increasing fluid flow could increase entropy generation, irreversibilities and limit the thermal interface of heat transfer, thereby increasing system inefficiencies [111].
3.3.8. Effects Varying Adsorbent Bed Overall Thermal Conductance
Figure 17 illustrates the effects of varying the bed's overall thermal conductance. Plot (a) shows a declining trend in both COP and at mid-range (6000 W/K, purple) and high (10000 W/K, sky blue) values of . However, lower (2000 W/K, orange) results in superior COP and . In Plot (b), the orange cluster dominates the range, while the highest (10000 W/K) points remain clustered at the bottom. This indicates a reduction in as exceeds mid-range values. Plot (c) reinforces Plot (b) and demonstrates that and Eta are better balanced at the lower and mid-range values, confirming that excessive thermal conductance may be detrimental to the ADC’s performance. Although increasing enhances convection, thereby increasing and COP, there always exists an optimal above which performance deteriorates [112]. Therefore, excessively high values could reduce the essential internal temperature swings required for effective adsorption cycles [113,114]. There is a need to balance with adsorbent mass, sorbent thermal degradation, cost effectiveness, and other design factors [114].
3.3.9. Effects of Varying Evaporator Overall Thermal Conductance
Figure 18 illustrates the effects of varying evaporator overall thermal conductance on the optimal objective functions. Plot (a) shows that increasing from 2000 W/K (orange) to 6000 W/K (purple) increases both COP and . A marginal improvement in is observed at 10,000 W/K (sky blue) [115,116]. Plot (b) reveals an initial peak increment in around 6000 W/K before flattening at higher values. Plot (c) confirms declining returns above the mid-range conductance for , while modestly rises. Even though research consistently confirms the positive correlation between increased and ADC performance [115], overly high values can equilibrate temperatures quickly, which could reduce the driving force needed for phase change [116]. Figure 18 shows that 6000 W/K offers the best compromise between COP, , and . Exceeding this threshold may compromise the ADC’s stability and negate performance gains.
3.3.10. Effects of Varying Condenser Overall Thermal Conductance
Figure 19 illustrates the effects of varying the condenser's overall thermal conductance on the optimal objective functions using three subplots. Plot (a) shows that COP and are inversely proportional to as indicated by the orange trajectory (2000 W/K), which yields the highest performance. In Plot (b), compared to COP, increases modestly around mid and high values. Plot (c) shows a performance-efficiency trade-off as the distribution of is rather flat, even while improves at lower The observed trends in plots (a) and (b) are plausible for ADC systems [117]. Despite the lack of research to explicitly confirm the threshold of "6000 W/K" as the point above which the COP and adversely diminish excessively high conductance could lead to smaller temperature gradients across heat exchangers and undermine second-law efficiency. This could reduce performance beyond a certain point [97]. Figure 19 emphasises that there is a conductance threshold likely between 2000–6000 W/K beyond which the performance of the single-stage dual-bed ADC diminishes. This highlights the need to effectively design the condenser by balancing overall thermal conductance, temperature differentials and reducing entropy generation.
4. Discussion
The detailed sensitivity findings presented above revealed that the MOGWO framework demonstrated a unique and physically consistent pattern in the variations of each of the ten decision variables of the adsorption chiller. Temperature-based input showed a clear trade-off. For instance, a higher hot-water inlet temperature decreased the cooling capacity but enhanced waste heat recovery efficiency. This outcome consists of thermal irreversibility effects reported by Papoutsis et al [83] and Alsarayreh et al. [97].
Likewise, there was a reduction in system performance when the cooling water inlet temperature increased. The most influential parameters were identified as flow rate and chilled water temperature, as optimising them exhibited significant improvement in cooling capacity and COP. This demonstrates their crucial role in evaporator-side heat extraction. On the other hand, non-linear patterns were observed as cooling and hot water mass flow rates increased. Waste heat recovery efficiency declined at very high mass flow rates. due to an increase in parasitic heat input.
The thermal conductances enhanced the ADC's performance up to a certain point, before showing diminishing returns. This observation indicates how oversizing could lead to flattening of the temperature gradients and impede the adsorption-desorption process. Rather than monotonic improvement, the findings revealed trade-offs between most of the variables. This reinforces the need for multi-objective optimization and validates the robustness of the regression-based MOGWO model.
5. Conclusions
This study demonstrates the effectiveness of Grey Wolf Optimizer (GWO) and Multi-Objective Grey Wolf Optimizer (MOGWO) in maximising the performance of a silica gel–water single-stage dual-bed adsorption chiller. Regression models that have been statistically validated were used to formulate objective functions for three key performance indicators: Coefficient of Performance (COP), cooling capacity (), and waste heat recovery efficiency (ηₑ). Furthermore, a One-At-A-Time (OAT) sensitivity analysis was carried out to guarantee the optimisation model's physical consistency and robustness. The study demonstrates that it is feasible to integrate metaheuristic algorithms into the design and improvement of low-grade heat thermally driven cooling systems.
The main findings and outcomes are as follows:
- A multi-objective optimization approach based on MOGWO was used to identify Pareto-optimal sets of decision variables governing the performance of a single-stage dual-bed ADC. These comprised how water, cold water and chilled water inlet temperatures, overall thermal conductance, and mass flow rates of working fluids. Instead of a single “best” solution, this approach rather generated a set of trade-off solutions.
- The ADC's performance was evaluated by three objective functions: COP, , and ηₑ. Linear regression equations derived and statistically validated (R² > 0.95) from a previously published study were used directly in the MOGWO fitness functions.
- By employing the GWO and MOGWO approaches, optimal and non-dominated solutions were generated, providing a range of trade-offs for performance enhancement. The MOGWO front exhibits COP values ranging from 0.5123 to 0.6859 and Qcc values from 12.45 to 20.73 kW, both surpassing Chua, Ng & Saha’s reported 0.50 – 0.65 COP and 6 –10 kW at = 90 °C, = 25 °c. The MOGWO solutions attained ηₑ values between 0.0824 and 0.1248 (8.24–12.48 %), which aligns with the qualitatively reported ηₑ range of approximately 10–12 % according to Chua, Ng & Saha.
- All MOGWO selected decision variables fall within Chua et al.’s validated ranges for = 22.01 °C (Chua et al. tested down to 20 °C and up to 25 °C), = 86.77 °C (Chua et al. used 90 °C), ṁ₍chw₎ = 0.80 kg/s and ṁhw = 1.50 kg/s (Chua et al. used 0.7–0.9 kg/s and 1.0–1.5 kg/s, and UA₍evap₎ = 6 000 W/K and UA₍cond₎ = 17 000 W/K (order 10³ W/K, matching finned-tube UAs). This close alignment confirms the predictive accuracy of the MOGWO regression models.
- By minimally altering the MOGWO algorithm architecture, One-at-a-Time (OAT) sensitivity analysis was conducted, allowing each decision variable to fluctuate within its physical range while maintaining the baseline values.
- Smoothed Pareto plots were used to examine and interpret the performance of three performance indicators: coefficient of performance (COP), Cooling Capacity (), and Waste Heat Recovery Efficiency ().
- Hot water inlet temperature showed an energy–efficiency trade-off evident from its non-linear influence as higher values improved ηₑ but degraded COP.
- The adsorbent bed cooling water inlet temperature had a significant impact on COP and . Higher resulted in increased bed exergy losses due to a reduction in thermal rejection efficiency.
- The most significant variables that increased and COP were the chilled water mass flow and inlet temperatures, demonstrating their critical importance in evaporator-side heat extraction.
- The thermal fluid variables, especially the flow rates of hot water () and chilled water (), had a significant impact on all three objectives, as seen by distinct optima rather than monotone trends.
- At very high levels, all three overall thermal conductances, , and showed diminishing returns, and COP and ηₑ either decreased or plateaued beyond mid-range values. This underscores the necessity of balancing all parameters during the design of the adsorption chiller.
- Overall, the robustness and physical consistency of the MOGWO regression-based model were reinforced as the SA verified the presence of trade-offs and the model's sensitivity to both thermal (, , or ) and hydraulic (, , or) conditions across all parameters.
- Ultimately, the study confirms the effectiveness of metaheuristics (like MOGWO) in ADC design and combines algorithmic optimization, regression modelling, validation against a well-established experimental model, and sensitivity analysis, to model a robust decision-support framework for ADC system design driven by low-grade waste heat.
Author Contributions
For Conceptualization, methodology, formal analysis, writing—original draft preparation, P. K-B.; writing—review and editing, supervision, L.T. and J. T-C. All authors have read and agreed to the published version of the manuscript.
Funding
This research received no external funding.
Data Availability Statement
Data generated during the study are unavailable due to ethical restrictions.
Conflicts of Interest
The authors declare no conflict of interest.
Abbreviations
The following abbreviations are used in this manuscript:
ADCs Adsorption Chillers
MVC Mechanical Vapour Compression
COP Coefficient of Performance
GWO Grey Wolf Optimizer
MOGWO Multi-Objective Grey Wolf Optimizer
HFC Hydrofluorocarbon
HCFC Hydrochlorofluorocarbon
RAC Refrigeration and Air Conditioning
GHG Greenhouse Gas
SEER Seasonal Energy Efficiency Ratio
KPI Key Performance Indicators
PSO Particle Swarm Optimization
References
- A. Barreca, K. Clay, O. Deschenes, M. Greenstone, and J. S. Shapiro, ‘Adapting to Climate Change: The Remarkable Decline in the US Temperature-Mortality Relationship over the Twentieth Century’, Journal of Political Economy, vol. 124, pp. 105–159, 2016. [CrossRef]
- J. Graff Zivin and M. Neidell, ‘Temperature and the Allocation of Time: Implications for Climate Change’, J Labor Econ, vol. 32, pp. 1–26, 2014. [CrossRef]
- L. Gurtovoi, S. D. Voropaeva, A. I. Emelianova, and I. E. Sokolova, ‘[Present-day etiology and antibacterial therapy of puerperal endometritis]’, Akush Ginekol (Mosk), vol. 4750, 1988.
- D. Coulomb and J.-L. Dupont, ‘The Impact of the Refrigeration Sector on Climate Change. Available at http://www.iifiir.org/userfiles/file/publications/notes/NoteTech_35_EN_uz7bwths.pdf ’, Paris, Nov. 2017.
- International Energy Agency, ‘The Future of Cooling: Opportunities for energy-efficient air conditioning. Available at: https://www.iea.org/futureofcooling/ ’, Paris, France, 2018.
- B. Faith, The Future of Cooling: Opportunities for Energy-Efficient Air Conditioning (Report of the International Energy Agency). Paris, France, 2018.
- B. Karki, ‘Experimental and Life Cycle Analysis of a Solar Thermal Adsorption Refrigeration (STAR) Using Ethanol - Activated Carbon’, 2018.
- G. William, Y. Jim, and J. Caitlin, ‘Alternatives to Vapor-Compression HVAC Technology’, ASHRAA, vol. 56, p. 12, 2014.
- J.-L. Dupont, The Role of Refrigeration in the Global Economy (2019), 38th Note on Refrigeration Technologies. IIF-IIR, 2019.
- P. Goyal, P. Baredar, A. Mittal, and A. R. Siddiqui, ‘Adsorption refrigeration technology ? An overview of theory and its solar energy applications’, Renewable and Sustainable Energy Reviews, vol. 53, pp. 1389–1410, 2016. [CrossRef]
- D. Mugnier and V. Goetz, ‘Energy storage comparison of sorption systems for cooling and refrigeration’, Solar Energy, vol. 71, pp. 47–55, 2001. [CrossRef]
- S. Mirjalili, ‘Grey Wolf Optimizer (GWO) ’. Accessed: Jan. 29, 2025. [Online]. Available: https://ch.mathworks.com/matlabcentral/fileexchange/44974-grey-wolf-optimizer-gwo.
- M. H. Nadimi-Shahraki, S. Taghian, S. Mirjalili, H. Zamani, and A. Bahreininejad, ‘GGWO: Gaze cues learning-based grey wolf optimizer and its applications for solving engineering problems’, J Comput Sci, vol. 61, p. 101636, 2022. [CrossRef]
- J. Krzywanski et al., ‘Optimization of a three-bed adsorption chiller by genetic algorithms and neural networks’, Energy Convers Manag, vol. 153, pp. 313–322, 2017. [CrossRef]
- M. Chorowski, P. Pyrka, Z. Rogala, and P. Czupry?ski, ‘Experimental Study of Performance Improvement of 3-Bed and 2-Evaporator Adsorption Chiller by Control Optimization’, Energies (Basel), vol. 12, p. 3943, 2019. [CrossRef]
- I. El-Sharkawy, H. AbdelMeguid, and B. B. Saha, ‘Towards an optimal performance of adsorption chillers: Reallocation of adsorption/desorption cycle times’, Int J Heat Mass Transf, vol. 63, pp. 171–182, Aug. 2013. [CrossRef]
- S. Mirjalili and A. Lewis, ‘The Whale Optimization Algorithm’, Advances in Engineering Software, vol. 95, pp. 51–67, May 2016. [CrossRef]
- I. kumar, L. Lekhraj, and A. Kumar, ‘WEIGHTED GREY WOLF OPTIMIZER WITH IMPROVED CONVERGENCE RATE IN TRAINING MULTI-LAYER PERCEPTRON TO SOLVE CLASSIFICATION PROBLEMS’, Jordanian Journal of Computers and Information Technology, no. 0, p. 1, 2021. [CrossRef]
- J. H. Holland, ‘Genetic Algorithms’, Sci Am, vol. 267, no. 1, pp. 66–72, Jul. 1992. [CrossRef]
- K. Krishnakumar and D. E. Goldberg, ‘Control system optimization using genetic algorithms’, Journal of Guidance, Control, and Dynamics, vol. 15, no. 3, pp. 735–740, May 1992. [CrossRef]
- R. Storn and K. Price, ‘Differential Evolution: A Simple and Efficient Heuristic for Global Optimization over Continuous Spaces’, Journal of Global Optimization, vol. 11, no. 4, pp. 341–359, 1997. [CrossRef]
- D. Simon, ‘Biogeography-Based Optimization’, IEEE Transactions on Evolutionary Computation, vol. 12, no. 6, pp. 702–713, Dec. 2008. [CrossRef]
- Xin Yao, Yong Liu, and Guangming Lin, ‘Evolutionary programming made faster’, IEEE Transactions on Evolutionary Computation, vol. 3, no. 2, pp. 82–102, Jul. 1999. [CrossRef]
- S. Mirjalili, S. M. Mirjalili, and A. Lewis, ‘Grey Wolf Optimizer’, Advances in Engineering Software, vol. 69, pp. 46–61, Mar. 2014. [CrossRef]
- J. Kennedy and R. Eberhart, ‘Particle swarm optimization’, in Proceedings of ICNN’95 - International Conference on Neural Networks, IEEE, pp. 1942–1948. [CrossRef]
- X.-S. Yang and Suash Deb, ‘Cuckoo Search via Lévy flights’, in 2009 World Congress on Nature & Biologically Inspired Computing (NaBIC), IEEE, 2009, pp. 210–214. [CrossRef]
- N. F. Johari, A. M. Zain, M. H. Noorfa, and A. Udin, ‘Firefly Algorithm for Optimization Problem’, Applied Mechanics and Materials, vol. 421, pp. 512–517, Sep. 2013. [CrossRef]
- I. Bawazir and D. Friedrich, ‘Evaluation and Design of Large-Scale Solar Adsorption Cooling Systems Based on Energetic, Economic and Environmental Performance’, Energies (Basel), vol. 15, no. 6, p. 2149, Mar. 2022. [CrossRef]
- K. Sztekler, ‘Optimisation of Operation of Adsorption Chiller with Desalination Function’, Energies (Basel), vol. 14, no. 9, p. 2668, May 2021. [CrossRef]
- B. B. Saha, S. Koyama, T. Kashiwagi, A. Akisawa, K. C. Ng, and H. T. Chua, ‘Waste heat driven dual-mode, multi-stage, multi-bed regenerative adsorption system’, International Journal of Refrigeration, vol. 26, no. 7, pp. 749–757, 2003. [CrossRef]
- H. T. Chua, K. C. Ng, W. Wang, C. Yap, and X. L. Wang, ‘Transient modeling of a two-bed silica gel–water adsorption chiller’, Int J Heat Mass Transf, vol. 47, no. 4, pp. 659–669, Feb. 2004. [CrossRef]
- H. T. Chua, K. C. Ng, A. Malek, T. Kashiwagi, A. Akisawa, and B. B. Saha, ‘Multi-bed regenerative adsorption chiller — improving the utilization of waste heat and reducing the chilled water outlet temperature fluctuation’, International Journal of Refrigeration, vol. 24, no. 2, pp. 124–136, Mar. 2001. [CrossRef]
- B. B. Saha, S. Koyama, T. Kashiwagi, A. Akisawa, K. C. Ng, and H. T. Chua, ‘Waste heat driven dual-mode, multi-stage, multi-bed regenerative adsorption system’, International Journal of Refrigeration, vol. 26, no. 7, pp. 749–757, Nov. 2003. [CrossRef]
- M. Z. I. Khan, K. C. A. Alam, B. B. Saha, A. Akisawa, and T. Kashiwagi, ‘Study on a re-heat two-stage adsorption chiller – The influence of thermal capacitance ratio, overall thermal conductance ratio and adsorbent mass on system performance’, Appl Therm Eng, vol. 27, no. 10, pp. 1677–1685, Jul. 2007. [CrossRef]
- I. S. Uyun, T. Miyazaki, Y. Ueda, and A. Akisawa, ‘Experimental Investigation of a Three-Bed Adsorption Refrigeration Chiller Employing an Advanced Mass Recovery Cycle’, Energies (Basel), vol. 2, no. 3, pp. 531–544, Jul. 2009. [CrossRef]
- S. Szarzynski, Y. Feng, and M. Pons, ‘Study of different internal vapour transports for adsorption cycles with heat regeneration’, International Journal of Refrigeration, vol. 20, no. 6, pp. 390–401, Jan. 1997. [CrossRef]
- R. Z. Wang, ‘Performance improvement of adsorption cooling by heat and mass recovery operation’, International Journal of Refrigeration, vol. 24, no. 7, pp. 602–611, Jul. 2001. [CrossRef]
- M. Muttakin, Md. A. Islam, K. S. Malik, D. Pahwa, and B. B. Saha, ‘Study on optimized adsorption chiller employing various heat and mass recovery schemes’, International Journal of Refrigeration, vol. 126, pp. 222–237, Jun. 2021. [CrossRef]
- I. Akahira, K. C. A. Alam, Y. Hamamoto, A. Akisawa, and T. Kashiwagi, ‘Mass recovery adsorption refrigeration cycle—improving cooling capacity’, International Journal of Refrigeration, vol. 27, no. 3, pp. 225–234, May 2004. [CrossRef]
- K. C. Leong and Y. Liu, ‘System performance of a combined heat and mass recovery adsorption cooling cycle: A parametric study’, Int J Heat Mass Transf, vol. 49, no. 15–16, pp. 2703–2711, Jul. 2006. [CrossRef]
- K. C. Leong and Y. Liu, ‘Numerical study of a combined heat and mass recovery adsorption cooling cycle’, Int J Heat Mass Transf, vol. 47, no. 22, pp. 4761–4770, Oct. 2004. [CrossRef]
- R. P. Sah, B. Choudhury, and R. K. Das, ‘Study of a two-bed silica gel–water adsorption chiller: performance analysis’, International Journal of Sustainable Energy, vol. 37, no. 1, pp. 30–46, Jan. 2018. [CrossRef]
- N. ul Qadir, S. A. M. Said, and R. Ben Mansour, ‘Performance prediction of a two-bed solar adsorption chiller with adaptive cycle time using a MIL-100(Fe)/water working pair – influence of solar collector configuration’, International Journal of Refrigeration, vol. 85, pp. 472–488, Jan. 2018. [CrossRef]
- J. Krzywanski et al., ‘Modeling of a re-heat two-stage adsorption chiller by AI approach’, MATEC Web of Conferences, vol. 240, p. 05014, Nov. 2018. [CrossRef]
- M. B. Elsheniti, M. A. Hassab, and A.-E. Attia, ‘Examination of effects of operating and geometric parameters on the performance of a two-bed adsorption chiller’, Appl Therm Eng, vol. 146, pp. 674–687, Jan. 2019. [CrossRef]
- M. Chorowski, P. Pyrka, Z. Rogala, and P. Czupryński, ‘Experimental Study of Performance Improvement of 3-Bed and 2-Evaporator Adsorption Chiller by Control Optimization’, Energies (Basel), vol. 12, no. 20, p. 3943, Oct. 2019. [CrossRef]
- J. Krzywanski et al., ‘An adaptive neuro-fuzzy model of a re-heat two-stage adsorption chiller’, Thermal Science, vol. 23, no. Suppl. 4, pp. 1053–1063, 2019. [CrossRef]
- M. Gado, E. Elgendy, K. Elsayed, and M. Fatouh, ‘Performance enhancement of an adsorption chiller by optimum cycle time allocation at different operating conditions’, Advances in Mechanical Engineering, vol. 11, no. 10, Oct. 2019. [CrossRef]
- N. ul Qadir, S. A. M. Said, R. B. Mansour, H. Imran, and M. Khan, ‘Performance comparison of a two-bed solar-driven adsorption chiller with optimal fixed and adaptive cycle times using a silica gel/water working pair’, Renew Energy, vol. 149, pp. 1000–1017, Apr. 2020. [CrossRef]
- M. Thommes et al., ‘Physisorption of gases, with special reference to the evaluation of surface area and pore size distribution (IUPAC Technical Report)’, Pure and Applied Chemistry, vol. 87, no. 9–10, pp. 1051–1069, Oct. 2015. [CrossRef]
- D. Wang, J. Zhang, Q. Yang, N. Li, and K. Sumathy, ‘Study of adsorption characteristics in silica gel–water adsorption refrigeration’, Appl Energy, vol. 113, pp. 734–741, Jan. 2014. [CrossRef]
- D. Wang, J. Zhang, Y. Xia, Y. Han, and S. Wang, ‘Investigation of adsorption performance deterioration in silica gel–water adsorption refrigeration’, Energy Convers Manag, vol. 58, pp. 157–162, Jun. 2012. [CrossRef]
- I. Allouhi, T. Kousksou, A. Jamil, T. El Rhafiki, Y. Mourad, and Y. Zeraouli, ‘Optimal working pairs for solar adsorption cooling applications’, Energy, vol. 79, pp. 235–247, Jan. 2015. [CrossRef]
- S. W. Hong, S. H. Ahn, J. D. Chung, K. J. Bae, D. A. Cha, and O. K. Kwon, ‘Characteristics of FAM-Z01 compared to silica gels in the performance of an adsorption bed’, Appl Therm Eng, vol. 104, pp. 24–33, Jul. 2016. [CrossRef]
- Q. W. Pan, R. Z. Wang, L. W. Wang, and D. Liu, ‘Design and experimental study of a silica gel-water adsorption chiller with modular adsorbers’, International Journal of Refrigeration, vol. 67, pp. 336–344, Jul. 2016. [CrossRef]
- P. J. Vodianitskaia, J. J. Soares, H. Melo, and J. M. Gurgel, ‘Experimental chiller with silica gel: Adsorption kinetics analysis and performance evaluation’, Energy Convers Manag, vol. 132, pp. 172–179, Jan. 2017. [CrossRef]
- F. Saadat, A. R. Hashmi, X. Zheng, Q. Pan, B. Wang, and Z. Gan, ‘Progress in zeolite–water adsorption technologies for energy-efficient utilization’, Energy, vol. 308, p. 133001, Nov. 2024. [CrossRef]
- W. Hua, W. Xie, X. Zhang, L. Gao, L. Que, and X. Ding, ‘Synthesis and characterization of silica gel composite with thermal conductivity enhancers and polymer binders for adsorption desalination and cooling system’, International Journal of Refrigeration, vol. 139, pp. 93–103, Jul. 2022. [CrossRef]
- M. M. Younes, I. I. El-Sharkawy, A. E. Kabeel, K. Uddin, T. Miyazaki, and B. B. Saha, ‘Characterization of silica gel-based composites for adsorption cooling applications’, International Journal of Refrigeration, vol. 118, pp. 345–353, Oct. 2020. [CrossRef]
- Yu. I. Aristov, I. S. Glaznev, A. Freni, and G. Restuccia, ‘Kinetics of water sorption on SWS-1L (calcium chloride confined to mesoporous silica gel): Influence of grain size and temperature’, Chem Eng Sci, vol. 61, no. 5, pp. 1453–1458, Mar. 2006. [CrossRef]
- Y. I. Aristov, ‘Optimal adsorbent for adsorptive heat transformers: Dynamic considerations’, International Journal of Refrigeration, vol. 32, no. 4, pp. 675–686, Jun. 2009. [CrossRef]
- X. Xia, B. Liu, B. Zhao, Z. Xia, and S. Li, ‘Enhanced Water Adsorption of MIL-101(Cr) by Metal-Organic Polyhedral Encapsulation for Adsorption Cooling’, Nanomaterials, vol. 13, no. 7, p. 1147, Mar. 2023. [CrossRef]
- T. H. Rupam, F. J. Tuli, I. Jahan, M. L. Palash, A. Chakraborty, and B. B. Saha, ‘Isotherms and kinetics of water sorption onto MOFs for adsorption cooling applications’, Thermal Science and Engineering Progress, vol. 34, p. 101436, Sep. 2022. [CrossRef]
- T. Miyazaki and A. Akisawa, ‘The influence of heat exchanger parameters on the optimum cycle time of adsorption chillers’, Appl Therm Eng, vol. 29, no. 13, pp. 2708–2717, Sep. 2009. [CrossRef]
- M. O. Okwu and L. K. Tartibu, ‘Introduction to Optimization’, 2021, pp. 1–4. [CrossRef]
- B. C. Silva, C. M. Rebello, A. E. Rodrigues, A. M. Ribeiro, A. F. P. Ferreira, and I. B. R. Nogueira, ‘Metaheuristic Framework for Material Screening and Operating Optimization of Adsorption-Based Heat Pumps’, ACS Omega, vol. 8, no. 22, pp. 19874–19891, Jun. 2023. [CrossRef]
- J. Krzywanski et al., ‘Optimization of a three-bed adsorption chiller by genetic algorithms and neural networks’, Energy Convers Manag, vol. 153, pp. 313–322, Dec. 2017. [CrossRef]
- T. Miyazaki and A. Akisawa, ‘The influence of heat exchanger parameters on the optimum cycle time of adsorption chillers’, Appl Therm Eng, vol. 29, no. 13, pp. 2708–2717, Sep. 2009. [CrossRef]
- H. Teimourzadeh, F. Jabari, and B. Mohammadi-Ivatloo, ‘An augmented group search optimization algorithm for optimal cooling-load dispatch in multi-chiller plants’, Computers & Electrical Engineering, vol. 85, p. 106434, Jul. 2020. [CrossRef]
- L. dos S. Coelho and V. C. Mariani, ‘Improved firefly algorithm approach applied to chiller loading for energy conservation’, Energy Build, vol. 59, pp. 273–278, Apr. 2013. [CrossRef]
- M. Z. I. Khan, K. C. A. Alam, B. B. Saha, Y. Hamamoto, A. Akisawa, and T. Kashiwagi, ‘Parametric study of a two-stage adsorption chiller using re-heat—The effect of overall thermal conductance and adsorbent mass on system performance’, International Journal of Thermal Sciences, vol. 45, no. 5, pp. 511–519, May 2006. [CrossRef]
- S. K. Farid, M. M. Billah, M. Z. I. Khan, M. M. Rahman, and U. Md. Sharif, ‘A numerical analysis of cooling water temperature of two-stage adsorption chiller along with different mass ratios’, International Communications in Heat and Mass Transfer, vol. 38, no. 8, pp. 1086–1092, Oct. 2011. [CrossRef]
- Z. Shi, H. Liang, W. Yang, J. Liu, Z. Liu, and Z. Qiao, ‘Machine learning and in silico discovery of metal-organic frameworks: Methanol as a working fluid in adsorption-driven heat pumps and chillers’, Chem Eng Sci, vol. 214, p. 115430, Mar. 2020. [CrossRef]
- S. Girnik, A. D. Grekova, L. G. Gordeeva, and Yu. I. Aristov, ‘Dynamic optimization of adsorptive chillers: Compact layer vs. bed of loose grains’, Appl Therm Eng, vol. 125, pp. 823–829, Oct. 2017. [CrossRef]
- I. El-Sharkawy, H. AbdelMeguid, and B. B. Saha, ‘Towards an optimal performance of adsorption chillers: Reallocation of adsorption/desorption cycle times’, Int J Heat Mass Transf, vol. 63, pp. 171–182, 2013. [CrossRef]
- R. P. Sah, B. Choudhury, and R. K. Das, ‘Study of a two-bed silica gel–water adsorption chiller: performance analysis’, International Journal of Sustainable Energy, vol. 37, no. 1, pp. 30–46, Jan. 2018. [CrossRef]
- E. G. Papoutsis, I. P. Koronaki, and V. D. Papaefthimiou, ‘Parametric Study of a Single-Stage Two-Bed Adsorption Chiller’, Journal of Energy Engineering, vol. 143, no. 4, Aug. 2017. [CrossRef]
- M. Scherle and U. Nieken, ‘Simultaneous Optimization of Process Operational and Material Parameters for a 2-Bed Adsorption Refrigeration Process’, ChemEngineering, vol. 4, no. 2, p. 31, May 2020. [CrossRef]
- J. Krzywanski et al., ‘Adsorption chiller in a combined heating and cooling system: simulation and optimization by neural networks’, Bulletin of the Polish Academy of Sciences Technical Sciences, pp. 137054–137054, Apr. 2021. [CrossRef]
- R. P. Sah, B. Choudhury, and R. K. Das, ‘Study of a two-bed silica gel–water adsorption chiller: performance analysis’, International Journal of Sustainable Energy, vol. 37, no. 1, pp. 30–46, Jan. 2018. [CrossRef]
- E. G. Papoutsis, I. P. Koronaki, and V. D. Papaefthimiou, ‘Parametric Study of a Single-Stage Two-Bed Adsorption Chiller’, J. Energy Eng., vol. 143, 2017. [CrossRef]
- E. G. Papoutsis, I. P. Koronaki, and V. D. Papaefthimiou, ‘Parametric Study of a Single-Stage Two-Bed Adsorption Chiller’, Journal of Energy Engineering, vol. 143, no. 4, Aug. 2017. [CrossRef]
- X. Wang and H. T. Chua, ‘Two bed silica gel–water adsorption chillers: An effectual lumped parameter model’, International Journal of Refrigeration, vol. 30, no. 8, pp. 1417–1426, Dec. 2007. [CrossRef]
- S. Mirjalili, S. M. Mirjalili, and A. Lewis, ‘Grey Wolf Optimizer’, Advances in Engineering Software, vol. 69, pp. 46–61, Mar. 2014. [CrossRef]
- Deb, ‘Multiobjective Optimization Using Evolutionary Algorithms. ’, New York: Jhon Wiley and Sons Ltd, 2001.
- S. Mirjalili, ‘Multi-Objective Grey Wolf Optimizer (MOGWO)’, MATLAB Central File Exchange (or MathWorks).
- H. T. Chua, K. C. Ng, A. Malek, T. Kashiwagi, A. Akisawa, and B. B. Saha, ‘Modeling the performance of two-bed, sillica gel-water adsorption chillers’, International Journal of Refrigeration, vol. 22, no. 3, pp. 194–204, May 1999. [CrossRef]
- E. G. Papoutsis, I. P. Koronaki, and V. D. Papaefthimiou, ‘Parametric Study of a Single-Stage Two-Bed Adsorption Chiller’, Journal of Energy Engineering, vol. 143, no. 4, Aug. 2017. [CrossRef]
- R. D. S. N., C. Seiler, and A. H. Monahan, ‘A Global Sensitivity Analysis of Parameter Uncertainty in the CLASSIC Model’, Atmosphere-Ocean, vol. 62, no. 5, pp. 347–359, Oct. 2024. [CrossRef]
- R. Roka, A. Figueiredo, A. Vieira, and C. Cardoso, ‘A Systematic Review of Sensitivity Analysis in Building Energy Modeling: Key Factors Influencing Building Thermal Energy Performance’, Energies (Basel), vol. 18, no. 9, p. 2375, May 2025. [CrossRef]
- C. A. C. Coello, G. T. Pulido, and M. S. Lechuga, ‘Handling multiple objectives with particle swarm optimization’, IEEE Transactions on Evolutionary Computation, vol. 8, no. 3, pp. 256–279, Jun. 2004. [CrossRef]
- I. Angulo, D. Rodríguez, W. Garzón, D. F. Gómez, A. Al Sumaiti, and S. Rivera, ‘Algorithms for Bidding Strategies in Local Energy Markets: Exhaustive Search through Parallel Computing and Metaheuristic Optimization’, Algorithms, vol. 14, no. 9, p. 269, Sep. 2021. [CrossRef]
- W.-S. Chang, C.-C. Wang, and C.-C. Shieh, ‘Experimental study of a solid adsorption cooling system using flat-tube heat exchangers as adsorption bed’, Appl Therm Eng, vol. 27, no. 13, pp. 2195–2199, Sep. 2007. [CrossRef]
- M. Marlinda, A. S. Uyun, T. Miyazaki, Y. Ueda, and A. Akisawa, ‘Performance Analysis of a Double-effect Adsorption Refrigeration Cycle with a Silica Gel/Water Working Pair’, Energies (Basel), vol. 3, no. 11, pp. 1704–1720, Oct. 2010. [CrossRef]
- Al-Maaitah, M. Attarakih, and H.-J. Bart, ‘Energy and Exergy Analyses of Adsorption Chiller at Various Recooling-Water and Dead-State Temperatures’, Energies (Basel), vol. 14, no. 8, p. 2172, Apr. 2021. [CrossRef]
- R. Gupta and I. K. Puri, ‘Waste heat recovery in a data center with an adsorption chiller: Technical and economic analysis’, Energy Convers Manag, vol. 245, p. 114576, Oct. 2021. [CrossRef]
- I. Alsarayreh, A. Al-Maaitah, M. Attarakih, and H.-J. Bart, ‘Energy and Exergy Analyses of Adsorption Chiller at Various Recooling-Water and Dead-State Temperatures’, Energies (Basel), vol. 14, no. 8, p. 2172, Apr. 2021. [CrossRef]
- R. P. Sah, A. Sur, N. D. Sarma, and S. P. Chaurasiya, ‘Comparative Study on Performances of Waste Heat Driven Adsorption Cooling System Using Silica Gel/Methanol and Silica Gel/Water Working Pair’, Journal Européen des Systèmes Automatisés, vol. 57, no. 6, pp. 1809–1816, Dec. 2024. [CrossRef]
- M. B. Elsheniti, A. T. Abd El-Hamid, O. A. El- Samni, S. M. Elsherbiny, and E. Elsayed, ‘Experimental evaluation of a solar two-bed lab-scale adsorption cooling system’, Alexandria Engineering Journal, vol. 60, no. 3, pp. 2747–2757, Jun. 2021. [CrossRef]
- I. M. S. SHAKIR,, Türkan Üçok Erkek, M. W. K. JABER, and A. Güngör, ‘Performance prediction of a two-bed adsorption chiller considering the impact of hot and cooling water temperatures and hot water mass flow rate ’, in 5th International Anatolian Energy Symposium, Turkey, Apr. 2020.
- F. T. ISHUGAH, R. WANG, L. WANG, and Z. LU, ‘PERFORMANCE IMPROVEMENT OF AN ADSORPTION CHILLER USING COMPOSITE ADSORBENT, SILICA GEL IMPREGNATED WITH LITHIUM CHLORIDE, PAIRED WITH METHANOL AS THE ADSORBATE’, International Journal of Air-Conditioning and Refrigeration, vol. 22, no. 02, p. 1440003, Jun. 2014. [CrossRef]
- Bry-Air, ‘Adsorption Chillers – How Water Driven Solid State Cooling Machines’, Bry-Air.
- (Saclay) Baudouy, ‘Heat Transfer and Cooling Techniques at Low Temperature’, CAS - CERN Accelerator School: Superconductivity for Accelerators, pp. 329–352, Jul. 2014.
- F. T. ISHUGAH, R. WANG, L. WANG, and Z. LU, ‘PERFORMANCE IMPROVEMENT OF AN ADSORPTION CHILLER USING COMPOSITE ADSORBENT, SILICA GEL IMPREGNATED WITH LITHIUM CHLORIDE, PAIRED WITH METHANOL AS THE ADSORBATE’, International Journal of Air-Conditioning and Refrigeration, vol. 22, no. 02, p. 1440003, Jun. 2014. [CrossRef]
- M. B. Yunus Cengel, Thermodynamics: An Engineering Approach, Eighth. M. A., Kanoglu, M., Thermodynamics: McGraw-Hill Education; 8th edition (January 7, 2014), 2014.
- ARANER, ‘How to Improve a Chilled Water Refrigeration System (https://www.araner.com/blog/chilled-water-refrigeration-system)’, ARANER.
- P. Gregor, W. H. Henze, and T. Marc, ‘Improving Campus Chilled Water Systems With Intelligent Control Valves: A Field Study’, ASCE, pp. 1–10, 2013.
- H. M. Vartolomei, ‘Theoretical Analysis of the Entropy Flow Generated by the Fluid Flow with Friction and Heat Exchange’, Applied Mechanics and Materials, vol. 659, pp. 499–502, Oct. 2014. [CrossRef]
- E. I. Jassim and B. Jasem, ‘Influence of Irreversibility and Entropy Production Produced by Nanofluid on the Performance of Heat Exchanger’, in Volume 10: Mechanics of Solids, Structures, and Fluids; Micro- and Nano-Systems Engineering and Packaging, American Society of Mechanical Engineers, Nov. 2024. [CrossRef]
- F. T. ISHUGAH, R. WANG, L. WANG, and Z. LU, ‘PERFORMANCE IMPROVEMENT OF AN ADSORPTION CHILLER USING COMPOSITE ADSORBENT, SILICA GEL IMPREGNATED WITH LITHIUM CHLORIDE, PAIRED WITH METHANOL AS THE ADSORBATE’, International Journal of Air-Conditioning and Refrigeration, vol. 22, no. 02, p. 1440003, Jun. 2014. [CrossRef]
- S. Parkar, R. Mulukh, G. Narhari, and S. Kulkarni, ‘Intensification of Temperature Swing Adsorption’, Journal of Sustainable Materials Processing and Management, vol. 2, no. 1, Apr. 2022. [CrossRef]
- S. Stefański, Ł. Mika, K. Sztekler, W. Kalawa, Ł. Lis, and W. Nowak, ‘Adsorption bed configurations for adsorption cooling application’, E3S Web of Conferences, vol. 108, p. 01010, Jul. 2019. [CrossRef]
- M. Z. I. Khan, K. C. A. Alam, B. B. Saha, Y. Hamamoto, A. Akisawa, and T. Kashiwagi, ‘Parametric study of a two-stage adsorption chiller using re-heat—The effect of overall thermal conductance and adsorbent mass on system performance’, International Journal of Thermal Sciences, vol. 45, no. 5, pp. 511–519, May 2006. [CrossRef]
- T. Toppi, T. Villa, S. Vasta, W. Mittelbach, and A. Freni, ‘Testing of a Falling-Film Evaporator for Adsorption Chillers’, Energies (Basel), vol. 15, no. 5, p. 1709, Feb. 2022. [CrossRef]
- W. S. Lee, M. Y. Park, X. Q. Duong, N. V. Cao, and J. D. Chung, ‘Effects of Evaporator and Condenser in the Analysis of Adsorption Chillers’, Energies (Basel), vol. 13, no. 8, p. 1901, Apr. 2020. [CrossRef]
Figure 2.
(a) Schematic diagram of a single-stage, dual-bed adsorption chiller during the adsorption–desorption cycle; (b) Flow configuration of the system during the inter-bed transitional (switching) phase.
Figure 2.
(a) Schematic diagram of a single-stage, dual-bed adsorption chiller during the adsorption–desorption cycle; (b) Flow configuration of the system during the inter-bed transitional (switching) phase.
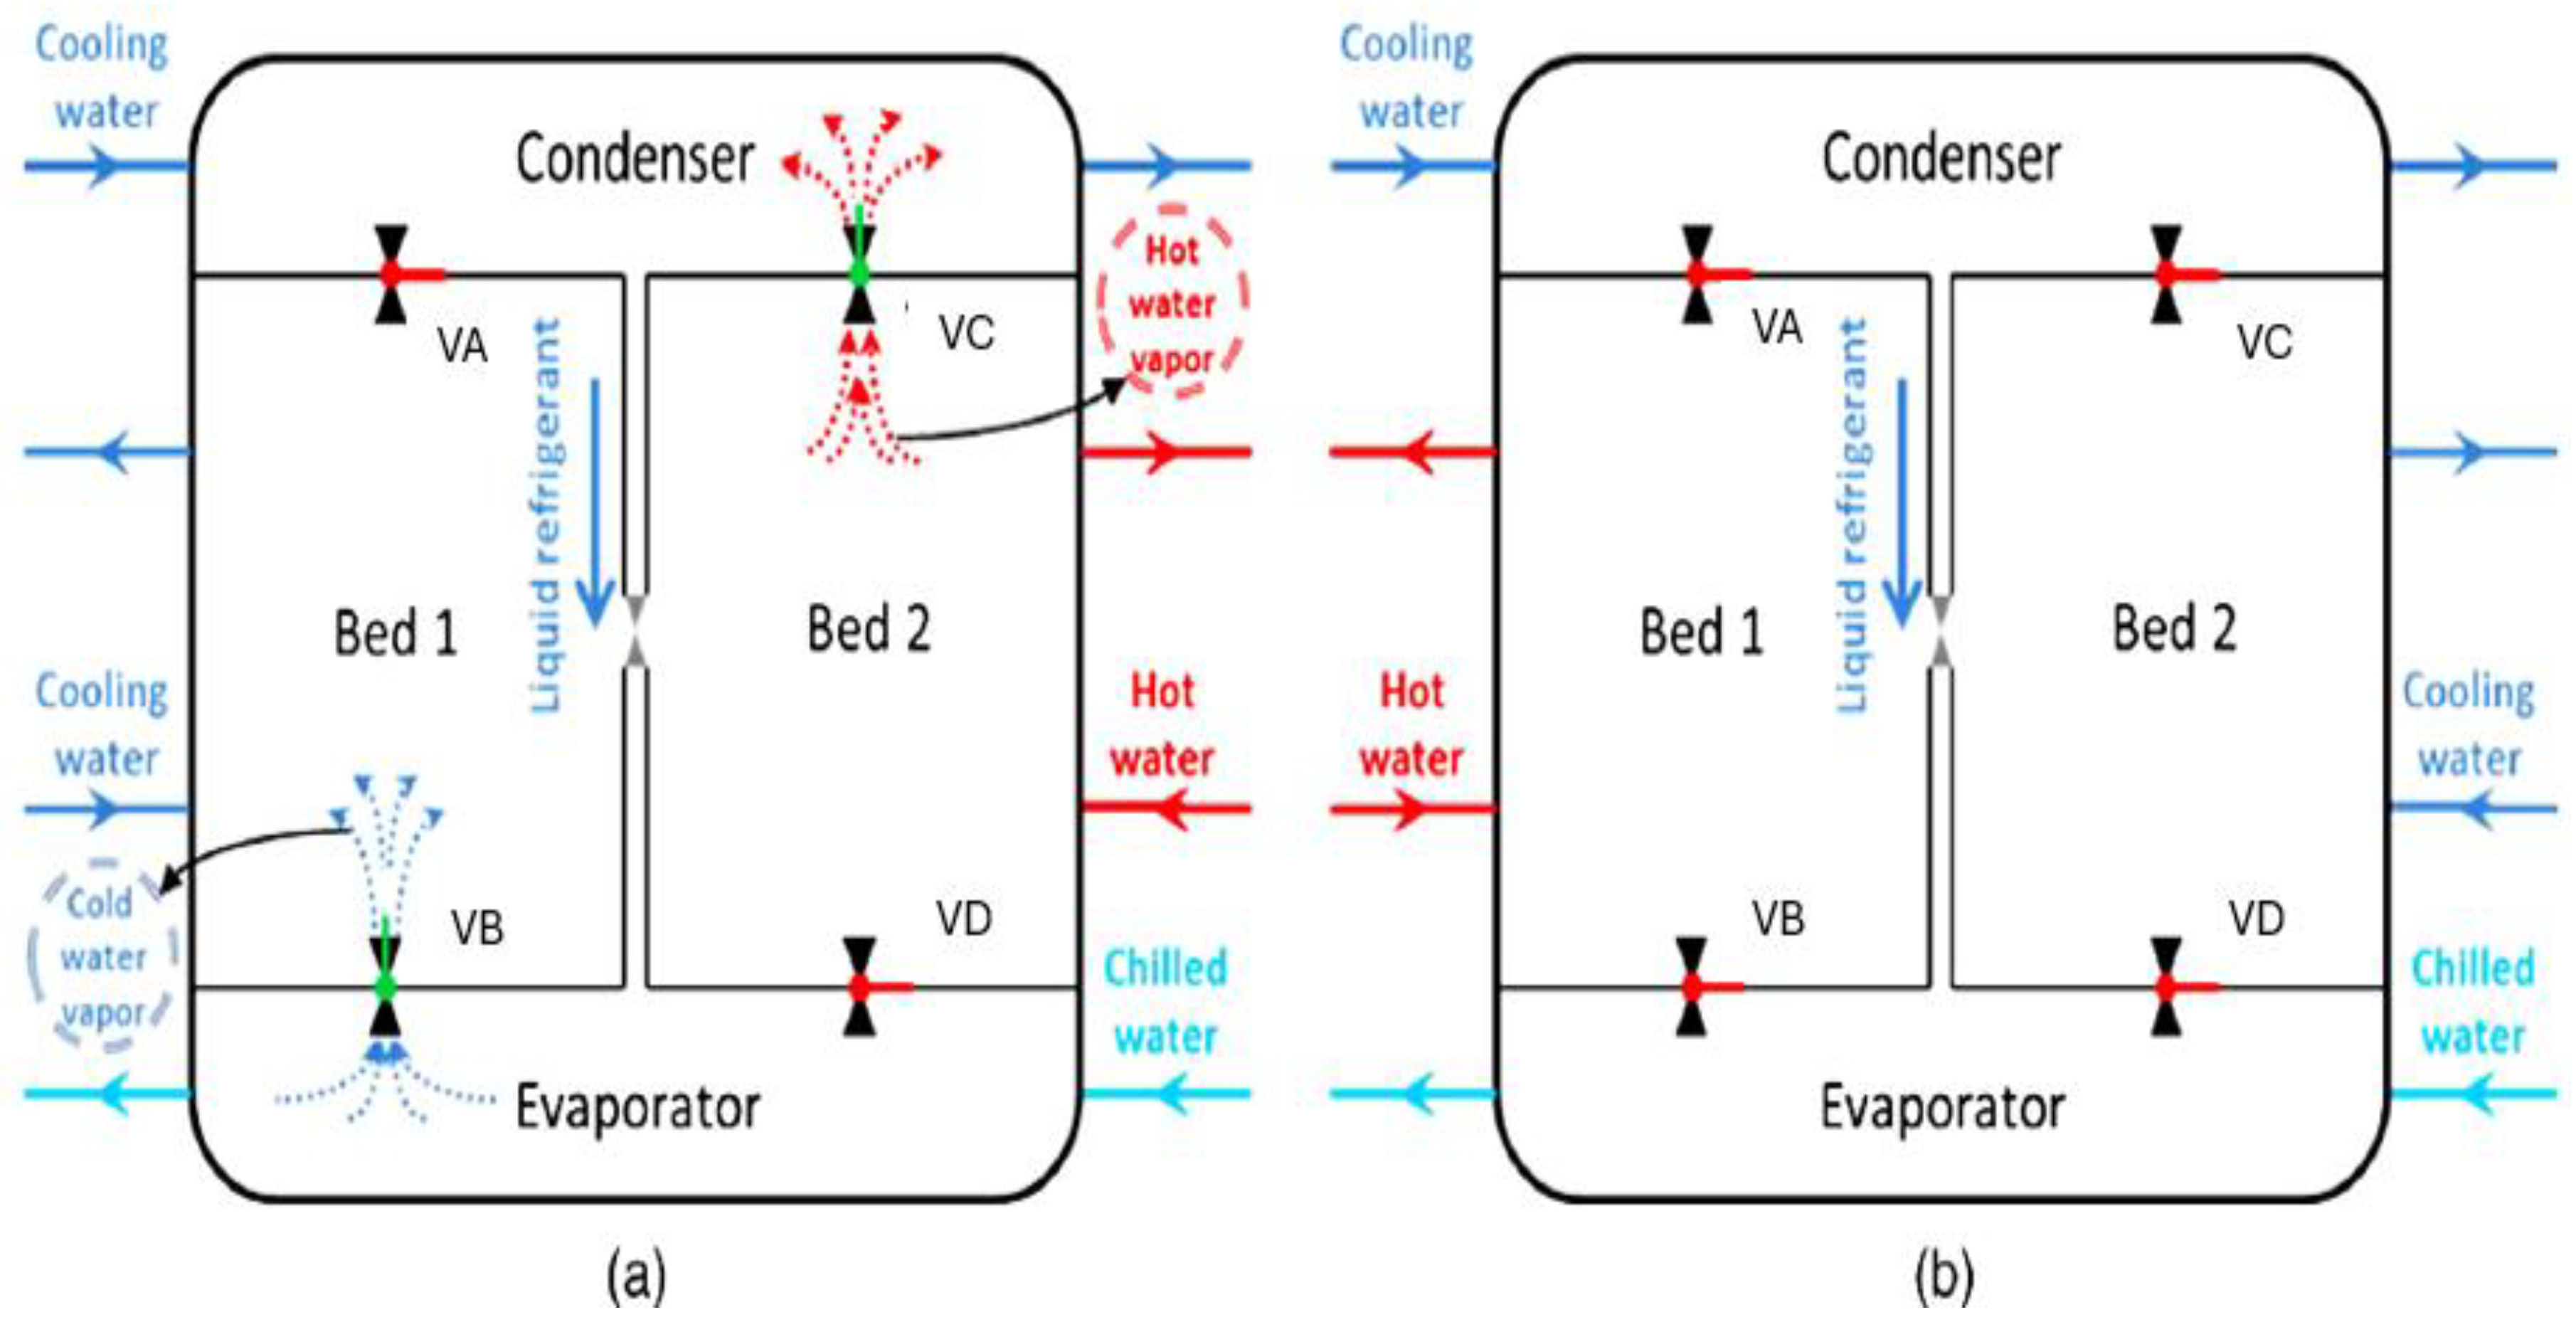
Figure 3.
Optimization methodology.
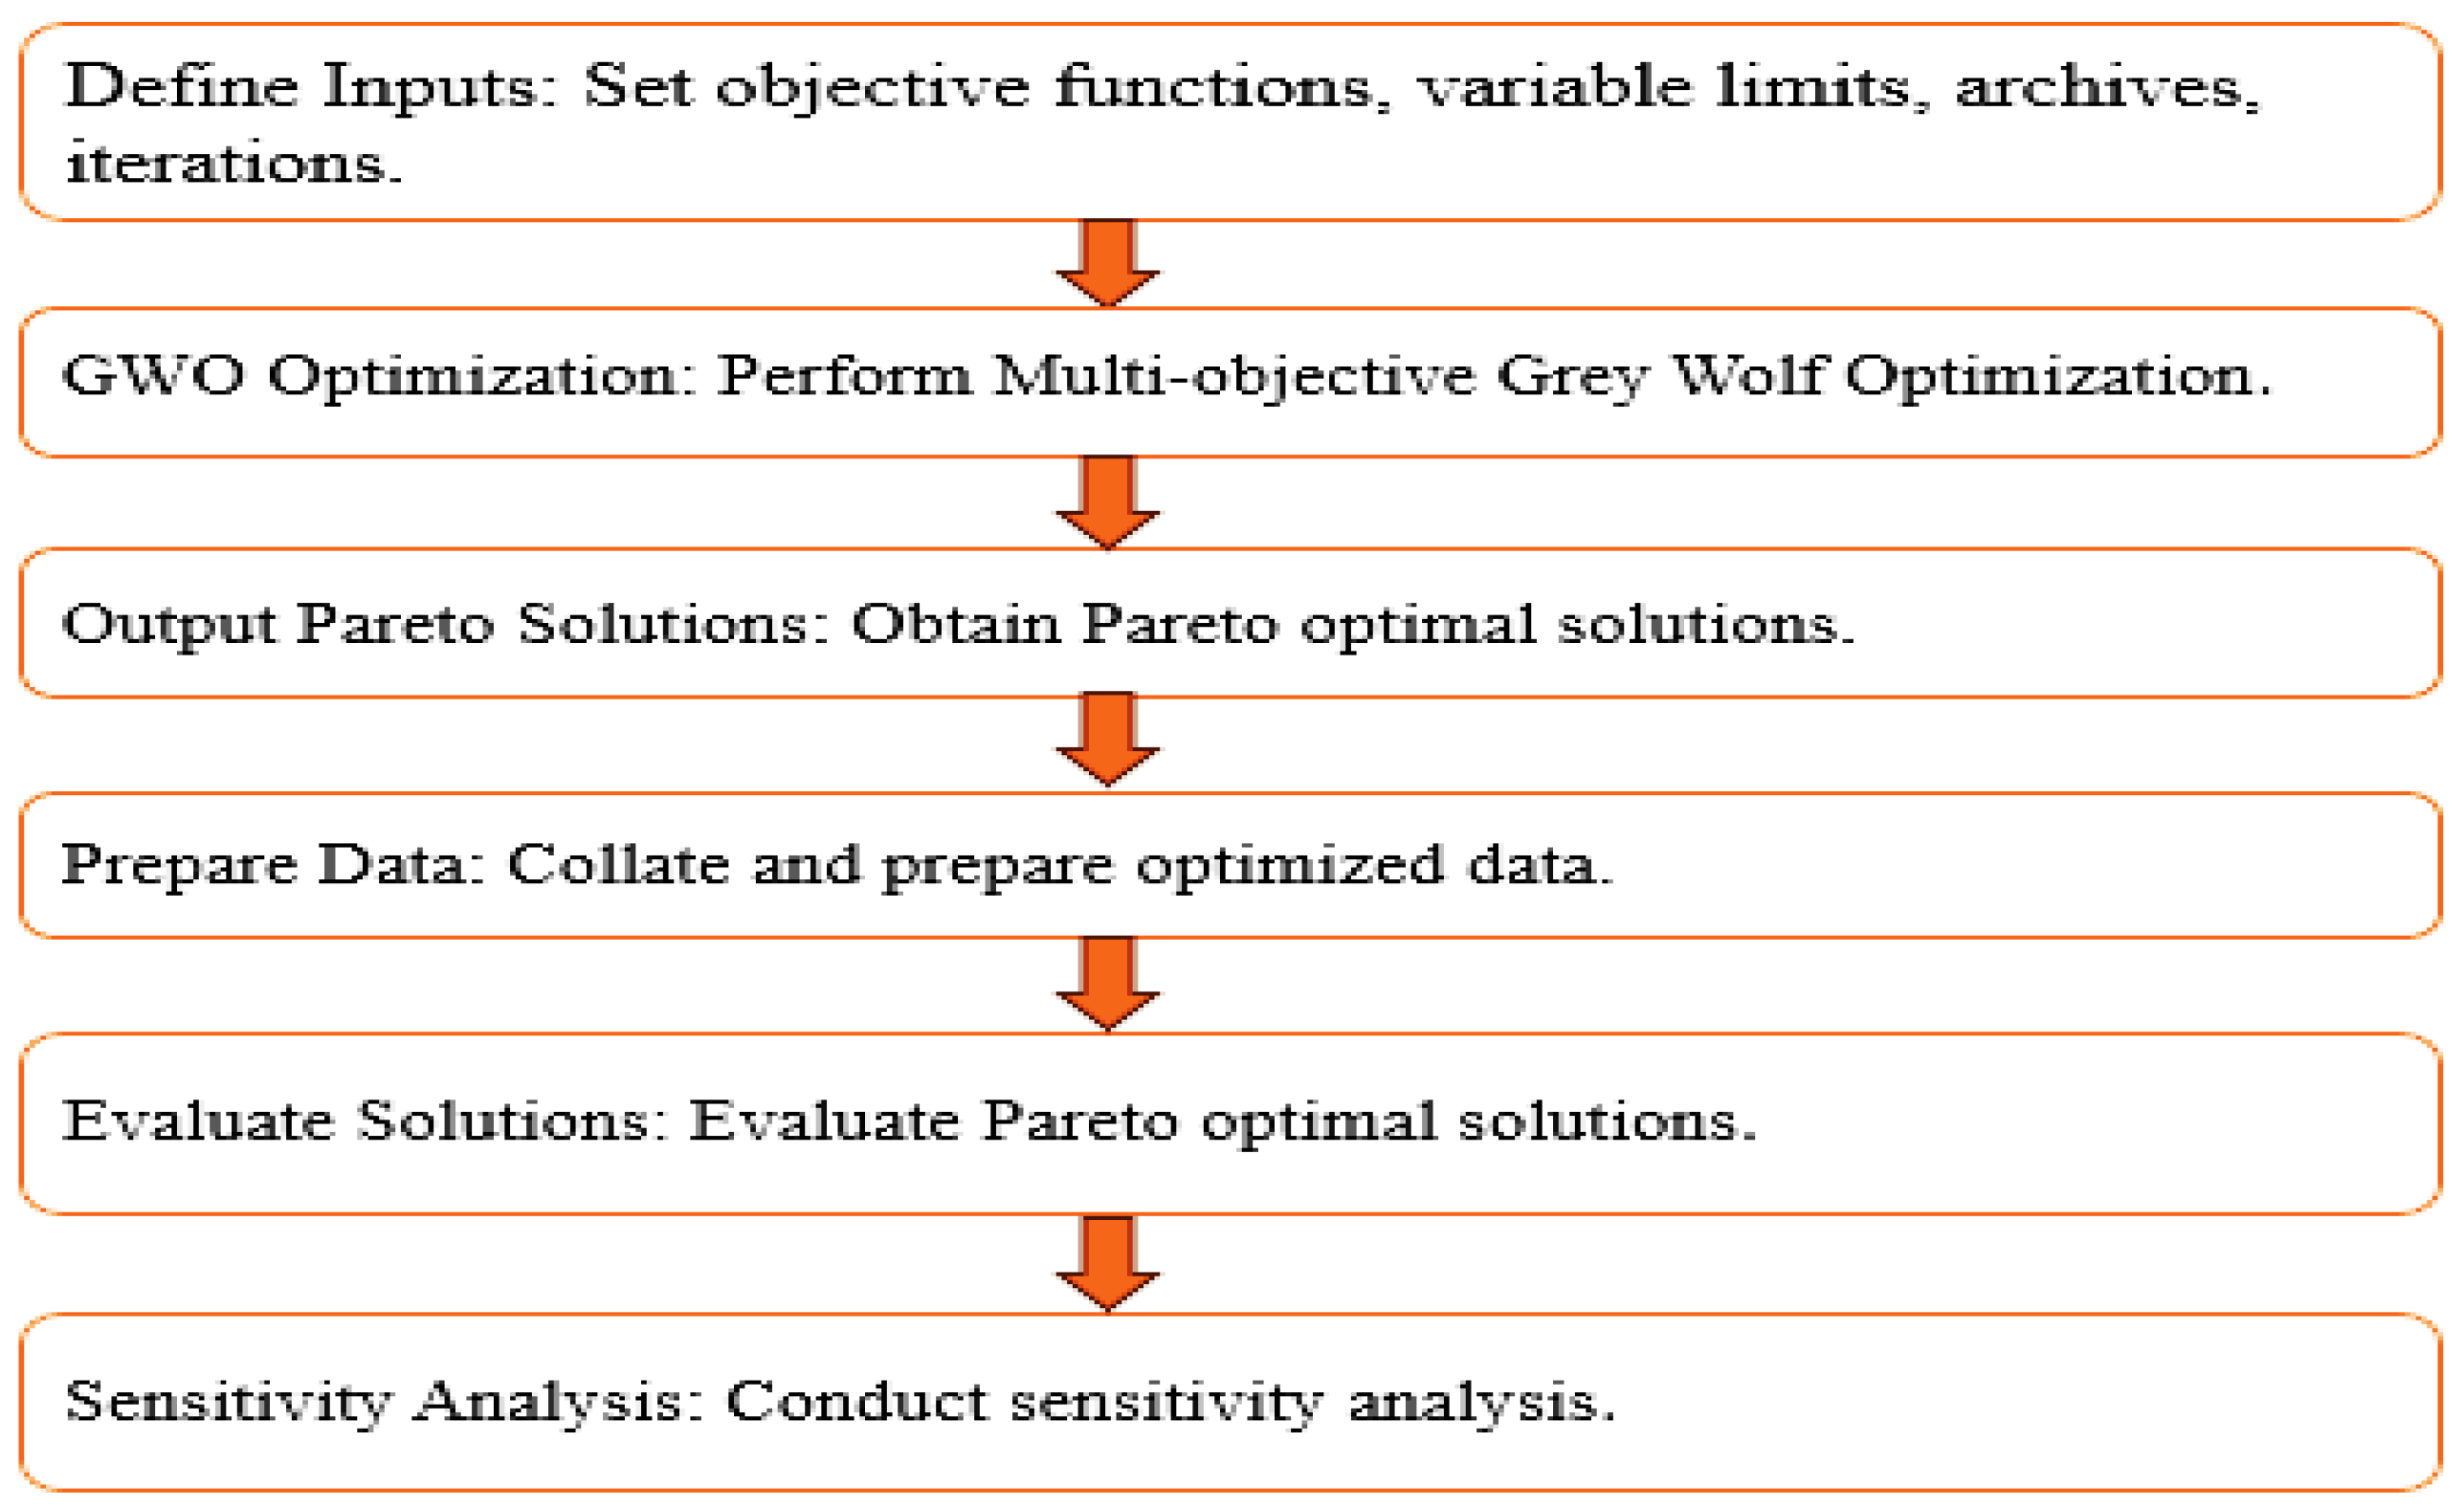
Figure 4.
Single-objective GWO flowchart.
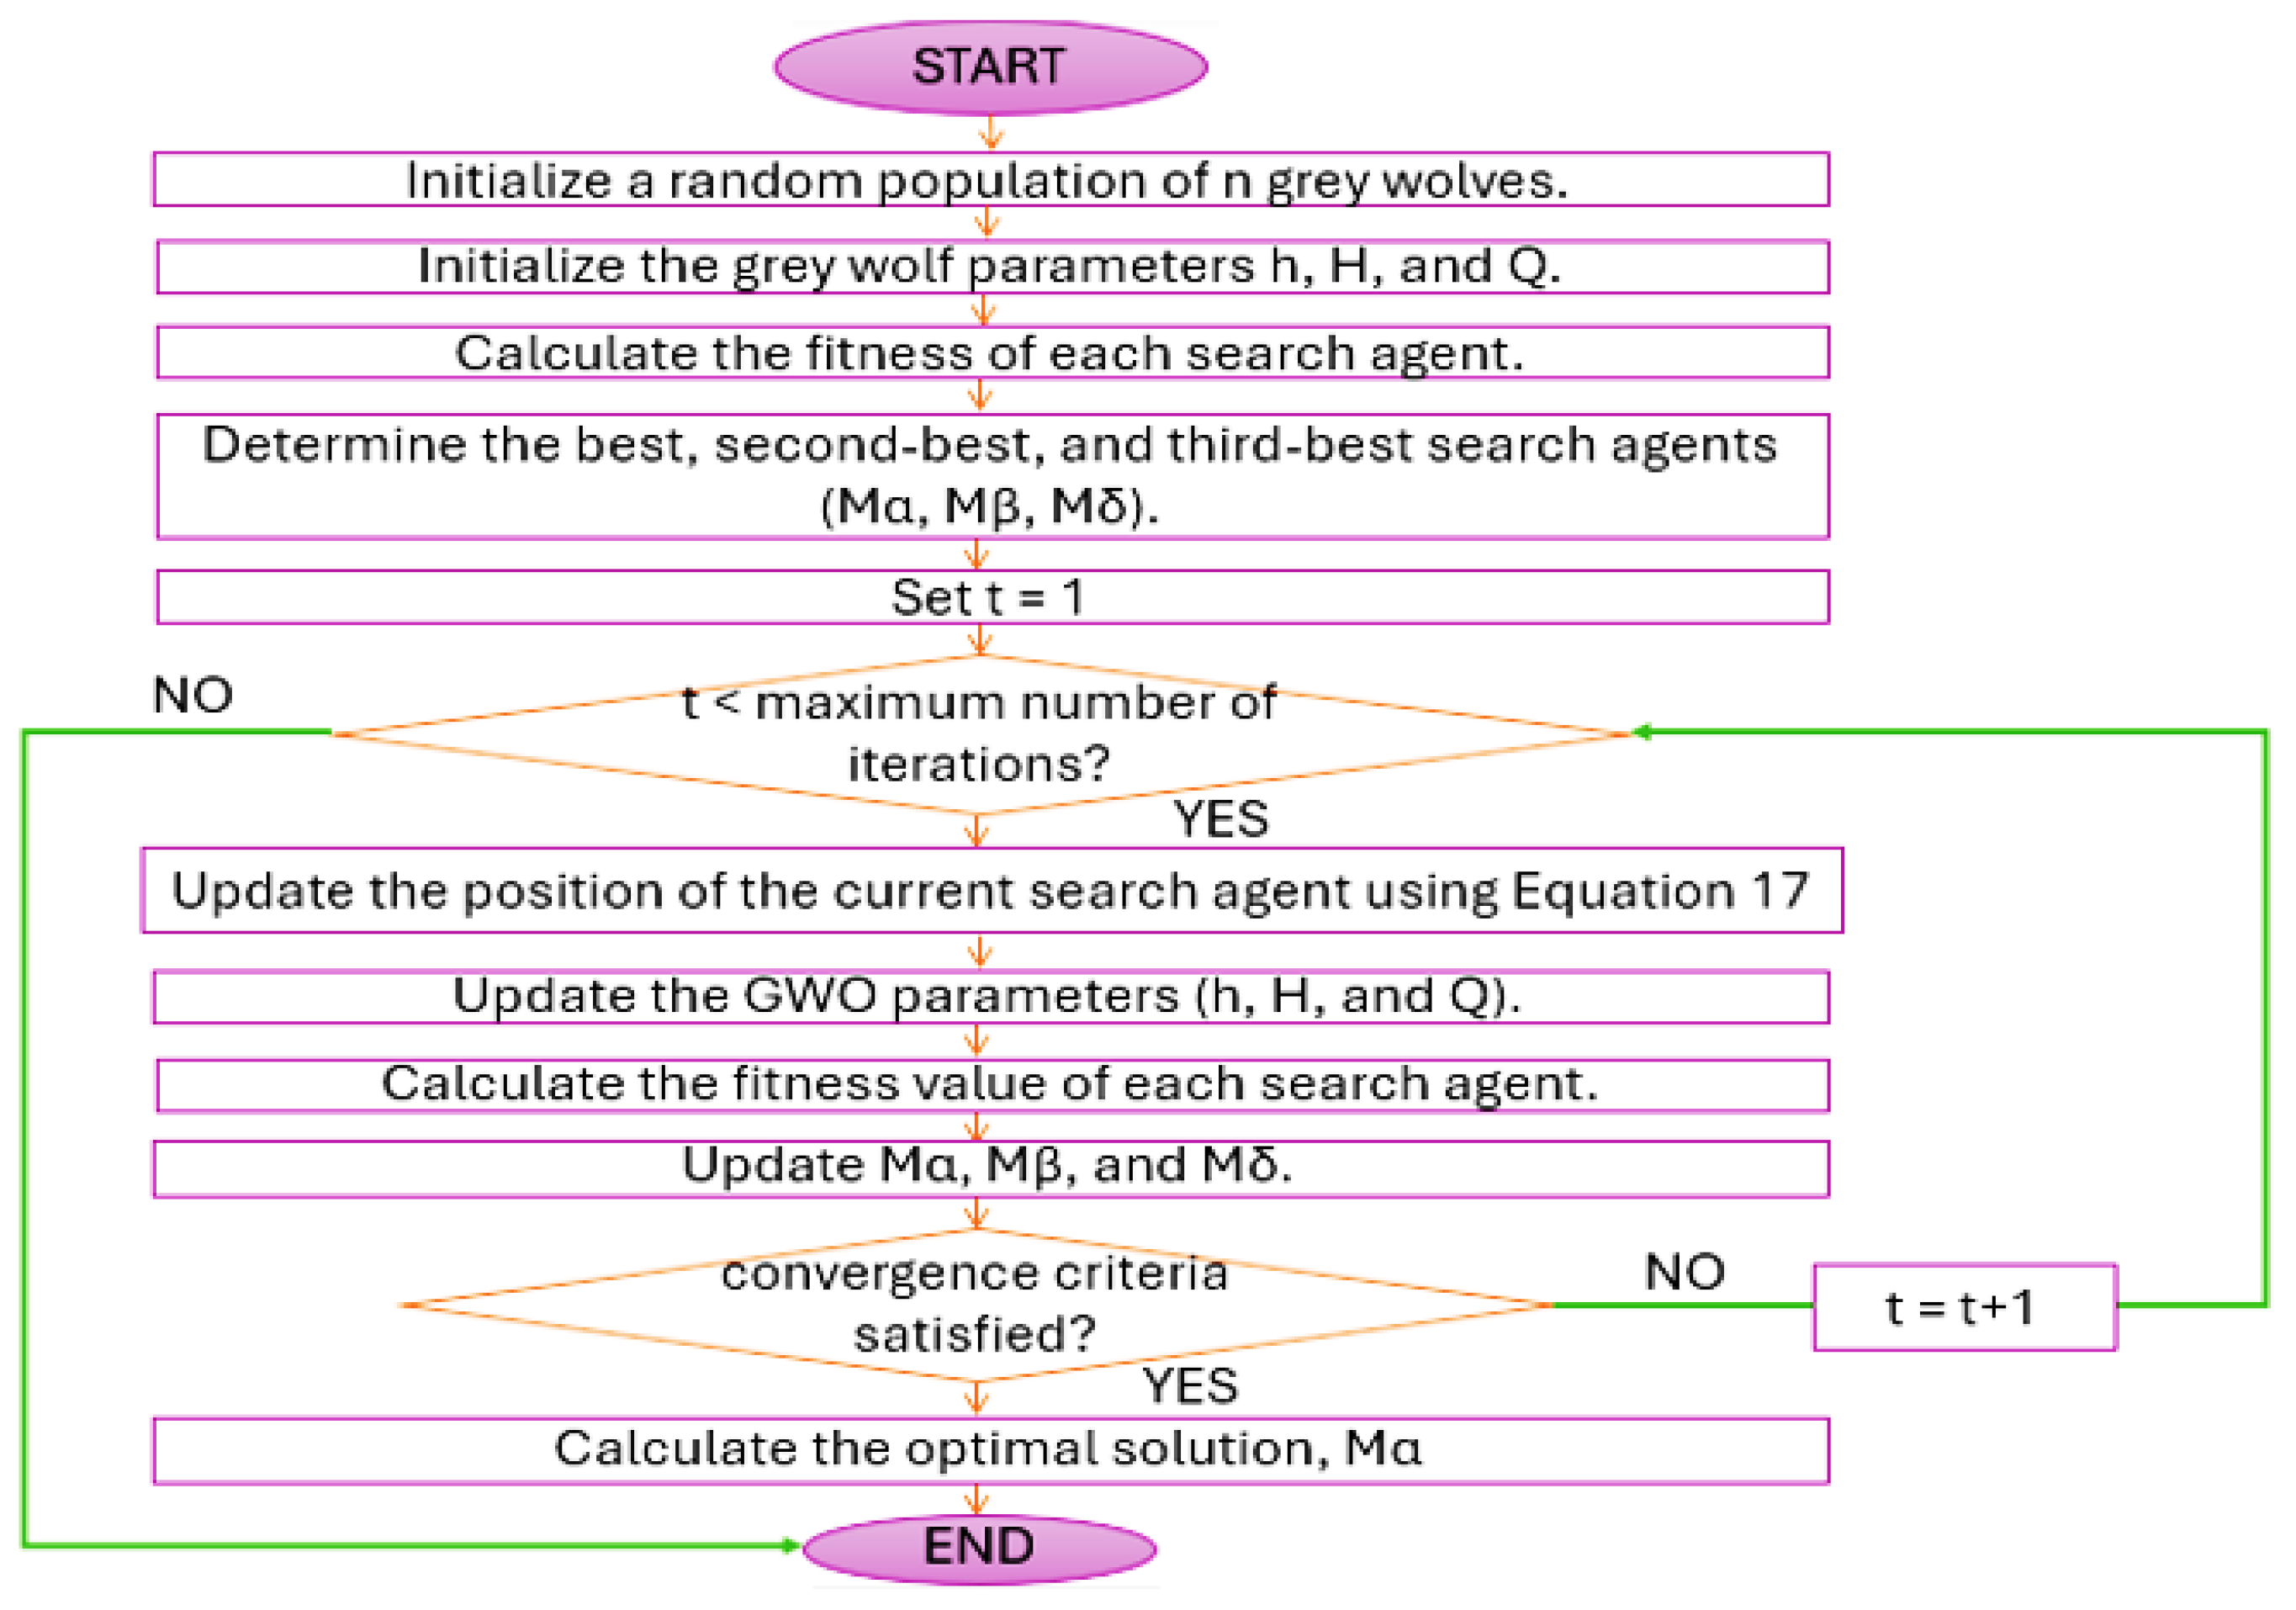
Figure 5.
Multi-objective Greywolf optimisation flowchart.
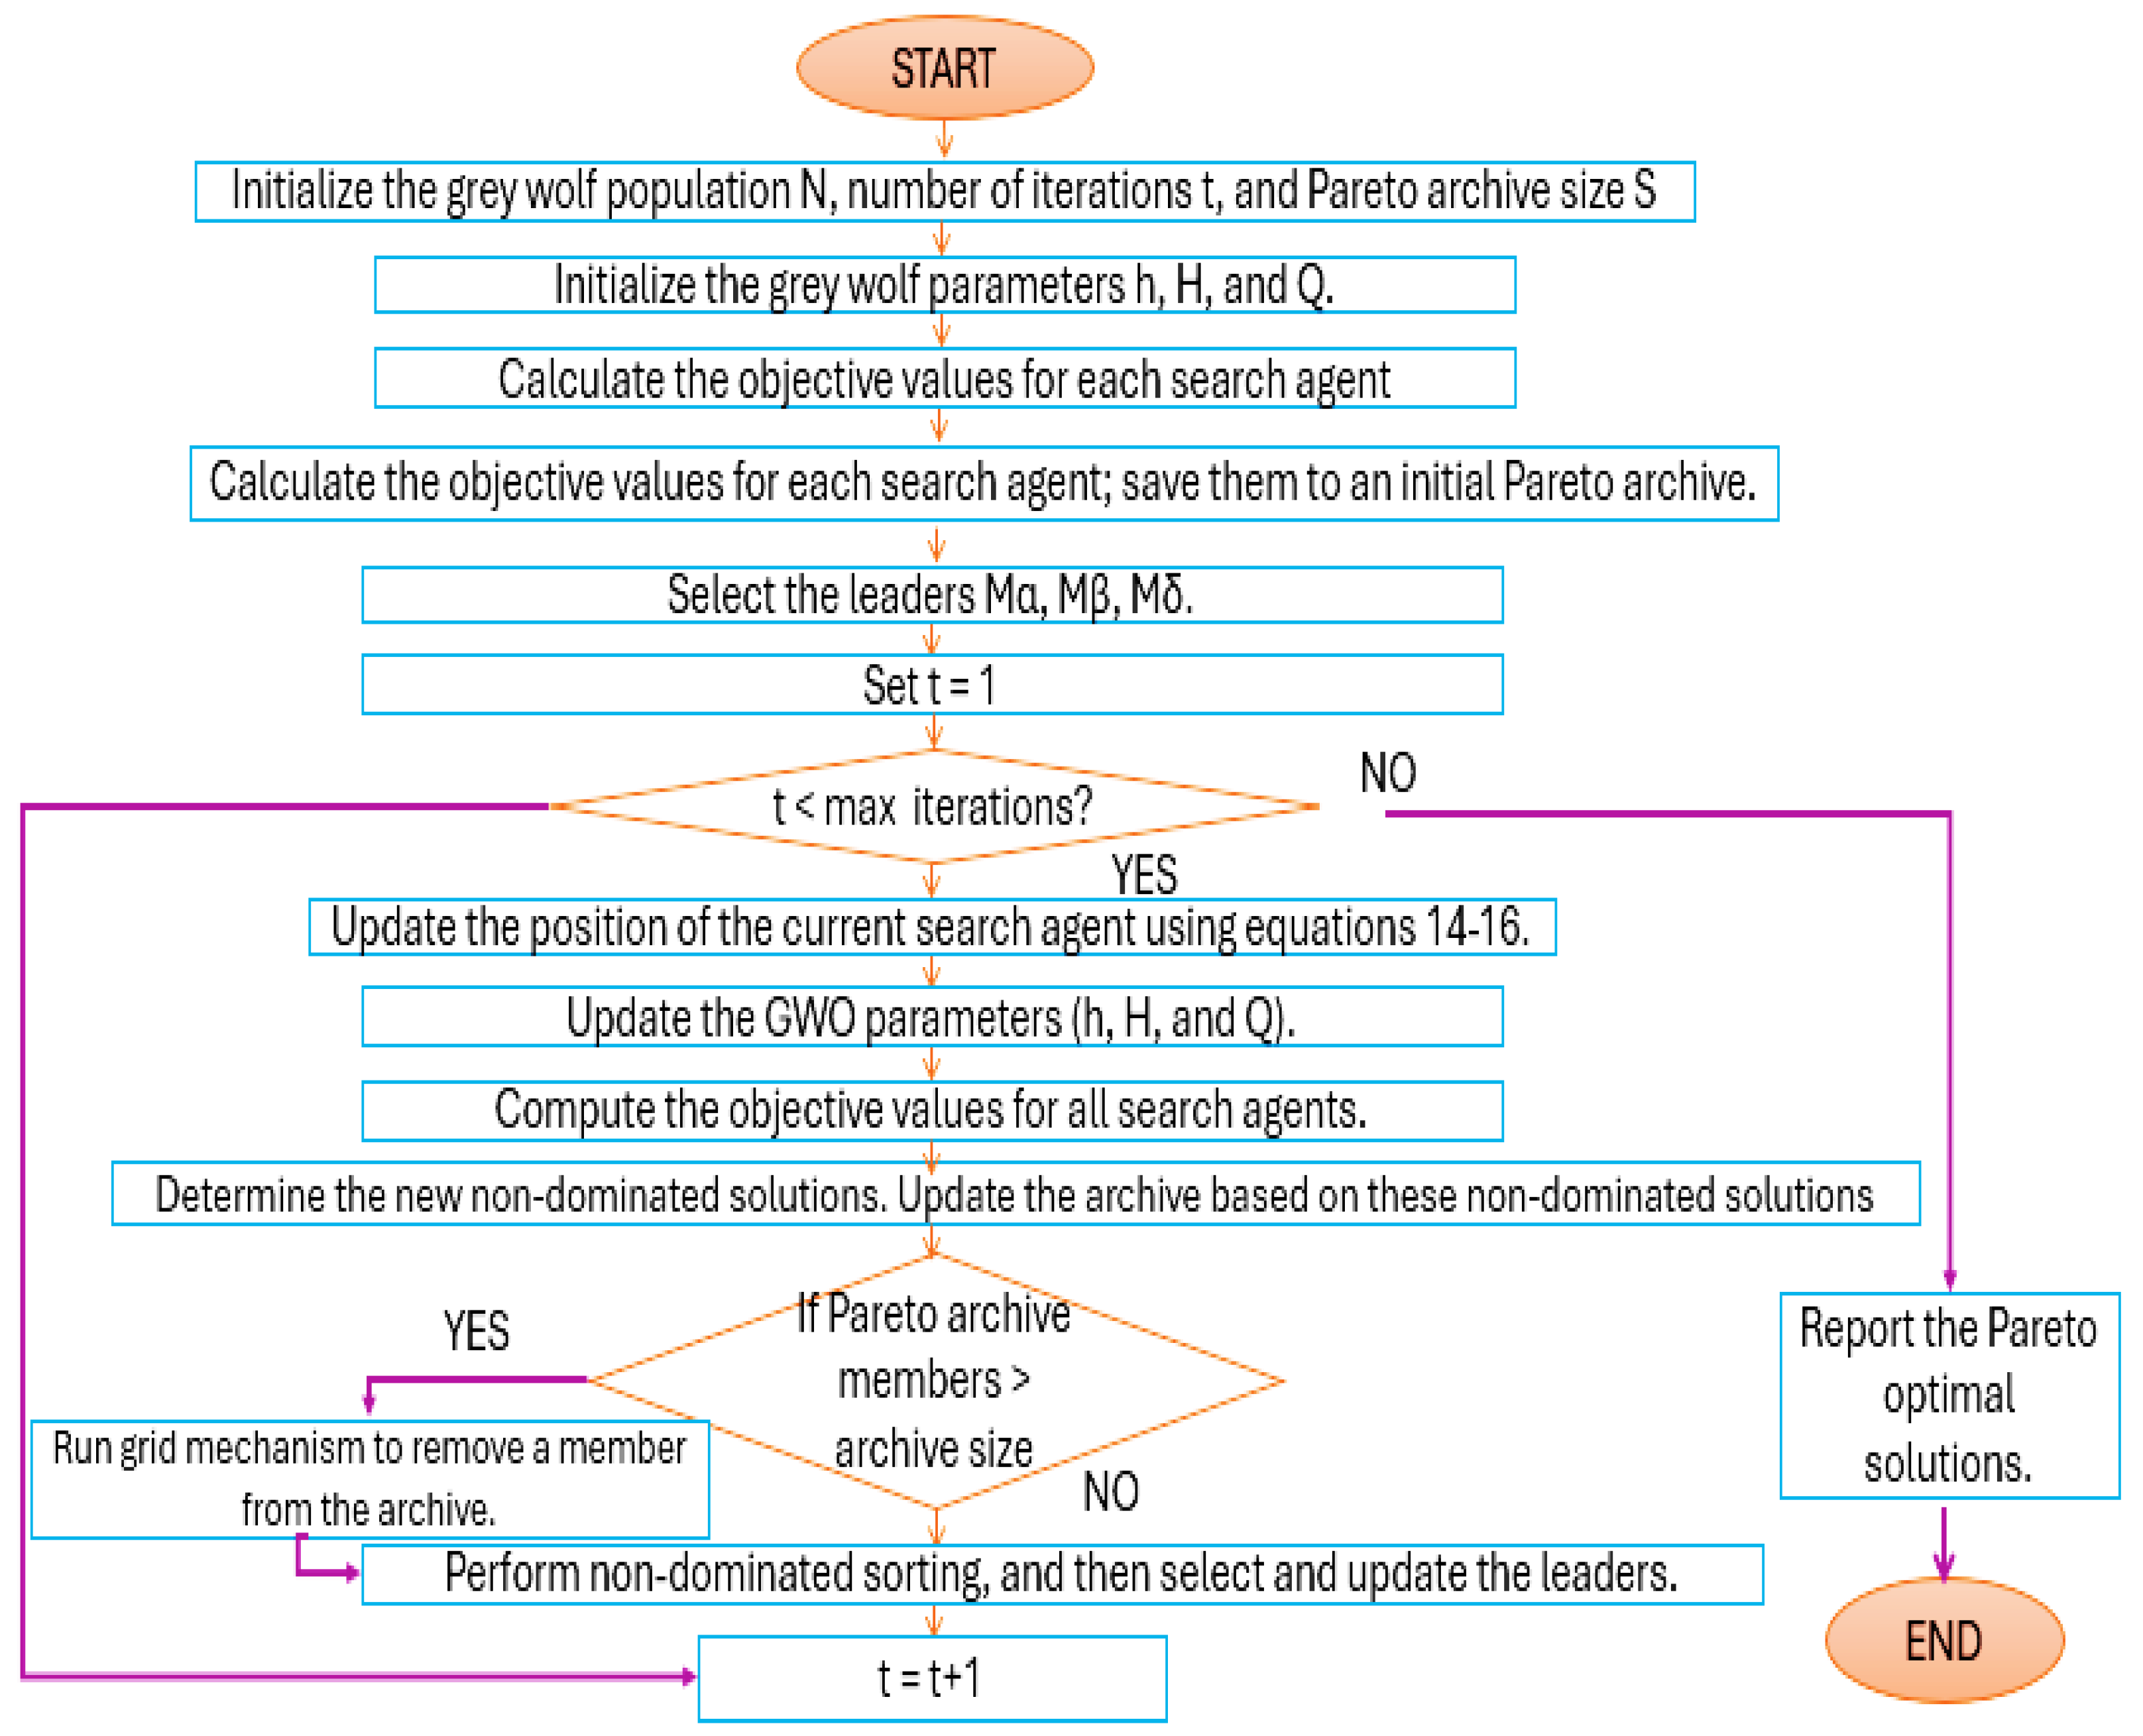
Figure 6.
Pareto front for Eta vs COP vs Qcc.
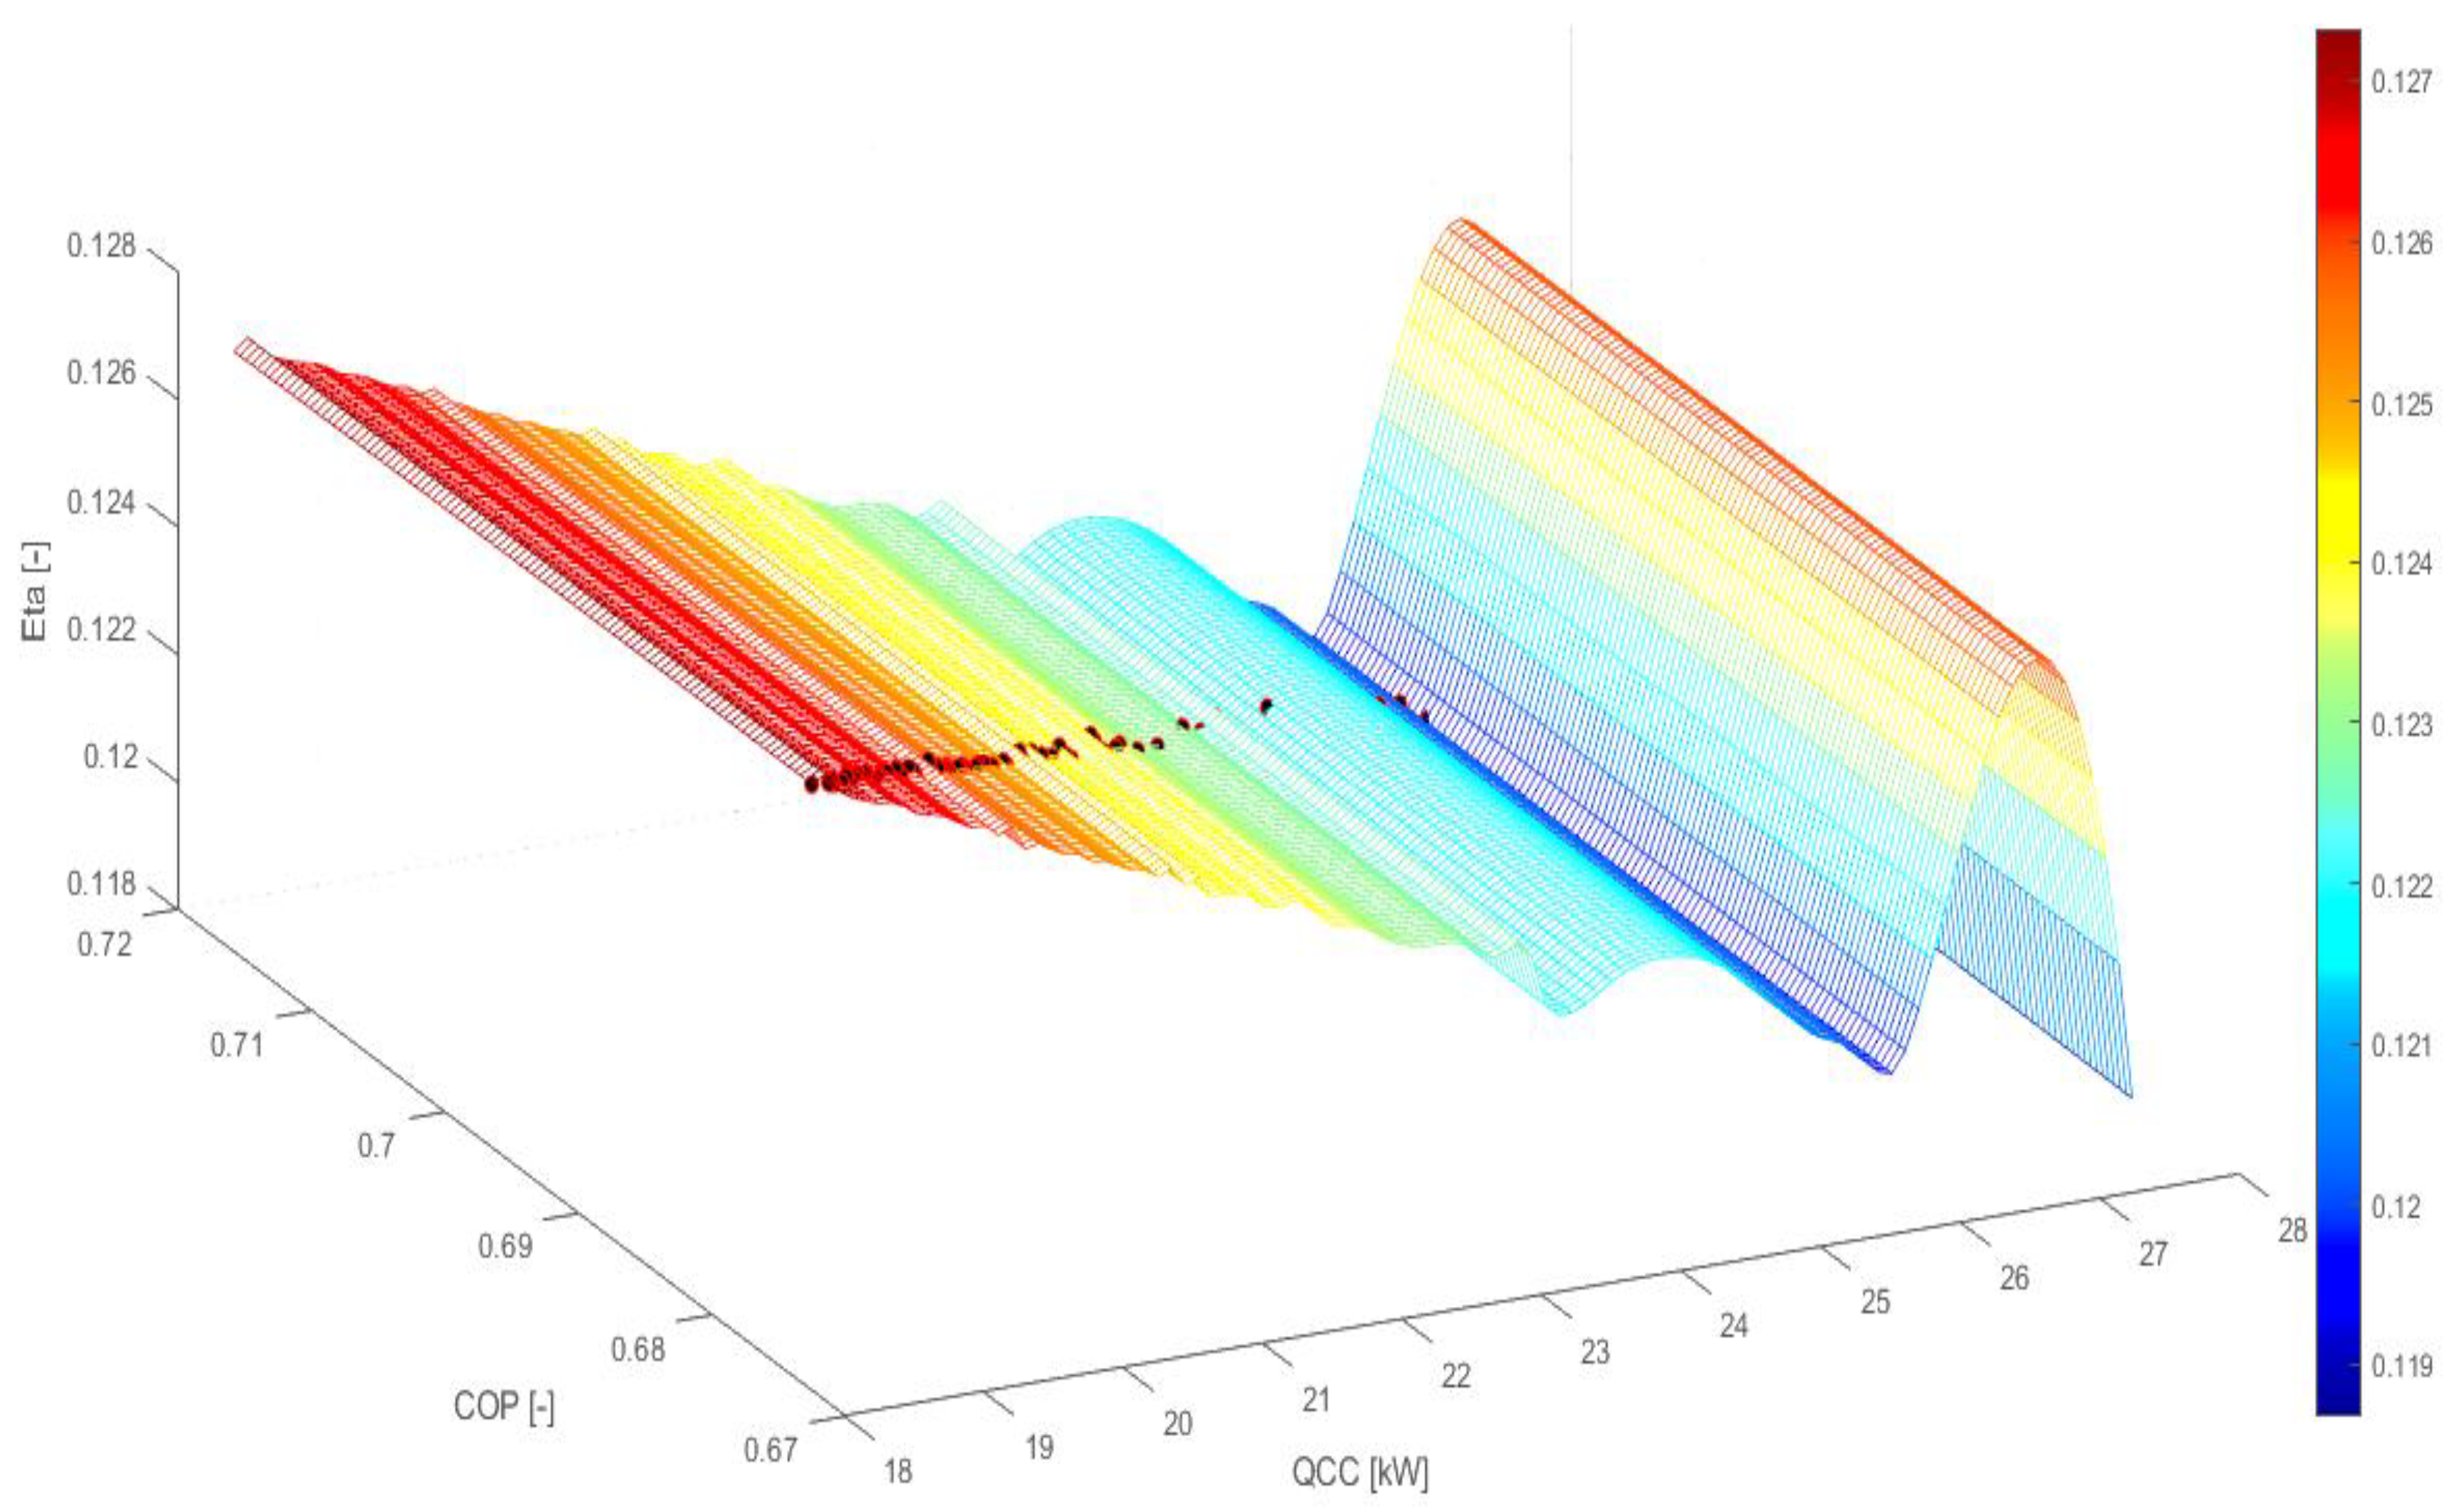
Figure 7.
Pareto front for COP vs Waste heat recovery efficiency, ηe.
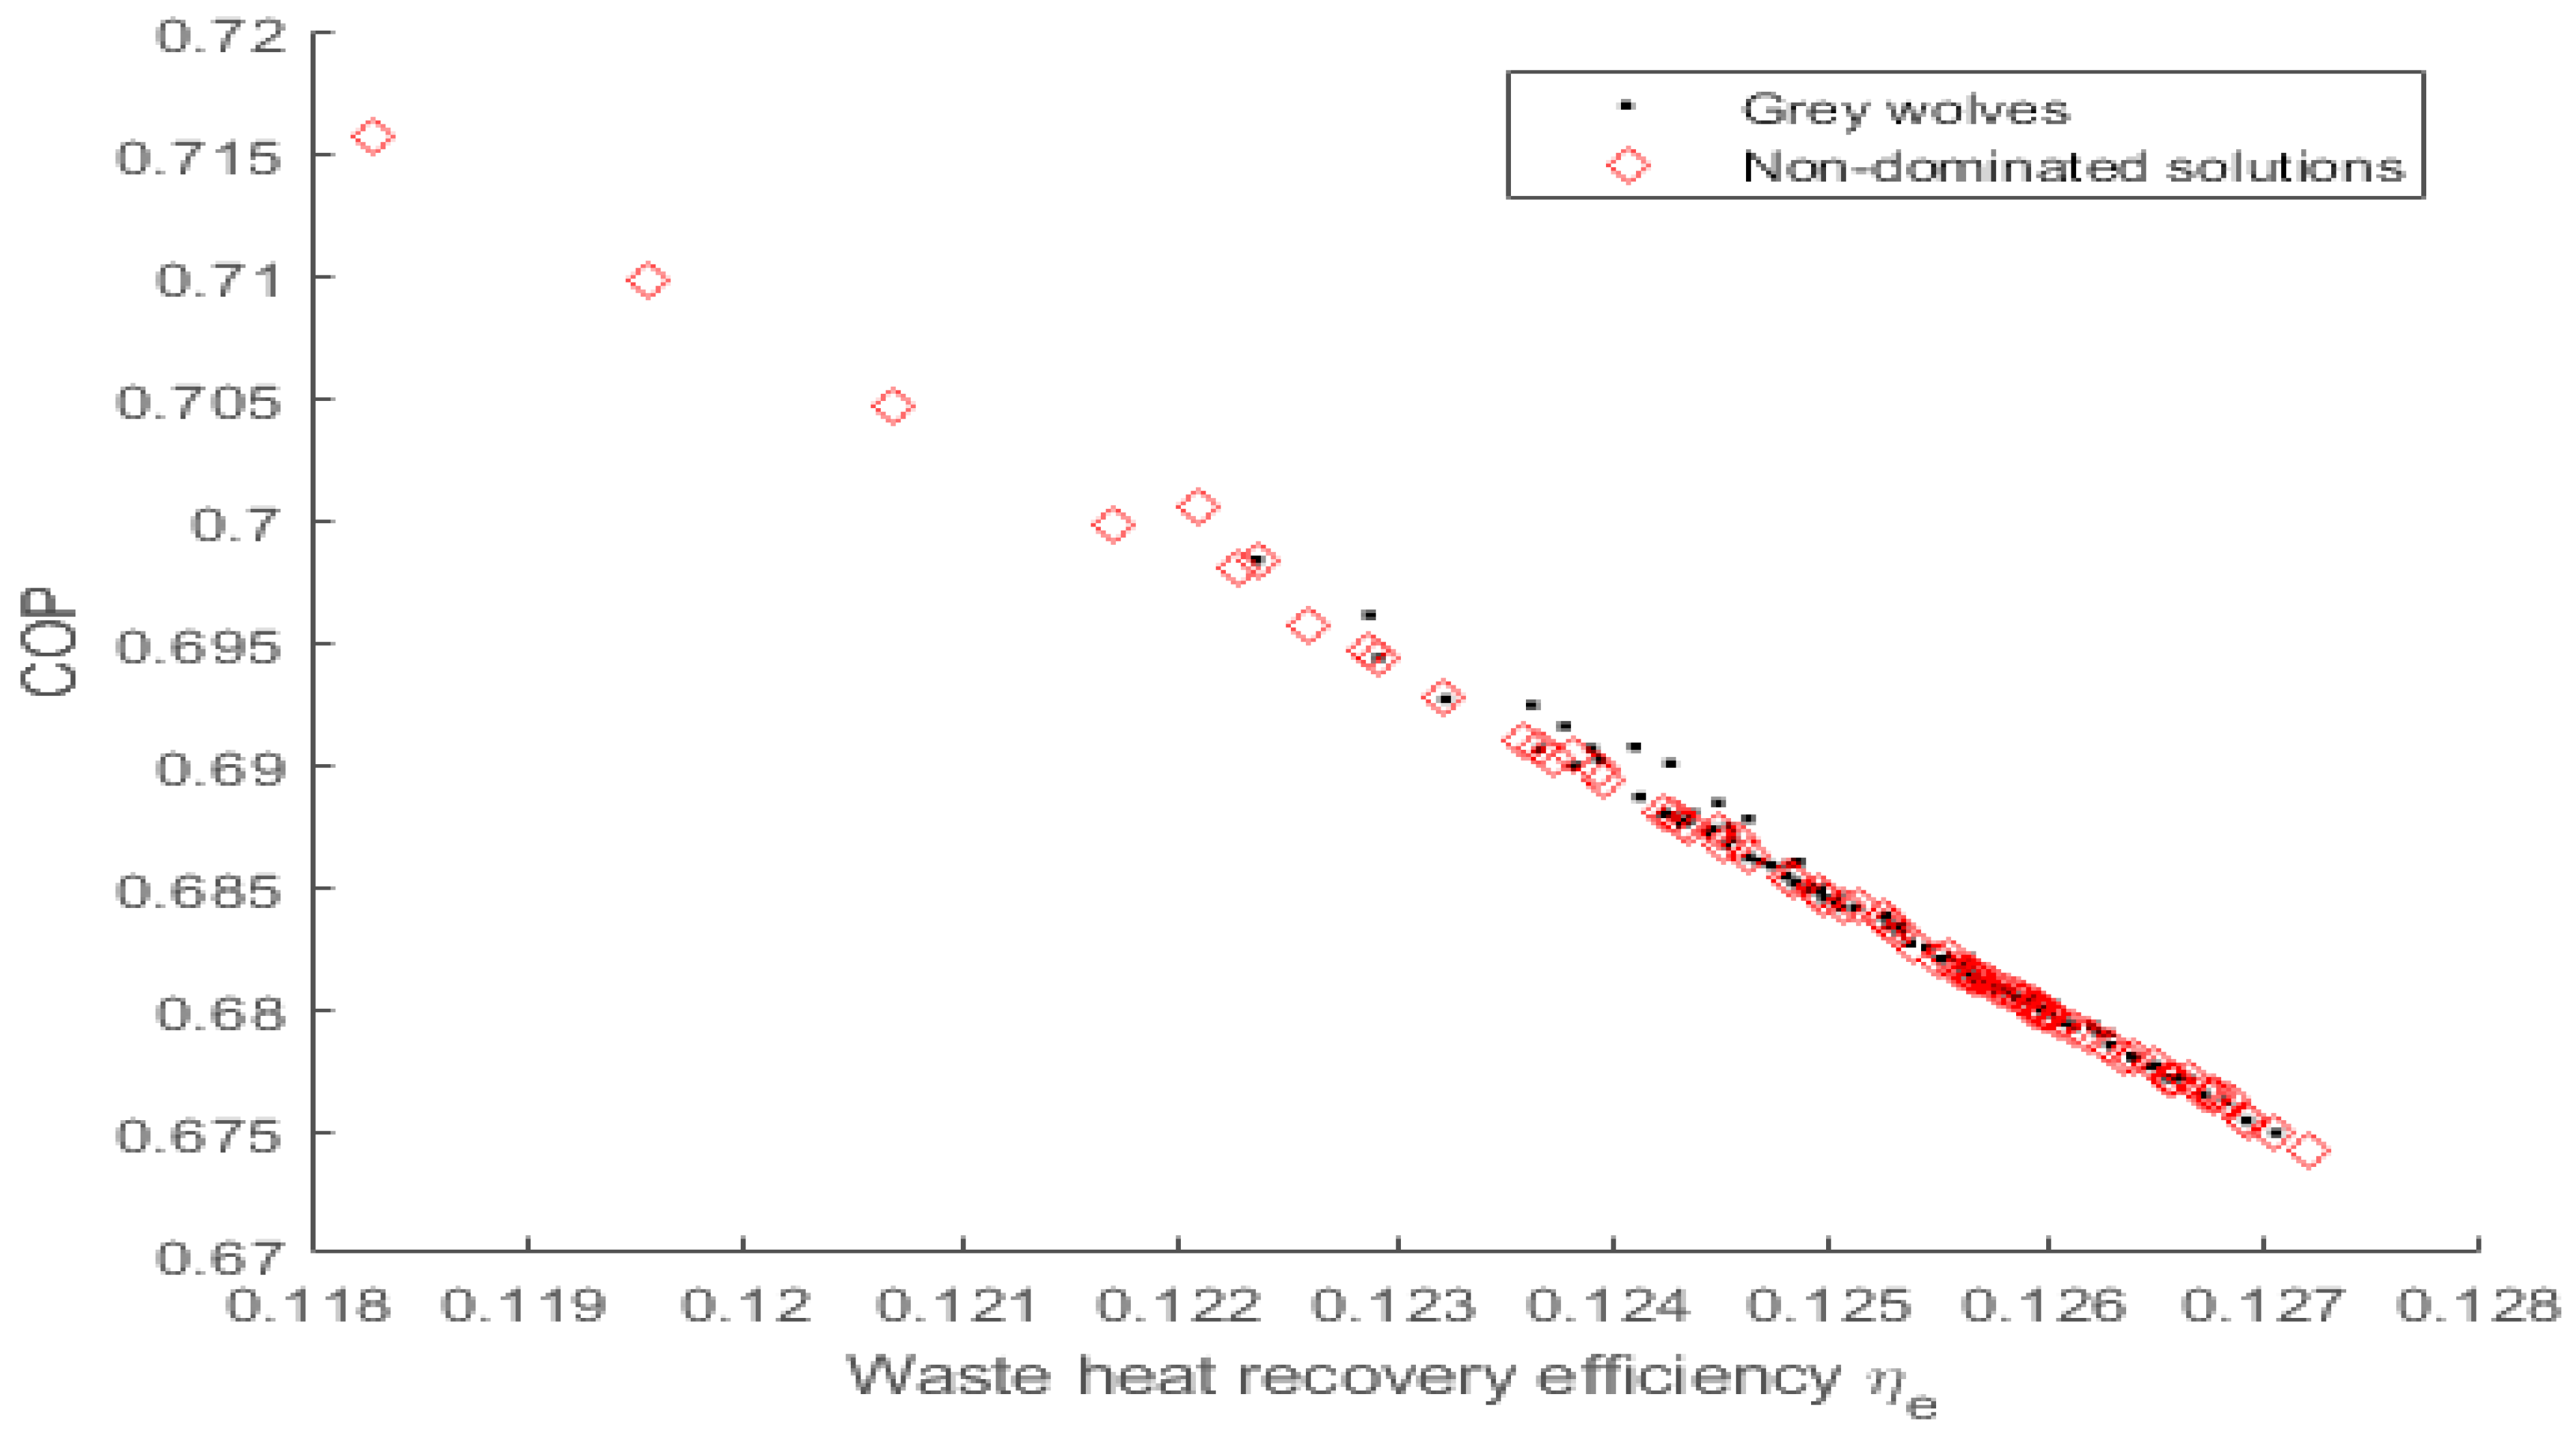
Figure 8.
Pareto front for Qcc vs COP.
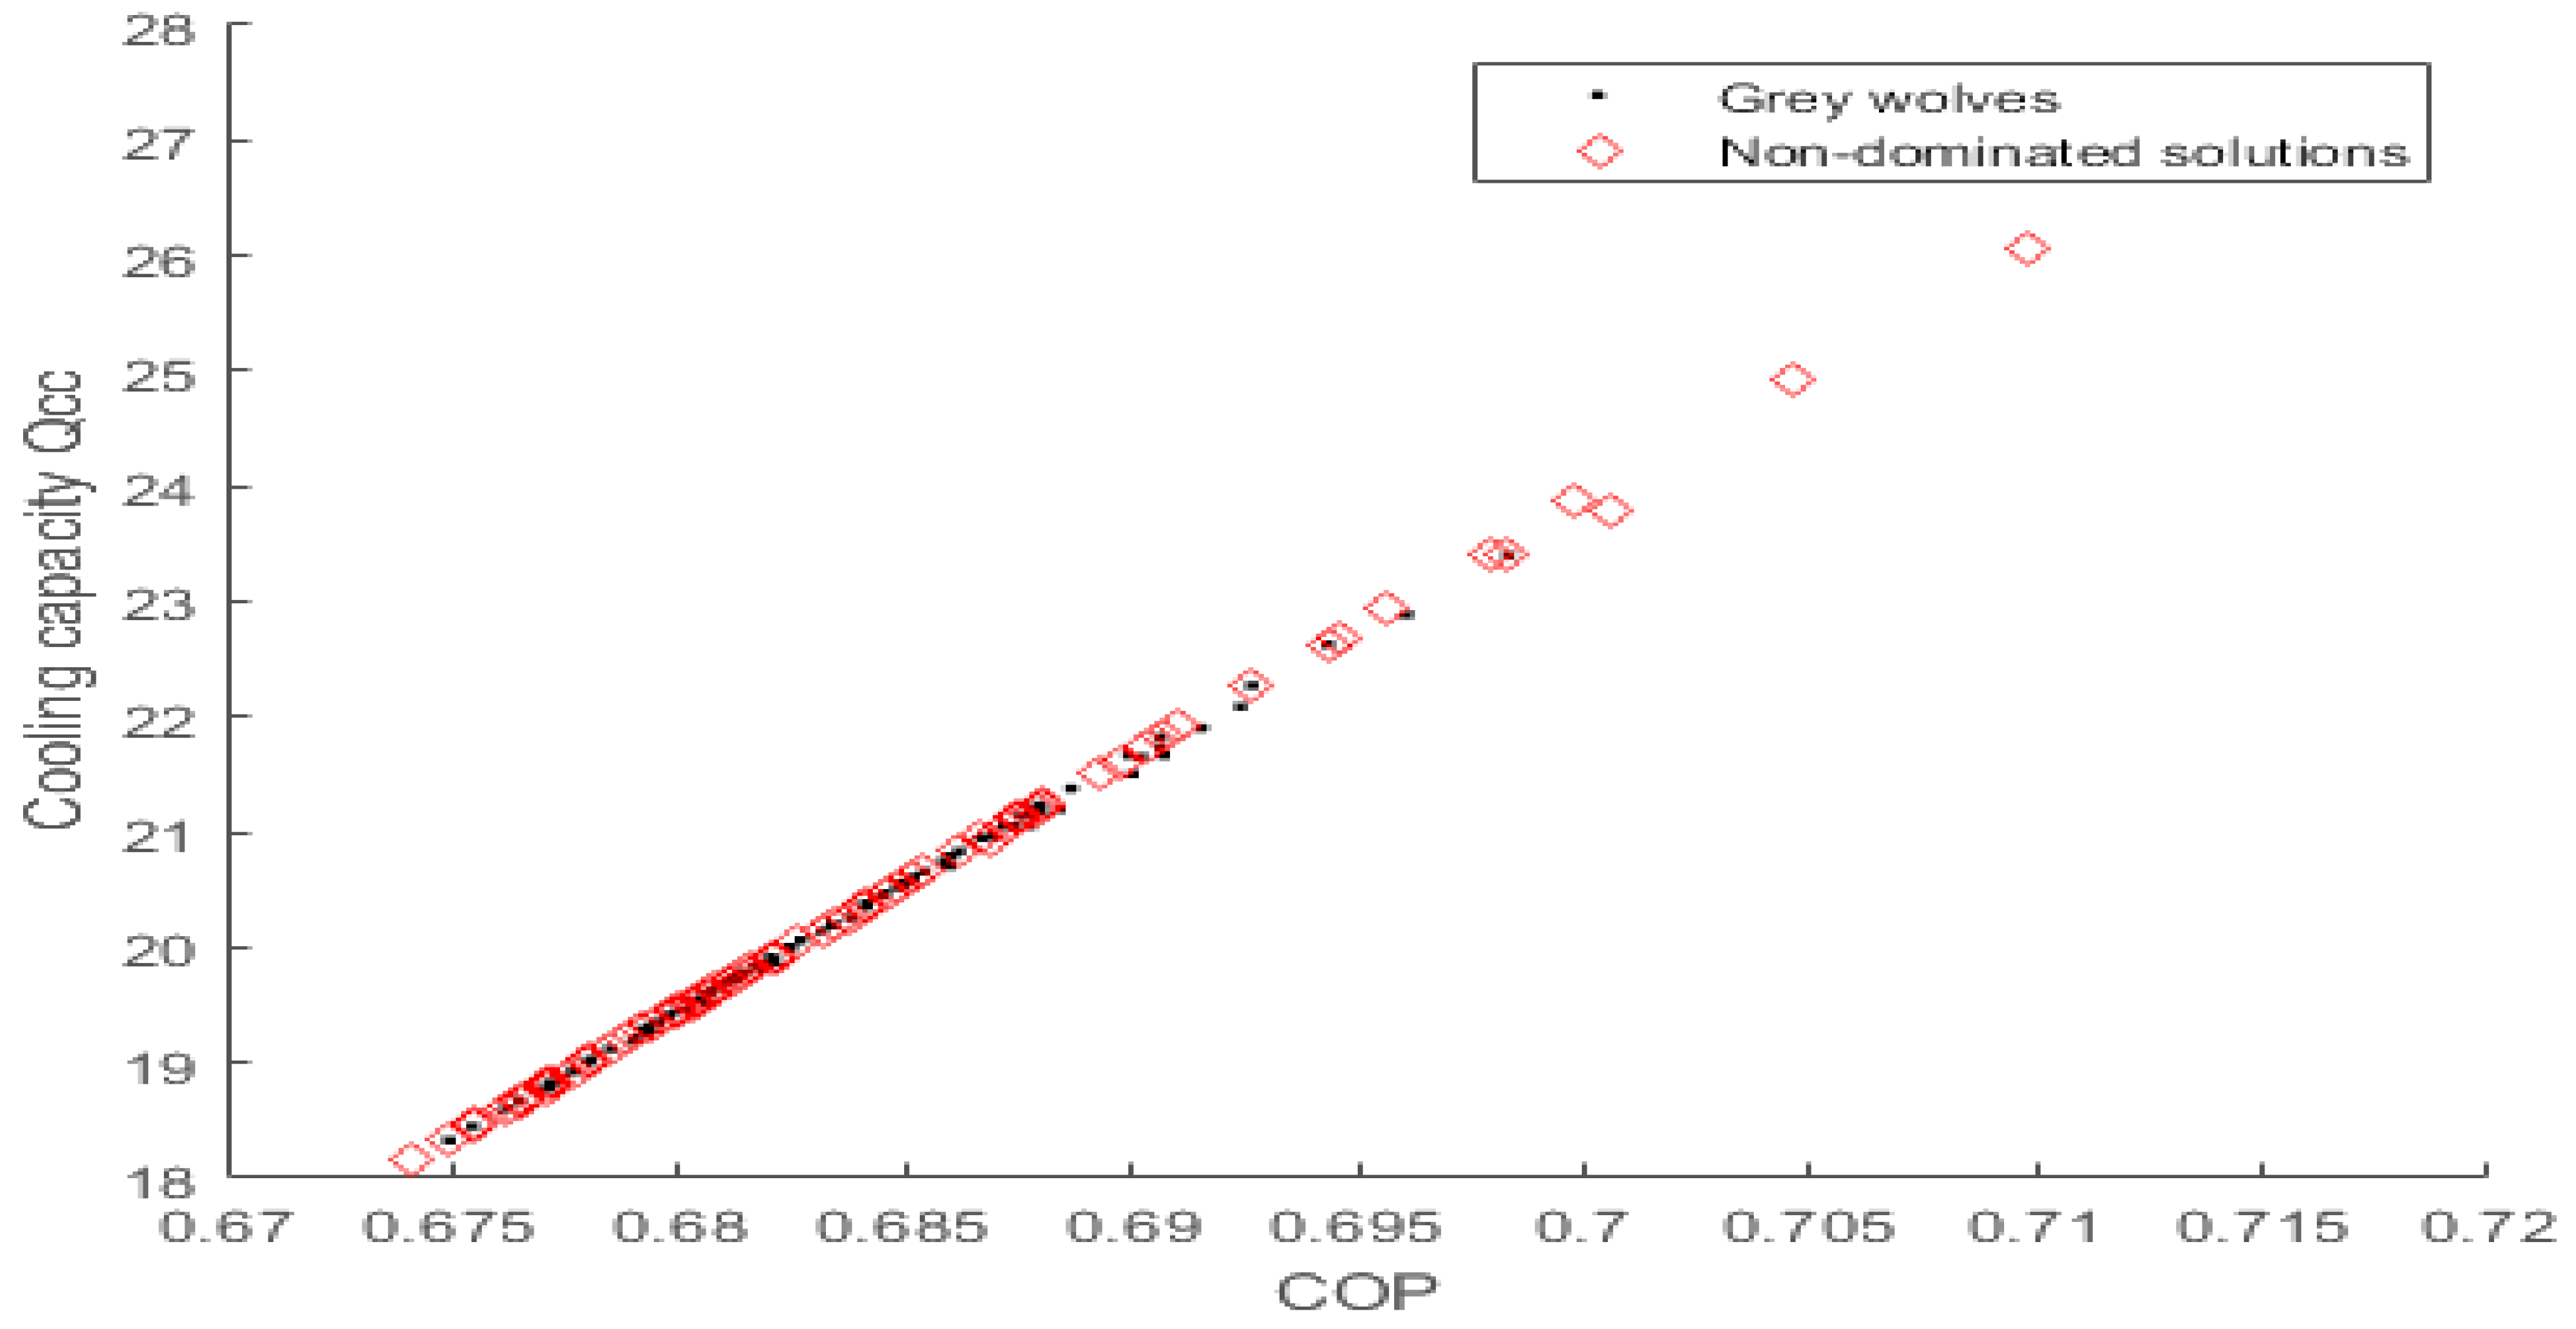
Figure 9.
Pareto front for ηe vs Qcc.
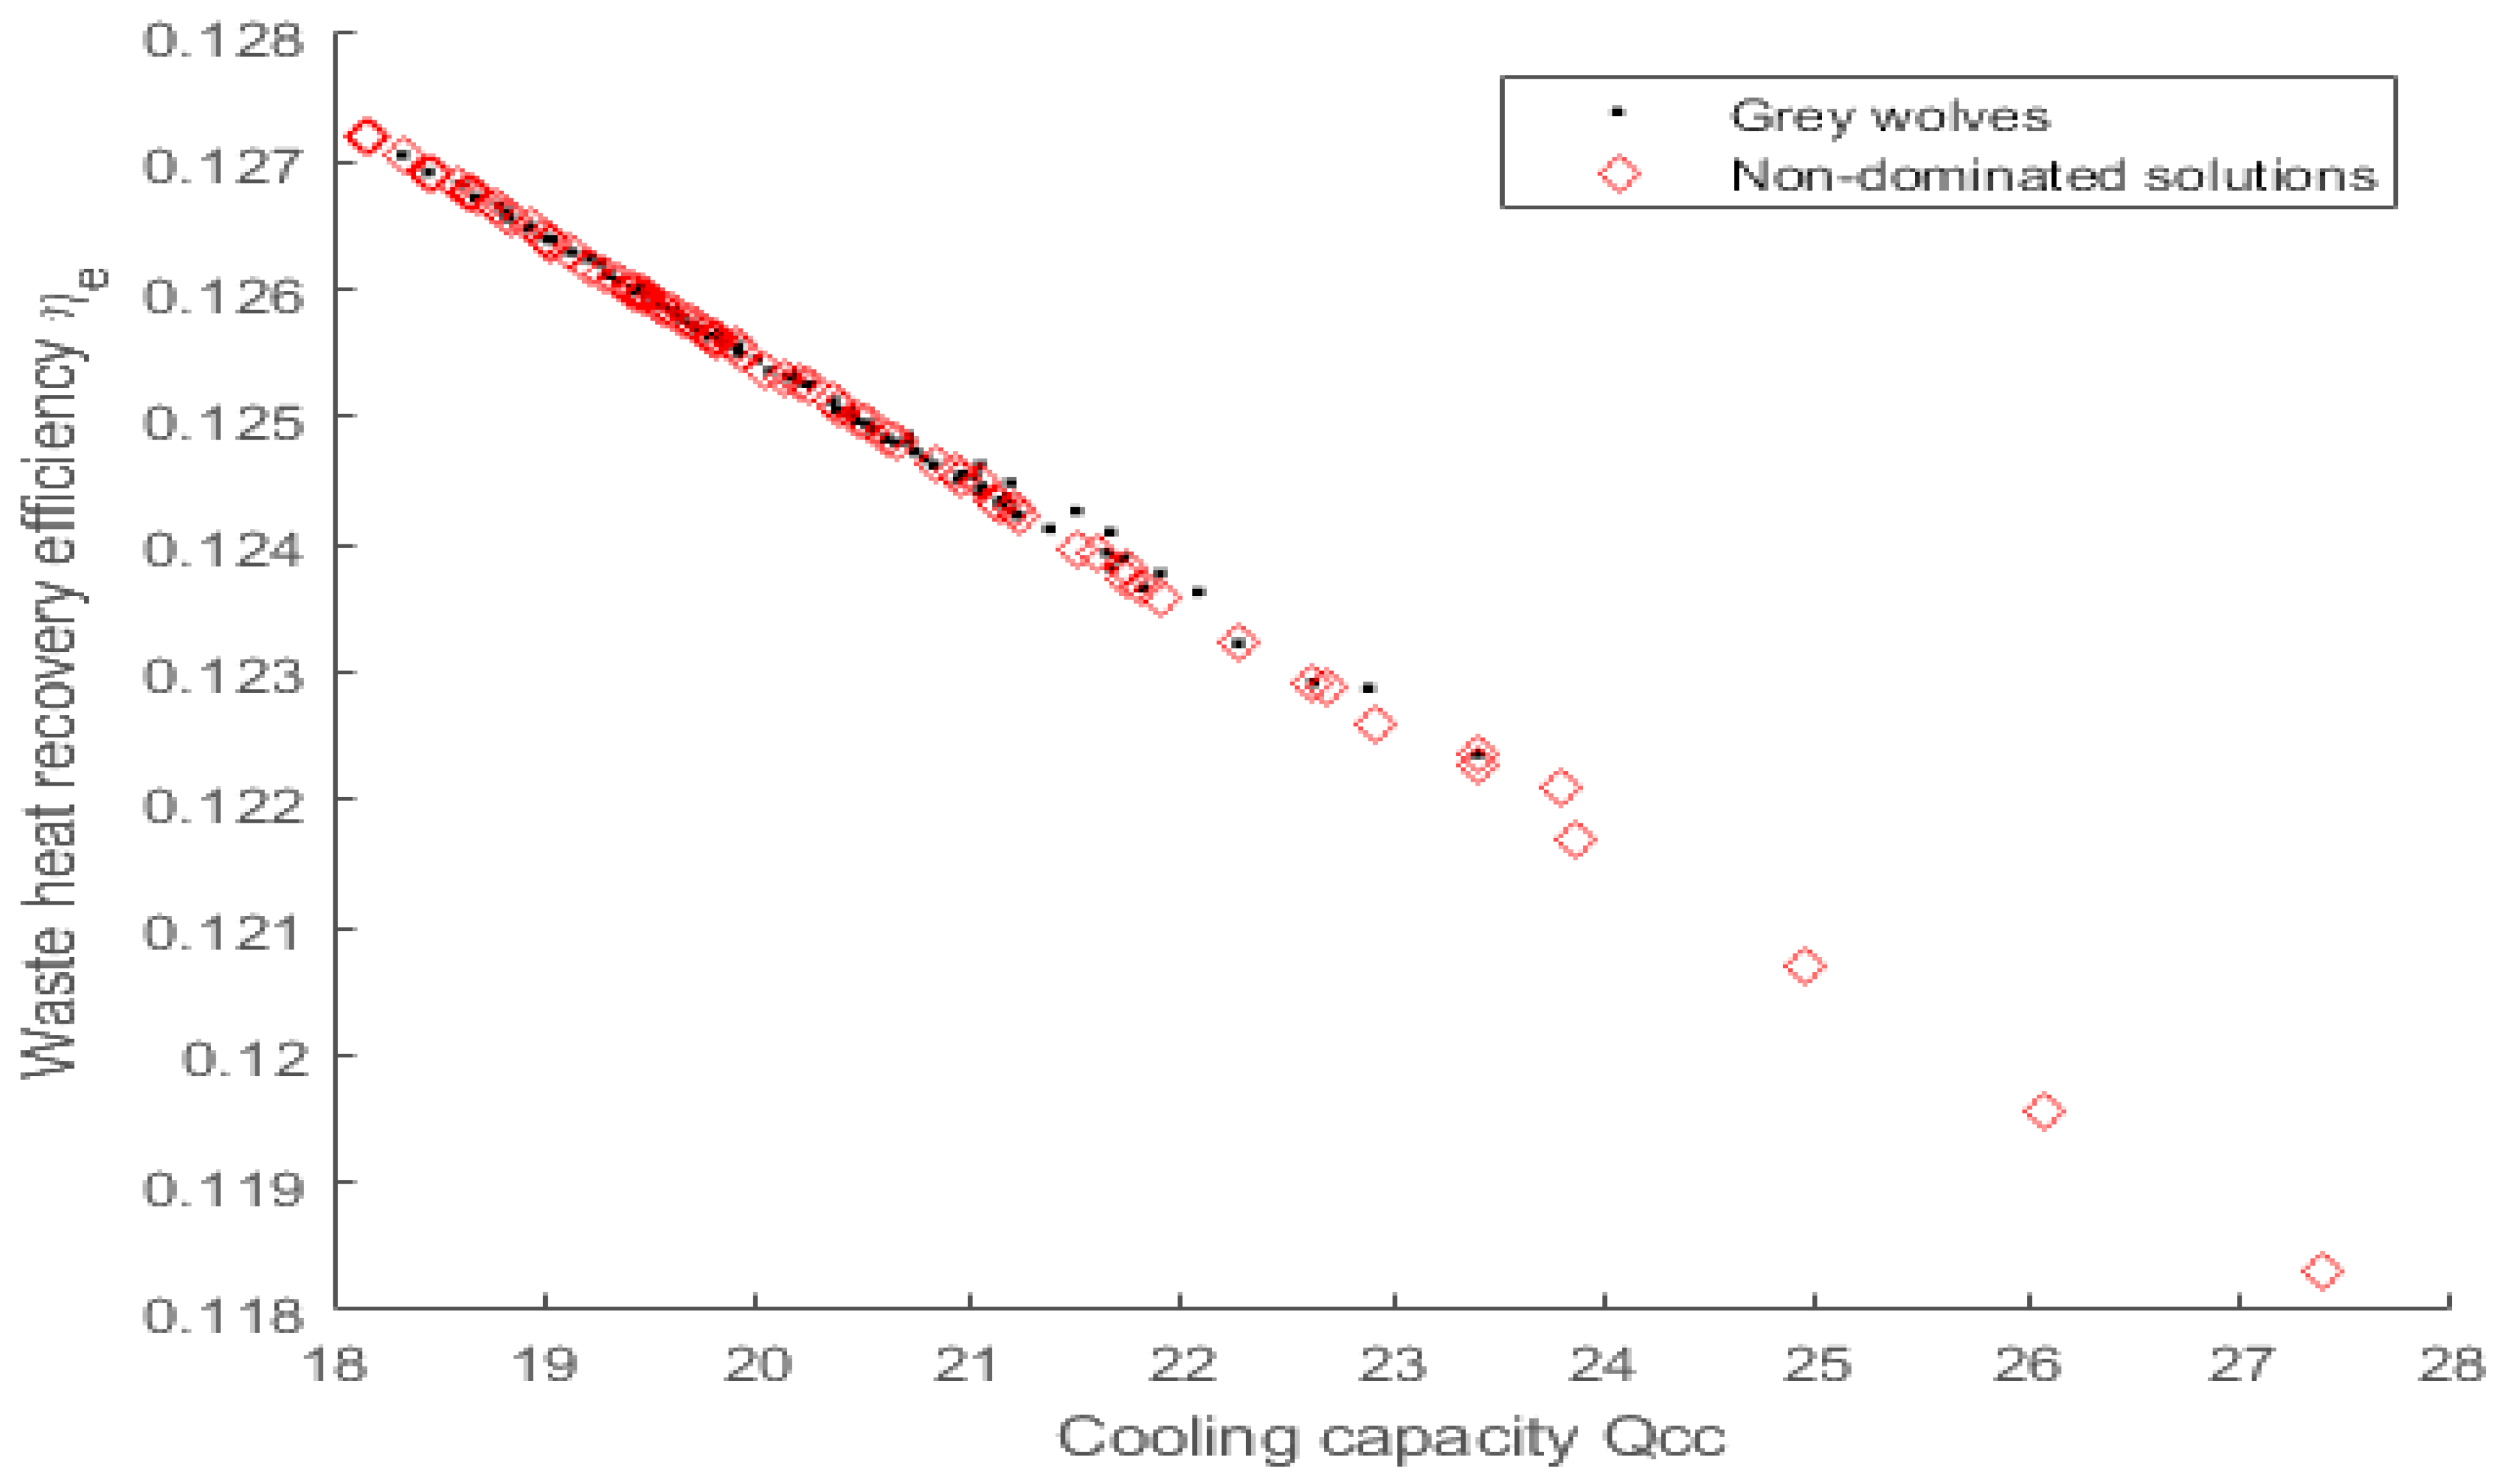
Figure 10.
Effects of varying hot water inlet temperature on the optimal objective functions.
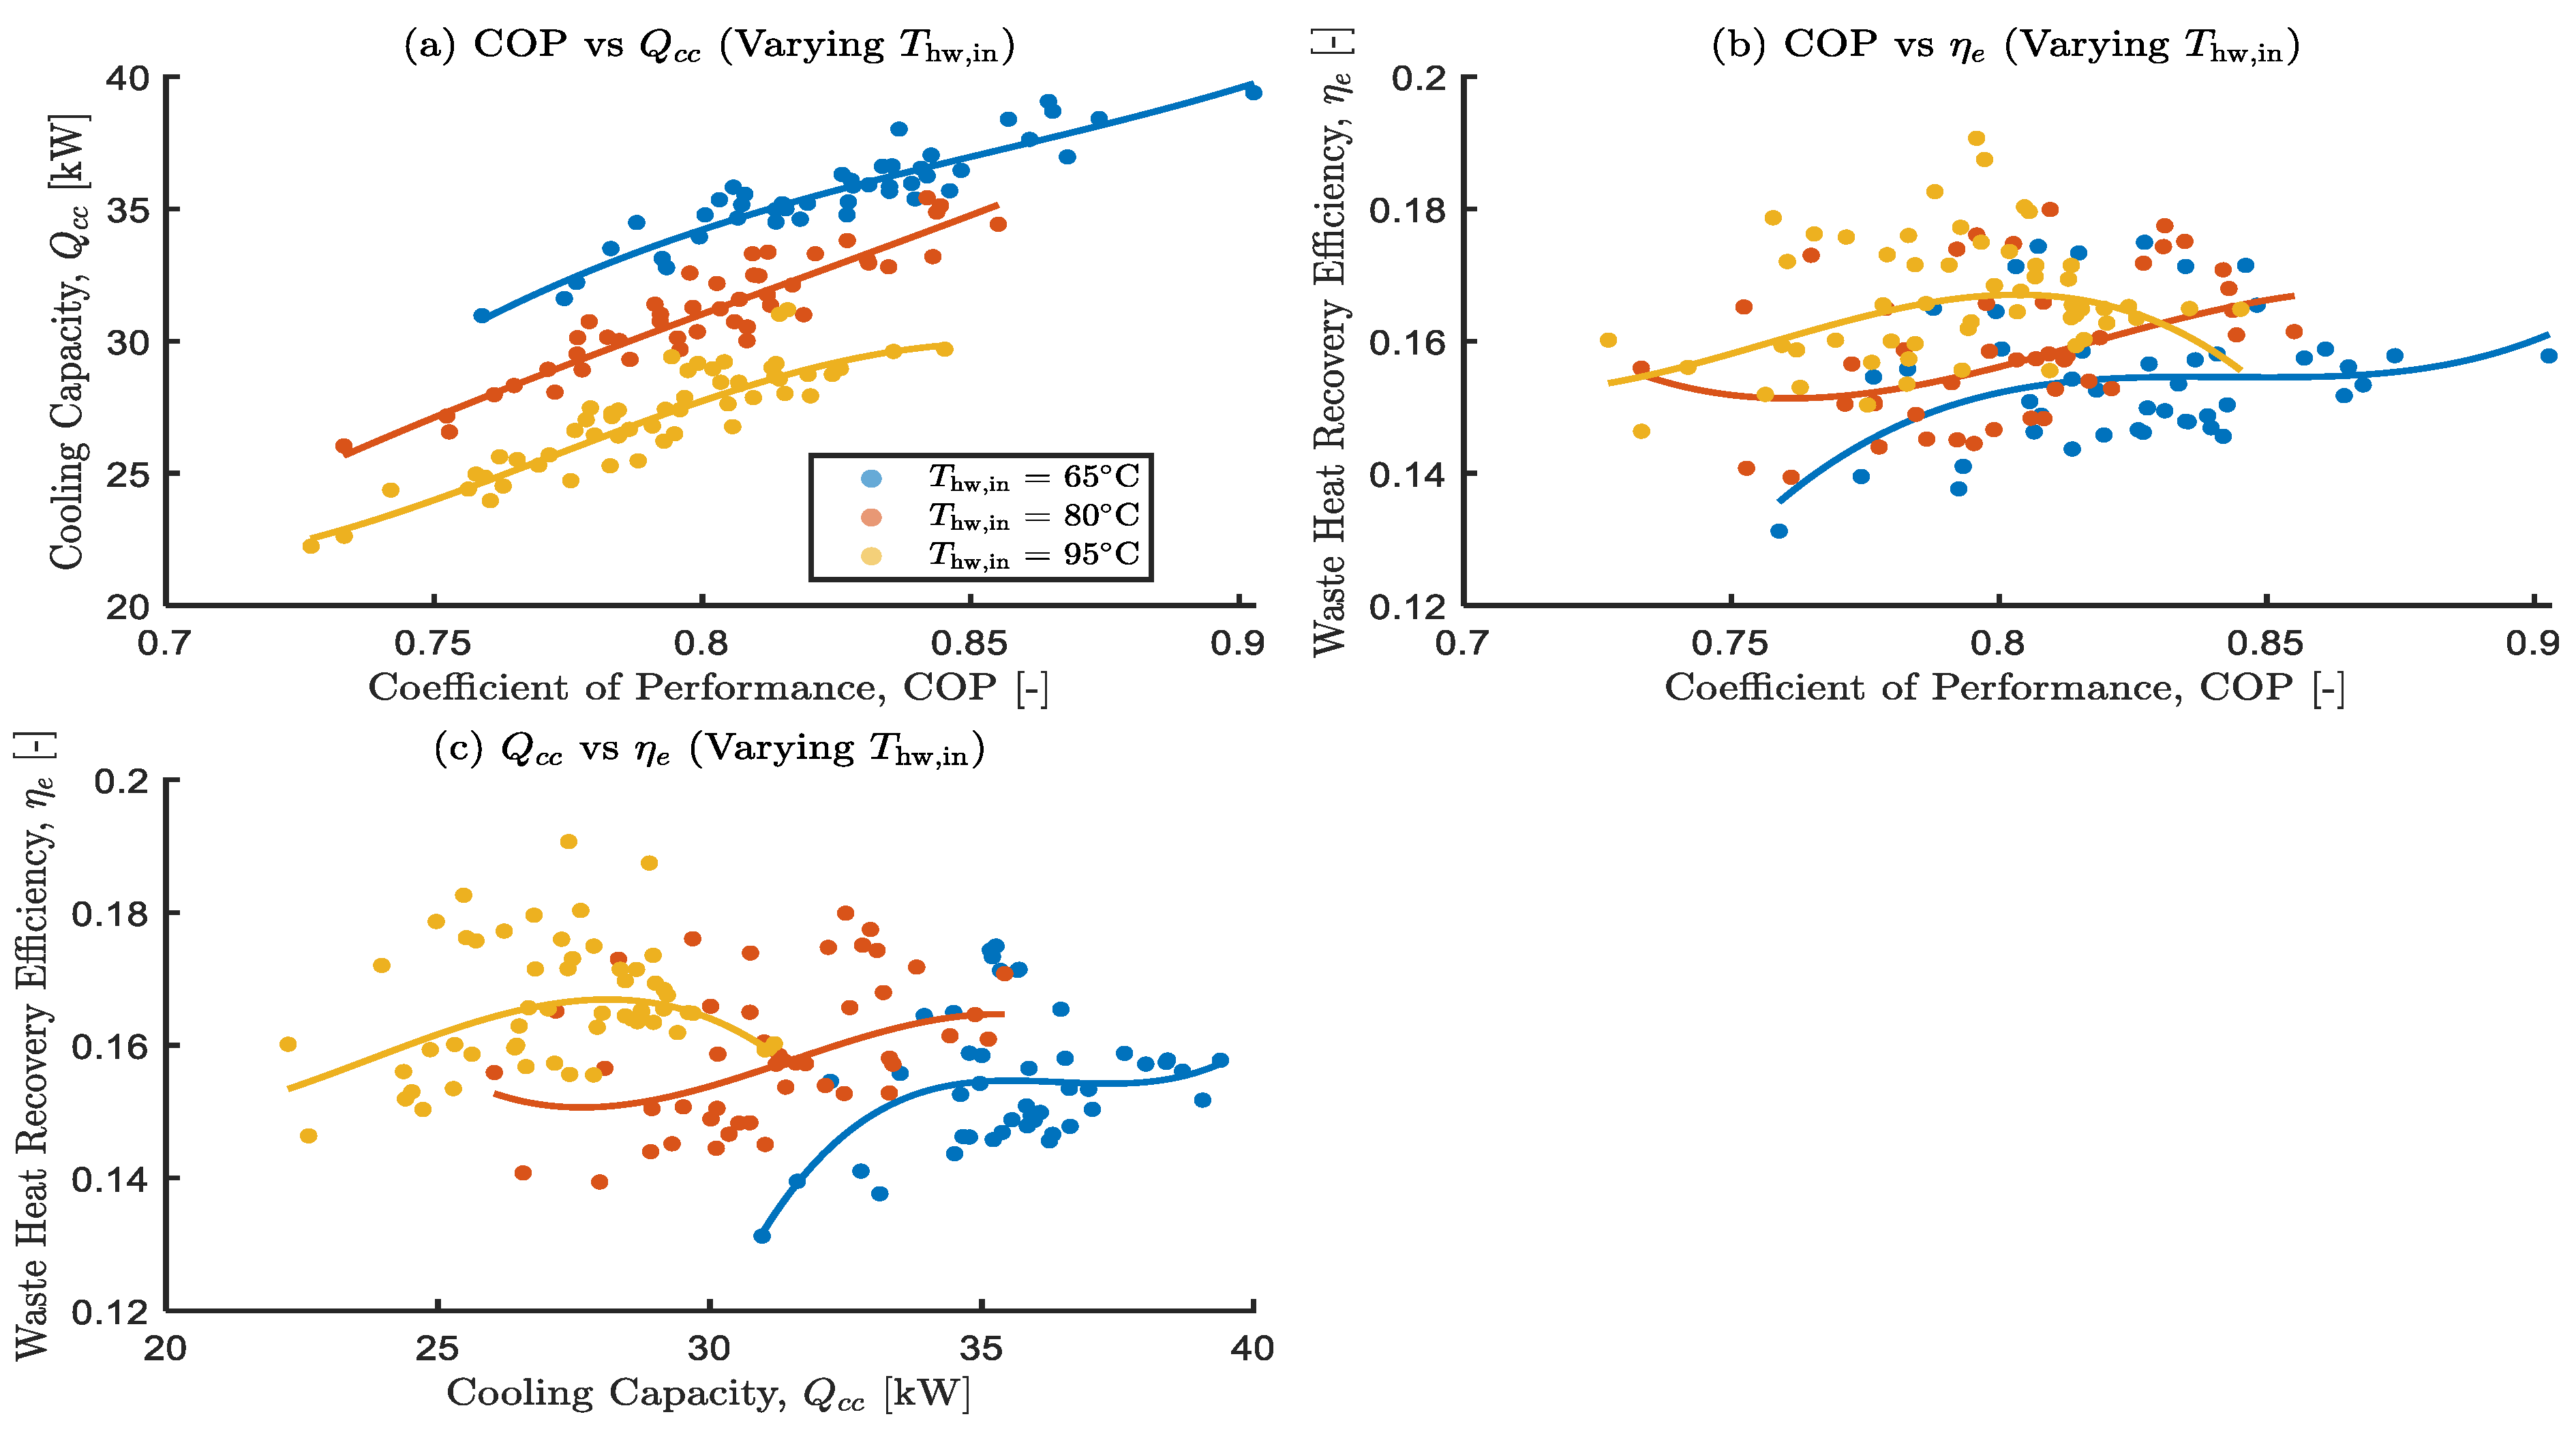
Figure 11.
Effects of varying cooling water inlet temperature on the optimal objective functions.
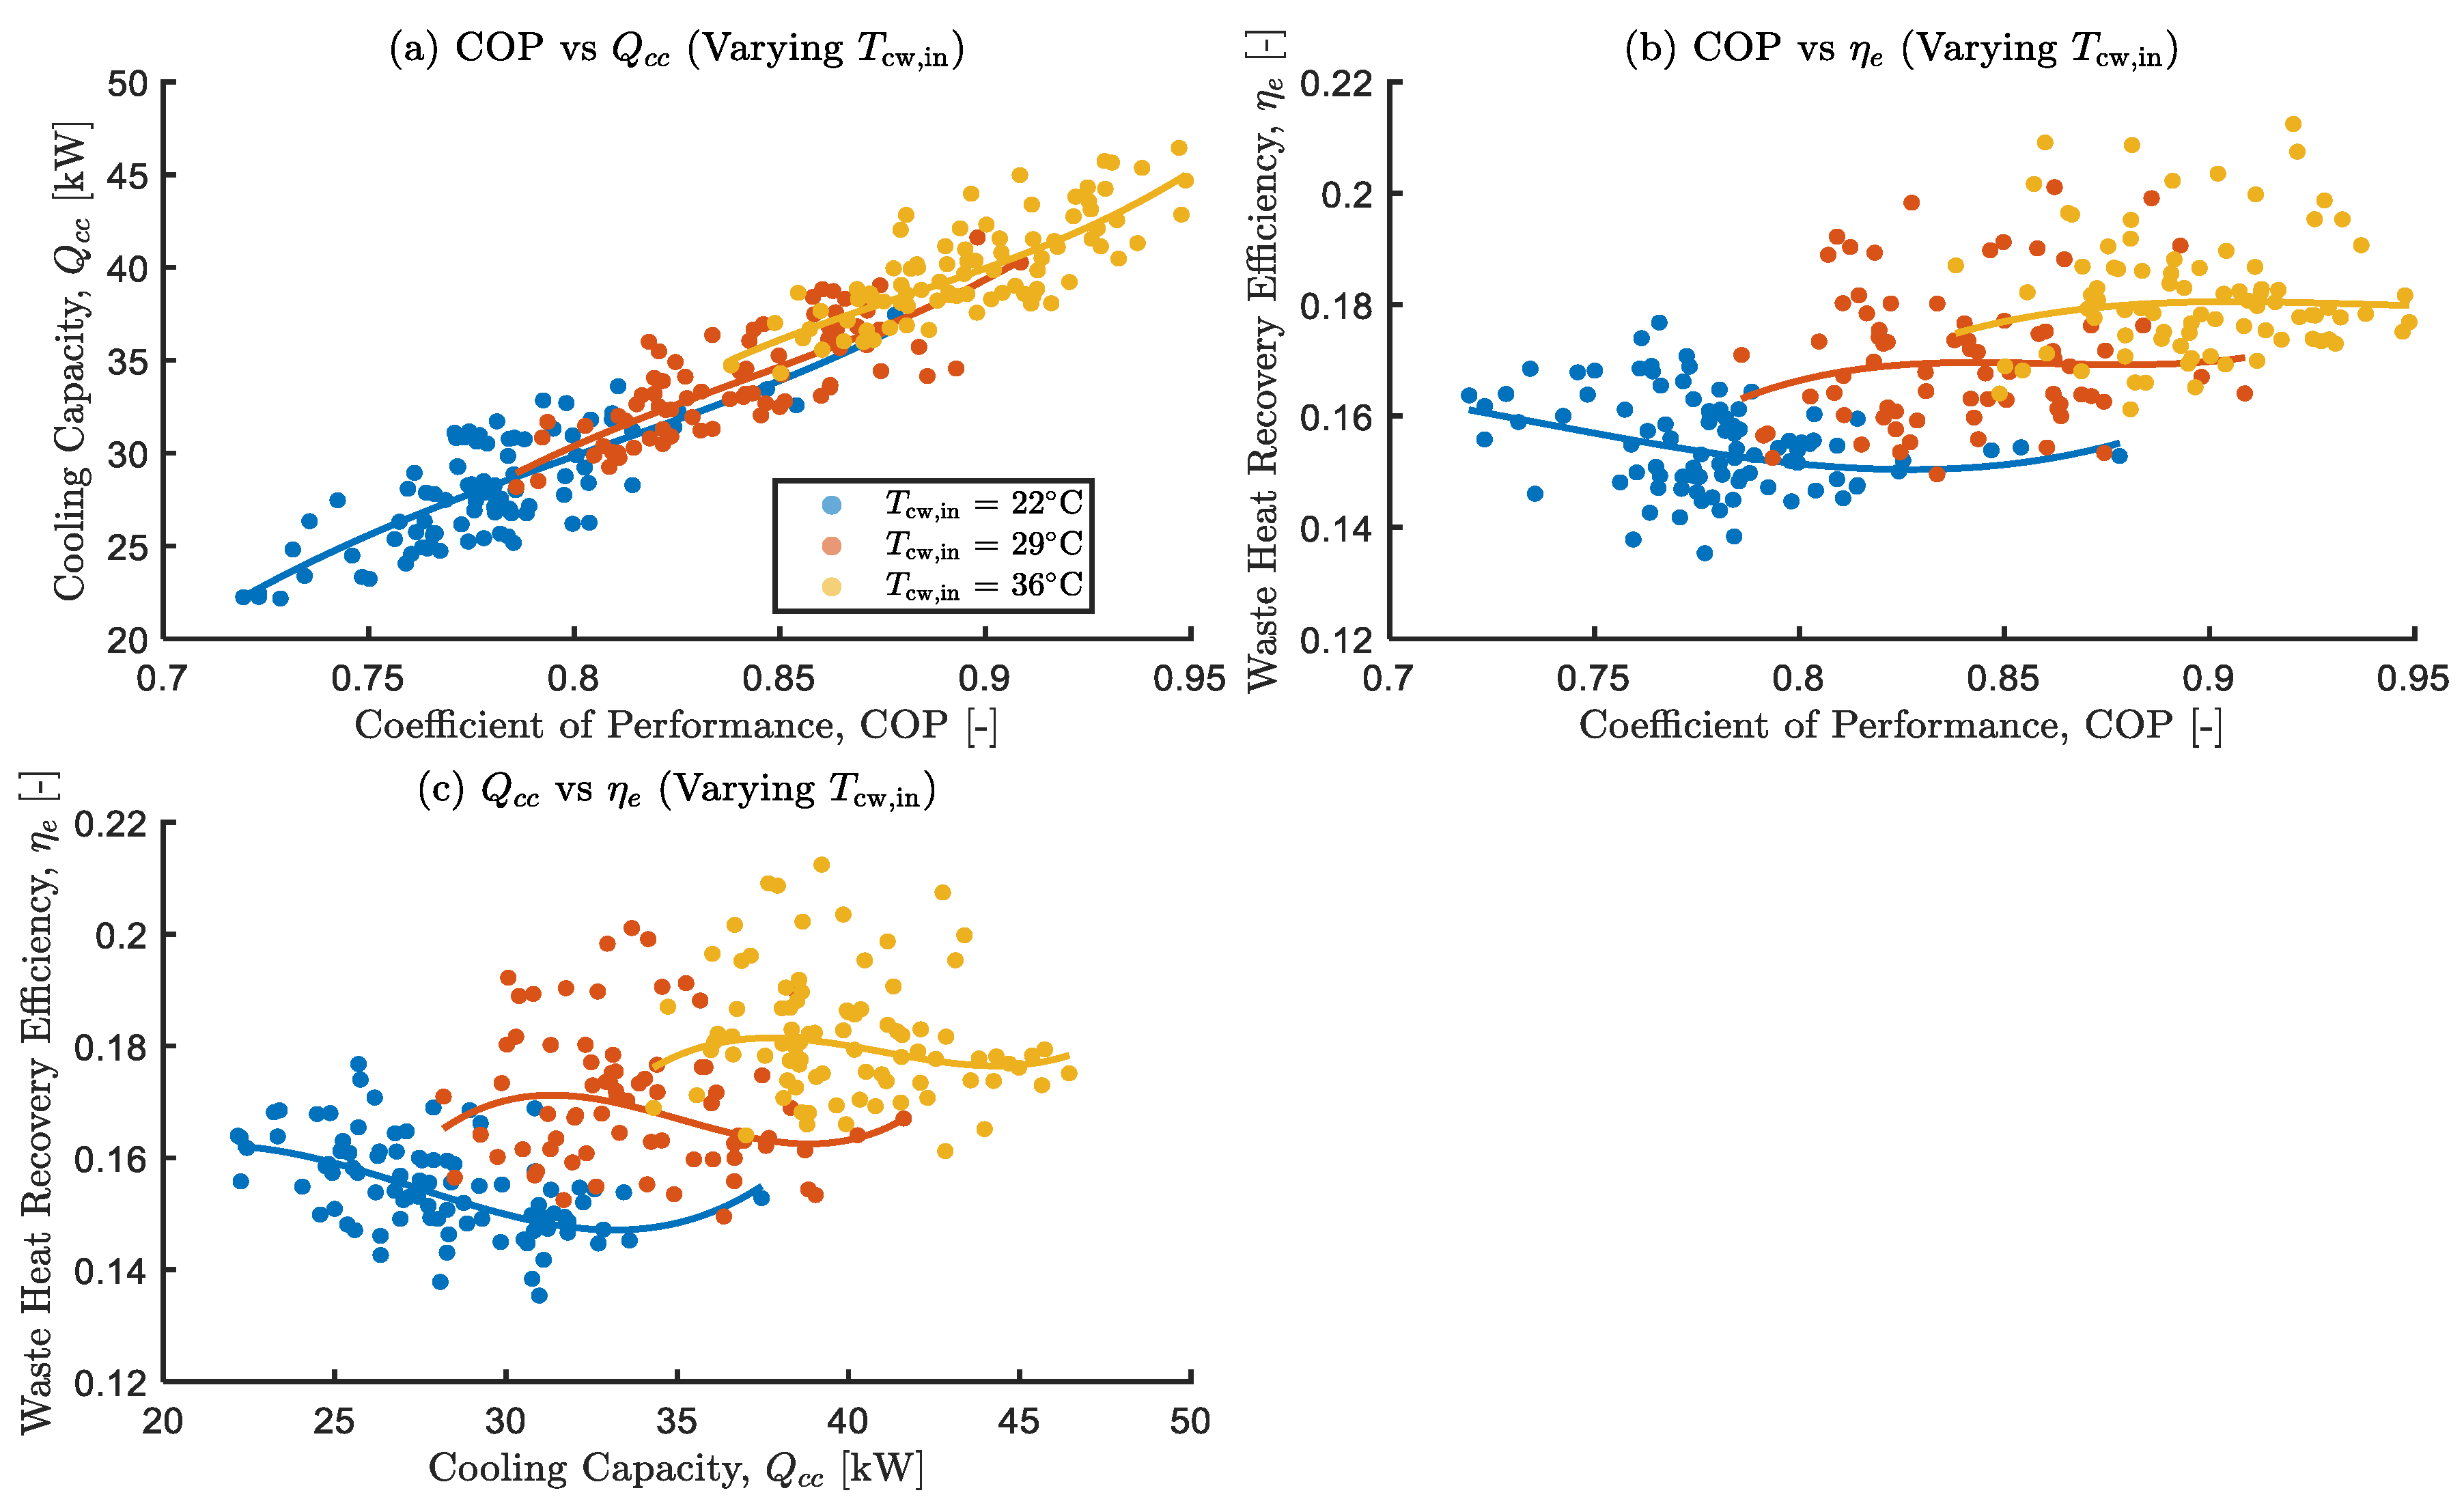
Figure 12.
Effects of varying chilled water inlet temperature on the optimal objective functions.
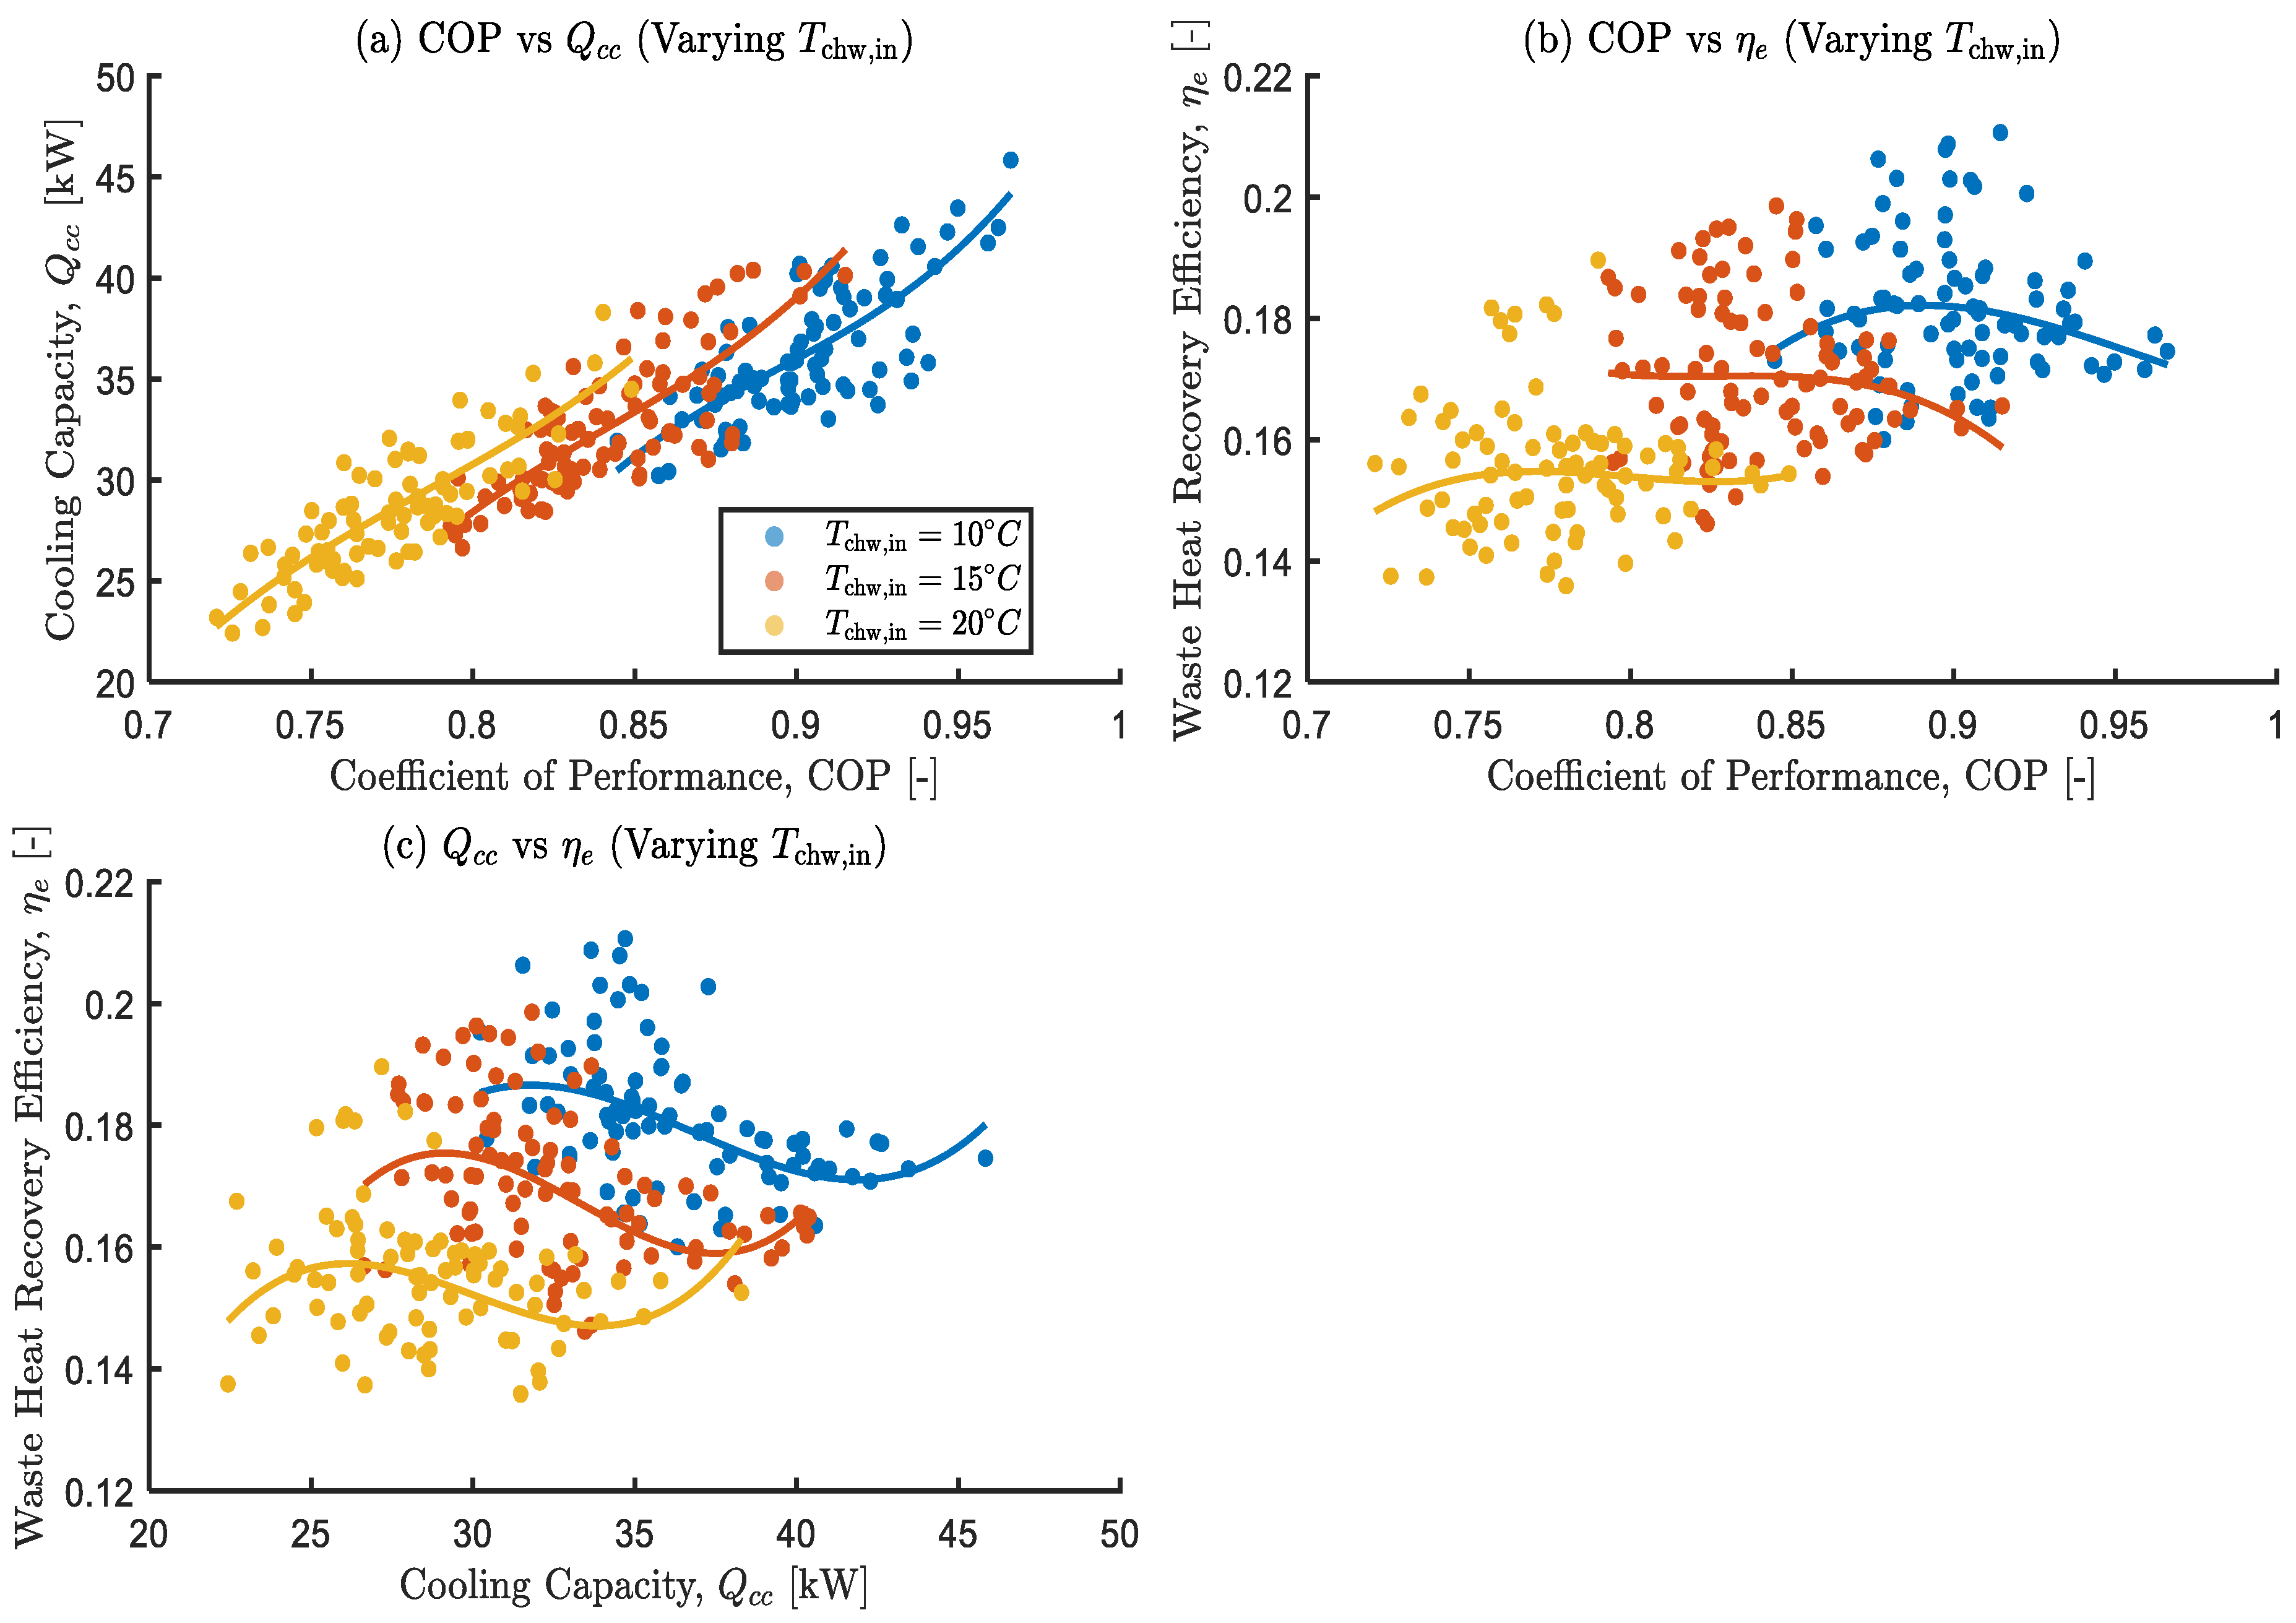
Figure 13.
Effects of varying mass flow rate of cooling water on the optimal objective functions.
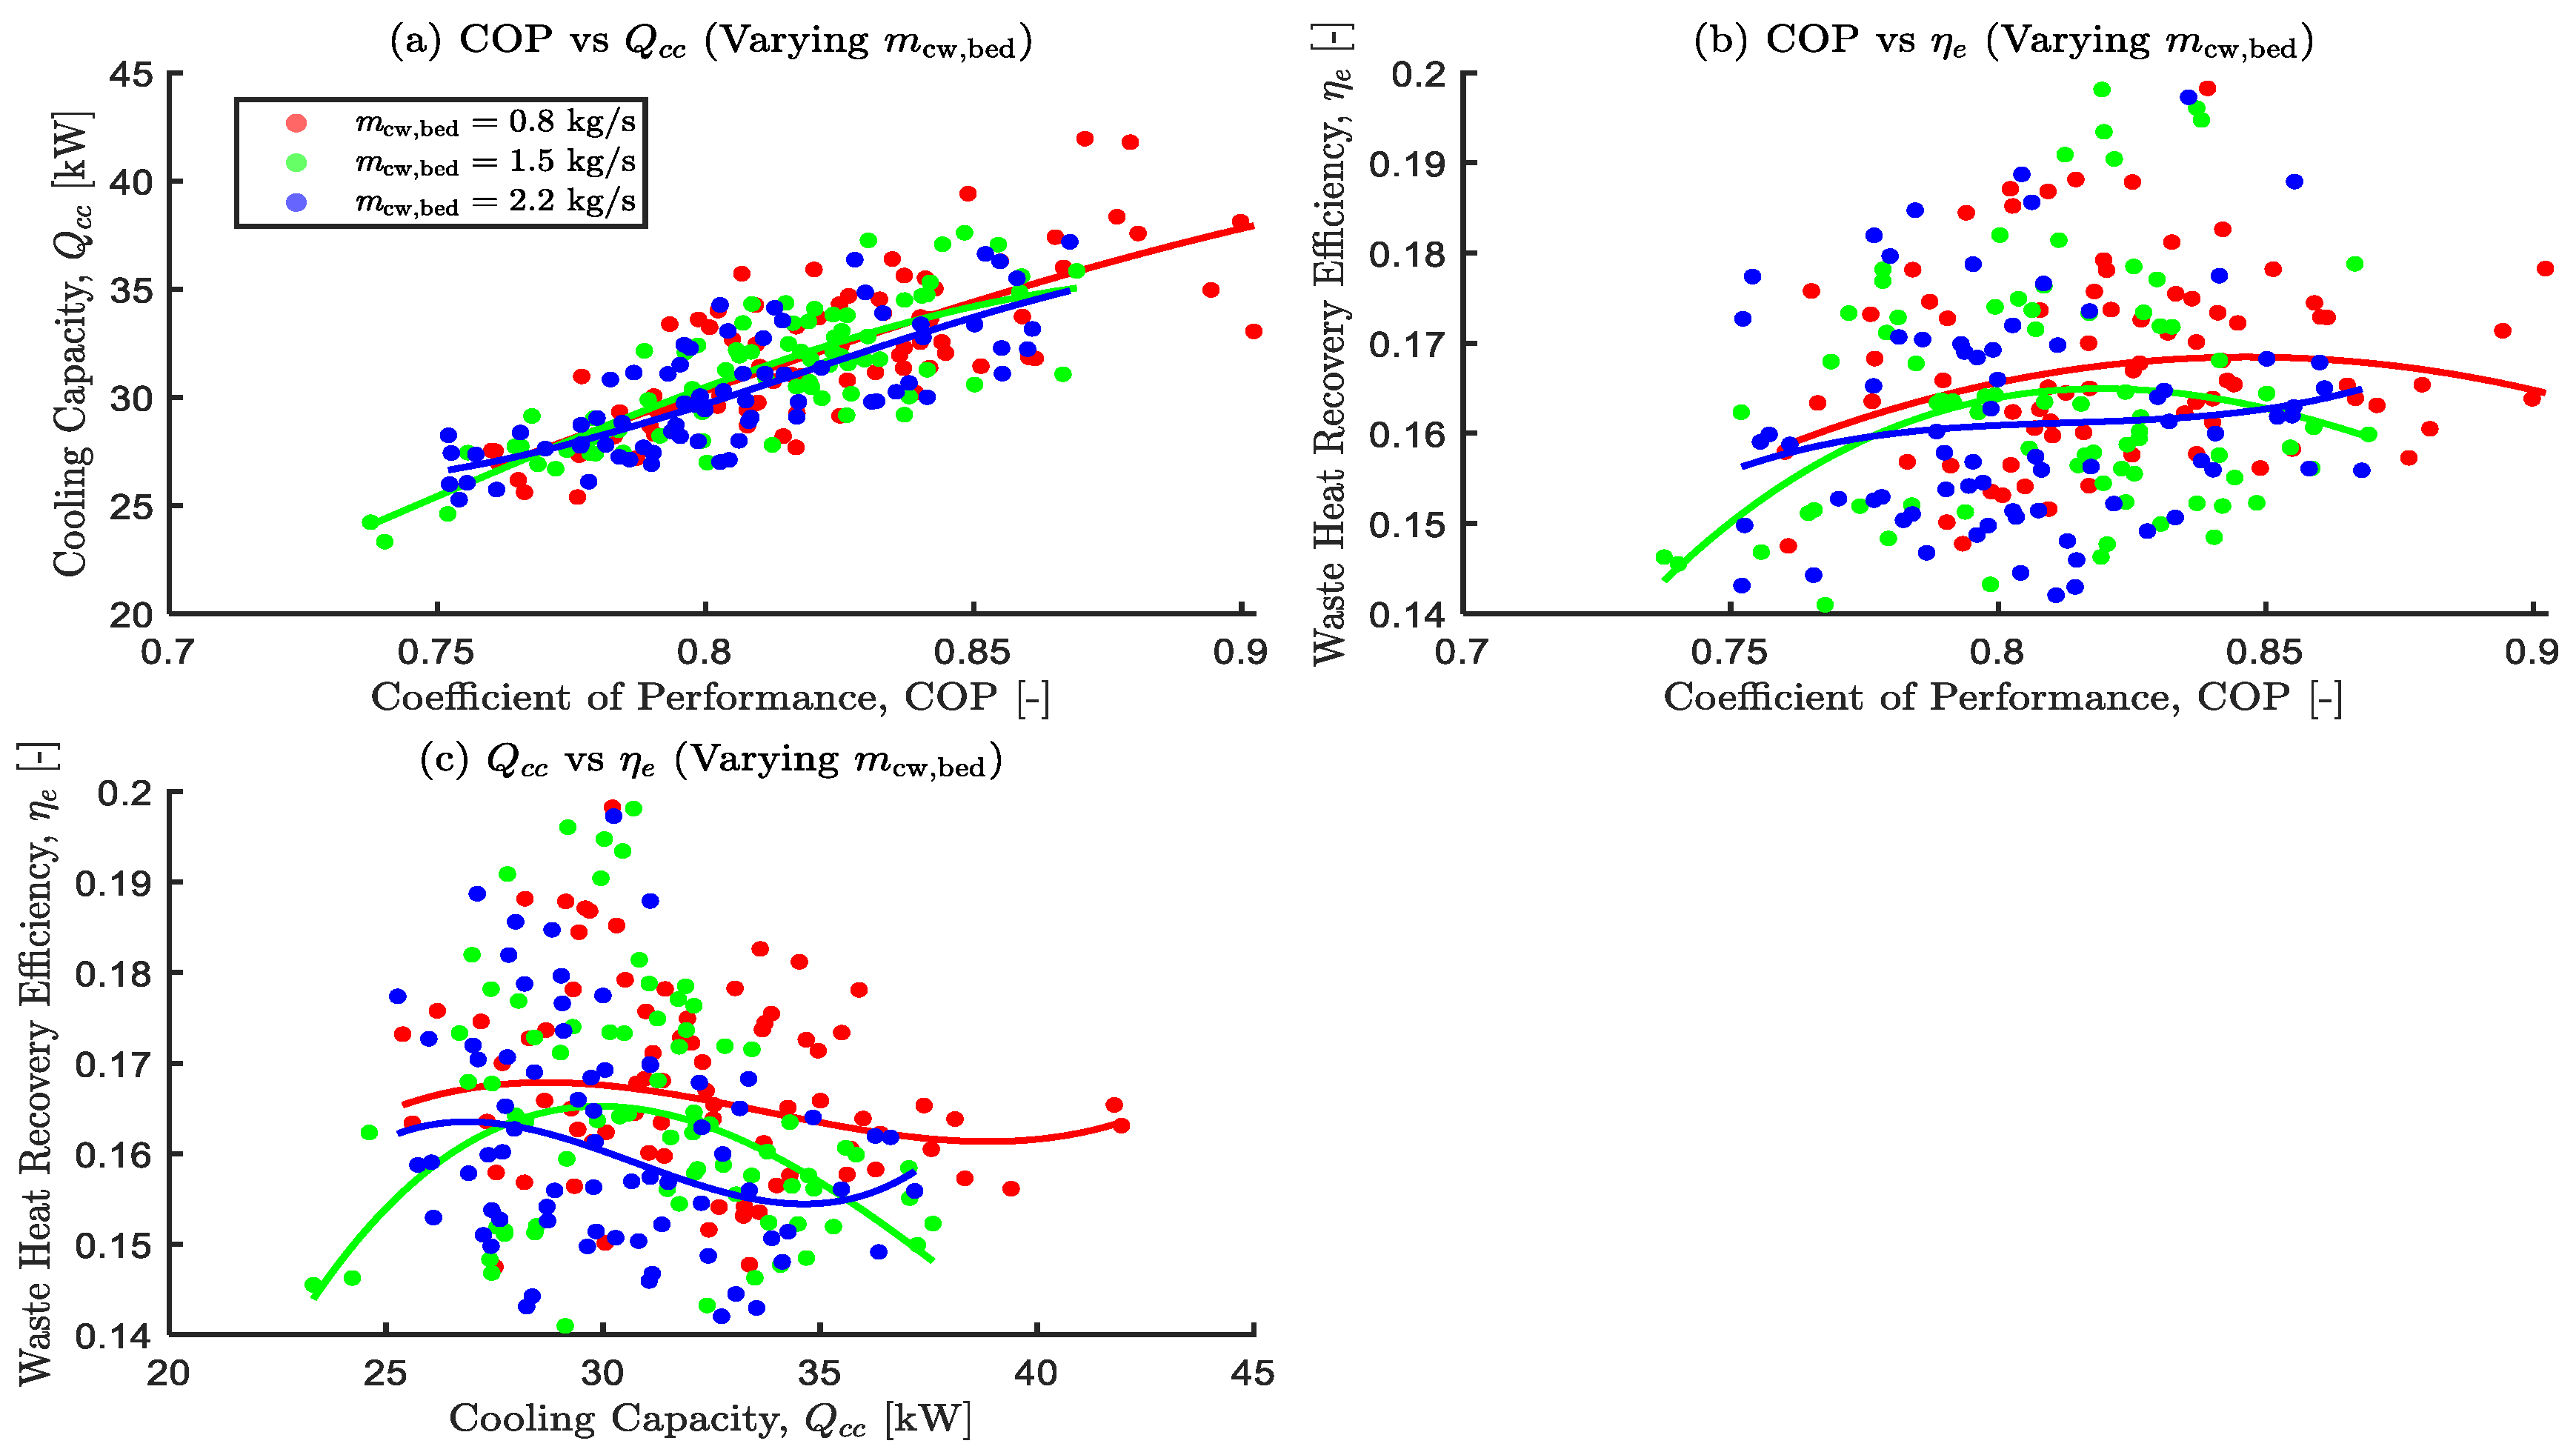
Figure 14.
Effects of varying mass flow rate of hot water on the optimal objective functions.
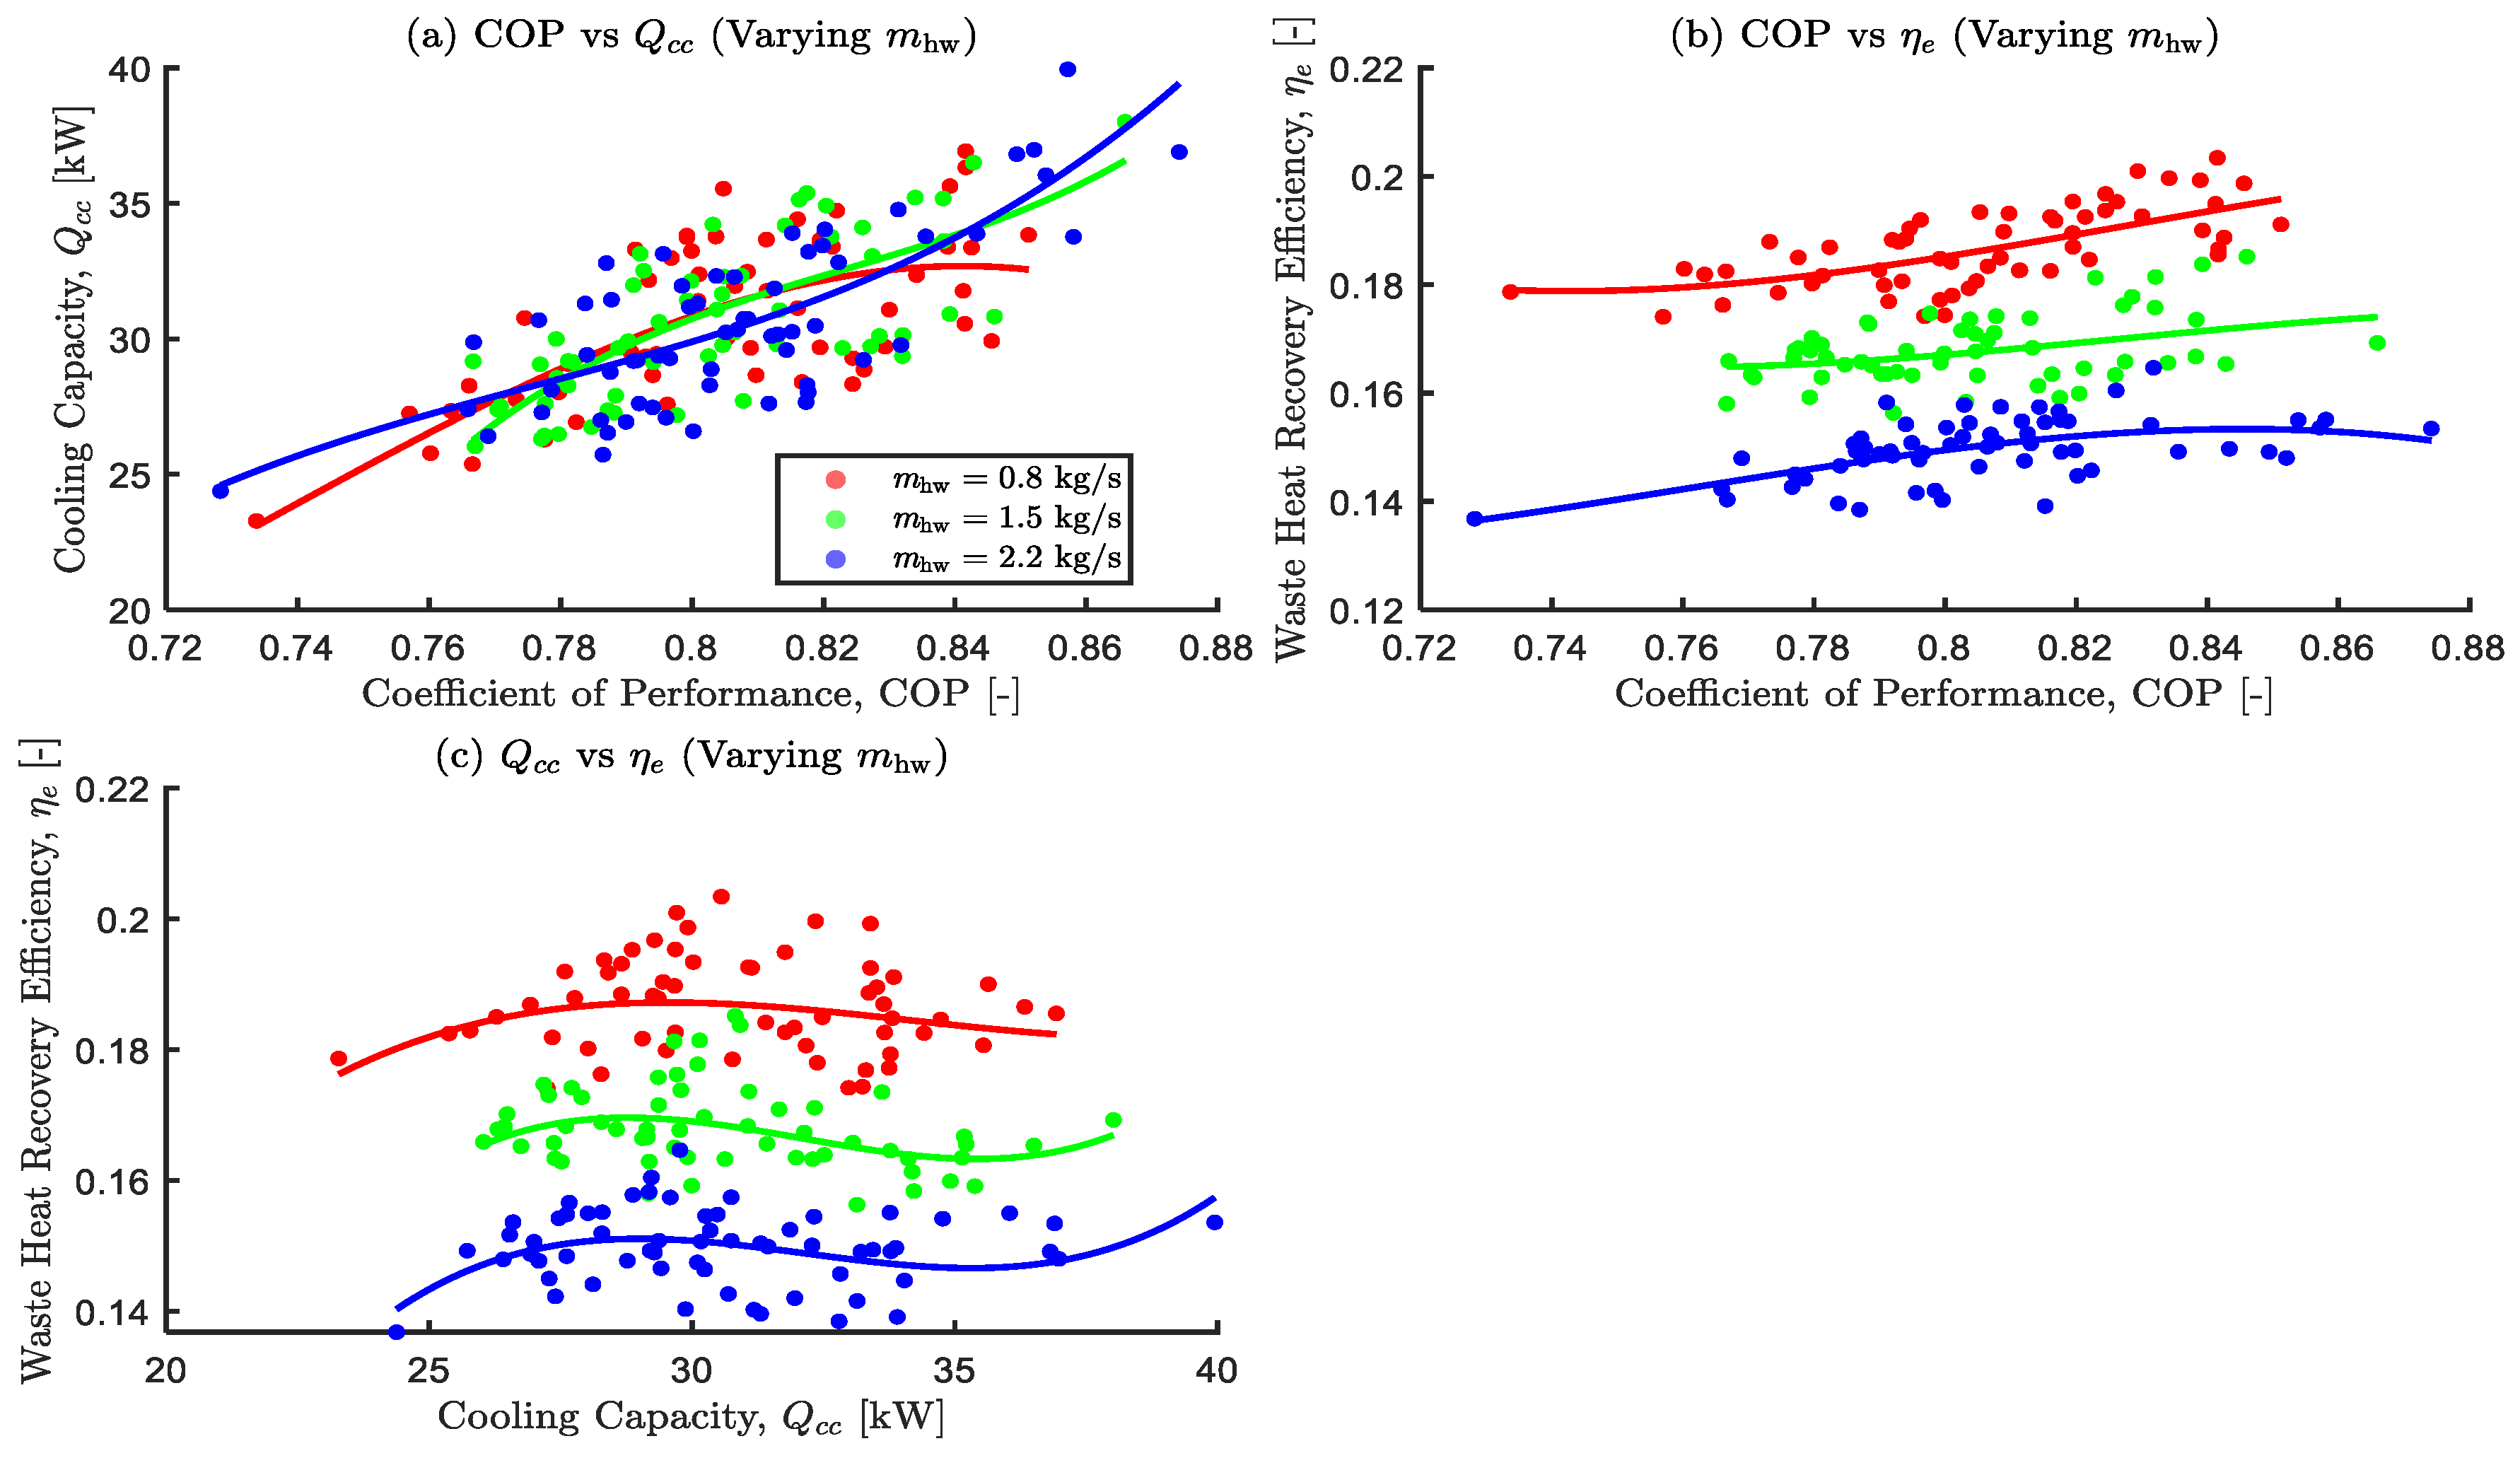
Figure 15.
Effects of varying chilled water mass flow rate on the optimal objective functions.
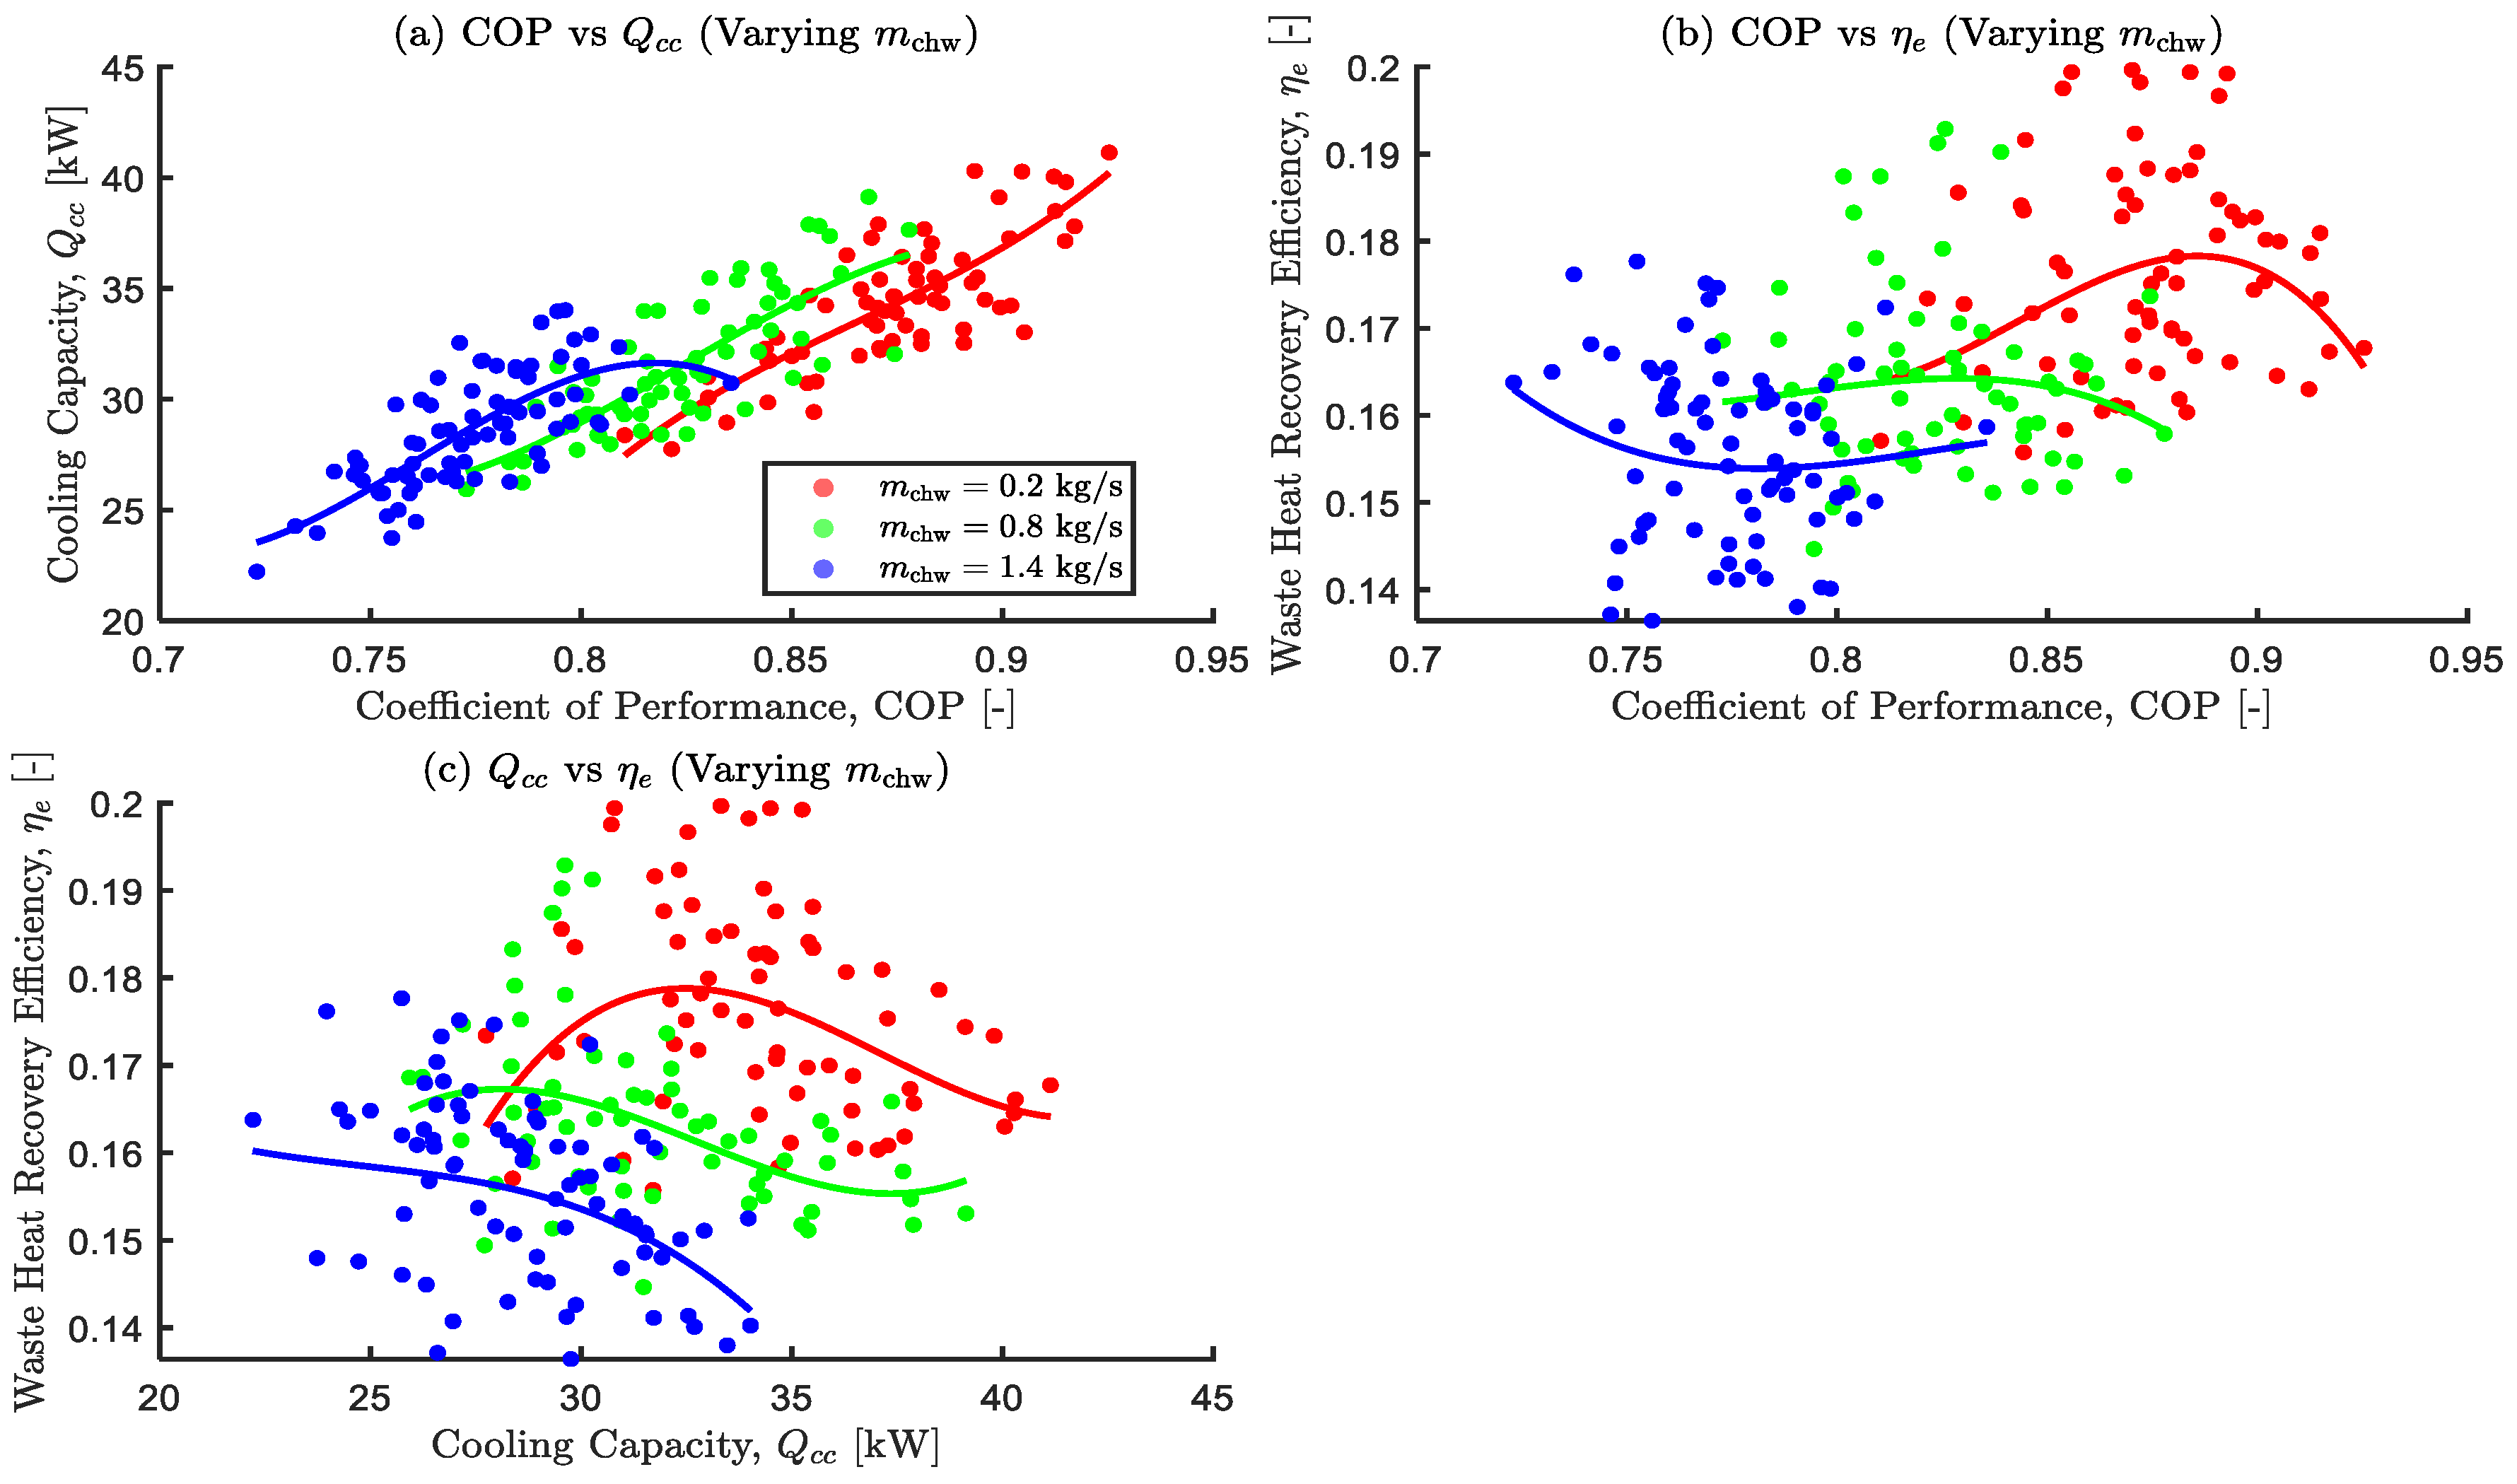
Figure 16.
Effects of varying condenser cooling water mass flow rate on the optimal objective functions.
Figure 16.
Effects of varying condenser cooling water mass flow rate on the optimal objective functions.
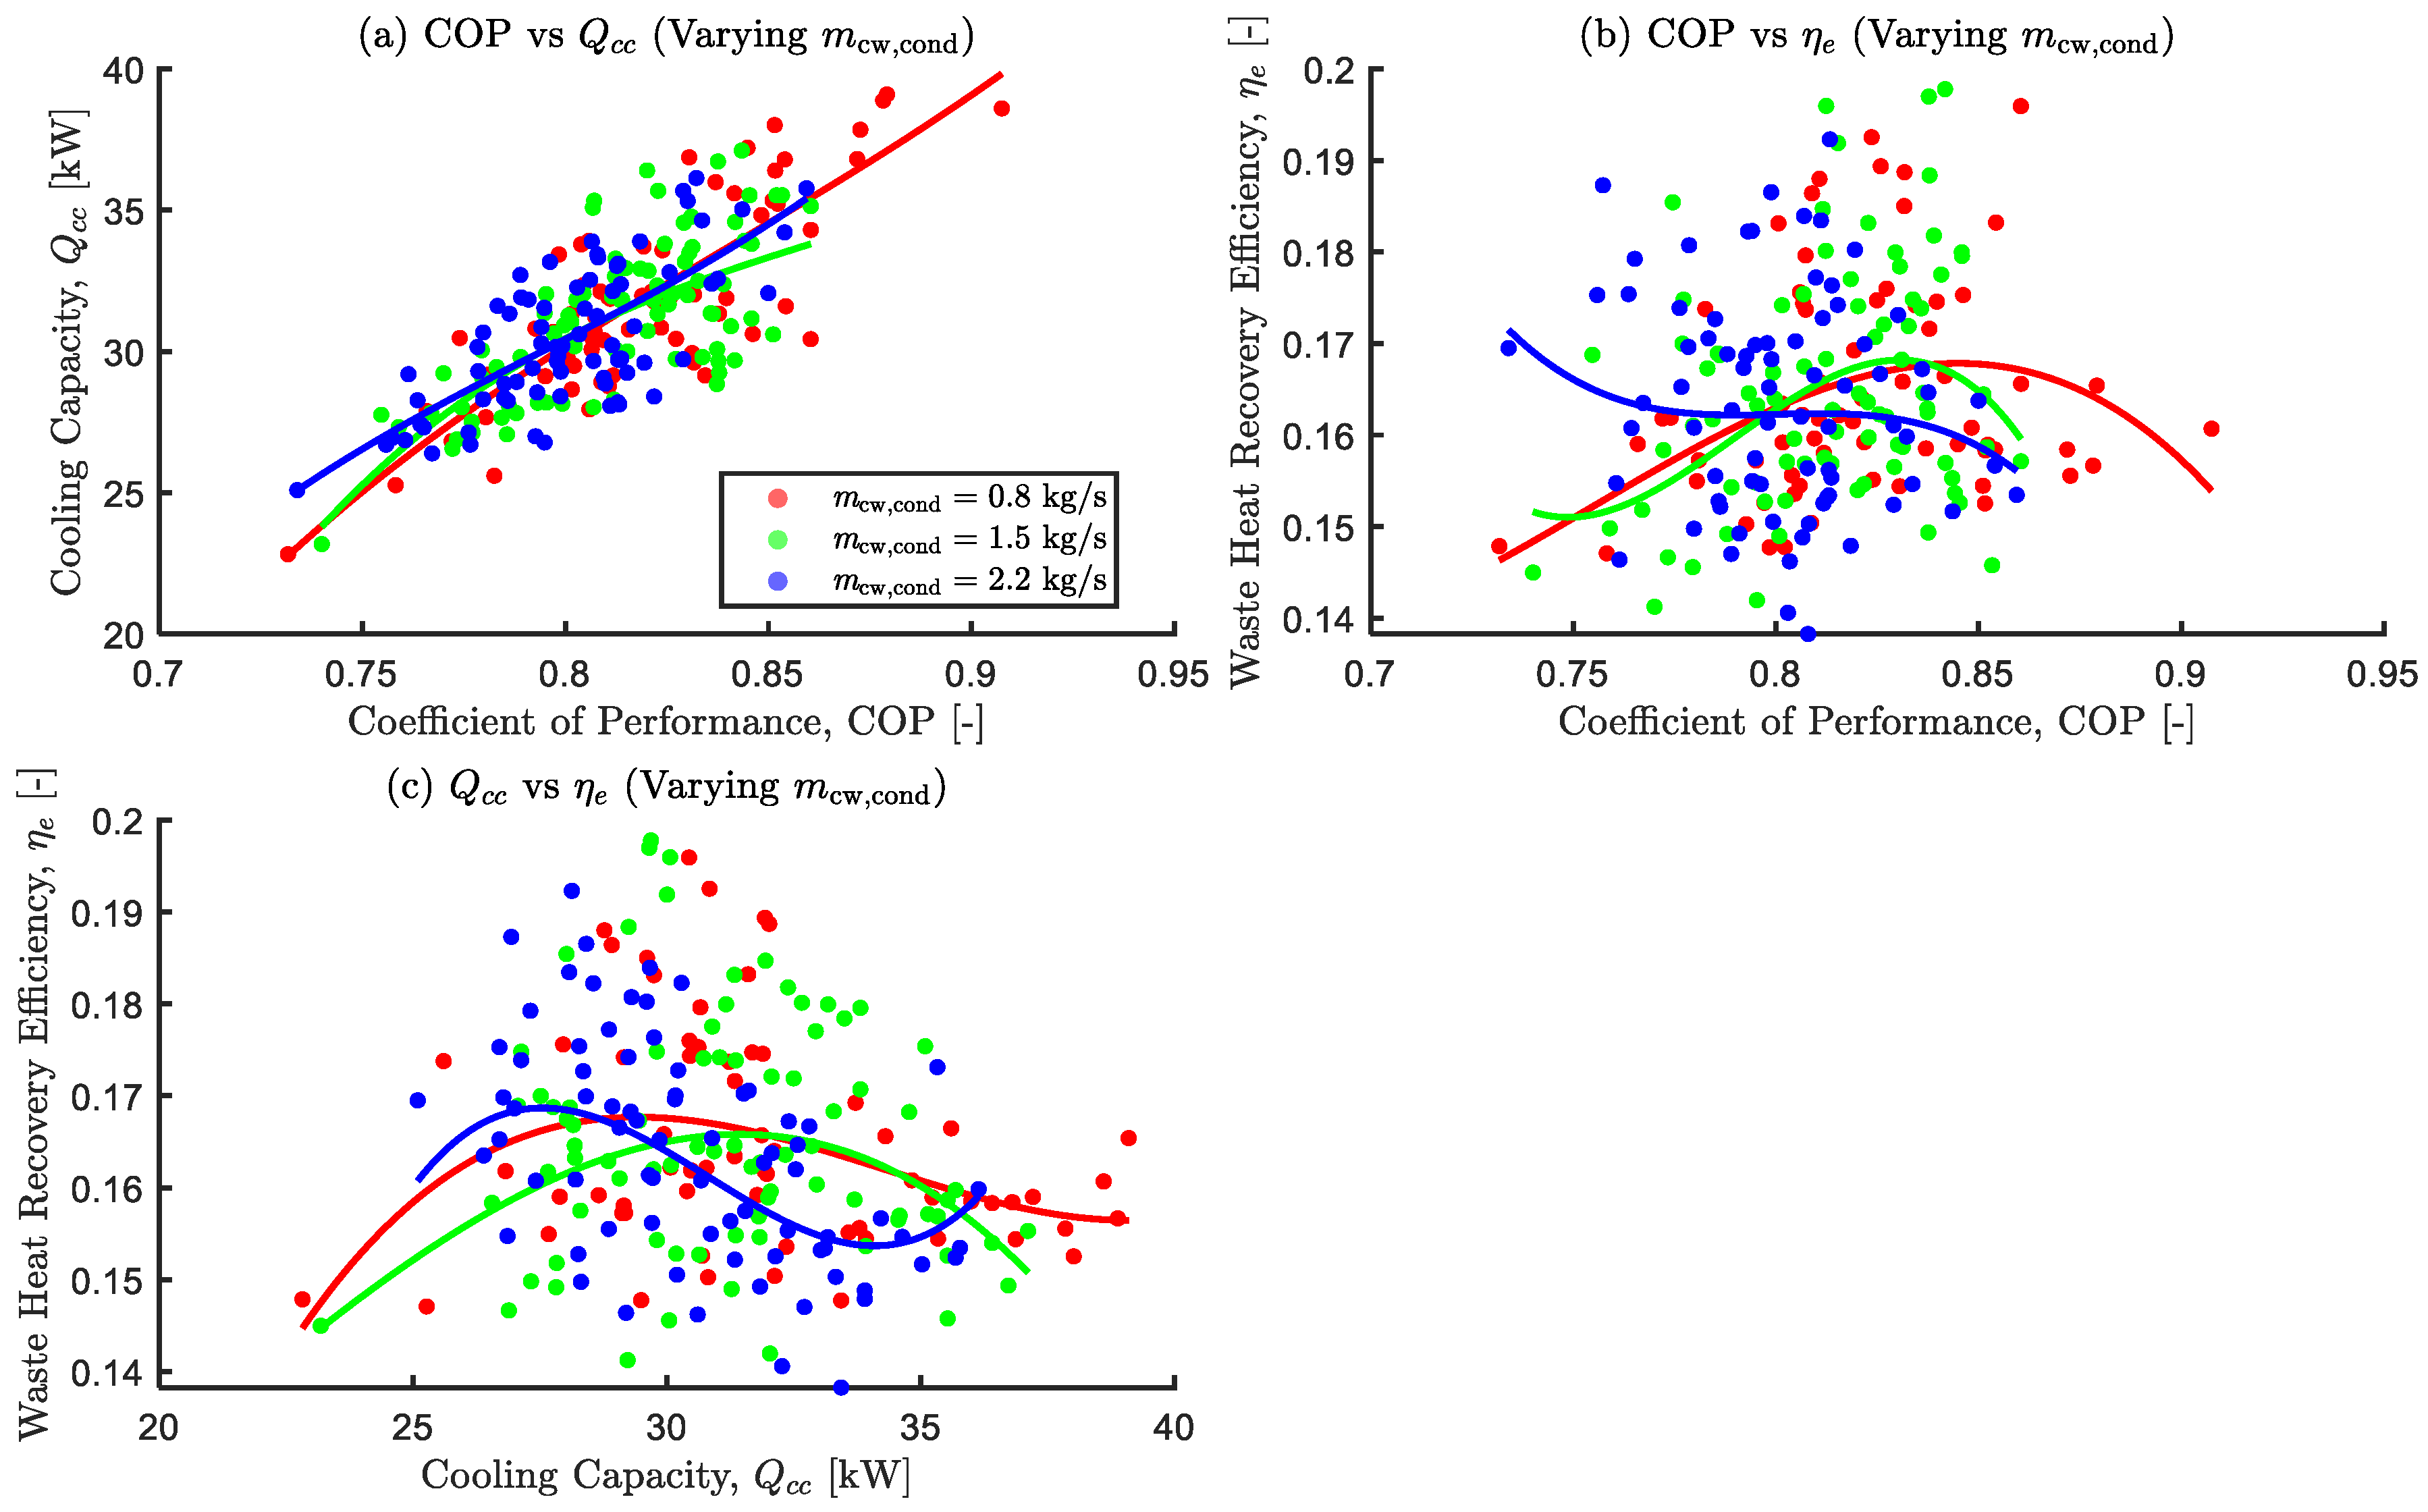
Figure 17.
Effects of varying adsorbent bed overall thermal conductance on the optimal objective functions.
Figure 17.
Effects of varying adsorbent bed overall thermal conductance on the optimal objective functions.
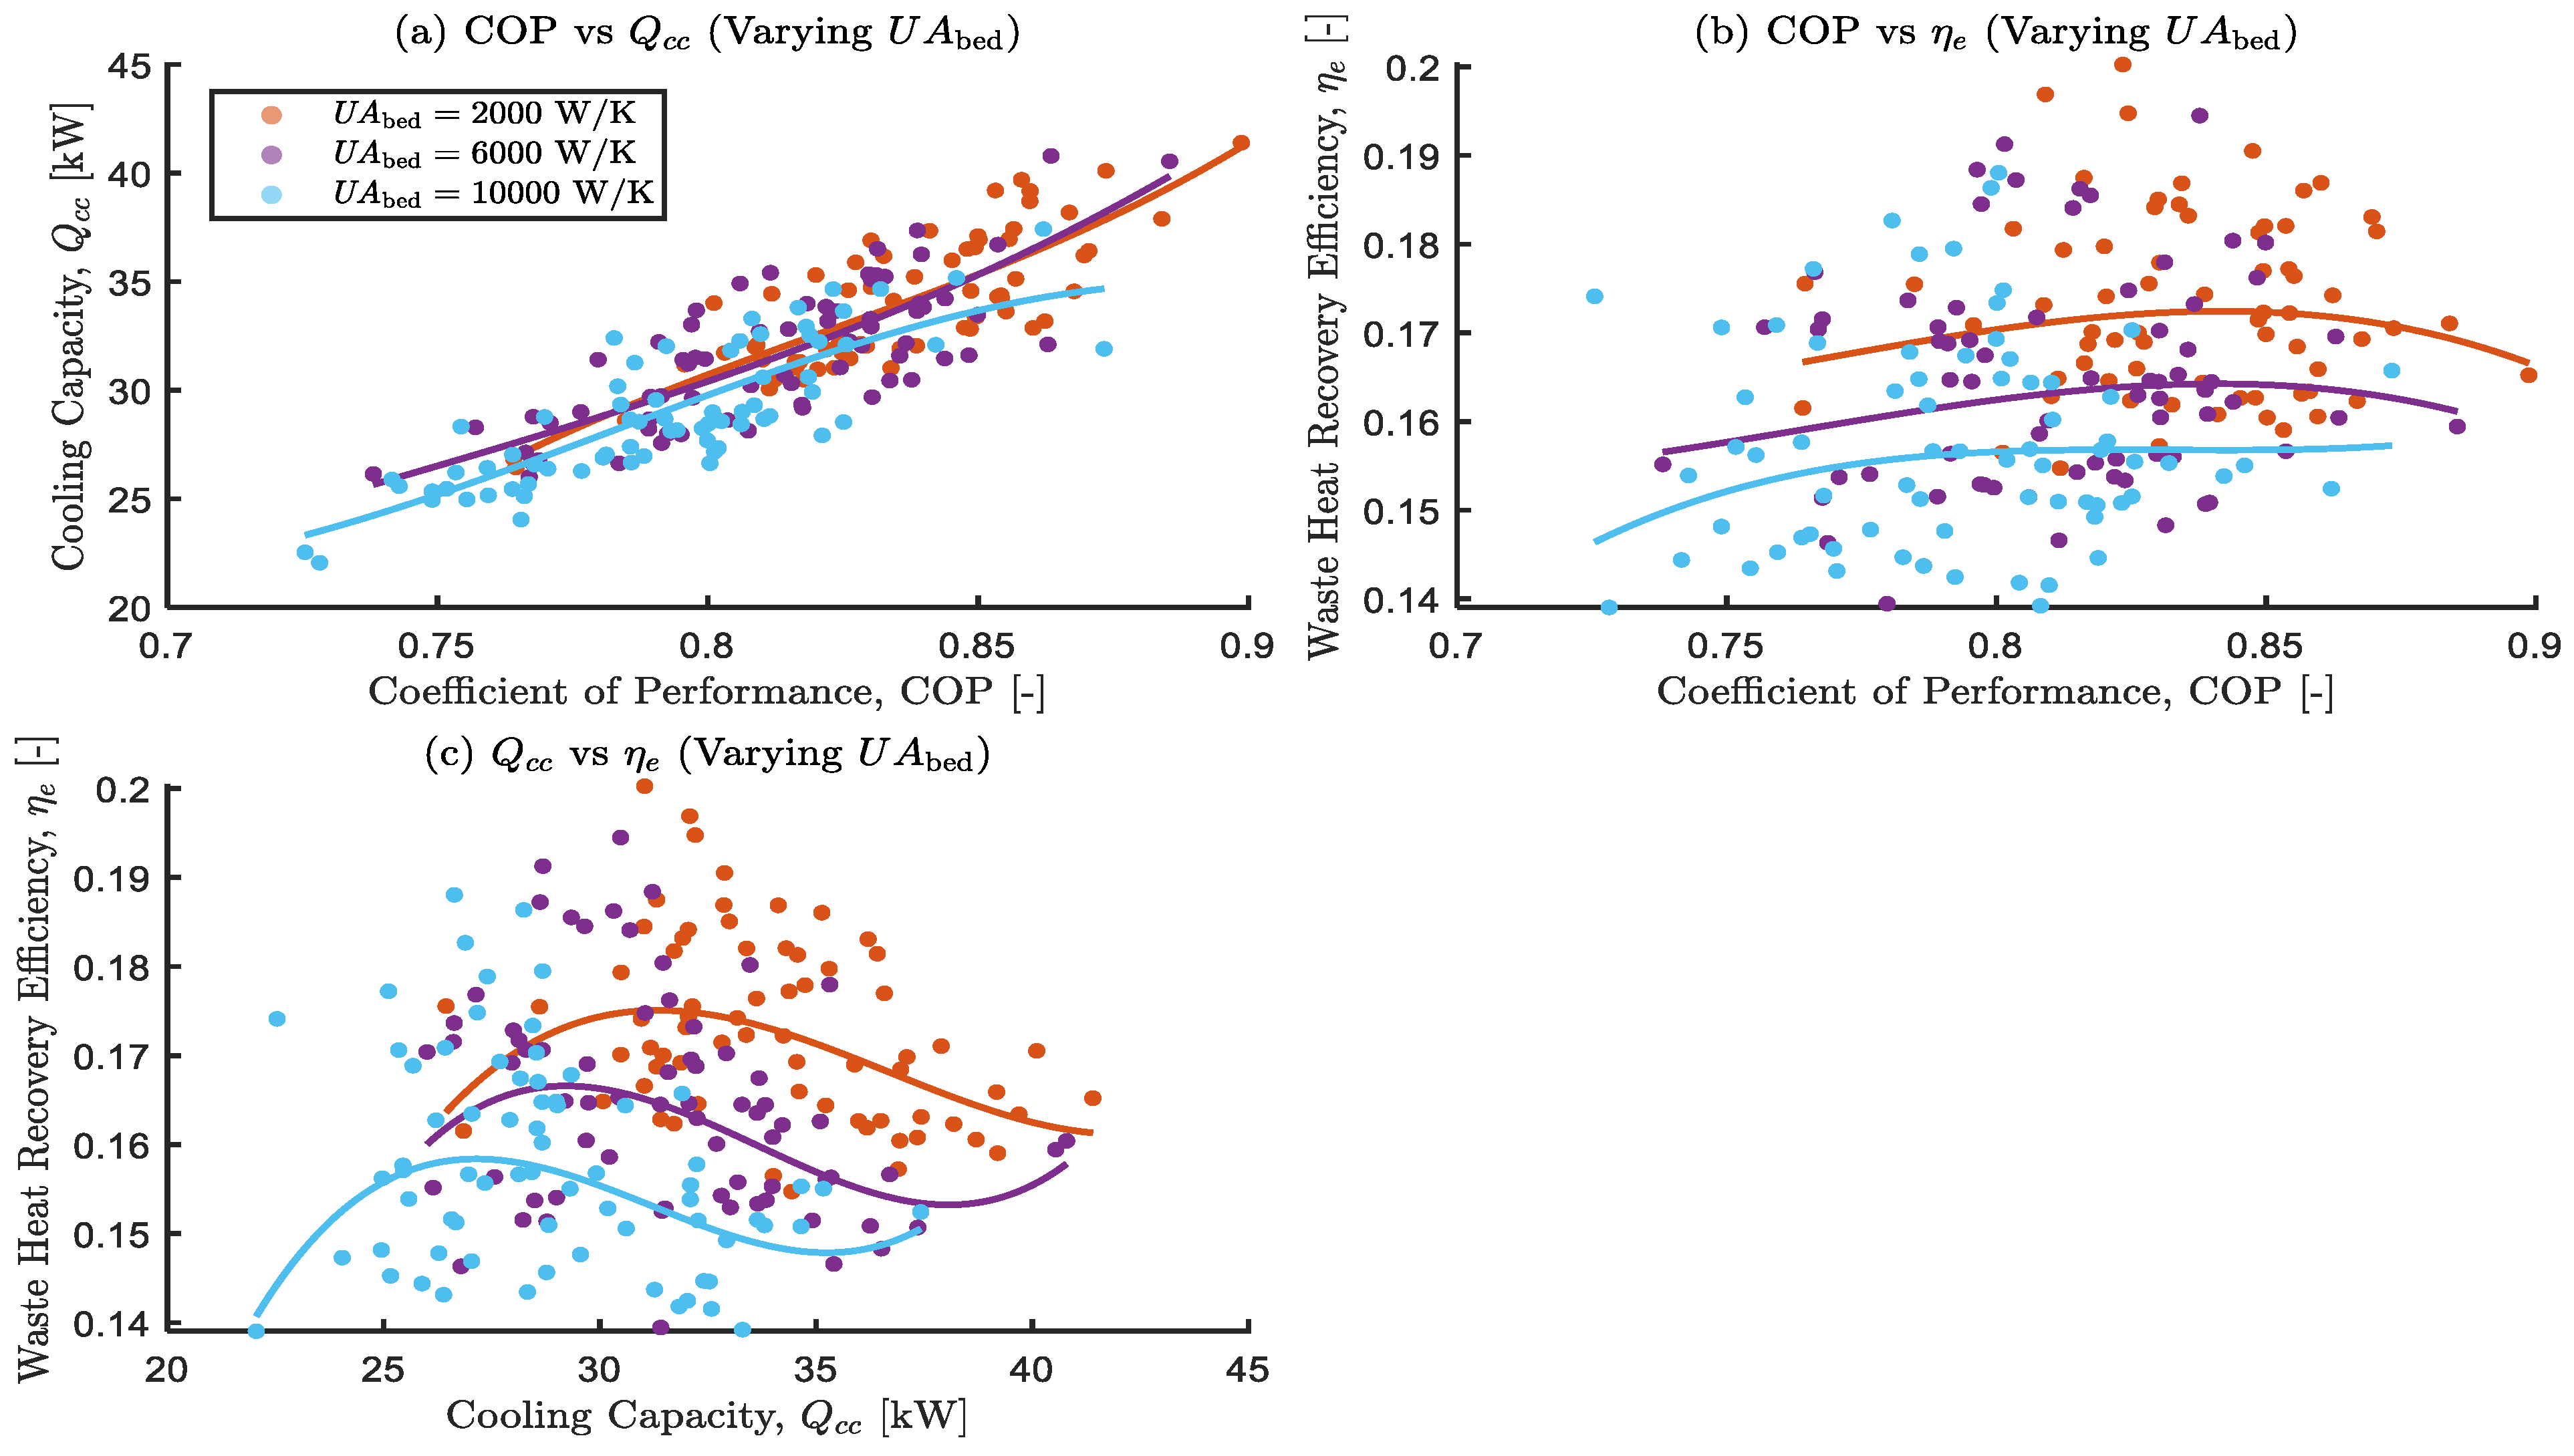
Figure 18.
Effects of varying evaporator overall thermal conductance on the optimal objective functions.
Figure 18.
Effects of varying evaporator overall thermal conductance on the optimal objective functions.
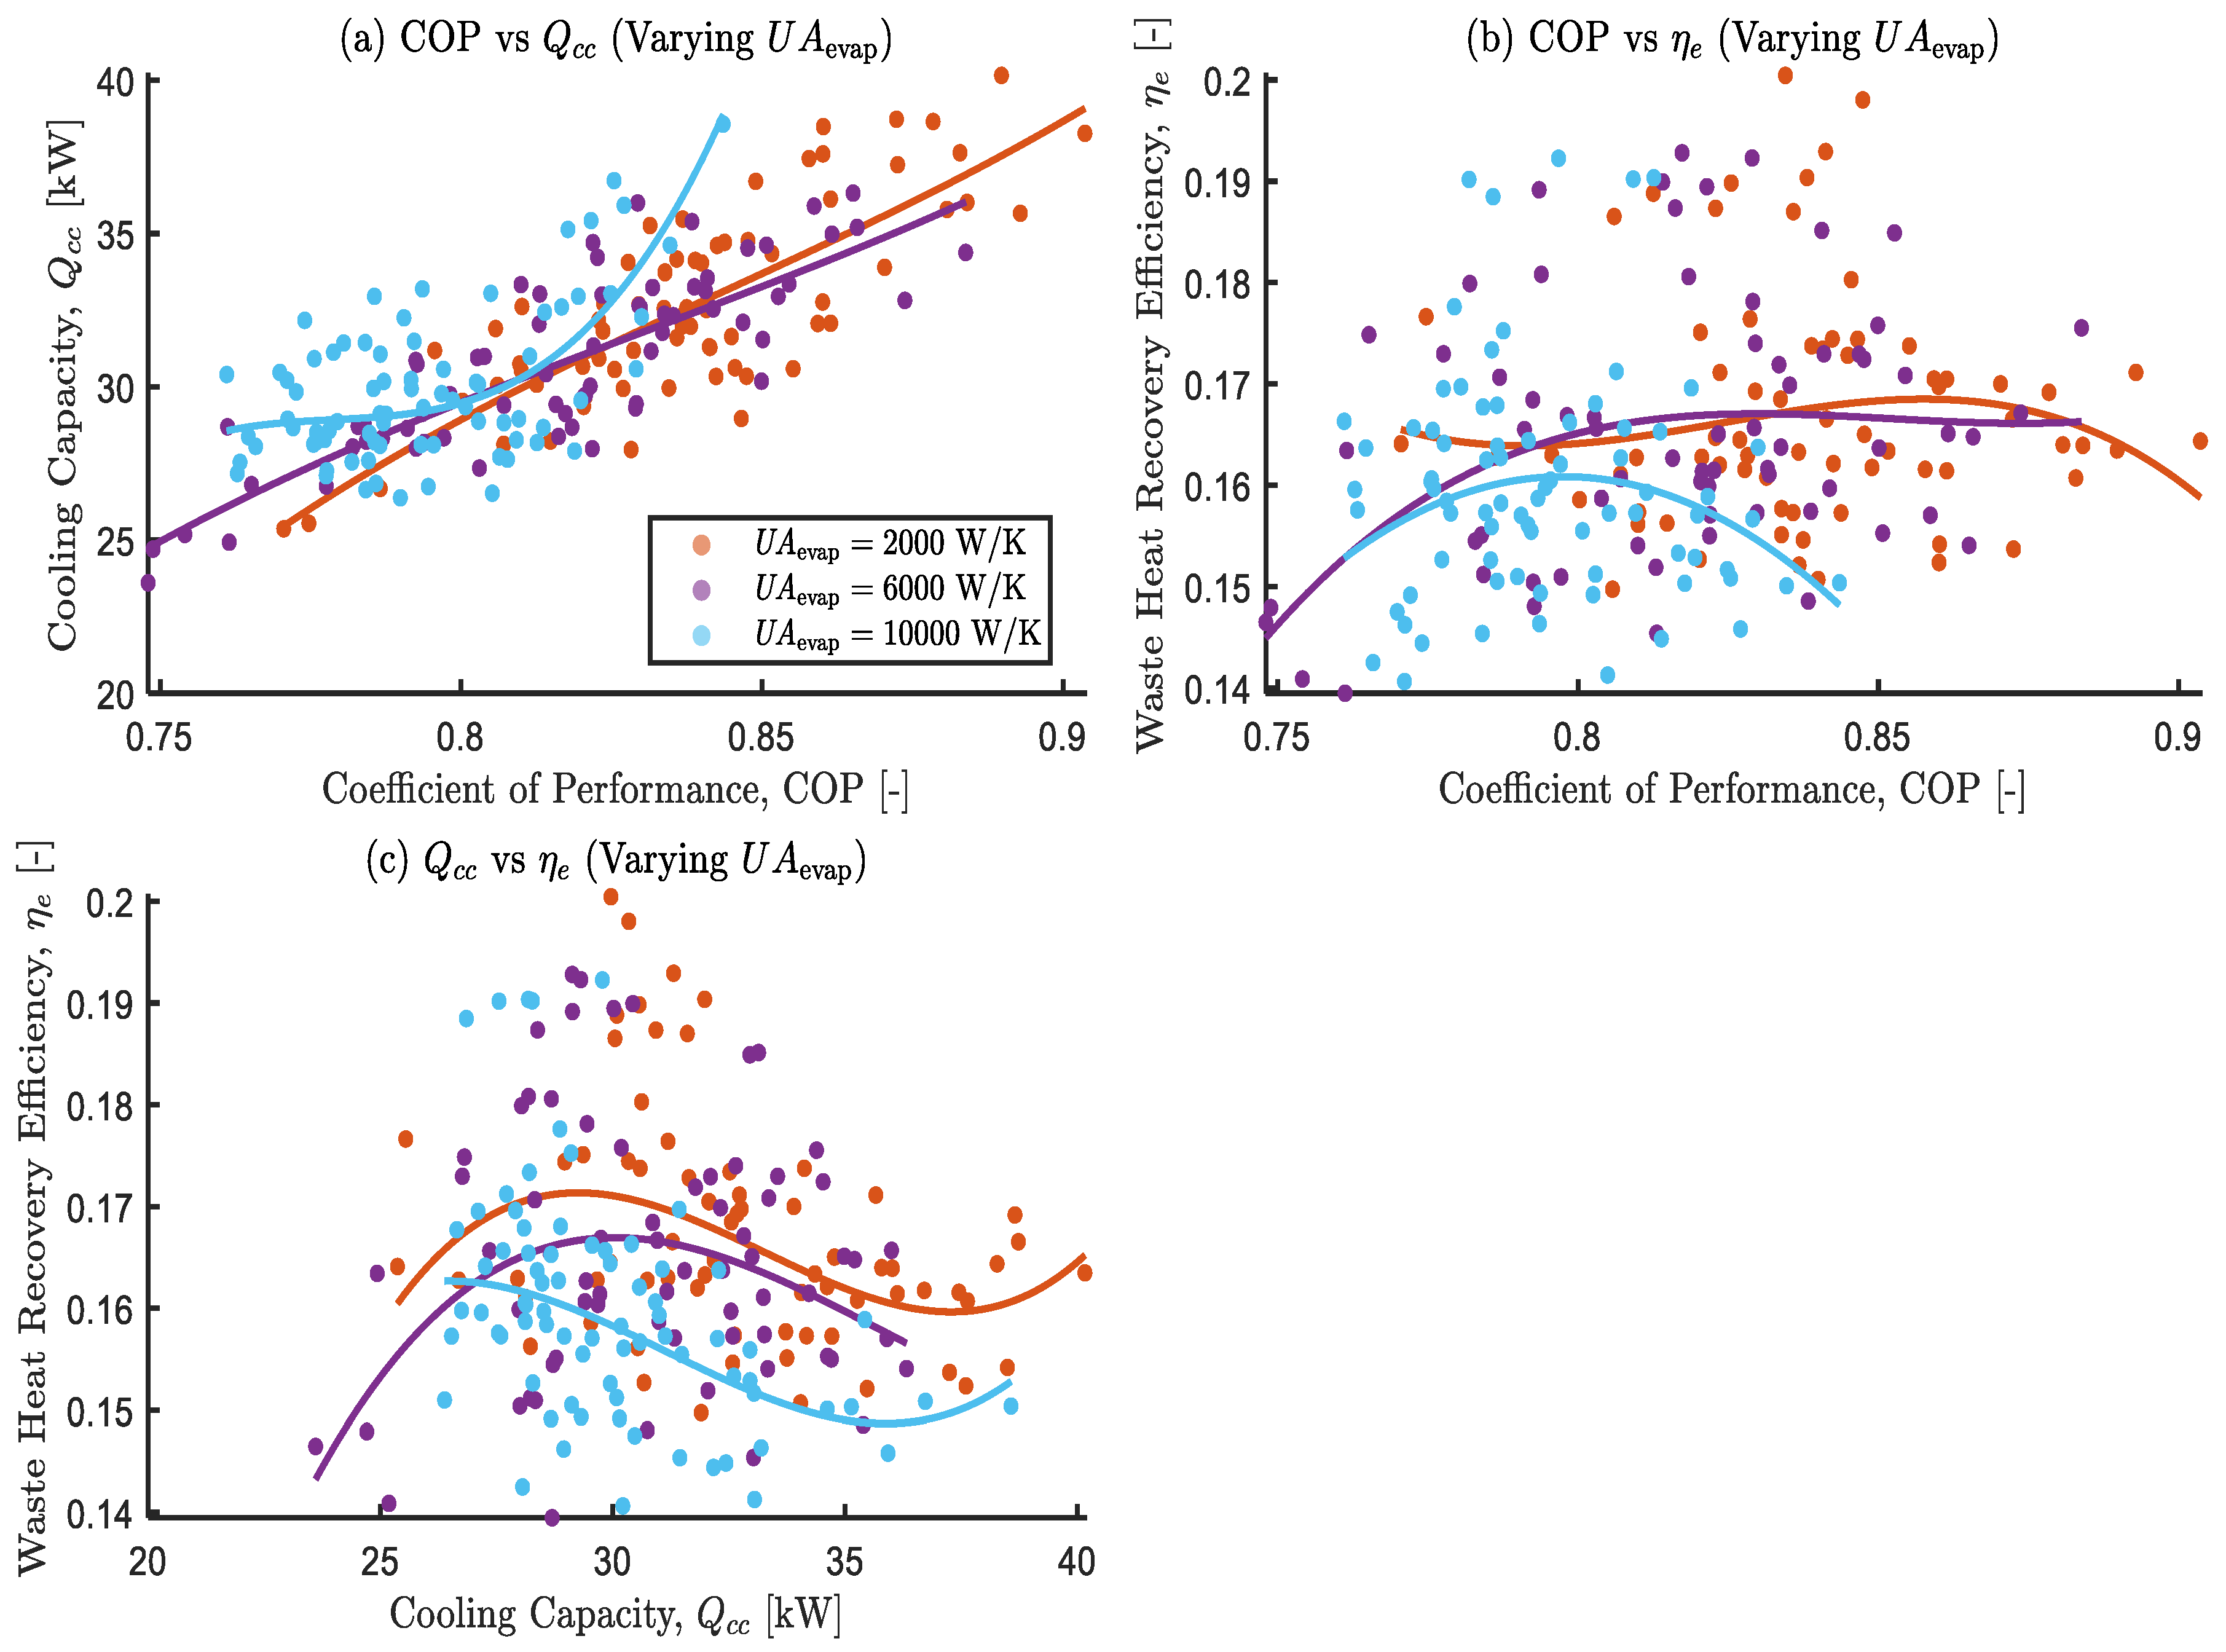
Figure 19.
Effects of varying condenser overall thermal conductance on the optimal objective functions.
Figure 19.
Effects of varying condenser overall thermal conductance on the optimal objective functions.
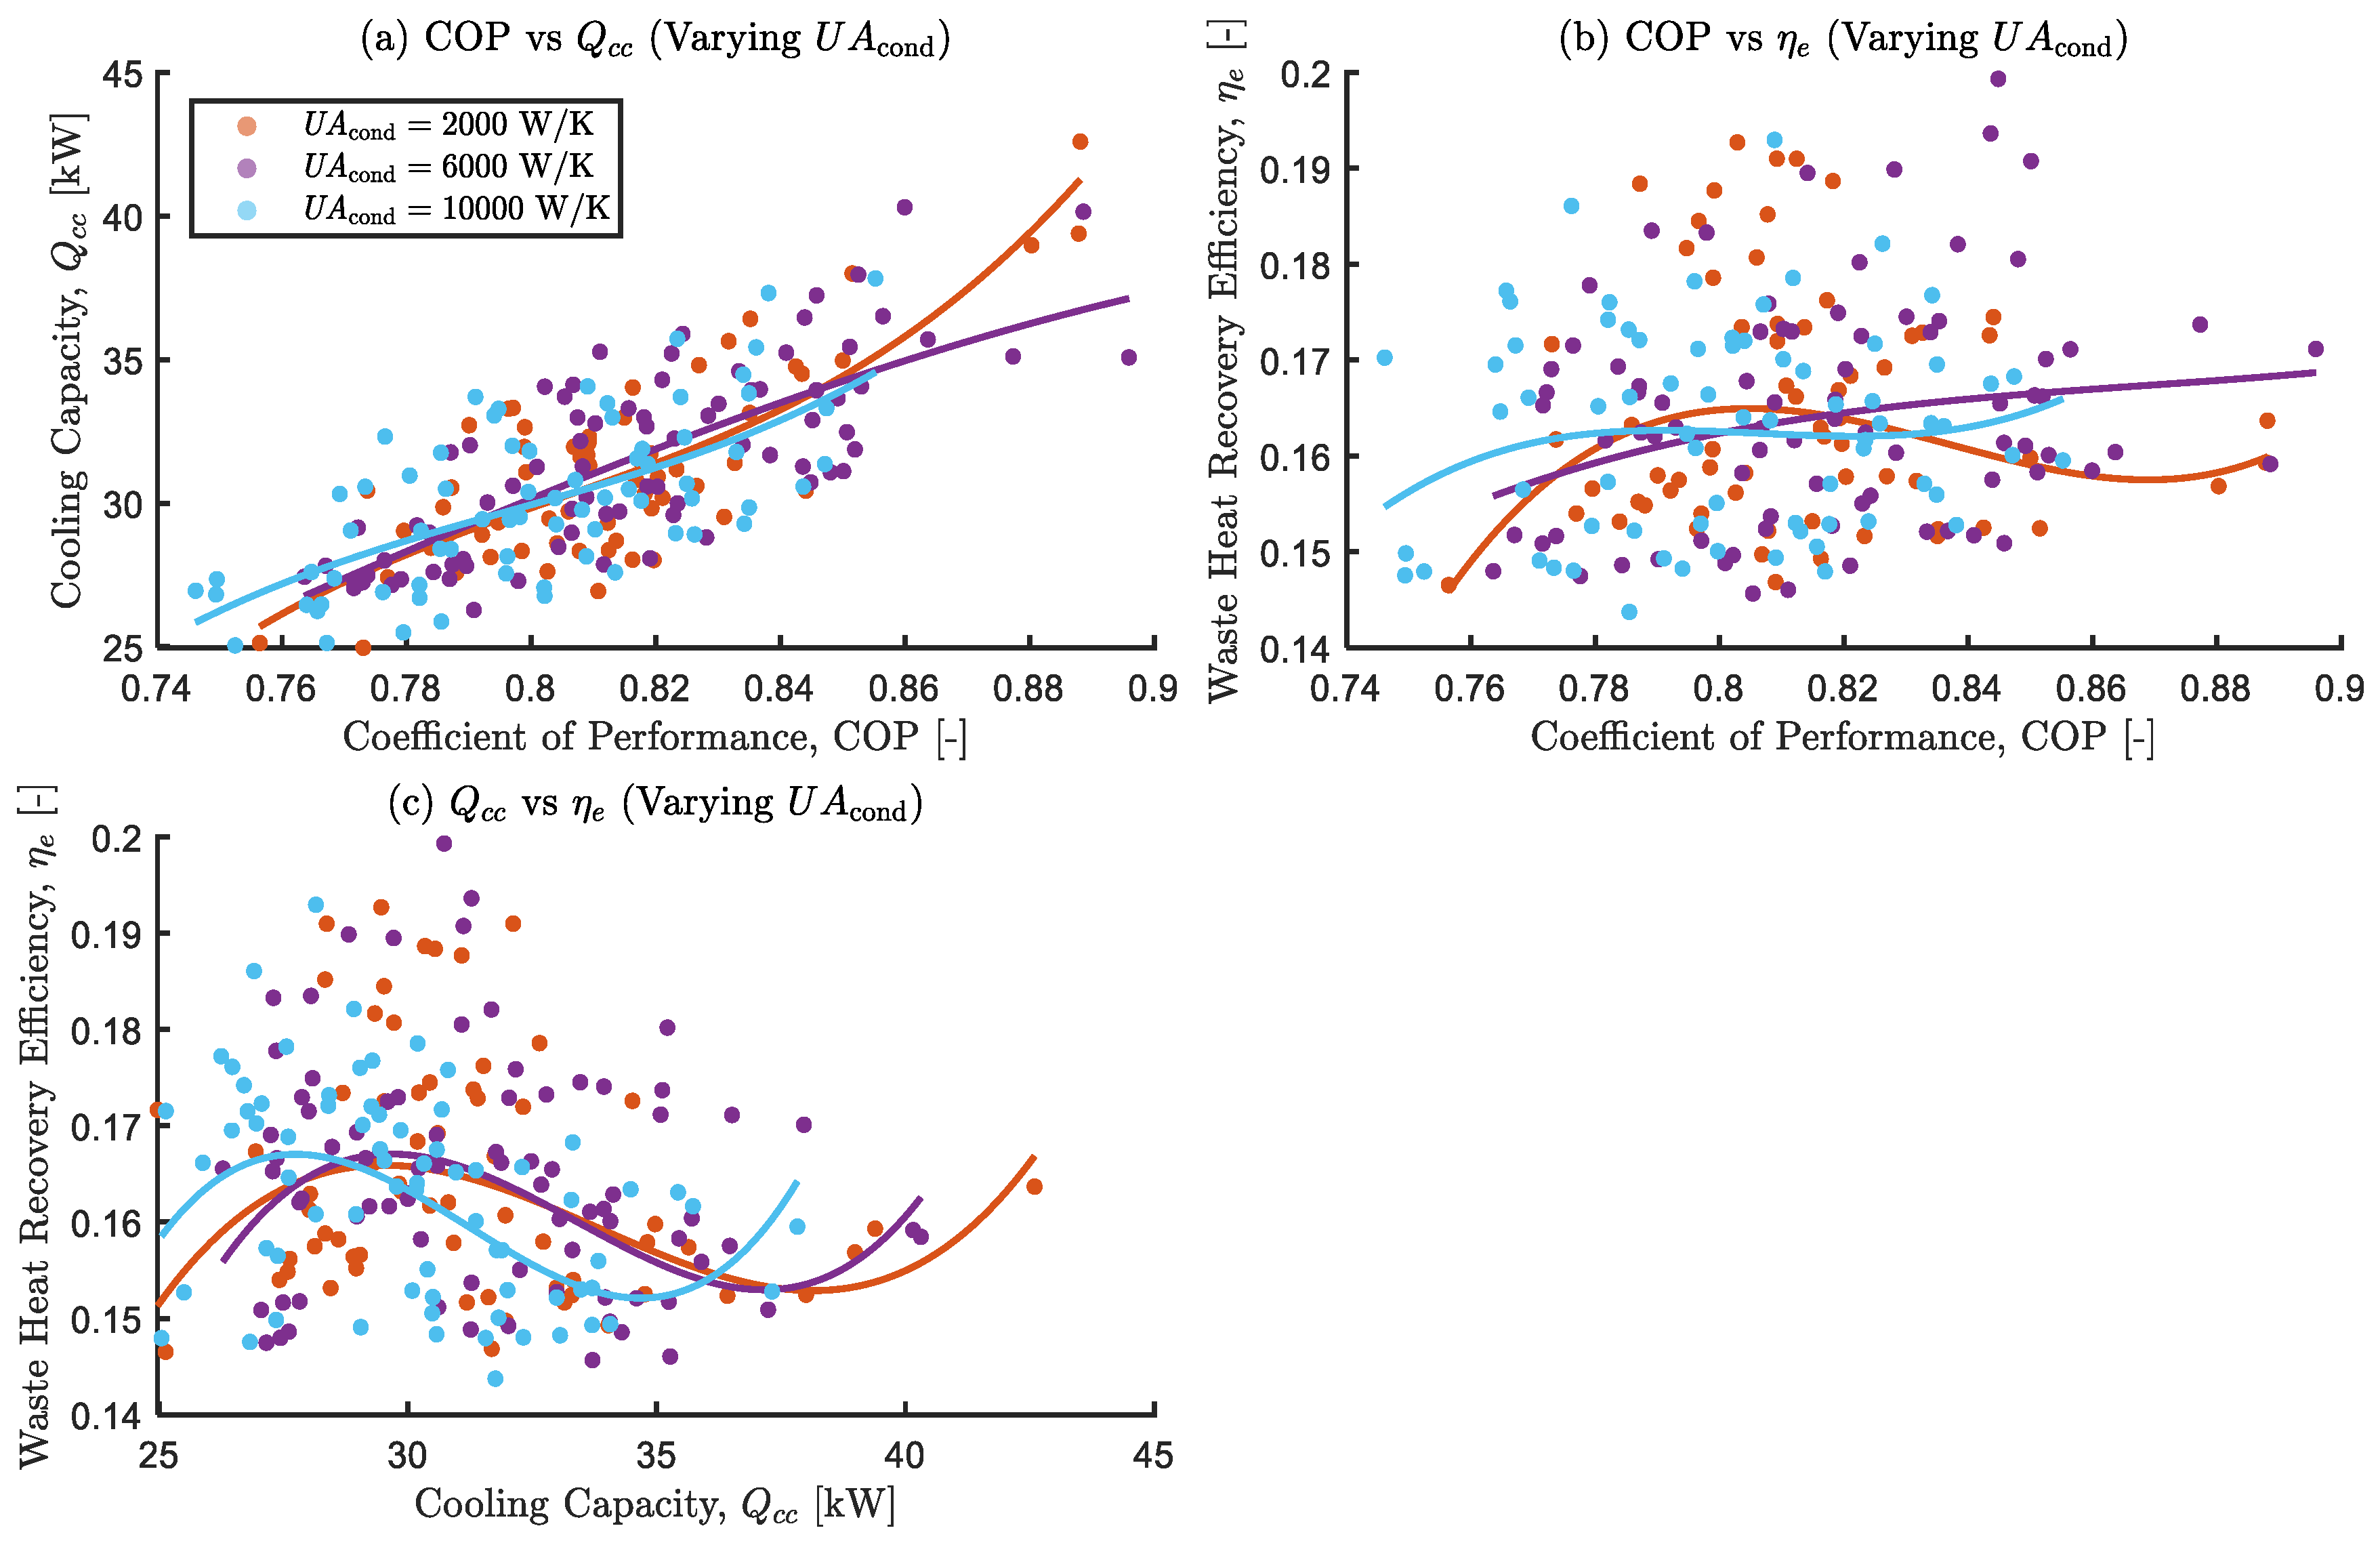

Table 1.
Major KPIs of adsorption chillers.
| Paper Titles | KPIs | Results Obtained |
|---|---|---|
| Study of a two-bed silica gel–water adsorption chiller: performance analysis. [42] | Cooling capacity using the lumped parameter simulation model. | The optimal value of 5.95 kW for a cycle time of 1600 s with the hot, cooling, and chilled water inlet temperatures at 85 °C, 25 °C, and 14 °C, respectively |
| Performance Prediction of a Two-bed Solar Adsorption Chiller with Adaptive Cycle Time Using a MIL-100(Fe)/Water Working Pair – Influence of Solar Collector Configuration. [43] | Specific Cooling Power (SCP), Coefficient of Performance (COP) and Solar Coefficient of Performance (COPSc) using numerical simulation. | A single-glazed insulated transparent solar collector with a predefined adsorption time of 110 s showed the highest thermal COP among other results. |
| Modeling of a re-heat two-stage adsorption chiller by AI approach. [44] | Analyzed cooling Capacity (Cc) using ANFIS model for optimization. | Other input parameters must be fixed and remain unaltered when analyzing the effect of a particular operating variable on the cooling capacity of a reheat two-stage adsorption chiller. |
| Examination of the effects of operating and geometric parameters on the performance of a two-bed adsorption chiller. [45] | Analyzed the Cooling Capacity (CC), Coefficient of Performance (COP) and Specific Cooling Capacity (SCC) on the overall performance of a two-bed adsorption chiller using a detailed numerical model. | Significant increase in COP and SCC by about 68% and 42%, respectively, with turbulent flow regimes. |
| Experimental Study of Performance Improvement of 3-Bed and 2-Evaporator Adsorption Chiller by Control Optimization. [46] | Used control software on a modified prototype of a 3-Bed and 2-Evaporator Adsorption Chiller to investigate Coefficient of Performance (COP), Cooperation Adsorption Unit Heating Source and Operational Aspects Such as Noise and Vibrations. | Substantial improvement in cooperation adsorption unit, heating source and chiller COP. |
| An adaptive neuro-fuzzy model of a re-heat two-stage adsorption chiller. [47] | Experimentally tested for the effect of thermal conductance values of sorption elements and evaporator on the cooling capacity and other design parameters. | The highest cooling capacity of 21.7 kW is achieved at the following design and operational parameters: Msorb = 40 kg, t = 1300 s, T = 80 C, Csorb/Cmet = 50, hAsorb = 4000 W/K, hAevap = 4000 W/K. |
| Performance enhancement of an adsorption chiller by optimum cycle time allocation at different operating conditions. [48] | Experimental allocation of the optimum cycle time at different operating conditions. System to examine the Cooling Capacity and Enhancement Ratio of the System Cooling Capacity. | Increment in system cooling capacity enhancement ratio of 15.6% at cooling, hot and chilled water inlet temperatures of 40 °C, 95 °C, and 10 °C, respectively. |
| Performance comparison of a two-bed solar-driven adsorption chiller with optimal fixed and adaptive cycle times using a silica gel/water working pair. [49] | Comparative study of Optimal Fixed and Adaptive Cycle Times, Adsorption/Desorption (Ads/Des) Uptakes and preheating/precooling (Ph/Pc) Times. | The adaptive cycle time resulted in 19% higher specific cooling power and a 66% higher COP than corresponding predicted values for a fixed cycle time condition, with a 0.7 °C minimum evaporator temperature reported for adsorption research works so far. |
Table 2.
Decision variables and bounds.
| Variable Description | Symbol | Range | Units |
| Hot water inlet temperature |
|
65 – 95 | ◦C |
| Cooling water inlet temperature |
|
22 – 36 | ◦C |
| Chilled water inlet temperature |
|
10 – 20 | ◦C |
| Hot water mass flow rate |
|
0.8 – 2.2 | kgs− 1 |
| Bed cooling water mass flow rate |
|
0.8 – 2.2 | kgs− 1 |
| Chilled water mass flow rate |
|
0.2 – 1.4 | kgs− 1 |
| Condenser cooling water mass flow rate |
|
0.8 – 2.2 | kgs− 1 |
| Adsorbent bed overall thermal conductance |
|
2,000 – 10,000 | W/K |
| Evaporator overall thermal conductance |
|
2,000 – 10,000 | W/K |
| Condenser overall thermal conductance |
|
10,000 – 24,000 | W/K |
Table 3.
Optimal Decision Variables for COP Maximization (GWO).
| Decision Variable | Symbol | Optimal Value | Unit |
| Hot water inlet temperature |
|
95.00 | °C |
| Cooling water inlet temperature |
|
22.00 | °C |
| Chilled water inlet temperature |
|
20.00 | °C |
| Hot water mass flow rate |
|
1.051 | kg/s |
| Bed cooling water mass flow rate |
|
1.388 | kg/s |
| Chilled water mass flow rate |
|
1.400 | kg/s |
| Condenser cooling water mass flow rate |
|
1.364 | kg/s |
| Adsorbent bed overall thermal conductance |
|
9830.45 | W/K |
| Evaporator overall thermal conductance |
|
9931.11 | W/K |
| Condenser overall thermal conductance |
|
14157.87 | W/K |
| Maximized COP | — | 0.69695 | — |
Table 4.
Optimal Decision Variables for Qcc Maximization (GWO).
| Decision Variable | Symbol | Optimal Value | Unit |
| Hot water inlet temperature |
|
95.00 | °C |
| Cooling water inlet temperature |
|
22.00 | °C |
| Chilled water inlet temperature |
|
19.99 | °C |
| Hot water mass flow rate |
|
1.198 | kg/s |
| Bed cooling water mass flow rate |
|
1.750 | kg/s |
| Chilled water mass flow rate |
|
1.390 | kg/s |
| Condenser cooling water mass flow rate |
|
1.126 | kg/s |
| Adsorbent bed overall thermal conductance |
|
9890.71 | W/K |
| Evaporator overall thermal conductance |
|
7677.01 | W/K |
| Condenser overall thermal conductance |
|
11495.20 | W/K |
| Maximized Qcc | — | 20.7589 | kW |
Table 5.
Optimal Decision Variables for ηe Maximization.
| Decision Variable | Symbol | Optimal Value | Unit |
| Hot water inlet temperature |
|
65.00 | °C |
| Cooling water inlet temperature |
|
22.00 | °C |
| Chilled water inlet temperature |
|
19.98 | °C |
| Hot water mass flow rate |
|
2.198 | kg/s |
| Bed cooling water mass flow rate |
|
1.658 | kg/s |
| Chilled water mass flow rate |
|
1.396 | kg/s |
| Condenser cooling water mass flow rate |
|
1.244 | kg/s |
| Adsorbent bed overall thermal conductance |
|
9882.41 | W/K |
| Evaporator overall thermal conductance |
|
6501.39 | W/K |
| Condenser overall thermal conductance |
|
12386.87 | W/K |
| Maximized ηe | — | 0.12527 | — |
Table 6.
Trend of Decision Variables under GWO-Based Single-Objective Optimization.
| Decision Variable | COP | Qcc | ηe | Conflict | |
| ↑ | ↑ | ↓ | ≠ | ||
| ↓ | ↓ | ↓ | |||
| ↑ | ↑ | ↑ | |||
| ↓ | ↑ | ↑ | ≠ | ||
| ↑ | ↑ | ↑ | |||
| ↑ | ↑ | ↑ | |||
| ↑ | ↓ | ↑ | ≠ | ||
| ↑ | ↑ | ↑ | |||
| ↑ | ↓ | ↓ | ≠ | ||
| ↑ | ↑ | ↑ | |||
Table 7.
Set values of the hyperparameters.
| Hyperparameter | Value |
| Grid inflation parameter, alpha | 0.1 |
| Leader selection pressure parameter, beta | 4 |
| Gamma | 2 |
| Archive size | 100 |
| Number of agents | 100 |
| Maximum iterations | 50 |
| Number of Grids per Dimension, nGrid | 100 |
| Final a | 0 |
| Random seed | 42 |
| Leader selection | Roulette Wheel based on hypercube crowding |
| Crowding distance | Crowding handled through hypercube grid and the “DeleteFromRep” function |
Table 8.
Performance metrics comparison for a two-bed, single-stage silica-gel/water adsorption chiller.
Table 8.
Performance metrics comparison for a two-bed, single-stage silica-gel/water adsorption chiller.
| Parameter | Chua, Ng & Saha [31,89] | MOGWO – This Work |
| COP Range | 0.50 – 0.65 (at = 90 °C, = 25 °C) | 0.5123 – 0.6859 (at = 86.77 °C, ₎ = 22.01 °C) |
| Cooling Capacity (Qcc) | 6 – 10 kW (depending on cycle time and ) | 12.45 – 20.73 kW |
| Waste-Heat Recovery Efficiency (ηₑ) | ≈ 0.10 – 0.12 (i.e., 10 – 12 % of heat input converted to cooling at 90 °C/25 °C) | 0.0824 – 0.1248 (i.e., 8.24 – 12.48 % of heat input recovered) |
| Operating Conditions | = 70 – 95 °C (optimal near 90 °C), = 20 – 30 °C (focus 25 °C), Two beds, ~ 1 kg/bed; finned-tube UA (~ 10³ W/K) | = 86.77 °C = 22.01 °C, Two beds; UAevap = 6000 W/K, UAcond = 17 000 W/K |
Disclaimer/Publisher’s Note: The statements, opinions and data contained in all publications are solely those of the individual author(s) and contributor(s) and not of MDPI and/or the editor(s). MDPI and/or the editor(s) disclaim responsibility for any injury to people or property resulting from any ideas, methods, instructions or products referred to in the content. |
© 2025 by the authors. Licensee MDPI, Basel, Switzerland. This article is an open access article distributed under the terms and conditions of the Creative Commons Attribution (CC BY) license (http://creativecommons.org/licenses/by/4.0/).
Copyright: This open access article is published under a Creative Commons CC BY 4.0 license, which permit the free download, distribution, and reuse, provided that the author and preprint are cited in any reuse.


