
Submitted:
07 July 2025
Posted:
09 July 2025
You are already at the latest version
Abstract
Previous studies linked disadvantaged neighborhoods to poor cancer outcomes. The Neighborhood Deprivation Index (NDI) quantifies socioeconomic disadvantage but its impact on gastroesophageal adenocarcinoma outcomes remains understudied. We conducted a retrospective analysis of 40,589 patients with esophageal or gastric adenocarcinoma from the SEER database (1996–2015), stratifying them by NDI: less disadvantaged (NDI < 60) and highly disadvantaged (NDI ≥60). Multivariate regression showed NDI ≥60 was independently associated with worse overall survival (OS) (HR 1.027, p=0.017) and disease-specific survival (DSS) (HR 1.025, p=0.04). Other predictors of poor OS and DSS included older age (≥ 60 years old), male sex, single marital status, lack of insurance, advanced stage/grade, and gastric tumor site. In contrast, Hispanic and non-Hispanic Black ethnicity, urban residence, and undergoing surgery were associated with better outcomes. Disadvantaged neighborhoods are linked to poorer survival in upper GI cancers, likely due to socioeconomic barriers. Addressing social determinants of health is crucial to reducing these disparities.
Keywords:
gastric
; esophageal
; gastroesophageal
; adenocarcinoma
; neighborhood deprivation index
1. Introduction
Gastroesophageal cancers account for 1.6 million new cases per year worldwide and claim nearly 1.3 million lives annually [1]. Social determinants of health (SDOH) play a crucial role in cancer survival, especially gastric cancer, as they directly influence access to timely diagnosis, treatment, and care. Socioeconomic status (SES), education, occupation, geographic location, and living conditions shape healthcare access and outcomes [2,3,4].
The Neighborhood Deprivation Index (NDI) has been used to quantify SES. Several studies have highlighted the correlation between disadvantaged living conditions and worse outcomes in various cancers [5,6,7,8,9]. Low-income individuals often face barriers to early screening, treatment, and follow-up care, which can lead to later-stage diagnoses and reduced survival [10].
Racial and ethnic backgrounds further complicate survival disparities in gastric cancer. Research shows that minority groups such as Hispanic, Asian, Pacific Islander, and Black populations have higher rates of gastric cancer compared to Non-Hispanic White individuals [11]. Recent investigations have also shown that patients of Asian and Pacific Islander descent were more likely to present with earlier stage and have better survival than White patients [12]. Moreover, Asian gastric cancer patients have been found to have a 12% higher survival rate, primarily attributed to earlier diagnosis.
Only a limited number of epidemiological studies have investigated the association of SES and geographical variation in relation to survival outcomes for patients with gastroesophageal adenocarcinoma. Understanding the impact of SES conditions and outcomes is important to developing strategies to mitigate healthcare disparities in this patient population. In this study, we aimed to investigate the effect of NDI among patients with gastroesophageal adenocarcinoma.
2. Materials and Methods
We conducted a retrospective analysis using the Surveillance, Epidemiology, and End Results (SEER) database from 1996-2015 [13]. The NDI was divided into two halves: the least disadvantaged areas (NDI <60%) and the highest disadvantaged areas (NDI ≥ 60%), respectively. Data of all patients diagnosed with gastroesophageal adenocarcinoma (esophageal, gastric, and GEJ) from 1996-2015 were retrieved. Patients with missing survival follow-up data were excluded. We extracted data regarding demographic characteristics, marital status, insurance, tumor histology, grade and stage, surgical history, and survival outcomes. NDI group summarized demographic and clinical characteristics using frequencies and relative frequencies for categorical variables and median and interquartile range for continuous variables. All associations were compared using Kruskal-Wallis and Chi-Square tests. Kaplan Meier curves were summarized by the NDI group for time-to-event outcomes, overall and disease-specific survivals. All associations were compared using a log-rank test. Median and 95% confidence intervals were reported. We constructed a multivariate Cox model to evaluate the effect of NDI on the OS/DSS concurrently with the other variables like age, sex, race, location, marital status, insurance, disease grade, and surgery (one variable at a time). To further assess the treatment effect over time, we also applied the Restricted Mean Survival Time (RMST) regression, which provides an alternative measure of survival by calculating the area under the survival curve up to 120 months. A linear link function was utilized. The analysis was conducted in Rv4.2.3 at a significance level of ≤ 0.05. The RMST regression was conducted using PROCRMSTREG, SAS 9.4.
3. Results
A total of 40,589 patients diagnosed with gastroesophageal adenocarcinoma (23,691 patients with NDI <60 and 16,898 with NDI ≥ 60) were analyzed, comprising 21,384 esophageal and 19,205 gastric cancer patients. Disadvantaged areas (NDI ≥ 60) had a higher proportion of Black and Hispanic, single, uninsured, rural patients, advanced disease stage (III/IV), and were less likely to undergo surgery compared to NDI <60 (p<0.001) (Table 1).

Table 1.
Overall Sample Demographics Separated by NDI.
| Overall Sample | < 60 | ≥ 60 | Overall | P-Value | |
| 23691 | 16898 | 40589 | |||
| Age | Mean | 66.17 | 65.9 | 66.06 | 0.01003 |
| Median (IQR) | 67.0 (58.0, 75.0) | 66.0 (57.0, 75.0) | 66.0 (58.0, 75.0) | ||
| Age | < 40 | 513 (2.165%) | 357 (2.113%) | 870 (2.143%) | 0.1404 |
| 40-50 | 1779 (7.509%) | 1242 (7.350%) | 3021 (7.443%) | ||
| 50-60 | 4710 (19.88%) | 3516 (20.81%) | 8226 (20.27%) | ||
| 60+ | 16689 (70.44%) | 11783 (69.73%) | 28472 (70.15%) | ||
| Sex | Female | 5229 (22.07%) | 3679 (21.77%) | 8908 (21.95%) | 0.4688 |
| Male | 18462 (77.93%) | 13219 (78.23%) | 31681 (78.05%) | < 0.001 | |
| Race | Hispanic | 1776 (7.497%) | 2234 (13.22%) | 4010 (9.880%) | |
| Non-Hispanic Black | 1131 (4.774%) | 1521 (9.001%) | 2652 (6.534%) | ||
| Non-Hispanic White | 19738 (83.31%) | 12543 (74.23%) | 32281 (79.53%) | ||
| Other | 1046 (4.415%) | 600 (3.551%) | 1646 (4.055%) | ||
| Location | Rural | 4673 (19.72%) | 4982 (29.48%) | 9655 (23.79%) | < 0.001 |
| Urban | 19018 (80.28%) | 11916 (70.52%) | 30934 (76.21%) | ||
| Marital Status | Single | 8642 (36.48%) | 6776 (40.10%) | 15418 (37.99%) | < 0.001 |
| Married | 15049 (63.52%) | 10122 (59.90%) | 25171 (62.01%) | ||
| Insurance Status | Insured | 8659 (36.55%) | 7523 (44.52%) | 16182 (39.87%) | < 0.001 |
| Uninsured | 339 (1.431%) | 345 (2.042%) | 684 (1.685%) | ||
| Unknown | 14693 (62.02%) | 9030 (53.44%) | 23723 (58.45%) | ||
| Disease Stage | I/II | 4560 (19.25%) | 3931 (23.26%) | 8491 (20.92%) | < 0.001 |
| III/IV | 7065 (29.82%) | 5917 (35.02%) | 12982 (31.98%) | ||
| Unknown | 12066 (50.93%) | 7050 (41.72%) | 19116 (47.10%) | ||
| Grade | I/II | 8460 (35.71%) | 6331 (37.47%) | 14791 (36.44%) | < 0.001 |
| III/IV | 11767 (49.67%) | 7980 (47.22%) | 19747 (48.65%) | ||
| Unknown | 3464 (14.62%) | 2587 (15.31%) | 6051 (14.91%) | ||
| Surgery | No | 10604 (44.76%) | 8887 (52.59%) | 19491 (48.02%) | < 0.001 |
| Yes | 11768 (49.67%) | 7368 (43.60%) | 19136 (47.15%) | ||
| Unknown | 1319 (5.568%) | 643 (3.805%) | 1962 (4.834%) | ||
| Disease Site | Esophagus | 12554 (52.99%) | 8830 (52.25%) | 21384 (52.68%) | 0.1504 |
| Stomach | 11137 (47.01%) | 8068 (47.75%) | 19205 (47.32%) | ||
Median overall survival (OS) was lower in disadvantaged areas for gastric cancer: 9.0 months (NDI ≥ 60) vs. 10.0 months (NDI <60) (p=0.0007). Similar results were seen for esophageal cancer at 10.0 months (NDI ≥ 60) vs 11.0 months (NDI<60) (p=0.020). (Figure 1). Multivariate regression analysis for the combined gastroesophageal adenocarcinoma cohort showed that NDI ≥ 60 was independently associated with worse OS (HR 1.027, p=0.017) (Table 2).
Figure 1.
Esophageal and Gastric Overall Survival and Disease Specific Survival.
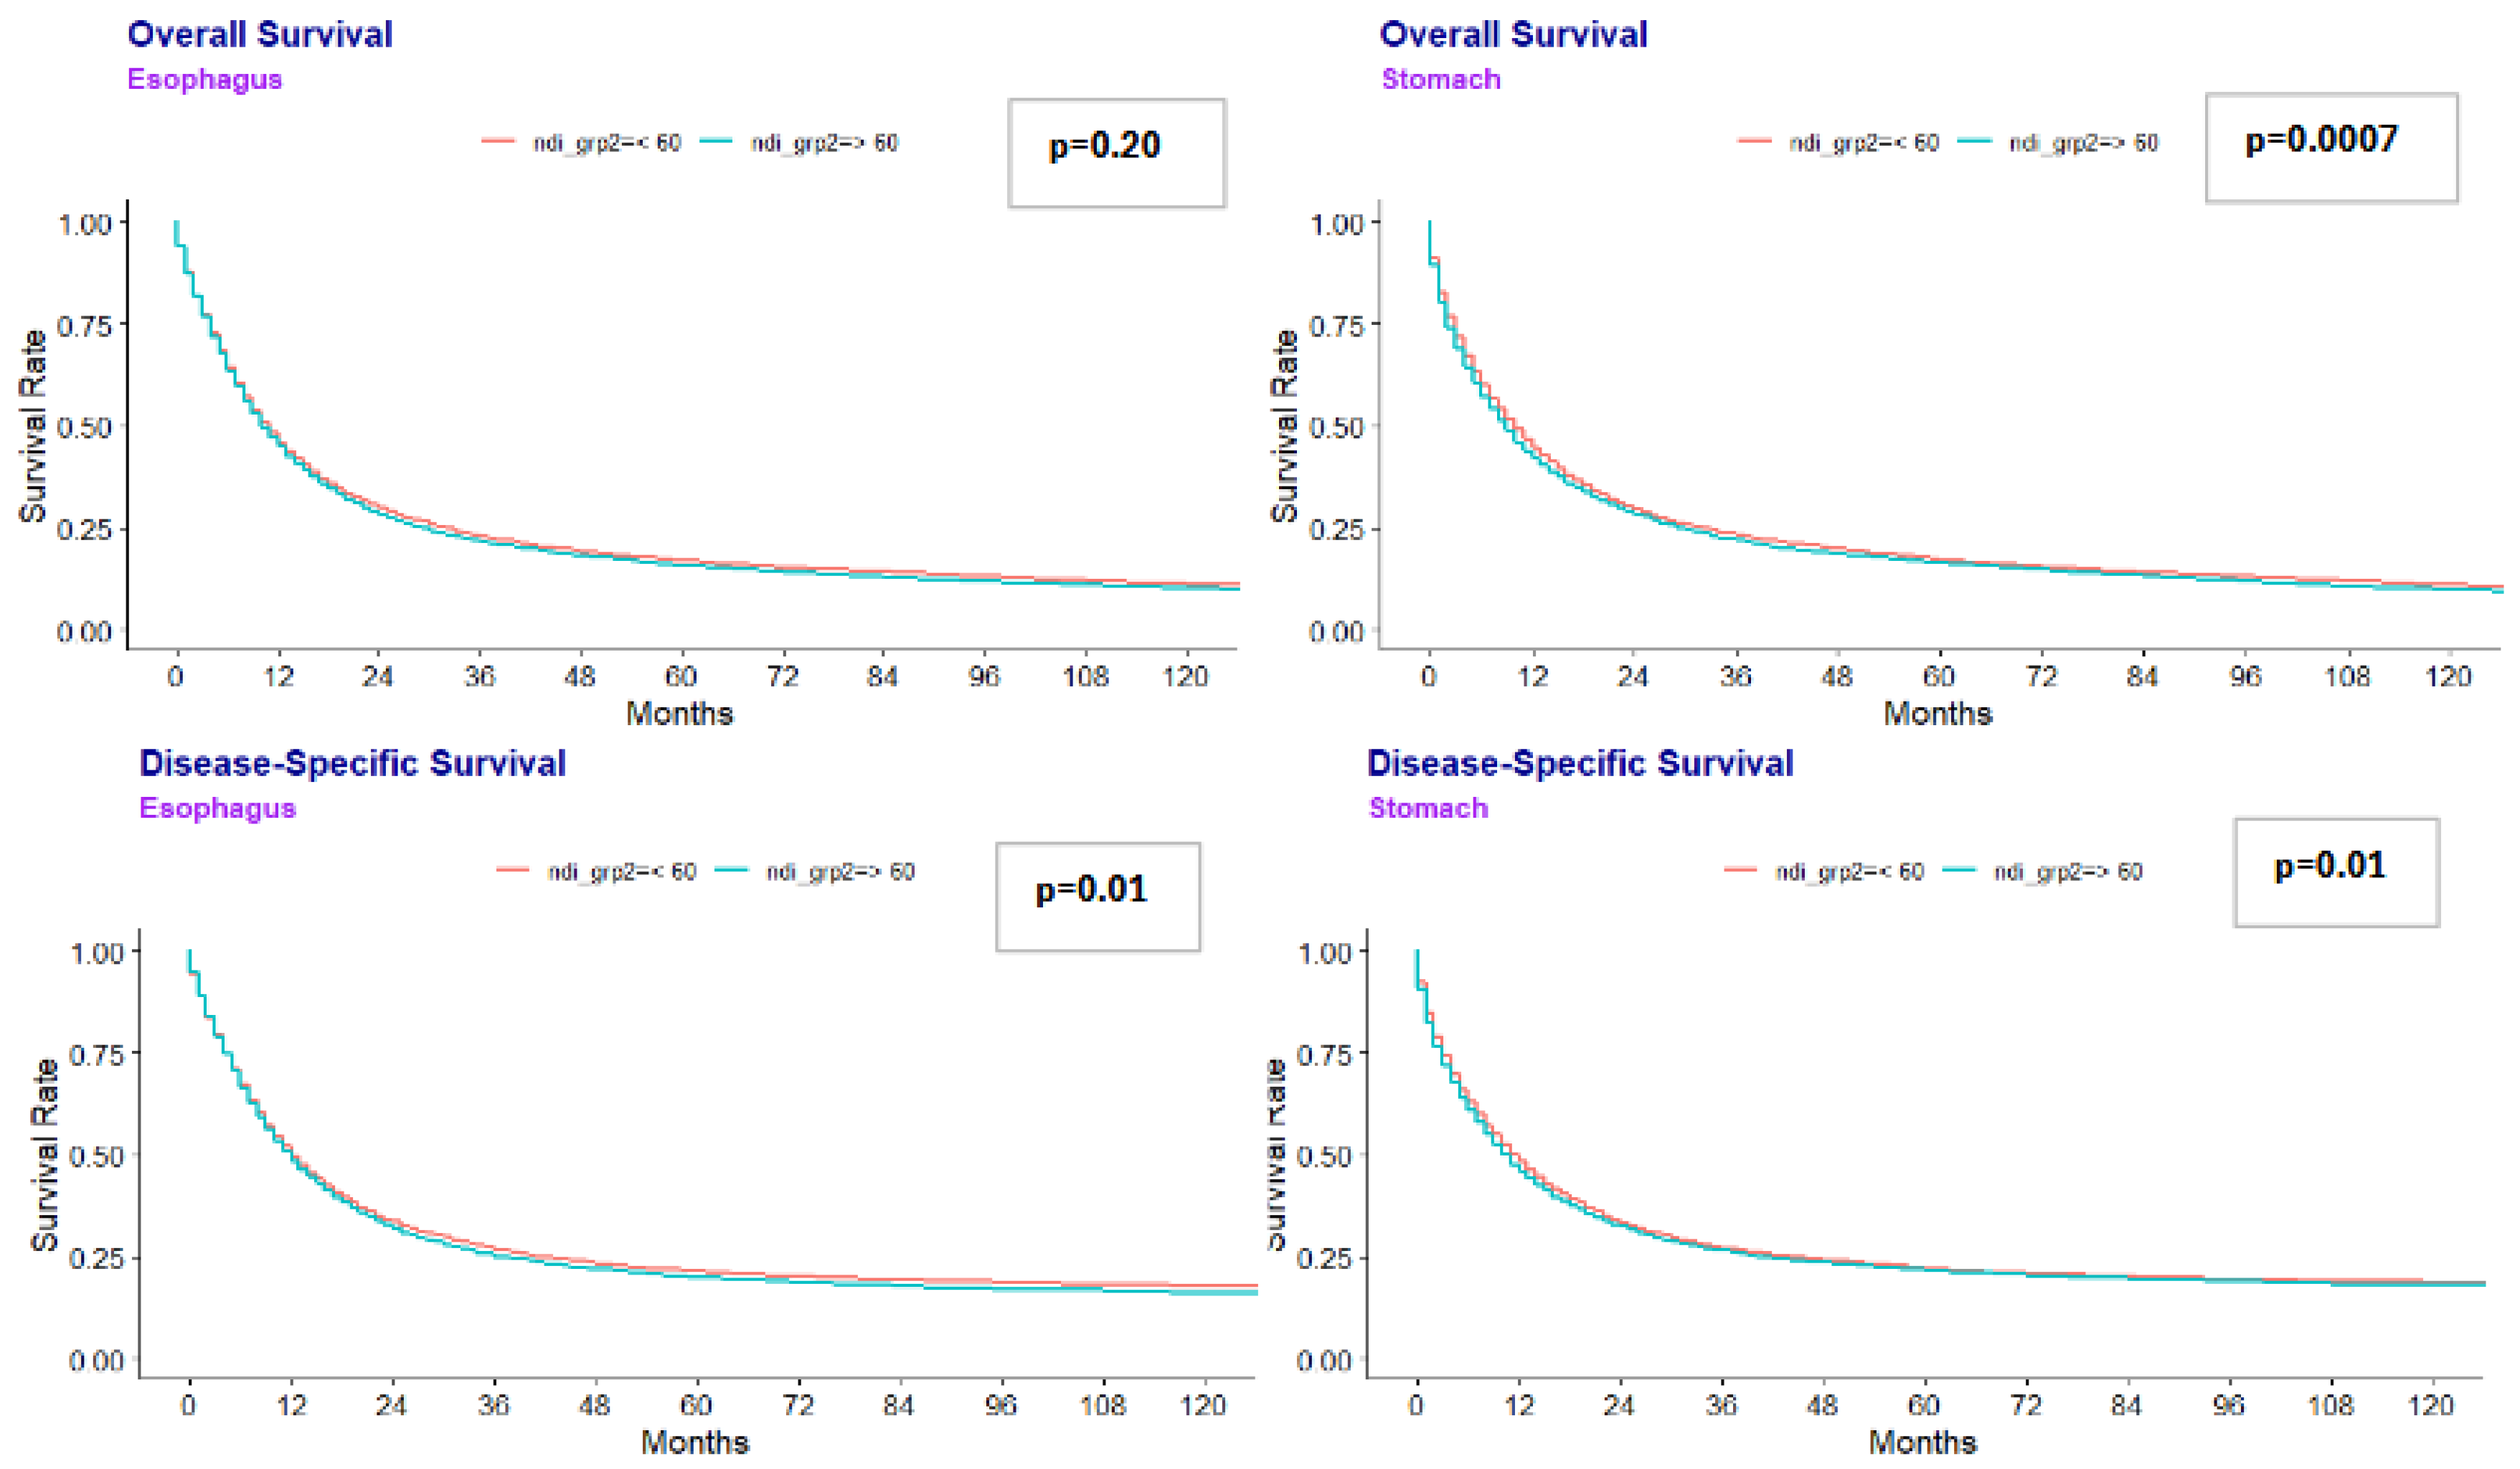
Median DSS was also lower in more disadvantaged areas. Patients with gastric cancer from more disadvantaged areas had a shorter DSS at 10.0 months compared to 12.0 months for those living in less disadvantaged areas (p=0.010). Patients with esophageal cancer had a similar median DSS at 12.0 months, regardless of what area they lived in. Multivariate analysis showed that NDI ≥ 60 was independently associated with DSS (HR 1.025, p=0.04).
Other significant predictors of worse OS and DSS included age (60+), male sex, single marital status, uninsured, advanced disease stage (III/IV), advanced disease grade (III/IV), and gastric disease site (p<0.0001). Hispanic patients, non-Hispanic Black, lived in an urban area, and had surgery had improved OS and DSS (p<0.0001) (Table 2). RMST analysis further confirmed these findings.
4. Discussion
Our study highlights the significant impact of socioeconomic factors on survival outcomes in individuals with gastroesophageal adenocarcinoma. It also demonstrates that patients with gastroesophageal adenocarcinoma who live in disadvantaged areas (NDI ≥ 60) had significantly worse OS and DSS compared to individuals living in less disadvantaged areas, even after adjusting for other variables like demographic and clinical factors.
Our results are consistent with prior studies [5,6,7,8,9]. Similar studies have shown that higher socioeconomic deprivation is associated with lower odds of receiving chemotherapy and worse OS in patients with metastatic gastric cancer [8]. The study showed that patients with the highest deprivation quartile had a median OS of 5.1 months compared to 7.5 months in the lowest deprivation quartile [8]. Another study found that there was an increased 30-day mortality following esophagectomy in patients with higher deprivation, when compared to the lowest deprivation quintiles, with an odds ratio of 1.37 [14]. These studies highlight the impact of social determinants of health on survival outcomes.
Multiple factors likely contribute to these disparities. Examples include delays in diagnosis and treatment, lower health literacy, and worse access to healthcare. Our study showed that disadvantaged areas had a higher proportion of uninsured patients from rural areas with limited access to specialized care and were more likely to present with an advanced disease stage. Tailored healthcare policies that aim to improve healthcare delivery to areas with high deprivation may help improve outcomes for patients with gastroesophageal adenocarcinoma. For instance, Kronfli et al. found that targeted interventions focused on pain management, transportation, and financial aid at an inner-city academic center, particularly among Black patients, could improve cancer outcomes and quality of life [15]. Similarly, Lineback et al. found that social workers and medical advocates who work individually with patients can improve care for patients with esophageal cancers. Specifically, individuals with low SES were more likely to have greater difficulties with caregiver communication, trust, and financial strain. The study also showed individuals with lower SES were less likely to understand their treatment options well. When provided with a care team manager or social worker, hospital systems were able to help solve these issues. These professionals can help navigate complex treatments and financial concerns and help improve clinical outcomes [15].
This is the first study to analyze the impact of NDI on gastroesophageal adenocarcinoma. One strength of our study is utilizing a large, nationally representative SEER database, which covers more than 50% of the US population. Our study has several limitations. Firstly, the SEER database does not have details on individual socioeconomic factors such as income, education, and employment status, which limits our complete understanding of the disparities among the patient population. Additionally, details on environmental influences like air quality, water pollution, transportation, and treatment regimens are unavailable. Future prospective cohort studies are needed to further understand these disparities.
In conclusion, we showed that patients from disadvantaged areas (NDI ≥ 60) have significantly worse OS and DSS for gastroesophageal adenocarcinoma, even after adjusting for demographic and clinical variables. Patients’ survival is due to complex interplay of social determinants of health and racial/ethnic background. Disparities in survival outcomes reflect systemic factors, such as access to healthcare, and individual factors, such as stage at diagnosis and response to treatment. Understanding these factors is essential for developing strategies to mitigate healthcare disparities and improve outcomes for diverse populations. Addressing socioeconomic and cultural barriers, as well as improving access to early detection and treatment, are crucial for reducing the survival gap among gastroesophageal adenocarcinoma patients.
Funding
This work was supported through funding by the National Cancer Institute at the National Institutes of Health (grant No. P30CA016056); used for access to Roswell Park Biostatistics Shared Resources). The study’s design and decision to publish were independent of any involvement from the funding sources.
Conflicts of Interest
Sarbajit Mukherjee is a volunteer guidelines panel member at the National Comprehensive Cancer Network and American Society of Clinical Oncology. He received research funding from the National Comprehensive Cancer Network and Ipsen Biopharmaceuticals/North American Neuroendocrine Tumor Society, which were paid to the institute. Dr Mukherjee received consulting fees from Merck and BeiGene, Ltd. Sarbajit Mukherjee and all other authors declare no author conflicts of interest.
Data Availability
All the data used for this study is from the publicly available Surveillance, Epidemiology, and End Results (SEER) database at https://seer.cancer.gov/data/index.html.
Acknowledgments
The funder did not play a role in the design of the study; the collection, analysis, and interpretation of the data; the writing of the manuscript; or the decision to submit the manuscript for publication.
Ethics approval
Not applicable.
References
- Bray F, Ferlay J, Soerjomataram I, Siegel RL, Torre LA, Jemal A. Global cancer statistics 2018: GLOBOCAN estimates of incidence and mortality worldwide for 36 cancers in 185 countries [published correction appears in CA Cancer J Clin. 2020 Jul;70(4):313. doi: 10.3322/caac.21609.]. CA Cancer J Clin. 2018;68(6):394-424. doi:10.3322/caac.21492Cella DF, Orav EJ, Kornblith AB, Holland JC, Silberfarb PM, Lee KW, Comis RL, Perry M, Cooper R, Maurer LH et al (1991) Socioeconomic status and cancer survival. J Clin Oncol 9:1500 1509.
- Singh GK, Jemal A. Socioeconomic and Racial/Ethnic Disparities in Cancer Mortality, Incidence, and Survival in the United States, 1950-2014: Over Six Decades of Changing Patterns and Widening Inequalities. J Environ Public Health. 2017;2017:2819372. [CrossRef]
- Rana N, Gosain R, Lemini R, et al. Socio-Demographic Disparities in Gastric Adenocarcinoma: A Population-Based Study. Cancers (Basel). 2020;12(1):157. Published 2020 Jan 9. [CrossRef]
- Roy AM, George A, Attwood K, et al. Effect of neighborhood deprivation index on breast cancer survival in the United States. Breast Cancer Res Treat. 2023;202(1):139-153. [CrossRef]
- Rodriguez ER, Tonn T, Jafry M, et al. Neighborhood-level social determinants of health burden among adolescent and young adult cancer patients and impact on overall survival. JNCI Cancer Spectr. 2024;8(4):pkae062. [CrossRef]
- Kennedy, K., Jusue-Torres, I., Buller, I.D. et al. Neighborhood-level deprivation and survival in lung cancer. BMC Cancer 24, 959 (2024). [CrossRef]
- Pichardo MS, Minas TZ, Pichardo CM, et al. Association of Neighborhood Deprivation With Prostate Cancer and Immune Markers in African American and European American Men. JAMA Netw Open. 2023;6(1):e2251745. Published 2023 Jan 3. [CrossRef]
- Raghu A, Shah S, Permuth JB, et al. The impact of neighborhood socioeconomic deprivation on treatment and survival for patients with metastatic gastric cancer: An incidence-based retrospective cohort study. JCO Oncology Practice. 2024;20(10_suppl):110-110. [CrossRef]
- Bourgeois A, Horrill T, Mollison A, Stringer E, Lambert LK, Stajduhar K. Barriers to cancer treatment for people experiencing socioeconomic disadvantage in high-income countries: a scoping review. BMC Health Serv Res. 2024;24(1):670. Published 2024 May 28. [CrossRef]
- Dong, E., Duan, L., & Wu, B. U. (2017). Racial and Ethnic Minorities at Increased Risk for Gastric Cancer in a Regional US Population Study. Clinical gastroenterology and hepatology: the official clinical practice journal of the American Gastroenterological Association, 15(4), 511–517. [CrossRef]
- Powers BD, Daly MP, Davey A, Taghavi S, Jayarajan SN, Willis AI. The impact of race on gastric cancer outcomes in the United States. Journal of Clinical Oncology. 2013;31(4_suppl):83-83. [CrossRef]
- Rawla P, Barsouk A. Epidemiology of gastric cancer: global trends, risk factors and prevention. Prz Gastroenterol. 2019;14(1):26-38. [CrossRef]
- Surveillance, Epidemiology, and End Results (SEER) Program Populations (1969-2023) (www.seer.cancer.gov/popdata), National Cancer Institute, DCCPS, Surveillance Research Program, released February 2025.
- Kronfli, D., Savla, B., Lievers, A., Baker, K., Eggleston, C., Miller, R., Bentzen, S. M., Mohindra, P., & Vyfhuis, M. A. L. (2022). Identifying Psychosocial Needs of Patients With Cancer Undergoing Curative Radiation Therapy in an Inner-City Academic Center to Address Racial Disparities. International journal of radiation oncology, biology, physics, 114 (2), 185-194. [CrossRef]
- Lineback CM, Mervak CM, Revels SL, Kemp MT, Reddy RM. Barriers to Accessing Optimal Esophageal Cancer Care for Socioeconomically Disadvantaged Patients. Ann Thorac Surg. 2017;103(2): 416-421. [CrossRef]
Table 2.
Multivariate regression analysis for OS and DSS.
| Overall Sample (OS) | HR | P-Value | Overall Sample (DSS) | HR | P-Value | |
| NDI | ≥ 60 | 1.03 | 0.017 | 1.02 | 0.041 | |
| Age | 60+ | 1.45 | <0.0001 | 1.23 | < 0.0001 | |
| Sex | Male | 1.06 | <0.0001 | 1.03 | 0.023 | |
| Race | Non-Hispanic Black | 0.98 | <0.0001 | 0.97 | <0.0001 | |
| Hispanic | 0.96 | <0.0001 | 0.96 | <0.0001 | ||
| Location | Urban | 0.94 | <0.0001 | 0.93 | <0.0001 | |
| Marital Status | Single | 1.20 | <0.0001 | 1.16 | <0.0001 | |
| Insurance | Uninsured | 1.22 | <0.0001 | 1.20 | <0.0001 | |
| Disease Stage | III/IV | 2.02 | <0.0001 | 2.34 | < 0.0001 | |
| Disease Grade | III/IV | 1.33 | <0.0001 | 1.40 | < 0.0001 | |
| Disease Site | Stomach | 1.21 | <0.0001 | 1.20 | < 0.0001 | |
| Surgery | Yes | 0.37 | <0.0001 | 0.35 | < 0.0001 | |
Disclaimer/Publisher’s Note: The statements, opinions and data contained in all publications are solely those of the individual author(s) and contributor(s) and not of MDPI and/or the editor(s). MDPI and/or the editor(s) disclaim responsibility for any injury to people or property resulting from any ideas, methods, instructions or products referred to in the content. |
© 2025 by the authors. Licensee MDPI, Basel, Switzerland. This article is an open access article distributed under the terms and conditions of the Creative Commons Attribution (CC BY) license (http://creativecommons.org/licenses/by/4.0/).
Copyright: This open access article is published under a Creative Commons CC BY 4.0 license, which permit the free download, distribution, and reuse, provided that the author and preprint are cited in any reuse.


