
Submitted:
08 July 2025
Posted:
11 July 2025
You are already at the latest version
Abstract
Objective: The aim of our study was to assess the expression of Programmed death-ligand 1 (PD-L1) and proliferation biomarkers (Ki-67, cyclin D1 and P53) in Pituitary Neuroendocrine Tumors (PitNETs) depending on the transcription factor and adenoma subtype. Material and methods: The analysis was performed in seventy-four patients operated on in a single neurosurgical centre for pituitary tumor. Immunohistochemistry was performed for transcription factors and biomarkers: PD-L, Ki-67, P53 and cyclin D1 in tissue microarray format. Membranous expression of PD-L1 was scored as 0 (no expression) and ≥1%. Nuclear expression of Ki-67 was scored at <3% and ≥3%, expression of P53 and Cyclin D1 were scored at <10% and ≥10%. Results: The following tumors expressed PD-L1≥1%: gonadotroph - 21 (28.4%), corticotroph - 5 (6.7%), gonadotroph/lactotroph - 2 (2.7%), null cell adenoma - 3 (4.0%), multiple synchronous PitNET - 2 (2.7%); immature PIT-1 tumour – 1 (1.3%); mature PIT-1 tumor -1 (1.5%). KI≥3% was found in the following types of PITNETs: gonadotroph – 3 (4.0%), corticotroph - 2 (2.7%), lactotroph – 1 (1.3%), multiple synchronous PitNET – 1 (1.3%), immature PIT-1 tumor -1 (1.3%), mature PIT-1 tumor -1 (1.3%). Of the four factors, PD-L1 increased the odds of invasiveness the most (adjusted OR = 2.35; 95% CI: 0.56–9.90). Patients with K≥3% were statistically significantly younger (p=0.03). All tumors (100%) with a combination of Cyclin D1≥10% & P53<10% were invasive on the Hardy scale. Conclusions: PD-L1 expression was present in some types of PitNETs, which may play a role in immunotherapy. CyclinD1 D>10% may affect the invasiveness of PitNETs. Further studies are needed in a larger group of patients to determine the importance of this factor, as well as studies on the role of cyclin D1 in PitNETs.
Keywords:
biomarkers
; PD-L1
; Ki67
; Cyclin D11
; p53
; PitNETs
; transcription factors
; invasiveness
1. Introduction
The biological behavior of Pituitary Neuroendocrine Tumors (PitNETs) is still unclear and is a challenge for clinicians. PitNETs account for approximately 10-15% of intracranial tumors [1,2,3]. Currently, the WHO classification of PITNETs is in force, which was proposed in 2017 and then modified in 2022 [4, 5]. The classifications are based on the immunohistochemical profile and transcription factors (TF) from which the tumor originates (PIT-1, pituitary-specific POU-class homeodomain transcription factor; SF 1, steroidogenic factor 1 and TPIT, T-box family member TBX19), which makes it possible to identify so-called silent PitNETs, which do not produce clinically detectable amounts of hormones, but have a specific molecular phenotype. The diagnosis and classification of PitNETs were based on clinical presentation, plasma hormone levels, MRI features (tumor size and cavernous sinus invasion) and histopathological features (immune subtype, Ki-67 index, mitotic count and P53 positivity). Recently, a new prognostic clinicopathological classification (HYPOPRONOS) was proposed to predict the risk of reccurence of pituitary tumors [6,7]. Using pituitary magnetic resonance imaging (MRI) for diagnosis of cavernous or sphenoid sinus invasion, immunocytochemistry, markers of the cell cycle (Ki-67, mitoses) and P53, tumours were classified according to size (micro, macro and giant), hormonal type and grade (grade 1a: non-invasive, 1b: non-invasive and proliferative, 2a: invasive, 2b: invasive and proliferative, and 3: metastatic). The European Society of Endocrinology guidelines define an aggressive pituitary adenoma as a radiologically invasive tumor with an unusually rapid growth rate, or as a tumor presenting with clinically relevant growth despite optimal use of standard medical, surgical, and radiotherapeutic therapies [8]. According to various studies, about 2% of macroadenomas are aggressive in nature [9].
Currently, many studies have been devoted to the subject of prognostic factors, thanks to which it will be possible to determine the biological behavior of PitNETs. This will allow for the identification of potentially aggressive tumors [6]. One of the factors is the programmed cell death protein 1 (PD-1; encoded by the PSCD1 gene) and its ligand programmed death-ligand 1 (PD-L1; encoded by the CD274 gene). The engagement of PD-1 receptor expressed on activated T cells and its ligand is a major co-inhibitory checkpoint signalling that controls T-cell activities. Various types of cancers express high levels of PD-L1 and exploit the PD-L1/PD-1 signalling to evade T-cell immunity [10]. Hence, blocking the PD-L1/PD-1 pathway had anticancer effects in patients with advanced cancers. PD-L1 is an immunoinhibitory molecule that suppresses the activation of T cells, leading to the progression of tumors [11]. Overexpression of PD-L1 has been evaluated in various cancers such as gastric cancer [12,13], hepatocellular carcinoma [14], renal cell carcinoma [15], esophageal cancer [16], pancreatic cancer [17], ovarian cancer [18], and bladder cancer [19]. The prognostic value of PD-L1 expression in lung cancer, colorectal cancer, and melanoma is controversial. PD-L1 expression was related to aggressive behavior in lung tumors [19,20,21] and melanoma [22]. The current data suggest that PD-L1 expression in the thyroid gland might represent a marker of malignancy that correlates with papillary thyroid cancer [23].
The association between PD-L1 expression and PitNETs behavior has been studied in many studies [24,25,26,27,28,29,30,31]. Higher expression of PD-L1 has been demonstrated in somatotroph, lactotroph, and PIT-1 positive plurihormonal tumors [28] and lower expression in gonadotroph and corticotroph tumors [29, 32]. A positive correlation has also been shown between PD-L1 expression and tumor volume and cavernous sinus invasion [31], but there are studies that do not confirm the correlation between PD-L1 and radiological features of invasion [29]. The correlation between PD-L1 expression in PitNETs has also been studied in the paediatric population [33]. Immune checkpoints are currently used in the treatment of pituitary tumors [34]. The roles of the tumor immune microenvironment (TIME) and the role of macrophages and T cells are emphasized. Macrophages and T cells are principal immune infiltrates within the TIME. Multiple studies have confirmed that PD-1/PD-L1 and immune checkpoint inhibitors (ICIs) targeting PD-1/PD-L1 are of great importance in the treatment of numerous tumors [35]. Immune checkpoint inhibitors, including anti-PD-1 (nivolumab and pembrolizumab), anti-PD-L1 (atezolizumab, avelumab, and duravulumab) are currently FDA - approved treatment options for a wide range of cancer types [36]. Currently, immunotherapy is the subject of research as a promising method of treatment aggressive PITNETs and rare pituitary carcinomas [37, 38,39].
The nuclear protein Ki-67 (a nuclear protein encoded by the MKI67 gene), which is a marker of cell proliferation, plays an important role in the assessment of pituitary tumors. This issue has been addressed in numerous studies [40, 41,42, 43]. It is present in the active phases of the cell cycle (G1, S, G2, M) and absent in the resting phase (G0). It is expressed as the Ki-67 index, i.e., the percentage of cells showing positive expression. High Ki-67 (>3%) correlates with more frequent invasion of the cavernous sinus [44,45], recurrence after treatment [45,46,47], lower efficacy of pharmacological therapy, and the need for more intensive treatment, e.g., radiotherapy. The Ki-67 index helps assess the risk of recurrence, tumor growth rate, and potential malignancy (when exceeding 10-20%). The cut-off for Ki-67% is assumed to be 3% [48]. In PIT-1 lineage tumors (lactotroph, somatotroph, thyrotroph), the typical Ki-67 value is <1-3%, which translates into low to moderate aggressiveness and risk of recurrence. In corticotroph tumors of the TPIT lineage, the Ki-67 value is 3-10% (sometimes over 10%), which results in high aggressiveness and a high risk of recurrence [42,49]. In a study by Rak et al., it was shown that sparsely granulated corticotroph tumors more often have Ki-67≥3%, while densely granulated tumors have <3% [49]. Silent corticotroph tumors are characterized by a Ki-67 index of >5-10%, and therefore have an aggressive course and a high risk of recurrence. Crook cell tumors have similar indices [50,51]. Gonadotroph tumors of the SF-1 lineage have a low KI-67, i.e., <1-2%, and therefore a low risk of aggressiveness and recurrence. Null cell adenoma tumors usually have Ki-67 1-3%. Plurihormonal tumors show Ki-67% in the range of 3-10%, which may also be associated with increased aggressiveness. Pituitary carcinomas, in turn, show very high Ki-67%, i.e., >20-50%, and therefore very high aggressiveness and risk of recurrence and metastasis [52,47].
Cyclins play an important role in the regulation of cell progression through the cell cycle. Cyclin D1 is a regulatory protein (encoded by the CCND1 gene) that plays a key role in the cell cycle, mainly in the transition from the G1 phase to the S phase and the initiation of DNA replication. The role of this protein in pituitary tumors has been extensively studied [53,54,55,56,60,61]. It activates cyclin-dependent kinases (CDKs). In pituitary tumors, cyclin D1 (CCND1) is particularly important, as it plays a role in the proliferation, progression, and potential aggressiveness of these tumors. Overexpression of cyclin D1 leads to excessive cell proliferation, resulting in rapid tumor growth. Cyclin D1 correlates positively with Ki-67 (proliferation index). Higher cyclin levels may indicate a higher risk of residual tumor growth, recurrence after surgery [57,58,59], and invasion into the cavernous sinus [57,58]. Overexpression of this protein has been reported in a significant proportion of pituitary tumors (up to 54%), particularly in macroadenomas and hormonally inactive tumors [53,58,59].
The P53 protein (tumor suppressor protein encoded by the TP53 gene) is a nuclear transcription protein that acts as a tumor suppressor, monitoring DNA integrity and activating repair mechanisms or apoptosis in the event of damage. In the 2004 WHO classification, P53 protein was one of the three criteria for atypical pituitary adenoma. However, it is not currently a mandatory marker in routine PitNETs diagnosis, but it may be helpful in identifying potentially aggressive tumors. In a normal pituitary gland, P53 expression is very low, in most pituitary adenomas it is minimal, while excessive (>10%) expression may indicate a more aggressive phenotype, a tendency to recur and a propensity for invasion. Significant overexpression of P53 (strong diffuse expression in >10% of cells) may suggest a TP53 mutation, which may be associated with more aggressive clinical behavior of the tumor [62]. TP53 mutation has been described more frequently in highly proliferative, potentially metastatic PitNETs types [63]. In addition, tumors with high P53 expression were reported to show more frequent progression of residual pituitary adenoma [48] and invasion into the cavernous sinus [45].
In view of the above literature, we attempted to assess these four prognostic factors in our patient study group. We have adopted the following goals:
1/ Primary objective: to assess the expression of PDL1, Ki-67, cyclin D1 and P53 in PitNETs tumors depending on the transcription factor and adenoma subtype.
2/ Secondary objective: to assess the correlation between PDL1, cyclin D1, P53 and Ki-67 and tumor invasiveness, hormonal function and parameters such as age, sex, maximum tumor size, tumor volume.
2. Material and Methods
2.1. Patients
Retrospective immunohistochemical and radiological analysis of pituitary tumors was performed. The study included a group of seventy-four patients who underwent surgery at the St Raphael’s Hospital in Krakow, Poland, between 2022 and 2024, and who were referred for surgery for a tumor within the sella turcica and in whom a pituitary adenoma was subsequently confirmed by histopathology (HP). Each patient gave informed consent for the collection of tumor tissue for the study. The patient data were anonymized. The study was approved by the Bioethics Committee of the Andrzej Frycz Modrzewski Krakow University, permission No. KBKA/31/O/2024 issued on 6 June 2024.
2.2. Materials and Methods
2.2.1. Immunohistochemical Assessment of the Hormones and Transcriptions Factors
The postoperative materials from the resected tumors were examined histopathologically. Immunohistochemical evaluation included the level of pituitary hormones (ACTH, GH, PRL, TSH, LH, FSH) and transcription factors (Pit-1, SF1 and TPIT). Based on the hormones secreted by the adenoma and the clinical picture, the tumors were classified as either hormonally active or non-active. The final histopathological diagnosis followed the guidelines and terminology of the WHO classification (5th edition, Website beta version 2022) incorporating the immunoexpression of tropic hormones and the above mentioned transcription factors. Sections of 3 um were used. After routine deparaffinization, rehydration and blocking of endogenous peroxidase activity freshly made 3% H2O2 in methanol for 20 min. at room temperature, sections were microwaved for 30 min. using EDTA buffer pH=9.0 for antigen retrieval and then incubated with primary antibody – ready to use primary antibody: An-ti-ACTH AM487-5M mouse monoclonal (clone: AH26), Anti-Prolactin AM978-5M mouse monoclonal (clone: PRL/2644), Anti-FSH-Beta AM986-5M mouse monoclonal (clone: FSH b/1062), Anti-Thyroid Stimulating Hormone mouse mono-clonal AM033-5M (clone: 5404), Anti-Luteinizing Hormone AN787-5M mouse monoclonal (clone: SP132) incubation 30 min. room temp. Followed by Labelled Polymer-HRP anti-mouse (peroxidase labelled polymer conjugated to goat an-ti-mouse immunoglobulins in Tris-Hcl buffer containing stabilizing protein) -30 min. room temperature with DAB (di-aminobenzidine tetrahydrochloride) as chromogen was applied - 8 min. room temperature. Slides were counterstained with hematoxylin Mayer - 30 s. In case of GH, PIT1, SF1, TPIT citrate buffer pH 6,0 for antigen retrieval was used and then slides were incubated with Ultra Vision Quanto Detection System V-TL-125-QHD – containing: 1- blocking serum (Ultra Vision Protein Block) to minimize nonspecific background staining with 5-minute incubation. As for particulars of antibodies for of GH, and transcription factors, the following antibodies were used: Anti-human Growth Hormone AR707-5R polyclonal rabbit – ready to use incubation 30 min. room temp, Anti-TPIT ab243028 mouse monoclonal (clone: CL6251) at a 1:1000 dilution, Anti-Pit-1 ab272639 rabbit polyclonal at a 1: 1000 dilution, Anti-SF1 antibody ab217317 rabbit monoclonal EPR19744 at a 1: 1500 dilution. Incubation 60 min. room temp. Followed by application of the Primary Antibody Amplifier Quanto – 10 - minute incubation, and subsequently the antibody conjugated with HRP-labeled polymer (HRP Polymer Quanto) – 10 - minute incubation, with DAB (diaminobenzidine tetrahydrochlo-ride) as chromogen was applied - 8 min. room temperature. Slides were counterstained with hematoxylin Mayer - 30 s. To confirm the specificity of the primary antibody positive and negative control tests were performed, following manu-factures instructions. Sections of human pituitary gland tissue were included as positive control. The negative control test included substitution of primary antibody with phosphate buffered saline pH = 7.4.
2.2.2. Immunohistochemistry of the PDL1, cyclin D1, Ki-67 and P53
Formalin-fixed, paraffin-embedded (FFPE) tumor tissue blocks were sectioned at 4 µm thickness using a rotary microtome. Sections were mounted on Superfrost Plus™ glass slides (Thermo Fisher Scientific) and dried overnight at 37°C, followed by baking at 60°C for 1 hour prior to staining. Slides were deparaffinized in three changes of xylene (5 min each), followed by rehydration through a graded ethanol series (2x100% and 2x95%). Heat-induced epitope retrieval was performed using citrate buffer (Target Retrieval Solution, (pH = 6.1, DAKO Cytomation, Glostrup, Denmark),) at 96°C for 50 minutes. Slides were allowed to cool gradually to room temperature (RT) in the buffer, then rinsed in destilled water. To quench endogenous peroxidase activity, sections were incubated in and in 3% hydrogen peroxide (H₂O₂) in methanol for 30 minutes. For non-specific protein binding, slides were preincubated with eBioscience™ IHC/ICC Blocking Buffer - High Protein ((Thermo Fisher Scientific) for 5 minutes at RT in a humidified chamber. Whole night incubation with diluted primary antibodes at 4 °C in a humidity chamber was carried out. The following antibodies were used: PD-L1 polyclonal antibody (Invitrogen, dilution: 1:100), Ki-67 Antigen, Clone MIB-1 (Agilent, dilution: 1:100), P53, clone DO-7 mouse antibody (Cell Signalling Technology, dilution: 1:100), anti cyclinD1/BCL-1 (Thermo Fisher Scientific, clone SP4, dilution 1:50). In all cases, the reaction was visualized using BrightVision system (Immunologic, Duiven, The Netherlands) and 0.01% 3.3-diaminobenzidine tetrahydrochloride (Vector Laboratories, Inc., Burlingame, CA, USA). Slides were counterstained with Mayer’s hematoxylin for 1 minute, rinsed in running tap water for 10 minutes, dehydrated through graded alcohols, cleared in xylene, and coverslipped using a permanent mounting medium (e.g., DPX). Each staining batch included a known PD-L1–positive control (e.g., tonsil or placenta tissue) and a negative control (primary antibody omitted).
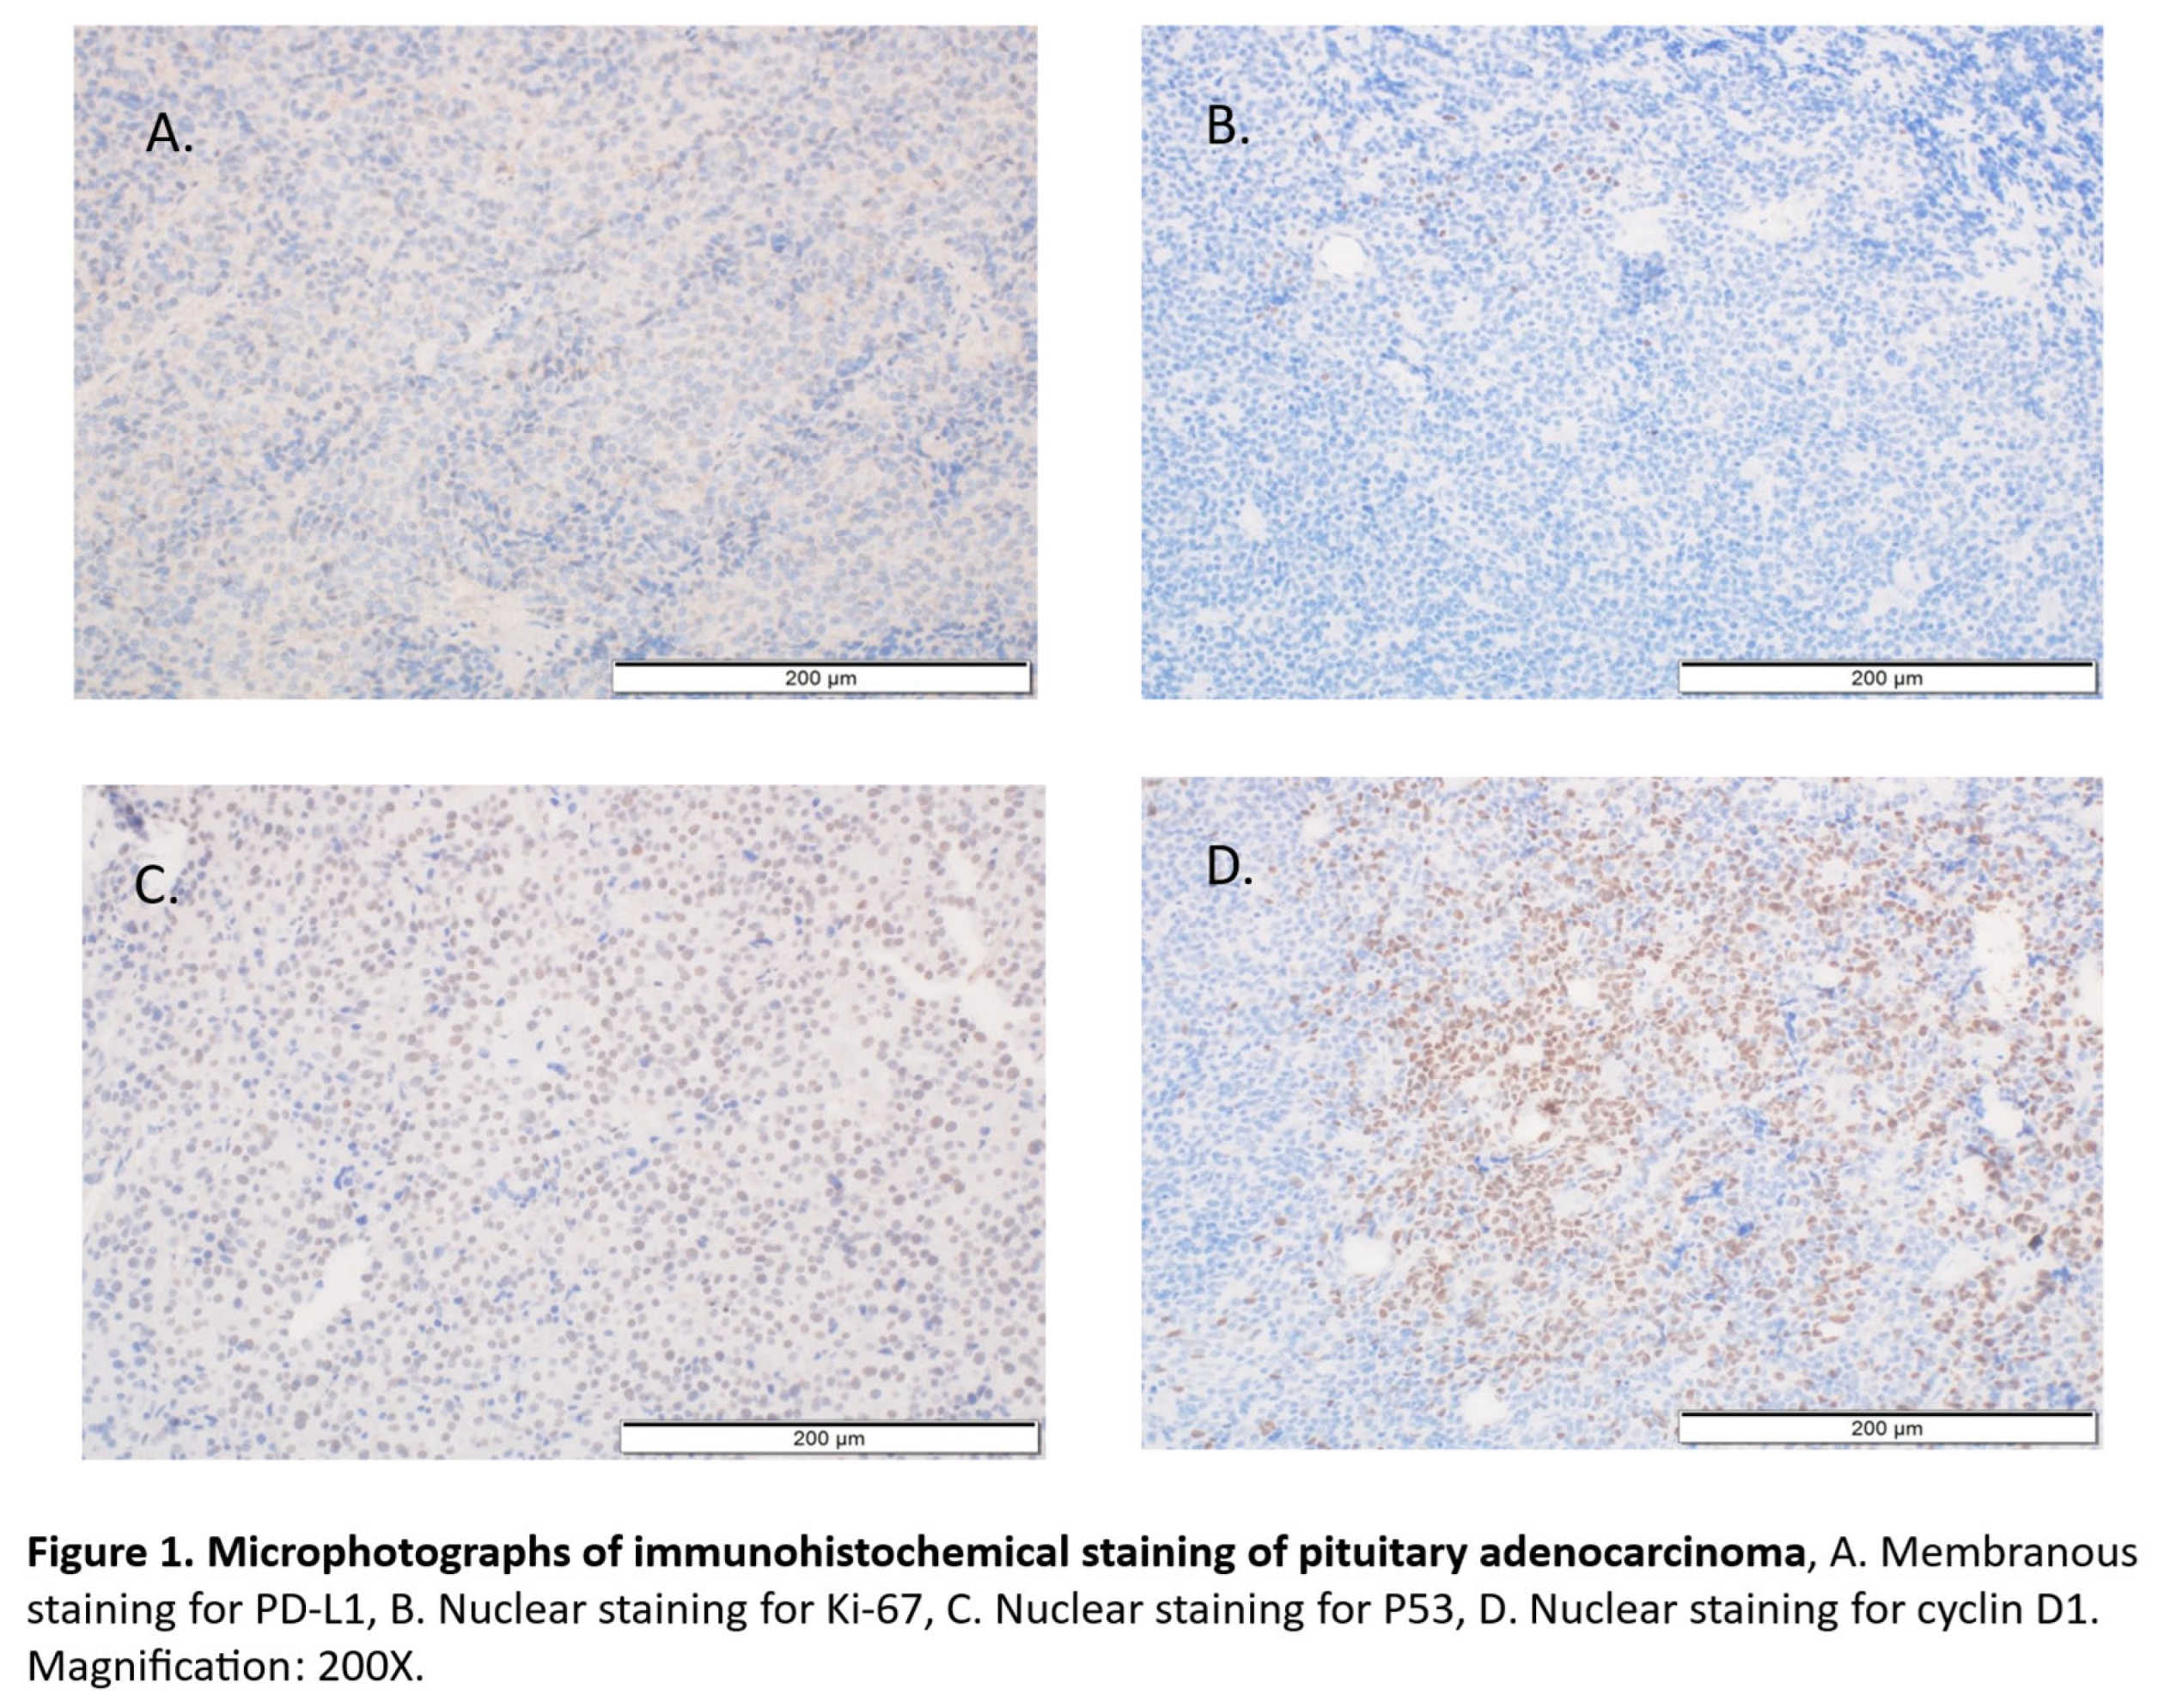
All evaluations were performed blinded to the study endpoint. In case of PD-l1 expression, similar to other authors [], membranous staining of tumor cells was considered positive (Figure 1A), regardless of intensity, and scored using the tumor proportion Score (TPS): defined as the percentage of viable tumor cells showing partial or complete membrane staining at any intensity. For Ki-67, P53 and cyclin D1 expression labelling index was analysed, which means the percentage of tumor cells with positive nuclear staining (Figure 1B-D).
The cut-off point for PD-L1, Ki-67LI, P53 expression and cyclin D1 expression/its lack were assumed at the levels of ≥1%, 3%, 10% and 10%, respectively, according to other authors.
2.2.3. Magnetic Resonance Imaging of the Tumor
Each patient was subjected to the pituitary-targeted magnetic resonance imaging (MRI) scan before surgery; in individual cases, a computer tomography (CT) scan of the head was performed due to the fact that MRI was contraindi-cated. Radiological assessment was based on pituitary MRI with contrast. The thickness of the layers used was 2-3mm. All standard MRI sequences necessary to diagnose pituitary adenoma were used. Measurements were performed using contrast-enhanced T1-weighted images. A volumetric method was used based on standard software available in the Osirix browser. Based on the MRI image, the tumor was measured in 3 dimensions, i.e., AP, ML and CC (cor x sag x cc), and the tumor volume was calculated. In addition, tumor invasion into the cavernous sinuses was assessed using the Knosp scale, while the invasion towards the sella turcica was assessed according to the Hardy scale. Knosp classification system: grade 0: the tumor does not cross the medial line of the internal carotid artery; grade 1: tumor is confined medial to the intercavernous line, crossing the vertical meridian of the carotid siphon in cross-section; grade 2: tumors extend past the intercavernous line but stay within the line tangent to the supracavernous and intracavernous carotid arteries; grade 3 tumors spread lateral to the lateral tangential line; grade 4 tumors totally encase the intracavernous carotid artery. In Hardy scale, the relation of the pituitary tumor to the sella is defined by grades I to V: intrasellar mi-croadenoma is grade I; macroadenoma causing diffuse enlargement but no perforation of the sellar floor is grade II; those causing focal eruption through the anterior sella surface are grade III; those causing extensive destruction into the sphenoid sinus are grade IV; and those that exhibit CSF (cerebrospinal fluid) or hematogenous spread are grade V. Tumor with suprasellar or parasellar extension is further designated as stages 0 and A to E: stage 0 - tumors are intrasellar; stage A - tumors reach only the suprasellar cistern; stage B - tumors encroach upon the anterior recesses of the third ventricle; stage C - tumors elevate the floor of the third ventricle; stage D - tumors extend to intradural intracranial growth; and stage E - tumors invade the cavernous sinus laterally.
In our study tumors of the Knosp grade 1 and 2 were classified as non-invasive, while grade 3 and 4 tumors were classified as invasive. Analogically, the Hardy scale grade 1 and 2 tumors were considered non-invasive and grades 3 and above were assigned to the invasive group. The patients were referred to a neurosurgeon due to their suffering from such symptoms as headache, dizziness, tinnitus, sudden visual disturbances and sudden eyelid drooping. A total of 74 consecutive patients underwent transsphenoidal excision of the pituitary tumor via the transnasal approach. All the operations were performed by the same neurosurgeon (R.C.) in the St Raphael’s Hospital in Krakow.
3. Statistics
Continuous variables were reported as median with interquartile range (Q1–Q3), and compared using the Mann–Whitney U test. Categorical variables were presented as counts and percentages, and compared using the Pearson Chi-square test or Fisher Exact test, as appropriate. The Fisher Exact test was used when the expected frequency in any cell of the contingency table was less than 5.
To determine optimal cut-off points for PD-L1 expression (TPS) across pituitary adenoma subtypes and transcription factor expression, we applied the Liu [64] method which identifies the threshold maximizing the product of sensitivity and specificity, used also by Harel et al. [28]. Cut-off selection was based on binary classification (presence/absence of a tumor subtype or marker), with the TPS value yielding the highest sensitivity × specificity product chosen as optimal.
The association between tumor invasiveness (defined as Knosp grade B or Hardy grade D) and the expression of selected biomarkers (PDL1, p53, Cyclin D1, Ki67) was assessed using simple and multivariate logistic regression. All predictors were included simultaneously in the adjusted model. Model fit was evaluated using the Hosmer–Lemeshow goodness-of-fit test, whilst model explanatory power was assessed using Cox–Snell and Nagelkerke pseudo-R² values. Discriminative ability was measured using the area under the receiver operating characteristic curve (AUC). Results were presented as odds ratios (OR) with 95% confidence intervals (CI).
Calculations were performed in Statistica v.13.3. A p-value of less than 0.05 were considered statistically significant.
4. Results
4.1. Patients Characteristics
The study cohort comprised 74 patients diagnosed with PitNETs. The detailed characteristics of the group is shown in Table 1. Briefly, the mean age at diagnosis was 57.4 years with a standard deviation (SD) of 14.0 years and a median of 60.5 years (interquartile range [IQR]: 47.0–69.0). Females constituted 39.2% (n = 29) of the group, while males accounted for 60.8% (n = 45). With respect to tumor size, macroadenomas were predominant (97.3%), whereas giant adenomas (diameter >40 mm) were present in 14.9% (n = 11). The mean tumor volume was 8.6 cm³ (SD 8.9) with a median of 5.0 cm³ (IQR: 3.1–10.2). Tumor invasiveness was evaluated using both the Knosp and Hardy classification systems. In the Knosp scale, grades 1 and 2 were classified as non-invasive, whereas grades 3 and 4 were considered invasive. Similarly, in the Hardy classification, tumors graded as stage 1 or 2 were deemed non-invasive, while stage ≥3 indicated invasive growth. Based on these criteria, 51.4% (n = 38) of tumors were invasive according to the Knosp scale, and 77.0% (n = 57) according to the Hardy scale. Taking into account both radiological and histopathological findings, 78.4% (n = 58) of tumors exhibited features of invasiveness. We divided the tumors into 5 groups according to the presence or absence of a transcription factor, i.e., tumours expressing Pit-1 only, SF1 only, TPIT only, PitNETs with no distinct cel lineage = null cell adenoma, and tumours expressing ≥2 transcription factors (multiply PitNETs). PD-L1 expression was assessed in 66 patients (no data in 8 cases), Ki-67 expression was assessed in the overall group (n=74), P53 expression in 67 (no data in 7 cases), and cyclin D1 expression in 70 patients (no data in 4 cases). The detailed characteristics of the group is shown in Table 1.
4.2. Immunoexpression of PDL-1, Ki-67, P53 and Cyclin D1 and Their Correlation with Epidemiological, Clinical and Histopathological Features
To analyze relation between all assessed epidemiological, clinical and histopathological features and PDL-1, Ki-67, P53 or cyclin D1 expression, all tumors were divided into two subgroups: with lack of protein expression and with protein overexpression, using specific cut off points, selected on the basis of literature data. In case of Pd-L1, Ki-67, P53 and cyclin D1 these cut off points were at the level of: 1% for PD-L1 [28], 3% for Ki-67 [7], 10% for P53 [79] and 10% for cyclin D1 [55]. In the studied tumor cohort, we observed the presence of tumors with overexpression of PD-L1, Ki-67, P53 and cyclin D1 in 47.3%, 12.2%, 44.6% and 39.2% of cases, respectively (Table 1).
To analyze relation between all assessed epidemiological, clinical and histopathological features all tumors were divided into two groups: due to the lack of selective protein expression and with overexpression using specific cut off points. Next, we analyzed the differences between tumors with different expression of PDL1. Among the analyzed subtypes, only tumors expressing PIT1 exclusively showed a statistically significant correlation with PDL-1 expression (p≤0.05). Among tumors from the PIT1 lineage, positive PDL-1 expression (TPS ≥1%) was found in only 1 case, while in the remaining 6 there was no PDL1 expression, indicating an inverse relationship between the presence of PIT1 and PDL-1 expression. No significant differences were found for tumors from other cell lineages.
Nevertheless, when using a simplified classification into no expression (TPS 0%) and positive expression (TPS ≥1%), certain trends can be observed: Gonadotroph PitNETs, accounting for more than half of the entire group, showed positive PD-L1 expression (TPS >1%) in nearly 50% of cases. A similar trend was observed in corticotroph PitNETs, where PD-L1 was present in 62.5% of cases. In contrast, tumors such as somatotroph, thyrotroph, and most lactotroph tumors showed only a lack of PD-L1 expression.
Next, we analyzed the expression of proliferative proteins and their effect on various parameters of pituitary tumors. The results are presented in Table 2.
We analyzed the values of the examined factors in tumors that, according to the WHO, have the potential for aggressive behavior. In our study, there were 2 cases of Crook’s tumor (PD-L1 0.0% and 5.0% respectively; Ki-67 10.0% and 1.4% respectively, P53 60.0% and 0.0% respectively, Cyklin D 0.0% and 0.0% respectively); 2 cases of silent corticotroph PitNETs (PD-L1 5.5% and 0.0% respectively, Ki-67 0.0% and 0.5% respectively, P53 60.0% and 20.0% respectively, Cyclin D1 20.0% and 0.0% respectively), 2 cases of male lactotroph PitNETs (PD-L1 0.0% and 0.0% respectively, Ki-67 3.2% and 1.6% respectively, P53 0.0% and 0.0% respectively, Cyclin D1 0.0% and 5.0% respectively).
We analyzed the relationships between the expression of Ki-67, P53, and Cyclin D1 and the expression of PD-L1. There was no statistically significant association between PD-L1 expression and the overexpression of Ki-67 (p = 0.71), P53 (p = 0.10), or Cyclin D1 (p = 0.27); however, a trend toward higher P53 expression in PD-L1 positive cases was observed. The results are presented in Table 3.
In the case of PD-L1, the cut-off point is sought and is different for different types of PitNETs. In our study, we attempted to determine the cut-off point for this protein. We established the best cut-off point of TPS to maximize sensitivity and specificity values for the different TF and PitNET subtypes. The optimal cut-off point of TPS was ≥ 1.3% for tumors expressing SF-1. For tumors expressing TPIT it was ≥ 5%, while for tumors from the PIT-1 lineage, the cut-off point it was 0.00%. The results are presented in Table 4.
Analysis of cut-off points for transcription factors: TPS showed the highest effectiveness in predicting the presence of null cell adenoma, achieving AUC = 0.75 and sensitivity of 1.00 at a TPS threshold of ≥ 5%. In the ROC analysis, PD-L1 expression at TPS ≥ 5% best identified cases of null cell adenoma, achieving a sensitivity of 100% and specificity of 59%. In tumors expressing PIT-1, any detectable PD-L1 expression (TPS ≥1%) was associated with high sensitivity (0.86) and moderate specificity (0.58), with an AUC of 0.68. Thus, the presence of any PD-L1 expression (i.e., PDL1 ≥ 1%) was associated with a lower likelihood of PIT-1 lineage presence. In the ROC analysis, the absence of PD-L1 expression (TPS = 0%) best identified PIT-1 - positive cases, with a sensitivity of 85% and a specificity of 58%. This meant that the absence of PD-L1 expression was a relatively sensitive and moderately specific feature for the diagnosis of PIT-1 lineage tumors. For tumors of the SF-1 lineage, the optimal TPS cut-off ≥ 1.3% yielded only moderate sensitivity (56%) and low specificity (52%), which translated into a low AUC (0.57), indicating the limited usefulness of TPS in identifying this lineage. In the case of TPIT-positive tumors and those with multi-lineage differentiation (Multi-lineage), TPS also proved to be of little use, with AUC values of 0.50 and 0.59, respectively, meaning that PD-L1 levels did not allow these types of lesions to be effectively distinguished.
Analysis of cut-off points for individual PitNET types: In the ROC analysis, PD-L1 expression (TPS) showed varying diagnostic utility depending on the type of pituitary tumor. The best predictive properties were obtained for lactotroph PitNETs. The absence of PD-L1 expression (TPS = 0%) allowed for their diagnosis with perfect sensitivity (1.00) and moderate specificity (0.56), with an AUC = 0.78. This means that all lactotroph PitNETs did not express PD-L1, making TPS a very sensitive indicator of their presence. At the same time, moderate specificity indicates that the absence of TPS also occurs in other types of tumors, albeit less frequently. Thus, the absence of PD-L1 expression suggested a lactotroph tumor, while its presence might make this diagnosis less likely.
In the case of immature PIT-1 lineage tumors, the absence of TPS also proved to be a relatively sensitive indicator, achieving a sensitivity of 0.80 and a specificity of 0.56 (AUC = 0.67). This means that most of these tumors did not express PD-L1, and its absence increased the likelihood of belonging to this category. However, moderate specificity indicates the limited ability of TPS to distinguish these tumors from others.
For gonadotroph PitNETs, the optimal cutoff point for PD-L1 expression (TPS) was TPS ≥ 1.3%. At this threshold, sensitivity was 55% and specificity was 50%, with an AUC = 0.54. Thus, PD-L1 expression above 1.3% allows for the detection of slightly more than half of gonadotroph cases (moderate sensitivity), but at the same time, it occurs equally often in other types (low specificity). An AUC value very close to 0.5 indicated that TPS in this range practically did not distinguish gonadotroph tumors from other types of tumors. Therefore, TPS has very limited usefulness as a diagnostic marker for this type of adenoma.
In corticotroph PitNETs, TPS ≥ 5% allowed for diagnosis with moderate sensitivity (0.63) and low specificity (0.59), with an AUC of only 0.50. This means that PD-L1 expression did not effectively differentiate these tumors from other types. PD-L1 appeared with similar frequency in both groups, making TPS an unsuitable diagnostic indicator in this case.
Next, we conducted a univariate and multivariate analysis of the impact of all four factors (PDL1, p53, Ki67, and cyclin D1) on the invasiveness of pituitary tumors. The results are presented in Table 5.
In the logistic regression analysis, none of the evaluated biomarkers (PDL1, p53, Ki67, Cyclin D1) reached statistical significance in association with tumor invasiveness defined by Knosp grade B or Hardy grade D (all p > 0.05). However, the crude analysis revealed a promising trend for PDL1 expression, which was associated with more than a twofold increased odds of invasiveness (crude OR = 2.52; 95% CI: 0.67–9.43; p = 0.17). After adjusting for other biomarkers (p53, Ki67, Cyclin D1), the association remained elevated (adjusted OR = 2.35; 95% CI: 0.56–9.90), but still this result did not reach statistical significance (p = 0.25). Similarly, Cyclin D1 seemed to increase the odds of invasiveness both in crude and in adjusted model, but the results were not statistically significant, which may be due to the small sample size. The overexpression of other biomarkers (Ki-67 and p53) showed weaker and protective associations with tumor invasiveness but also non-significant. These results remained essentially unchanged after additional adjusting for age and sex. The Hosmer–Lemeshow test indicated a good model fit (χ² = 3.63; p = 0.60). The model’s discriminative ability, assessed using the area under the ROC curve, was moderate (AUC = 0.64; SE = 0.10). Pseudo-R² values also indicated limited explanatory power (Cox–Snell R² = 0.04; Nagelkerke R² = 0.06).
4.3. Combined Analysis of Ki-67 and P53 Expression or Ki-67 and Cyclin D1
4.3.1. Combination Analysis of Ki-67 and P53 Factors
We divided the entire group into different combinations of pairs of Ki-67 and P53 factors, i.e., Ki>=3&P53>=10 (1), Ki>=3&P53<10 (2), Ki<3&P53>=10 (3) and Ki<3&P53<10 (4) and found that the median age in these groups was, respectively: for group 1 - 41 years (36–51), for group 2 – 48.5 years (35–62), for group 3 – 63 years (50–68), for group 4 – 62 years (53–70.5). Group 1 appears to be younger than the others; however, the differences did not reach statistical significance after correction for multiple comparisons (overall Kruskal–Wallis test: p = 0.04; post-hoc comparisons: group 1 vs. 3 – p = 0.06; group 1 vs. 4 – p = 0.06), indicating a trend that warrants further investigation. With respect to other parameters, i.e., sex, tumor size and volume, transcription factor type, hormonal function and invasiveness, no statistically significant differences were found. The distribution of these combinations depending on the PitNETs type is presented in Table 6.
4.3.2. Combination Analysis of Cyclin D1 and P53 Factors
A division into pairs of factors for Cyclin D1 and P53 was also performed: Cyk>=10&P53>=10 (1), Cyc>=10&P53<10 (2), Cyc<10&P53>=10 (3) and Cyc<10&P53<10 (4). Relative to the parameters, i.e., age, sex, tumor size and volume, transcription factor type, and hormonal function were not found to be statistically significant. The distribution of these combinations of factors depending on the type of PitNETs is presented in Table 7.
4.3.3. Analysis of the Effect of the Combination of Ki-67, P53 and Cyclin D1 on the Invasiveness of PitNETs
In addition, the incidence of invasive tumors (according to Hardy scale) was analyzed in four subgroups based on Ki-67 and P53 expression (Ki>=3&P53≥10, Ki≥3&P53<10, Ki<3&P53≥10, Ki<3&P53<10) or Cyclin D1 and P53 expression levels (Cyc≥10/P53≥10, Cyc≥10/P53<10, Cyc<10/P53≥10, Cyc<10/P53<10). This analysis showed that all tumors (100%) in the group with high Cyclin D1 expression and low p53 expression (n=10) were invasive. For the remaining three combinations of protein expression (n=52), the percentage of invasive tumors was 75%. Although a clear trend is observed, the difference did not reach statistical significance (exact Fisher’s test: p = 0.10). The results are presented in Table 8.
5. Discussion
Pituitary neuroendocrine tumors are known to be variably infiltrated by different immune cells. The tumor immune microenvironment (TIME) and its clinical implications remain largely unexplored. The immune microenvironment could determine the biological and clinical behavior of a neoplasm and may have prognostic implications. Macrophages and T cells are principal immune infiltrates within the TIME. In the study by Vela-Patiño et al., characteristic expression profiles of genes associated with the immune system, including those encoding interleukins and chemokines, were identified for each tumor lineage [65]. Genes such as IL4-I1, IL-36A, TIRAP, IL-17REL, and CCL5 were upregulated in all PitNETs, while IL34, IL20RA, and IL-2RB characterized NR5A1, TBX19, and POU1F1 tumors, respectively. M2 macrophages, CD4+ T lymphocytes, CD8+ T lymphocytes, NK cells, and neutrophils can potentially infiltrate PitNET. [65].
Different subtypes of PitNETs display distinct immune patterns, influencing tumor progressive behaviors. PD-L1 on tumor cells binds to programmed cell death 1 (PD-1) on immune cells, contributing to tumor immune escape [66]. PD-L1 is the most extensively studied immune checkpoint. However, PD-L1 expression is regulated by various factors, leading to different meanings of PD-L1 positivity. The presence of PD-L1 in pituitary tumors may suggest potential sensitivity to immunotherapy (e.g., PD-1/PD-L1 inhibitors). When analyzing the results obtained in our study, it should be emphasized that the results may have been influenced by the small size of the patient group studied, as well as by large quantitative disparities between individual types of PitNETs. Positive PD-L1 expression (≥1%) was found in 53% of patients. In our group of patients, only in the case of PIT1 tumors was a statistically significant correlation with PDL-1 expression found (p≤0.05), i.e., an inverse correlation between the presence of PIT1 and PD-L1 expression was demonstrated. When analyzing individual types of PitNETs using a simplified division into no expression (TPS 0%) and positive expression (TPS ≥1%), certain trends were observed: gonadotropic tumors, which accounted for more than half of the entire group, showed positive PD-L1 expression (TPS >1%) in nearly 50% of cases. A similar trend was observed in corticotropic tumors, where PD-L1 was present in 62.5% of cases. In contrast, tumors such as somatotrophic, thyrotrophic, and most lactotrophic tumors did not show PD-L1 expression; however, it should be noted that these tumor types were isolated cases in our study. This fact may explain the inconsistency with the results of other studies [28].
It should be noted, however, that positive PD-L1 expression in our study group was null cell adenoma in all cases. When analyzing the optimal cut-off point, it should be noted that in our study group, TPS showed the highest effectiveness in predicting the presence of null cell adenoma, achieving AUC = 0.75 and sensitivity 1.00 at a TPS threshold ≥ 5%. The literature also describes increased PD-L1 expression in Silent Pituitary Adenoma [67]. When analyzing PDL1 expression according to hormonal activity, no statistically significant differences were found in our study, as in other studies [30,68]. However, there are studies confirming more frequent positive PDL expression in hormonally active tumors [34,69]. These differences may result from the nature of the group analyzed. Referring to the impact of PD-L1 on invasiveness based on multivariate analysis, our study showed that PD-L1 was the strongest factor influencing invasiveness (OR = 2.35; 95% CI: 0.56–9.90) among the factors studied, but the results were not statistically significant. A similar effect of PD-L1 on invasiveness has been described in the literature [31,34,67], but there are studies that do not confirm this relationship [29,30]. In our study, tumors with positive PD-L1 expression had a larger volume and maximum dimension, but this was not statistically significant. Similarly, other studies have not shown a statistically significant relationship between PDL1 expression and tumor size [29,30]. In summary, based on our study, it can be said that the relationship between PD-L1 and size, volume, and invasiveness remains controversial.
When analyzing the optimal cut off point for tumors derived from individual transcription factors, it should be noted that in our study group, TPS shows the highest effectiveness in predicting the presence of null cell adenoma. In the case of tumors from the PIT-1 lineage, TPS was found to be moderately useful as an indicator of PIT-1 presence. The lack of a significant association between PG-L1 and tumors from the PIT-1 lineage was also described in another study [63]. TPS also had limited usefulness in identifying SF1 lineage tumors. In the case of TPIT lineage tumors and tumors expressing more than two transcription factors (Multi PitNETs), TPS also proved to be of little use. In the case of Immature PIT-1 lineage tumors in our study, TPS was found to have limited ability to distinguish these tumors from others. For gonadotroph, TPS has very limited usefulness as a diagnostic marker. In corticotropic tumors, TPS ≥ 5% allowed for diagnosis with moderate sensitivity (0.63) and low specificity (0.59), with an AUC of only 0.50. This means that PD-L1 expression does not effectively differentiate these tumors from other types. In the case of mature PIT-1 lineage tumors, very high PD-L1 expression (TPS ≥ 85%) achieved moderate sensitivity (0.50) but very high specificity (0.98), with an AUC of 0.61. This means that only half of these tumors show such high TPS levels, but if this result occurs, it is almost synonymous with this diagnosis. However, it should be emphasized that the small number of these tumor types in our study may have influenced the results obtained.
When analyzing the Ki-67 results, it should be noted that patients with Ki-67≥3% were statistically significantly younger, which may be associated with a more aggressive tumor course in this group of patients. The Ki-67 index is an indicator of the active proliferation and aggressive behavior of PitNETs. The study by Wang et al. showed that age, rich blood supply to the tumor, and erosion of the dorsum sellae bone are influencing factors for predicting the Ki-67 index [70]. In addition, tumors with larger dimensions and greater volume were found in the Ki-67≥3% group, but this was not statistically significant in our study group. With regard to transcription factors, it should be noted that Ki-67<3% was more common in tumors from the PIT-1 (88.89%), tumors from the SF-1 (90.70%), tumors from the TPIT (75.00%), in 100% of null cell adenoma tumors, and in tumors expressing multiple trancriptions factors (81.82%), but this was not statistically significant. In individual PitNET types, KI67≥3% was found in isolated cases, i.e., in 1 case of Crook’s cell tumor, in 1 case of corticotroph SGCT, in 1 case of lactotroph PitNET in a male, in 1 case of immature PIT1-lineage PitNET, in 1 case of mature PIT-1 lineage PitNET, and in 1 case of multiple synchronous PitNET. Furthermore, it should also be noted that Ki≥3% was also found in 3 cases of gonadotroph PitNETs. When analyzing the relationship between Ki67 and invasiveness and hormonal activity, it should be noted that there were no statistically significant differences, which was also confirmed in another study [71].
Cyclin-D1 is an important cell cycle regulator and plays an important role as an oncoprotein in tumor proliferation. High levels of Cyclin-D1 are required to sustain tumor growth [72]. In our study, multivariate analysis showed that PD-L1 and Cyclin D1 are factors that increase the odds of tumor invasiveness (OR (95% CI) 2.35 (0.56–9.90) and 1.93 (0.42–8.84), respectively). The lack of statistical significance may result from the small size of the study group. In addition, Cyclin D1 expression ≥10% in our study was more common in hormone-inactive tumors (45.45%) than in hormone-active tumors (26.67%), which was also confirmed in another study [58]. With regard to individual transcription factors and PitNET types, it was found that they were more often characterized by cyclin expression <10%.
With regard to p53 protein, no significant effect on various tumor’s parameters was observed in our group. The literature also does not confirm the effect of p53 on tumor size and recurrence risk, but a link between this protein and cavernous sinus invasion has been confirmed [45].
The combined analysis of Cyclin D1 and P53 expression showed that all tumors (100%) in the group with high Cyclin D1 expression and low p53 expression (n=10) were invasive, while the combined anaysis of Ki-67 and p53 expression did not yield a distinct molecular or clinicopathological subgroup within the analyzed cohort (except age). This finding suggests a potential synergistic role of Cyclin D1 upregulation and p53 downregulation in driving tumor invasiveness, which may not be captured through Ki-67/p53 co-expression patterns alone. While Ki-67 is widely used as a general proliferation marker due to its expression across all active phases of the cell cycle (G1, S, G2, and M) and absence in quiescent (G0) cells, it does not provide mechanistic insights into the regulation of cell cycle entry or progression. In contrast, Cyclin D1 functions as a regulatory protein that plays a direct and active role in driving cell cycle progression through the G1 phase by activating cyclin-dependent kinases (CDK4/6), leading to phosphorylation of the retinoblastoma protein (pRb) and subsequent E2F-mediated transcription of S-phase genes. As such, Cyclin D1 not only reflects proliferative activity but also indicates upstream signaling events involved in cell cycle control, including those mediated by mitogenic stimuli or oncogenic pathways. These results underscore also the limitations of relying solely on proliferation and TP53 status for tumor stratification and support the utility of incorporating cell cycle regulators such as Cyclin D1 into biomarker panels for improved prognostic or predictive accuracy. Further validation in larger, independent cohorts is warranted.
Tumours with increased potential for aggressive behavior require a separate discussion. By definition, these are invasive tumours with extremely rapid growth despite optimal treatment. They are characterized by Ki>3%, often >10% and mitotic activity >2/10HPF [8]. In our database, there were 2 cases of Crook tumor, 2 cases of silent corticotroph tumor and 3 cases of plurihormonal PIT-1 positive tumors and 2 cases of male lactotroph tumor. A number of studies have confirmed high values of Ki-67 in aggressive silent corticotroph tumors [73, 74] and Crooke’s cell adenoma [75]. In addition, in our study, 3 cases of gonadotroph with Ki≥ 3% were found, which confirms that tumors of this type may also tend to behave aggressively, which is also described in the literature [76, 77]. Higher expression of PD-L1 in aggressive tumors has been reported in the literature [68] as well as higher expression of Cyclin D1 [53].
Finally, it is important to highlight the factors that limit our study. These are undoubtedly: the small size of the study group and the large discrepancy between the number of different types of PitNETs. Therefore, the results should be treated with caution. In our study, we analyzed a large amount of data, including histopathological data, immunohistochemical data on transcription factors, pituitary hormones, and four proteins, as well as radiological data on pituitary tumors. Therefore, we believe that our study may represent a valuable contribution to the current knowledge on the biological factors influencing the biological behavior of pituitary tumors and their course, and thus to the treatment outcomes. Undoubtedly, studies on a larger group of patients are necessary, especially regarding the role of PD-L1 and cyclin D1.
6. Conclusions
PD-L1 expression is present in some types of PitNETs, which may play a role in immunotherapy. Cyclin D1 may be a factor influencing the invasiveness of pituitary tumors, however, further studies are necessary in a larger group of patients to determine the impact of these factors on the course and biological behavior of PitNETs.
Author Contributions
Conceptualization, A.K.; B.B; methodology, A.K.; B.B.; validation, A.K.; B.B; formal analysis, A.M-G; investigation, A.K.; B.P.; K.W.; W.M.; F.J.; resources, A.K.; data curation, A.K.; A.M-G.; writing—original draft preparation, A.K.; A.M-G.; writing—review and editing, A.K., A.M-G.; B.B.; visualization, A.K. A.M-G.; supervision, A.K.; B.B.; F.G.; R.C; D.A.; project administration, A.K.; funding acquisition, F.G. All authors have read and agreed to the published version of the manuscript.”.
Funding
Our study was funded by the National Science Centre under the Student research clubs create innovations project No. SKN/SN/601666/2024.
Institutional Review Board Statement
The study was approved by the Bioethics Committee of the Andrzej Frycz Modrzewski Krakow University, permission No. KBKA/31/O/2024 on 06.06.2024.
Informed Consent Statement
All patients provided written informed consent to participate in the study after receiving a full explanation of the purpose and nature of all the procedures used.
Data availability
The datasets used and/or analyzed during the current study are available from the corresponding author upon a reasonable request.
Acknowledgments
The authors are grateful and would like to thank the neurosurgeons of the Neurosurgery Department of St. Raphael’s Hospital in Kraków for their help in interpreting the MRI images of the pituitary tumors. We are grateful to Edyta Radwanska, for excellent technical support and expertise in the field of immunohistochemistry.
Conflicts of interest
The authors declare that they have no conflict of interest.
References
- Molitch ME (2017) Diagnosis and treatment of pituitary adenomas: a review. JAMA 317:516–524. https ://doi.org/10.1001/Jama.2016.19699. [CrossRef]
- Melmed S. Pathogenesis of pituitary tumors. Nat Rev Endocrinol. 2011 May;7(5):257-66. doi: 10.1038/nrendo.2011.40. Epub 2011 Mar 22. Erratum in: Nat Rev Endocrinol. 2011 May;7(5):following 266. PMID: 21423242. [CrossRef]
- Melmed S, Kaiser UB, Lopes MB, Bertherat J, Syro LV, Raverot G, Reincke M, Johannsson G, Beckers A, Fleseriu M, Giustina A, Wass JAH, Ho KKY. Clinical Biology of the Pituitary Adenoma. Endocr Rev. 2022 Nov 25;43(6):1003-1037. doi: 10.1210/endrev/bnac010. PMID: 35395078; PMCID: PMC9695123. [CrossRef]
- Asa SL, Casar-Borota O, Chanson P, Delgrange E, Earls P, Ezzat S, Grossman A, Ikeda H, Inoshita N, Karavitaki N, Korbonits M, Laws ER Jr, Lopes MB, Maartens N, McCutcheon IE, Mete O, Nishioka H, Raverot G, Roncaroli F, Saeger W, Syro LV, Vasiljevic A, Villa C, Wierinckx A, Trouillas J; attendees of 14th Meeting of the International Pituitary Pathology Club, Annecy, France, November 2016. From pituitary adenoma to pituitary neuroendocrine tumor (PITNET): an International Pituitary Pathology Club proposal. Endocr Relat Cancer. 2017 Apr;24(4):C5-C8. doi: 10.1530/ERC-17-0004. PMID: 28264912. [CrossRef]
- Asa SL, Mete O, Perry A, Osamura RY. Overview of the 2022 WHO Classification of Pituitary Tumors. Endocr Pathol. 2022 Mar;33(1):6-26. doi: 10.1007/s12022-022-09703-7. Epub 2022 Mar 15. PMID: 35291028. [CrossRef]
- Raverot G, Dantony E, Beauvy J, et al. Risk of recurrence in pituitary neuroendocrine tumors: a prospective study using a five-tiered classification. J Clin Endocrinol Metab. 2017;102(9):3368-3374.
- Trouillas J, Roy P, Sturm N, et al. A new prognostic clinicopathological classification of pituitary adenomas: a multicentric case-control study of 410 patients with 8 years postoperative follow-up. Acta Neuropathol. 2013;126(1):123-135.
- Raverot G, Burman P, McCormack A, et al. European Society of Endocrinology Clinical Practice Guidelines for the management of aggressive pituitary tumours and carcinomas. Eur J Endocrinol. 2018;178(1):G1-G24.
- Dekkers OM, Karavitaki N, Pereira AM. The epidemiology of aggressive pituitary tumors (and its challenges). Rev Endocr Metab Disord. 2020;21(2):209-212.
- Cha JH, Chan LC, Li CW, Hsu JL, Hung MC. Mechanisms Controlling PD-L1 Expression in Cancer. Mol Cell. 2019 Nov 7;76(3):359-370. doi: 10.1016/j.molcel.2019.09.030. Epub 2019 Oct 24. PMID: 31668929; PMCID: PMC6981282. [CrossRef]
- Wang X, Teng F, Kong L, Yu J. PD-L1 expression in human cancers and its association with clinical outcomes. Onco Targets Ther. 2016 Aug 12;9:5023-39. doi: 10.2147/OTT.S105862. PMID: 27574444; PMCID: PMC4990391. [CrossRef]
- Hou J, Yu Z, Xiang R, et al. Correlation between infiltration of FOXP3+ regulatory T cells and expression of B7-H1 in the tumor tissues of gastric cancer. Exp Mol Pathol. 2014;96(3):284–291.
- Qing Y, Li Q, Ren T, Xia W, Peng Y, Liu GL, Luo H, Yang YX, Dai XY, Zhou SF, Wang D. Upregulation of PD-L1 and APE1 is associated with tumorigenesis and poor prognosis of gastric cancer. Drug Des Devel Ther. 2015 Feb 16;9:901-9. doi: 10.2147/DDDT.S75152. [CrossRef]
- Shi F, Shi M, Zeng Z, Qi RZ, Liu ZW, Zhang JY, Yang YP, Tien P, Wang FS. PD-1 and PD-L1 upregulation promotes CD8(+) T-cell apoptosis and postoperative recurrence in hepatocellular carcinoma patients. Int J Cancer. 2011 Feb 15;128(4):887-96. doi: 10.1002/ijc.25397. [CrossRef]
- Thompson RH, Gillett MD, Cheville JC, Lohse CM, Dong H, Webster WS, Chen L, Zincke H, Blute ML, Leibovich BC, Kwon ED. Costimulatory molecule B7-H1 in primary and metastatic clear cell renal cell carcinoma. Cancer. 2005 Nov 15;104(10):2084-91. doi: 10.1002/cncr.21470. [CrossRef]
- Ohigashi Y, Sho M, Yamada Y, Tsurui Y, Hamada K, Ikeda N, Mizuno T, Yoriki R, Kashizuka H, Yane K, Tsushima F, Otsuki N, Yagita H, Azuma M, Nakajima Y. Clinical significance of programmed death-1 ligand-1 and programmed death-1 ligand-2 expression in human esophageal cancer. Clin Cancer Res. 2005 Apr 15;11(8):2947-53. doi: 10.1158/1078-0432.CCR-04-1469. [CrossRef]
- Wang L, Ma Q, Chen X, Guo K, Li J, Zhang M. Clinical significance of B7-H1 and B7-1 expressions in pancreatic carcinoma. World J Surg. 2010 May;34(5):1059-65. doi: 10.1007/s00268-010-0448-x. [CrossRef]
- Peng Z, Li M, Li H, Gao Q. PD-1/PD-L1 immune checkpoint blockade in ovarian cancer: Dilemmas and opportunities. Drug Discov Today. 2023 Aug;28(8):103666. doi: 10.1016/j.drudis.2023.103666. [CrossRef]
- Ghosh S, Nataraj NB, Noronha A, Patkar S, Sekar A, Mukherjee S, Winograd-Katz S, Kramarski L, Verma A, Lindzen M, Garcia DD, Green J, Eisenberg G, Gil-Henn H, Basu A, Lender Y, Weiss S, Oren M, Lotem M, Geiger B, Ruppin E, Yarden Y. PD-L1 recruits phospholipase C and enhances tumorigenicity of lung tumors harboring mutant forms of EGFR. Cell Rep. 2021 May 25;35(8):109181. doi: 10.1016/j.celrep.2021.109181. [CrossRef]
- Luo Y, Ma S, Sun Y, Peng S, Zeng Z, Han L, Li S, Sun W, Xu J, Tian X, Wang F, Wu Q, Xiao Y, Zhang J, Gong Y, Xie C. MUC3A induces PD-L1 and reduces tyrosine kinase inhibitors effects in EGFR-mutant non-small cell lung cancer. Int J Biol Sci. 2021 Apr 12;17(7):1671-1681. doi: 10.7150/ijbs.57964. [CrossRef]
- Deng H, Zhao Y, Cai X, Chen H, Cheng B, Zhong R, Li F, Xiong S, Li J, Liu J, He J, Liang W. PD-L1 expression and Tumor mutation burden as Pathological response biomarkers of Neoadjuvant immunotherapy for Early-stage Non-small cell lung cancer: A systematic review and meta-analysis. Crit Rev Oncol Hematol. 2022 Feb;170:103582. doi: 10.1016/j.critrevonc.2022.103582. Epub 2022 Jan 11. [CrossRef]
- Kaunitz GJ, Cottrell TR, Lilo M, Muthappan V, Esandrio J, Berry S, Xu H, Ogurtsova A, Anders RA, Fischer AH, Kraft S, Gerstenblith MR, Thompson CL, Honda K, Cuda JD, Eberhart CG, Handa JT, Lipson EJ, Taube JM. Melanoma subtypes demonstrate distinct PD-L1 expression profiles. Lab Invest. 2017 Sep;97(9):1063-1071. doi: 10.1038/labinvest.2017.64. [CrossRef]
- Dell’Aquila M, Granitto A, Martini M, Capodimonti S, Cocomazzi A, Musarra T, et al. PD-L1 and thyroid cytology: A possible diagnostic and prognostic marker. Cancer Cytopathol.2020; 128:177–89. doi: 10.1002/cncy.22224. [CrossRef]
- Mei Y, Bi WL, Greenwald NF et al. (2016) Increased expression of programmed death ligand 1 (PD-L1) in human pituitary tumors. Oncotarget 7:76565–76576. https ://doi.org/10.18632 /oncot arget .12088. [CrossRef]
- Salomon MP, Wang X, Marzese DM et al. (2018) The epigenomic landscape of pituitary adenomas reveals specific alterations and differentiates among acromegaly, Cushing’s disease and endocrine-inactive subtypes. Clin Cancer Res 24:4126–4136. https:// doi.org/10.1158/1078-0432.CCR-17-2206. [CrossRef]
- Wang P, Wang T, Yang Y et al. (2018) The expression profile of PD-L1 and CD8 + lymphocyte in pituitary adenomas indicating for immunotherapy. J Neurooncol 139:89–95. https://doi. org/10.1007/s11060-018-2844-2.
- Sato M, Tamura R, Tamura H et al. (2019) Analysis of tumor angiogenesis and immune microenvironment in non-functional pituitary endocrine tumors. J Clin Med. https://doi.org/10.3390/ jcm8050695. [CrossRef]
- Harel E, Hewer E, La Rosa S, Brouland JP, Pitteloud N, Santoni F, Brunner M, Daniel RT, Messerer M, Cossu G. PD-L1 expression in PITNETs: Correlations with the 2022 WHO classification. Brain Spine. 2024 Dec 24;5:104171. doi: 10.1016/j.bas.2024.104171. [CrossRef]
- Cossu, G.; La Rosa, S.; Brouland, J.P.; Pitteloud, N.; Harel, E.; Santoni, F.; Brunner, M.; Daniel, R.T.; Messerer, M. PD-L1 Expression in Pituitary Neuroendocrine Tumors/Pituitary Adenomas. Cancers 2023, 15, 4471. https://doi.org/10.3390/cancers15184471. [CrossRef]
- Suteau V, Collin A, Menei P, Rodien P, Rousselet MC, Briet C. Expression of programmed death-ligand 1 (PD-L1) in human pituitary neuroendocrine tumor. Cancer Immunol Immunother. 2020 Oct;69(10):2053-2061. doi: 10.1007/s00262-020-02611-x. Epub 2020 May 22. [CrossRef]
- Luo M, Tang R, Wang H. Tumor immune microenvironment in pituitary neuroendocrine tumors (PITNETs): increased M2 macrophage infiltration and PD-L1 expression in PIT1-lineage subset. J Neurooncol. 2023 Jul;163(3):663-674. doi: 10.1007/s11060-023-04382-8. [CrossRef]
- Guo X, Yang Y, Qian Z, Chang M, Zhao Y, Ma W, Wang Y, Xing B. Immune landscape and progress in immunotherapy for pituitary neuroendocrine tumors. Cancer Lett. 2024 Jun 28;592:216908. doi: 10.1016/j.canlet.2024.216908. [CrossRef]
- Shi M, Song Y, Zhang Y, Li L, Yu J, Hou A and Han S (2023) PD-L1 and tumor-infiltrating CD8+ lymphocytes are correlated with clinical characteristics in pediatric and adolescent pituitary adenomas. Front. Endocrinol. 14:1151714. doi: 10.3389/fendo.2023.1151714. [CrossRef]
- Guo X, Yang Y, Qian Z, Chang M, Zhao Y, Ma W, Wang Y, Xing B. Immune landscape and progress in immunotherapy for pituitary neuroendocrine tumors. Cancer Lett. 2024 Jun 28;592:216908. doi: 10.1016/j.canlet.2024.216908. [CrossRef]
- Xu Y, Song G, Xie S, Jiang W, Chen X, Chu M, Hu X, Wang ZW. The roles of PD-1/PD-L1 in the prognosis and immunotherapy of prostate cancer. Mol Ther. 2021 Jun 2;29(6):1958-1969. doi: 10.1016/j.ymthe.2021.04.029. [CrossRef]
- Mehdizadeh S, Bayatipoor H, Pashangzadeh S, Jafarpour R, Shojaei Z, Motallebnezhad M. Immune checkpoints and cancer development: Therapeutic implications and future directions. Pathol Res Pract. 2021 Jul;223:153485. doi: 10.1016/j.prp.2021.153485. [CrossRef]
- Raverot G, Ilie MD. Immunotherapy in pituitary carcinomas and aggressive pituitary tumors. Best Pract Res Clin Endocrinol Metab. 2022 Dec;36(6):101712. doi: 10.1016/j.beem.2022.101712. [CrossRef]
- Ilie MD, Vasiljevic A, Jouanneau E, Raverot G. Immunotherapy in aggressive pituitary tumors and carcinomas: a systematic review. Endocr Relat Cancer. 2022 May 27;29(7):415-426. doi: 10.1530/ERC-22-0037. [CrossRef]
- Lopes-Pinto M, Lacerda-Nobre E, Silva AL, Marques P. Therapeutical Usefulness of PD-1/PD-L1 Inhibitors in Aggressive or Metastatic Pituitary Tumours. Cancers (Basel). 2024 Aug 30;16(17):3033. doi: 10.3390/cancers16173033. [CrossRef]
- Gruppetta M, Formosa R, Falzon S, Ariff Scicluna S, Falzon E, Degeatano J, Vassallo J. Expression of cell cycle regulators and biomarkers of proliferation and regrowth in human pituitary adenomas. Pituitary. 2017 Jun;20(3):358-371. doi: 10.1007/s11102-017-0803-0. [CrossRef]
- Gejman R, Swearingen B, Hedley-Whyte ET (2008) Role of Ki-67 proliferation index and p53 expression in predicting progression of pituitary adenomas. Hum Pathol 39:758–766. https ://doi. org/10.1016/j.humpath.2007.10.004. [CrossRef]
- Salehi F, Agur A, Scheithauer BW, Kovacs K, Lloyd RV, Cusimano M. Ki-67 in pituitary neoplasms: a review--part I. Neurosurgery. 2009 Sep;65(3):429-37; discussion 437. doi: 10.1227/01.NEU.0000349930.66434.82. [CrossRef]
- Del Basso De Caro M, Solari D, Pagliuca F, Villa A, Guadagno E, Cavallo LM, Colao A, Pettinato G, Cappabianca P. Atypical pituitary adenomas: clinical characteristics and role of ki-67 and p53 in prognostic and therapeutic evaluation. A series of 50 patients. Neurosurg Rev. 2017 Jan;40(1):105-114. doi: 10.1007/s10143-016-0740-9. [CrossRef]
- Honegger J, Prettin C, Feuerhake F, Petrick M, Schulte-Mönting J, Reincke M. Expression of Ki-67 antigen in nonfunctioning pituitary adenomas: correlation with growth velocity and invasiveness. J Neurosurg. 2003 Oct;99(4):674-9. doi: 10.3171/jns.2003.99.4.0674. [CrossRef]
- Hasanov R, Aydoğan Bİ, Kiremitçi S, Erden E, Güllü S. The Prognostic Roles of the Ki-67 Proliferation Index, P53 Expression, Mitotic Index, and Radiological Tumor Invasion in Pituitary Adenomas. Endocr Pathol. 2019 Mar;30(1):49-55. doi: 10.1007/s12022-018-9563-2. [CrossRef]
- Petry C, Poli JHZ, de Azevedo Dossin I, Rech CGSL, Pereira Lima JFS, Ferreira NP, da Costa Oliveira M. Evaluation of the potential of the Ki67 index to predict tumor evolution in patients with pituitary adenoma. Int J Clin Exp Pathol. 2019 Jan 1;12(1):320-326.
- Matoušek P, Buzrla P, Reguli Š, Krajča J, Dvořáčková J, Lipina R. Factors That Predict the Growth of Residual Nonfunctional Pituitary Adenomas: Correlations between Relapse and Cell Cycle Markers. Biomed Res Int. 2018 Jul 10;2018:1876290. doi: 10.1155/2018/1876290. PMID: 30112364; PMCID: PMC6077672. [CrossRef]
- Mete O, Cintosun A, Pressman I, Asa SL. Epidemiology and biomarker profile of pituitary adenohypophysial tumors. Mod Pathol. 2018 Jun;31(6):900-909. doi: 10.1038/s41379-018-0016-8. [CrossRef]
- Rak B, Maksymowicz M, Pękul M, Zieliński G. Clinical, Biological, Radiological Pathological and Immediate Post-Operative Remission of Sparsely and Densely Granulated Corticotroph Pituitary Tumors: A Retrospective Study of a Cohort of 277 Patients With Cushing’s Disease. Front Endocrinol (Lausanne). 2021 May 31;12:672178. doi: 10.3389/fendo.2021.672178. [CrossRef]
- George DH, Scheithauer BW, Kovacs K, Horvath E, Young WF Jr, Lloyd RV, Meyer FB. Crooke’s cell adenoma of the pituitary: an aggressive variant of corticotroph adenoma. Am J Surg Pathol. 2003 Oct;27(10):1330-6. doi: 10.1097/00000478-200310000-00005. [CrossRef]
- Osamura RY, Inomoto C, Tahara S, Oyama KI, Matsuno A, Teramoto A. Pathology of Crooke Cells in the Human Pituitaries: A Timely Review. Appl Immunohistochem Mol Morphol. 2023 Aug 1;31(7):485-489. doi: 10.1097/PAI.0000000000001070. Epub 2022 Oct 17. [CrossRef]
- Raymond P, Raverot G, Ilie MD. Outcome and prognostic factors for pituitary carcinomas: lessons from a systematic review. Endocr Relat Cancer. 2023 Mar 31;30(5):e220338. doi: 10.1530/ERC-22-0338. [CrossRef]
- Jordan S, Lidhar K, Korbonits M, Lowe DG, Grossman AB. Cyclin D1 and cyclin E expression in normal and adenomatous pituitary. Eur J Endocrinol. 2000 Jul;143(1):R1-6. doi: 10.1530/eje.0.143r001. PMID: 10870044. [CrossRef]
- Tani Y, Inoshita N, Sugiyama T, Kato M, Yamada S, Shichiri M, Hirata Y. Upregulation of CDKN2A and suppression of cyclin D11 gene expressions in ACTH-secreting pituitary adenomas. Eur J Endocrinol. 2010 Oct;163(4):523-9. doi: 10.1530/EJE-10-0245. Epub 2010 Jul 8. PMID: 20616110. [CrossRef]
- Turner HE, Nagy Z, Sullivan N, Esiri MM, Wass JA. Expression analysis of cyclins in pituitary adenomas and the normal pituitary gland. Clin Endocrinol (Oxf). 2000 Sep;53(3):337-44. doi: 10.1046/j.1365-2265.2000.01088.x. PMID: 10971451. [CrossRef]
- Fedele M, Fusco A. Role of the high mobility group A proteins in the regulation of pituitary cell cycle. J Mol Endocrinol. 2010 Jun;44(6):309-18. doi: 10.1677/JME-09-0178. Epub 2010 Mar 10. PMID: 20219853. [CrossRef]
- Stefanidis P, Kyriakopoulos G, Seretis AM, Korfias S, Theocharis S, Angelousi A. Prognostic Factors for Invasiveness and Recurrence of Pituitary Adenomas: A Series of 94 Patients. Diagnostics (Basel). 2022 Oct 5;12(10):2413. doi: 10.3390/diagnostics12102413. PMID: 36292101; PMCID: PMC9600140. [CrossRef]
- Hibberts NA, Simpson DJ, Bicknell JE, Broome JC, Hoban PR, Clayton RN, Farrell WE. Analysis of cyclin D11 (CCND1) allelic imbalance and overexpression in sporadic human pituitary tumors. Clin Cancer Res. 1999 Aug;5(8):2133-9. PMID: 10473097.
- Hewedi IH, Osman WM, El Mahdy MM. Differential expression of cyclin D11 in human pituitary tumors: relation to MIB-1 and p27/Kip1 labeling indices. J Egypt Natl Canc Inst. 2011 Dec;23(4):171-9. doi: 10.1016/j.jnci.2011.11.003. Epub 2011 Dec 29. PMID: 22776845. [CrossRef]
- Tóth M. Agresszív hypophysisadenoma és hypophysiscarcinoma [Aggressive pituitary adenoma and pituitary carcinoma]. Orv Hetil. 2023 Jul 30;164(30):1167-1175. Hungarian. doi: 10.1556/650.2023.32832. [CrossRef]
- Yagnik G, Jahangiri A, Chen R, Wagner JR, Aghi MK. Role of a p53 polymorphism in the development of nonfunctional pituitary adenomas. Mol Cell Endocrinol. 2017 May 5;446:81-90. doi: 10.1016/j.mce.2017.02.017. Epub 2017 Feb 16. PMID: 28214592; PMCID: PMC5553295. [CrossRef]
- Thapar K, Scheithauer BW, Kovacs K, Pernicone PJ, Laws ER Jr. p53 expression in pituitary adenomas and carcinomas: correlation with invasiveness and tumor growth fractions. Neurosurgery. 1996 Apr;38(4):765-70; discussion 770-1. PMID: 8692397.
- Saeger W, Mawrin C, Meinhardt M, Wefers AK, Jacobsen F. Two Pituitary Neuroendocrine Tumors (PITNETs) with Very High Proliferation and TP53 Mutation - High-Grade PITNET or PitNEC? Endocr Pathol. 2022 Jun;33(2):257-262. doi: 10.1007/s12022-021-09693-y. Epub 2021 Oct 20. Erratum in: Endocr Pathol. 2022 Jun;33(2):263. doi: 10.1007/s12022-021-09699-6. PMID: 34669159; PMCID: PMC9135791. [CrossRef]
- Liu, X., 2012. Classification accuracy and cut point selection. Stat. Med. 31 (23), 2676–2686. https://doi.org/10.1002/sim.4509. [CrossRef]
- Vela-Patiño S, Salazar MI, Taniguchi-Ponciano K, Vadillo E, Gomez-Apo E, Escobar-España A, Perez-Koldenkova V, Bonifaz L, Aguilar-Flores C, Marrero-Rodríguez D, Mercado M. The Immune Microenvironment Landscape of Pituitary NeuroEndocrine Tumors, a Transcriptomic Approach. Genes (Basel). 2024 Apr 24;15(5):531. doi: 10.3390/genes15050531. PMID: 38790160; PMCID: PMC11120841. [CrossRef]
- Yi M, Niu M, Xu L, Luo S, Wu K. Regulation of PD-L1 expression in the tumor microenvironment. J Hematol Oncol. 2021 Jan 7;14(1):10. doi: 10.1186/s13045-020-01027-5. PMID: 33413496; PMCID: PMC7792099. [CrossRef]
- Uraki S, Ariyasu H, Doi A, Takeshima K, Morita S, Inaba H, Furuta H, Fukuhara N, Inoshita N, Nishioka H, Nakao N, Yamada S, Akamizu T. MSH6/2 and PD-L1 Expressions Are Associated with Tumor Growth and Invasiveness in Silent Pituitary Adenoma Subtypes. Int J Mol Sci. 2020 Apr 18;21(8):2831. doi: 10.3390/ijms21082831. PMID: 32325698; PMCID: PMC7215962. [CrossRef]
- Xi Z, Jones PS, Mikamoto M, Jiang X, Faje AT, Nie C, Labelle KE, Zhou Y, Miller KK, Soberman RJ, Zhang X. The Upregulation of Molecules Related to Tumor Immune Escape in Human Pituitary Adenomas. Front Endocrinol (Lausanne). 2021 Oct 21;12:726448. doi: 10.3389/fendo.2021.726448. PMID: 34745002; PMCID: PMC8566912. [CrossRef]
- Mei Y, Bi WL, Agolia J, Hu C, Giantini Larsen AM, Meredith DM, Al Abdulmohsen S, Bale T, Dunn GP, Abedalthagafi M, Dunn IF. Immune profiling of pituitary tumors reveals variations in immune infiltration and checkpoint molecule expression. Pituitary. 2021 Jun;24(3):359-373. doi: 10.1007/s11102-020-01114-3. Epub 2021 Jan 25. PMID: 33492612. [CrossRef]
- Wang X, Li M, Jiang X, Wang F, Ling S, Niu C. Prediction of Higher Ki-67 Index in Pituitary Adenomas by Pre- and Intra-Operative Clinical Characteristics. Brain Sci. 2022 Jul 28;12(8):1002. doi: 10.3390/brainsci12081002. PMID: 36009065; PMCID: PMC9405805. [CrossRef]
- Grimm F, Maurus R, Beschorner R, Naros G, Stanojevic M, Gugel I, Giese S, Bier G, Bender B, Honegger J. Ki-67 labeling index and expression of p53 are non-predictive for invasiveness and tumor size in functional and nonfunctional pituitary adenomas. Acta Neurochir (Wien). 2019 Jun;161(6):1149-1156. doi: 10.1007/s00701-019-03879-4. Epub 2019 Apr 30. PMID: 31037500. [CrossRef]
- Hibberts, N.A.; Simpson, D.J.; Bicknell, J.E.; Broome, J.C.; Hoban, P.R.; Clayton, R.N.; Farrell, W.E. Analysis of cyclin D11 (CCND1) allelic imbalance and overexpression in sporadic human pituitary tumors. Clin. Cancer Res. 1999, 5, 2133–2139. [PubMed].
- Flores L, Sleightholm R, Neilsen B, Baine M, Drincic A, Thorell W, Shonka N, Oupicky D, Zhang C. Highly Aggressive and Radiation-Resistant, “Atypical” and Silent Pituitary Corticotrophic Carcinoma: A Case Report and Review of the Literature. Case Rep Oncol. 2019 Feb 8;12(1):139-146. doi: 10.1159/000496019. PMID: 31043952; PMCID: PMC6477470. [CrossRef]
- Lasolle H, Vasiljevic A, Jouanneau E, Ilie MD, Raverot G. Aggressive corticotroph tumors and carcinomas. J Neuroendocrinol. 2022 Aug;34(8):e13169. doi: 10.1111/jne.13169. Epub 2022 Aug 18. PMID: 35979732; PMCID: PMC9542524. [CrossRef]
- Kovacs K, Diep CC, Horvath E, Cusimano M, Smyth H, Lombardero CC, Scheithauer BW, Lloyd RV. Prognostic indicators in an aggressive pituitary Crooke’s cell adenoma. Can J Neurol Sci. 2005 Nov;32(4):540-5. doi: 10.1017/s0317167100004583. PMID: 16408589. [CrossRef]
- Ilie MD, Raverot G. Treatment Options for Gonadotroph Tumors: Current State and Perspectives. J Clin Endocrinol Metab. 2020 Oct 1;105(10):dgaa497. doi: 10.1210/clinem/dgaa497. PMID: 32735647. [CrossRef]
- Gandhi C, Koumna S, Chik C. Treatment of an Aggressive Gonadotroph Pituitary Neuroendocrine Tumor With 177Lutetium DOTATATE Radionuclide Therapy. JCEM Case Rep. 2024 Jul 15;2(7):luae123. doi: 10.1210/jcemcr/luae123. PMID: 39011402; PMCID: PMC11247163. [CrossRef]

Table 1.
Demographic, radiological and immunohistochemical characteristics of the study group (n=74).
Table 1.
Demographic, radiological and immunohistochemical characteristics of the study group (n=74).
| Characteristic | N (%) |
|---|---|
| Age (years) | |
| Mean (SD); Me (Q1-Q3) | 57.4 (14.0); 60.5 (47.0–69.0) |
| Gender | |
| F/M | 29 (39.2%)/45 (60.8%) |
| Tumor size | |
| Microadenoma | 1 (1.4%) |
| Macroadenoma | 72 (97.3%) |
| Missing | 1 (1.4%) |
| Gigant adenoma (>40mm) | |
| No | 62 (83.8%) |
| Yes | 11 (14.9%) |
| Missing | 1 (1.4%) |
| Tumor volume (cm³) | |
| Mean (SD); Me (Q1-Q3) | 8.6 (8.9); 5.0 (3.1–10.2) |
| Max size of tumor (mm) | |
| Mean (SD); Me (Q1-Q3) | 28.6 (10.2); 25.0 (21.5–34.0) |
| Transcriptions factors | |
| PIT-1 | 9 (12.2%) |
| SF1 | 43 (58.1%) |
| TPIT | 8 (10.8%) |
| PitNETs with no distinct cel lineage | 3 (4.1%) |
| Multiple PitNETs | 11 (14.9%) |
| Hormonal activity | |
| Non - active | 59 (79.7%) |
| Active | 15 (20.3%) |
| Type of PitNETs | |
| Gonadotroph | 42 (56.8%) |
| Gonadotroph/lactotroph | 2 (2.7%) |
| Corticotroph | 8 (10.8%) |
| Lactotroph | 4 (5.4%) |
| Somatotroph | 1 (1.4%) |
| Tyrotroph | 1 (1.4%) |
| Null cell adenoma | 3 (4.1%) |
| Multiple synchronous PITNET | 4 (5.4%) |
| Immature PIT-lineage tumor | 6 (8.1%) |
| Mature PIT-1 lineage tumor | 3 (4.1%) |
| PDL-1 (TPS) | |
| 0% | 31 (41.9%) |
| ≥1% | 35 (47.3%) |
| Missing | 8 (10.8%) |
| Proliferative factors | |
| P53 | |
| <10% | 34 (45.9%) |
| ≥10% | 33 (44.6%) |
| Missing | 7 (9.5%) |
| Ki-67 | |
| <3% | 65 (87.8%) |
| ≥3% | 9 (12.2%) |
| Cyclin D1 | |
| <10% | 41 (55.4%) |
| ≥10% | 29 (39.2%) |
| Missing | 4 (5.4%) |
| Knosp scale | |
| Invasive | 38 (51.4%) |
| Non-invasive | 34 (45.9%) |
| Missing | 2 (2.7%) |
| Hardy scale | |
| Invasive | 57 (77.0%) |
| Non-invasive | 15 (20.3%) |
| Missing | 2 (2.7%) |
| Overall invasiveness | |
| No | 14 (18.9%) |
| Yes | 58 (78.4%) |
| Missing | 2 (2.7%) |
Legend: PitNET(s): Pituitary neuroendocrine tumor(s). TF, transcription factor(s); PD-L1, Programmed death-ligand 1; TPS, Tumor Proportion Score; PIT-1, pituitary-specific positive transcription factor 1; TPIT, T-box transcription factor. SF-1, The steroidogenic factor 1 transcription factor. Multiple PitNETs; tumours expressing ≥2 transcription factors (Multiple synchronous tumor, Immature PIT-1 lineage tumor, Mature Pit-1 lineage tumor, Gonadotroph/lactotroph).
Table 2.
PitNETs characteristics according to expression levels of PD-L1 (n=66, no date – 8 cases), P53 (n = 67, no date -7 cases), Ki-67 (n = 74 ) and cyclin D1 (n=70, no date -4 cases).
Table 2.
PitNETs characteristics according to expression levels of PD-L1 (n=66, no date – 8 cases), P53 (n = 67, no date -7 cases), Ki-67 (n = 74 ) and cyclin D1 (n=70, no date -4 cases).
| Feature | PD-L1 | Ki-67 | P 53 | Cyclin D1 | ||||||||
|---|---|---|---|---|---|---|---|---|---|---|---|---|
| <1% (n=31) N (%) |
≥1% (n=35) N (%) |
p- value |
<3% (n=65) N (%) |
≥3 (n=9) N (%) |
p- value |
<10% (n=34) N (%) |
≥10% (n=33) N (%) |
p-value | <10% (n=41) N (%) |
≥10% (n=29) N (%) |
p-value | |
| Age (years) | 0. 59ᵠ | 0.03ᵠ | 0.57ᵠ | 0.38ᵠ | ||||||||
| Me (Q1-Q3) | 59.0 (43.0-70.0) |
60.0 (52.0–68.0) |
62.0 (50.0–69.0) |
41.0 (36.0–57.0) |
62.0 (53.0-70.0) |
61.0 (45.0-67.0) |
57.0 (49.0-68.0) |
62.0 (47.0-68.0) | ||||
| Gender | 0.91ᵡ | 0.08ᵟ | 0.73ᵡ | 0.77ᵡ | ||||||||
| Female | 12 (46.2) | 14 (53.8) | 28 (96.5) | 1 (3.45) | 13 (48.1) | 14 (51.8) | 17 (60.71) | 11 (39.29) | ||||
| Male | 19 (47.5) | 21 (52.5) | 37 (82.2) | 8 (17.78) | 21 (52.5) | 19 (47.5) | 24 (57.14) | 18 (42.86) | ||||
|
Tumor volume [cm3] |
0.55ᵠ | 0.96ᵠ | 0.41ᵠ | 0.31ᵠ | ||||||||
| Me (Q1-Q3) | 4.6 (2.1-10.0) |
6.2 (3.2–10.0) |
4.8 (3.1–10.2) |
7.3 (2.8–11.0) |
5.2 (2.8-10.0) |
7.3 (3.8-11.5) |
4.3 (2.8–9.0) |
8.1 (3.1–12.3) |
||||
| Max size (mm) | 0.59ᵠ | 0.94ᵠ | 0.59ᵠ | 0.86ᵠ | ||||||||
| Me (Q1-Q3) | 23.0 (22.5-34.0) |
30.0 (22.0–34.0) |
25.0 (22.0–33.0) |
29.0 (20.0–36.0) |
28.5 (22.5-34.0) |
25.5 (20.8-33.0) |
25.0 (21.0-34.0) |
26.8 (22.3-33.0) |
||||
|
Gigant adenoma (>40mm) |
1.00ᵡ | 0.62ᵟ | 0.92ᵡ | 0.76ᵡ | ||||||||
| No | 27 (47.4) | 30 (52.6) | 55 (52.1) | 7 (47.9) | 29 (51.0) | 27 (49.0) | 34 (58.6) | 24 (41.4) | ||||
| Yes | 4 (50.0) | 4 (50.0) | 9 (38.3) | 2 (61.7) | 5 (49.2) | 5 (50.8) | 7 (63.6) | 4 (36.4) | ||||
| Missing | 0 (0.0) | 1 (100.0) | 1 (100.0) | 0 (0.0) | 0 (0.0) | 1 (100.0) | 0 (0.0) | 1(100) | ||||
| PIT-1 overexpression | <0.05ᵟ | 1.00ᵟ | 1.00ᵟ | 0.73ᵟ | ||||||||
| No | 25 (42.4) | 34 (57.6) | 57 (87.7) | 8 (12.3) | 30 (50.0) | 30 (50.0) | 35 (57.38) | 26 (42.62) | ||||
| Yes | 6 (85.7) | 1 (14.3) | 8 (88.9) | 1 (11.1) | 4 (57.1) | 3 (42.9) | 6 (66.67) | 3 (33.33) | ||||
| SF1 overexpression | 0.34ᵡ | 0.48ᵟ | 0.36ᵡ | 0.09ᵡ | ||||||||
| No | 16 (53.3) | 14 (46.7) | 26 (83.87) | 5 (16.13) | 15 (57.7) | 11 (42.3) | 21 (67.74) | 9 (29.03) | ||||
| Yes | 15 (41.7) | 21 (58.3) | 39 (90.70) | 4 (9.30) | 19 (46.3) | 22 (53.7) | 20 (50.00) | 20 (50.00) | ||||
| TPIT oveexpression | 0.71ᵟ | 0.25ᵟ | 1.00ᵟ | 0.54ᵡ | ||||||||
| No | 28 (48.3) | 30 (51.7) | 59 (89.39) | 7 (10.61) | 30 (50.8) | 29 (49.2) | 35 (56.45) | 27 (43.55) | ||||
| Yes | 3 (37.5) | 5 (62.5) | 6 (75.00) | 2 (25.00) | 4 (50.0) | 4 (50.0) | 6 (75.00) | 2 (25.00) | ||||
| PitNETs with no distinct cell lineage | 0.24ᵟ | 1.00ᵟ | 0.49ᵟ | 0.51ᵟ | ||||||||
| No | 30 (49.23) | 31 (50.8) | 62 (87.35) | 9 (12.65) | 32 (49.2) | 33 (50.8) | 39 (57.35) | 29 (42.65) | ||||
| Yes | 1 (20.0) | 4 (80.0) | 3 (100.00) | 0 (0.00) | 2 (100.0) | 0 (0.0) | 2 (100.00) | 0 (0.00) | ||||
| Multiple PitNETs | 0.72ᵟ | 0.62ᵟ | 0.24ᵟ | 1.00ᵟ | ||||||||
| No | 25 (44.6) | 31 (55.4) | 56 (86.15) | 7 (13.85) | 29 (50.0) | 29 (50.0) | 34 (57.6) | 25 (42.4) | ||||
| Yes | 6 (60.0) | 4 (40.0) | 9 (81.82) | 2 (18.18) | 5 (55.6) | 4 (44.4) | 7 (63.6) | 4 (36.4) | ||||
| Type of PitNETs | - | - | - | - | ||||||||
| Gonadotroph | 17 (44.7) | 21 (55.3) | 39 (92.86) | 3 (7.14) | 19 (47.5) | 21 (52.5) | 20 (51.3) | 19 (48.7) | ||||
| Gonadotroph/Lactotroph | 0 (0.0) | 2 (100.0) | 2 (100.00) | 0 (0.00) | 1 (100.0) | 0 (0.0) | 2 (100.0) | 0 (0.0) | ||||
| Corticotroph | 3 (37.5) | 5 (62.5) | 6 (75.00) | 2 (25.00) | 4 (50.0) | 4 (50.0) | 6 (75.0) | 2 (25.0) | ||||
| Lactotroph | 3 (100.0) | 0 (0.0) | 3 (75.00) | 1 (25.00) | 2 (50.0) | 2 (50.0) | 3 (75.0) | 1 (25.0) | ||||
| Somatroph | 1 (100.0) | 0 (0.0) | 1 (100.00) | 0 (0.00) | 0 (0.0) | 0 (0.0) | 0 (0.0) | 1 (100.0) | ||||
| Tyrotroph | 1 (100.0) | 0 (0.0) | 1 (100.00) | 0 (0.00) | 1 (100.0) | 0 (0.0) | 1 (100.0) | 0 (0.0) | ||||
| Null cell adenoma | 0 (0.0) | 3 (100.0) | 3 (100.00) | 0 (0.00) | 2 (100.0) | 0 (0.0) | 2 (100.0) | 0 (0.0) | ||||
| Multiple synchronous PitNET | 1 (33.3) | 2 (66.7) | 3 (75.00) | 1 (25.00) | 2 (50.0) | 2 (50.0) | 2 (50.0) | 2 (50.0) | ||||
| Immature PIT-lineage tumour | 4 (80.0) | 1 (20.0) | 5 (83.33) | 1 (16.67) | 2 (40.00) |
3 (60.0) |
4 (66.7 | 2 (33.3) | ||||
| Mature PIT-lineage tumor | 1 (50.0) | 1 (50.0) | 2 (66.67) | 1 (33.33) | 1 (50. 0) | 1 (50.0) | 1 (33.3) | 2 (66.7) | ||||
| Hormonal activity, | 0.24ᵡ | 0.38ᵟ | 0.14ᵡ | 0.19ᵡ | ||||||||
| Non-active | 23 (43.4) | 30 (56.6) | 53 (89.8) | 6 (10.2) | 25 (46.3) | 29 (53.7) | 30 (54.5) | 25 (45.5) | ||||
| Active | 8 (61.5) | 5 (38.5) | 12 (80.00) | 3 (20.0) | 9 (69.2) | 4 (30.8) | 11 (73.2) | 4 (26.67) | ||||
| Knosp scale | 0.31ᵡ | 0.73ᵟ | 0.88ᵡ | 0.91ᵡ | ||||||||
| Invasive | 18 (51.4) | 15 (45.5) | 34 (89.5) | 4 (10.5) | 18 (51.4) | 17 (48.6) | 22 (59.46) | 15 (40.54) | ||||
| Non-invasive | 16 (53.3) | 18 (58.1) | 29 (85.3) | 5 (14.7) | 16 (53.3) | 14 (46.7) | 18 (58.1) | 13 (41.9) | ||||
| Missing | 0 (0.00) |
2 (100.0) | 2 (100.0) | 0 (0.0) | 0 (0.0) (0.00) |
2 (100.0) | 1 (50.0) | 1 (50.0) | ||||
| Hardy scale, n (%) | 0.29ᵡ | 0.38ᵟ | 0.62ᵡ | 0.92ᵡ | ||||||||
| Invasive | 23 (45.1) | 28 (54.9) | 51 (89.5) | 6 (10.5) | 28 (53.8) | 24 (46.2) | 31 (58.5) | 22 (41.5) | ||||
| Non-invasive | 8 (61.5) | 5 (38.5) | 12 (80.0) | 3 (20.0) | 6 (46.2) | 7 (53.8) | 9 (60.0) | 6 (40.0) | ||||
| Missing | 0 (0.0) | 2 (100.0) | 2 (100.0) | 0 (0.0) | 0 (0.0) | 2 (100.0) | 1 (50.0) | 1 (50.0) | ||||
| Overall invasiveness | 0.16ᵡ | 0.36ᵟ | 0.86ᵡ | 0.64ᵡ | ||||||||
| Non-invasive in Knosp or Hardy scale | 6 (50.0) | 4 (33.3) | 11 (78.6) | 3 (21.4) | 6 (50.0) | 6 (50.0) | 9 (64.3) | 5 (35.7) | ||||
| Invasive in Knosp or Hardy scale | 28 (52.8) | 29 (55.8) | 52 (89.7) | 6 (10.3) | 28 (52.8) | 25 (47.2) | 31 (57.4) | 23 (42.6) | ||||
| Missing | 0 (0.0) | 2 (100.0) | 2 (100.0) | 0 (0.0) | 0 (0.0) | 2 (100.0) | 1 (50.0) | 1 (50.0) | ||||
Legend: ᵟFisher Exact test; ᵡPearson Chi-square test; ᵠMann-Whitney U test; analyses were performed excluding missing data.
Table 3.
Association Between Expression of Ki-67, P53, and Cyclin D1 and PD-L1 Status (TPS 0% vs TPS ≥1%).
Table 3.
Association Between Expression of Ki-67, P53, and Cyclin D1 and PD-L1 Status (TPS 0% vs TPS ≥1%).
| Parameters | PD-L1 | p-value | |
| TPS 0% | TPS ≥1% | ||
| Ki-67 overexpression, n (%)ᵟ | 0.71 | ||
| <3% | 28 (48.3) | 30 (51.7) | |
| ≥3% | 3 (37.5) | 5 (62.5) | |
| Missing | |||
| P53 overexpression, n (%)ᵡ | 0.10 | ||
| <10% | 19 (57.6) | 14 (42.4) | |
| ≥10% | 11 (36.7) | 19 (63.3) | |
| Missing | 1 (33.3) | 2 (66.7) | |
| Cyclin D1 overexpression, n (%)ᵡ | 0.27 | ||
| <10% | 14 (41.2) | 20 (58.8) | |
| ≥10% | 16 (55.2) | 13 (44.8) | |
| Missing | 1 (33.3) | 2 (66.7) | |
ᵟFisher Exact test; ᵡPearson Chi-square test; analyses were performed excluding missing data.
Table 4.
Optimal cut points of PD-L1 expression according to the expression of specific transcription factor and subtypes of PitNETs, while maximizing the product of the sensitivity and the specificity.
Table 4.
Optimal cut points of PD-L1 expression according to the expression of specific transcription factor and subtypes of PitNETs, while maximizing the product of the sensitivity and the specificity.
| Outcome | Optimal TPS cut-point | Sensitivity | Specificity | AUC |
| Transcriptions factors | ||||
| PIT-1 | 0.00 | 0.86 | 0.58 | 0.68 |
| SF 1 | ≥ 1.3% | 0.56 | 0.52 | 0.57 |
| TPIT | ≥ 5% | 0.63 | 0.59 | 0.50 |
| Null cell adenoma | ≥ 5% | 1.00 | 0.59 | 0.75 |
| Multi PITNETs | ≤ 3% | 0.78 | 0.49 | 0.59 |
| Type of PitNETs | ||||
| Gonadotroph | ≥ 1.3% | 0.55 | 0.50 | 0.54 |
| Corticotroph | ≥ 5% | 0.63 | 0.59 | 0.50 |
| Lactotroph | 0.00 | 1.00 | 0.56 | 0.78 |
| Immature PIT1 lineage tumor | 0.00 | 0.80 | 0.56 | 0.67 |
| Mature PIT-1 lineage tumor | ≥ 85% | 0.50 | 0.98 | 0.61 |
Legend: Quantitative variable: PDL-1 [%], Status variable [0-1]: cell lineage (TF) and tumor type.
Table 5.
Association between biomarker expression and tumor invasiveness: simple and multivariate logistic regression analysis.
Table 5.
Association between biomarker expression and tumor invasiveness: simple and multivariate logistic regression analysis.
| Predictor | OR (95% CI) Crude | P - value | OR (95% CI) Adjusted | P - value |
| PDL 1 | ||||
| ≥1% | 2.52 (0.67 – 9.43) | 0.17 | 2.35 (0.56 – 9.90) | 0.25 |
| 0% (ref) | 1.00 | – | 1.00 | – |
| P53 | ||||
| ≥10 | 0.89 (0.22 – 3.13) | 0.86 | 0.74 (0.16 – 3.39) | 0.70 |
| <10 (ref) | 1.00 | – | 1.00 | – |
| Ki-67 | ||||
| ≥3 | 0.42 (0.09 – 1.96) | 0.27 | 0.76 (0.11 – 5.16) | 0.78 |
| <3 (ref) | 1.00 | – | 1.00 | – |
| Cyclin D1 | ||||
| ≥10 | 1.34 (0.39 – 4.52) | 0.64 | 1.93 (0.42 – 8.84) | 0.40 |
| <10 (ref) | 1.00 | – | 1.00 | – |
Model fit statistics: Hosmer–Lemeshow χ² = 3.63, p = 0.60; AUC = 0.64 (SE = 0.10); Cox–Snell R² = 0.04; Nagelkerke R² = 0.06.
Table 6.
Characteristics of PITENTs depending on the combination of factors Ki-67 and P53.
| Type of PitNETs | Ki>=3&P53>=10 (1) |
Ki>=3&P53<10 (2) |
Ki<3&P53>=10 (3) |
Ki<3&P53<10 (4) |
| N=6 | N=2 | N=27 | N=32 | |
| Gonadotroph | 3 (7.7%) | 0 (0.0%) | 18 (46.2%) | 18 (46.2%) |
| Gonadotroph/Lactotroph | 0 (0.0%) | 0 (0.0%) | 0 (0.0%) | 1 (100.0%) |
| Corticotroph | 2 (25.0%) | 0 (0.0%) | 2 (25.0%) | 4 (50.0%) |
| Lactotroph | 0 (0.0%) | 1 (25.0%) | 2 (50.0%) | 1 (25.0%) |
| Somatotroph | 0 (0.0%) | 0 (0.0%) | 0 (0.0%) | 0 (0.0%) |
| Tyrotroph | 0 (0.0%) | 0 (0.0%) | 0 (0.0%) | 1 (100.0%) |
| Null cell adenoma | 0 (0.0%) | 0 (0.0%) | 0 (0.0%) | 2 (100.0%) |
| Multiple synchronous PitNET | 1 (25.0%) | 0 (0.0%) | 1 (25.0%) | 2 (50.0%) |
| Immature PIT-1 lineage tumour | 0 (0.0%) | 1 (25.0%) | 3 (75.0%) | 0 (0.0%) |
| Mature PIT-1 lineage tumor | 0 (0.0%) | 0 (0.0%) | 1 (50.0%) | 1 (50.0%) |
Table 7.
Characteristics of PITENTs depending on the combination of factors Cyclin D1 and P53.
| Type of PitNETs | Cyk>=10&P53>=10 (1) |
Cyk>=10&P53<10 (2) |
Cyk<10&P53>=10 (3) |
Cyk<10&P53<10 (4) |
| N=18 | N=10 | N=14 | N=22 | |
| Gonadotroph | 10 (26.3%) | 9 (23.7%) | 10 (26.3%) | 9 (23.7%) |
| Gonadotroph/Lactotroph | 0 (0.0%) | 0 (0.0%) | 0 (0.0%) | 1 (100.0%) |
| Corticotroph | 2 (25.0%) | 0 (0.0%) | 2 (25.0%) | 4 (50.0%) |
| Lactotroph | 1 (25.0%) | 0 (0.0%) | 1 (25.0%) | 2 (50.0%) |
| Somatroph | 0 (0.0%) | 0 (0.0%) | 0 (0.0%) | 0 (0.0%) |
| Tyreotroph | 0 (0.0%) | 0 (0.0%) | 0 (0.0%) | 1 (100.0%) |
| Null cell adenoma | 0 (0.0%) | 0 (0.0%) | 0 (0.0%) | 1 (100.0%) |
| Multiple synchronous PitNET | 2 (50.0%) | 0 (0.0%) | 0 (0.0%) | 2 (50.0%) |
| Immature PIT-lineage tumor | 2 (40.0%) | 0 (0.0%) | 1 (20.0%) | 2 (40.0%) |
| Mature PIT-1 lineage tumor | 1 (50.0%) | 1 (50.0%) | 0 (0.0%) | 0 (0.0%) |
Table 8.
Analysis of the effect of combinations of Ki67, P53 and Cyclin D1 on the invasiveness of PitNETs.
Table 8.
Analysis of the effect of combinations of Ki67, P53 and Cyclin D1 on the invasiveness of PitNETs.
| Features | Knosp scale | Hardy scale | ||
| Non-invasive n (%) |
Invasive n (%) | Non-invasive n (%) |
Invasive n (%) |
|
| Combined analysis of Ki-67 and P53 | ||||
| Ki-67≥3% & P53≥10% | 3 (50.0) | 3 (50.0) | 1 (16.7) | 5 (83.3) |
| Ki-67≥3% & P53<10% | 1 (50.0) | 1 (50.0) | 1 (50.0) | 1 (50.0) |
| Ki-67<3% & P53≥10% | 11 (44.0) | 14 (56.0) | 6 (24.0) | 19 (76.0) |
| Ki-67<3% & P53<10% | 15 (46.9) | 17 (53.1) | 5 (15.6) | 27 (84.4) |
| p valueᵡ | 0.992 | 0.615 | ||
| Combined analysis of Cyclin D1 and P53 | ||||
| Cyclin D1≥10% & P53≥10% | 8 (47.1) | 9 (52.9) | 5 (29.4) | 12 (70.6) |
| Cyclin D1≥10% & P53<10% | 4 (40.0) | 6 (60.0) | 0 (0.0) | 10 (100.0) |
| Cyclin D1<10% & P53≥10% | 5 (38.5) | 8 (61.5) | 2 (15.4) | 11 (84.6) |
| Cyclin D1<10% & P53<10% | 11 (50.0) | 11 (50.0) | 6 (27.3) | 16 (72.7) |
| p valueᵡ | 0.902 | 0.245 | ||
ᵡPearson Chi-square test; ᵠMann-Whitney U test; analyses were performed excluding missing data.
Disclaimer/Publisher’s Note: The statements, opinions and data contained in all publications are solely those of the individual author(s) and contributor(s) and not of MDPI and/or the editor(s). MDPI and/or the editor(s) disclaim responsibility for any injury to people or property resulting from any ideas, methods, instructions or products referred to in the content. |
© 2025 by the authors. Licensee MDPI, Basel, Switzerland. This article is an open access article distributed under the terms and conditions of the Creative Commons Attribution (CC BY) license (http://creativecommons.org/licenses/by/4.0/).
Copyright: This open access article is published under a Creative Commons CC BY 4.0 license, which permit the free download, distribution, and reuse, provided that the author and preprint are cited in any reuse.


