
Submitted:
01 January 2025
Posted:
06 January 2025
You are already at the latest version
Abstract
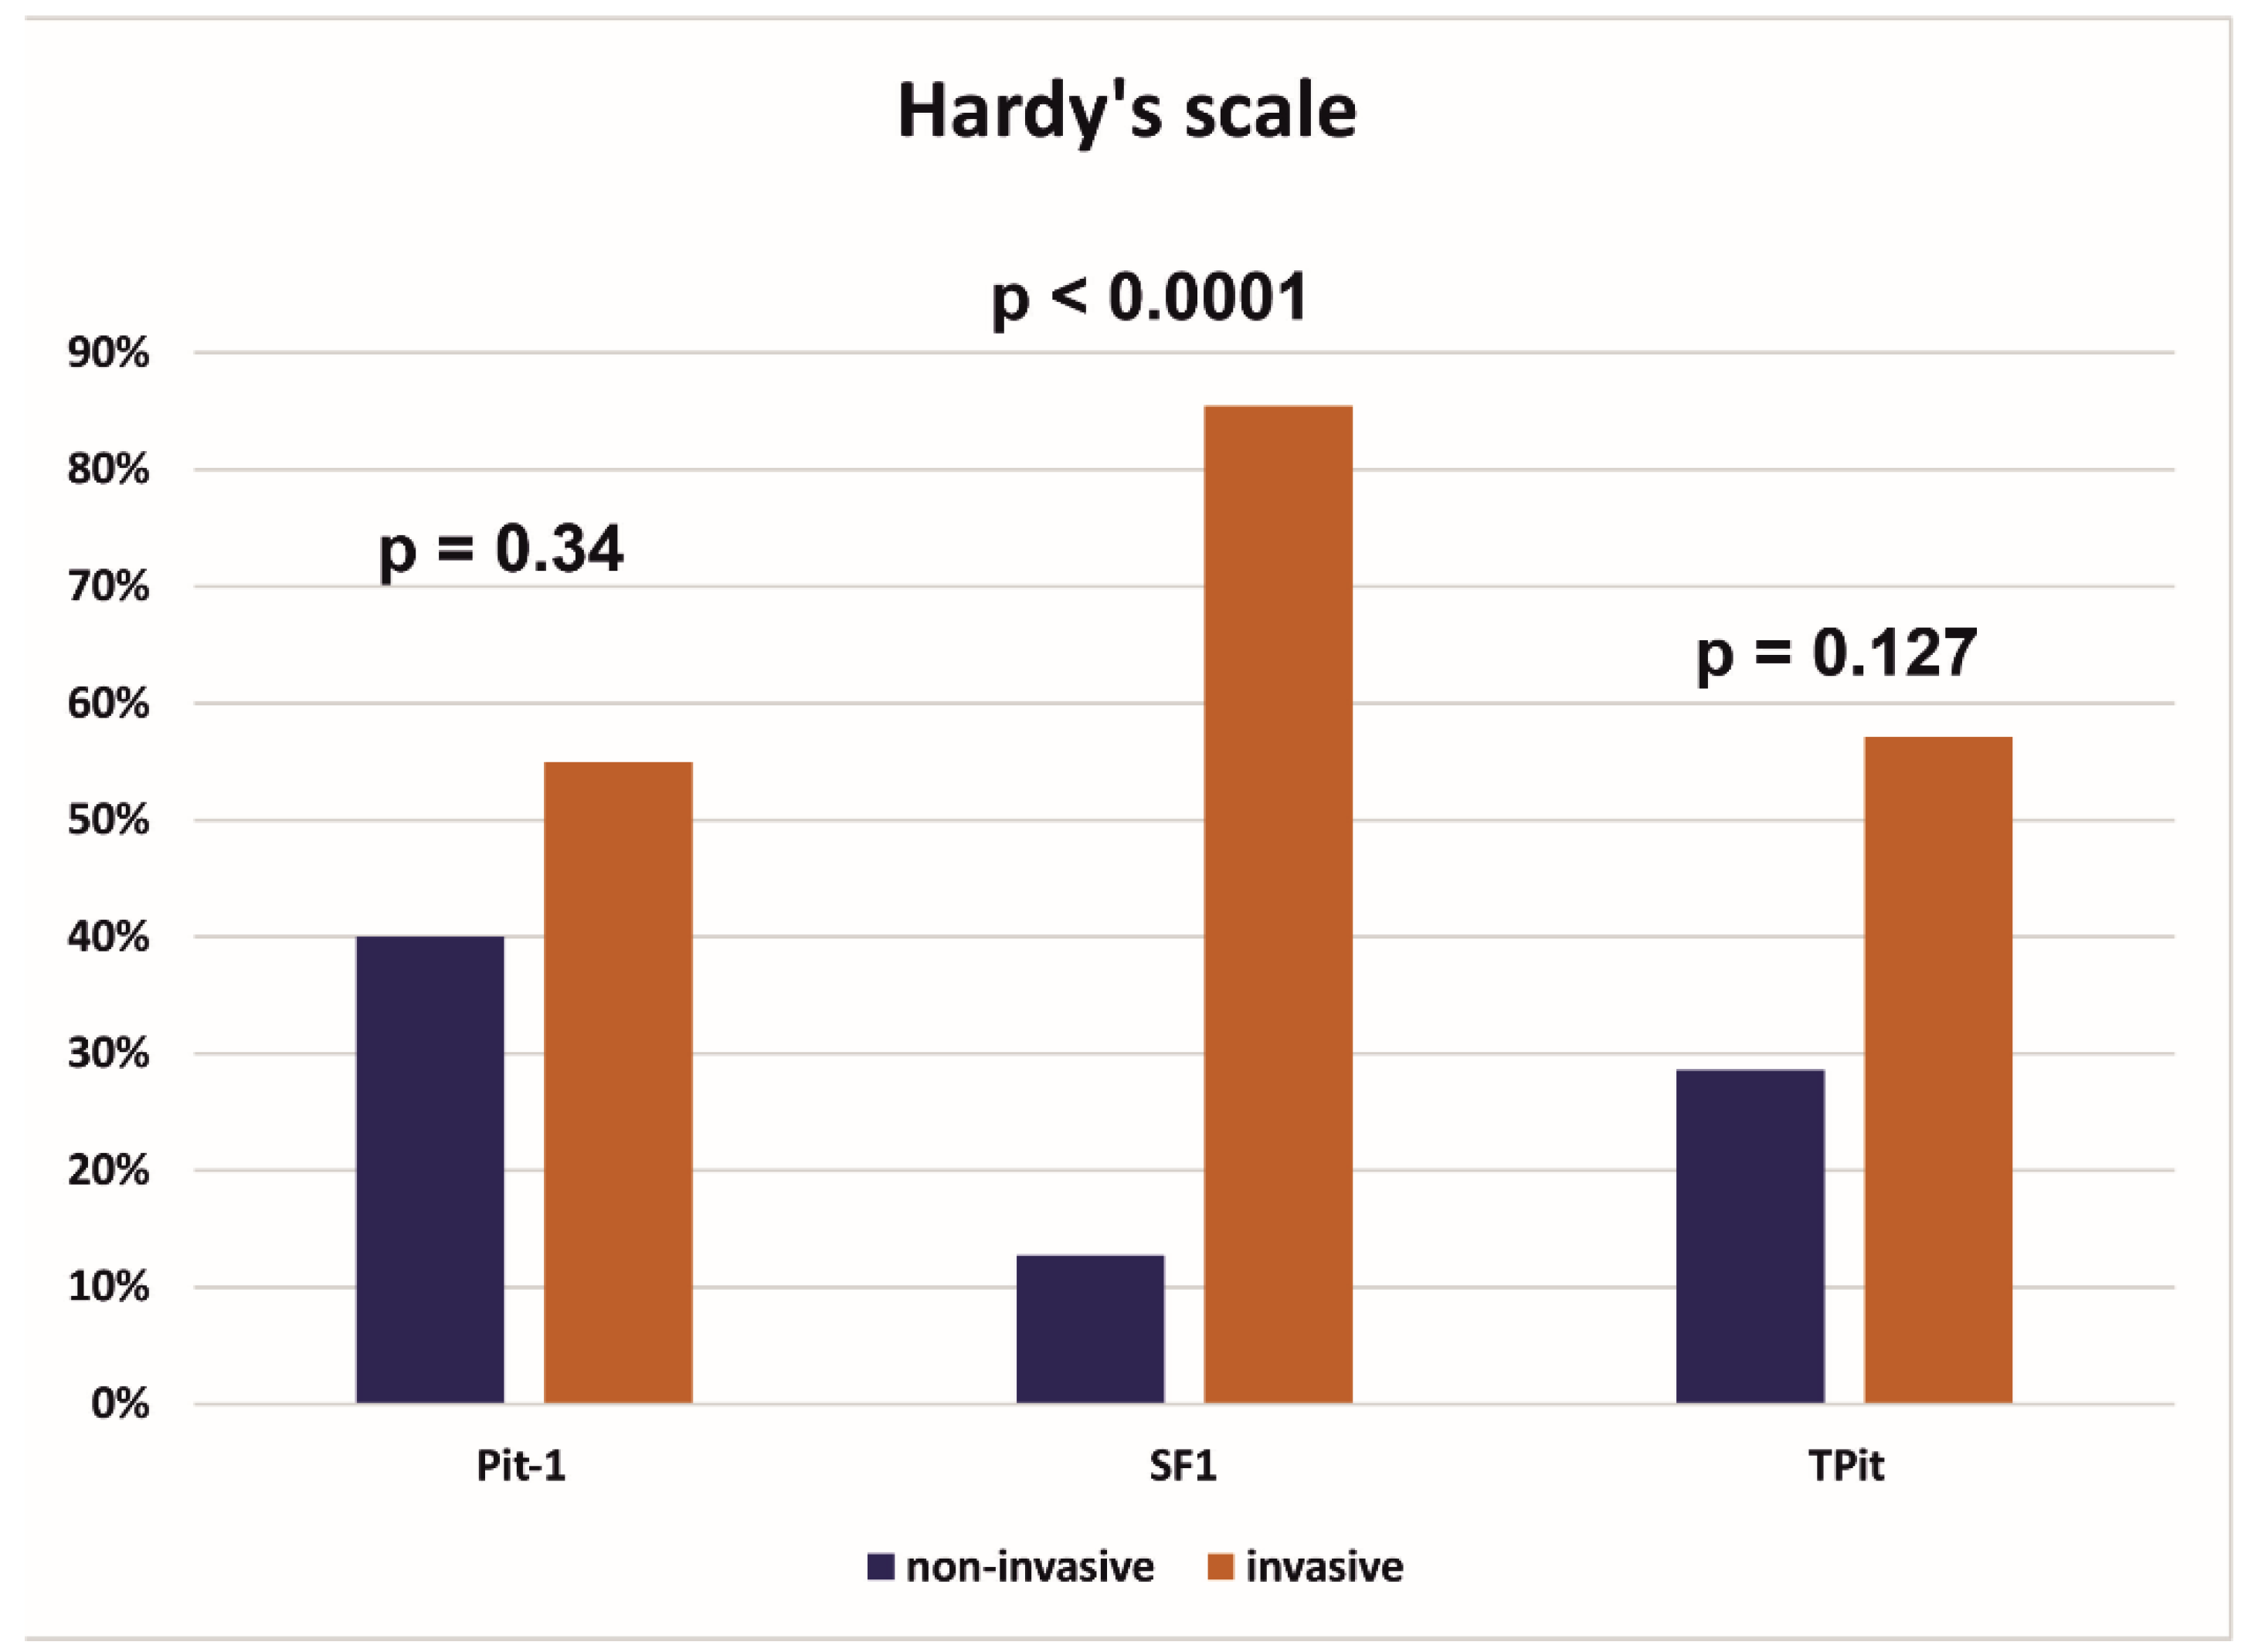
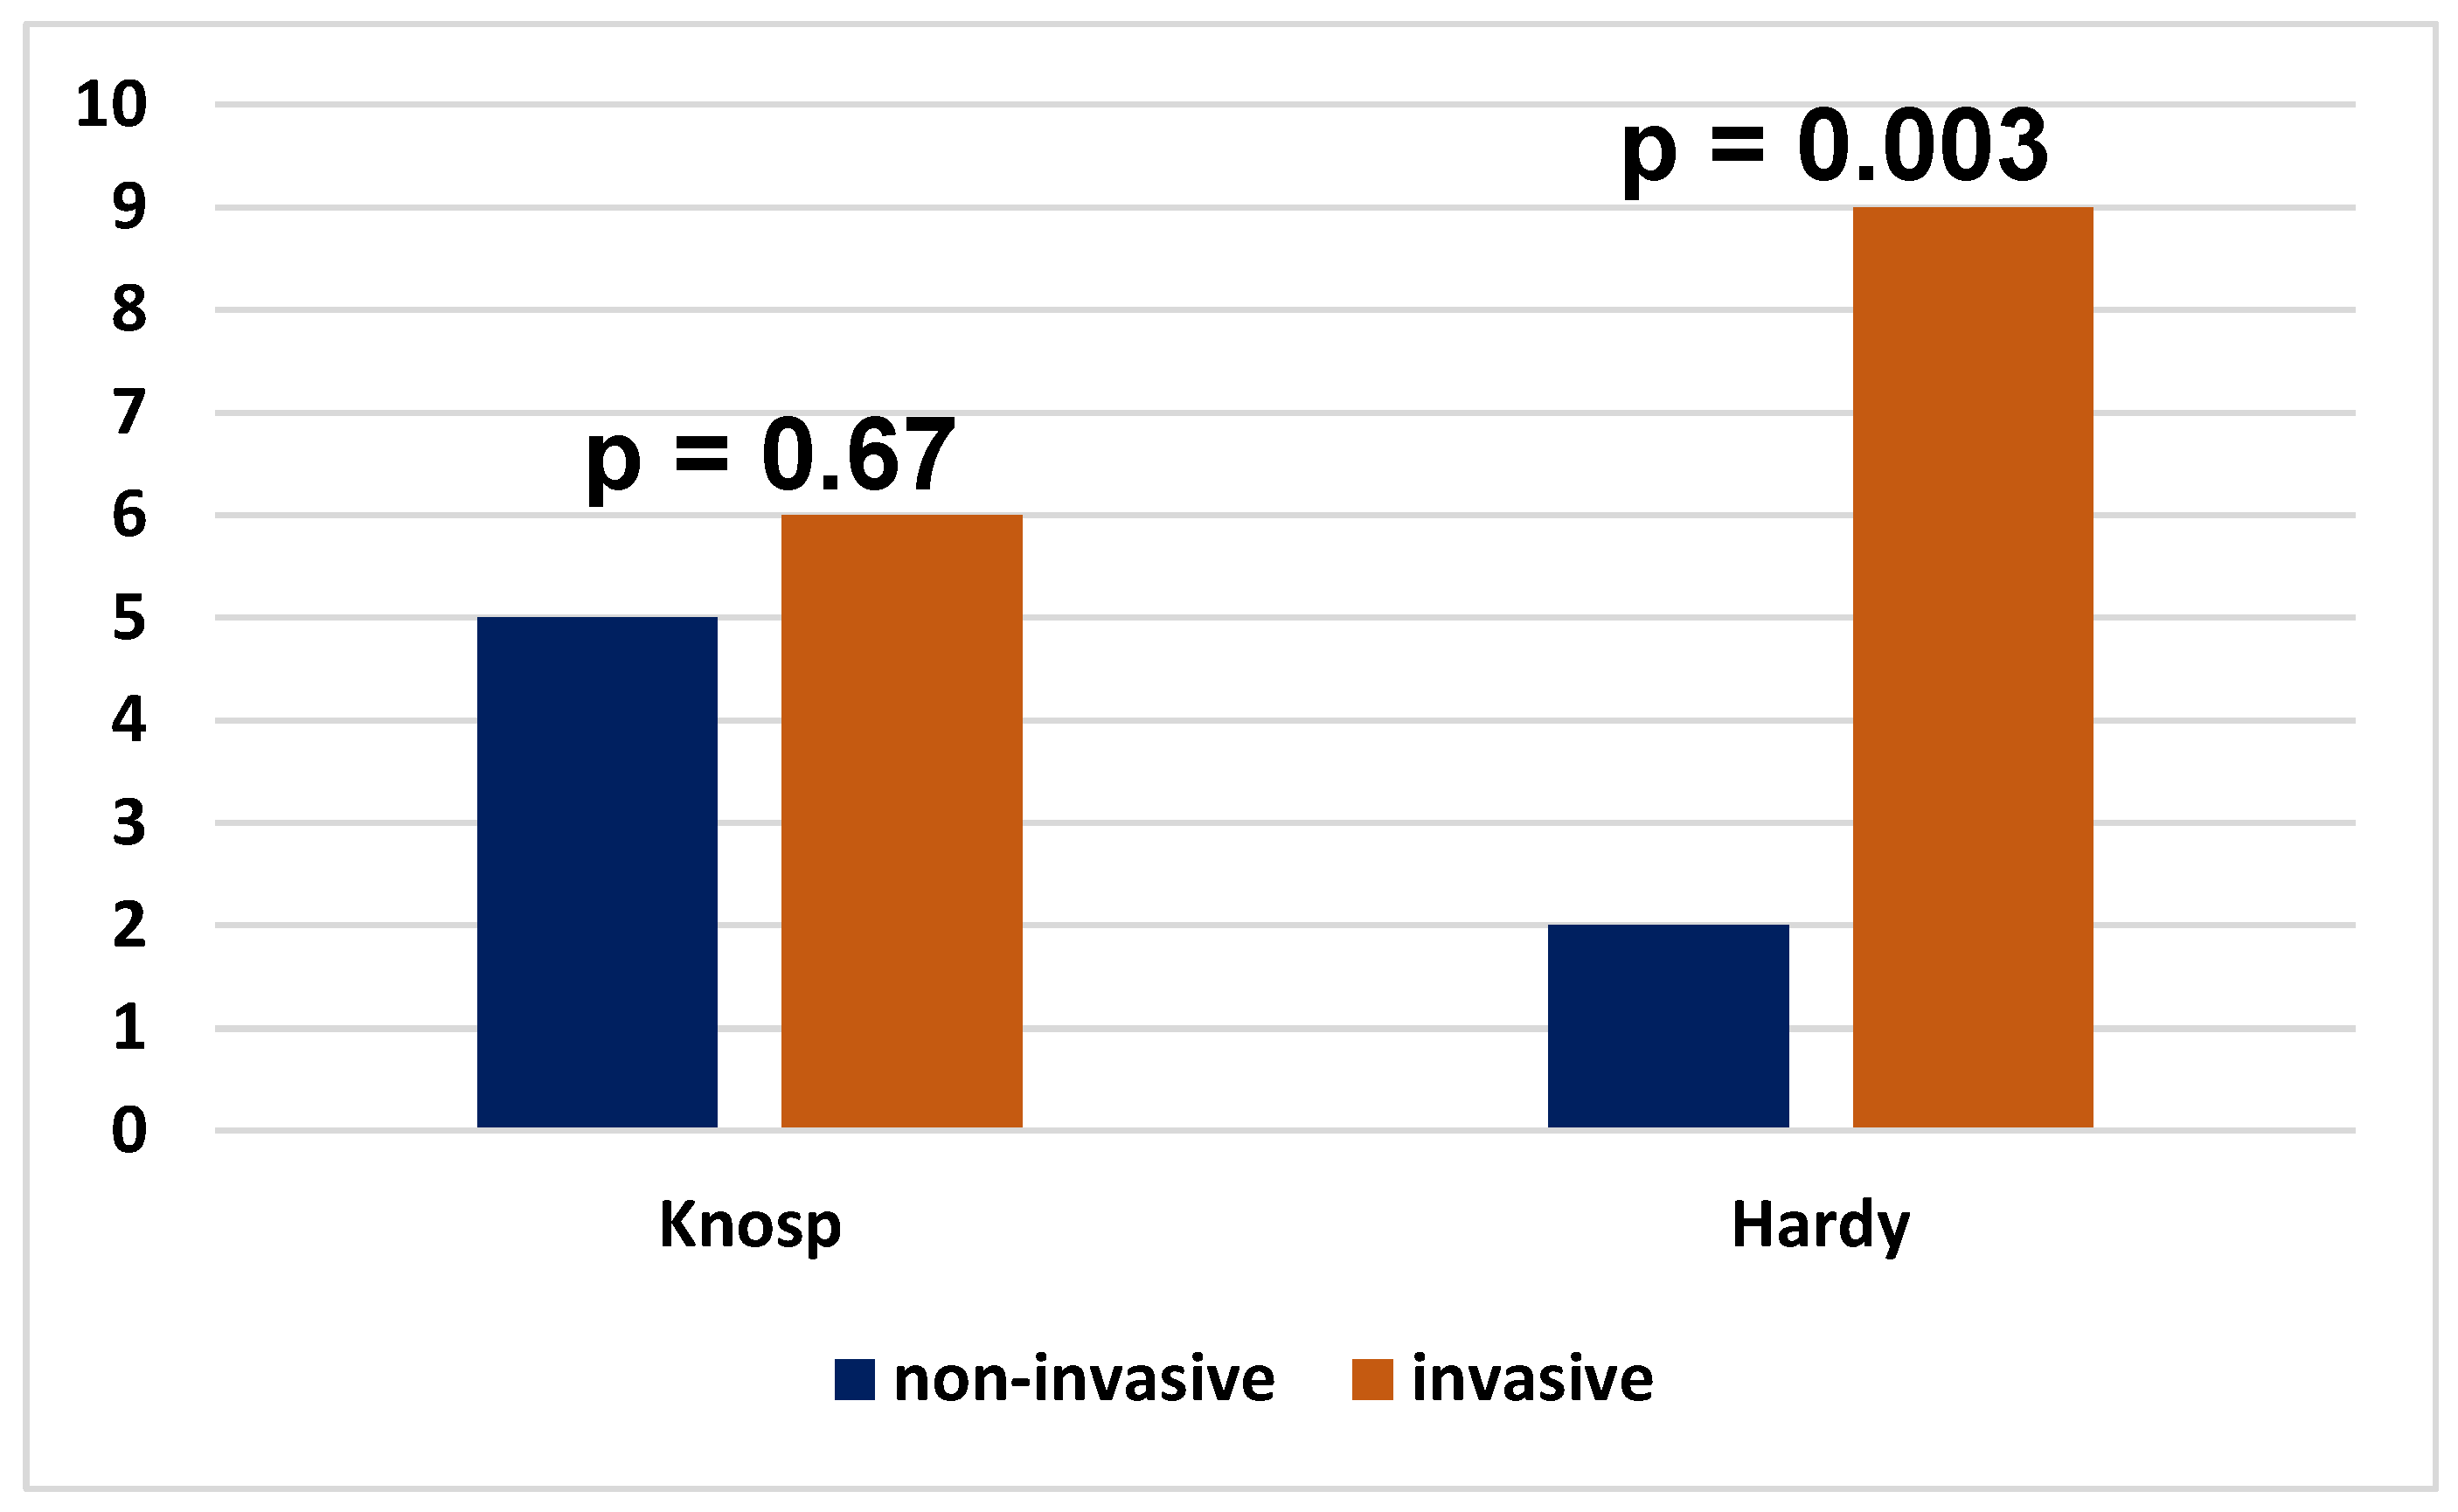
Objective: The objective of the study was to provide radiological and immunohistochemical evaluation of pituitary neuroendocrine tumors (PitNETs) concentrating on their invasiveness, endocrine function and expression of transcription factors. Methods: 79 cases of PitNETs were analyzed. The analysis included their MRI features, invasiveness and immunophenotype (immunoexpression of transcription factors Pit-1, SF1, TPit and the hormones). Results: Tumors from the SF1 line were statistically significantly more likely to show a tendency to invade the sella turcica (p<0.0001), while tumors from the Pit-1 and TPit factor lines were demonstrated to be both invasive and non-invasive, and the difference was not statistically significant. No statistically significant difference was found in the invasion of the cavernous sinuses by the pituitary tumors regardless of the transcription factor from which they originated. No statistically significant differences were observed between hormonally active and inactive tumors in terms of gender, age, invasiveness, size, or volume. Conclusions: PitNETs, also known as pituitary adenomas, continue to represent a significant challenge for clinicians. Tumors from the SF1 factor line are characterized by a statistically significantly more frequent invasion directed towards the sella turcica, while tumors from the Pit-1 and TPit lines do not show such a relationship. Patients with corticotroph PitNETs need to be controlled due to the proclivity of the tumors for aggressive behavior. Other types of PitNETs are less common. Tumors that express multiple transcription factors necessitate the patient to be subjected to further diagnostic and investigative procedures.
Keywords:
1. Introduction
2. Material and Methods
2.1. Patients
2.2. Materials and Methods
3. Statistics
4. Results
5. Discussion
6. Conclusion
Funding
Data availability
Institutional Review Board Statement
Informed Consent Statement
Acknowledgments
Conflicts of Interest
References
- Ostrom QT, Cioffi G, Gittleman H, Patil N, Waite K, Kruchko C, Barnholtz-Sloan JS. CBTRUS Statistical Report: Primary Brain and Other Central Nervous System Tumors Diagnosed in the United States in 2012-2016. Neuro Oncol. 2019 Nov 1;21(Suppl 5):v1-v100. [CrossRef]
- McDowell BD, Wallace RB, Carnahan RM, Chrischilles EA, Lynch CF, Schlechte JA. Demographic differences in incidence for Pituitary adenoma. Pituitary. (2011) 14:23–30. [CrossRef]
- Ezzat S, Asa SL, Couldwell WT, et al. The prevalence of Pituitary adenomas: a systematic review. Cancer. 2004;101:613–619.
- Knosp E, Steiner E, Kitz K, Matula C. Pituitary adenomas with invasion of the cavernous sinus space: a magnetic resonance imaging classification compared with surgical findings. Neurosurgery. 1993;33(4):610-617; discussion 617-618. [CrossRef]
- Fang Y, Pei Z, Chen H, Wang R, Feng M, Wei L, Li J, Zhang H, Wang S. Diagnostic value of Knosp grade and modified Knosp grade for cavernous sinus invasion in Pituitary adenomas: a systematic review and meta-analysis. Pituitary. 2021 Jun;24(3):457-464. [CrossRef]
- Hardy J, Vezina JL. Transsphenoidal neurosurgery of intracranial neoplasm. Adv Neurol. 1976;15:261-73.
- Zhu X, Rosenfeld MG. Transcriptional control of precursor proliferation in the early phases of Pituitary development. Curr Opin Genet Dev. 2004 Oct;14(5):567-74. [CrossRef]
- Osamura RY, Grossman A, Korbonits M, et al. Pituitary adenoma. In: Tumors of the Pituitary Gland. WHO Classification of Endocrine Tumors. 4th ed. Lyon, France: IARC; 2017:14–18.
- Trouillas J, Jaffrain-Rea ML, Vasiljevic A, Raverot G, Roncaroli F, Villa C. How to classify the Pituitary neuroendocrine tumors (Pitnet)S in 2020. Cancers (Basel) (2020) 12(2):514. [CrossRef]
- Wan XY, Chen J, Wang JW, Liu YC, Shu K, Lei T. Overview of the 2022 WHO Classification of Pituitary Adenomas/Pituitary Neuroendocrine Tumors: Clinical Practices, Controversies, and Perspectives. Curr Med Sci. 2022 Dec;42(6):1111-1118. [CrossRef]
- Obari A, Sano T, Ohyama K, Kudo E, Qian ZR, Yoneda A, Rayhan N, Mustafizur Rahman M, Yamada S. Clinicopathological features of growth hormone-producing Pituitary adenomas: difference among various types defined by cytokeratin distribution pattern including a transitional form. Endocr Pathol. 2008 Summer;19(2):82-91. [CrossRef]
- Raverot G, Burman P, McCormack A, Heaney A, Petersenn S, Popovic V, Trouillas J, Dekkers OM; European Society of Endocrinology. European Society of Endocrinology Clinical Practice Guidelines for the management of aggressive Pituitary tumors and carcinomas. Eur J Endocrinol. 2018 Jan;178(1):G1-G24. [CrossRef]
- De Sousa SMC, McCormack AI. Aggressive Pituitary tumors and Pituitary carcinomas. In: Feingold KR, Anawalt B, Boyce A, Chrousos G, Dungan K, Grossman A et al., editors. Endotext. South Dartmouth (MA) 2000.
- Lopes MBS. The 2017 World Health Organization classification of tumors of the Pituitary gland: a summary. Acta Neuropathol. 2017 Oct;134(4):521-535. [CrossRef]
- Yamada S, Osamura RY, Righi A, et al. Gonadotroph adenoma. In: Tumors of the Pituitary Gland. WHO Classification of Endocrine Tumors. Lyon, France: IARC; 2017:34–36.
- Mete O, Grossman A, Trouillas J, et al. Corticotroph adenoma. In: Tumors of the Pituitary Gland. WHO Classification of Endocrine Tumors. 4th ed. Lyon, France: IARC; 2017:30–33.
- Ben-Shlomo A, Cooper O. Silent corticotroph adenomas. Pituitary (2018) 21(2):183–93. [CrossRef]
- Cooper O. Silent corticotroph adenomas. Pituitary. 2015 Apr;18(2):225-31. [CrossRef]
- Wang EL, Qian ZR, Yamada S, et al. Clinicopathological characterization of TSH-producing adenomas: special reference to TSH-immunoreactive but clinically non-functioning adenomas. Endocr Pathol. 2009;20:209–220.
- Kontogeorgos G, Kovacs K, Lloyd RV, et al. Plurihormonal and double adenomas. In: Tumors of the Pituitary Gland. WHO Classification of Endocrine Tumors. 4th ed. Lyon, France: IARC; 2017:39–40.
- Nishioka H, Kontogeorgos G, Lloyd RV, et al. Null cell adenoma. In: Tumors of the Pituitary Gland. WHO Classification of Endocrine Tumors. 4th ed. Lyon, France: IARC; 2017:37–38.
- Picó A. Agressive Pituitary tumors: a diagnostic and therapeutic challenge for multidisciplinary Pituitary units. Endocrinol Diabetes Nutr (Engl Ed). 2020 Feb;67(2):75-77. English, Spanish. [CrossRef]
- Dekkers OM, Karavitaki N, Pereira AM. The epidemiology of aggressive Pituitary tumors (and its challenges). Rev Endocr Metab Disord 2020;21:209e12. [CrossRef]
- Raverot G, Ilie MD, Lasolle H, Amodru V, Trouillas J, Castinetti F, et al. Aggressive Pituitary tumors and Pituitary carcinomas. Nat Rev Endocrinol 2021;17(11):671e84. [CrossRef]
- Zhu D, Wang Z, Tian T, Wu X, He D, Zhu Y, Liu D, Wang H. Prevalence and clinical characteristics of Crooke’s cell adenomas in 101 patients with T-PIT-positive Pituitary adenomas: Case series and literature review. Front Endocrinol (Lausanne). 2022 Aug 19;13:947085. [CrossRef]
- Giraldi EA, Neill SG, Mendoza P, Saindane A, Oyesiku NM, Ioachimescu AG. Functioning Crooke Cell Adenomas: Case Series and Literature Review. World Neurosurg. 2022 Feb;158:e754-e765. [CrossRef]

|
Overall (N=79) |
|
| Age | |
| Mean (SD) | 57.2 (13.9) |
| Median [Q1-Q3] | 60.0 [47.5-68.5] |
| Min-Max | 23.0-82.0 |
| Gender | |
| F | 32 (40.5%) |
| M | 47 (59.5%) |
| Tumor size AP (mm) | |
| Mean (SD) | 21.2 (8.40) |
| Median [Q1-Q3] | 20.0 [16.0-25.8] |
| Min-Max | 4.50-50.0 |
| Missing | 1 (1.3%) |
| Tumor size ML (mm) | |
| Mean (SD) | 25.5 (8.06) |
| Median [Q1-Q3] | 25.0 [20.0-30.0] |
| Min-Max | 5.50-45.0 |
| Missing | 1 (1.3%) |
| Tumor size CC (mm) | |
| Mean (SD) | 24.3 (10.7) |
| Median [Q1-Q3] | 22.0 [17.0-30.8] |
| Min-Max | 4.50-56.0 |
| Missing | 1 (1.3%) |
| Volume of tumor V (cm3) | |
| Mean (SD) | 8.51 (8.66) |
| Median [Q1-Q3] | 5.20 [3.15-10.1] |
| Min-Max | 0.200-50.0 |
| Missing | 4 (5.1%) |
| Transcriptions factors: | |
| Pit -1 | 21 (26.6%) |
| SF 1 | 55 (69.6%) |
| TPit | 14 (17.7%) |
| Type of PitNET | |
| Gonadotroph | 44 (55.69 %) |
| Corticotroph | 10 (12.65%) |
| Lactotroph | 4 (5.06%) |
| Null cell adenoma | 3 (3.79%) |
| Multiple synchronous | 4 (5.06%) |
| Somatotroph | 1 (1.26%) |
| Gonadotroph/lactotroph | 2 (2.53%) |
| Thyrotroph | 1 (1.26%) |
| Mature Pit - 1 lineage tumor | 3 (3.8%) |
| Immature Pit -1 lineage tumor | 7 (8.86%) |
| Hormonal activity of PitNET | |
| Non-active | 62 (78.48%) |
| Active | 17 (21.52%) |
| Hardy scale | |
| Non-invasive (grade 1, 2) | 15 (19.0%) |
| Invasive (grade 3 and above) | 62 (78.5%) |
| Missing | 2 (2.5%) |
| Knosp scale | |
| Non - invasive (grade 1, 2) | 37 (46.8%) |
| Invasive (grade 3, 4) | 40 (50.6%) |
| Missing | 2 (2.5%) |
| Overall (N=79) |
Non-invasive (N=37) |
Invasive (N=40) |
p-value | |
|---|---|---|---|---|
| Invasivenessthe Hardy scale | < 0.0001* | |||
| Non-invasive | 15 (19.0%) | 14 (37.8%) | 1 (2.5%) | |
| Invasive | 62 (78.5%) | 23 (62.2%) | 39 (97.5%) | |
| Missing | 2 (2.5%) | 0 (0%) | 0 (0%) | |
| Age | 0.87 | |||
| Mean (SD) | 57.2 (13.9) | 57.4 (14.1) | 56.9 (13.9) | |
| Median [Q1-Q3] | 60.0 [47.5-68.5] | 59.0 [48.0-69.0] | 61.0 [46.5-67.3] | |
| Min-Max | 23.0-82.0 | 31.0-82.0 | 23.0-78.0 | |
| Gender | 0.52 | |||
| F | 32 (40.5%) | 14 (37.8%) | 18 (45.0%) | |
| M | 47 (59.5%) | 23 (62.2%) | 22 (55.0%) | |
| Hormonal PitNET activity | 0.65 | |||
| Non-active | 62 (78.5%) | 28 (75.7%) | 32 (80.0%) | |
| Active | 17 (21.5%) | 9 (24.3%) | 8 (20.0%) | |
| Type of PitNET | 0.37 | |||
| Gonadotroph | 44 (55.7%) | 20 (54.1%) | 24 (60.0%) | |
| Gonadotroph/lactotroph | 2 (2.5%) | 0 (0%) | 2 (5.0%) | |
| Corticotroph | 10 (12.7%) | 4 (10.8%) | 5 (12.5%) | |
| Lactotroph | 4 (5.1%) | 3 (8.1%) | 1 (2.5%) | |
| Null cell adenoma | 3 (3.8%) | 2 (5.4%) | 1 (2.5%) | |
| Multiple synchronous | 4 (5.1%) | 1 (2.7%) | 3 (7.5%) | |
| Thyrotroph | 1 (1.3%) | 0 (0%) | 1 (2.5%) | |
| Somatotroph | 1 (1.3%) | 1 (2.7%) | 0 (0%) | |
| Mature Pit - 1 lineage tumor | 3 (3.8%) | 3 (8.1%) | 0 (0%) | |
| Immature Pit -1 lineage tumor | 7 (8.9%) | 3 (8.1%) | 3 (7.5%) | |
| Tumor volume V (cm3) | < 0.0001* | |||
| Mean (SD) | 8.51 (8.66) | 4.90 (4.57) | 11.8 (10.1) | |
| Median [Q1-Q3] | 5.20 [3.15-10.1] | 3.30 [1.83-6.88] | 9.00 [4.60-14.2] | |
| Min-Max | 0.200-50.0 | 0.200-20.0 | 1.70-50.0 | |
| Missing | 4 (5.1%) | 1 (2.7%) | 1 (2.5%) | |
| Max size | < 0.0001* | |||
| Mean (SD) | 27.8 (9.75) | 22.9 (7.32) | 32.1 (9.79) | |
| Median [Q1-Q3] | 25.5 [21.6-33.0] | 22.5 [19.0-27.0] | 30.5 [23.8-38.5] | |
| Min-Max | 5.50-56.0 | 5.50-41.0 | 18.0-56.0 | |
| Missing | 1 (1.3%) | 0 (0%) | 0 (0%) | |
| Pit - 1 | 0.65 | |||
| negative | 59 (74.7%) | 27 (73.0%) | 31 (77.5%) | |
| positive | 20 (25.3%) | 10 (27.0%) | 9 (22.5%) | |
| SF1 | 0.64 | |||
| negative | 24 (30.4%) | 12 (32.4%) | 11 (27.5%) | |
| positive | 55 (69.6%) | 25 (67.6%) | 29 (72.5%) | |
| TPit | 0.44 | |||
| negative | 65 (82.3%) | 30 (81.1%) | 35 (87.5%) | |
| positive | 14 (17.7%) | 7 (18.9%) | 5 (12.5%) |
|
Overall (N=79) |
Non-invasive (N=15) |
Invasive (N=62) |
p-value | |
| Invasiveness on the Knosp scale | < 0.0001* | |||
| Non - invasive | 37 (46.8%) | 14 (93.3%) | 23 (37.1%) | |
| Invasive | 40 (50.6%) | 1 (6.7%) | 39 (62.9%) | |
| Missing | 2 (2.5%) | 0 (0%) | 0 (0%) | |
| Age | 0.64 | |||
| Mean (SD) | 57.2 (13.9) | 55.4 (14.7) | 57.6 (13.8) | |
| Median [Q1-Q3] | 60.0 [47.5-68.5] | 61.0 [42.0-65.5] | 59.5 [49.0-68.8] | |
| Min-Max | 23.0-82.0 | 31.0-75.0 | 23.0-82.0 | |
| Gender | 0.89 | |||
| F | 32 (40.5%) | 6 (40.0%) | 26 (41.9%) | |
| M | 47 (59.5%) | 9 (60.0%) | 36 (58.1%) | |
| Hormonal activity of PitNETs | 0.084 | |||
| Non - active | 62 (78.5%) | 9 (60.0%) | 51 (82.3%) | |
| Active | 17 (21.5%) | 6 (40.0%) | 11 (17.7%) | |
| Type of PitNET | 0.011* | |||
| Gonadotroph | 44 (55.7%) | 5 (33.3%) | 39 (62.9%) | |
| Gonadotroph/lactotroph | 2 (2.5%) | 0 (0%) | 2 (3.2%) | |
| Corticotroph | 10 (12.7%) | 2 (13.3%) | 7 (11.3%) | |
| Lactotroph | 4 (5.1%) | 3 (20.0%) | 1 (1.6%) | |
| Null cell adenoma | 3 (3.8%) | 0 (0%) | 3 (4.8%) | |
| Multiple synchronous | 4 (5.1%) | 0 (0%) | 4 (6.5%) | |
| Thyrotroph | 1 (1.3%) | 0 (0%) | 1 (1.6%) | |
| Somatotroph | 1 (1.3%) | 1 (6.7%) | 0 (0%) | |
| Mature Pit -1 lineage tumor | 3 (3.8%) | 2 (13.3%) | 1 (1.6%) | |
| Immature Pit -1 lineage tumor | 7 (8.9%) | 2 (13.3%) | 4 (6.5%) | |
| Volume of tumor V (cm3) | < 0.0001* | |||
| Mean (SD) | 8.51 (8.66) | 2.22 (1.98) | 9.96 (8.96) | |
| Median [Q1-Q3] | 5.20 [3.15-10.1] | 1.65 [1.18-2.93] | 8.20 [4.00-12.0] | |
| Min-Max | 0.200-50.0 | 0.200-8.00 | 1.30-50.0 | |
| Missing | 4 (5.1%) | 1 (6.7%) | 1 (1.6%) | |
| Max size | < 0.0001* | |||
| Mean (SD) | 27.8 (9.75) | 18.7 (6.18) | 29.9 (9.28) | |
| Median [Q1-Q3] | 25.5 [21.6-33.0] | 20.0 [16.5-23.0] | 28.3 [23.0-34.0] | |
| Min-Max | 5.50-56.0 | 5.50-29.0 | 16.0-56.0 | |
| Missing | 1 (1.3%) | 0 (0%) | 0 (0%) | |
| Pit - 1 | 0.008* | |||
| negative | 59 (74.7%) | 7 (46.7%) | 51 (82.3%) | |
| positive | 20 (25.3%) | 8 (53.3%) | 11 (17.7%) | |
| SF1 | 0.055 | |||
| negative | 24 (30.4%) | 8 (53.3%) | 15 (24.2%) | |
| positive | 55 (69.6%) | 7 (46.7%) | 47 (75.8%) | |
| TPit | 0.23 | |||
| negative | 65 (82.3%) | 11 (73.3%) | 54 (87.1%) | |
| positive | 14 (17.7%) | 4 (26.7%) | 8 (12.9%) |
| age | sex |
AP (mm) |
ML (mm) |
CC (mm) |
KS | HS |
V cm3 |
Type PitNET |
PRL | ACTH | GH | TSH | LH | FSH | Pit-1 | SF1 | TPit |
| 62 | F | 33 | 27 | 41 | 1 | 4D | 18 | gonadotroph | 0 | 0 | 0 | 0 | 0 | 0 | 0 | ++ | 0 |
| 64 | M | 40 | 37 | 45 | 4 | 4E | 33 | multiplesynchronous | 0 | 0 | 0 | 0 | + | 0 | 0 | + | 0 |
| 65 | M | 29 | 36 | 46 | 4 | 4D | 21 | gonadotroph | 0 | 0 | 0 | 0 | 0 | 0 | 0 | +++ | 0 |
| 73 | F | 41 | 41 | 43 | 4 | 4E | 25 | gonadotroph | 0 | 0 | 0 | 0 | 0 | 0 | 0 | +++ | 0 |
| 62 | M | 33 | 44 | 35 | 4 | 4A | immature Pit-1 | 0 | 0 | 0 | 0 | 0 | 0 | + | -/+ | 0 | |
| 43 | M | 31 | 29 | 51 | 4 | 4E | 21 | immature Pit-1 | 0 | 0 | 0 | 0 | 0 | 0 | + | 0 | 0 |
| 57 | F | 30 | 45 | 31 | 3B | 4E | 21 | corticotroph | 0 | + | 0 | 0 | 0 | 0 | 0 | 0 | + |
| 63 | F | 26 | 34 | 43 | 4 | 4E | 19 | corticotroph | 0 | 0 | 0 | 0 | 0 | 0 | 0 | 0 | + |
| 44 | M | 37 | 44 | 56 | 4 | 4E | 50 | gonadotroph | 0 | 0 | 0 | 0 | 0 | + | 0 | + | 0 |
| 70 | F | 50 | 38 | 43 | 4 | 4E | 33 | gonadotroph | 0 | 0 | 0 | 0 | 0 | + | 0 | + | 0 |
| 57 | M | 32 | 40 | 40 | 4 | 4D | 13 | gonadotroph | 0 | 0 | 0 | 0 | 0 | + | 0 | + | 0 |
|
Overall (N=79) |
Hormonally inactive (N=62) |
Hormonally active (N=17) |
p-value |
||
| Age | 0.089 | ||||
| Mean (SD) | 57.2 (13.9) | 58.7 (13.0) | 51.8 (15.9) | ||
| Median [Q1-Q3] | 60.0 [47.5-68.5] | 62.0 [50.0-69.0] | 52.0 [39.0-64.0] | ||
| Min-Max | 23.0-82.0 | 27.0-82.0 | 23.0-77.0 | ||
| Gender | 0.24 | ||||
| F | 32 (40.5%) | 23 (37.1%) | 9 (52.9%) | ||
| M | 47 (59.5%) | 39 (62.9%) | 8 (47.1%) | ||
| Max size | 0.37 | ||||
| Mean (SD) | 27.8 (9.75) | 28.3 (9.75) | 25.8 (9.80) | ||
| Median [Q1-Q3] | 25.5 [21.6-33.0] | 26.0 [22.0-33.0] | 23.0 [20.0-29.0] | ||
| Min-Max | 5.50-56.0 | 5.50-56.0 | 8.00-45.0 | ||
| Missing | 1 (1.3%) | 1 (1.6%) | 0 (0%) | ||
|
Invasiveness on the Knosp scale |
0.65 | ||||
| Non-invasive | 37 (46.8%) | 28 (45.2%) | 9 (52.9%) | ||
| Invasive | 40 (50.6%) | 32 (51.6%) | 8 (47.1%) | ||
| Missing | 2 (2.5%) | 2 (3.2%) | 0 (0%) | ||
|
Invasiveness on the Hardy scale |
0.084 | ||||
| Non-invasive | 15 (19.0%) | 9 (14.5%) | 6 (35.3%) | ||
| Invasive | 62 (78.5%) | 51 (82.3%) | 11 (64.7%) | ||
| Missing | 2 (2.5%) | 2 (3.2%) | 0 (0%) | ||
| V (cm3) | 0.13 | ||||
| Mean (SD) | 8.51 (8.66) | 8.94 (8.72) | 7.05 (8.53) | ||
| Median [Q1-Q3] | 5.20 [3.15-10.1] | 5.60 [3.23-10.8] | 4.00 [1.40-8.60] | ||
| Min-Max | 0.200-50.0 | 0.800-50.0 | 0.200-33.0 | ||
| Missing | 4 (5.1%) | 4 (6.5%) | 0 (0%) | ||
| Type of PitNETs | < 0.0001* | ||||
| Gonadotroph | 44 (55.7%) | 44 (71.0%) | 0 (0%) | ||
| Gonadotroph/lactotroph | 2 (2.5%) | 0 (0%) | 2 (11.8%) | ||
| Corticotroph | 10 (12.7%) | 5 (8.1%) | 5 (29.4%) | ||
| Lactotroph | 4 (5.1%) | 1 (1.6%) | 3 (17.6%) | ||
| Null cell adenoma | 3 (3.8%) | 3 (4.8%) | 0 (0%) | ||
| Multiple synchronous | 4 (5.1%) | 3 (4.8%) | 1 (5.9%) | ||
| Thyrotroph | 1 (1.3%) | 0 (0%) | 1 (5.9%) | ||
| Somatotroph | 1 (1.3%) | 0 (0%) | 1 (5.9%) | ||
| Mature Pit-1-lineage tumor | 3 (3.8%) | 0 (0%) | 3 (17.6%) | ||
| Immature Pit-1 lineage tumor | 7 (8.9%) | 6 (9.7%) | 1 (5.9%) |
| Type of PitNET | PRL | ACTH | GH | TSH | LH | FSH | Pit - 1 | SF1 | TPit |
|---|---|---|---|---|---|---|---|---|---|
| gonadotroph | 0 | 0 | 0 | 0 | 0 | 0 | -/+ | ++ | 0 |
| immature Pit-1 lineage tumor | 0 | 0 | 0 | 0 | 0 | 0 | + | -/+ | 0 |
| gonadotroph | 0 | 0 | 0 | 0 | 0 | 1 | -/+ | + | 0 |
| immature Pit-1 lineage tumor | 0 | 0 | 0 | 0 | 0 | 0 | + | + | 0 |
| immature Pit-1 lineage tumor | 0 | 0 | 0 | 0 | 0 | 0 | + | -/+ | -/+ |
| gonadotroph | 0 | 0 | 0 | 0 | 0 | 0 | -/+ | + | 0 |
| gonadotroph/lactotroph | 1 | 0 | 0 | 0 | 0 | 1 | + | + | 0 |
| gonadotroph/lactotroph | 1 | 0 | 0 | 0 | 1 | 1 | + | + | 0 |
| immature Pit-1 lineage tumor | 0 | 0 | 0 | 0 | 0 | 0 | + | -/+ | + |
| mature Pit-1 lineage tumor | 1 | 1 | 1 | 0 | 1 | 1 | + | + | + |
| immature Pit-1 lineage tumor | 0 | 0 | 0 | 0 | 0 | 0 | -/+ | + | 0 |
| age |
sex | AP (mm) |
ML (mm) |
CC (mm) |
Knosp scale |
Hardy scale |
V cm3 |
subtype | ACTH |
|---|---|---|---|---|---|---|---|---|---|
| 41 | F | 14 | 17 | 11 | 2 | 2A | 1,9 | SGCT | 0 |
| 31 | M | 20 | 25 | 20 | 4 | 3B | 3,7 | Crooke | 1 |
| 72 | F | 23 | 22 | 20 | 4 | 3E | 4,6 | SGCT | 0 |
| 71 | M | no data | no data | no data | no data | no data | no data | silent | 0 |
| 38 | F | 4,5 | 5,5 | 4,5 | 1 | 1A | 0,8 | SGCT | 1 |
| 77 | M | 34 | 21 | 18 | 1 | 3C | 6,2 | Crooke | 1 |
| 57 | F | 30 | 45 | 31 | 3B | 4E | 21 | no data | 1 |
| 63 | F | 26 | 34 | 43 | 4 | 4E | 19 | silent | 0 |
| 49 | F | 27 | 26 | 27 | 2 | 3C | 8,6 | Crooke | 1 |
| 68 | F | 20 | 27 | 21 | 3A | 3 | 6 | SGCT | 1 |
| age | sex |
AP (mm) |
ML (mm) |
CC (mm) |
Knosp scale |
Hardy scale |
V cm3 |
Typeof PitNET |
Sub type |
PRL | ACTH | GH | TSH | LH | FSH | Pit-1 | SF1 | TPit |
| 35 | M | 20 | 22 | 29 | 1 | 2C | 8 | L | 1 | 0 | 0 | 0 | 0 | 0 | + | 0 | ||
| 23 | M | 28 | 35 | 29 | 4 | 4D | 12 | L | 1 | 0 | 1 | 0 | 0 | 0 | + | 0 | 0 | |
| 31 | M | 20 | 25 | 20 | 4 | 3B | 3,7 | C | CA | 1 | 1 | 1 | 0 | 0 | 0 | 0 | 0 | +++ |
| 77 | M | 34 | 21 | 18 | 1 | 2C | 6,2 | C | CA | 0 | 1 | 0 | 0 | 0 | 0 | 0 | 0 | + |
| 49 | F | 27 | 26 | 27 | 2 | 3C | 8,6 | C | CA | 0 | 1 | 0 | 0 | 0 | 0 | 0 | + | |
| 63 | F | 26 | 34 | 43 | 4 | 4E | 19 | C | silent | 0 | 0 | 0 | 0 | 0 | 0 | 0 | 0 | + |
| 71 | M | C | silent | 0 | 0 | 0 | 0 | 0 | 0 | 0 | 0 | +++ | ||||||
| 75 | M | 6 | 17 | 6 | 1 | 2A | 0,5 | Ph | 1 | 1 | 1 | 0 | 1 | 1 | + | + | + | |
| 66 | F | 8 | 8 | 6 | 0 | 0,2 | Ph | 1 | 0 | 1 | 1 | 0 | 0 | + | 0 | 0 | ||
Disclaimer/Publisher’s Note: The statements, opinions and data contained in all publications are solely those of the individual author(s) and contributor(s) and not of MDPI and/or the editor(s). MDPI and/or the editor(s) disclaim responsibility for any injury to people or property resulting from any ideas, methods, instructions or products referred to in the content. |
© 2025 by the authors. Licensee MDPI, Basel, Switzerland. This article is an open access article distributed under the terms and conditions of the Creative Commons Attribution (CC BY) license (http://creativecommons.org/licenses/by/4.0/).


