
Submitted:
08 July 2025
Posted:
09 July 2025
You are already at the latest version
Abstract
We summarize the experience of studying 2D features in the galaxy distribution of galaxy cluster fields. For detailed study of the inner structure of galaxy clusters, algorithms were developed for detecting various types of regular substructures inside such objects automatically. Substructures in galaxy clusters arise from interactions as well as evolution of the cosmic web, but cannot be described according to the schemes of morphological classification, both classical and modern, because some regular substructures are not present. Our algorithms are based on numerical criteria that permit the determination of classical morphological types, connected with parameters such as the degree of concentration to the cluster center and/or to a straight line, on a statistically significant level. Other types of substructures can also be detected with corresponding algorithms. As a result, we can analyze intracluster features, such as crosses, semi-crosses, complex crosses, and compact dense chains. All algorithms are realized in the “Cluster Cartography” tool and can be used with data taken from different catalogues. The algorithms and their realization in program code must simplify, standardize, and speed up the analysis of 2D distributions of galaxies in clusters. It is possible in future to adapt the algorithms for the 3D case. The results of statistically-valid morphological classification are useful for studies of the evolution of galaxy clusters.
Keywords:
galaxy clusters
; morphology
; methods
; data analysis
; statistical
1. Introduction
Modern systematic surveys of extragalactic objects are excellent material for the study of large-scale structure in the Universe: the galaxy distribution is organized in a complex network with filaments surrounding underdense regions and crossing at overdensities, which host galaxy clusters.
Classification is an essential stage of any scientific study, and galaxy cluster morphological classification is not an exception to the rule. The features of galaxy morphology for clusters at optical and X-ray wavelengths permit one to highlight subtypes that occur in interactions between cluster members, in interactions with neighboring elements of the Large Scale Structure of the Universe, or at their evolutionary stage. The three main components of a galaxy cluster are best established using different instruments and methods of study. Galaxies presently are the main optical markers of structure in other, more massive, cluster components – dark matter and intracluster gas. Common features in various, modern, numerical simulations must agree with the distribution of true cluster members.
The basis of morphological classification in the optical is the distribution of galaxies in a cluster field. The first catalogues by Abell [1] and maps by Zwicky et al. [2] of galaxy clusters were created on Palomar Sky Survey plates. Simultaneously, the first attempts at the classification of galaxy clusters were executed: Abell [1] proposed an initial approach and divided clusters into rich and poor, as well as into regular and irregular morphologies; Zwicky et al. [2] proposed another separation into compact, medium-compact, and open clusters. Prevalent during the era of Bautz-Morgan (BM) classification [3] was the relative contrast (dominance in extent and brightness) of the brightest galaxy relative to other cluster members, ranging from type I to III in decreasing order of dominance. Rood and Sastry [4] and later Strubble and Rood [5] used the geometry in their system of the distribution of the ten brightest members, and divided clusters into cD, with the brightest giant central galaxy, binary B, core C, line L, and F, irregular I. Oemler [6] recognized three types of clusters that depended on the prevalent type of galaxies: “spiral rich”, “spiral poor”, and “cD”. The last type describes clusters with a dominant giant elliptical cD galaxy at the center. López-Cruz et al. [7] and López-Cruz [8] introduced the same type as special, proposing the definition of cD clusters; the complement to that class was called non-cD clusters. Bahcall [9] summarized the properties of clusters and groups of galaxies. Panko [10] proposed an integrated approach based on the generalization of the listed classical schemes and the quality of the observational material, PF catalogue [11], for the morphology classification of galaxy clusters.
The correspondence of these schemes is demonstrated in Table 1.
At first, the Panko [10] scheme was based on numerical criteria. That permitted detection of differences in concentration towards the cluster center (C – compact, I – intermediate, and O – open clusters), and/or to some preferential line (L or F types, depending on degree of concentration). The role of bright cluster members is also indicated in that scheme as cD or BG with an Arabic numeral corresponding to the number of significant bright galaxies. Other features are marked as P. Later [12], the symbol F for concentration to a preferential line was excluded, and the symbol L was modified to L with an Arabic numeral (5, 7, 9, 11) according to the degree of concentration to the line. The statistical approach became the next step in the study: it permits detection of other regular peculiarities, such as X- and Y-types (crosses and semi-crosses), curved bands, and short dense chains [12, as quoted there]. Simultaneously, the criteria for feature detection were changed from numerical to statistical. The statistical criteria were based on the difference in the value of the normalized surface density to the overdensity region and its average value calculated for other parts of the cluster field, at the level 2σ and more. The overdense region can be either round or elongated in shape. During testing of the scheme, it was found that crosses and semi-crosses are not rare features of the inner structure of galaxy clusters, and an algorithm for detection of cruciform substructures was constructed.
Here we describe computer algorithms for analysis of such features. All algorithms were tested both on real and simulated clusters. The data set containing the data for real clusters was the list of the 247 ACO clusters with the corresponding PF clusters. The algorithms were then applied to the detection of substructures in about 500 PF clusters, and the results are used as illustrations in the corresponding topics.
2. Observational Basis for the Study
The classification scheme proposed by Panko [10] was initially intended for studing the morphology of rich galaxy clusters extracted from “A Catalogue of Galaxy Clusters and Groups” (PF hereinafter) [11]. The PF catalogue was created from the Münster Red Sky Survey galaxy list [13], MRSS hereinafter. The MRSS is the last photographic sky survey, and high-quality, but, unfortunately, 2D. It includes 217 ESO Southern Sky Atlas R Schmidt plates, obtained at La Silla Observatory. The survey covers an area of 5000 square degrees in the region of Galactic latitudes b < –45°. The plates were digitized using two PDS 2020GMplus microdensitometers of the Astronomisches Institut at Münster. The classification of objects into stars, galaxies, and perturbed objects was done by an automatic procedure, with a posterior visual check of the automatic classification. The external calibration of the photographic magnitudes was carried out using CCD sequences obtained with three telescopes in Chile and South Africa [13]. The MRSS contains positions, red magnitudes rF, radii, ellipticities, and position angles in the best fitted ellipse approximation for about 5.5 million galaxies to rF = 24m. The MRSS galaxy list is complete to magnitude rF = 18.3m, i.e., MRSS contains all galaxies to that magnitude. About 1.2 million galaxies in the completeness limit were used as input data for creating the PF catalogue [11]. Each PF cluster has several parameters including: Right Ascension and Declination (2000.0), equivalent radius in arc seconds for full area of structure, the number of galaxies, major and minor semiaxes of the best fitted ellipse, ellipticity of the structure (E=1 – b/a, where a, b are ellipse semiaxes), the position angle of the major axis of structure (counted clockwise from direction to the North Celestial Pole, as for the position angle of galaxies in the MRSS). We also have the full list of galaxies in each cluster field. That provides a qualitative observational basis for the study of the 2D distribution of galaxies in the cluster fields.
From 460 PF galaxy clusters of richness 100 or more and with no boundary effects, only 247 have counterparts in the ACO [14] catalogue. Accordingly, only those clusters have BM and Abell morphological types. There is a connection between the magnitude limit for the Palomar Observatory Sky Survey and the ESO Southern Sky Atlas R Schmidt platess. Nevertheless, even the short list of PF galaxy clusters leads to significant results [15,16]. Yet the determination of morphological types for other PF clusters becomes necessary, with our main goal here being the detection of substructures in the clusters.
Based on the adopted classification scheme, the derived algorithms determine the requirements for cluster mapping, the method for establishing excess concentration to the cluster centers and/or linear concentrations, as well as for detecting other features in the positions and orientations of galaxies. In the next section, we demonstrate the algorithms for MRSS and PF data. They can be readily adapted to other lists of galaxies.
3. The Algorithms for the Features Search
3.1. Cluster Mapping
As a first step, we generate a cluster map suitable for visual control. The equatorial coordinates are recalculated as rectangular coordinates in the usual manner, with point (0, 0) corresponding to the cluster center. The size of the cluster map, 4000×4000 arc seconds, is selected in order to show the positions of galaxies at a convenient scale.
The best way to visualize galaxies in the map is by using symbols with the same shapes and orientations as galaxies in the MRSS. The brightness (magnitude) of each galaxy is an important integral parameter, so the symbol size must be associated with it. We adopted the size of each circle symbol m’ as:
where a, b, c, d and f are constants, and m is the magnitude of the galaxy cited in the catalogue.
m’=a×bc(d – m)+ f,
For MRSS data for the selected size of the map, the equation is:
m’=3×20.6(18.5–m)+6.
For other catalogues, the conversion constants must be calculated separately. As the next step, we must determine the symbol shape and orientation corresponding to the galaxy parameters. We assume that an ellipse is the appropriate figure for the symbol and calculate the axes A and B of each ellipse using the ellipticity E from MRSS. We assume that the areas of the ellipse and a circle with diameter m’ are equal. The appropriate equations are:
where A and B are the axes of the elliptical symbol for the galaxy at the scale of the map, and E is the ellipticity of the image of the galaxy, according to the value cited in MRSS.
The sizes of galaxies in arcseconds are small for the map scale. The computer code must also indicate each galaxy according to its angular size by a specific magnification.
The positional angle of the major axis of the symbol must also correspond to MRSS data. The brightest cluster members can be noted by darker symbols: the brightest galaxy can be shown in black, the second-ranked in dark grey, etc.
The realization of such a cluster mapping was presented in [12], and examples of maps for the PF 0020-4224 and PF 2199-2391 clusters are shown in Figure 1. The PF 0020-4224 cluster (Figure 1a) has crossed filaments (X-type), and the brightest cluster members are aligned across the dominant linear substructure. The PF 2199-2391 cluster (Figure 1b) has the brightest galaxy in the cluster center, with no significant concentration toward the cluster center. As a difference from PF 0020-4224 in Figure 1a, for PF 2199-2391 the cruciform feature (Y-type) is not seen, but was detected by the corresponding algorithm.
3.2. The Detection of the Degree of Concentration Toward the Cluster Center
A standard morphological feature, beginning with Abell [1], Zwicki et al. [2], and Bautz and Morgan [3], is the degree of concentration toward the cluster center. Abell’s regular clusters correspond to Zwicki et al. compact ones, BM I type, and C in the Panko [10] scheme. We show typical histograms for concentrated C and open O clusters in Figure 2. To search for such features, the cluster field is divided into concentric ring zones, and the normalized density of galaxies f’ in each zone is calculated taking into account the difference in areas of the zones. Histograms of the normalized density f’ permit one to establish a statistically valid degree of concentration.
For C-type clusters (Figure 2a), the overdense region is well-defined with a typical size of 0.1 of the radius of the cluster. For PF 2187-1958 the calculations indicate a mean normalized density value for all zones, excluding the central zone, of 0.0109 with a Standard Deviation of 0.0075. The normalized density f’ of the central zone is 0.105, and we assume the peak in Figure 2a is statistically significant. For I-type, the overdense region has blurred borders and its radius is larger than in C-type. It is typically about 0.15 of the radius of such clusters. Open galaxy clusters have no significant concentration toward the cluster center (Figure 2b). In the program code, the position of the maximum of normalized density and the normalized densities of galaxies in each circle zone for the histogram must be calculated automatically. Additionally, if any cluster has two overdense regions, the positions of the secondary center (or some other such feature) must be set separately with corresponding calculations and histograms. The number of zones is typically 10, but it can be changed if necessary.
3.3. The Detection of the Linear Substructures
One more standard morphological feature in galaxy clusters is linear substructure. It can also be detected by corresponding calculations and histograms. The cluster field in such cases is divided into N parallel zones, and the normalized density of galaxies f’ in each zone is calculated. Our experience indicates that N can be 5, 7, 9, 11, etc, because for in the typical case the overdense bands passes through the central part of the cluster, i.e., the number of parallel zones must be odd. We have checked value 3, but significant detection of the band is possible starting from value 5. The width of the zone in the map is calculated according to the diameter of the cluster and noted in the histograms as part of the diameter. The parallel grid rotates relative to the cluster with a step of 1°. The maximal value of the normalized density f’ corresponds to the direction of the linear substructure. If the linear substructure is real, variations in the studied region or number of zones give the difference in the derived value of the position angle in the limit 3°. Thus, step 1° is optimal. For the detection of linear substructure, the overdensity of its band must be statistically different from the mean density of other bands (Figure 3a,b). The number of parallel zones is transformed to an Arabic numeral in L-classification.
The case L7 (OL 7-type clusters PF 0121-3001, Figure 3a) is clearly different from the L11 case (OL 11-type cluster PF 0443-4308, Figure 3b) by the width of the overdense band. We did not detect a linear substructure like L13. In program code, the direction and densities of galaxies in each band zone for the histogram are determined automatically. Additionally, if any cluster has two overdense bands, the positions of the secondary one (or some other direction) must be set separately with corresponding calculations and histograms. For C or I clusters, the central zone must be excluded from the analysis because the central condensation distorts the distribution in the zone. For example, for some C or I type clusters that have no linear substructure, the low overdensity in any band with the contribution of central cluster members becomes significant. As a result, the L-type for such cluster will be assumed falsely
These 2 steps allow us to classify the clusters as C, I, or O morphological types and add the L-type with the Arabic numeral (5, 7, 9, 11) according to the overdense band width, if it is detected.
3.4. The Detection of Complex Regular Substructures
About 20% of clusters in our data set (PF catalogue) have regular nonstandard features in their 2D distributions of galaxies in the cluster field. We detected crossed or merged linear substructures (X, Y, and complex cruciform types) and compact chains [12, as quoted there]. We did not find the classification of such clusters in the literature. Nevertheless, the detected peculiarities are statistically significant; they reflect the evolutionary moments in cluster forming, as was shown in numerous numerical simulations by the famous Millennium Simulation [17] to modern Illustric [18], EAGLE [19], and The Uchuu simulations [20], for example. The manner of detecting cruciform peculiarities is the “lighthouse beam” analysis. The cross in the cruciform corresponds to the position of the origin of the “lighthouse beam”. The width of the beam is set as N (5, 7, 9, 11), as for the detection of linear substructures, but the number of galaxies must be calculated only for the upper half of the zone, much like the real beam of a lighthouse. The steps for beam rotation are also 1°, and we obtain the galaxy counts for each angle. Visual control can be executed in the cluster map. The example of “lighthouse beam” analysis for clusters is shown in Figure 4. For the PF 0020-4224 histogram for the width of the beam 1/7 of the diameter, we detect the 4 maxima (in Figure 4a they are marked with arrows) corresponding to the directions of portions of the cruciform substructures. The map of this cluster was shown in Figure 1. The X-type substructure is seen and underlined by the positions of the 6 brightest galaxies. The Y-type substructure in PF 2199-2391 is detected in the histogram, and is smoothed out when looking at the map.
3.5. Additional Modes in the Program Code
All described algorithms are realized in the “Cluster cartography” tool (CC) [12]. At present, the final version of the CC code is being tested. The CC tool consists of 2 parts. The first part, “CC_Input” recalculates catalogue data to the input CC format: rectangular coordinates X and Y, the symbol size m’, ellipticity from catalogue E, positional angle PA, and sign of the brightest galaxy, 0 by default, 1 for brightest galaxy, 2 for the second-rank galaxy, etc. The next part executes other steps, including recalculation of the major and minor axes of the ellipse from m’ and E. Additionally, sometimes there is a need to export information about galaxies forming the features. CC makes it, as well as exports all images, namely the cluster map, cluster map with zones, and histograms for analysis.
One more mode is realized for checking the presence of the Binggeli effect [21] in the detected substructures. It must be presented as a histogram for the values of the acute angle between the direction to the nearest neighbour and the positional angle of the major axis of the galaxy image. The alignment of galaxies in the substructure must also be studied in computer code.
The next mode, “Hubble mix,” the ratio of the counts of elliptical and spiral galaxies in the cluster, can be estimated as an excess in the distribution of ellipticities of galaxies in a case when we do not know their morphological types. Panko and Flin [22] compare the individual distribution of ellipticities for two PF clusters having the same morphological type I and estimated redshifts. They detected two kinds of ellipticity distributions: bimodal and single-mode. Maximum frequency in the single-mode clusters corresponds to the bin 0.2 – 0.3; for bimodal clusters, the main peak occurs in the bin 0.1 – 0.2, with a secondary maximum in the bins 0.4 – 0.6, corresponding to the spiral/disk rich type. CC can also build the distribution of ellipticities.
All histograms and maps of the cluster can be exported as pictures for future use with the cluster name.
4. Discussion
The proposed algorithms allow us to detect interesting features in 2D galaxy distributions, such as linear bands, crosses, compact or curved chains. The rapid and statistically valid detection of substructures in galaxy clusters is one way to compare the galaxies (optical), intracluster gas (X-ray), and DM distributions. The main goal of the application of the proposed algorithms shifted from purely morphological classification to the search for features associated with the evolution of galaxy clusters, according to [4]. Interaction between such clusters manifests itself in the presence of “bridges” between clusters, as shown in Dietrich et al. [23], Gu et al. [24], or HyeongHan et al. [25]. The “bridge” manifests in hot gas and DM distributions [23]. For one data set Tugay et al. [26] detected the coincidence of directions for linear substructure in the PF 2187-1958 galaxy cluster and the corresponding X-ray image. Our cluster maps and radio or X-ray images can be compared using the positions of the compass substructures and the positions and orientations for the elongated substructures, as in the noted paper. Cluster X-Ray Morphological Classes by Jones and Forman [28] have a good correspondence with Panko types: type S (single symmetric peak) corresponds to CcD; O (offset center) and E (elliptical)—to L-type, etc. We plan to obtain one more data set for comparison of optical and X-ray data, and also with simulated galaxy cluster mergers.
The directions of linear and/or cruciform substructures are connected with the positions of neighbors, as in the Binggeli effect [21] The alignment of galaxies on the substructures must correspond to Joachimi et al. [28]. They demonstrated that elliptical galaxies tend to align their major axes with the linear substructure direction, while disk galaxies tend to align their spin perpendicular to the linear substructure direction (Figure 1a). The confirmation of such alignments provides evidence for the physical nature of the detected substructures.
5. Conclusions
The proposed algorithms permit the determination of morphological types for galaxy clusters using the scheme by Panko [10]. Additional possibilities permit discussion of the evolutionary status of galaxy clusters. Complex inner structure is likely for young clusters. The excess of spiral/disk galaxies is also noted for young clusters. The Strubble and Rood [5] ideas about the evolution of galaxy clusters from open ones without any substructures to relaxed, concentrated cD clusters are consistent with previous results obtained with PF and MRSS data. The main goal of the present paper is a detailed description of the algorithms, as the basis for future studies.
There is no fundamental difference between morphological features in 2D and 3D data. The concentration to a point must be conserved; the concentration to a line can be cruciform or transformed to the concentration to the plane, cruciform features and compact chains must also be conserved. 2D analysis requires much less time. It can be used in the first step of a study: open clusters without features can be excluded from future consideration. Moreover, even SDSS data are cut off at specific redshifts by magnitude, and only the brightest galaxies outline the clusters, for example [29]. From that point of view the PF and MRSS data with completeness to rF =18.3m remain important and promising observational data for studying the morphology of galaxy clusters. The proposed algorithms standardize the process while “Cluster cartography” improves its efficiency. The approach can be adapted to input data from other catalogues, but the main task remains the morphology of PF galaxy clusters and the comparison of the results with numerical simulations. The updated computer code for Cluster Cartography in online mode [30] has important prospects for galaxy cluster studies.
Supplementary Materials
The following supporting information can be downloaded at the website of this paper posted on Preprints.org
Funding
This research was partially funded by the SAIA n. o. the National Scholarship Program of the Slovak Republic and Pavol Jozef Safarik University in Kosice.
Acknowledgments
This research has made use of NASA’s Astrophysics Data System. The author is thankful to I. Vavilova for useful comments during the preparation of the paper.
Conflicts of Interest
The author declares no conflicts of interest.
Abbreviations
The following abbreviations are used in this manuscript:
| MRSS | Münster Red Sky Survey |
| PF | A Catalogue of Galaxy Clusters and Groups |
References
- Abell, G.O. The Distribution of Rich Clusters of Galaxies. Astrophys. J. Suppl. Ser. 1958, 3, pp. 211–288. [CrossRef]
- Zwicky, F.; Herzog, E.; Wild, P.; Karpowitz, M.; Kowal, C.T. Catalogue of Galaxies and of Clusters of Galaxies (6 Vols), Pasadena, California Institute of Technology, 1961 – 1968, pp. 1–43.
- Bautz, L.P.; Morgan, W.W. On the Classification of the Forms of Clusters of Galaxies. Astrophys. J. 1970, 162. L149–L153. [CrossRef]
- Rood, H.J.; Sastry, G. N. “Tuning Fork” Classification of Rich Clusters of Galaxies. Publ. Astron. Soc. Pacific. 1971, 83, pp. 313–319. [CrossRef]
- Struble, M. F.; Rood, H. J. A catalog of morphological properties of the 2712 Abell clusters. Astrophys. J. Suppl. Ser. 1987, 63, pp. 555–613. [CrossRef]
- Oemler, A. Jr. The Systematic Properties of Clusters of Galaxies. Photometry of 15 Clusters. Astrophys. J. 1974, 194, pp. 1–19. [CrossRef]
- López-Cruz, O.; Yee, H.K.C.; Brown, J.P.; Jones, C.; Forman, W. Are Luminous cD Halos Formed by the Disruption of Dwarf Galaxies? Astrophys. J. 1997, 475, L97–L101. [CrossRef]
- López - Cruz O. The Classification of Clusters of Galaxies: Comments on the Proposal of a New Subclass. In: The Garrison Festschrift: held in Tucson, Arizona. Gray, R.O.; Corbally, C.J.; Philip, A. G. D., Eds.; L. Davis Press, Schenectady, NY, 2003; pp. 109–122.
- Bahcall N. A. Clusters and Superclusters of Galaxies. In: Formation of Structure in the Universe. Dekel, A;. Ostriker, J. P.; Eds.; Cambridge University Press, 1999; pp. 135–171. https://arxiv.org/abs/astro-ph/9611148.
- Panko, E. A. The Criteria for Morphological Classification of PF Galaxy Clusters. Odessa Astron. Publ. 2013, 26, pp. 90−93. [CrossRef]
- Panko, E.; Flin, P. A Catalogue of Galaxy Clusters and Groups Based on the Muenster Red Sky Survey. Journal of Astron. Data. 2006, 12, pp. 1−9.
- Emelyanov, S.I.; Panko, E.A. The Possibilities of the “Cluster Cartography” Tool for the Study of the Inner Structures of Galaxy Clusters. Odessa Astron. Publ. 2021, 32, pp. 35−39. [CrossRef]
- Ungruhe, R.; Seitter, W.C.; Duerbeck, H.W. The Muenster Red Sky Survey: Large-scale Structures in the Universe. Journal of Astron. Data. 2003, 9, pp. 1−12.
- Abell, G.O.; Corwin, H.G.; Olowin, R.P. A Catalog of Rich Clusters of Galaxies. Astrophys. J. Suppl. Ser. 1989, 70, pp. 1−138. [CrossRef]
- Godłowski, W.; Piwowarska, P.; Panko, E.; Flin, P. The Orientation of Galaxies in Galaxy Clusters. Astrophys. J. 2010, 723, pp. 985−992. [CrossRef]
- Panko, E.; Juszczyk, T.; Flin, P. Orientation of Brighter Galaxies in Nearby Galaxy Clusters. Astron. J. 2009, 138, pp. 1709−1713. [CrossRef]
- Springel, V.; White, S.D.M.; Jenkins, A.; Frenk, C.S.; et al. Simulations of the formation, evolution and clustering of galaxies and quasars. Nature, 2005, 435, Issue 7042, pp. 629−636. https://arxiv.org/abs/astro-ph/0504097. [CrossRef]
- Vogelsberger, M.; Genel, S.; Springel, V.; Torrey, P; et al. Introducing the Illustris Project: simulating the coevolution of dark and visible matter in the Universe. Mon. Notic. Roy. Astron. Soc. 2014, 444, pp. 1518−1547. [CrossRef]
- Artale, M.C.; Pedrosa, S.E.; Trayford, J.W.; Theuns, T.; et al. Small-scale galaxy clustering in the EAGLE simulation. Mon. Notic. Roy. Astron. Soc. 2017, 470, pp. 1771−1787. [CrossRef]
- Ishiyama, T.; Francisco, P.; Klypin, A.A.; Sinha, M.; et al. The Uchuu simulations: Data Release 1 and dark matter halo concentrations. Mon. Notic. Roy. Astron. Soc. 2021, 506, pp. 4210−4231. [CrossRef]
- Binggeli, B. The shape and orientation of clusters of galaxies. Astron. and Astrophys. 1982, 107, pp. 338-349. https://ui.adsabs.harvard.edu/link_gateway/1982A%26A...107..338B/ADS_PDF.
- Panko, E. A.; Flin, P. The Ellipticities of Galaxies in Galaxy Clusters of Different Morphological Type. Odessa Astron. Publ. 2014, 27, pp. 32−33.
- Dietrich, J. P.; Werner, N.; Clowe, D.; Finoguenov, A. et al. A filament of dark matter between two clusters of galaxies. Nature, 2012, 487, pp. 202–204. https://arxiv.org/abs/1207.0809. [CrossRef]
- Gu, L.; Akamatsu, H.; Shimwell,T. W.; Intema, H. T.; et al. Observations of a pre-merger shock in colliding clusters of galaxies. Nat Astron, 2019, 3, pp. 838−843. https://arxiv.org/abs/1906.10285. [CrossRef]
- HyeongHan, K.; Jee, M.J.; Lee, W.; ZuHone, J.; at al. Direct evidence of a major merger in the Perseus cluster. Nat Astron. Advanced Online Publication. 2025. E-Print Comments: accepted to Nature Astronomy for publication. https://arxiv.org/abs/2405.00115 . [CrossRef]
- Tugay, A. T.; Dylda, S. S.; Panko, E. A. X-Ray Emission and Orientation of Selected PF Galaxy Clusters. Odes. Astron. Publ. 2016, 29, 34−36. [CrossRef]
- Jones, C.; Forman, W. Einstein Observatory Images of Clusters of Galaxies. Astrophys. J. 1999, 511, pp. 65−83. [CrossRef]
- Joachimi, B.; Cacciato, M.; Kitching, T. D.; Leonard, A.; et al. Galaxy alignments: An overview. Space Sci. Rev. 2015, 193, pp. 1−65. [CrossRef]
- Wen, Z. L.; Han, J. L.; Liu, F. S; Galaxy Clusters Identified from The SDSS DR6 and their Properties. Astrophys. J. Suppl. Ser. 2009, 183, pp. 197−213. [CrossRef]
- Yemelianov, S.I.; Panko, E.A. Cluster Cartography. Online https://clustercartography.github.io/ (accessed on 25.05.2025).
Figure 1.
The maps for two PF galaxy clusters. The axes units are arcseconds; the size symbol corresponds to the rF magnitude of the galaxy. The brightest galaxy is shown as black, the next-ranked galaxies are grey. The alignment of the brightest galaxy along its mother substructure is seen in PF 0020-4224. .
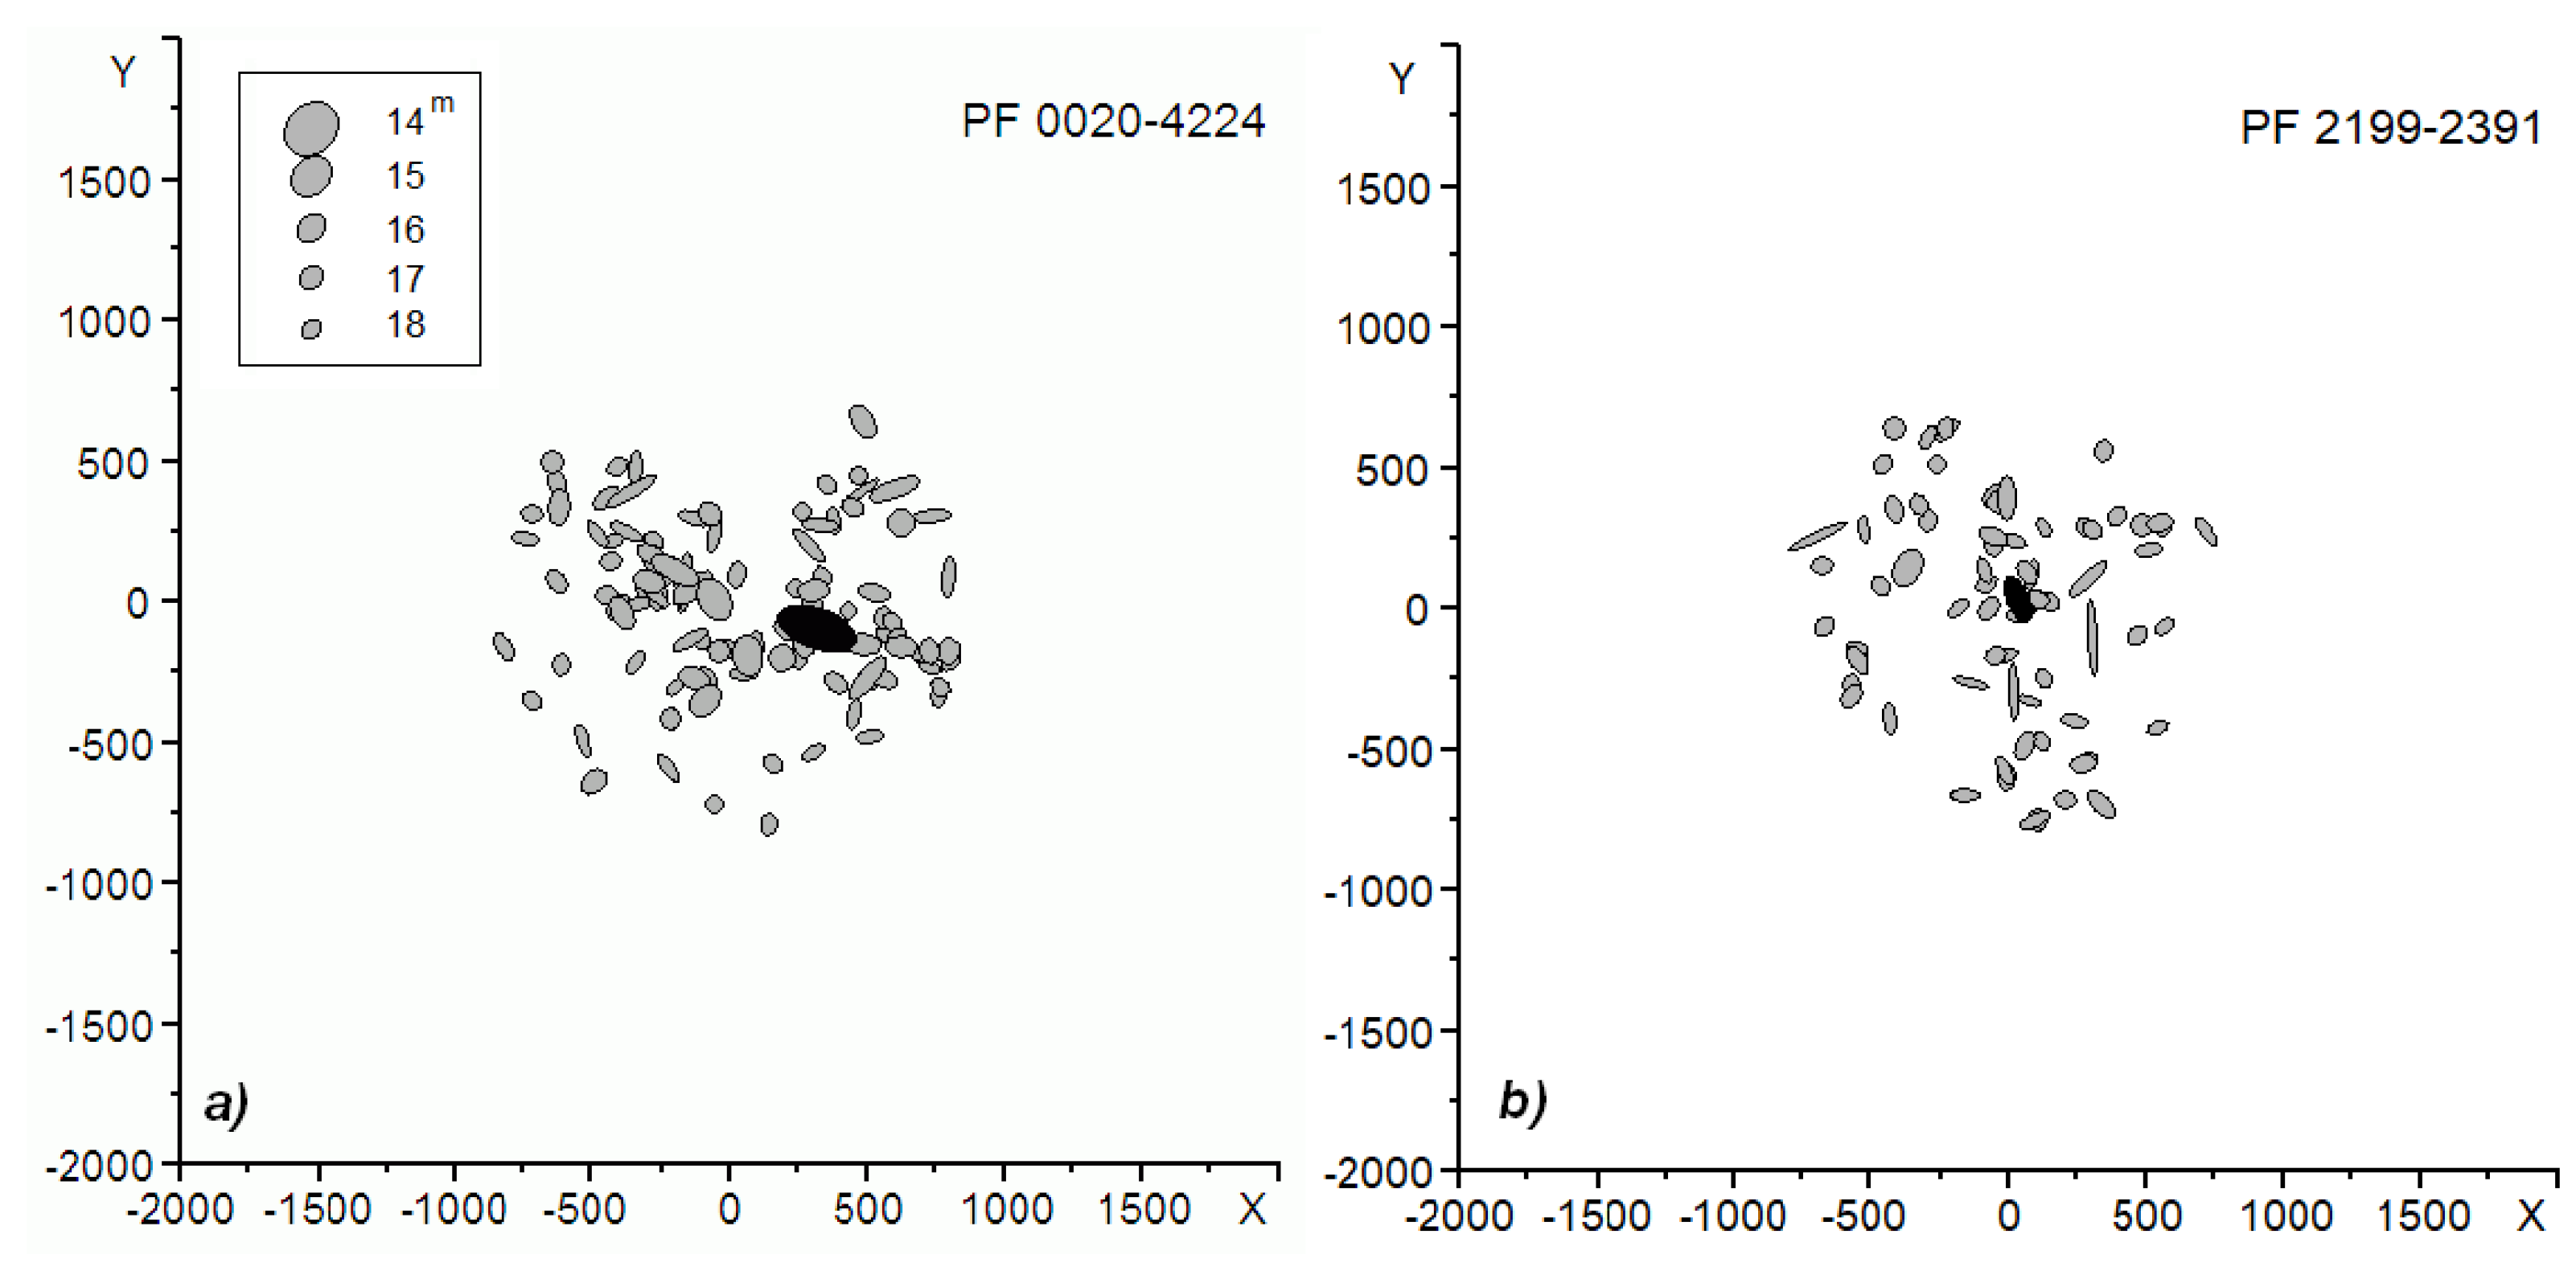
Figure 2.
The distributions of the normalized densities f’ of galaxies in the ring zones: a) C-type clusters PF 2187-1958 with significant overdense central zone; b) O-type cluster PF 0031-2046 displaying a relatively smooth distribution. R is the cluster radius.
Figure 2.
The distributions of the normalized densities f’ of galaxies in the ring zones: a) C-type clusters PF 2187-1958 with significant overdense central zone; b) O-type cluster PF 0031-2046 displaying a relatively smooth distribution. R is the cluster radius.
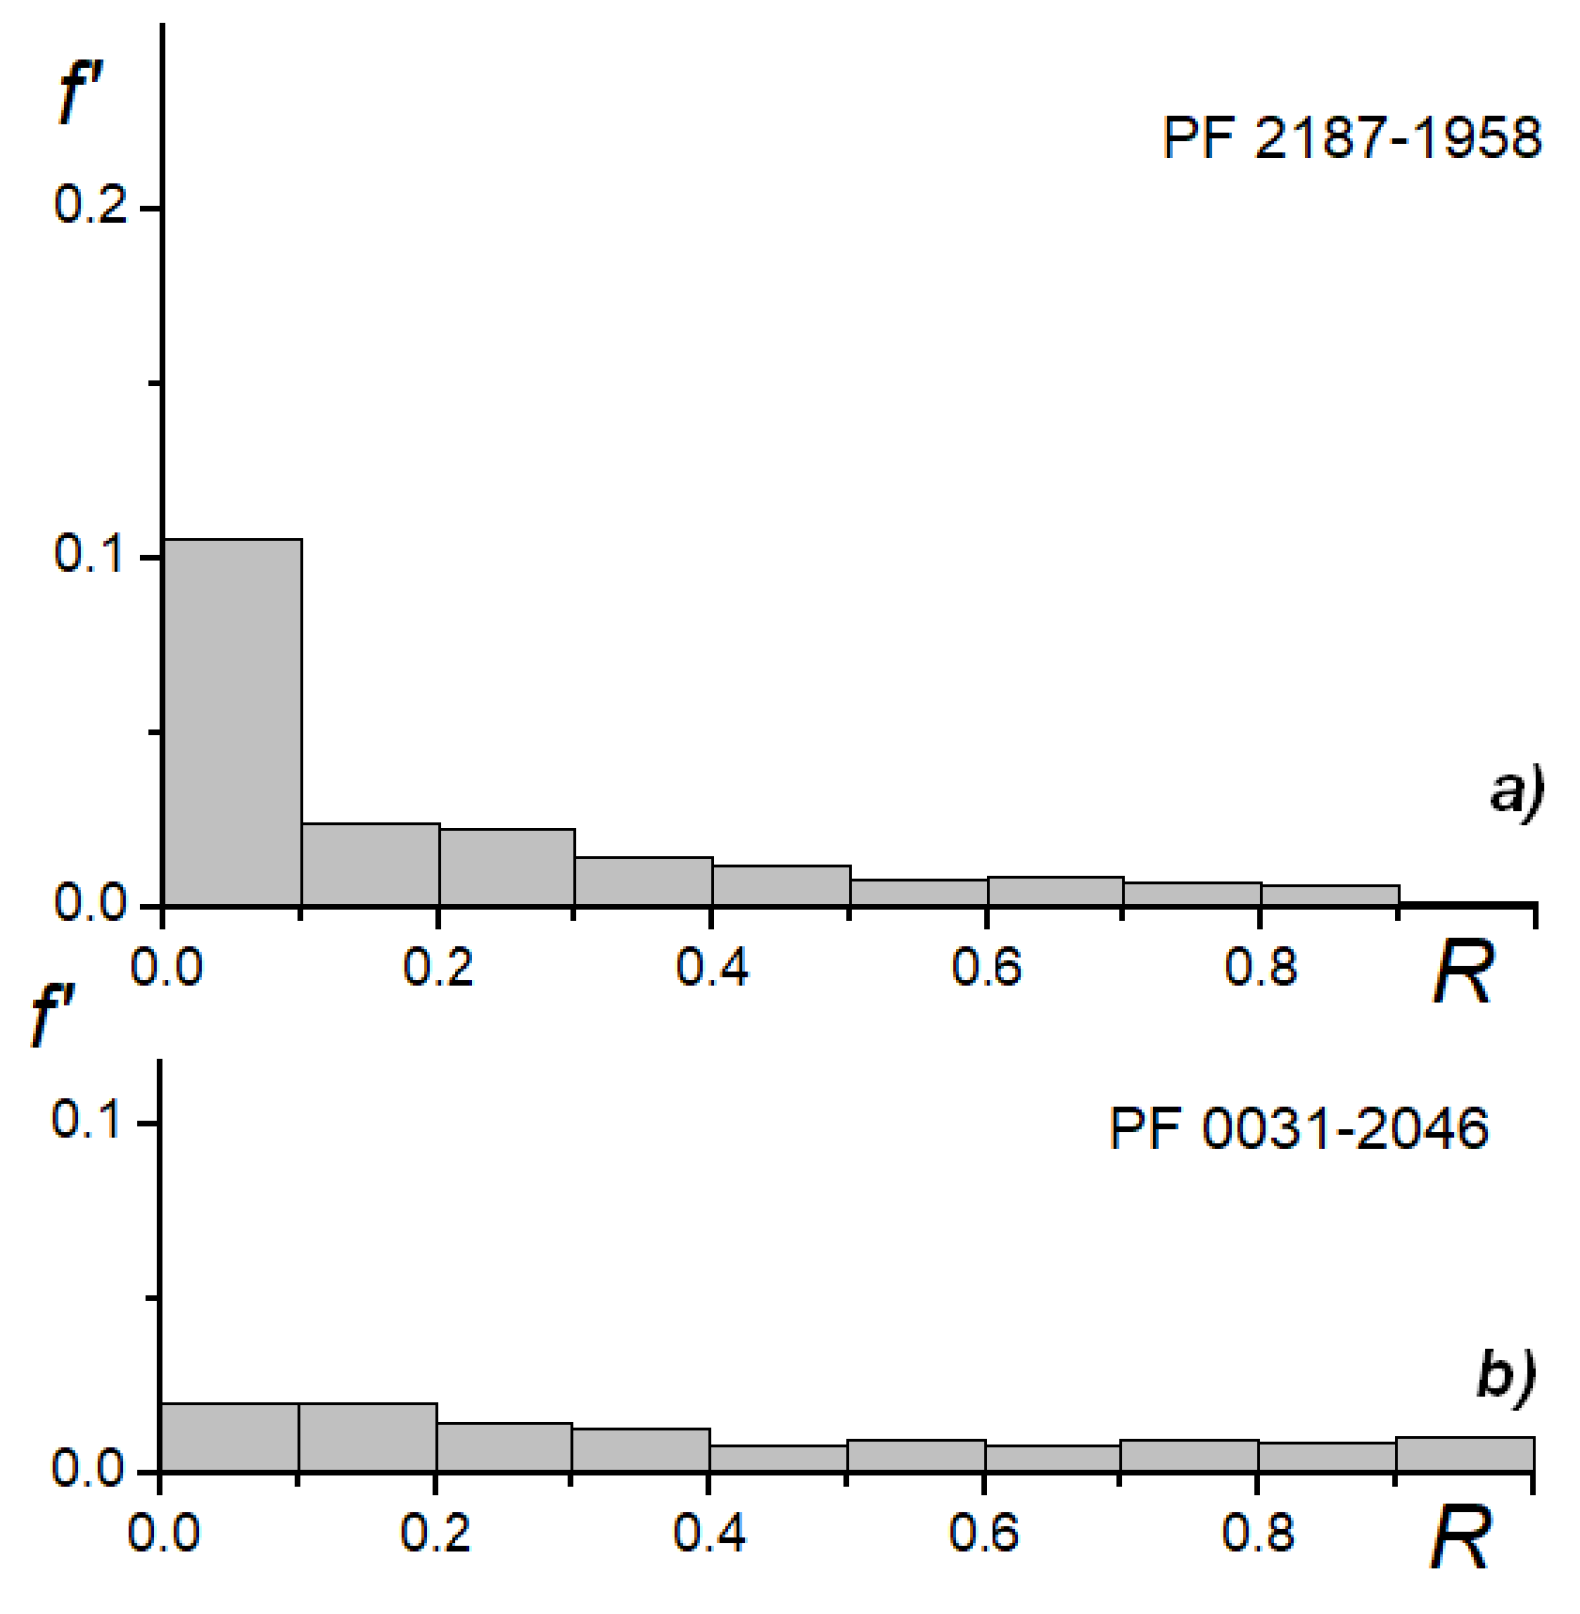
Figure 3.
The distributions of densities of galaxies in parallel zones: a) OL7-type clusters PF 0121-3001, b) OL11-type cluster PF 0443-4308. In both cases, the filamentary feature is well-defined, with sharp borders. D is the cluster’s diameter.
Figure 3.
The distributions of densities of galaxies in parallel zones: a) OL7-type clusters PF 0121-3001, b) OL11-type cluster PF 0443-4308. In both cases, the filamentary feature is well-defined, with sharp borders. D is the cluster’s diameter.
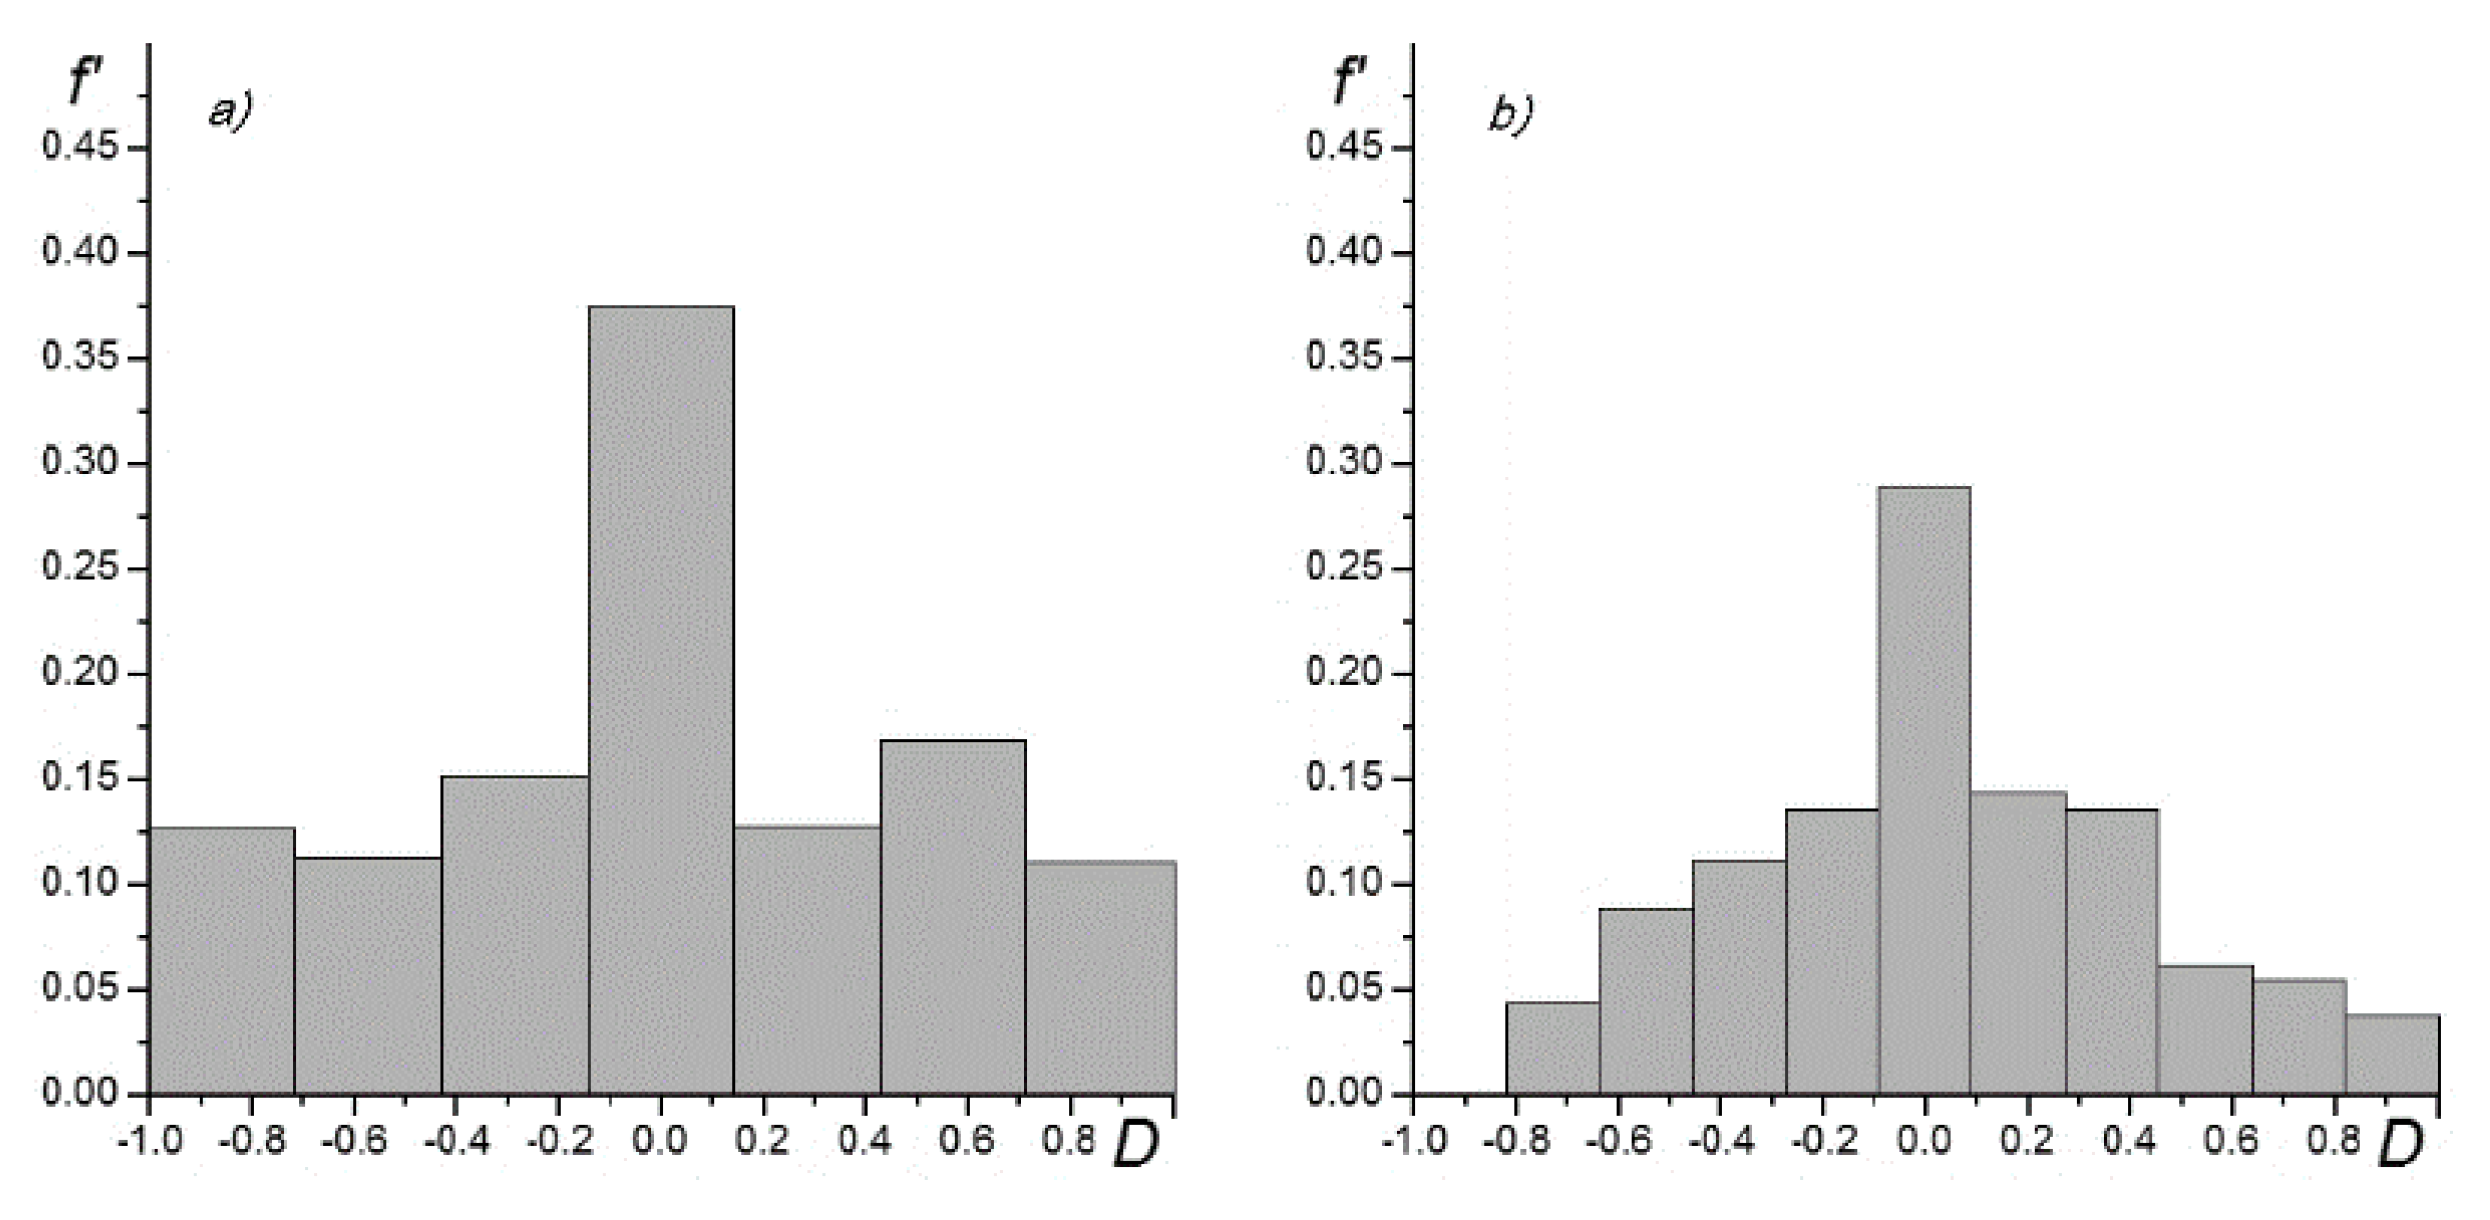
Figure 4.
The “lighthouse beam” analysis for the clusters PF 0020-4224 (X-type) and PF 2199-2391 (Y-type). Unsmoothed values are shown. α is the positional angle of the substructure element; for clarity, the angle is shown within the range 0°− 365°. The peaks in the distributions correspond to the elements of cruciform substructures; the spatial maps of the clusters are shown in Figure 1.
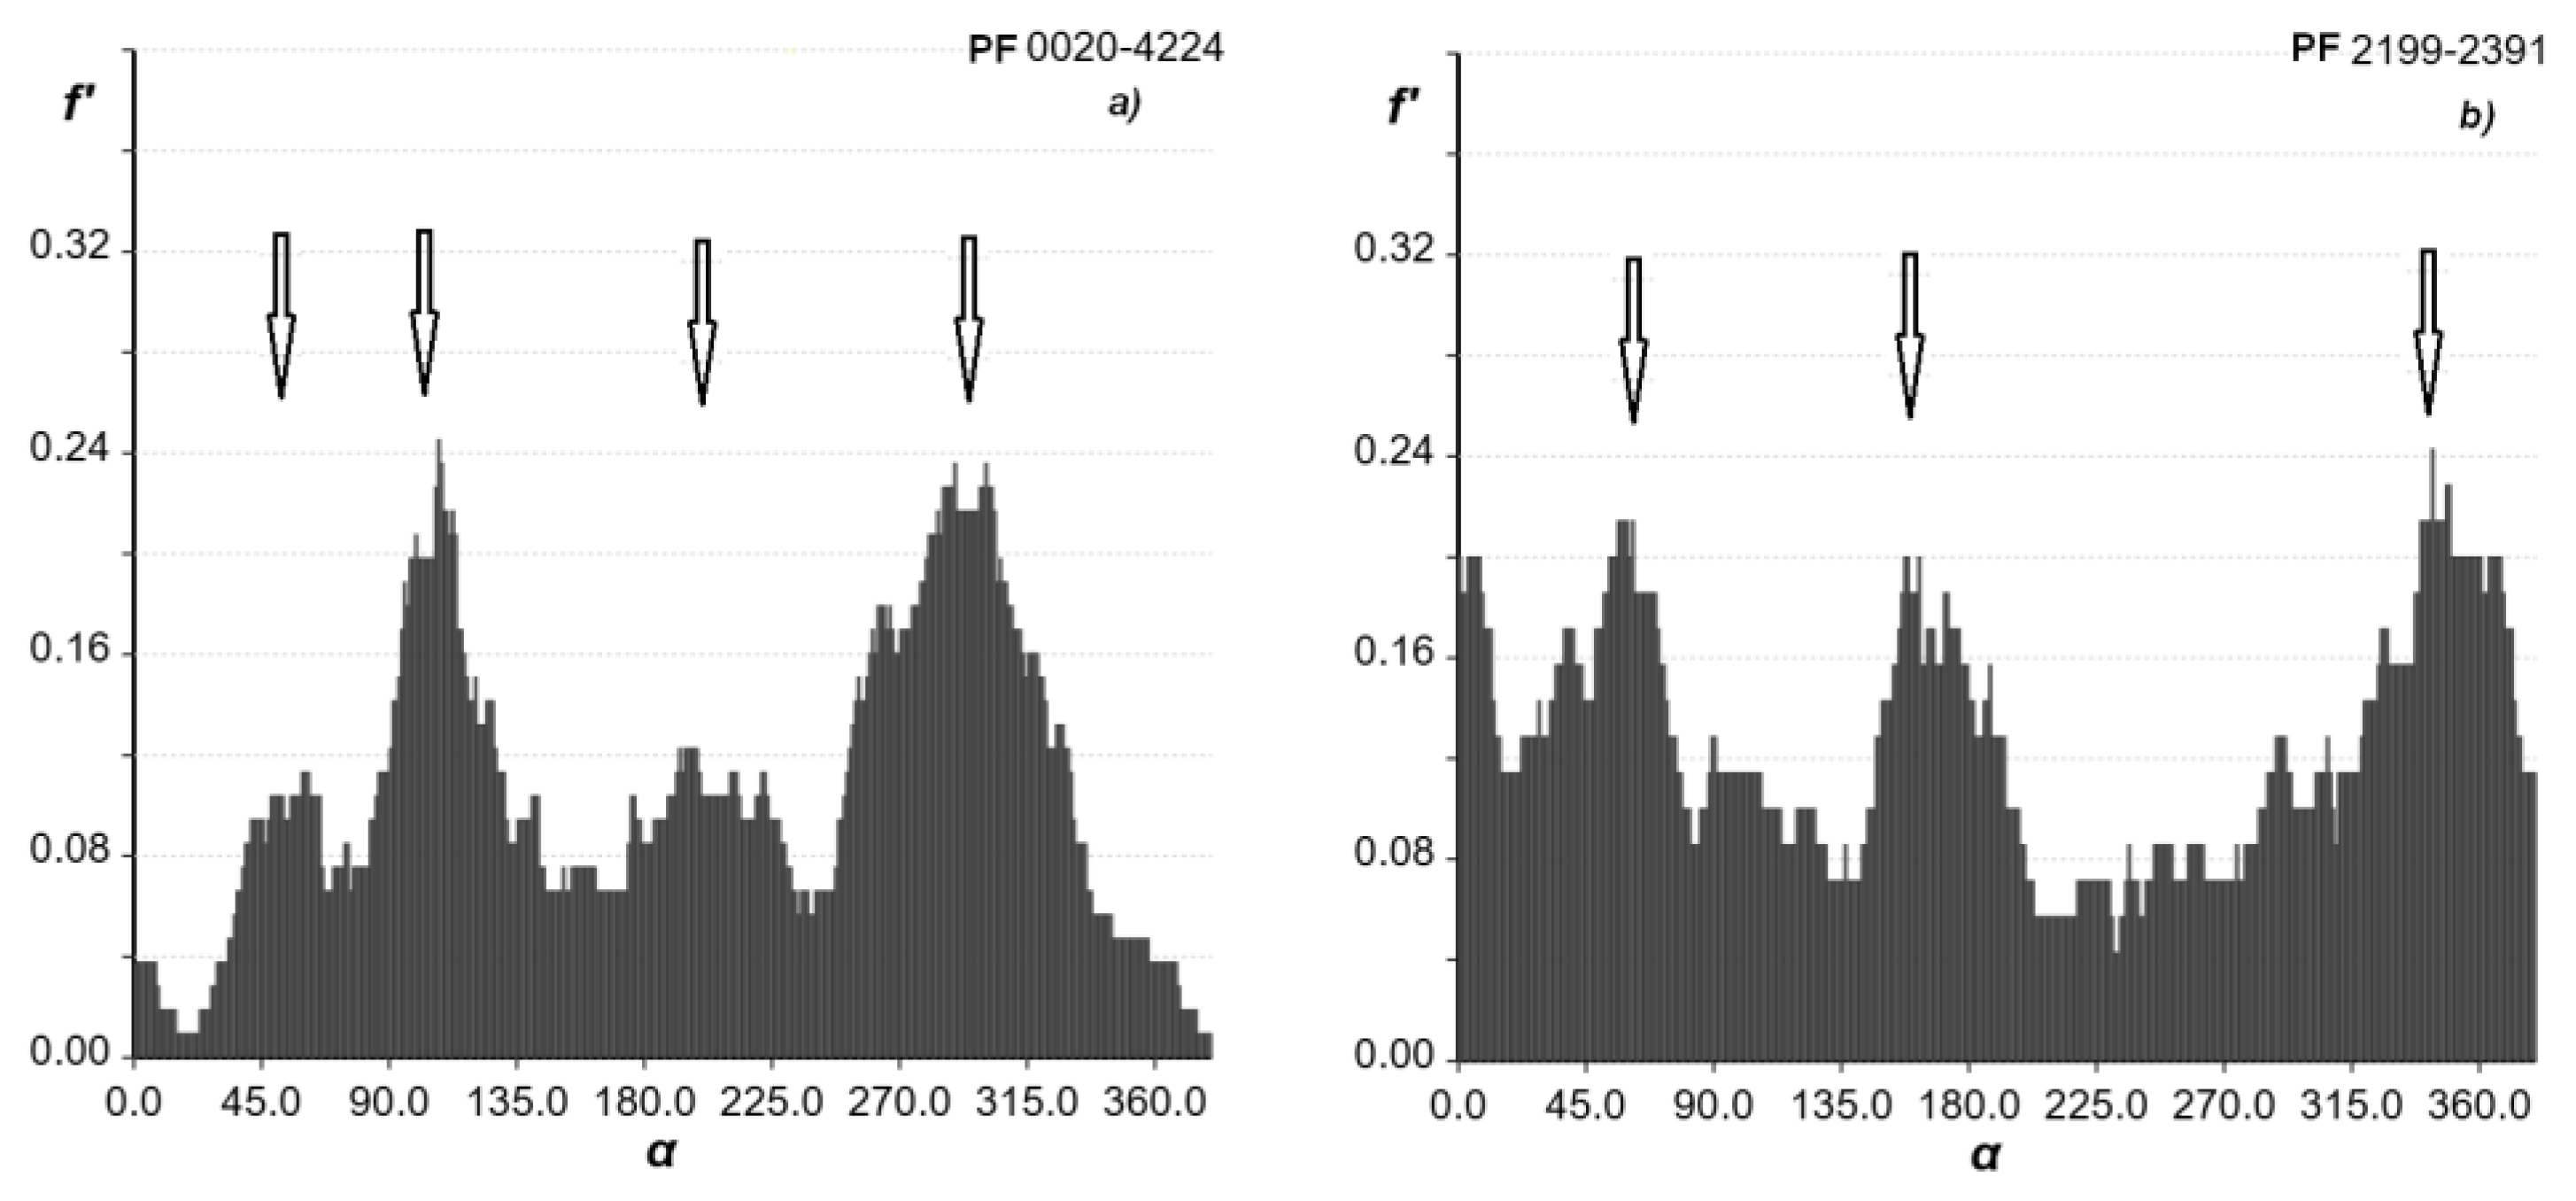

Table 1.
The comparison of the schemes of the morphological classification of galaxy clusters.
|
The scheme and Property |
Regular clusters |
Intermediate clusters |
Irregular clusters |
| Zwicky type | Compact | Medium-Compact | Open |
| Bautz-Morgan type | I, I-II, II | (II), II-III | (II-III), III |
| Rood-Sastry type | cD, B, (L,C) | (L), (F), (C) | (F), I |
| Lòpez-Cruz | cD | non-cD | non-cD |
| Symmetry | Spherical | Intermediate | No |
| Central concentration | High | Moderate | Very little |
| Central profile | Steep | Intermediate | Flat |
| Panko type | C, (CF), CcD, CBG |
I, IBG, IL71, IL11, IP |
O, OBG, OL91, OP, |
1 The Arabic numeral can be 5, 7, 9, or 11.
Disclaimer/Publisher’s Note: The statements, opinions and data contained in all publications are solely those of the individual author(s) and contributor(s) and not of MDPI and/or the editor(s). MDPI and/or the editor(s) disclaim responsibility for any injury to people or property resulting from any ideas, methods, instructions or products referred to in the content. |
© 2025 by the authors. Licensee MDPI, Basel, Switzerland. This article is an open access article distributed under the terms and conditions of the Creative Commons Attribution (CC BY) license (http://creativecommons.org/licenses/by/4.0/).
Copyright: This open access article is published under a Creative Commons CC BY 4.0 license, which permit the free download, distribution, and reuse, provided that the author and preprint are cited in any reuse.


