
Submitted:
07 July 2025
Posted:
08 July 2025
You are already at the latest version
Abstract
Despite a high publication volume (1996–2024), Brazil lags innovation leaders due to systemic barriers driving researchers toward low-impact journals or research abandonment. One critical and solvable barrier is the absence of interactive tools for top journal selection. To tackle this, the Journal with Notable Assessment Score (Jonas) Butterfly Model provides a data-driven framework to help resource-limited researchers in Administration, Engineering, Environmental, and Interdisciplinary fields identify fast, high-impact, transparent, and APC-free journals when possible. To achieve this, the model begins its flight with four phases, exploring national and international databases, scientometrics, open science, documentary and bibliometric reviews, three original formulas, statistical normalization, computational methods, Julius AI, and digital platforms for data extraction, analysis, storage, and interactive presentation. From the Qualis dataset of 27,929 unique titles, the model generates structured databases and an HTML tool, enabling researchers to explore 400 Top-Tier A1 journals (21 Diamond, 361 Hybrid, 18 Gold OA) ranked by the Most Notable Journal Score, classified within a 3x9 matrix (speed × impact), ranging from Q1 (Slowest & Highest Impact), Q3 (Fastest & High Impact), down to Q9 (Fastest & Lowest Impact). For authors with fewer funds, 21 diamond journals emerged as viable alternatives, proving that fee-free publishing need not compromise visibility or prestige. By merging scientometrics, open science principles, digital tools, and intuitive visualization, the proposed model offers authors, policymakers, and editors a clear flight path toward more equitable, faster, and higher-impact scientific dissemination, helping to strengthen Brazil’s global research visibility.
Keywords:
Computational Methods
; Digital Tools
; Journal Selection
; Most Notable Journals
; Open Science
; Production Engineering
; Scientometrics
1. Introduction
1.1. Brazil Versus the Most Competitive and Innovative Nations
Scientific publications are the engines of innovation (Brooks, 1994; Cohen et al., 2002), national competitiveness, economic development, and global impact (May, 1997). They play a crucial role in spreading technologies and solutions that tackle global and local challenges across various sectors.
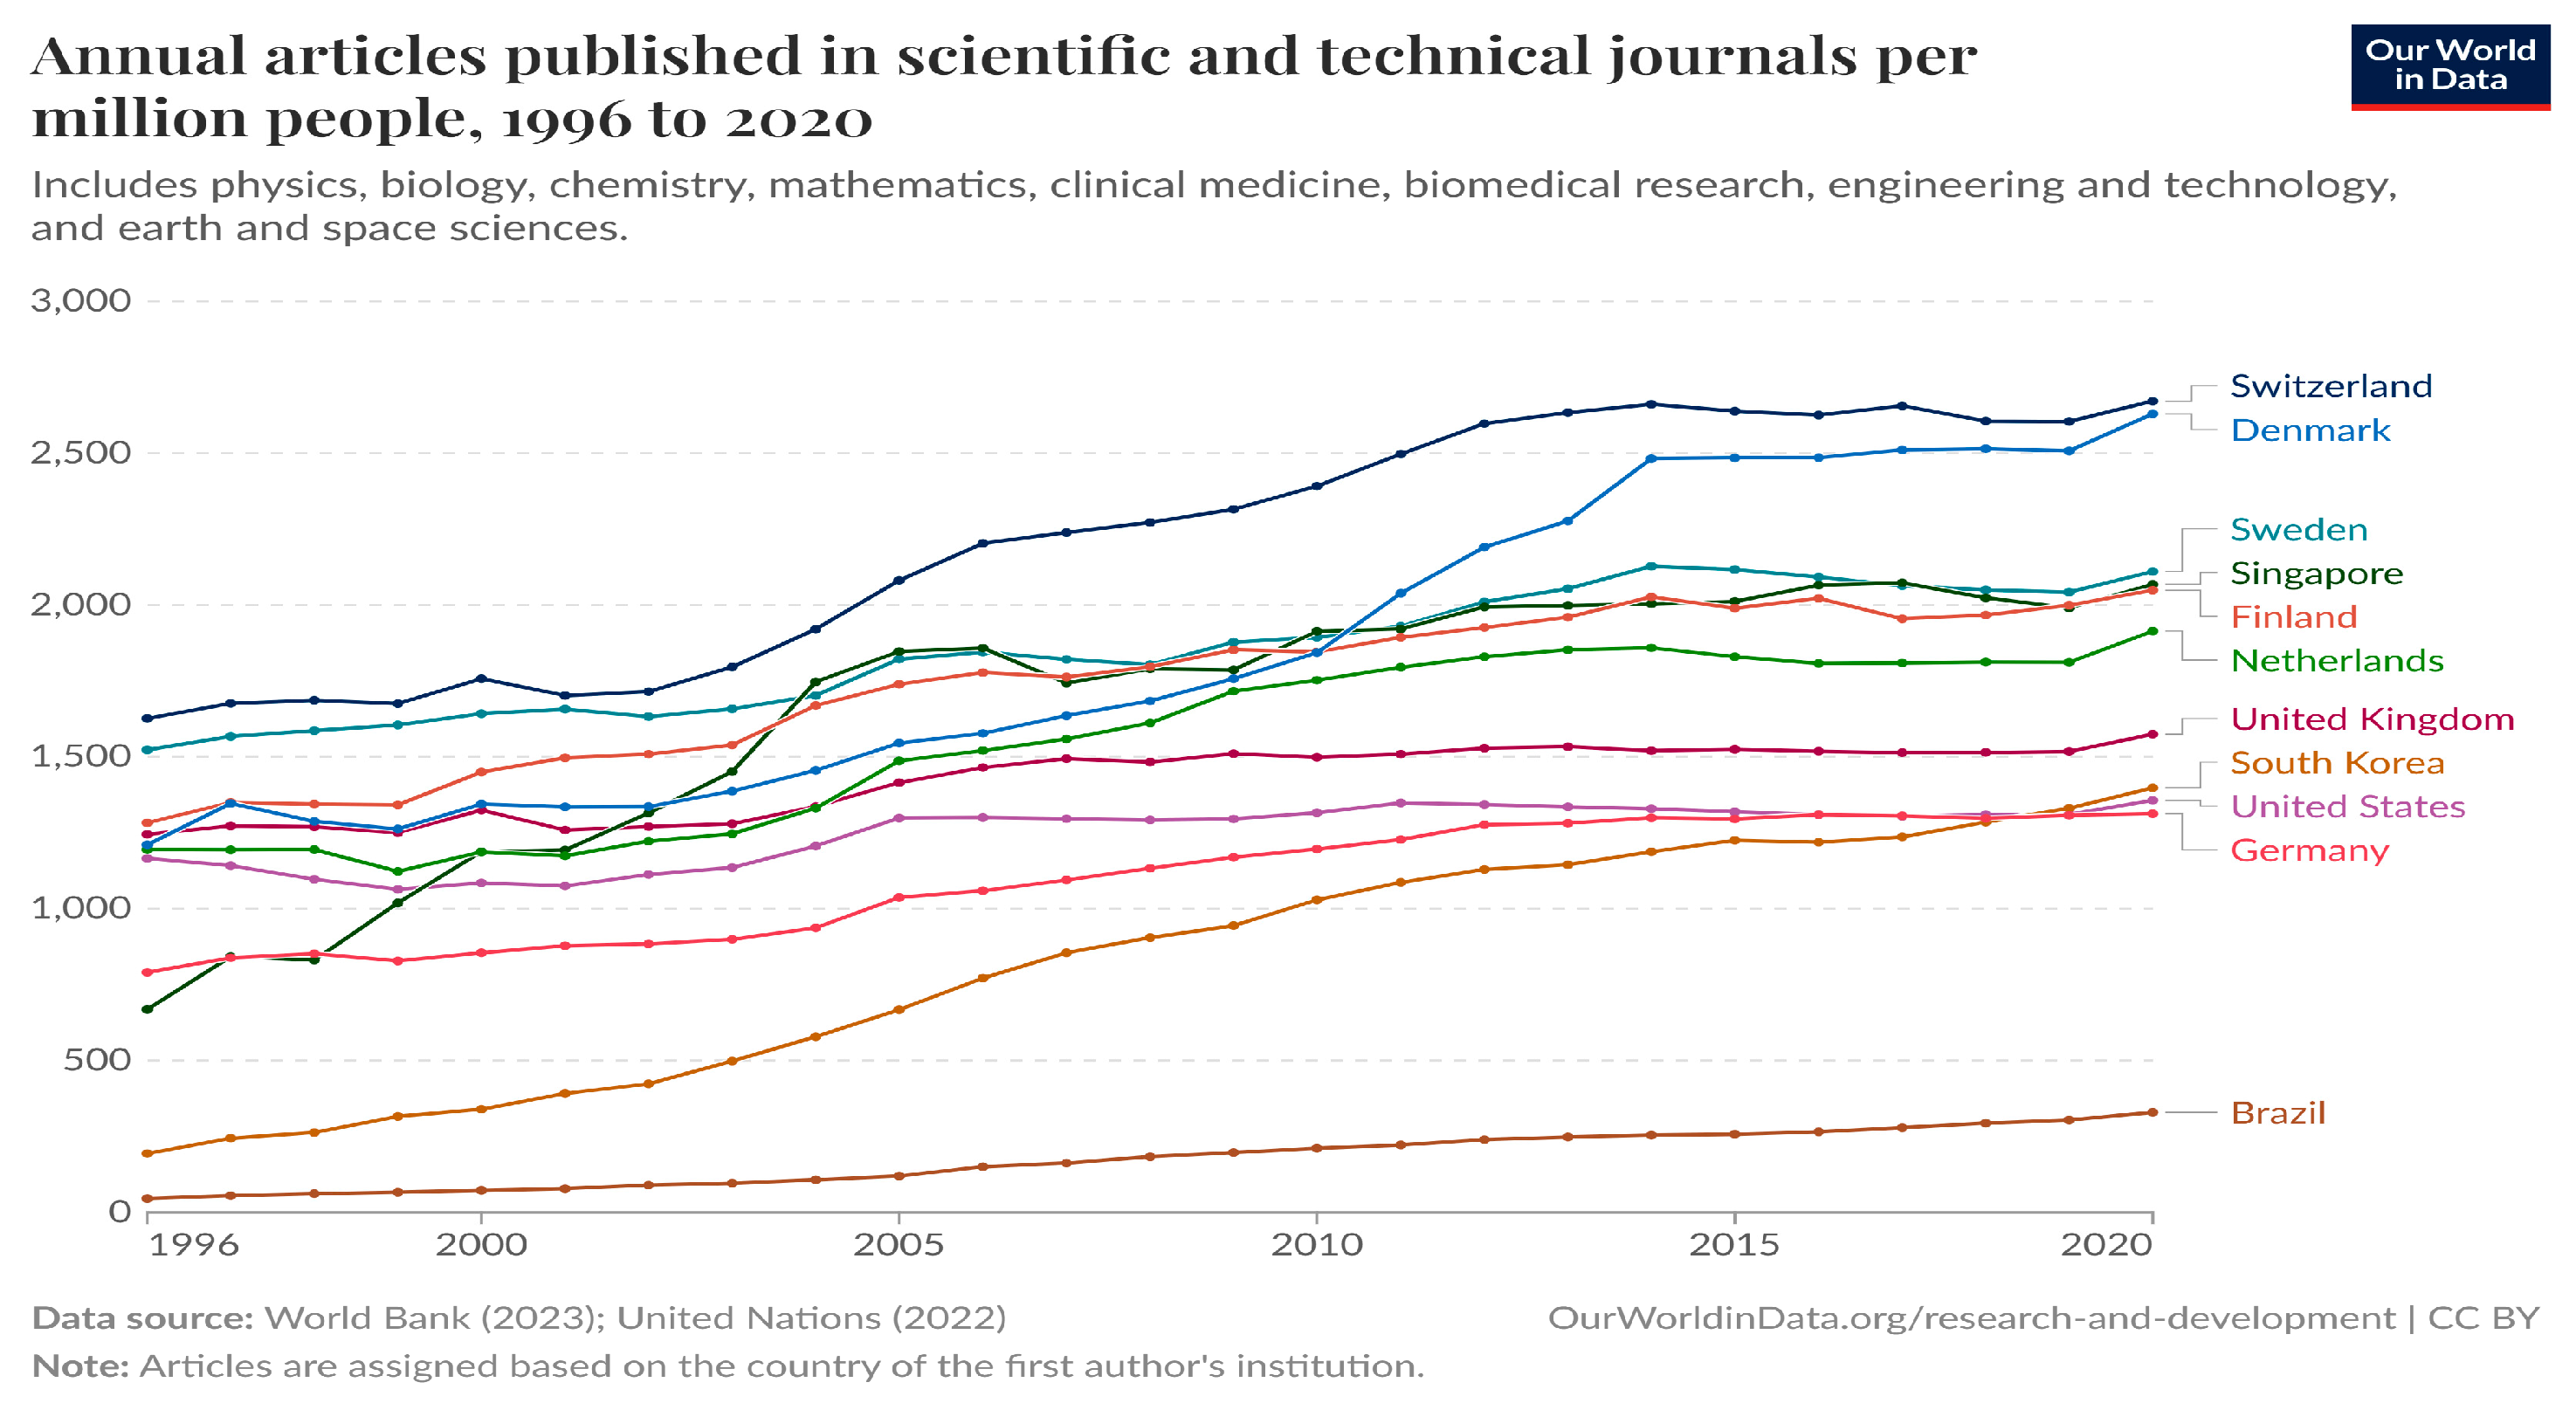
From 1996 to 2024, the USA, China, UK, Germany, Japan, India, France, Italy, Canada, and Australia accounted for 64.1% of the global scientific output, which is 55.4 million documents. Brazil produced 1,527,999 documents, making up 1.8%, placing it in 14th position (SCImago Lab, 2025; Appendix R). However, when assessed using more suitable and normalized indicators, Brazil is still far from leaders’ nations in global S&T&I regarding innovation capacity, competitiveness, R&D investment, researcher density, and publications per capita (WIPO, 2024; Gomes da Silva, 2024; Figure 1, Figure 2 and Figure 3).
Figure 1.
Comparing Brazil GERD with ten most innovative countries (2010-2021).
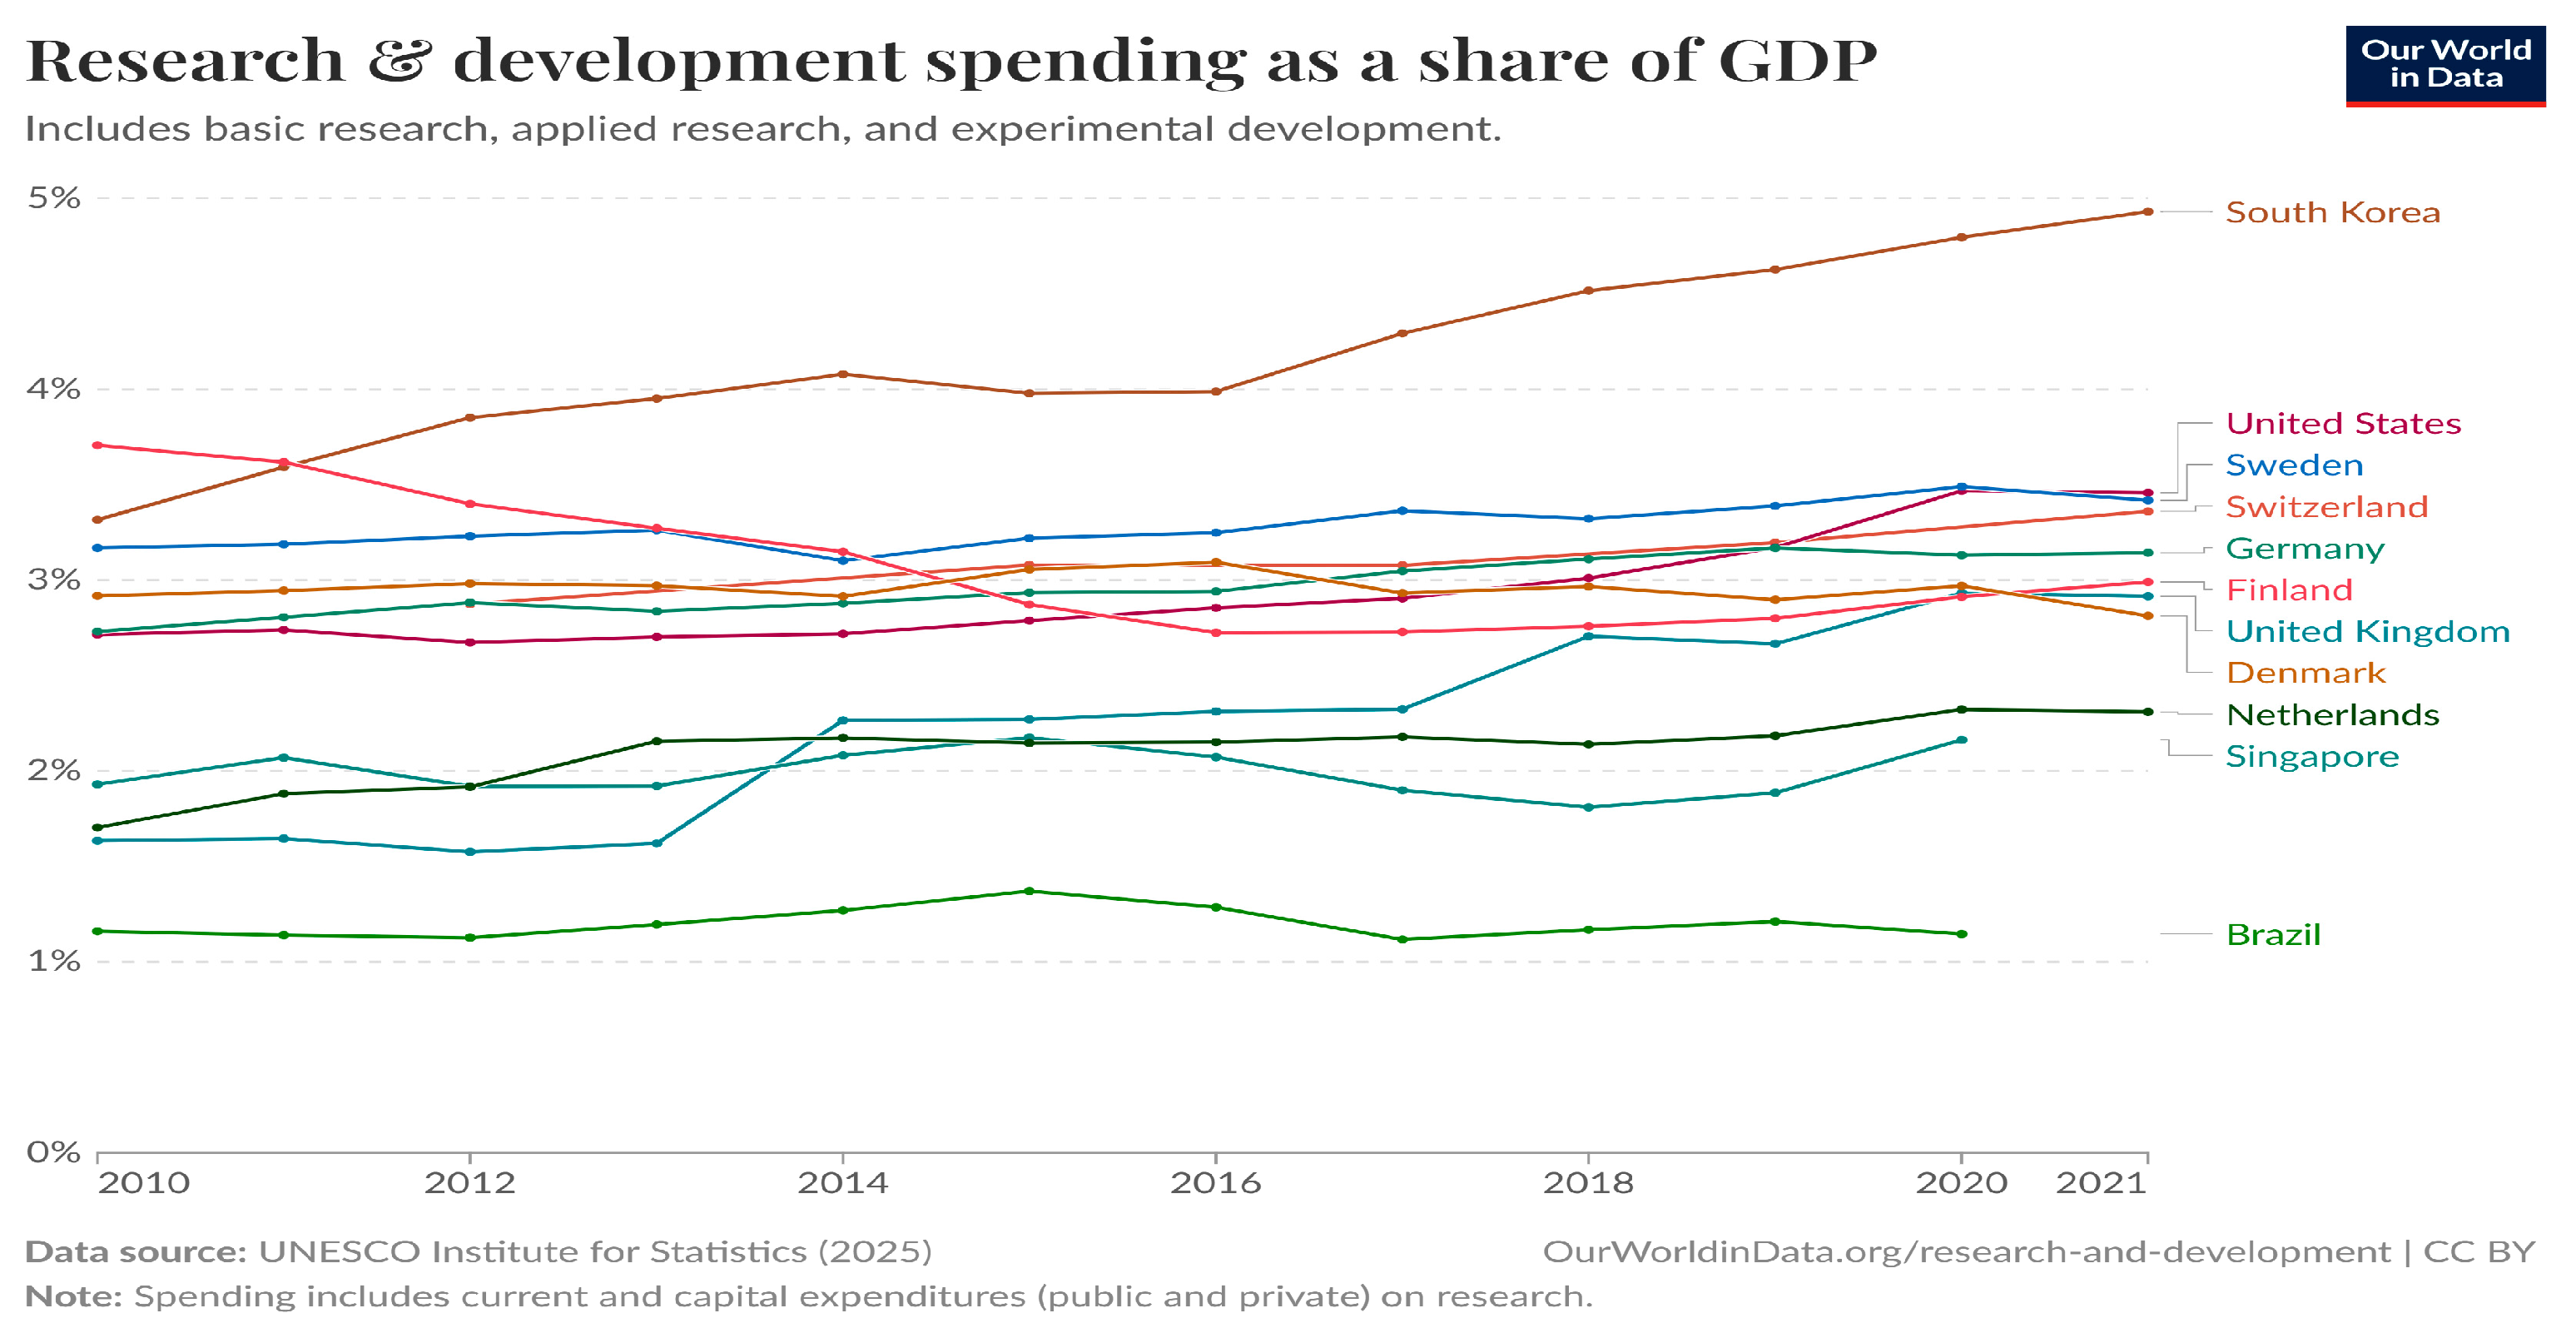
Figure 2.
R&D researcher density – Brazil x ten most innovative countries (1996-2021).
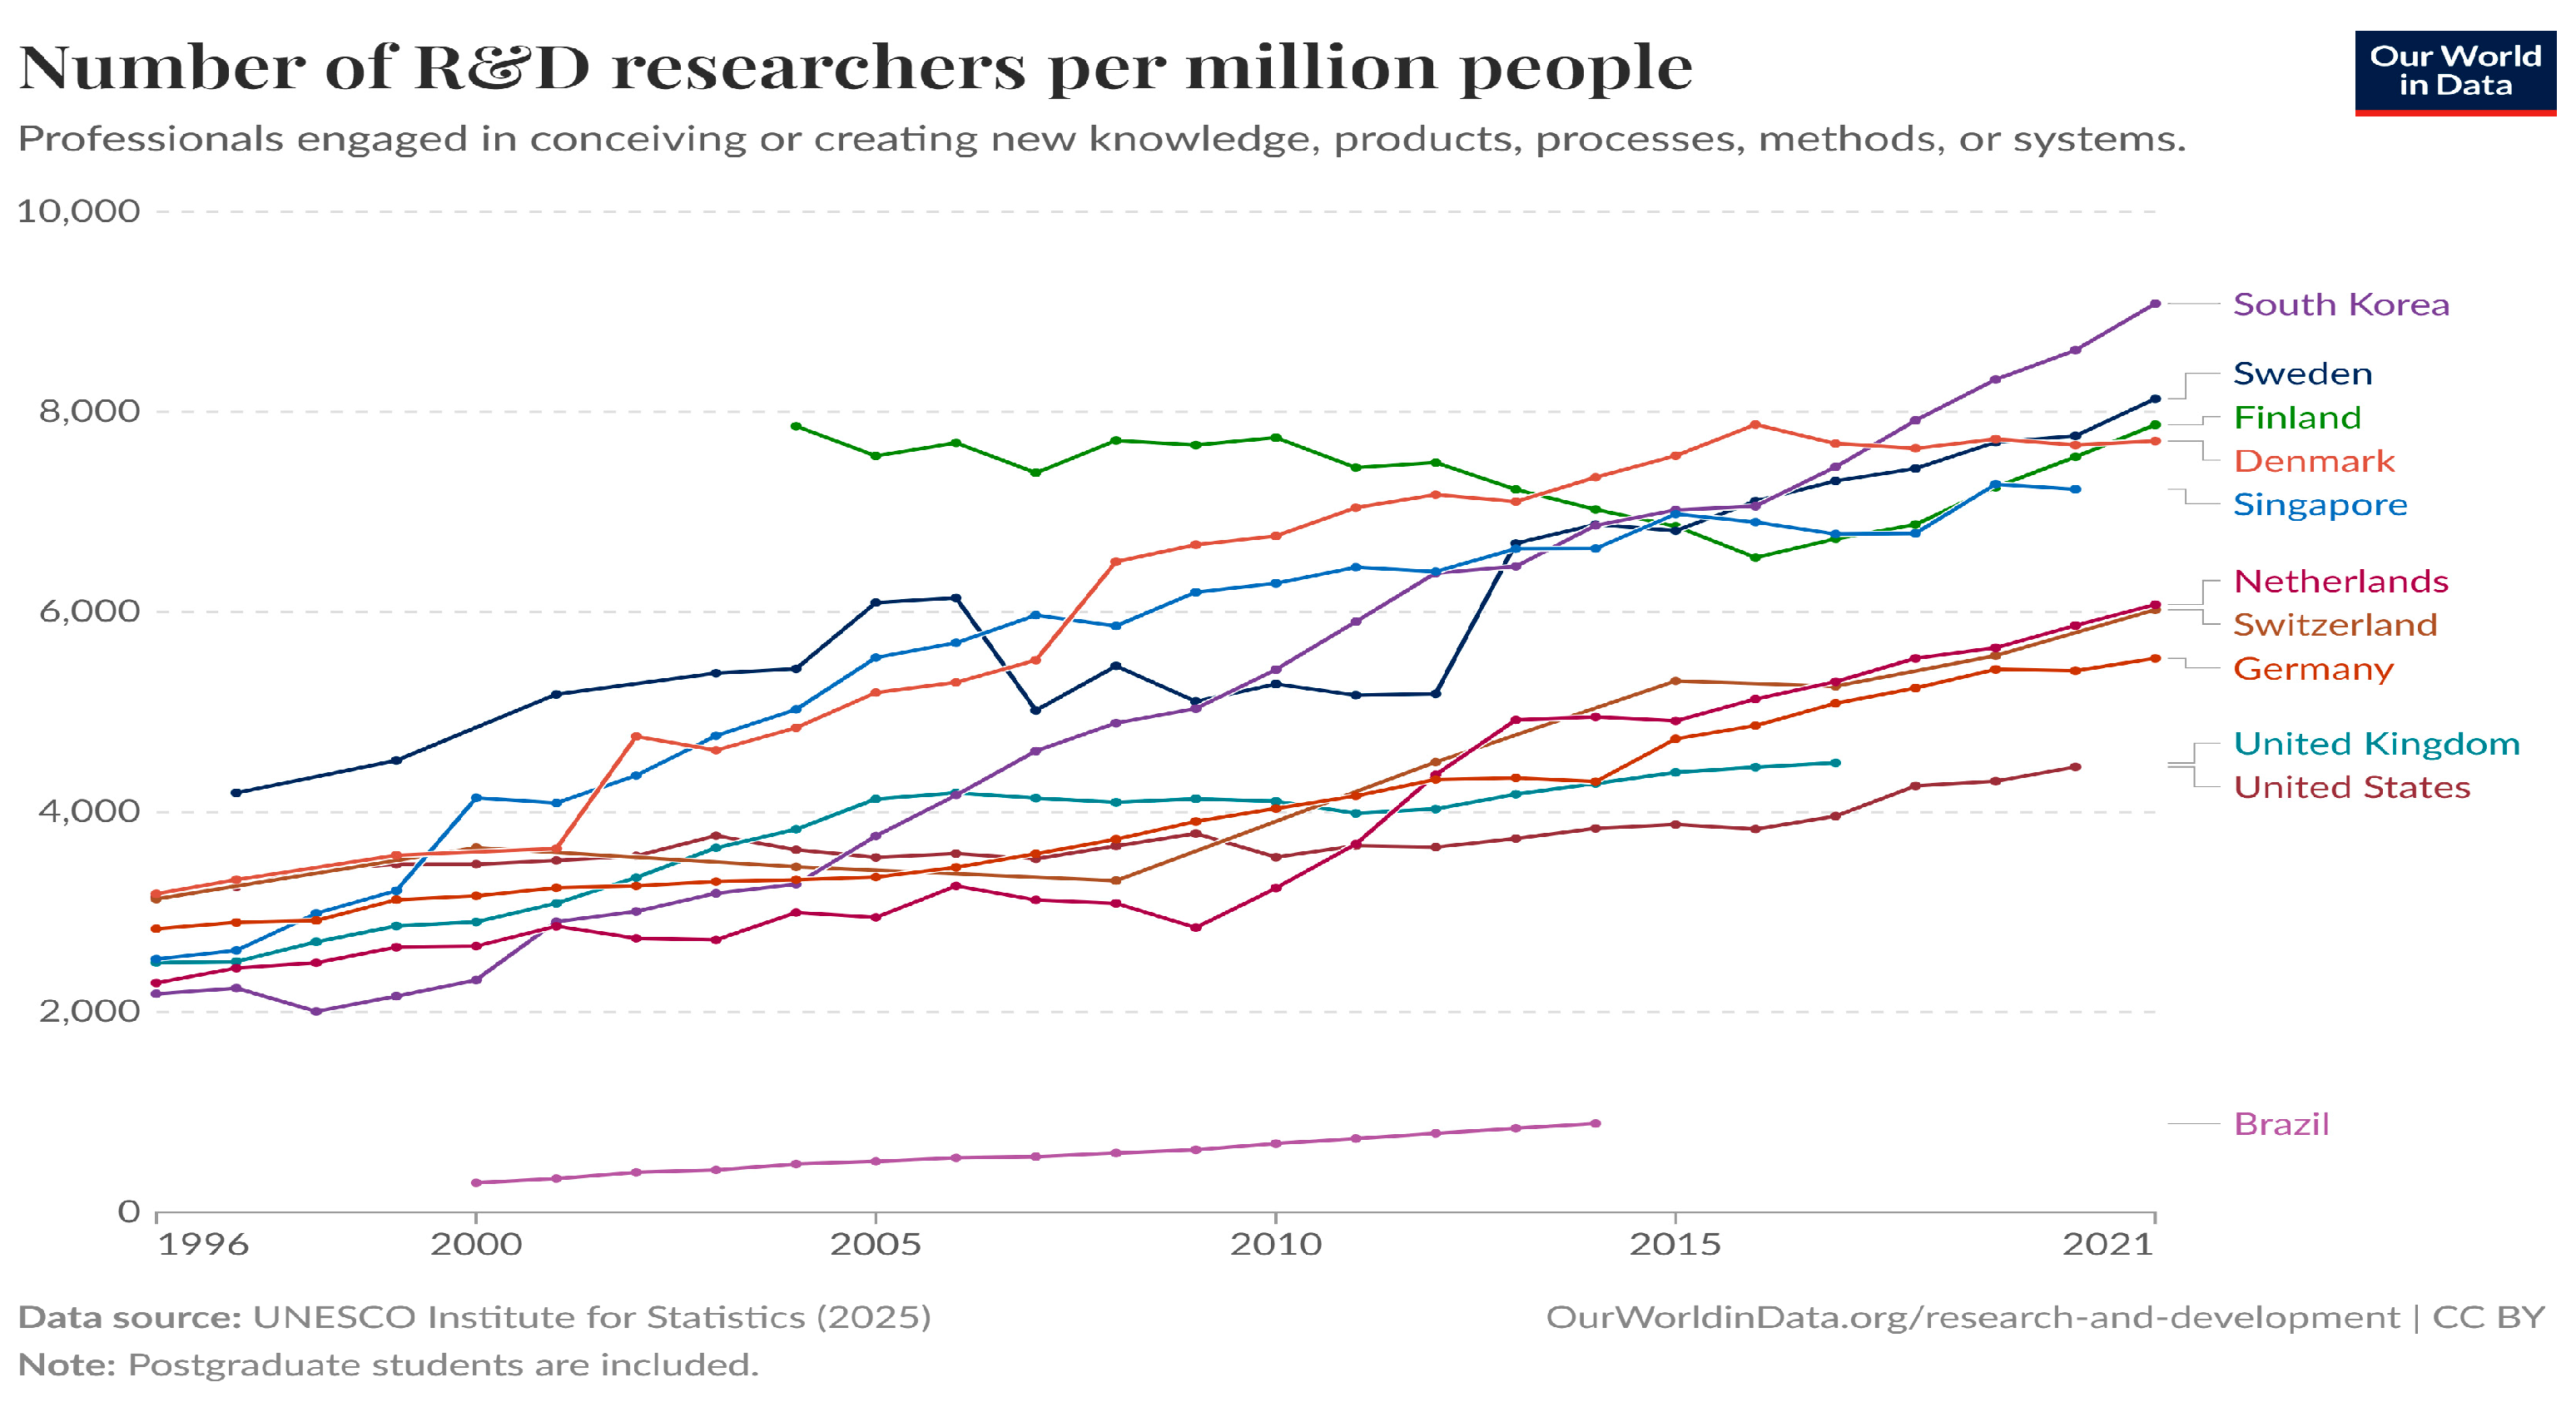
Figure 3.
Publications per capita – Brazil x 10 most innovative countries (1996-2020).
1.2. Barriers That Brazilian Researchers Face
Although Brazilian researchers have increased their international presence since the 1990s, they still face many barriers. These include regional disparities, chronic underfunding, resource scarcity, low research impact, excessive workloads, bureaucratic challenges, outdated infrastructure, stagnant stipends, currency depreciation, high publication costs, gender inequalities, unclear grant allocation, corruption, political instability, lack of openness in corporate tax incentive reporting, fragmented data, no interactive digital tools for top journal selection, and repeated budget cuts and freezes in S&T&I, which have worsened the crisis (Abraão, 2025; Alencar and Barbosa, 2021; Carneiro, 2017; Confies, 2017; De Negri, 2021; De Jesus and Kamlot, 2023; De Rezende et al., 2025; Fernandes and Mesquita, 2024; Ferraz et al., 2012; IQC, 2022; Giusti, 2024; McManus et al., 2021; Sousa et al., 2020; TCU, 2025).
These barriers lead to brain drain and force many researchers to quit or publish in lower-impact journals, limit Brazil’s scientific influence and contributions to global research (Cafardo, 2022; The Economist, 2021; Rodríguez Mega, 2019; Simões, 2011).
1.3. Main Research Problem, Goal and Questions
Among the many challenges facing Brazilian researchers, fragmented data and the lack of interactive digital tools for top tier journal selection remain a persistent yet highly solvable issue, requiring minimal investment and technical effort compared to broader structural barriers.
Brazilian scholars, particularly those with limited resources, lack access to intuitive platforms that match the national demands and their research core area with suitable, high-impact journals based on publication speed, openness, impact, and transparency. This often leads to misaligned submissions or publication in predatory outlets, hurting both visibility and career progression.
Existing journal selection platforms, such as DOAJ, SCImago, JANE, Elsevier Journal Finder, and Springer Journal Suggester, offer valuable support to researchers but present important limitations that justify developing a customized tool for Brazilian authors. Most platforms do not offer multi-criteria rankings, they do not integrate Brazil’s Qualis-CAPES framework, they are confined to their publisher-specific portfolios, and they provide limited filtering options by publication speed, impact, APCs, or transparency indicators. Additionally, they do not allow users to generate field-specific, customized, and printable PDF reports or use multi-dimensional filters that align with open science principles and Brazil’s national evaluation needs.
To address this gap, the Jonas Butterfly Model provides a data-driven framework to help resource-limited researchers in Administration, Engineering, Environmental, and Interdisciplinary fields identify fast, high-impact, transparent, and APC-free journals when possible.
To help Under-Resourced Brazilian researchers take flight in academic publishing, this study was guided by four key wingbeats to overcome the journal selection bottleneck:
Q1.
How can Under-Resourced Brazilian researchers discover a clear flight path to journals that combine core area, speed, impact, transparency, and affordability?
Q2.
How can fragmented bibliometric data be transformed into a reliable, multi-criteria journal ranking tailored toBrazil’sresearch context?
Q3.
How to deliver this ranking as an open, easy-to-use digital tool?
Q4.
Whatarethe most notable journals combining fast publication, high impact, and open access?
1.4. Importance to the Academy and to UN SDGs
In October 2024, CAPES, the Brazilian federal agency under the Ministry of Education tasked with advancing graduate education and research, announced a shift from post-graduation courses and journal-based to article-level evaluation. While the transition remains in progress and further details are pending, the model is already aligned with the three article-level assessment procedures disclosed by CAPES in May 2025 (CAPES, 2025, p. 42).
First Procedure (Bibliometric indicators of journals): it leverages international databases like SCImago, DOAJ and Research Life to provide detailed metrics on journal performance, such as SJR and HI indicators. This model helps researchers identify journals with strong bibliometric profiles across many thematic areas by strategically targeting publication venues to enhance article evaluation using this criterion.
Second Procedure (Article-level indicators): the model indirectly supports article-level performance by guiding researchers toward journals known for high visibility, open access, and faster publication times. These features can increase an article’s chances of being cited and indexed, which are key metrics considered in the second procedure.
By optimizing these factors early, authors are better positioned for positive evaluation outcomes.
Third Procedure (Qualitative evaluation): the model categorizes journals by type and area, allowing researchers to align their work with the most relevant and reputable outlets in their field.
In addition, when the model support postgraduate courses, Brazil’s research and innovation capacities, and underfinanced and excluded scholars, with better publishing tool focusing the four mentioned areas, it is contributing over time to the following UN SDGs: SDG 4 (Quality Education): by offering free and open access to an interactive HTML tool that supports academic publishing decisions; SDG 9 (Industry, Innovation and Infrastructure): by proposing an innovative digital framework that strengthens research infrastructure; SDG 10 (Reduced Inequalities): by enabling more equitable participation in academic publishing from low-income regions; SDG 11, 12, and 13 (Sustainable Cities, Responsible Consumption, Climate Action): indirectly supported through improved dissemination of research in administration, environmental science, engineering, and interdisciplinary journals found.
1.5. Originality
First) Conceptual model: the four-stage model guides authors from identifying their core area to selecting the Most Notable Journals using a systematic, metaphor-driven approach.
Second) Field gap in Literature: although Production Engineering is a broad discipline with 340 journals listed under the Industrial and Manufacturing Engineering category in Scimago (Appendix S), no prior study has developed a comprehensive journal selection model for this field. Bibliometric research, such as Ramkumar et al. (2021) and Souza and Quelhas (2020), has focused on specific subfields like quality management, lean manufacturing, or supply chain, leaving the broader Production Engineering area underexplored.
Third) Digital innovation for targeted inclusion: while the model does not develop physical materials technologies, it introduces a digital solution that empowers resource-limited researchers to engage in global scientific discourse across four interconnected domains: Administration, Engineering, Environmental Science, and Interdisciplinary Studies.
Fourth) Integration of national and global metrics: it uniquely integrates QUALIS-CAPES with SCImago/SJR metrics, combining national relevance with international impact in journal selection.
Fifth) Use of diverse data sources: multiple bibliometric sources (QUALIS, SJR, DOAJ, Researcher Life) are combined to create a robust, multi-dimensional journal evaluation.
Sixth) Advances Scientometric research: by introducing new formulas, integrating diverse data sources, and providing a multi-dimensional framework for top tier journal evaluation.
Seventh) Formula-based ranking system: the formulas (RAS, CLRPE, MNJ) combine postgraduate strength, interdisciplinary relevance, transparency, speed, and impact, prioritizing criteria more accessible to Under-Resourced researchers.
Eighth) Beyond traditional metrics: existing tools focus on impact indicators like Journal Impact Factor, CiteScore, or SJR, but overlook transparency, speed, and accessibility. The model offers a data-driven, multidimensional framework assessing impact, transparency, journal type, ease of identification, core area, APC cost, and publication speed.
Ninth) Novel methodological design: its ten-step workflow and three original formulas ensure methodological rigor, reproducibility, and transparency in journal ranking.
Tenth) Computational methods as a foundation: the model employs automated data extraction and cleaning (using Julius AI and Levenshtein Distance algorithms), normalization and statistical scaling, and algorithmic ranking via original formulas. These computational techniques enable the integration and analysis of large, heterogeneous datasets from national and international sources, ensuring reproducibility and supporting the creation of a dynamic, user-friendly digital tool for journal selection.
Eleventh) Interactive HTML tool: although international platforms like DOAJ, SCIMAGO, JANE, Elsevier Journal Finder, and Springer Journal Suggester exist, the model culminates in an interactive HTML tool that allows users to explore 400 top journals by name, performance type, area, journal type, search, and generate printable reports aligned with MEC/CAPES standards.
Twelfth) Synergistic use of Julius AI with multiple digital platforms: the model integrates Julius AI with Edraw Max, GitHub, Harvard Dataverse, and Wix Studio to extract, clean, analyze, update, and present results from large-scale national and international journal datasets, along with making the article easier to read. This workflow ensures data cleaning, reproducibility, and transparency, with all data and code openly shared, supporting open science and FAIR principles (Wilkinson et al., 2016).
2. Methodology, Results, and Discussion
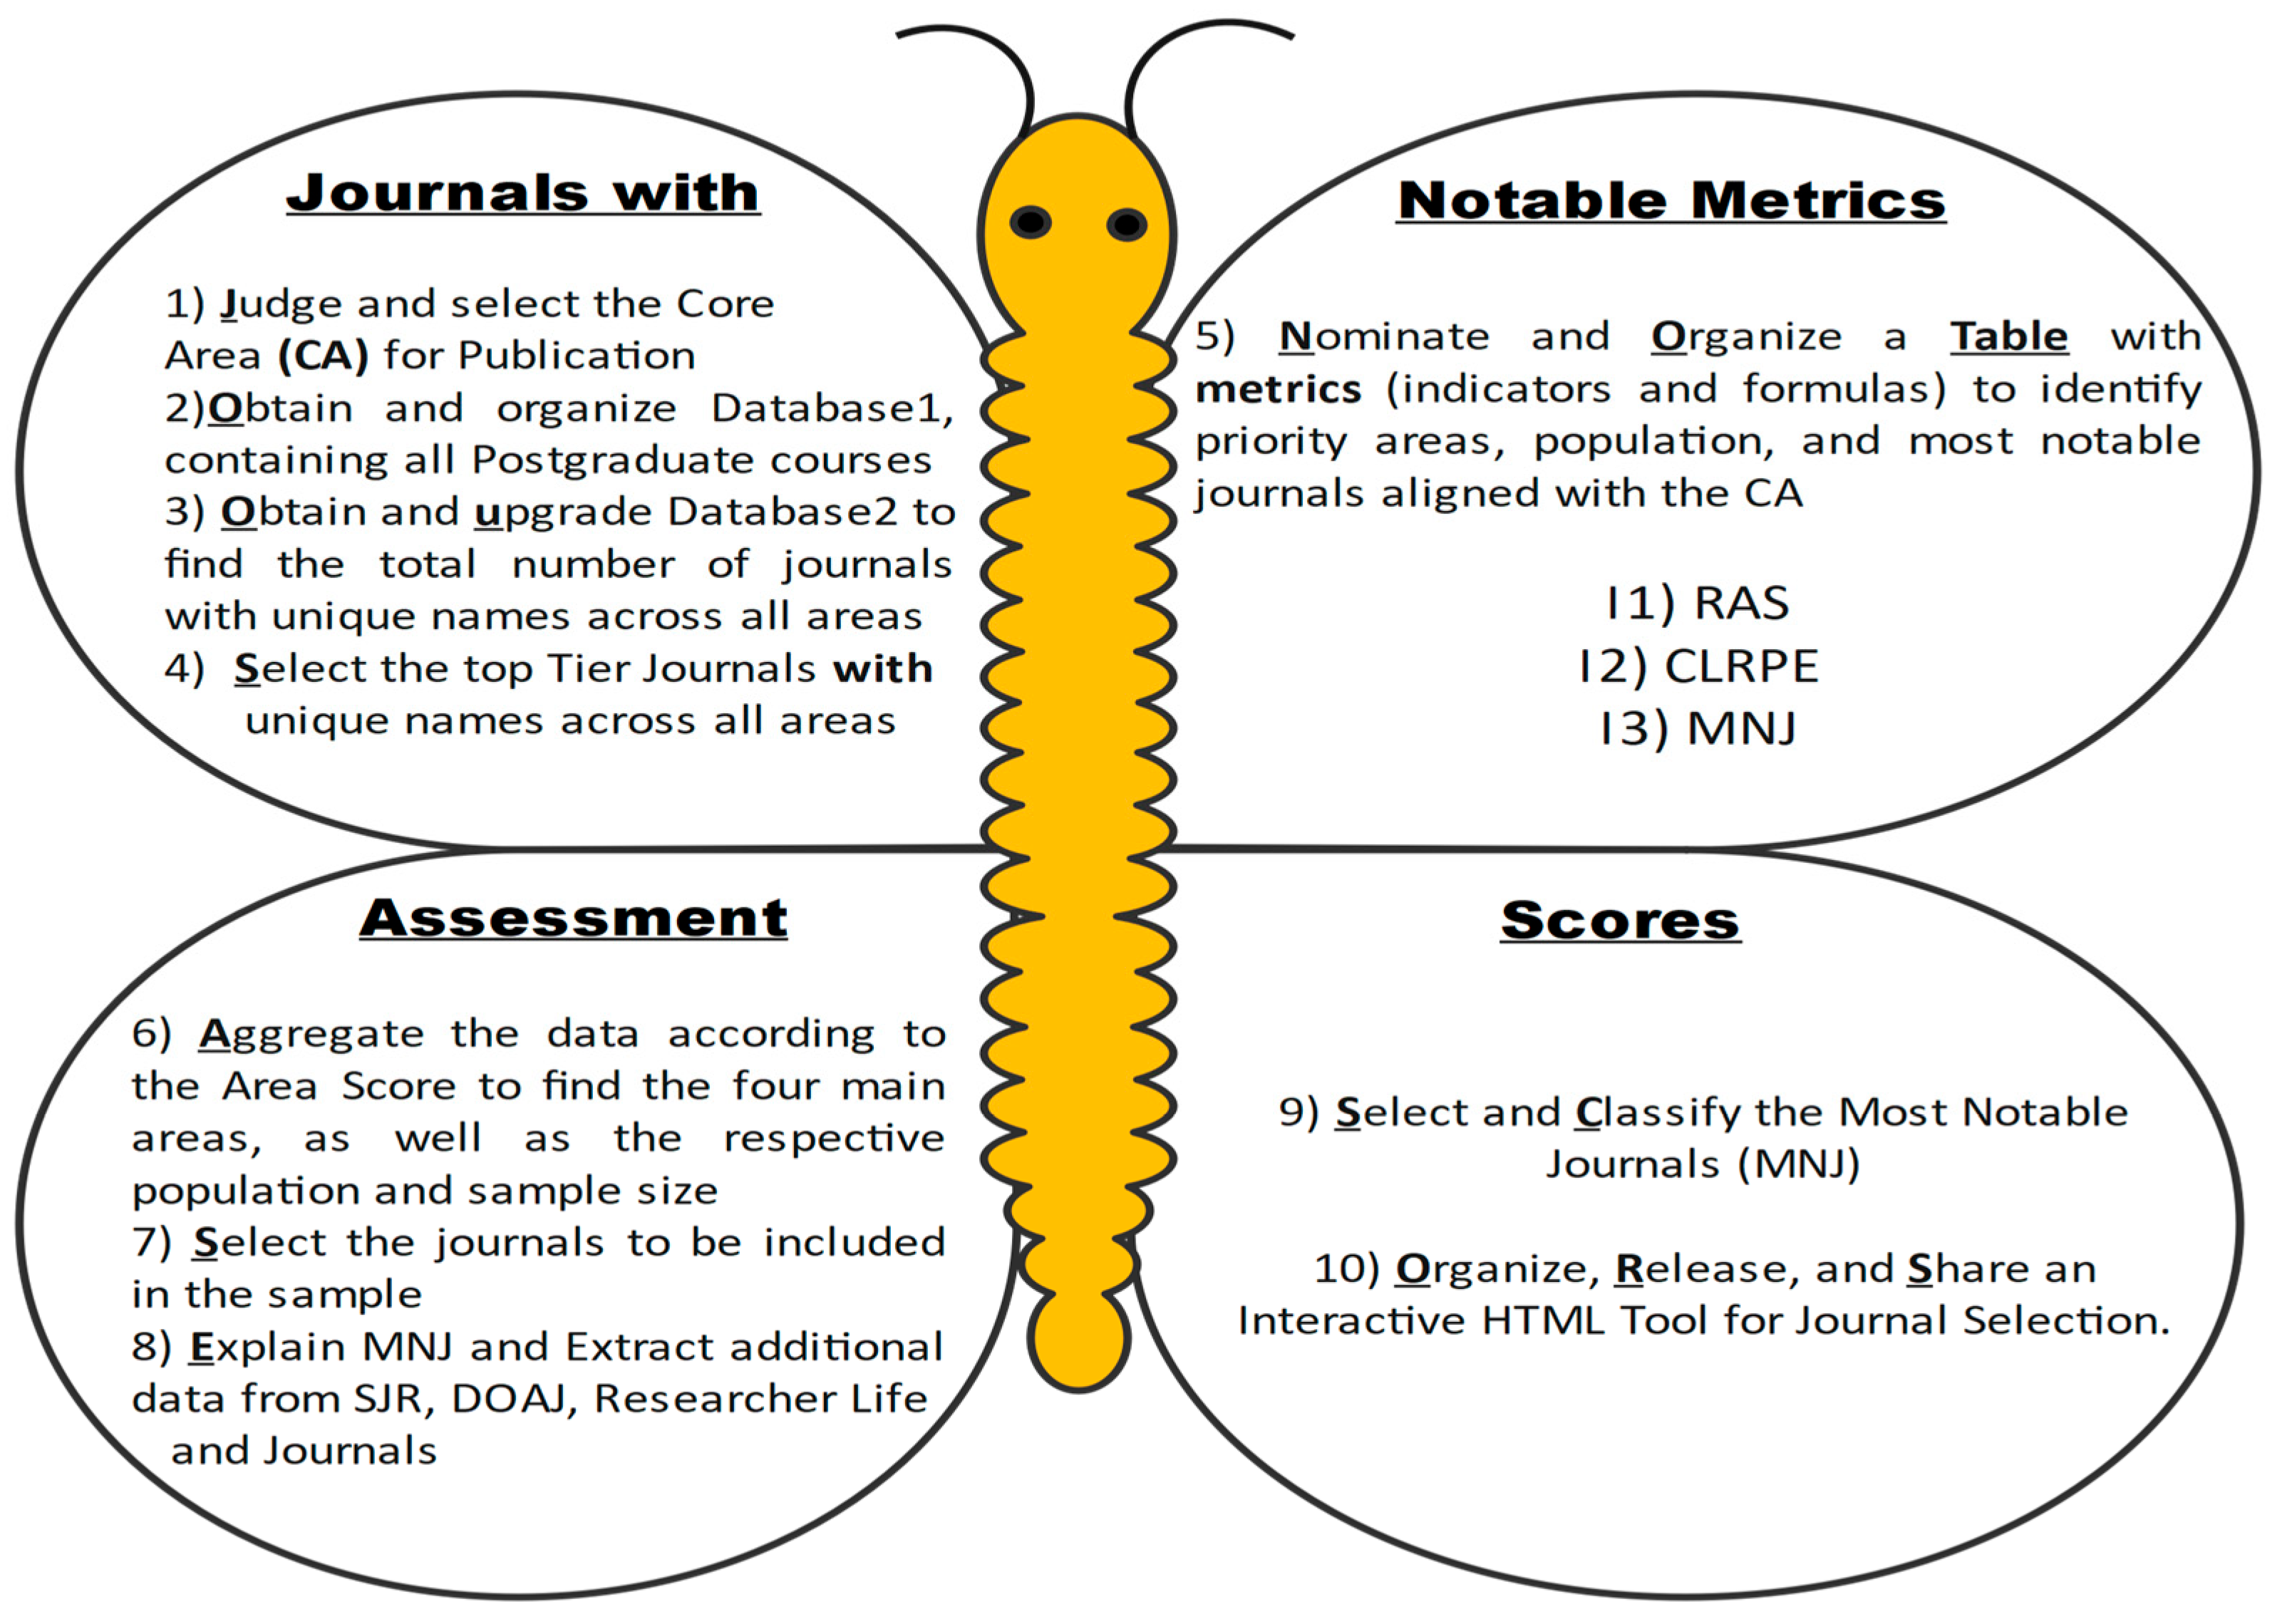
The following sections present the methodology, results, and discussion, visually summarized in two complementary models: a four-phase conceptual butterfly-shaped model (Figure 4) and a ten-step analytical flowchart detailing the research process (Figure 5).
Figure 4.
Jonas’ Butterfly Model.
This explanatory and applied study uses a mixed-methods design that integrates open science principles with bibliometric and documentary analyses, complemented by expert validation. Scientometric techniques underpin the quantitative component, which combines computational methods for data extraction and cleaning (using Julius AI and Levenshtein Distance fuzzy matching), integration of multiple bibliometric databases, normalization procedures (min–max scaling and percentile-rank transformation), and ranking through original formulas (RAS, CLRPE, and MNJ). These steps were systematically implemented to ensure methodological rigor, consistency, and comparability across datasets.
Figure 5.
Research Methodology.
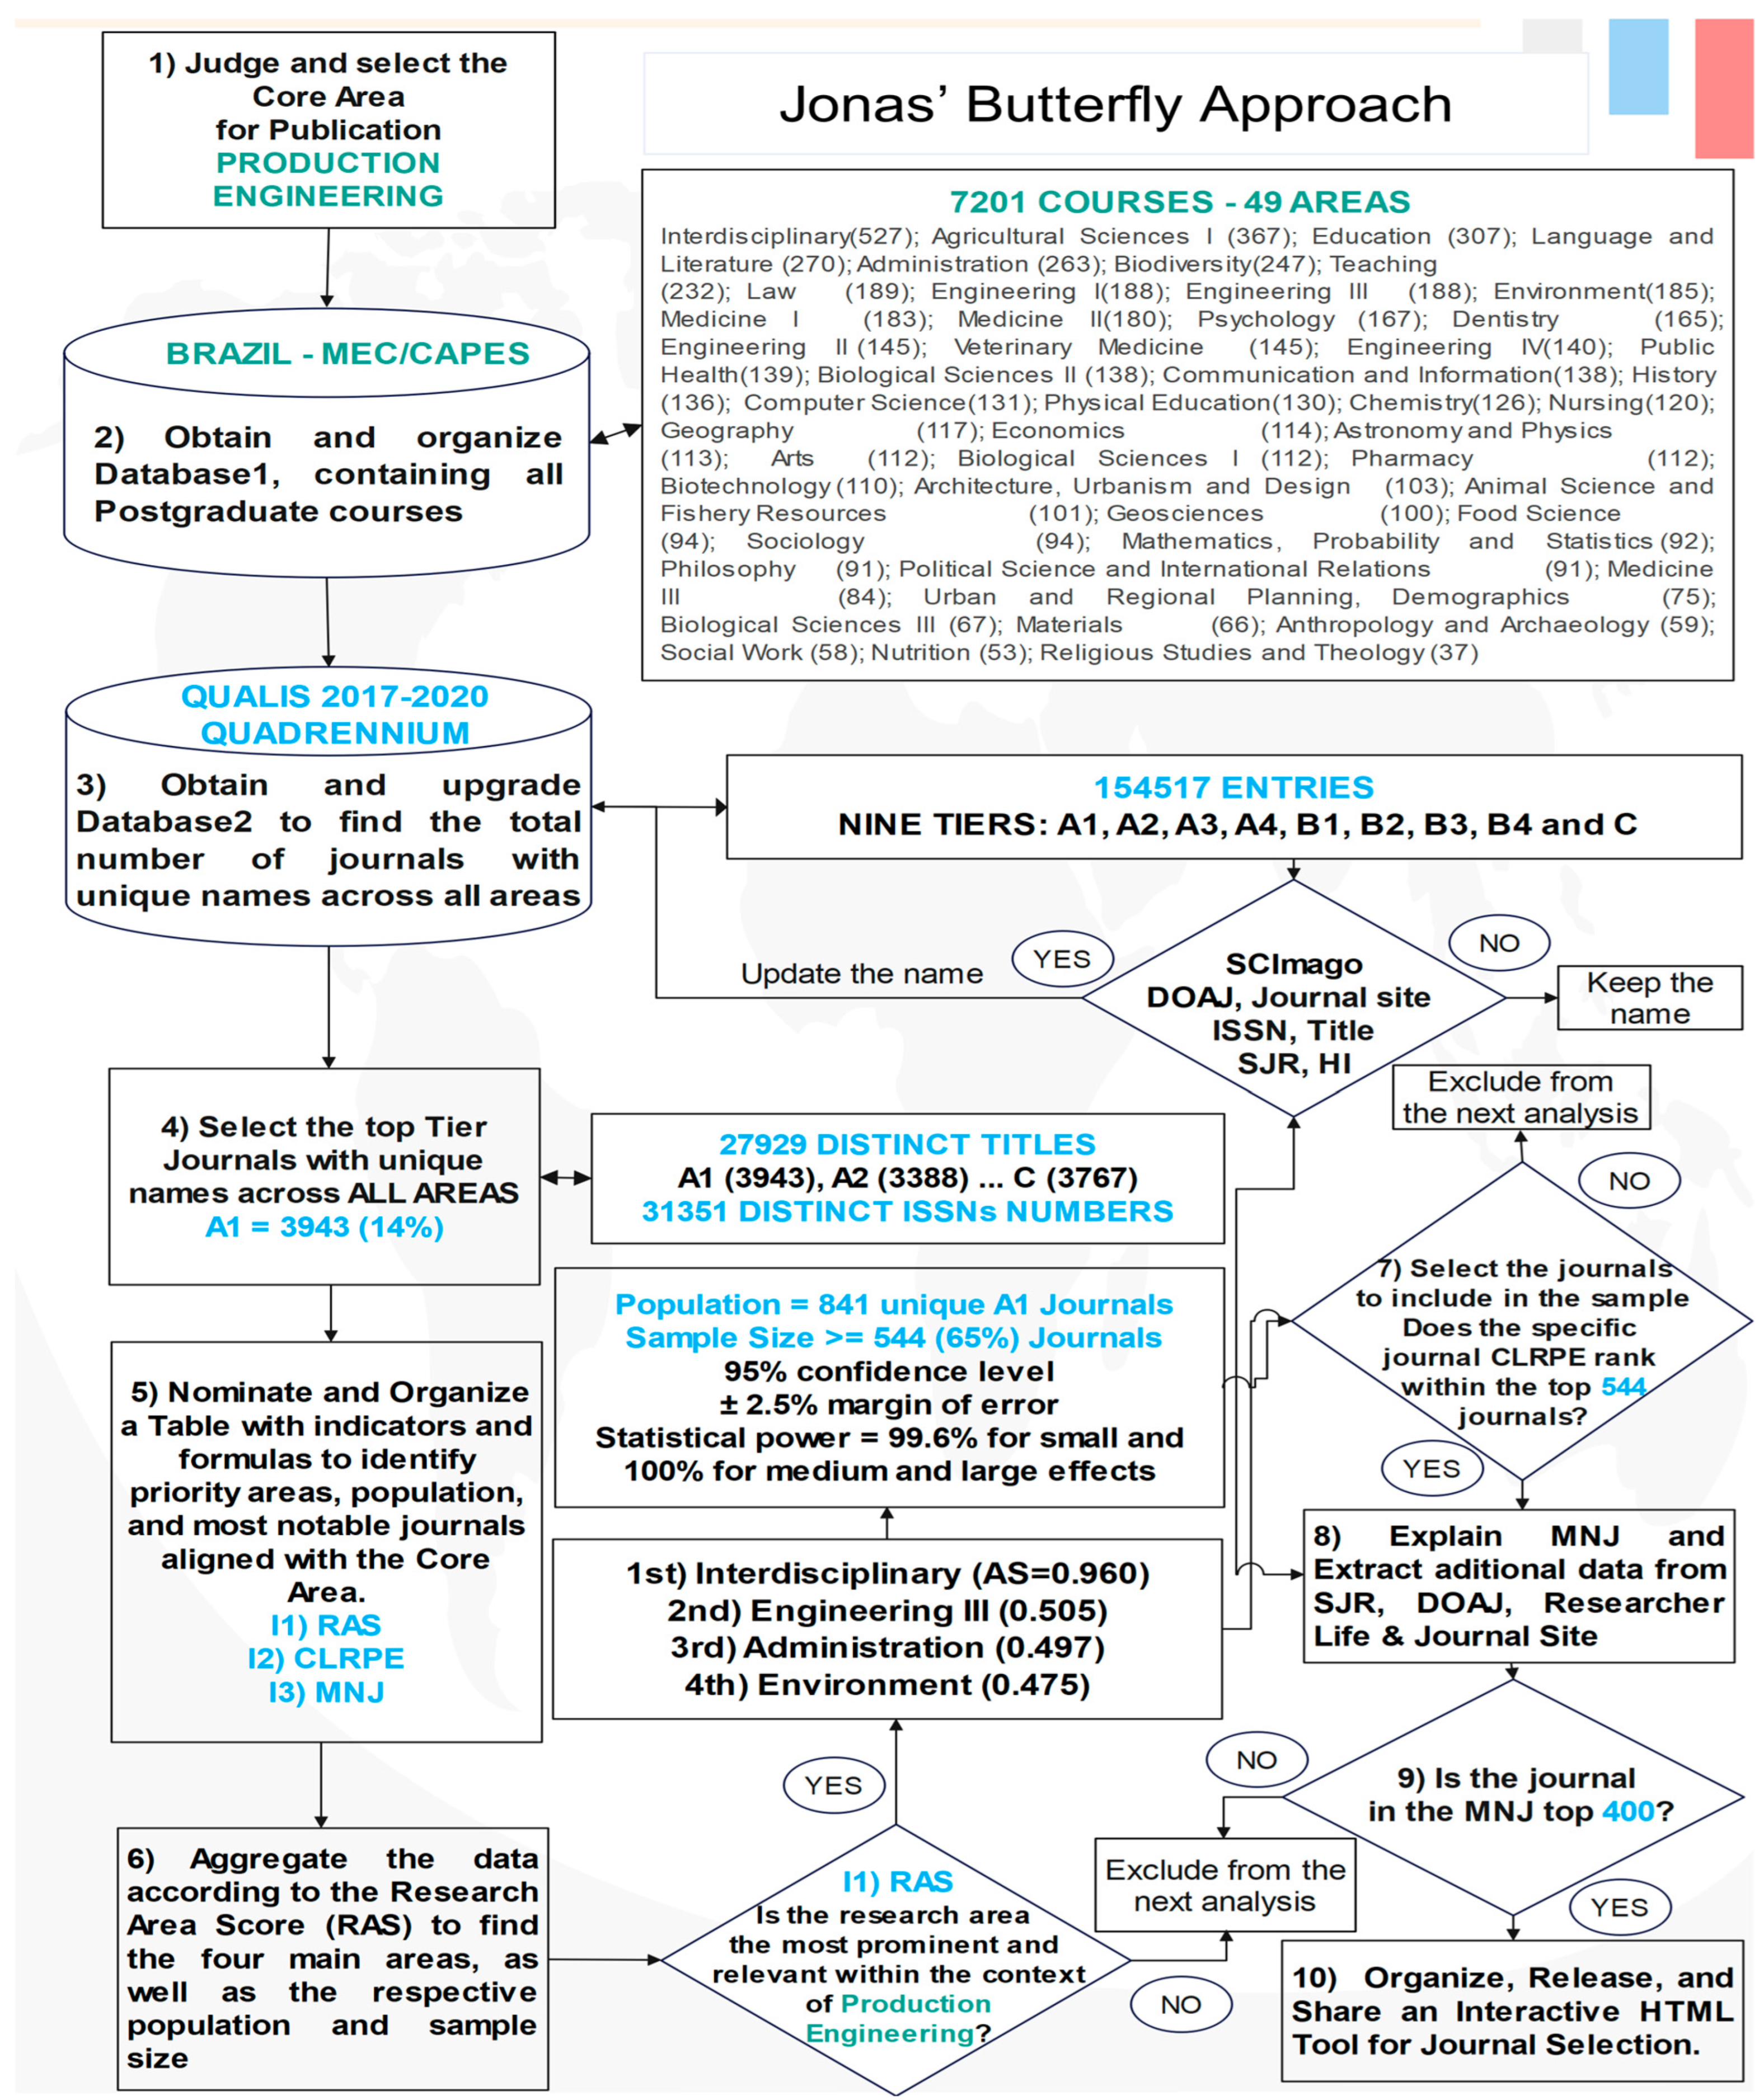
At the last step, the computational workflow was implemented using a Python script and digital platforms (Edraw Max, GitHub, Wix Studio, and Harvard Dataverse), enabling automated data processing, transparent analysis, and the generation of an interactive HTML tool for journal selection. These tools saved time and made the research process more transparent and accessible for others who want to follow or build on this work.
Despite the inherent risks of generative AI, using it for data collection, creation, and visualization improves the discoverability and quality of datasets shared, thereby speeding research and helping users find and understand needed information (Hosseimi et al., 2024; Resnik & Hosseini, 2024; Solatorio & Dupriez, 2024).
Data were gathered and examined over one year (May 2024–April 2025), with an additional update in May 2025. The research follows a systematic, multi-stage process to identify and assess the most influential academic journals for Brazilian scholars working in an Under-Resourced environment, focusing specifically on the area of Production Engineering as its core domain (Figure 6 shown in Appendix T; ABEPRO, 2024).
2.1. Phase 1: Journal with Data Preparation
Step 1) Judge and select the Core Area (CA) for publication:
This refers to the researcher’s main field. For this study, Production Engineering (PE) was chosen as the core area (Figure 6; Appendix T), aligned with the author’s area of expertise.
In Brazil, the Associação Brasileira de Engenharia de Produção (ABEPRO) is the main body representing PE professionals. The field covers ten areas, ranging from Operations, Supply Chain, and Quality to Sustainability and Education, divided into 58 subareas focused on designing, operating, and improving integrated production systems (ABEPRO, 2024).
Step 2) Obtain and organize Database1, containing all Postgraduate courses
The Coordenação de Aperfeiçoamento de Pessoal de Nível Superior (CAPES), under Brazil’s Ministry of Education, oversees postgraduate education and contributes to national academic output. Data were collected on January 11, 2025, from the CAPES Graduate Programs Database (https://sucupira-v2.capes.gov.br/), the country’s main system for cataloging and evaluating stricto sensu programs.
As of January 2025, the CAPES database listed 7,201 postgraduate programs across 49 academic areas in Brazil (Figure 5; Appendix A), reflecting the country’s diverse research and education landscape. The four largest areas were Interdisciplinary Studies (527 programs), Agricultural Sciences I (367), Education (307), and Language and Literature (270). PE, the core focus of this study, falls under Engineering III, alongside Mechanical, Aerospace, and Naval Engineering.
This distribution illustrates the academic ecosystem driving Brazil’s scientific output and underpins the Research Area Score (RAS) calculation in the Jonas Butterfly Model.
Step 3) Obtain and update Database2, to find total number of journals with unique names
The second database was sourced from the Brazilian Qualis System (https://tinyurl.com/3f2ucmky), a framework developed by CAPES to evaluate and classify academic journals into nine strata (tiers), ranging from A1 (highest quality) to B4 and C (lower quality). Although the Qualis System is being phased out and will be replaced by a new article-level evaluation model starting with the 2025–2028 cycle, it remains widely used in Brazil. Due to its historical significance and continued relevance, particularly for the 2017–2020 evaluation period, the Qualis database is used in this study, as it remains the only publicly available and comprehensive national source for journal classification currently guiding funding decisions and publication strategies during this transition.
The database was downloaded on January 12, 2025, and to ensure data accuracy and avoid duplicate journal entries, the Qualis database (2017–2020 cycle, 154,517 records) underwent a standardization and deduplication process using the Julius AI and Levenshtein Distance fuzzy-matching algorithm, a method that has played a central role, both past and present, in sequence alignment in particular and biological database similarity search in general (Berger et al., 2021). This allowed identification and correction of minor typographical differences in journal titles with identical ISSNs (e.g., variations in punctuation or accents).
The cleaning process (Appendix B) involved four iterative rounds, validated against external databases like Scimago, DOAJ, and official journal sites. Analysis of the 2017–2020 Qualis Database (Figure 7) showed an uneven distribution, with 28,363 A1 titles (18.4% of 154,517 entries; Appendix C). This sharp decline across strata suggests title overlaps and a bias toward publishing in higher-ranked, more prestigious journals.
Focusing solely on the A1 journals (28,363 records, as detailed in Appendix D), nearly 50% are concentrated in a few areas, including Interdisciplinary (7.02%), Medicine I and II (8.64% combined), Biological Sciences I–III (10.39%), Public Health (3.36%), Biotechnology (3.30%), Environmental Sciences (3.28%), and Engineering III (3.12%). This concentration highlights a strong emphasis on publishing in high-impact journals within select fields.
Figure 7.
Number of records and unique journals of the Brazilian Qualis System (2017-2020).
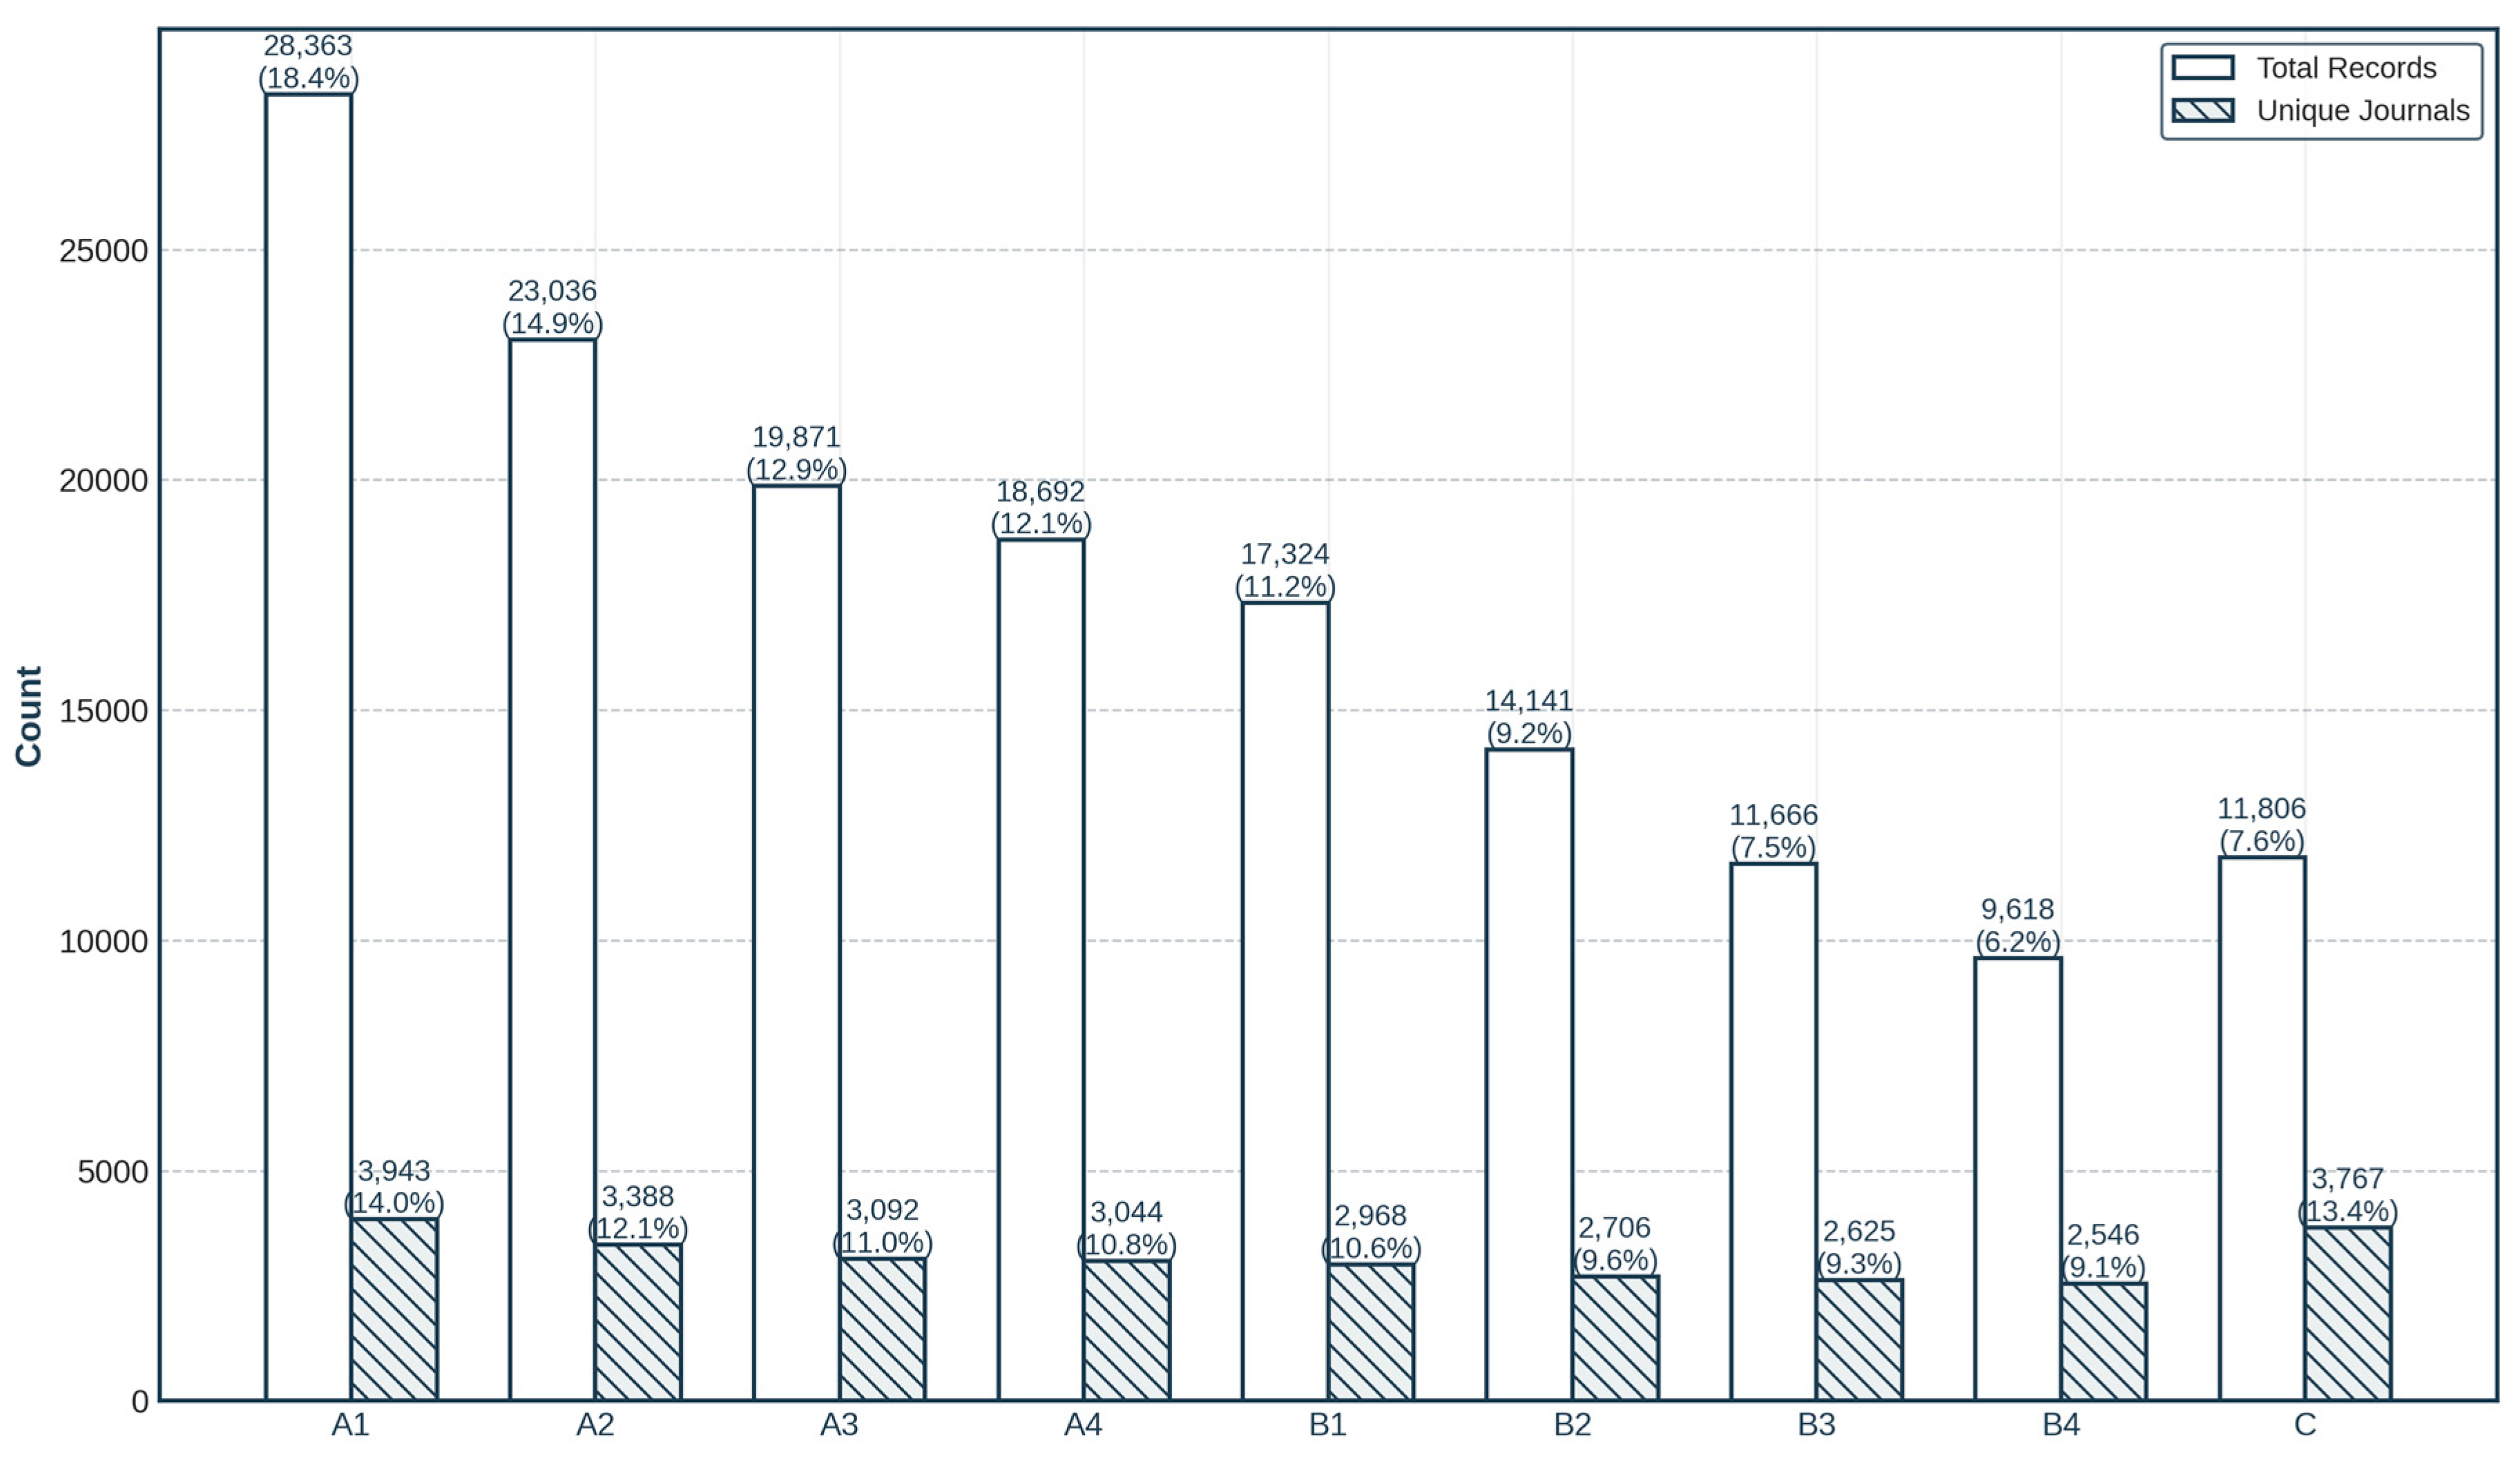
Analysis of the 2017–2020 Qualis Database shows that higher strata (A1–A4) account for 58% of records, reflecting a preference for top-tier journals, while B1–B4 and C represent 34% and 7.7%, respectively. However, when focusing on 27,929 unique titles, the distribution is more balanced, with A1 (14%) and C (13.4%) showing comparable shares.
Additionally, 148 journals appear in multiple strata, highlighting the system’s interdisciplinary reach and inclusiveness.
Another key finding is that the 27,929 unique journal titles correspond to 31,351 ISSNs, reflecting the broad scope of Qualis evaluations. This analysis prioritizes journal unique titles over ISSNs, as titles better capture publication diversity, avoiding duplication from format changes (print or electronic), regional editions, or title history.
Step 4) Select the Top Tier Journals with unique names across all areas
Among 27,929 distinct titles, 3943 (14%) journals are considered in A1 top tier stratum, which is the main target of this research.
2.2. Phase 2: Notable Metrics
Step 5) Nominate and Organize a Table with indicators and formulas
A bibliometric analysis using Lens.org (Gomes da Silva, 2025a) identified 41 publications with ‘Journal Metrics’ in titles or abstracts, mostly journal articles (38; 93%). Basically, traditional evaluation relies heavily on citation-based metrics, especially the Journal Impact Factor (JIF), dominant since the 1960s (Donato, 2014; James et al., 2019).
Given the well-documented limitations of the Journal Impact Factor (Ball State University, n.d.; Chorus & Waltman, 2016; Chivers et al., 2023; James et al., 2019, p. 369; Mech et al., 2020), this study prioritizes the SJR and H-index, as both are free available and offer field-normalized and prestige-weighted assessments, providing a more balanced and reliable evaluation of scholarly impact (Hirsch, 2005; González-Pereira et al., 2010; Kim et al., 2018).
The SJR, freely available from ScimagoLabs and based on Scopus data, uses a three-year citation window and a prestige-weighted algorithm inspired by Google’s PageRank, emphasizing quality over quantity and allowing fairer cross-disciplinary comparisons (González-Pereira et al., 2010; KU Medical Center, 2023).
A higher SJR reflects not just popularity but recognition by influential journals. In addition, unlike the two-year window of the JIF, the SJR uses three years to better capture long-term impact and enable fairer cross-disciplinary comparisons.
For example, on the Scimago Journal & Country Rank platform (https://www.scimagojr.com/), the top-ranked journal is CA: A Cancer Journal for Clinicians, with an SJR of 145.004 and Q1 status. This high value reflects its exceptional citation volume from highly prestigious journals, confirming its leadership and prominence in oncological research.
In parallel, the HI integrates assessments of both productivity and impact by considering the number of publications in conjunction with their citation influence, thus mitigating the distorting effects of outliers (Hirsch, 2005; Masic and Begic, 2016). In simple terms, The HI is a metric that shows how many papers a journal (or a researcher) has published that have each received at least the same number of citations. For example, a journal with an H-index of 40 has published 40 articles, and each of those has been cited at least 40 times.
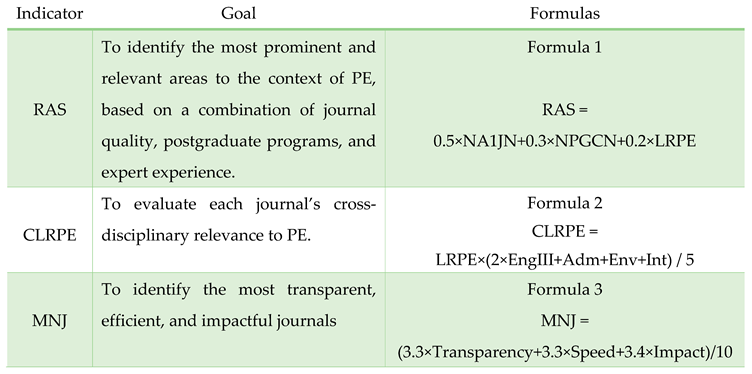
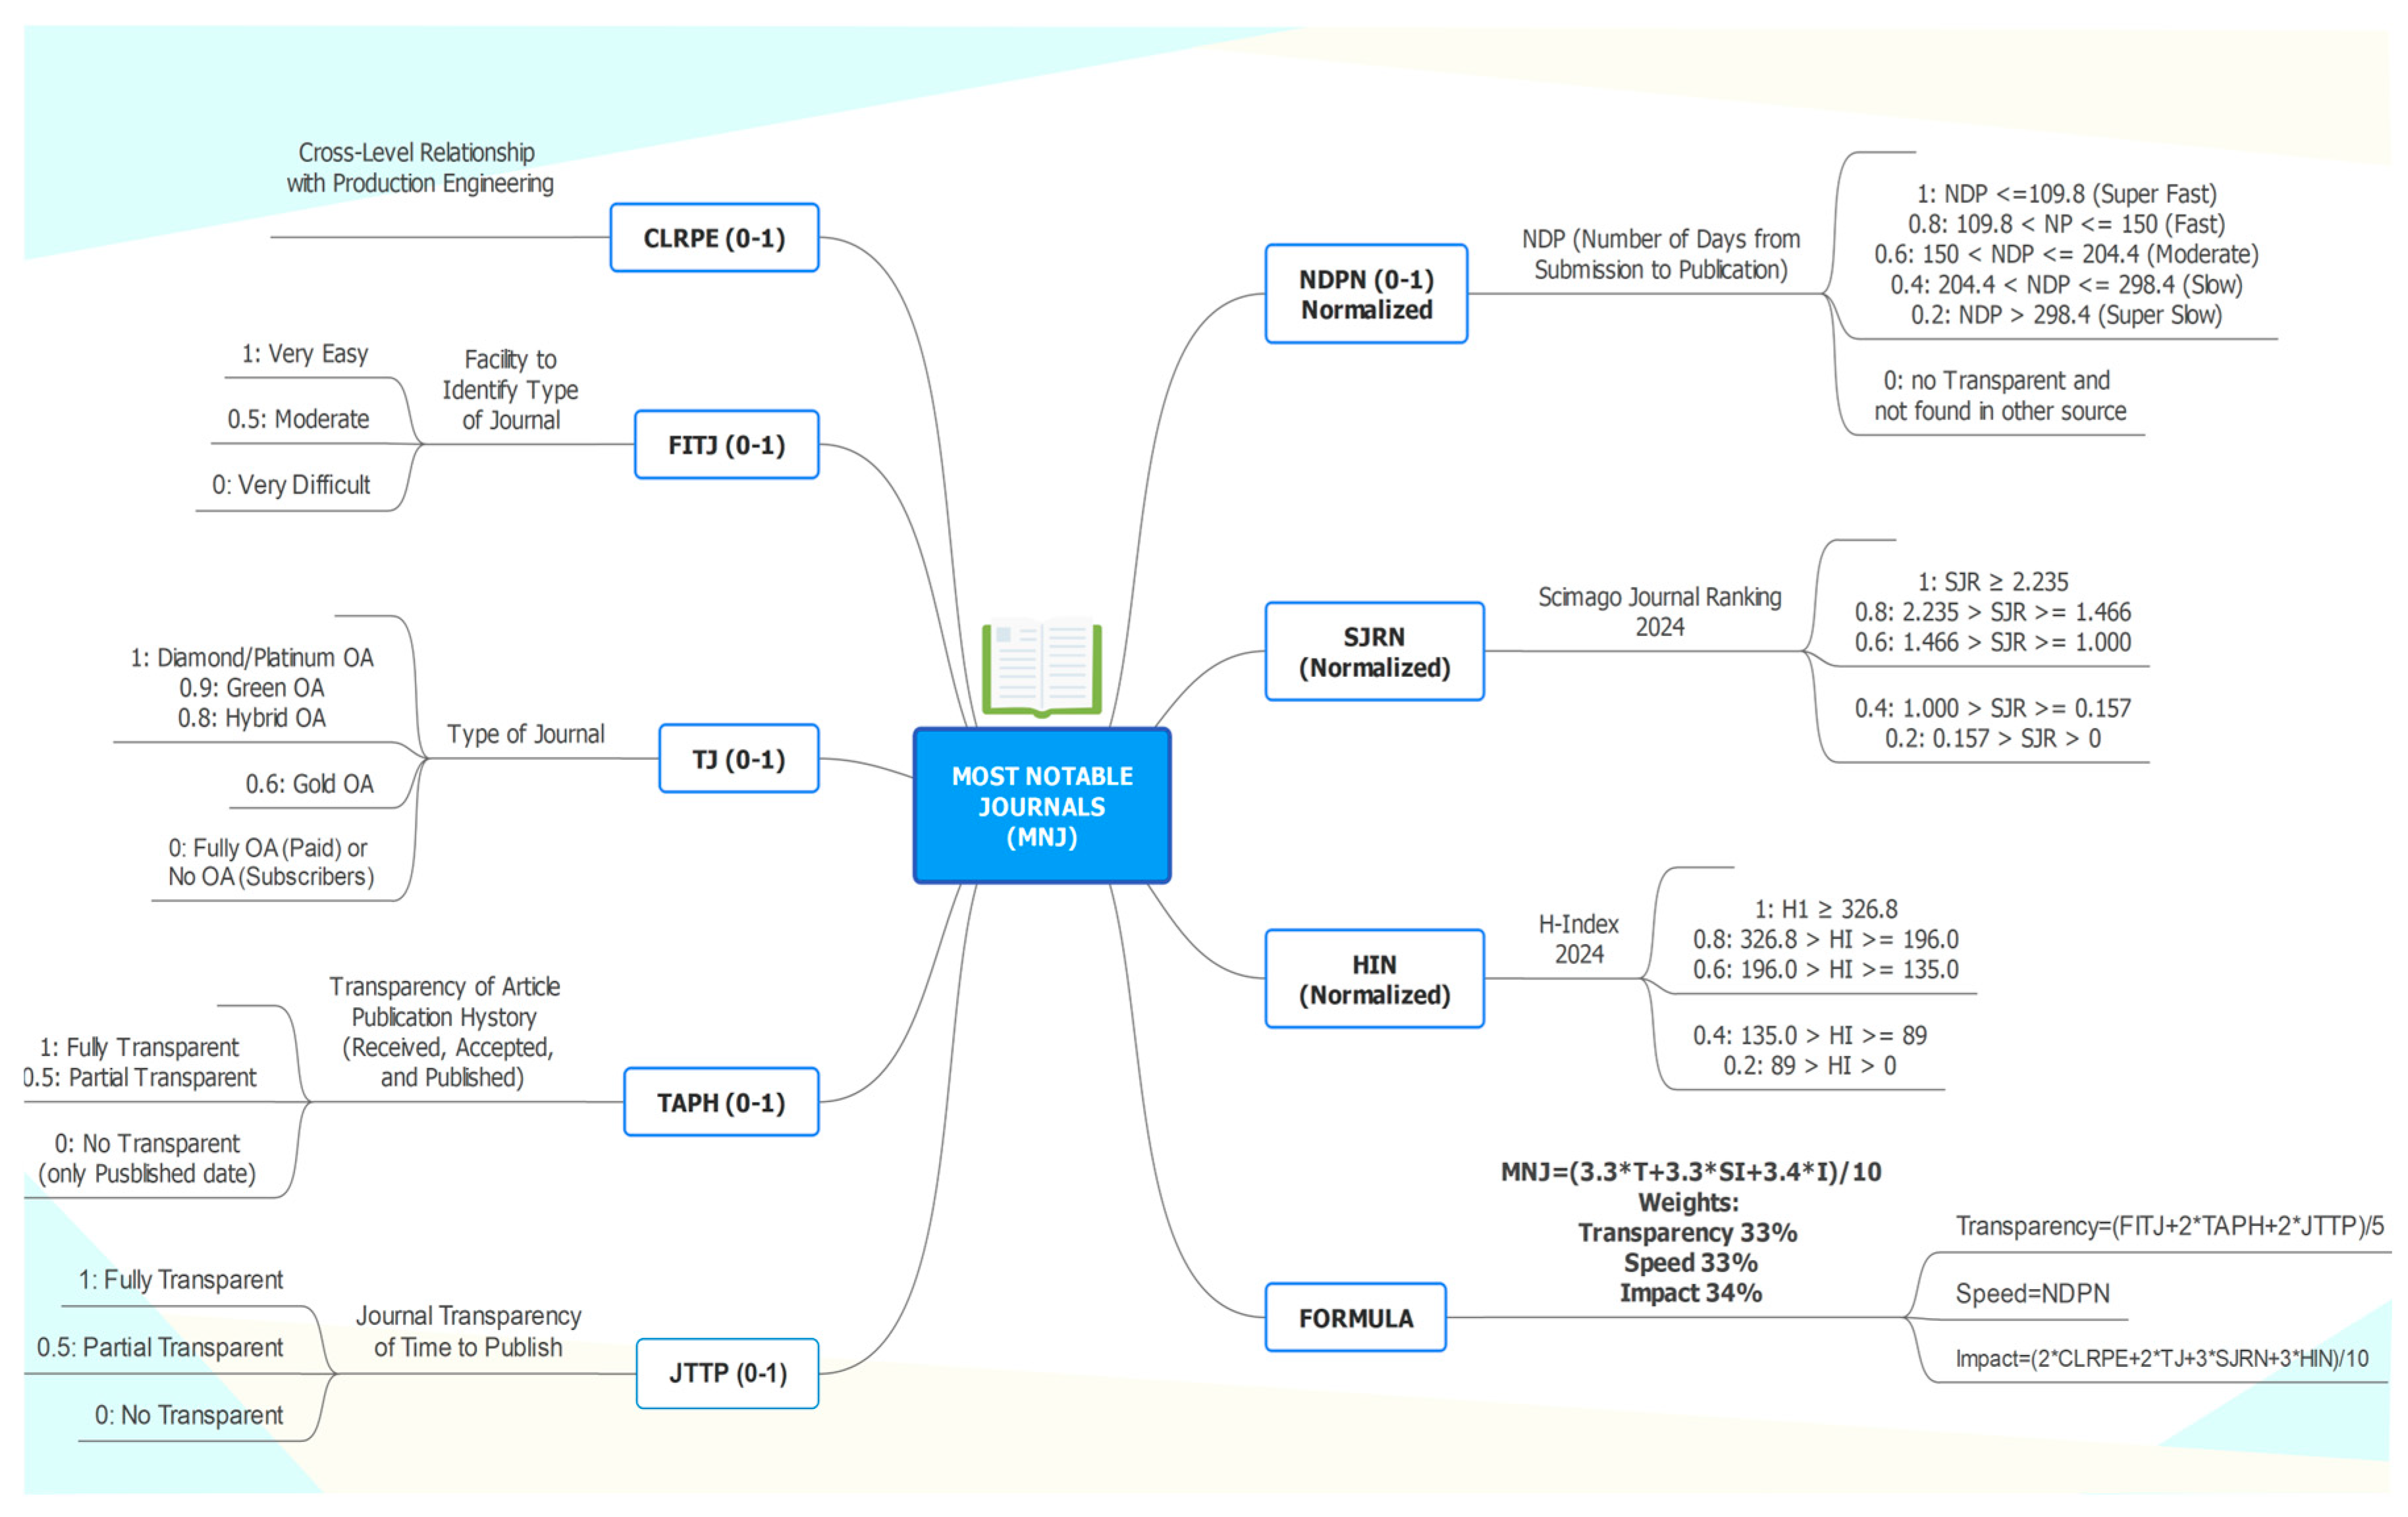
This section does not seek to exhaustively debate the best metrics for journal evaluation. Instead, it explains the use of SJR and HI, with data sourced from the Scimago Journal & Country Rank site using 2024 as the reference year. These metrics are combined with three new key indicators (Table 1), Research Area Score (RAS), Cross-Level Relationship with Production Engineering (CLRPE), and Most Notable Journals (MNJ), which will be detailed in the following sections.

Table 1.
Main indicators and formulas used.
 |
2.3. Phase 3: Assessment
Step 6) Aggregate the data according to the RAS to find the four main areas, population and sample
The Research Area Score (RAS) indicator provides a comprehensive and normalized measure that ranks research areas based on their academic strength and relevance to the Core Area selected.
The data collection process involved two primary sources from CAPES. The Qualis System provided the Number of A1 Journals (NA1J), which represents the quantity of highest-tier journals in each academic area. CAPES’ evaluation of postgraduate programs supplied the Number of Post-Graduation Courses (NPGC), encompassing both master’s and doctoral programs. Additionally, the Level of Relation with Production Engineering (LRPE) was determined through the author’s expert analysis of ABEPRO’s defined areas and subareas.
For each 49 areas, the author assigned a value between 0 and 1, where: 0.0: No relation to the Core Area (Production Engineering); 0.2: Weak relation; 0.4: Moderate Relation; 0.6: Substantial Relation; 0.8: Strong Relation, and 1.0: Very Strong Relation.
The statistical approach involved normalizing the variables NA1J and NPGC to ensure fair comparison across different scales. The variables used in the analysis are defined as follows:
Formula 1: RAS = 0.5 x NA1JN+0.3 x NPGCN +0.2 x LRPE, where:
NA1JN (Normalized Number of A1 Journals) = (NA1J−NA1Jmin) / (NA1Jmax−NA1Jmin)
NPGCN (Normalized Number of Post-Graduation Course =
(NPGC−NPGCmin) / (NPGCmax−NPGCmin)
NA1JN (Normalized Number of A1 Journals) = (NA1J−NA1Jmin) / (NA1Jmax−NA1Jmin)
NPGCN (Normalized Number of Post-Graduation Course =
(NPGC−NPGCmin) / (NPGCmax−NPGCmin)
The weights in the formula were assigned based on specific criteria:
- 0.5 for NA1JN: highest weight assigned to research output quality, as A1 journals represent the pinnacle of academic publication
- 0.3 for NPGCN: weight given to educational infrastructure, reflecting postgraduate training role
- 0.2 for LRPE: weight assigned to domain relevance with the Core Area, balancing the need for field-specific alignment while acknowledging its subjective nature
The normalization scaled each area from 0 to 1, with 1 representing the area with the most A1 journals and 0 the least, ensuring fair comparison across fields. As shown in Appendix E, the top four areas most relevant to PE were: Interdisciplinary (RAS = 0.960; 1,992 A1 journals; 527 programs; LRPE = 0.8), Engineering III (0.505; 886 journals; 188 programs; LRPE = 1.0), Administration (0.497; 832 journals; 263 programs; LRPE = 0.8), and Environmental Sciences (0.475; 929 journals; 185 programs; LRPE = 0.8).
After defining the four main areas, 2,275 unique A1 journals were identified (Appendix F) and assigned LRPE scores. Of these, 63% (1,434) had no link to PE (LRPE = 0.0) and were excluded. The final sample comprised 841 journals (37%) with non-zero LRPE: 43% weak to moderate, 23% substantial, and 34% strong to very strong relevance, ensuring alignment with the study’s disciplinary focus. For resource-limited researchers, targeting these 841 journals offers greater visibility, citation potential, and cross-disciplinary reach, especially through Administration and Environmental Sciences journals. This supports broader dissemination and funding chances without large budgets.
Using Survey Monkey (2025) with N=841, 95% confidence, and a 2.5% margin of error, the minimum sample size was set at 544 journals (64.7%), ensuring strong statistical reliability for analyzing journal relevance in PE.
Step 7) Select the journals to be included in the sample
To select the titles, the Cross-Level Relationship with Production Engineering (CLRPE) indicator was designed to evaluate each journal’s cross-disciplinary relevance to PE. As mentioned in Table 1, the CLRPE is calculated using Formula 2: LRPE×(2×EngIII+Adm+Env+Int) / 5, where:
- LRPE was already explained in Step 6.
- Adm, EngIII, Env, Int receives binary variables (0 or 1) indicating whether the journal is classified under the four main areas selected with RAS formula (Step 6)
In this formula, Engineering III (EngIII) is weighed double for its key role in PE, while Administration (Adm), Environment (Env), and Interdisciplinary (Int) areas are equally weighted. The sum is divided by 5 to normalize the CLRPE score between 0 and 1, enabling easy comparison and effective, balanced journal ranking.
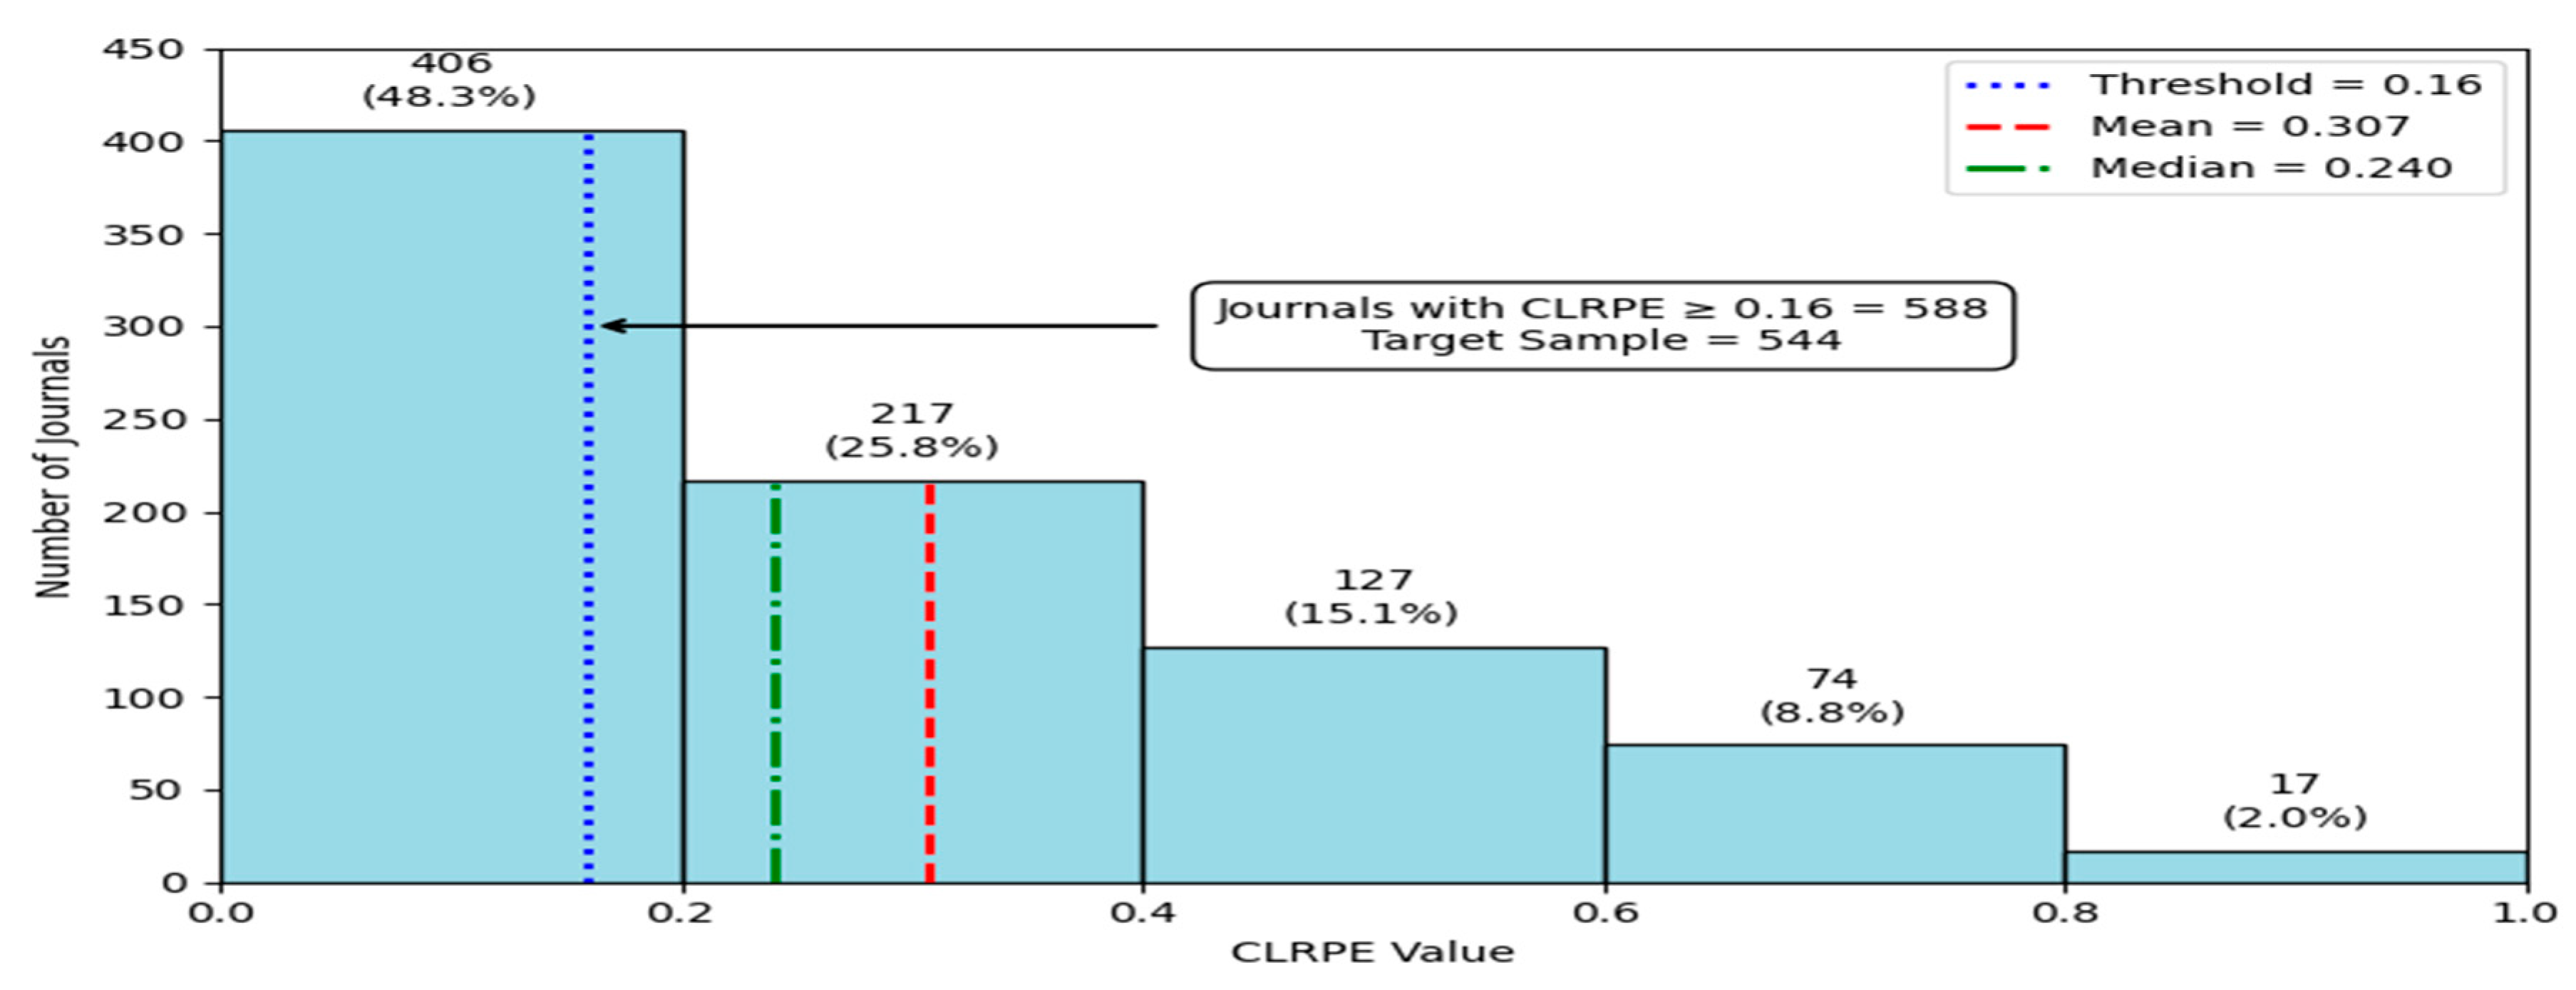
Appendix G lists CLRPE values (0–1) for 841 journals, calculated based on their coverage of four PE-related areas and sorted in descending order. Based on the distribution of CLRPE, an initial group of 544 journals with the highest CLRPE values fell within the interval CLRPE ≥ 0.16, meeting sample size requirements for 95% confidence and 2.5% margin of error. However, a closer inspection of the full population of 841 journals revealed that several additional titles share exactly the 0.16 CLRPE value. By including them, the sample increased to 588 (69.9%) journals, preventing the exclusion of borderline cases and preserving statistical rigor.
Figure 8 shows a left-skewed distribution of CLRPE scores for 841 journals, with 48.3% scoring ≤ 0.20. Frequencies decrease across intervals, with only 2% scoring above 0.80. The median (0.24) and mean (0.31) fall in the 0.20–0.40 range, indicating most journals score below 0.30. A CLRPE cutoff of 0.16 includes 588 journals (69.9%), exceeding the required sample size of 544.
Figure 8.
Distribution of CLRPE values across 841 A1 journals.
When the analysis (Appendix G) focuses on the four coverage areas at CLRPE ≥ 0.16 compared with the population, the results reveal both strong performers and areas for targeted improvement. Engineering III leads with 89.9% (455/506) of journals meeting the threshold. Environment follows at 83.3% (245/294), with some just below cutoff. Administration has 74.8% (306/409), and Interdisciplinary 72.7% (397/546), indicating solid but improvable coverage across areas.
Step 8) Explain MNJ and Extract additional data from SJR, DOAJ, Researcher Life, and Journals
To determine which data needed to be extracted and the appropriate sources, Formula 3 (Table 1 and Figure 9) was developed to identify the most transparent, efficient, and impactful journals, referred to hereafter as the Most Notable Journals (MNJ).
The MNJ score is computed as a weighted average of three key components, Transparency, Speed, and Impact, according to the following Formula 3:
MNJ = (3.3 × Transparency + 3.3 × Speed + 3.4 × Impact) / 10
Indicator data for these components were collected between May and December 2024, then updated from April to May 2025, using 2024 as the reference year. The data were sourced from multiple reputable platforms, including the journal’s official website, Scimago (https://www.scimagojr.com/), DOAJ (https://doaj.org/), and Researcher Life (https://researcher.life/). Due to space limitations, all MNJ component descriptions and normalized values (0 to 1) are provided in Appendix H1 and Appendix H2, respectively.
In this phase, it is important to highlight two key points. First, among the 588 journals identified in Step 7, 586 were successfully validated. Only the journal REDES (ISSNs 1414-7106 and 1982-6745) was excluded due to its absence from the Scimago database, which rendered it without available values for the SJR and H-Index metrics. Second, the quantile-based normalization and classification applied to the SJRN and HIR variables ensure standardized scaling that effectively captures meaningful differences in journal performance. This methodological approach, using well-defined thresholds, enhances interpretability, facilitates direct comparisons across journals, and supports robust, replicable analysis in scholarly assessments.
2.4. Phase 4: Scores
Step 9) Select and Classify the 400 Most Notable Journals (MNJ)
9.1 Select 400 MNJs
The MNJ formula was applied to a dataset of 587 journals (Appendix H2) to prioritize and select the top 400 Most Notable Journals (MNJs). The selection process involved excluding 50 journals (8.5%) that were either fully open access with mandatory APCs or subscription-only, both financially restrictive for researchers with limited funding. Additionally, 133 journals (22.6%) were excluded due to a lack of transparency in the SPEED Index, and 3 journals were removed for having the lowest MNJ scores.
The new list, presented in Appendix I, ranks the 400 MNJs in descending order based on their MNJ scores (median: 0.6956; range: 0.3078–0.9619). For each journal, key publication attributes are provided, including Title, ISSN, MNJ score, coverage across four main subject areas, Qualis classification, APC amounts (ranging from US$0 to US$12,690; mean: US$3,763), publisher, journal type, 2024 NDP (in days), and the component metrics contributing to the MNJ score. Consequently, the five leading MNJs are Elsevier’s hybrid journals, and include: Applied Catalysis B: Environmental, Bioresource Technology, Energy Conversion and Management, Science of The Total Environment, and Journal of Hazardous Materials.
These journals support open access through two options for authors with accepted articles: pay the APC (median: US$4,830) for immediate open access, or opt for the traditional subscription model, where only the abstract is publicly accessible and full content is restricted to subscribers. They also demonstrate a rapid publication timeline, with a median NDP of 89.5 days.
Figure 9.
Detailed Formula of the Most Notable Journals (MNJ).
9.2. Performance by type of Journal and Publishers
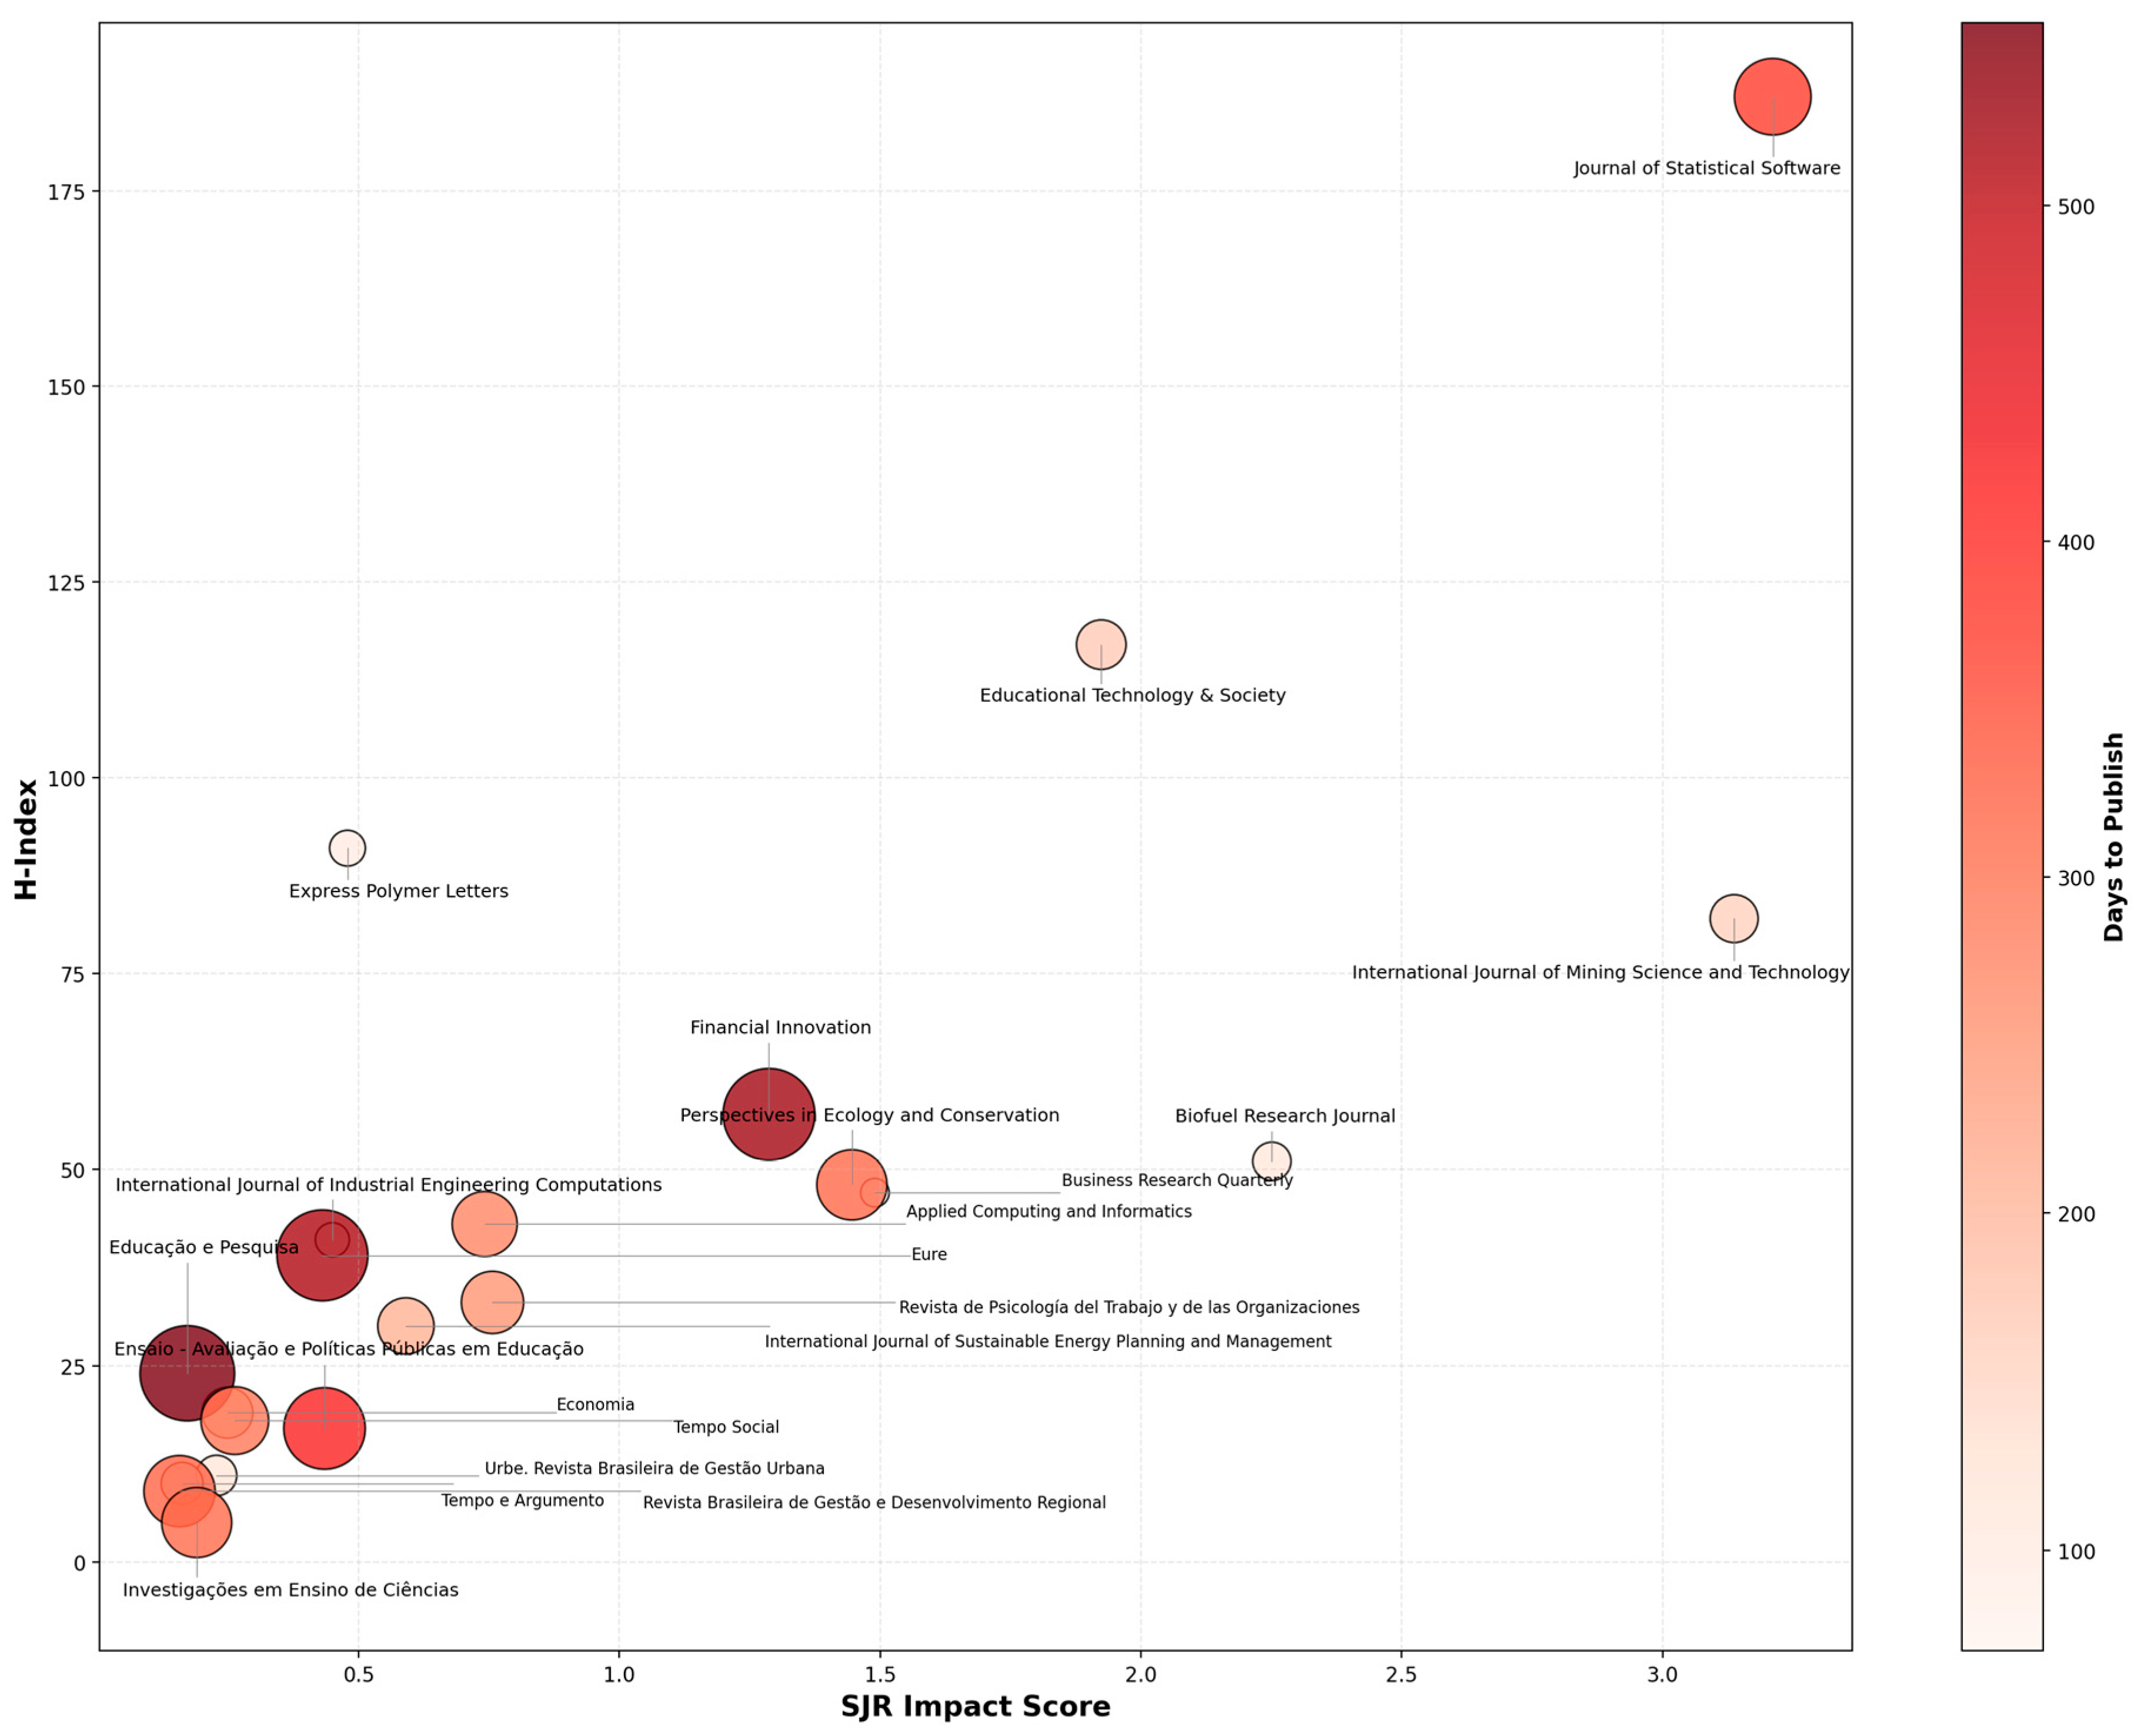
The analysis of 400 journal types reveals a more favorable publication landscape for Under-Resourced researchers than initially anticipated. Among them, 21 Diamond Open Access (OA) journals (5.2%) stand out for offering no-fee publishing and full public access to articles. These journals report a mean publication time of 261 days (ranging from 70 to 554.5 days), making them highly accessible for scholars facing financial constraints.
Figure 10 presents a combined impact-speed metric (SJR × H-Index × NDP) for these Diamond journals. On average, they show an SJR of 0.955 (0.157–3.211) and an H-index of 46.6 (5–187). The Most Notable Journals include the International Journal of Industrial Engineering Computations (MNJ=0.8164; NDP=90 days; SJR=0.450; HI=41), Biofuel Research Journal (MNJ=0.7953; 109 days; 2.251; 51), International Journal of Mining Science and Technology (MNJ=0.7456; 158.5 days; 3.137; 82), and Express Polymer Letters (MNJ=0.6334; 98 days; 0.479; 91).
For researchers prioritizing impact and visibility over publication speed, recommended journals include the Journal of Statistical Software (NDP = 371 days), International Journal of Mining Science and Technology (158.5 days), and Educational Technology & Society (168 days). Conversely, for those seeking faster publication timelines, leading options are Business Research Quarterly (70 days), International Journal of Industrial Engineering Computations (90 days), Express Polymer Letters (98 days), and Biofuel Research Journal (109 days). Targeting these Diamond journals allows scholars to publish in top-tier A1 outlets without incurring APCs, effectively balancing impact, visibility, and speed according to individual research goals.
Figure 10.
Performance Metrics of 21 Most Notable Diamond Open Access Journals.
Hybrid Journals dominate with 361 journals (90.2%) with the top five MNJs already mentioned in the previous section. All the 361 journals offer the option of free publication with abstract-only visibility, boasting the highest average metrics (SJR 2.048, H-index 170.8) and faster publication times (median 180 days). While their APCs average $4,034 for those choosing open access, the no-APC option (tradition) makes them accessible to all researchers.
Gold OA Journals constitute only 18 journals (4.5%), requiring APCs averaging $2,722 (range $1,300-$4,640) with moderate impact (SJR 1.184) and median of 214 days from submission to publication. Strategic options include journals related to University of Surrey (Jasss; US$ 1,300, 98 days), Vilnius Gediminas Technical University (Technological and Economic Development of Economy; $1,378, 105 days), and Springer Nature (Humanities and Social Sciences Communications; $1,890, 133 days) for researchers with modest funding.
In terms of Publishers, the Elsevier Group leads with 206 journals (210 Hybrid, 1 Diamond), averaging 189 days to publication and SJR 1.933, while Springer Group’s 38 journals (33 Hybrid, 4 Gold OA, 1 Diamond) average 244 days, and Taylor & Francis’s 27 journals (26 Hybrid, 1 Gold OA) take 261 days on average.
9.3. Performance by Qualis Main Area
When each journal area is classified according to QUALIS main area, the Appendix I shows high diversity, covering 30 distinct fields. In terms of representability, the top ten areas (Table 2; Appendix J) include Engineering III (96 journals), Administration (69), and Chemistry (31), while eight areas, such as Geography, Education, and History, are represented by only one journal each
Table 2.
The ten most representative Qualis main Areas among the 400 MNJ.
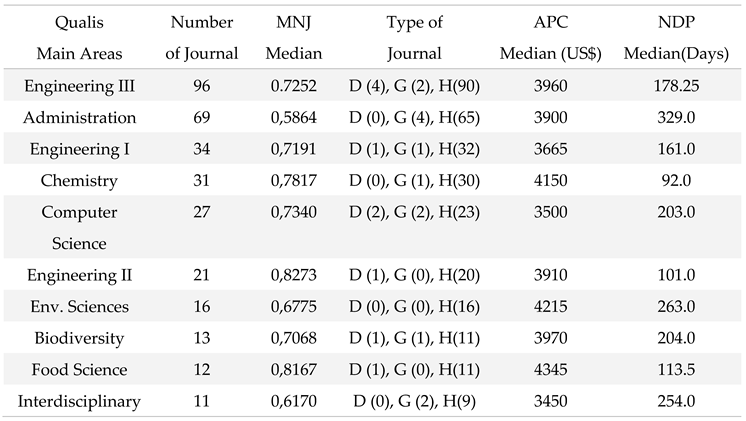 |
Legend: D = Diamond Journals (Free), G = Gold OA; H = Hybrid OA.
Analysis of median MNJ scores, journal types, APCs, and NDP across Qualis Main Areas with over five journals (Appendix J; Figure 11) reveals distinct patterns within High, Middle, and Low MNJ Groups, offering key insights for resource-limited researchers.
The High MNJ Group includes five areas with 84 journals and a median MNJ of 0.8167: Engineering II, Food Science, Astronomy & Physics, Chemistry, and Agricultural Sciences I. These fields feature a fast median publication time (101 days) and a median APC of US$3,950. Most journals are hybrid (81 titles), with only two Diamond and one Gold OA.
For Under-Resourced authors, hybrid journals in High MNJ Group offer free publication with abstract access but restrict full-text availability. Despite the few Diamond journals, the abundance of hybrid outlets provides 83 no-APC options for rapid dissemination, albeit with limited visibility behind paywalls.
The Middle MNJ Group includes four areas with 166 journals and a median MNJ of 0.7232: Engineering III, Computer Science, Engineering IV, and Engineering I. This group has a slower median NDP (170 days) but a lower median APC of US$3,682.50. Hybrid journals dominate (154 titles), with seven Diamond and five Gold OA journals offering free or low-fee full-text publication. This provides underfunded researchers with a balance of impact and affordability.
Figure 11.
Submission-to-Publication Distribution by MNJ Group (Areas > 5 Journals).
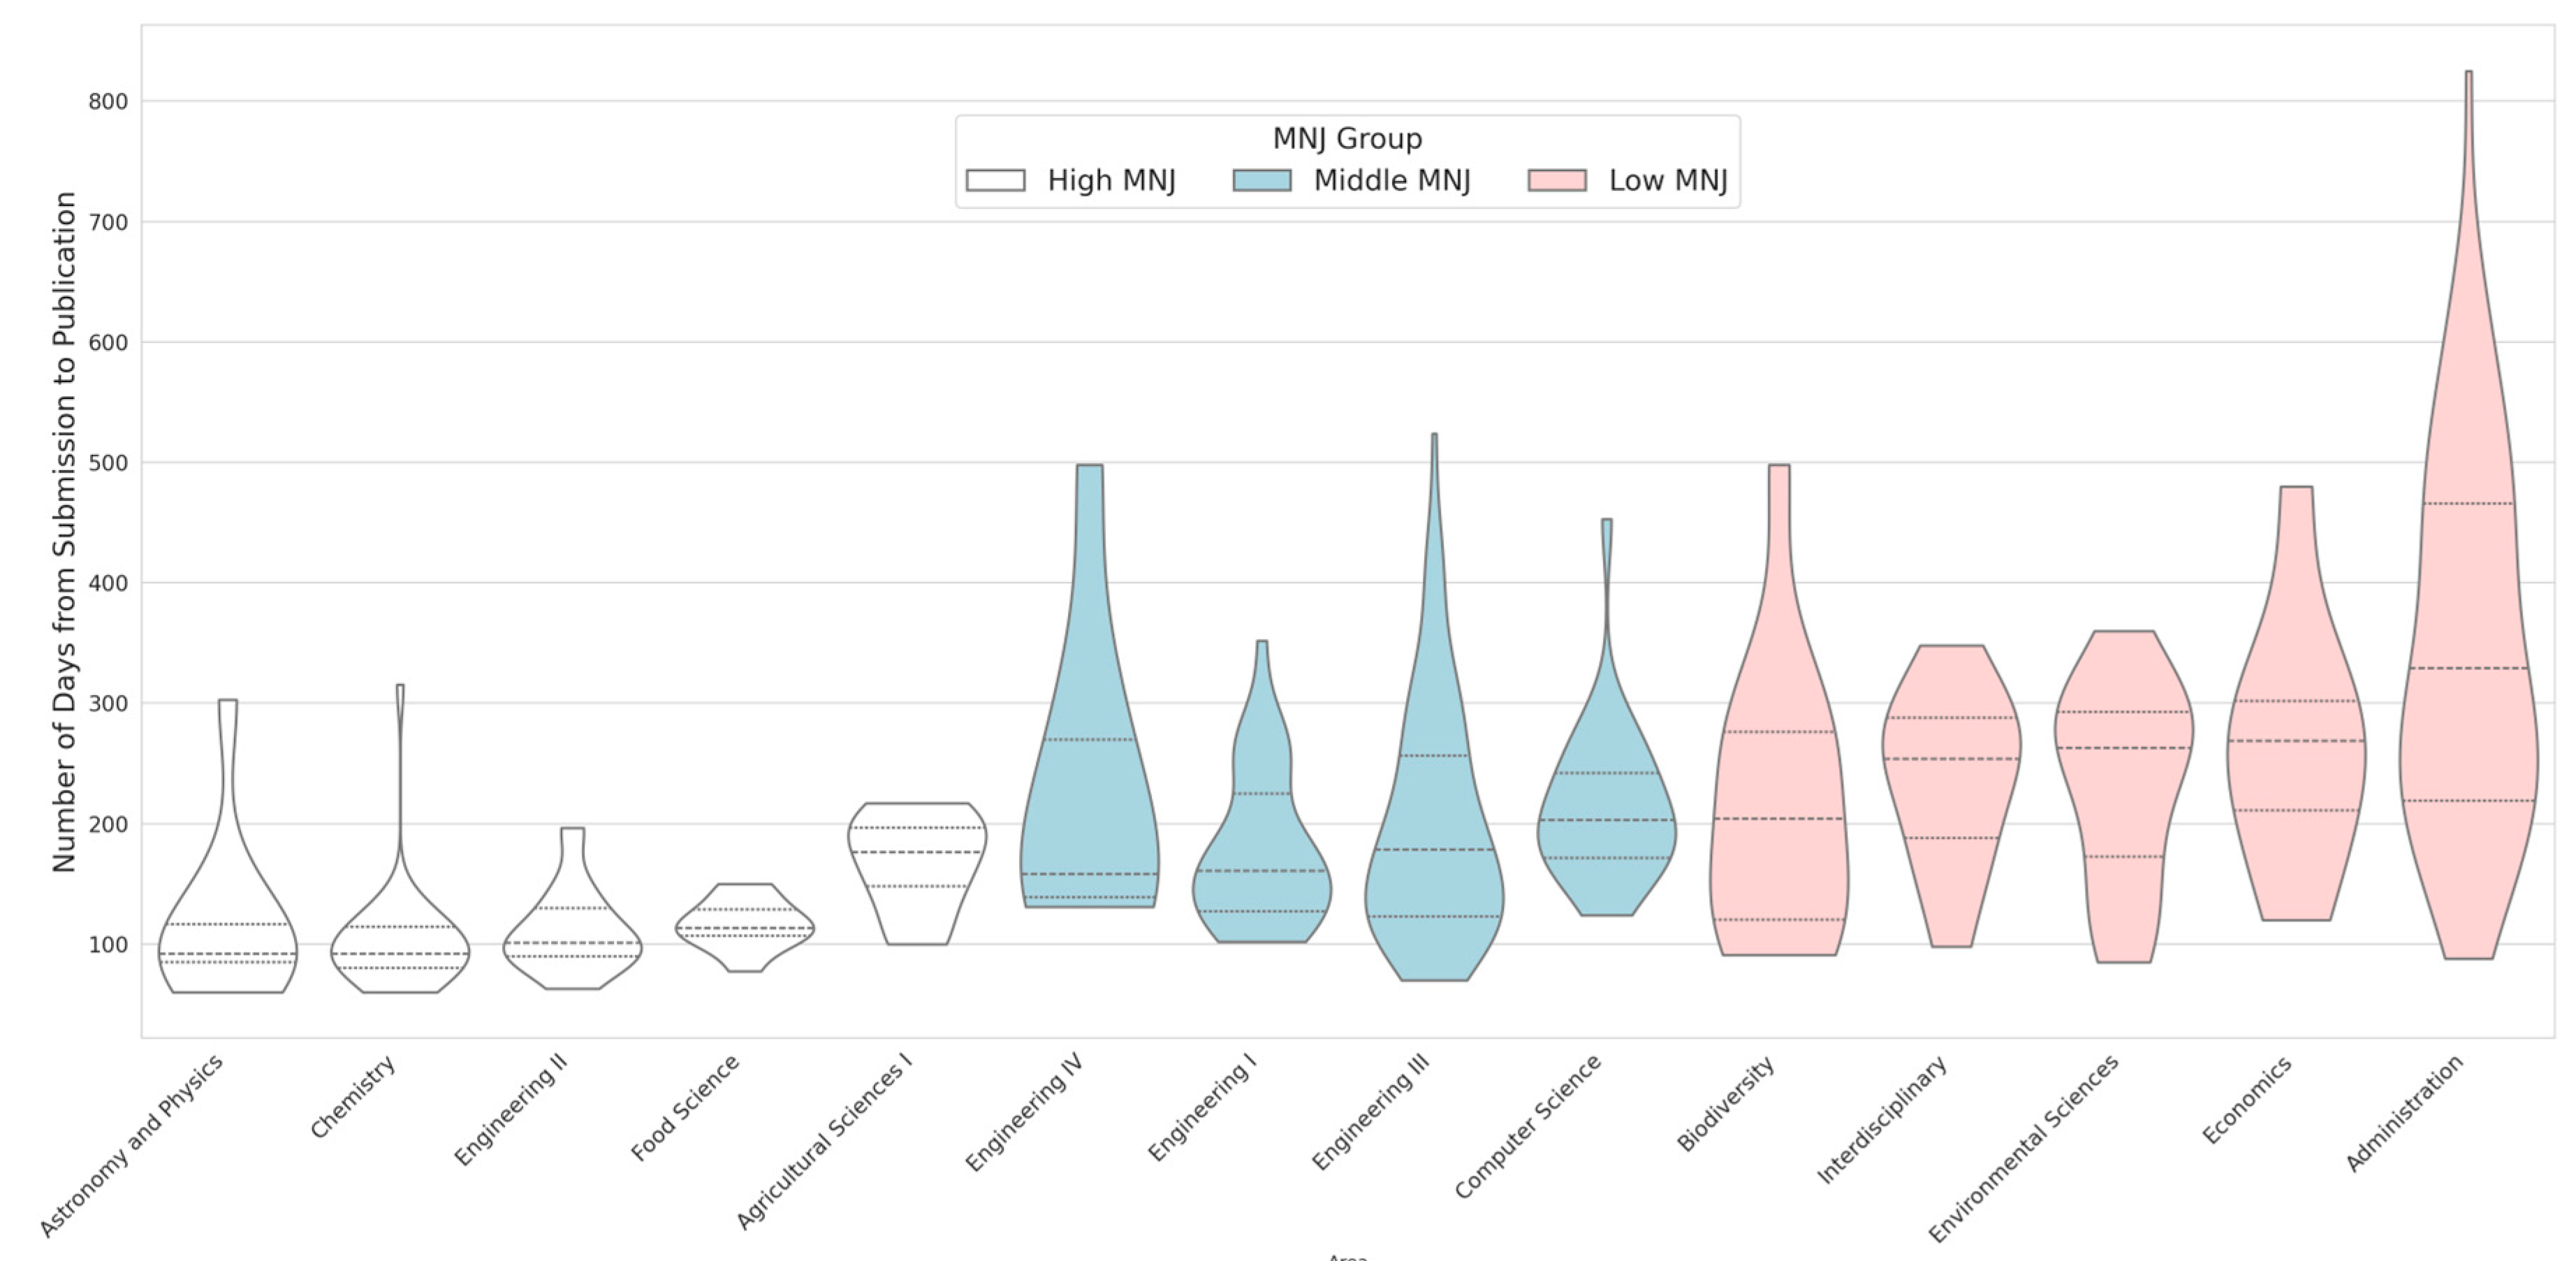
The Low MNJ Group includes Biodiversity, Environmental Sciences, Interdisciplinarity, Administration, and Economics, totaling 117 journals with a median MNJ of 0.6170. Despite lower impact and longer publication times (median 263 days), this group charges the highest median APC (US$3,955) and consists mainly of hybrids (108), with only seven Gold OA and two Diamond journals, offering a poor cost–benefit ratio.
To navigate these constraints, Under-Resourced scholars should publish via hybrid no-APC routes and deposit preprints in open repositories, or concentrate on the few available Diamond journals, to ensure both fee relief and full-text accessibility.
9.4. Classify the 400 MNJs
The Julius AI and Appendix I were used to develop Appendices L and M to classify the journals in nine quadrants as shown in Figure 12. To avoid arbitrary thresholds, the 400 journals were classified using again the percentile-based approach, dividing Speed and Impact into tertiles: Speed (Slow ≤0.4, Moderate 0.4–0.8, Fast >0.8); Impact (Low ≤0.552, Moderate 0.552–0.68, High >0.68), all percentiles based on 33.33rd and 66.67th breaks).
Thus, Appendix L and Figure 12 present the distribution of journals across the nine groups (3×3 matrix), revealing notable patterns within the academic publishing landscape. These patterns and recommendations are described in the next sections.
9.4.1 Quadrant 1 (Q1): Slowest & High Impactful
This group includes 51 journals (median MNJ: 0.6544) with long publication times (median NDP: 281 days) but high impact. Dominated by hybrids (96.1%), it offers flexibility for Under-Resourced researchers. Key titles include the International Journal of Production Economics and Renewable & Sustainable Energy Reviews. With one Diamond (Journal of Statistical Software) and hybrid APCs (median: $4,030), authors can publish without upfront costs, retain abstract visibility, and seek funding for OA after acceptance.
9.4.2 Quadrant 2 (Q2): Moderate Speed & High Impactful
This quadrant includes 47 journals (median MNJ: 0.7905) with fast publication times (median NDP: 154 days) and high impact. All are hybrids, offering submission without upfront APCs. Top titles include Applied Energy (MNJ = 0.8864; NDP = 131.5 days), Waste Management (MNJ = 0.8796; NDP = 147.5 days), Environmental Pollution (MNJ = 0.8755; NDP = 111 days), Acta Materialia (MNJ = 0.8687; NDP = 132 days), and Journal of Environmental Management (MNJ = 0.8660; NDP = 111.5 days).
Despite a high median APC ($4,260), Under-Resourced researchers can benefit from rapid timelines, defer OA decisions until after acceptance, and explore green OA options where available.
Figure 12.
3x3 Matrix showing the distribution of the 400 Most Notable Journals.
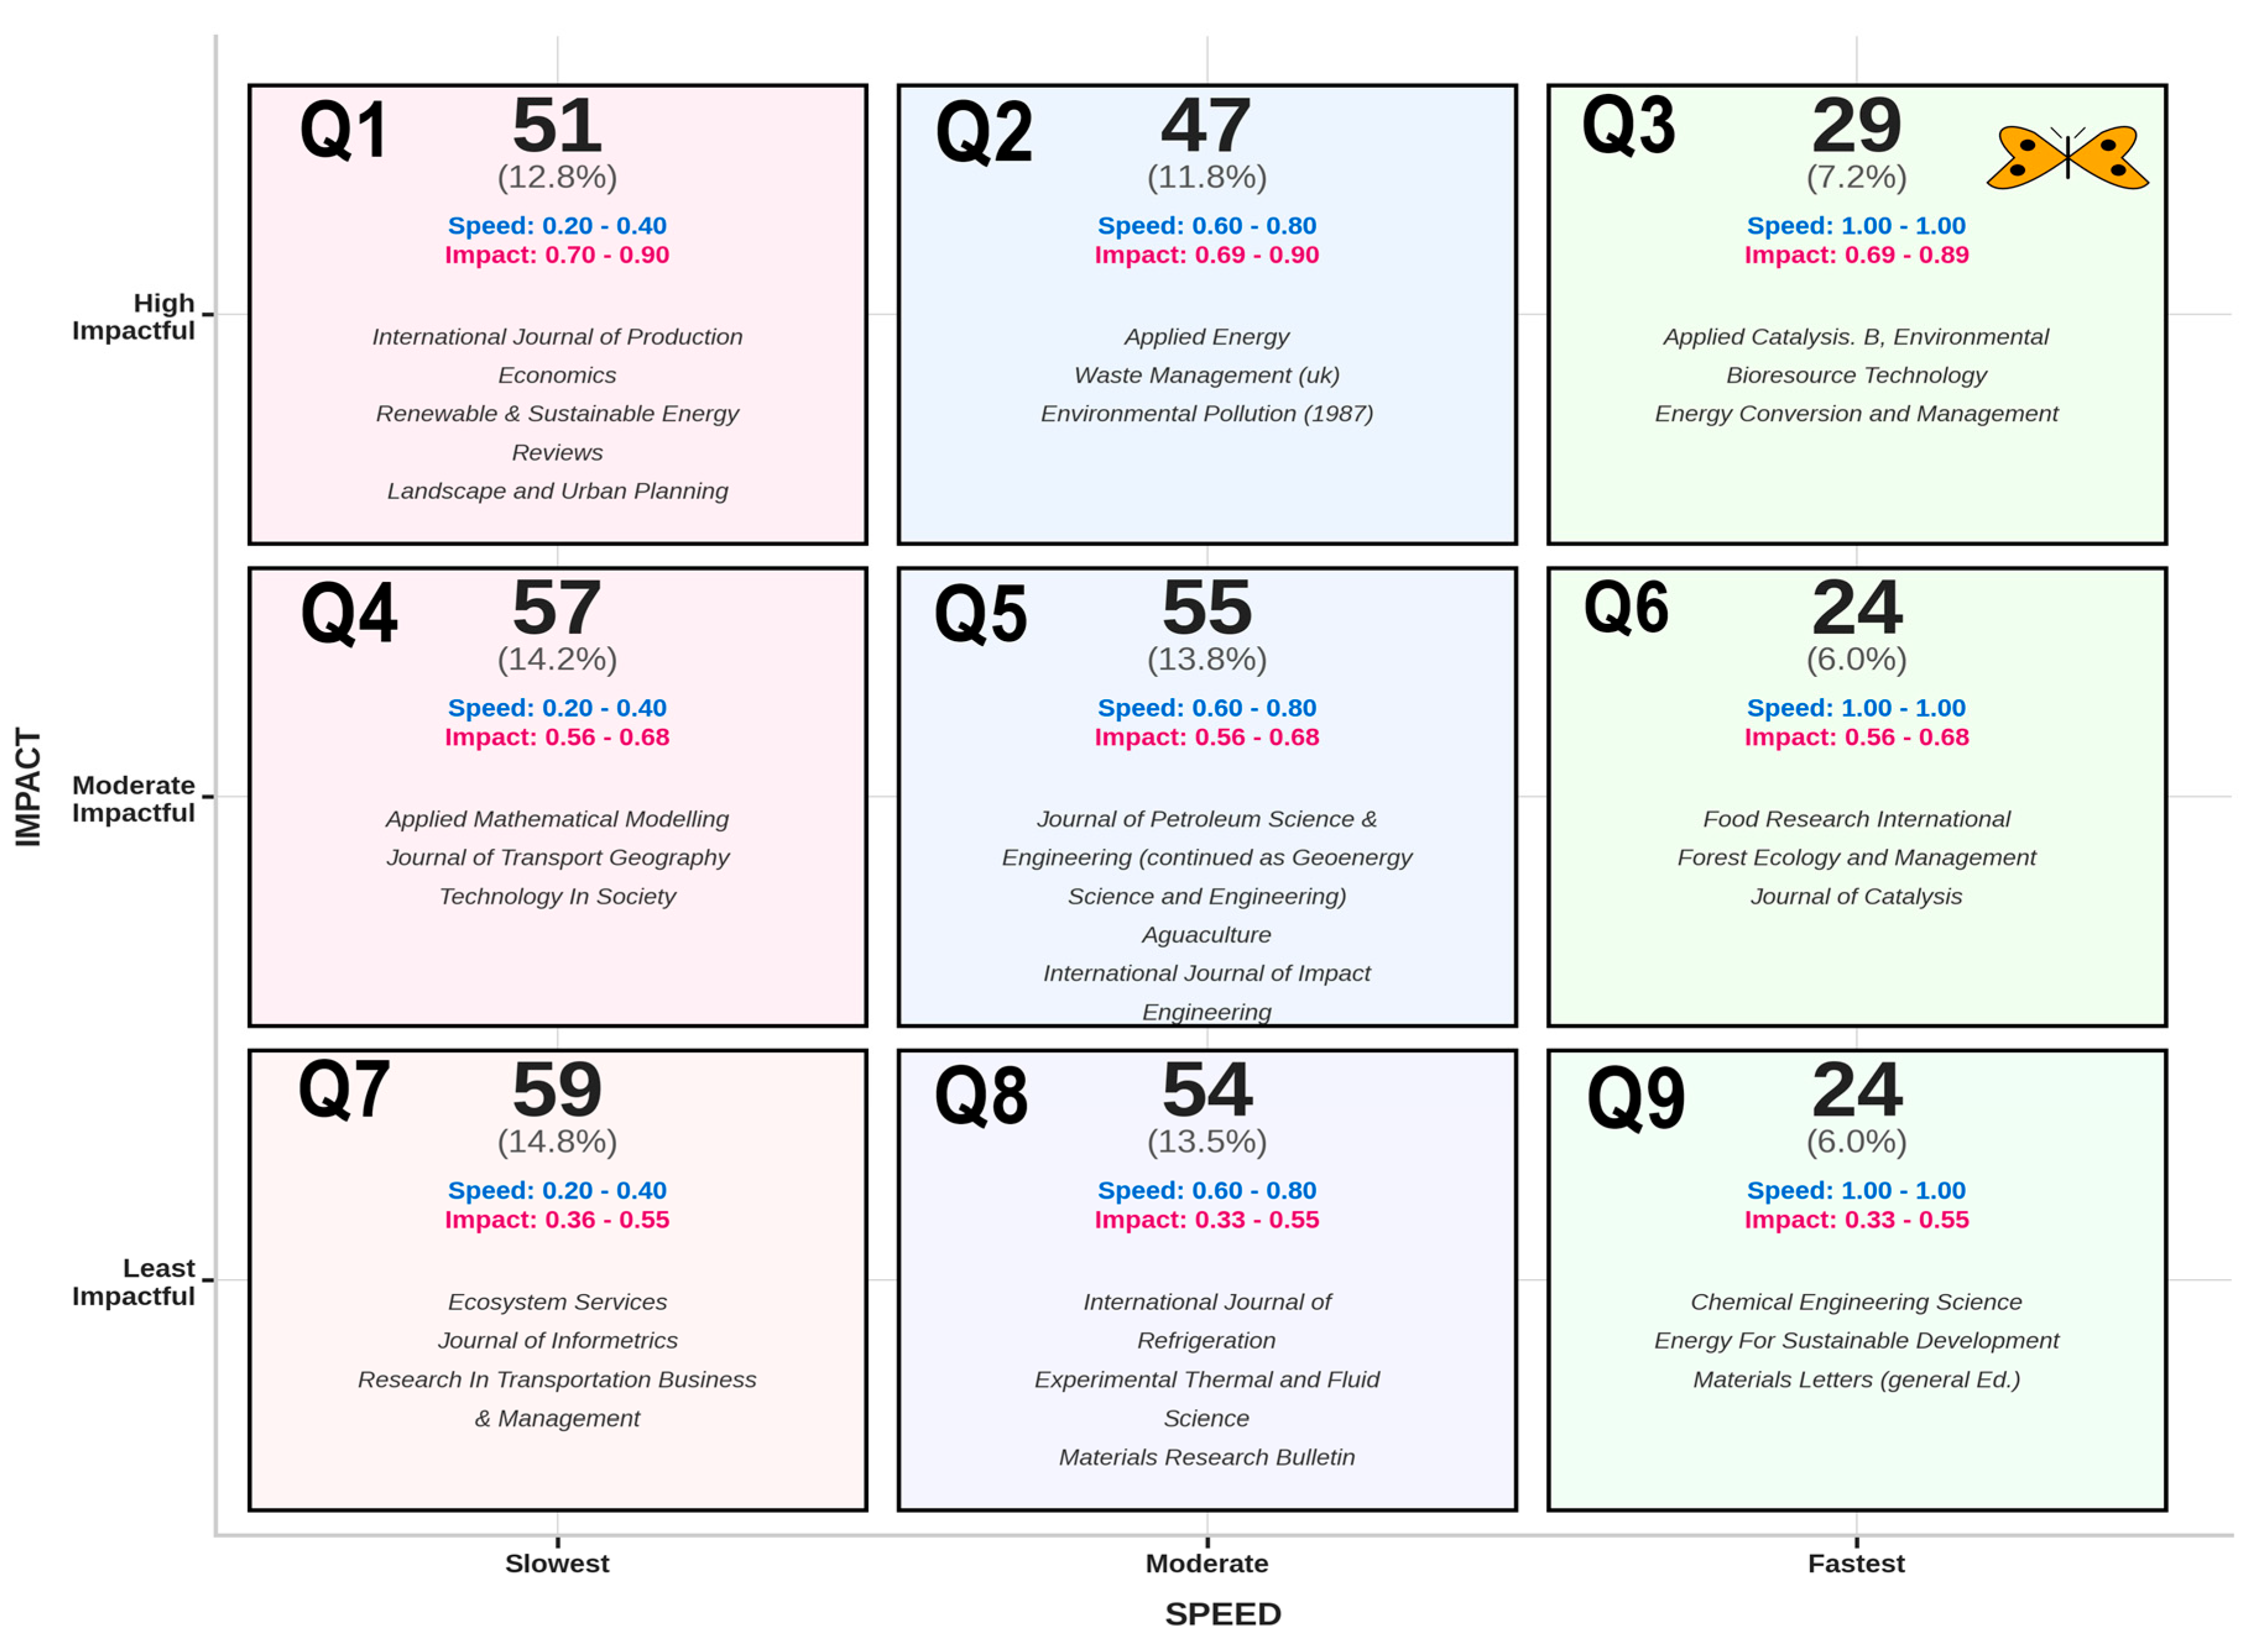
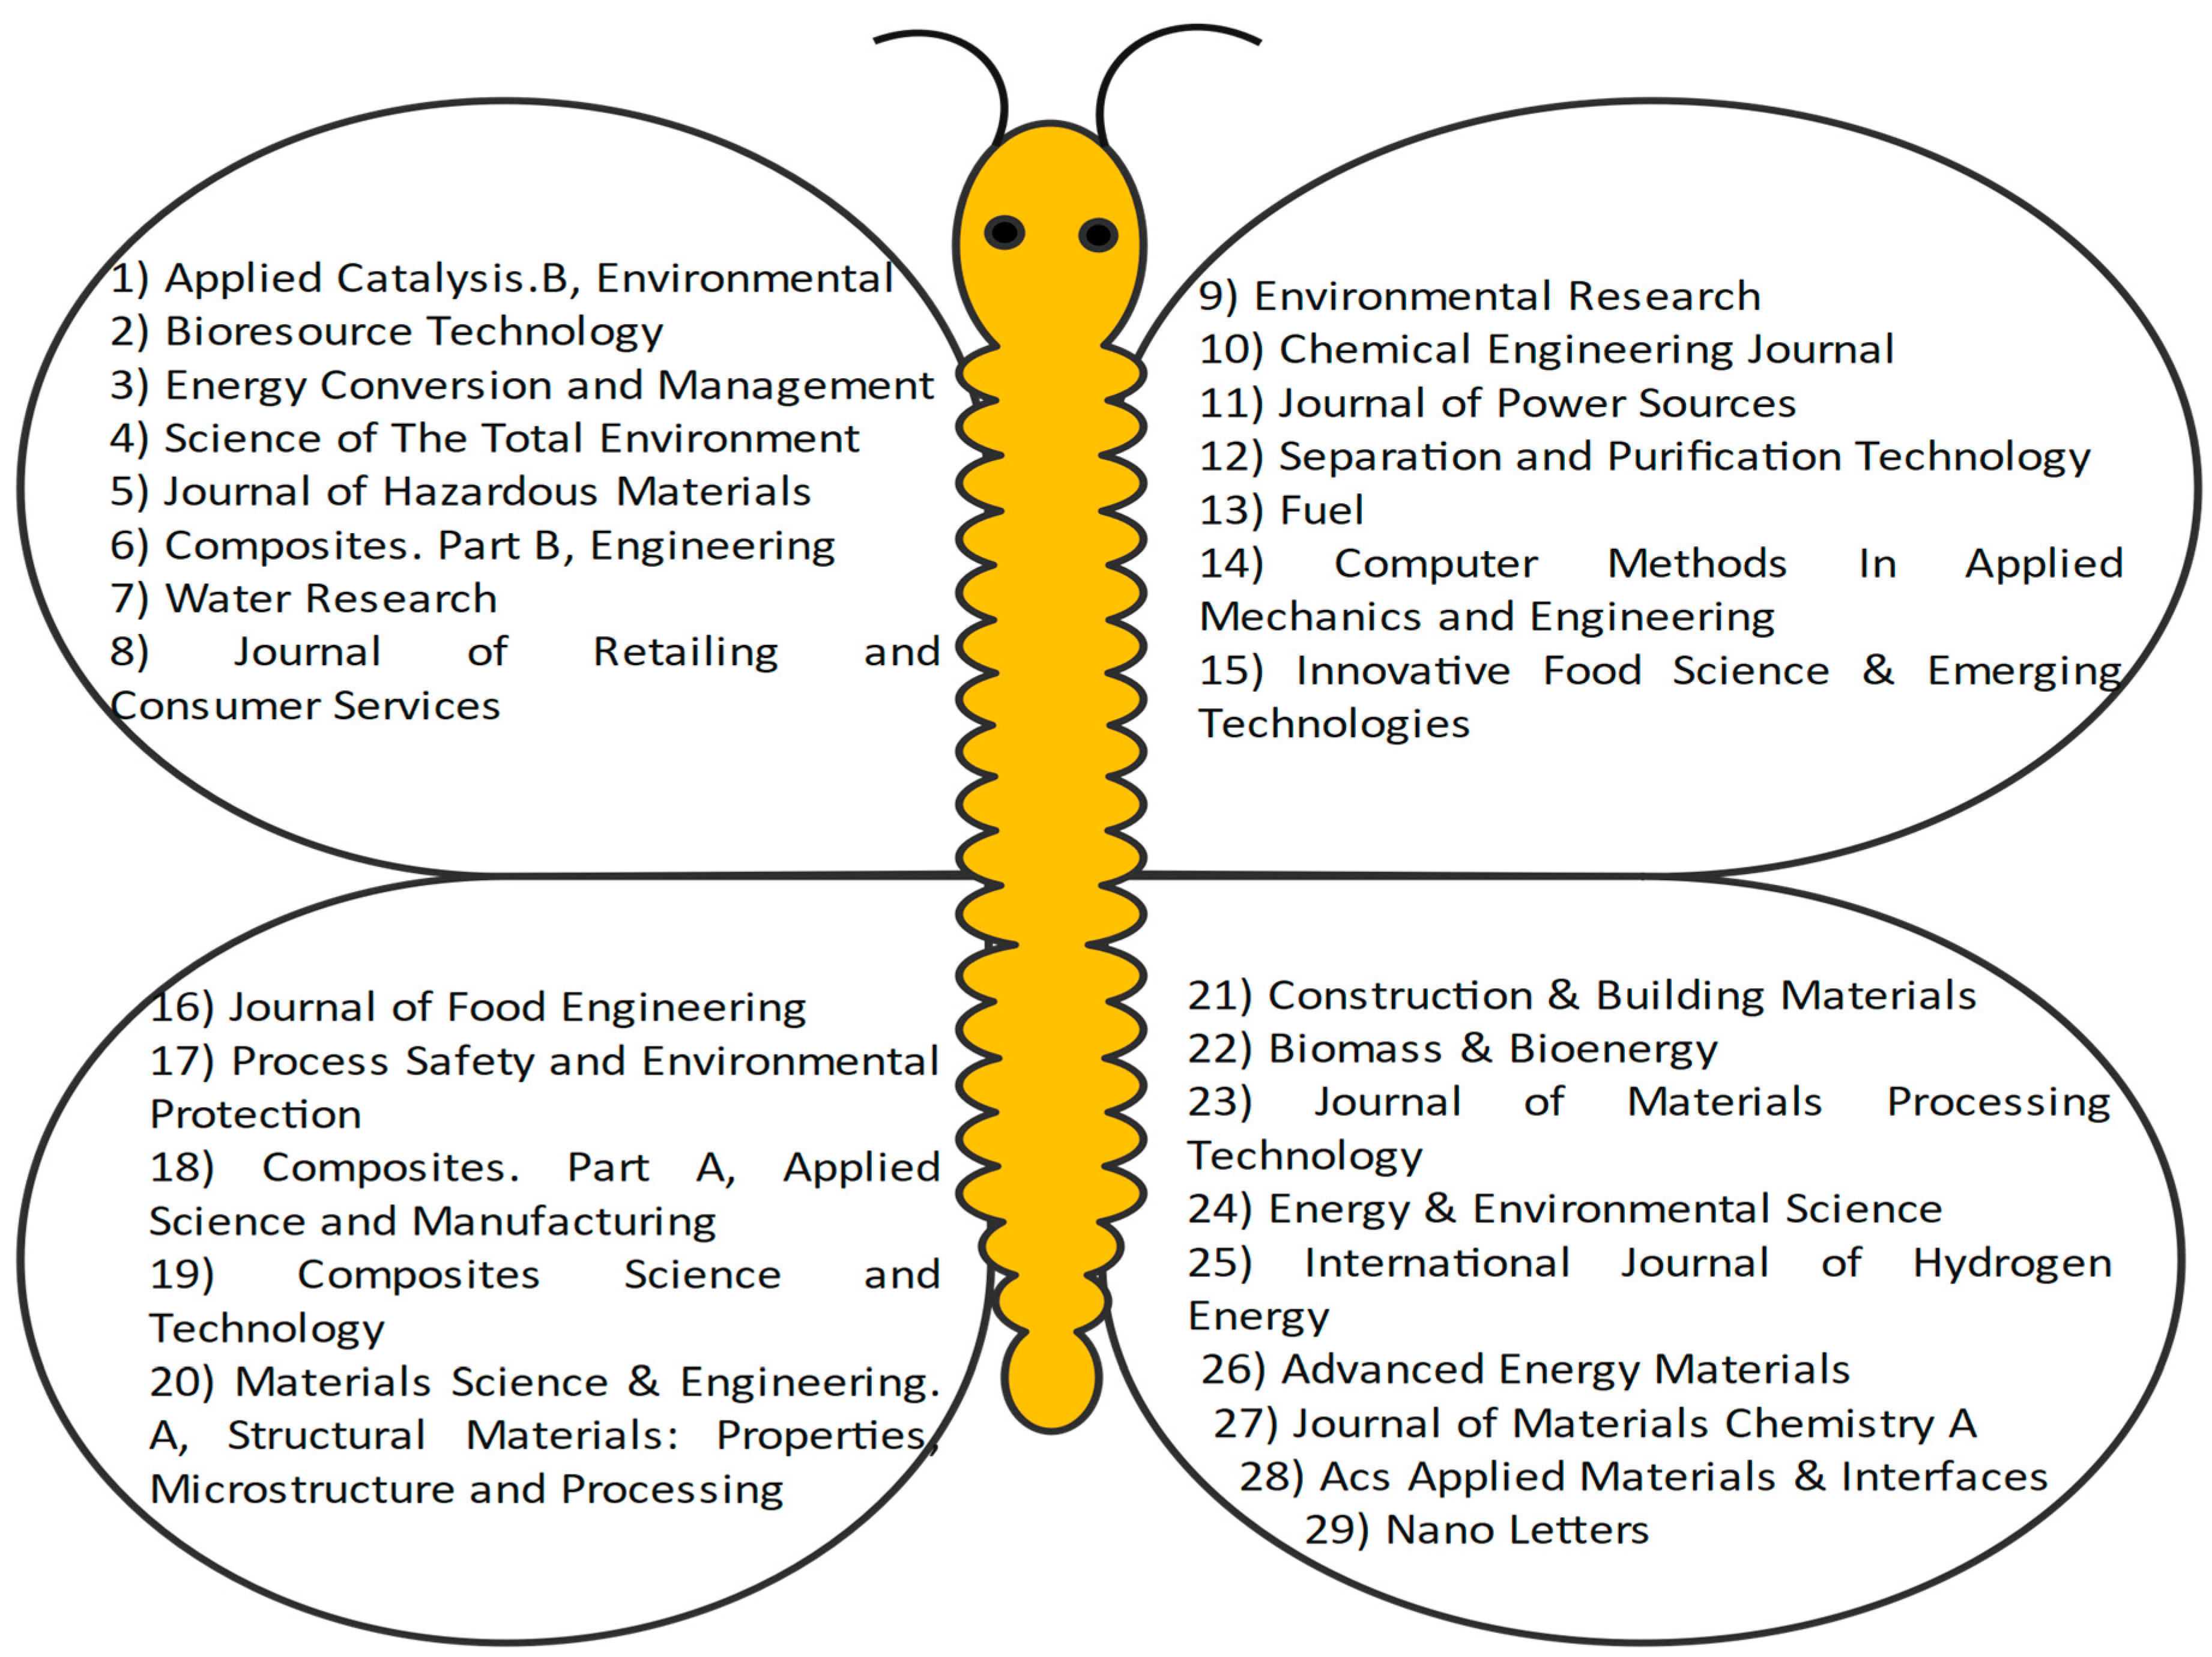
9.4.3 Quadrant 3 (Q3): Fastest & High Impactful Journals
This is the elite category (Figure 13), characterized by the highest median MNJ (0.9116), the greatest impact (0.712), and the fastest publication time among all quadrants, with a median NDP of 91 days. All 29 journals operate as hybrids, and the five best performers are: Applied Catalysis B: Environmental (MNJ = 0.9619; NDP = 76.5 days; CLRPE = 0.64; SJR = 5.18; HI = 353), Bioresource Technology (MNJ = 0.9592; NDP = 80.5 days; CLRPE = 0.60; SJR = 2.395; HI = 383), Energy Conversion and Management (MNJ = 0.9524; NDP = 91.5 days; CLRPE = 0.80; SJR = 2.659; HI = 274), Science of The Total Environment (MNJ = 0.9524; NDP = 91 days; CLRPE = 0.80; SJR = 2.137; HI = 399), and Journal of Hazardous Materials (MNJ = 0.9510; NDP = 89.5 days; CLRPE = 0.48; SJR = 3.078; HI = 375).
These fast, high-impact hybrid journals offer accessible submission with optional post-acceptance APCs (median US$4,480). They are highly recommended for Under-Resourced researchers or for breakthrough studies requiring rapid dissemination. Their quick peer-review process and strong editorial standards ensure high visibility and impact. Even under paywalled access, publishing in these journals helps establish research priority and accommodates future open access conversion if funding becomes available.
9.4.4 Quadrant 4 (Q4): Slowest & Moderate Impactful
This group of 57 journals (median MNJ: 0.5850) is mostly hybrid (94.7%), with one Diamond (Financial Innovation) and two Gold OA titles. Top performers include Applied Mathematical Modelling, Journal of Transport Geography, Land Use Policy, and Technology in Society.
These journals have slower processing times (median NDP: 295 days) and moderate impact, making them suitable for non-urgent submissions like reviews or methodological studies. With a lower median APC (US$3,890), and flexible hybrid models, they offer accessible options for researchers focusing on specialized or emerging fields without strict time constraints.
Figure 13.
The 29 Most Notable Journals (Fastest & High Impactful).
9.4.5 Quadrant 5 (Q5): Moderate Speed & Moderate Impactful
This third-largest group features journals like Journal of Petroleum Science & Engineering (now Geoenergy Science and Engineering), Aquaculture, and International Journal of Impact Engineering. These 55 journals show moderate impact (median MNJ: 0.8155), average publication speed (median NDP: 157 days), and affordable median APCs (US$3,810).
With 92.7% hybrid coverage, they offer accessible, mid-range venues ideal for researchers seeking a balance between speed, cost, and visibility to build a steady publication record.
9.4.6 Quadrant 6 (Q6): Fastest & Moderate Impactful
This second-fastest group (24 journals) includes Food Research International, Forest Ecology and Management, Journal of Catalysis, Energy Storage Materials, and International Journal of Engineering Science, all combining rapid publication (median NDP: 91.5 days) with moderate impact (MNJ ≈ 0.89).
With a uniform speed index (1.00) and strong hybrid presence (91.7%), plus two Diamond titles, these journals suit time-sensitive research. Despite a higher median APC (US$4,145), Under-Resourced researchers can publish without APCs, making this category ideal for fast-tracked, applied, or emerging-topic publications.
9.4.7 Quadrant 7 (Q7): Slowest & Least Impactful
This largest quadrant (59 journals) includes Eure, Science and Public Policy, and Investigações em Ensino de Ciências, characterized by the lowest median MNJ (0.4823) and longest publication times (median NDP: 300 days).
Despite slower processing and modest impact (Speed Index: 0.20–0.40; Impact Index: 0.36–0.55), this group offers the highest proportion of free publishing options: 17% Diamond, 10% Gold OA, and 72.9% hybrid journals. Many titles are newer or in reformulation, often adopting Diamond models to attract submissions.
This quadrant seems to be ideal for early-career or resource-limited researchers seeking A1 publications without APCs. Priority should go to Diamond and Gold OA outlets, with hybrid journals used where no-fee traditional routes exist. Preprints and institutional repositories can help mitigate visibility delays.
9.4.8 Quadrant 8 (Q8): Moderate Speed & Least Impactful
With a median MNJ of 0.6599 and NDP of 150 days, this group offers consistent, mid-speed publication schedules with moderate impact. Representative journals include International Journal of Refrigeration, Experimental Thermal and Fluid Science, and Materials Research Bulletin.
Comprising 54 journals (47 hybrid, 4 Gold OA, 3 Diamond), this quadrant balances affordability (median APC: $3,585) with publication speed. It is best suited for Under-Resourced researchers seeking timely dissemination in niche fields without high APC burdens. Hybrid and OA options provide flexibility, making it a practical choice for maintaining a steady publication record between higher-impact projects.
9.4.9 Quadrant 9 (Q9): Fastest & Least Impactful
This group of 24 journals offers the third-fastest publication speed (median NDP: 93.5 days) with solid performance (median MNJ: 0.8218). It includes 19 hybrid journals (79.2%), 2 Diamond (e.g., International Journal of Industrial Engineering Computations, Express Polymer Letters), and 3 Gold OA journals. Journals like Chemical Engineering Science and Energy for Sustainable Development combine rapid processing with flexible access models. The median APC ($3,590) applies only if authors opt for open access after acceptance.
Ideal for time-sensitive research, preliminary results, or early-career publications. Free submission is possible through hybrid and Diamond models, enabling authors to build publication records and establish priority while managing budget constraints.
Step 10) Organize, Release, and Share an Interactive HTML Tool for Journal Selection.
Between June 1–13, 2025, Julius AI, the dataset (Appendix L), and two logos were used to test prompts, resulting in the final prompt, Python script, and HTML file (Appendices N–P). This process produced an interactive HTML tool (Figure 14; Appendix Q) to help researchers explore 400 Diamond, Hybrid, and Gold OA journals with notable scores.
Figure 14.
The main section of the HTML file designed to assist researchers.
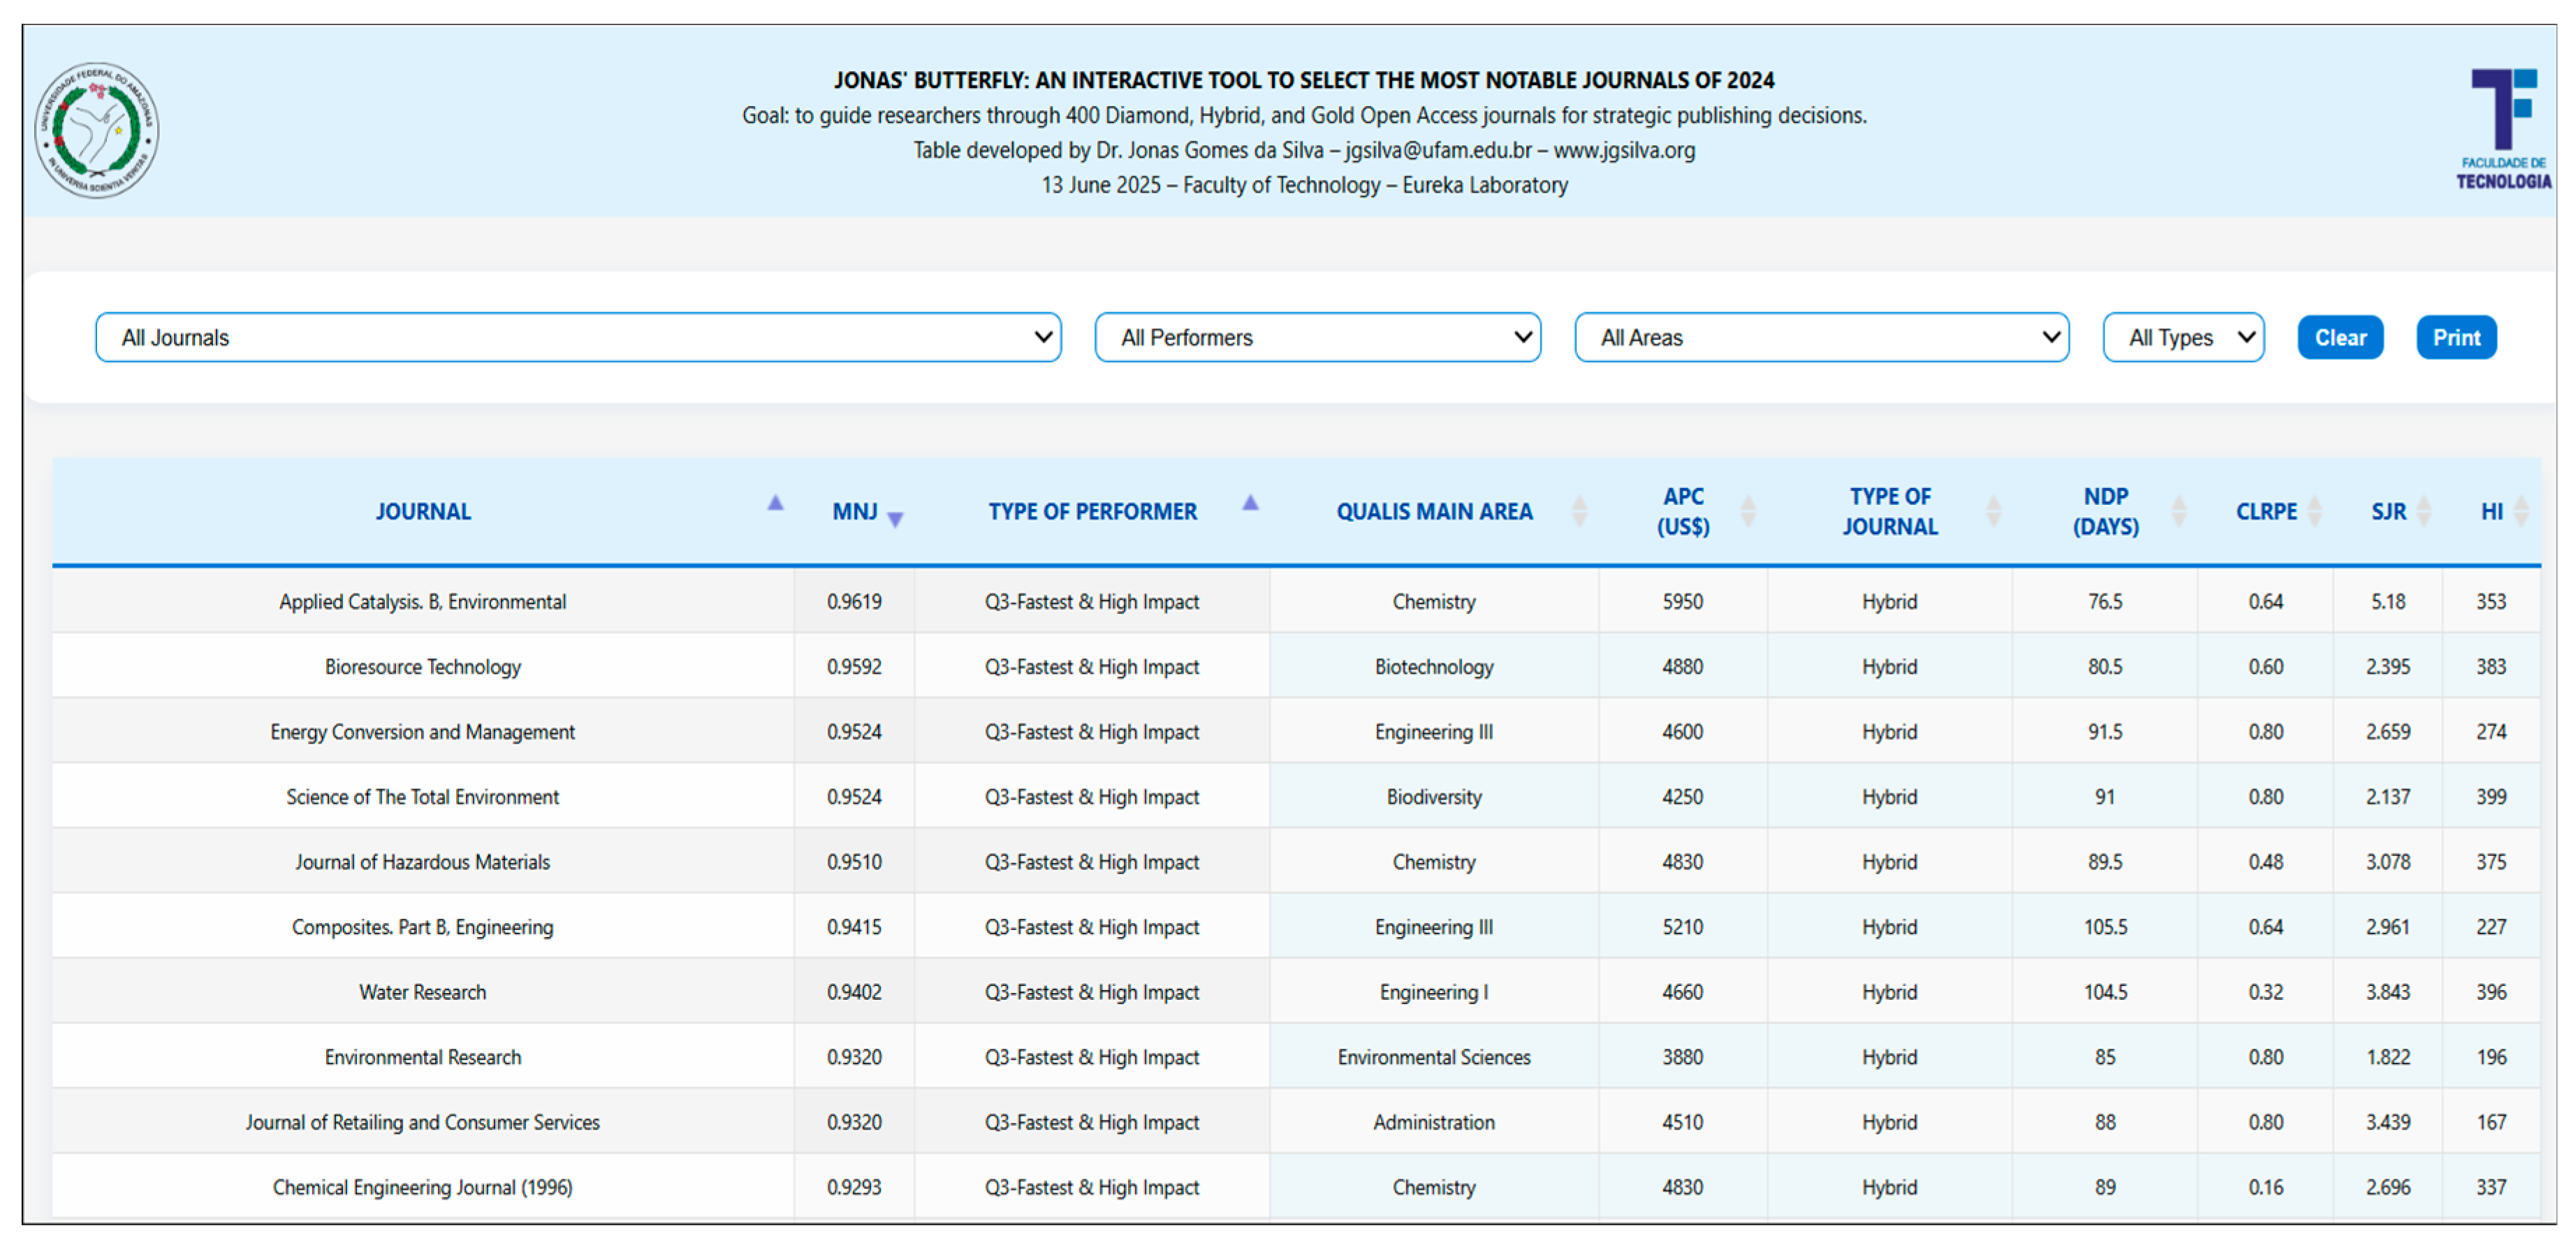
The next step was creating a public GitHub repository, “400mostnotablejournals2024,” using the author’s account and the HTML file (Appendix Q). A shareable link (https://tinyurl.com/35uhcuaf) was added to the author’s website (https://www.jgsilva.org/, ‘Pub’ section) via Wix Studio, ensuring free access for academics and the public. This use of GitHub promotes transparency, reproducibility, and collaboration through open sharing, version control, and detailed documentation (Chen et al., 2025; Ram, 2013).
This is an interactive HTML tool that provides researchers with services to enhance their academic publishing decisions. It enables rapid exploration and comparison of over 400 notable journals by offering four intuitive filters for journal name, type of performer, main research area, and journal type, as well as two buttons to clean or to print pdf report.
The responsive table allows easy sorting and pagination, while the integrated PDF export function lets users generate customized reports of filtered results, complete with institutional branding for printing.
Additionally, all appendices, figures, files, and datasets were deposited in the author’s Harvard Dataverse account (Gomes da Silva, 2025b). Harvard Dataverse is a widely recognized multidisciplinary repository that adheres to the FAIR principles and is commonly used by journals and researchers to ensure robust data management, long-term preservation, and proper citation (Wilkinson et al., 2016; Boyd, 2021).
3. Conclusions
Brazilian under-resourced researchers face major barriers when targeting top-tier journals, mainly due to fragmented data and the lack of user-friendly decision tools. This study tackled these barriers with scientometric methods and data-driven model that answers four core questions:
Q1: the Jonas Butterfly Model proposes a clear “flight path” by integrating national and international databases, bibliometric reviews, and open science principles, to generate a nine-quadrant matrix that maps 400 Most Notable Journals across transparency, speed, and impact dimensions. Researchers can now identify optimal publication venues based on their specific priorities: those seeking rapid dissemination with high impact should target Quadrant 3 journals (median 91 days, MNJ score 0.9116), while those prioritizing prestige over speed can select from Quadrant 1 options (median 281 days, MNJ score 0.6544). The model reveals that 90.2% of top journals operate hybrid models, allowing free submission with optional APCs upon acceptance, while 21 (5.2%) journals offer completely fee-free diamond access, providing clear affordability pathways for unfunded authors.
Q2: By using computational methods, including AI tools (Julius AI) for automated data collection, extraction, cleaning, and integration; normalization and statistical scaling; and algorithmic ranking based on three original formulas (Research Area Score [RAS], Cross-Level Relationship with Production Engineering [CLRPE], and Most Notable Journal [MNJ] Score), the model effectively synthesizes dispersed bibliometric metrics into a unified, reproducible ranking system.
Although not without limitations, the normalization process accounts for field-specific publication patterns while incorporating transparency indicators and bibliometric performance metrics (SJR, h-index), resulting in a comprehensive evaluation framework that directly supports CAPES’ shift toward article-level assessment.
Q3: the study explored open-source platforms with other digital tools, that transform bibliometric data into an intuitive interface. Researchers can dynamically filter journals by publication speed, impact metrics, open access models, and APC requirements, instantly generating personalized journal shortlists. The HTML dashboard’s accessibility ensures that even researchers with limited technical expertise can navigate the publishing landscape strategically, reducing selection time and improving decision quality.
Brazilian researchers, including students and professors across 1,163 postgraduate courses in four key areas related to Production Engineering (Appendix E), now have access to a data-driven model and an interactive HTML platform designed to support strategic, evidence-based journal targeting and submission planning. Furthermore, researchers from other fields can utilize the provided datasets and, with appropriate adaptations, apply the methodological steps outlined in this study to identify the Most Notable Journals within their core research areas.
Q4: among 400 MNJ, the ten Most Notable Journals are: the Applied Catalysis B: Environmental, Bioresource Technology, Energy Conversion and Management, Science of The Total Environment, Journal of Hazardous Materials, Composites. Part B, Engineering, Water Research, Journal of Retailing and Consumer Services, Environmental Research, and Chemical Engineering Journal. They are all hybrid models with MNJ, SJR, HI values > 0.9293, 1.822, and 167, respectively.
For authors with fewer funds, 21 diamond journals emerged as viable alternatives, with the best including the International Journal of Industrial Engineering Computations (90 days, SJR: 0.450), Biofuel Research Journal (109 days, SJR: 2.251), and International Journal of Mining Science and Technology (158.5 days, SJR: 3.137), proving that fee-free publishing need not compromise visibility or prestige.
In sum, by merging scientometrics, open science principles, digital tools, and intuitive visualization, the proposed Model offers authors, policymakers, and editors a clear flight path toward more equitable, faster, and higher-impact scientific dissemination, helping to strengthen Brazil’s global research visibility.
4. Implications
For researchers, it demystifies journal selection by combining speed, impact, openness, and relevance into a single metric-driven platform, enabling smarter and faster publication decisions.
For university managers and graduate or post-graduate programs, it offers a replicable, data-grounded methodology to guide publication strategies, foster higher evaluation scores under the CAPES framework, and align research outputs with funding agency priorities.
For CAPES, funding agencies, and policymakers, the model provides an empirical diagnostic of Brazil’s publishing bottlenecks, offering evidence to inform the design of incentive programs, capacity-building actions, or negotiations for transformative publishing agreements.
For journal editors: the 3×3 matrix serves as a benchmarking dashboard, enabling editorial teams to compare their journals against peer clusters, identify performance gaps (e.g., speed, transparency), and prioritize operational improvements.
For a long-term perspective, the widespread adoption and further development of this model could catalyze a cultural shift towards more transparent, efficient, and inclusive scholarly publishing, reinforcing Brazil’s capacity to compete globally and fostering a more equitable research ecosystem for under-resourced communities
5. Limitations and Further Recommendations
First) while the model successfully classified journals by speed and impact, it did not examine the editorial, structural, and operational factors that contributed to differences in publication speed among journals within the fields of Engineering, Administration, Environmental Sciences, and Interdisciplinary Studies.
Variables such as the publisher, size of editorial boards, number of reviewers per manuscript, number of issues per year, average article length (in pages), number of authors per paper, journal acceptance rates, submission volume, and degree of editorial process digitalization were not analyzed, leaving an important knowledge gap regarding what drives faster (Q3, Q6, Q9 journals) or slower (Q1, Q4 and Q7 journals) editorial timelines across these disciplines.
Future research should investigate key factors influencing publication speed across areas, especially journals from Quadrant 3, using correlational analysis, regression models, or editorial case studies. Comparative studies among quadrants could explore how editorial team size, article length, and review rounds affect processing times. Data from journal websites, editorial systems, and editor surveys can clarify speed patterns across Engineering, Administration, Environment, and Interdisciplinary fields.
Second) the study used as the core area the PE, future studies should prioritize replicating and validating the Model across other knowledge domains, such as Health Sciences, Social Sciences, and Humanities, to assess its flexibility and generalizability.
Third) The study’s exclusive focus on the Brazilian academic context may limit the generalizability of the Jonas Butterfly Model to countries with different funding structures, publication practices, and evaluation frameworks.
Future research should test the model’s adaptability in other national settings by integrating local research policies, postgraduate databases, and journal classification systems with global datasets like Scopus, SCImago, and DOAJ.
Fourth) there is absence of real-time, automated, and user-personalized functionalities in the current version of the Jonas Butterfly Model and its associated HTML tool, which was developed using 2024 data and entirely self-funded by the author without external financial support. Given these resource constraints, the tool was designed as a static, proof-of-concept platform.
To enhance its accuracy, usability, and alignment with evolving CAPES policies, future developments should include AI-based journal recommendation engines, real-time or at least annual data updates, and user satisfaction surveys involving Brazilian postgraduate researchers. Moreover, integrating multilingual support, dynamic APC monitoring, and AI-driven manuscript-to-journal matching would significantly improve the tool’s accessibility for non-English speakers and early-career researchers, further strengthening its capacity to democratize journal selection for Under-Resourced academic communities.
Fifth) For Brazilian policymakers, especially within MEC and CAPES, a key recommendation is to embed editorial speed and transparency metrics into the new article-level evaluation framework. CAPES could establish field-normalized benchmarks for publication timelines, acknowledging disciplinary differences.
MEC and CAPES should incentivize Brazilian journals to adopt open peer-review, disclose processing times, and reduce publication delays. Targeted funding could support workflow improvements in existing Diamond OA journals and foster the creation of new, fast-track Diamond outlets in priority research areas. These measures would reduce barriers for Under-Resourced researchers and advance Brazil’s alignment with global open science and research equity standards.
Acknowledgments
The author thanks the editors and reviewers for their thoughtful comments and assistance.
Declaration of generative AI and AI-assisted technologies in the writing process
As noted in this study, the author used JULIUS AI, aligned with FAIR Guiding Principles for scientific data (Wilkinson et al., 2016), to extract, clean, analyze, and integrate data; prepare presentations; and make text more legible. The author reviewed and edited all AI-generated output versions and is fully responsible for the final product.
Appendices
As noted, all appendices are archived in Harvard Dataverse (Gomes da Silva, 2025b):
Appendix A – Database containing the number of postgraduate courses in Brazil per areas
Appendix B – Data treatment of Journal Title Names
Appendix C – Dataset containing all Journals in Brazilian Qualis System - 2017 to 2020 period
Appendix D – Datasets containing all Top A1 journals list in Portuguese, English, as well as number of titles per area
Appendix E – Dataset showing the Research Area Score (RAS) calculation
Appendix F – Dataset showing LRPE (Level of Relation with Production Engineering) calculation to find the population of top-tier and unique A1 Journals
Appendix G – Dataset showing CLRPE calculation to find the Sample
Appendix H1 – Explanation of Most Notable Components
Appendix H2 – Dataset presenting the calculation of the Most Notable Journal (MNJ) Score, used to identify and stratify the sample based on MNJ Score.
Appendix I – Dataset presenting only data of the 400 Most Notable Journals
Appendix J – Dataset presenting statistics of the MNJ groups per Qualis Main Areas
Appendix L – Dataset with all 400 most notable journals classified in nine quadrants (TYPE OF PERFORMER)
Appendix M – Dataset with statistics related to each quadrant
Appendix N – Prompt used to generate the HTML files
Appendix O – Code to generate the Html
Appendix P – Python Script used to generate the Html
Appendix Q – Html file
Appendix R – SCImago Country Rankings for Publications (1996–2024)
Appendix S – Number of Production Engineering Journals on the Scimago Platform
Appendix T – Figure 6: Areas and subareas of Production Engineering in Brazil
References
- ABEPRO, 2024. A Profissão da Engenharia de Produção [WWW Document]. Abepro.org.br. 2024. Available online: https://portal.abepro.org.br/abepro2024/profissao/ (accessed on 13 April 2025).
- Abrão, C. Abrão, C., 2025. Entidades cobram governo Lula sobre cortes que “ameaçam universidades” [WWW Document]. Gazetadopovo.com.br. 2025. Available online: https://www.gazetadopovo.com.br/vida-e-cidadania/entidades-cientificas-cobram-governo-lula-sobre-cortes-no-orcamento-universidades/ (accessed on 25 May 2025).
- Alencar, B.N. , Barbosa, M.C., 2021. Open Access Publications with Article Processing Charge (APC) Payment: a Brazilian Scenario Analysis. Anais da Academia Brasileira de Ciências 93.
- Ball State University, n.d. Evaluating Journals for Quality and Legitimacy: Journal Quality - Traditional Metrics [WWW Document]. Libguides.com. Available online: https://bsu.libguides.com/c.php?g=1174044&p=8577665.
- Berger, B. , Waterman, M.S., Yu, Y.W. Levenshtein Distance, Sequence Comparison and Biological Database Search. IEEE Trans. Inf. Theory 2021, 67, 3287–3294. [Google Scholar] [PubMed]
- Berk, R.A. Importance of Expert Judgment in Content-Related Validity Evidence. West. J. Nurs. Res. 1990, 12, 659–671. [Google Scholar] [PubMed]
- Bornmann, L. , Williams, R. An evaluation of percentile measures of citation impact, and a proposal for making them better. Scientometrics 2020, 124, 1457–1478. [Google Scholar]
- Boyd, C. Use of Optional Data Curation Features by Users of Harvard Dataverse Repository. J. Escience Librariansh. 2021, 10. [Google Scholar]
- Brooks, H. The relationship between science and technology. Res. Policy 1994, 23, 477–486. [Google Scholar]
- Cafardo, R., 2022. Governo atual é o que mais cortou em recursos de Educação e Ciência [WWW Document]. Estadão de SP. 2022. Available online: https://www.estadao.com.br/educacao/governo-atual-e-o-que-mais-cortou-em-recursos-de-educacao-e-ciencia/?srsltid=AfmBOor6kwrO3WZKkZcTDVcJ4GrTX6cCgSVO-Gui7dlogEma-YYiiejE (accessed on 14 May 2025).
- CAPES, 2025. DIRETRIZES COMUNS DA AVALIAÇÃO DE PERMANÊNCIA DOS PROGRAMAS DE PÓS-GRADUAÇÃO STRICTO SENSU [WWW Document]. Available online: https://uploads.capes.gov.br/files/2025-05-02_DocumentoReferencial_FICHA.pdf (accessed on 17 May 2025).
- Carneiro, J. 2017. Cortes na ciência geram êxodo de cérebros, congelam pesquisas e vão punir Brasil por décadas, diz presidente da academia - BBC News Brasil [WWW Document]. BBC News Brasil. Available online: https://www.bbc.com/portuguese/brasil-40504128 (accessed on 14 April 2025).
- Chan, E. , Bourgeois-Doyle, D., Donaldson, M., Haine-Bennett, E., 2020. Toward a UNESCO Recommendation on Open Science: Canadian Perspectives Prepared for the Canadian Commission for UNESCO, https://en.ccunesco.ca/. Canadian Commission for UNESCO, Canada.
- Chen, K.Y. , Toro-Moreno, M., Subramaniam, A.R. GitHub enables collaborative and reproducible laboratory research. PLOS Biol. 2025, 23, e3003029. [Google Scholar]
- Chivers, M. , Howie, J., Apiata, A., McCallum, F., Smith, G., Apete, K., Cassin, M., Chen, Y., 2023. Exploring researchers’ views on Metrics and research impact: Internal report., sfdora.org. University of Waikato, New Zealand.
- Chorus, C. , Waltman, L. A Large-Scale Analysis of Impact Factor Biased Journal Self-Citations. PLOS ONE 2016, 11, e0161021. [Google Scholar]
- Cohen, W.M. , Nelson, R.R., Walsh, J.P. Links and Impacts: The Influence of Public Research on Industrial R&D. Manag. Sci. 2002, 48, 1–23. [Google Scholar]
- Confies, 2017. Burocracia consome mais de 30% do tempo dos cientistas, constata pesquisa – CONFIES [WWW Document]. Confies.org.br. Available online: https://confies.org.br/institucional/burocracia-consome-mais-de-30-do-tempo-dos-cientistas-constata-pesquisa/ (accessed on 14 May 2025).
- Creswell, J.W. , Plano Clark, V.L., 2017. Designing and conducting mixed methods research, 3rd ed. Sage, Los Angeles.
- De Jesus, D.S.V. & Kamlot, D., 2023. The Broken Helix: innovation and the political-economic crisis in Brazil. In: M.F. Interdisciplinarity (Ed.), Methodology Focused on the Area of Interdisciplinarity, vol. 1. Seven Publicações, pp. 188–193.
- De Negri, F. , 2021. New Pathways for Innovation in Brazil, https://repositorio.ipea.gov.br/. IPEA, Rio de Janeiro: IPEA : Washington D.C: Willson Center.
- De Rezende, L.R. , Castelo Branco, V.T.F., Savasini, K.V., Da Luz, M.P., Casagrande, M.D.T., Thives, L.P., Lucena, L.C.F.L., Bernucci, L.L.B., 2025. Criteria for Research Productivity Grants in Brazil Applied to Civil Engineering: Reflections on Gender Differences and the Current Context. Anais da Academia Brasileira de Ciências 97.
- Donato, H. Traditional and alternative metrics: The full story of impact. Pulmonology 2014, 20, 1–2. [Google Scholar]
- Donthu, N. , Kumar, S., Mukherjee, D., Pandey, N., Lim, W.M. How to conduct a bibliometric analysis: An overview and guidelines. J. Bus. Res. 2021, 133, 285–296. [Google Scholar]
- Fernandes, A.C. , Mesquita, F. Regional inequalities, dependency, and knowledge base. Rev. Bras. De Inovação 2024, 23, 1–37. [Google Scholar]
- Ferraz, C. , Finan, F., Moreira, D.B. Corrupting learning: Evidence from missing federal education funds in Brazil. J. Public Econ. 2012, 96, 712–726. [Google Scholar]
- Giusti, J. 2024. Crise na pós-graduação: evasão de pesquisadores prejudica ciência nacional [WWW Document]. Trabalho & Formação. Available online: https://www.correiobraziliense.com.br/euestudante/trabalho-e-formacao/2024/04/6836129-crise-na-pos-graduacao-evasao-de-pesquisadores-prejudica-ciencia-nacional.html (accessed on 14 March 2025).
- Gomes da Silva, J. 2024. O Brasil afunda no ranking de competitividade mundial - Jornal do Commercio [WWW Document]. Jornal do Commercio do Amazonas. Available online: https://jcam.com.br/artigos/o-brasil-afunda-no-ranking-de-competitividade-mundial/ (accessed on 24 March 2025).
- Gomes da Silva, J. , 2025a. Bibliometric report on Journal Metrics, The Lens. The Lens.
- Gomes da Silva, J. , 2025b. Dataset of Jonas Butterfly’s Model for Under-Resourced Brazilian Authors to Discover the Most Notable Journals. [WWW Document]. Available online: https://dataverse.harvard.edu/dataset.xhtml?persistentId=10.7910/DVN/JMSZCB. [CrossRef]
- González-Pereira, B. , Guerrero-Bote, V.P., Moya-Anegón, F. A new approach to the metric of journals’ scientific prestige: The SJR indicator. J. Informetr. 2010, 4, 379–391. [Google Scholar]
- Hirsch, J.E. An index to quantify an individual’s scientific research output. Proc. Natl. Acad. Sci. 2005, 102, 16569–16572. [Google Scholar] [PubMed]
- Hosseini, M. , Serge, Holmes, K., Ross-Hellauer, T. Open Science at the Generative AI Turn: An Exploratory Analysis of Challenges and Opportunities. Quant. Sci. Stud. 2024, 6, 22–45. [Google Scholar]
- IQC, 2022. Há 9 anos sem reajuste, bolsas de pós refletem desvalorização da pesquisa no Brasil [WWW Document]. Iqc.org.br. Available online: https://iqc.org.br/observatorio/artigos/ciencia/ha-9-anos-sem-reajuste-bolsas-de-pos-refletem-desvalorizacao-da-pesquisa-no-brasil/.
- James, C. , Colledge, L., Meester, W., Azoulay, N., Plume, A. CiteScore metrics: Creating journal metrics from the Scopus citation index. Learn. Publ. 2019, 32, 367–374. [Google Scholar]
- Kim, S. , Chung, E., Lee, J.Y. Latest trends in innovative global scholarly journal publication and distribution platforms. Sci. Ed. 2018, 5, 100–112. [Google Scholar]
- 2023. Research Impact and Author Profiles: Journal Impact [WWW Document]. Kumc.edu. Available online: https://guides.library.kumc.edu/c.php?g=451739&p=3084595 (accessed on 15 June 2025).
- Masic, I. , Begic, E. Scientometric Dilemma: Is H-index Adequate for Scientific Validity of Academic’s Work? Acta Inform. Medica 2016, 24, 228. [Google Scholar]
- May, R.M. The Scientific Wealth of Nations. Science 1997, 275, 793–796. [Google Scholar]
- Mayo-Wilson, E. , Grant, S., Supplee, L., Kianersi, S., Amin, A., DeHaven, A., Mellor, D. Evaluating implementation of the Transparency and Openness Promotion (TOP) guidelines: the TRUST process for rating journal policies, procedures, and practices. Res. Integr. Peer Rev. 2021, 6, 1–11. [Google Scholar]
- Mcmanus, C. , Neves, A. a. B., Diniz Filho, J.A., Maranhão, A.Q., Souza Filho, A.G. Profiles not metrics: the case of Brazilian universities. An. Da Acad. Bras. De Ciências 2021, 93, e29290261. [Google Scholar]
- Mech, E. , Ahmed, M.M., Tamale, E., Holek, M., Li, G., Thabane, L. Evaluating Journal Impact Factor: a systematic survey of the pros and cons, and overview of alternative measures. J. Venom. Anim. Toxins Incl. Trop. Dis. 2020, 26. [Google Scholar]
- Ram, K. Git can facilitate greater reproducibility and increased transparency in science. Source Code Biol. Med. 2013, 8. [Google Scholar]
- Ramkumar, B. , Harish, V., Renuka, S.D., Srinivasaiah, R. Lean Manufacturing: A Bibliometric Analysis, 1970- 2020. J. Scientometr. Res. 2021, 10, 63–73. [Google Scholar]
- Resnik, D.B. , Hosseini, M. The ethics of using artificial intelligence in scientific research: new guidance needed for a new tool. AI Ethics 2024, 5, 1499–1521. [Google Scholar]
- Rodríguez Mega, E. Funding crisis at Brazilian science agency could leave 80,000 researchers and students without pay. Science 2019.
- Scimago Lab, 2025. Scimago Country Rankings [WWW Document]. Scimagojr.com. Available online: https://www.scimagojr.com/countryrank.php (accessed on 1 May 2025).
- Simões, J. 2011. Governo corta R$ 1,7 bilhão do orçamento de ciência e tecnologia [WWW Document]. Site Inovação Tecnológica. Available online: https://www.inovacaotecnologica.com.br/noticias/noticia.php?artigo=corte-orcamento-ciencia-tecnologia&id=020175110322.
- Sinsomboonthong, S. Performance Comparison of New Adjusted Min-Max with Decimal Scaling and Statistical Column Normalization Methods for Artificial Neural Network Classification. Int. J. Math. Math. Sci. 2022, 2022, 1–9. [Google Scholar]
- Solatorio, A. , Dupriez, O., 2024. Efficient metadata enhancement with AI for better data discoverability [WWW Document]. World Bank Blogs. URL https://blogs.worldbank.org/en/opendata/efficient-metadata-enhancement-with-ai-for-better-data-discovera. (accessed on 3 June 2025).
- Souza, D.L. de, Zambalde, A.L., Mesquita, D.L., Souza, T.A. de, Silva, N.L.C.d. A perspectiva dos pesquisadores sobre os desafios da pesquisa no Brasil. Educ. E Pesqui. 2020, 46, 1–21. [Google Scholar]
- Souza, R.G. de, Quelhas, O.L.G. Model Proposal for Diagnosis and Integration of Industry 4.0 Concepts in Production Engineering Courses. Sustainability 2020, 12, 3471. [Google Scholar]
- Spitschan, M. , Schmidt, M.H., Blume, C. Principles of open, transparent and reproducible science in author guidelines of sleep research and chronobiology journals. Wellcome Open Res. 2021, 5, 172. [Google Scholar]
- SurveyMonkey, 2025. Sample Size Calculator: Understanding Sample Sizes | SurveyMonkey [WWW Document]. SurveyMonkey. Available online: https://www.surveymonkey.com/mp/sample-size-calculator/.
- Susan, S. , Lake, L., Tiffany, S., 2021. Unesco Science Report: the race against time for smarter development, Unesco.org. UNESCO.
- TCU, 2025. Lei do Bem: TCU identifica problemas na prestação de contas das empresas beneficiadas – Notícias | Portal TCU [WWW Document]. Portal TCU. Available online: https://portal.tcu.gov.br/imprensa/noticias/lei-do-bem-tcu-identifica-problemas-na-prestacao-de-contas-das-empresas-beneficiadas.
- The Economist, 2021. Brazil’s brain drain is getting worse [WWW Document]. The Economist. Available online: https://www.economist.com/the-americas/2021/07/24/brazils-brain-drain-is-getting-worse.
- Vicente-Saez, R. , Martinez-Fuentes, C. Open Science now: A systematic literature review for an integrated definition. J. Bus. Res. 2018, 88, 428–436. [Google Scholar]
- Wilkinson, M.D. , Dumontier, M., Aalbersberg, Ij.J., Appleton, G., Axton, M., Baak, A., Blomberg, N., Boiten, J.-W., da Silva Santos, L.B., Bourne, P.E., Bouwman, J., Brookes, A.J., Clark, T., Crosas, M., Dillo, I., Dumon, O., Edmunds, S., Evelo, C.T., Finkers, R., Gonzalez-Beltran, A. The FAIR Guiding Principles for Scientific Data Management and Stewardship. Sci. Data 2016, 3. [Google Scholar]
- WIPO, 2024. Which are the Most Innovative Economies in 2024? [WWW Document]. global-innovation-index. Available online: https://www.wipo.int/en/web/global-innovation-index/2024/index (accessed on 15 April 2025).
Disclaimer/Publisher’s Note: The statements, opinions and data contained in all publications are solely those of the individual author(s) and contributor(s) and not of MDPI and/or the editor(s). MDPI and/or the editor(s) disclaim responsibility for any injury to people or property resulting from any ideas, methods, instructions or products referred to in the content. |
© 2025 by the author. Licensee MDPI, Basel, Switzerland. This article is an open access article distributed under the terms and conditions of the Creative Commons Attribution (CC BY) license (https://creativecommons.org/licenses/by/4.0/).
Copyright: This open access article is published under a Creative Commons CC BY 4.0 license, which permit the free download, distribution, and reuse, provided that the author and preprint are cited in any reuse.


