
Submitted:
07 July 2025
Posted:
08 July 2025
You are already at the latest version
Abstract
This study investigates pedestrian comfort in a dense urban environment by evaluating the Mean Velocity Ratio (MVR) and Overall Mean Velocity Ratio (OMVR) criteria. It examines how neighboring building heights and wind incidence angles affect pedestrian-level wind conditions within a nine-building arrangement. Using Computational Fluid Dynamics (CFD) with the Reynolds-Averaged Navier-Stokes (RANS) k-ε model, validated against experimental data, this study analyzes scenarios where surrounding building heights vary from 0L to 6L and wind angles from 0° to 45°. The results demonstrate that wind angles perpendicular to the urban canyons (0° case) induce strong channeling effects, leading to MVR peaks as high as 3.42 and creating hazardous conditions. Conversely, an oblique 45° wind angle promotes more uniform airflow, significantly improving comfort. Increasing the height of neighboring buildings generally elevates the mean MVR due to enhanced channeling. However, even an isolated building (0L case) can generate high localized velocities due to flow separation. The findings underscore that both building configuration and wind direction are critical factors, and CFD serves as an essential tool for urban planners to mitigate adverse wind conditions and ensure pedestrian comfort.
Keywords:
CFD
; RANS
; pedestrian comfort
; wind comfort
; building configuration
1. Introduction
Global population growth has introduced new challenges in urban planning. As highlighted during the SARS-CoV-2 pandemic, when various regions implemented restrictions on public spaces, the confinement period underscored the importance of these collective environments for maintaining mental health [1,2]. In addition to these social and psychological aspects, urban planning must also address critical environmental challenges. Among them, the exacerbation of thermal discomfort due to the formation of urban heat islands, a phenomenon resulting from the predominance of impermeable surfaces and reduced vegetation, leading to elevated temperatures in city centers. According to the Royal Meteorological Society [3], the urban heat island effect has greater impact on the central regions of densely built areas, as seen in Figure 1a. Furthermore, the dispersion of atmospheric pollutants is significantly affected by urban morphology; for instance, pollutant accumulation can occur in street canyons (narrow avenues bordered by tall buildings), intensifying exposure to vehicular emissions or industrial discharges. Lastly, acoustic pollution represents another important concern, with noise levels amplified in such areas, particularly along major traffic corridors or near industrial facilities, contributing to adverse health outcomes. Figure 1 illustrates these main urban conditions that may cause discomfort on the city’s inhabitants. Comfort urban spaces foster the exchange of ideas, the development of new scientific discoveries, and social interaction. Therefore, it is recommended that professionals in architecture, engineering and urban planning prioritize the incorporation and enhancements of public areas in building designs, neighboring units, and urban neighborhoods.
Among the various criteria relevant to the effectiveness of public spaces in urban environments, ensuring user comfort is particularly significant, especially concerning the impact of wind action on pedestrians. Recent studies have shown that excessive wind speeds in urban areas can lead to pedestrian hazard and compromise building facades: Liu et al. [4] simulate the impacts of large skyscrapers on pedestrian comfort and safety, highlighting increases in average wind speed and gusts, providing comprehension for urban guidelines for tall buildings; Hashemi et al. [5] assess wind comfort and safety at Auckland University of Technology using Computational Fluid Dynamics (CFD) and field surveys, revealing that street orientation and building proportions significantly influence wind speeds and finally Liu et al. [6] analyze wind comfort and safety on external platforms of mega-tall buildings using wind tunnels and CFD, noting that aerodynamically planned locations positively influence user comfort, while acknowledging the need for further refinement of their methodology.
Additionally, empirical evidence suggests that in locations exposed to strong winds, there is a noticeable decline in the frequency of visits to commercial establishments and public buildings, resulting not only in reduced urban functionality but also in negative socioeconomic impacts on local business. Shi et al. [7] addresses pedestrian comfort in commercial zones by emphasizing the importance of evaluating wind environment in urban spaces during the planning phases: thermal comfort and urban ventilation are not considered in most standards but contributes to the design of more comfortable and safer commercial spaces for pedestrians. Elevated buildings (lift-up designs) for commercial urban zones gained special attention recently: Chen and Mak [8] evaluate, through CFD simulations, the combined effects of building height and presence of upstream buildings on thermal and wind comfort around elevated buildings, showing that increasing building height or creating height differences between buildings enhances wind comfort; Du et al. [9] uses CFD to assess how lift-up building design influences pedestrian-level wind comfort across four building configurations under three wind directions, showing that it improves comfort in elevated and neighboring areas, particularly under oblique winds; and Nevers et al. [10] incorporates Forchheimer loss terms to balance computational cost and accuracy, making it suitable for neighborhood-scale simulations.
The assessment of thermal and wind comfort for pedestrians and building users requires the application of specific urban wind engineering methodologies. Three main approaches can be employed: (i) in situ measurements using devices for environmental sensing, anemometer for example, (ii) physical testing in reduced-scale wind tunnels, and (iii) numerical simulations through CFD. In situ measurements are characterized by high accuracy, as they directly capture real environment conditions, enabling continuous data acquisition over extended time periods; However, they include high operational costs, lengthy time requirements, limited spatial coverage, dependence on specific weather conditions, and the need for integration with geographic information systems [11,12]. Wind tunnel testing enables the simulation of complex aerodynamic effects under controlled conditions but is hindered by high costs associated with constructing scaled models and accurately replicating flow conditions, as well as the considerable time required for experimental setup [13].
CFD simulations offer high operational flexibility, allowing for comprehensive analysis of multiple fluid dynamic parameters, such as mean velocity and pressure fields, Turbulent Kinetic Energy (TKE), and vorticity. They also provide comparative economic advantages over the other methods. However, their accuracy depends on the appropriate selection of turbulence models, correct definition of boundary conditions and computational domain inputs, and the need for experimental validations of results. High-fidelity simulations also demand substantial computational resources [14].
Although thermal comfort is a relevant metric for evaluating urban spaces, its primary application focuses on the analysis of indoor environments, including multifamily housing units [15], compartments within vertical buildings (residential and commercial) [16], and industrial complexes [17]. For assessing pedestrian safety under critical conditions, particularly concerning potentially hazardous flow regimes, analyses focus on identifying vortices, oscillatory aerodynamic loads, and kinematic flow parameters [18].
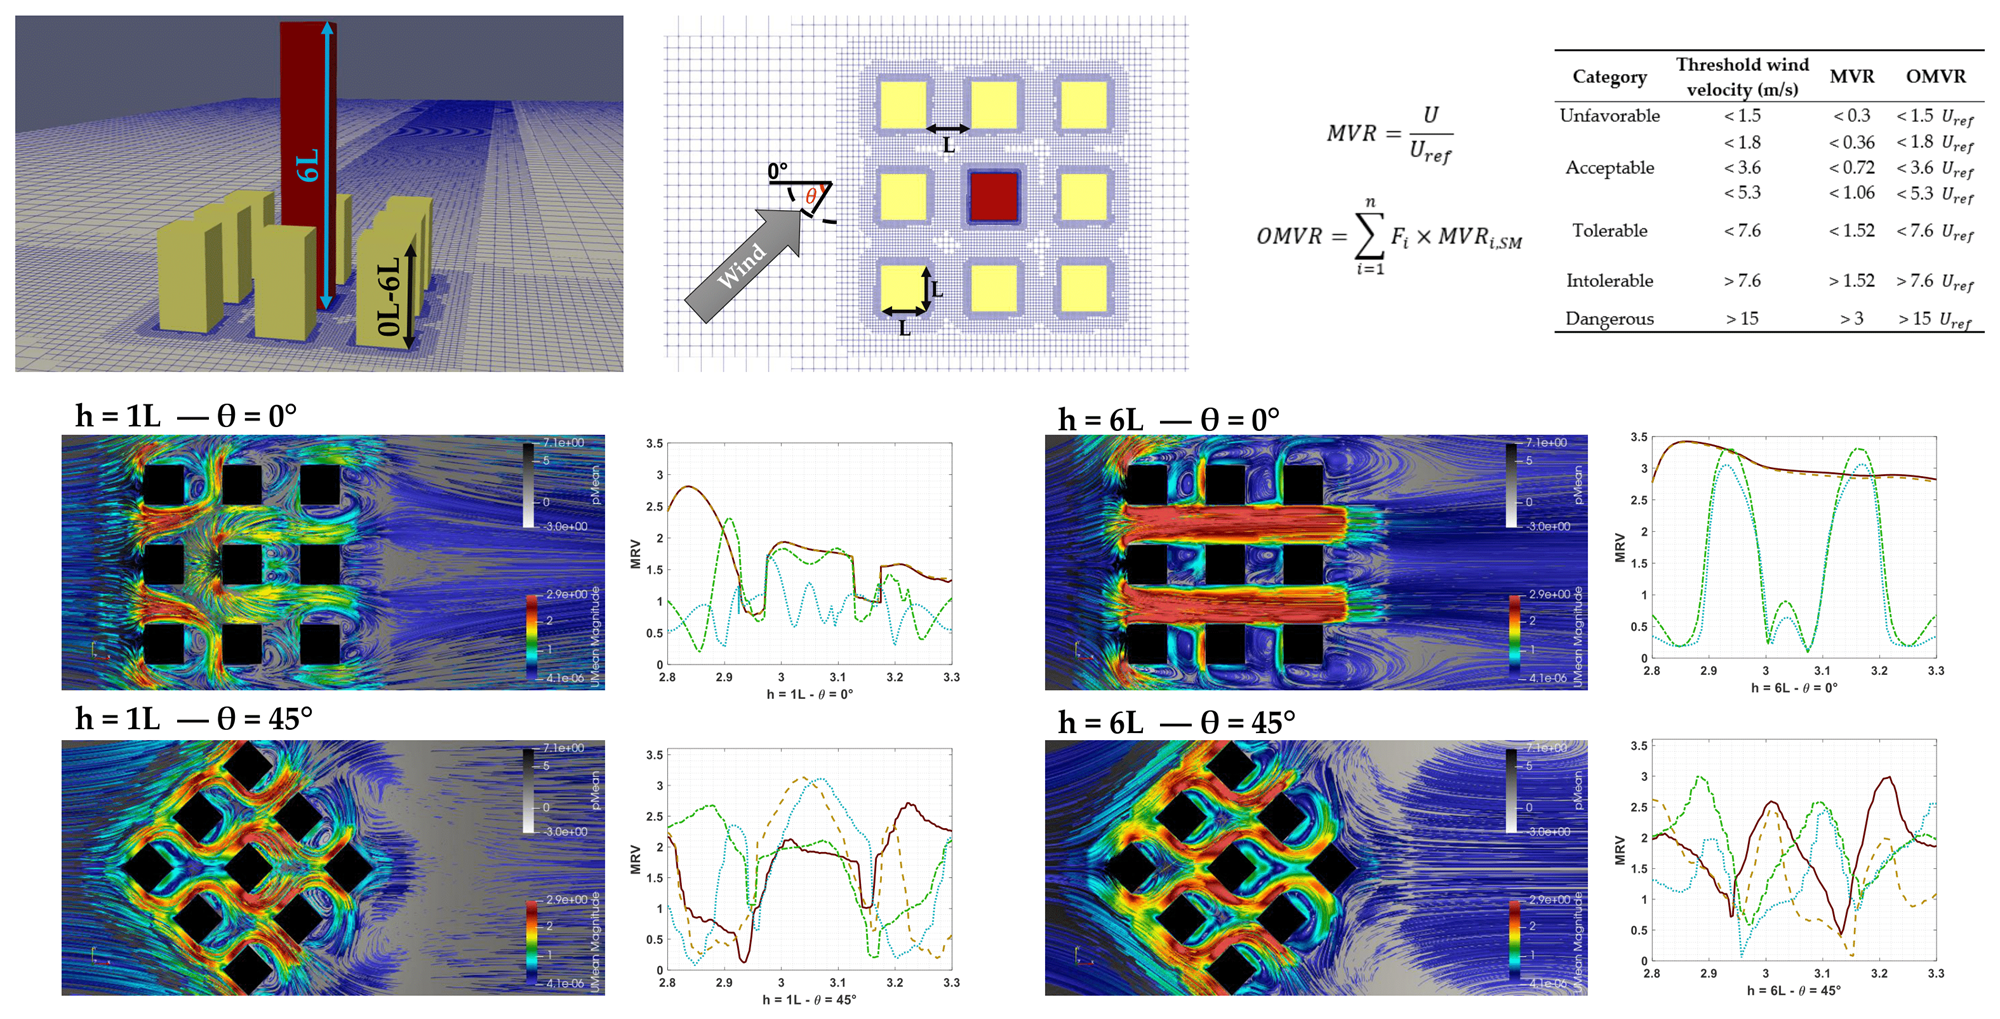
In this study, the Mean Velocity Ratio (MVR) and Overall Mean Velocity Ratio (OMVR) are adopted as evaluation metrics to quantify pedestrian-scale comfort in an urban arrangement consisting of nine square-plan buildings with characteristic dimension L. The experimental setup considers a fixed configuration with a main building of height 6L, surrounded by eight adjacent buildings whose heights progressively vary from 0L (isolated building configuration) to 6L (uniform urban canyon configuration). Additionally, the influence of wind incidence angle is investigated, with variations of 15° within the range from 0° to 45°. CFD simulations using OpenFOAM are employed to investigate the effects of building height and wind incidence angle on pedestrian-level wind comfort. The structure of the work is organized as follows: Section 2 presents a literature review covering the fundamentals of urban wind engineering and established metrics for assessing pedestrian comfort; methodology is presented in Section 3, including mathematical formulations and numerical schemes; in Section 4, a numerical validation is processed through comparison with experimental data; finally, Section 5 and 6 present, respectively, discussion of the obtained results and conclusions.
2. Literature Review
Computational Fluid Dynamics (CFD) is a numerical approach for simulating fluid flows, heat transfer processes, and related physical phenomena by solving the governing equations of fluid motion. Its application in urban contexts has led to significant advances in understanding flow patterns within complex urban environments, where experimental methodologies present intrinsic limitations [19]. This technique offers several advantages, including:
- Relatively low cost compared to experimental approaches.
- Scalability for different urban configurations.
- High spatial and temporal resolution in simulated flow fields.
Due to these characteristics, CFD has been widely employed in engineering applications such as assessment of wind energy potential, modeling of atmospheric pollutant dispersion, urban microclimate studies and pedestrian wind comfort analysis. This section presents a literature review of CFD applied to urban wind engineering, with emphasis on the interaction effects between neighboring buildings and the established metrics for assessing pedestrian comfort.
2.1. CFD in Urban Environment and Turbulence Modeling
Urban environments represent particularly complex domains for CFD simulations, characterized by intricate geometries resulting from the arrangement of buildings and urban infrastructure; multiscale interactions in flow patterns; and intense turbulence generation induced by surface obstacles (buildings, vegetation and topography). In this context, turbulence modeling plays a fundamental role in ensuring the accuracy of numerical simulations. Among the most employed approaches are:
- Reynolds-Averaged Navier Stokes (RANS) models, based on the temporal averaging of the governing equations.
- Large-Eddy Simulation (LES) models, which explicitly solve large vortices while modeling smaller-scale turbulence.
Each approach presents distinct trade-offs between computational cost and accuracy in representing the turbulent phenomena typical of urban environments.
RANS models are widely adopted in engineering due to their low computational cost and ability to predict time-averaged flow characteristics through turbulence closure schemes, primarily and models [20,21,22,23]. The realizable and Re-Normalization Group (RNG) variants for offer improved accuracy for simulating Atmospheric Boundary Layer (ABL) separation, flow recirculation, and building interactions compared to the standard formulation [24]. For models, the Shear Stress Transport (SST) approach is particularly effective for resolving near-wall flows, making it suitable for wind load assessments and pedestrian comfort studies [25]. Additionally, Reynolds Stress Models (RSM) provide enhanced representation of anisotropic turbulence by directly solving Reynolds stress transport equations, but their high computational cost and numerical complexity limit their practical use in large-scale urban simulations [26].
Although RANS models are widely applied in urban studies due to their lower computational cost, their accuracy is limited by turbulence closure assumptions that cannot fully capture complex turbulent phenomena. For cases requiring higher fidelity, such as detailed flow structures (e.g., vortex shedding), wake dynamics, and turbulence induced by obstacles, LES offers a superior alternative by directly resolving large-scale vortices while modeling small-scale eddies through SubGrid-Scale (SGS) models [27]. This approach enhances the representation of urban turbulence compared to the time-averaged RANS methodology. LES has demonstrated superiority in capturing transient features of complex 3D urban flows, including ABL separation, vortex formation within urban canyons, and pollutant dispersion [28]. However, its application is constrained by significant computational demands, particularly in large urban domains and under transient boundary conditions [29]. Consequently, LES is often reserved for scenarios where transient effects and detailed turbulence are critical, such as pedestrian wind comfort and pollutant dispersion analyses [30,31,32], while RANS remains preferred for steady-state simulations of mean velocity, notably in urban wind energy assessments [33,34,35]. Ultimately, the choice between RANS and LES represents a trade-off between physical fidelity and computational feasibility, with LES often serving as a benchmark for validating RANS models in specific contexts, especially when supported by high-performance computing.
CFD has become a key tool in building aerodynamics, supporting analyses of wind loads, natural ventilation, and urban microclimate modifications [36]. It plays a important role in optimizing architectural forms and urban layouts for energy efficiency by systematically evaluating how geometries influence flow patterns and wind acceleration [37]. Moreover, CFD aids in assessing the feasibility of integrating renewable energy systems, such as rooftop wind turbines, within complex urban settings [38], thus contributing to more sustainable designs. Best practices emphasize appropriate mesh resolution, turbulence model selection, and validation against experimental data to ensure reliability. For instance, Vita et al. [39] demonstrated that while LES is preferable for small-scale applications, RANS can still yield reliable results when computational resources are limited.
2.2. Neighborhood Effects on the Wind Flow
Urban development increasingly complexifies city landscapes regarding wind engineering and aerodynamic interactions. Flow variations can significantly alter wind loads on structural systems. The Brazilian standard NBR 6123/2023 [40] introduces an approximate neighborhood effect coefficient () to increment aerodynamic coefficients, but this is applicable solely to structural calculations involving two buildings. Therefore, normative previsions do not comprehensively address more complex urban configurations, prompting extensive research into factors such as building height, relative position, and wind incidence angels. Modifications to urban landscapes affect flow direction and surface roughness, making interference effects critical in design assessments.
Blessmann [41] identifies three main phenomena related to neighboring influence: hammering (periodic loads from von Kármán vortices causing dynamic responses in downstream structures), the Venturi effect (flow acceleration through preferential paths, altering pressure coefficients), and wake turbulence (closely aligned downstream buildings are shielded from direct wind gusts, creating vortices between them).
2.3. Criteria for Pedestrian Comfort
Numerous studies in wind engineering literature propose criteria to assess pedestrian comfort in urban environments. Notable among these are the works of Du et al. [42] and Chen and Mak [43], which focus on criteria adopted in Hong Kong, a city characterized by high population density and urbanization, where pedestrian comfort issues arise daily. Such assessments improve urban planning, particularly in densely built areas where airflow is constrained by tall buildings and narrow urban corridors.
Pedestrian comfort criteria traditionally rely on parameters such as mean wind speed and the probability of exceeding specific thresholds, associating these values with different human activities, e.g. sitting, walking or running, and defining acceptable limits for each activity. Typically, these criteria set the mean or gust wind speed as a threshold parameter, with maximum exceedance probabilities corresponding to varying levels of comfort and safety. However, most of these approaches were originally developed for contexts with strong winds and are often unsuitable for dense urban environments where decreasing and irregular spacing between buildings increases the complexity of flow-structure interactions.
Du et al. [42] proposed criteria tailored to dense urban settings, particularly considering the hot and humid climate of Hong Kong. A key parameter is the Mean Wind Velocity Ratio (MVR), defined as the ratio of mean wind speed at pedestrian level to the reference approaching wind speed. For more comprehensive analysis accounting for multiple wind directions and their respective occurrence probabilities, the Overall Mean Wind Velocity Ratio (OMVR) is employed.
These indices have proven particularly effective in representing and quantifying pedestrian comfort in complex urban environments and are recommended for studies and policy development aimed at enhancing pedestrian-level wind comfort. Equations (1) and (2) present the formulation for calculating these indices, while Table 1 provides threshold values for user comfort assessment, where is the velocity at pedestrian level, the reference wind velocity, and is the probability of wind in the direction.
3. Methodology
In this work, the standard RANS turbulence model was utilized for simulating turbulent flows. This model was implemented using the framework provided by OpenFOAM v12, as detailed in the following subsections. This section describes the main equations for the , as well as the computational domain and adopted numerical schemes. The same methodology is also used and detailed in Silva et al. [46].
3.1. Turbulence Model
The characterizes turbulence through two transport variables: turbulent kinetic energy (TKE, referred in the equations as ) and dissipation rate (), based on the work of Launder and Spalding [47], Launder et al. [48] and Tahry [49]. From these variables, the turbulent viscosity is computed and used for closing the transport equations of averaged quantities. is calculated using the Equation (3), where = 0.09 is the model coefficient for turbulent viscosity.
This implementation in OpenFOAM is suitable for high turbulence flows in relatively stable environments, such as simplified urban settings. The transport equations for both and are solved together with the conservation of mass and momentum, as presented in Equations (4) and (5), where = 1.225 kg/m³ is the air specific mass, is effective diffusivity for TKE, and are, respectively, TKE production and dissipation rate, is the effective diffusivity for the dissipation rate, = 1.44 and = 1.92 are model coefficients, and is the velocity field.
The model assumes a local equilibrium between production and dissipation of TKE in regions distant from solid surfaces. It is recommended for applications where velocity gradients dominate over separation or recirculation effects, such as simple geometric configurations for urban flow studies. The choice of the standard is justified by its robustness, low computational cost, and extensive validation in urban flow and wind load assessments.
3.2. Boundary and Initial Conditions
The computational domain was defined following established recommendations for flow simulations around building arrays (for more details, see Franke et al. [50] e Tominaga et al. [51]). The central building, with B:W:H (base:width:height) proportions, was positioned 5H from the domain inlet and 15H from the outlet, with its sides located 5H from the other structures, ensuring symmetry in the central longitudinal plane. The domain height extends up to 5H above the building, as seen in Figure 2.
The configuration involves eight buildings arranged equidistantly with a 1B separation. The ABL was modeled using a classic logarithmic profile, suitable for flat terrain, with a roughness length = 0.0024 m and a zero-plane displacement = 0 m. The reference velocity is = 10 m/s at a height of 10 m. The inlet equations for the velocity profile and friction velocity are presented, respectively, in Equations (6) and (7), where = 0.40 is the von Kárman constant.
TKE and dissipation rate were determined according to typical ABL formulations, adjusted by the constants presented in Section 3.1, through Equations (8) and (9), respectively.
At de domain outlet, a homogeneous Neumann condition was applied, meaning the normal gradient of the variables is null, allowing for flow extrapolation (). The lateral and top surfaces were treated as symmetry planes, assuming that the flow does not cross these boundaries and that there is no normal gradient of velocity or other variables. The ground and building surfaces were modeled as rough walls, utilizing empirical approximations that impose velocity and stress profiles compatible with turbulent flows near solid surfaces. The generation of the 3D mesh was performed using the snappyHexMesh utility, which enables progressive refinement around the geometries, based on STL files representing the buildings surfaces.
3.3. Numerical Schemes
For the resolution of the simulated cases, a segregated steady-state solution method was adopted, employing the incompressible flow solver, simpleFoam. Temporal discretization followed the implicit Euler scheme, characterized by being first-order and non-oscillatory. Although classically associated with transient problems, this scheme was used here in a steady-state configuration, to ensure numerical stability and robustness, even with relatively large time steps.
The spatial discretization of gradient derivatives was performed using the Gaussian finite volume method integration method, with linear interpolation between cell centers. This approach restricts extrapolated values at cell interfaces to the range defined by neighbors, thereby preventing non-physical oscillations. Divergence terms, related to advection and diffusion, were treated using linear upwind Gauss scheme to define values at faces and promoting stability in the resolution of advective and dissipative flows. This discretization was uniformly applied to the equations for the velocity field, TKE and dissipation.
Terms involving the Laplacian operator were discretized through the linear corrected scheme, which adds an orthogonal correction to compensate for any geometric misalignment between cells. The solution of the resulting algebraic system was conducted using Geometric Agglomeration Multi-Grid (GAMG) method for pressure, which enhances efficiency through hierarchical mesh levels. For the velocity, TKE and fields, smoothSolver was applied. The convergence criteria adopted has a tolerance of for all primary variables and for global residual control. For more details about the methodology, see Silva [52]. The same procedures were used by the authors to estimate wind loads on buildings facades in Silva et al. [46].
3.4. Simulation Case
A simplified building arrangement was analyzed, consisting of a neighborhood of nine buildings. The main building, located at the center of the arrangement, has dimensions of L × L × 6L, where L is the edge length of the base. The other buildings have the same base dimension L, and their height varies between 0L (for the case of the isolated central building) and 6L (where all buildings in the neighborhood have the same height), in increments of L. The buildings are spaced from each other by L, as the arrangement can be visualized in Figure 3.
Pedestrian comfort metrics were evaluated in the four canyons around the central building, designated as “Streets” #1 to #4, as illustrated in Figure 4. At each of these locations, the MVR and OMVR metrics were assessed at a height of 0.075L from the ground level (the height considered for wind incidence on pedestrians). Each building height scenario was analyzed for four distinct wind incidence angles ranging from = 0° to = 45° in 15° increments. As this study considers a generic configuration without a specific geographical location, the four wind directions were assumed to have an equal probability of occurrence, = 25%.
The computational meshes generated for each simulation case consisted, on average, of approximately 4.7 million finite volumes. The simulations were performed at a Reynolds number = 100,000.
4. Validation
This section presents the validation process for the adopted CFD configuration. Reference benchmark case was used as a basis for comparing the results in this study. CFD analyses were performed with OpenFOAM v12 on a system equipped with an Intel Core i5 4200U processor (dual-core, 1.60 GHz), 6 GB of RAM, and Ubuntu 18.04.6 LTS.
To verify the OpenFOAM configuration and the numerical schemes employed, a benchmark case involving two identical prismatic buildings was simulated, these structures had a geometric ratio of 1:1:4 (width:depth:height), and wind incidence angles of 0°, 15°, 30° and 45° were analyzed (see Figure 5).
For each wind direction, the mean pressure coefficient was plotted along the symmetry lines of the four facades of the building under analysis. These values were compared against experimental data using scatter plots, where experimental results are placed on the horizontal axis and simulated results on the vertical axis. Five statistical metrics were employed to assess the agreement between simulations and experiments: the coefficient of determination (R²), Fractional Bias (FB), the fraction of predictions within a factor of 2 of observations (FAC2), Root Mean Square Error (RMSE) and Mean Absolute Error (MAE). Higher R² and FAC2 values indicate better correlation, while lower FB, RMSE and MAE reflect reduced deviation.
Three mesh refinement levels were used: M1 (approximately 375,000 cells), M2 (1,428,000 cells), and M3 (3,785,000 cells). The results were compared with wind tunnel data from the Tokyo Polytechnic University (TPU) [53]. Figure 6 presents the results for each mesh refinement level gathering data from all wind incidence angles, and Table 2 summarizes the statistical coefficients and corresponding regression equations.
The level of agreement between the simulations and experimental data varied with the wind direction. In general, finer mesh resolution improved the R² values. Fractional bias was lowest in the finest meshes (M3), indicating that the data are mesh convergent. FAC2 values were comparable across meshes, suggesting minimal difference in predictive reliability. Exceptions occur with FB, which increases from M1 to M2 but reaches its lowest value in M3, and with FAC2, where M2 shows better values than M3. However, the statistical difference between these cases is negligible, as the occurrence of extreme values in refined meshes is an expected event in numerical simulations.
Thus, overall, although the model tended to overestimate pressures in positive regions and underestimate them in negative zones, it effectively captured the wind behavior around urban buildings, accounting for the influence of nearby structures. These findings validate the sustainability of the model and the mesh resolution equivalent to M3 for the simulations conducted in this study.
5. Results and Discussion
This section details the results of the MVR criterion for each scenario across the four designated streets. The OMVR parameter is subsequently analyzed for the entire neighborhood configuration, encompassing all four streets and wind directions. For detailed reference, pedestrian-level flow profiles and the corresponding MVR plots for each street are provided in Appendix A through Table A1, Table A2, Table A3, Table A4, Table A5, Table A6 and Table A7. Furthermore, Figure 7, Figure 8 and Figure 9 offer a comparative graphical overview through bar charts that summarize the findings for each street.
5.1. Wind Incidence Angle Analysis
Analysis of the plots reveals that the MVR criterion varies considerably with the wind incidence angle relative to the building configuration. The flow profiles in Appendix A demonstrate that when the wind impacts the neighborhood at a 0° angle, resulting in a perfect alignment between the streets and the flow, the Venturi effect becomes highly prominent. This phenomenon channels the flow and accelerates wind speed between the buildings, with MVR values peaking at 3.42 for the = 6L case. This trend is also observed at = 15°, where, despite the lack of perfect alignment between the canyons and the flow, the Venturi effect remains predominant, particularly for building heights of 4L. Furthermore, mean values for = 15° also peak above those for = 0°, reaching MVR = 2.99 in the = 6L case, owing to the combined effects of recirculation and Venturi phenomenon.
At = 30°, this trend begins to diminish. The flow profiles presented in Appendix A indicate that while the Venturi effect is still present along the streets, the dominant phenomenon becomes wind recirculation, characterized by the formation of multiples vortices downstream of the buildings, especially from = 3L onwards. Consequently, MVR values start to decrease compared to those at = 0° and 15°, although peaks considered highly hazardous for comfort indices still occur. However, when considering the mean values, a significant drop is observed in the bar charts for Figure 7, Figure 8 and Figure 9, particularly for Streets #1 and #2, which are more aligned with the flow in the previous configurations.
At an incidence angle of = 45°, a generalized decrease in the MVR criterion is observed, within the urban canyons. This occurs because the absence of any alignment with the flow makes the Venturi effect less influential, while downstream recirculation effects become more prominent. An examination of the flow profiles for these cases reveals no significant differences across the various building heights, precisely because the Venturi effect has less significance in this scenario. The bar charts confirm that the = 45° case yields the lowest mean, maximum and minimum MVR values. The absolute peak MVR is 3.14, occurring at = 1L, while the highest mean value is 1.89, recorded at = 6L.
5.2. Neighborhood Height Analysis
The influence of neighboring building height on the MVR parameter is first examined through the visualization of flow streamlines, presented in Appendix A. At = 1L, the flow is observed to follow multiple trajectories across all incidence angles. However, from = 3L onwards, a distinct tendency for the flow to be channeled within the urban canyons emerges, exhibiting fewer trajectory deviations at intersections and a greater propensity to follow the primary flow paths. This effect is most prominent at = 0° and 15°, as discussed in the previous sections, yet it is also discernible at = 30° and 45°.
From = 4L, the flow adopts a preferential path within the streets, indicating that the Venturi effect becomes more pronounced as the height of the neighboring buildings increases. This is particularly evident in Streets #1 and #2 at = 0°, 15° and 30°, which maintain some alignment with the flow, thereby favoring wind acceleration as the urban canyon cross-section narrows. Initially, the MVR plots for Streets #1 and #2 reveal significant variations between the building corridors and the street intersection regions. However, with increasing neighborhood height, this variability diminishes, while the man and maximum MVR values rise. The bar charts confirm a strong trend: an increase in the MVR criterion and a decrease in its variations in canyons aligned with the flow trajectory, whereas perpendicular canyons also exhibit a significant, albeit less pronounced, increase.
The isolated cases of particular interest ( = 0L). The flow streamlines reveal a contrary trend compared to the cases with a neighborhood: wind speed accelerates significantly in regions proximate to the isolated building while maintaining the inlet velocity in areas farther away. This considerably elevates the MVR criterion in the building immediate surroundings, with peaks that even exceed those induced by the Venturi effect. While this effect is less significant at = 0°, at = 15° the average MVR along Streets #1 and #2 surpasses that of the = 1L and = 2L cases. Significant maximum values are observed at = 15°, 30° and 45°, even exceeding the maximum values found in the 6L cases. This suggests that while the uniform-height neighborhood case yields a higher mean MVR, the isolate case produces localized peaks that can surpass those in the neighborhood configuration. This demonstrated that an isolated building can also cause significant pedestrian discomfort or even hazardous conditions, as evidenced by peaks exceeding 3.60 in Streets #3 and #4.
Therefore, the analysis confirms that neighboring building height significantly influences pedestrian comfort, as taller structures enhance wind channeling along preferential paths, thereby increasing its velocity within urban canyons. Nevertheless, it is also observed that in the isolated building case, the separation of the urban boundary layer, particularly at non-zero incidence angles, induces velocity peaks that can compromise the safety of pedestrians in the surrounding areas.
5.3. Overall Pedestrian Comfort
By referencing the values presented in Table 1, it becomes evident that MVR peaks throughout the simulations demonstrate that even in simplified scenarios, such as the idealized neighborhood employed in this study, velocity peaks arising from boundary layer separation and neighborhood effects can lead to potentially hazardous conditions for pedestrians. These peaks are typically observed in narrow corridors between two aligned buildings, while the minimum values are found at the intersections of urban corridors where a large cross-sectional area is available for wind flow.
Across all simulations, peak values considered intolerable for human activities were reached in at least one of the canyons within the urban configuration, although at = 45°, these peaks are notably less intense. The simplified configuration of the study also promotes the formation of preferential wind paths, consequently increasing the velocity values in these specific regions.
Although the peaks are deemed potentially hazardous to pedestrian comfort, the mean MVR criterion generally does not exceed tolerable thresholds for low neighborhood heights. However, as the height of the neighboring buildings increases, the flow tends to become more critical, with hazardous conditions becoming prevalent through the canyons. The bar charts indicate that with increasing building height, the mean MVR value trends closer to potentially dangerous levels. For a generalized analysis, and assuming equal probability for all wind incidence angles, the OMVR criterion, normalized by the reference velocity, is calculated and presented in Figure 10.
To adequately assess pedestrian safety and comfort, historical and statistical wind data for a specific region must be adopted. For this study, an equal probability for each wind direction was considered, making = 25%. For example, in Brazil, such data are obtained from the National Institute of Meteorology (INMET), whereby each region has its own reference velocity for design calculations. However, for the purposes of this study, which evaluates hypothetical cases the = 2L neighborhood condition is identified as offering a safer configuration for outdoor activities, classified as “tolerable” as seen in Tabel 1. For = 0L, it is placed in a threshold between “tolerable” and “intolerable” for human activities. For the other configurations, all can be classified as “intolerable”, not being well-suited for most human outdoor activities. It is noted that as the neighborhood height increases, so does the OMVR factor, demonstrating that building height is a primary factor influencing pedestrian comfort metrics, with the = 6L case yielding a maximum OMVR/ value of 9.32.
6. Conclusions
This study conducted a numerical investigation into pedestrian wind comfort within an idealized urban neighborhood composed of nine buildings. Through Computational Fluid Dynamics (CFD) simulations, the research systematically analyzed the influence of varying surrounding building heights (from 0L to 6L) and multiple wind incidence angles (from 0° to 45° in intervals of 15°) on pedestrian-level airflow, quantified by the Mean Velocity Ratio (MVR) and Overall Mean Velocity Ratio (OMVR) criteria.
The results revealed a strong dependence of pedestrian comfort on both the geometric configuration and the wind direction. It was demonstrated that wind angles aligned with the urban canyons (0° and 15°) promote a prominent Venturi effect, significantly accelerating wind speed between buildings and leading to MVR values that are considered intolerable or even dangerous. In contrast, an oblique wind incidence of 45° was found to distribute the airflow more evenly, mitigating extreme velocities and enhancing overall comfort. Furthermore, the analysis of neighborhood height showed that as surrounding buildings become taller, the channeling effect intensifies, leading to a general increase in mean wind speeds within the canyons. Notably, the study also highlighted that an isolated building configuration ( = 0L) is not exempt from creating adverse conditions; flow separation around the solitary structure can induce localized velocity peaks that can exceed those found in dense neighborhood layouts.
In conclusion, this research indicates that aerodynamic interactions in urban environments are complex and that oversimplified planning assumptions can lead to uncomfortable or unsafe pedestrian conditions. Both the arrangement and height of the buildings, as well as their orientation to predominant wind directions must be analyzed when planning urban environments. The findings emphasize the critical role of wind engineering analysis, demonstrating that CFD is a powerful tool for urban planning to identify and mitigate potential wind-related issues, thereby fostering the design of more resilient and comfortable public spaces.
6.1. Limitation of the Research
The authors acknowledge that the methodology adopted in this study has certain limitations that frame the scope of the conclusions. The research was based on a simplified and hypothetical urban configuration, featuring a perfectly aligned arrangement of buildings with identical base areas. This idealized geometry, while effective for isolating specific aerodynamic phenomena, favors certain flow profiles and does not capture the complex, irregular layouts of most real-world, particularly unplanned cities.
Furthermore, RANS turbulence model, while computationally efficient, introduces constraints by providing time-averaged flow characteristics. This approach inherently overlooks the transient nature of wind gusts and prevents the analysis of peak velocity values, which can be critical for safety assessments and are better captured by more robust turbulence schemes such as Large Eddy Simulations (LES). For a more comprehensive understanding, future studies should consider employing advanced models like RANS Shear Stress Transport or LES.
Finally, the study was conducted for a generic, hypothetical case without a specific geographical location. Consequently, it did not incorporate meteorological or statistic data for wind speed and directionality from a real site. A more robust and applicable study would require focusing on a specific locality to assign realistic boundary conditions and wind climate data, allowing for a more accurate and site-specific assessment of pedestrian comfort.
Author Contributions
P.U.d.S.: conceptualization, software, validation, formal analysis, investigation, resources, data curation, writing—original draft preparation, and visualization. G.B.: conceptualization, methodology, investigation, writing—review and editing, supervision, and project administration. M.G.: resources, writing—review and editing, supervision, and project administration. All authors have read and agreed to the published version of the manuscript.
Funding
Fundação de Coordenação de Aperfeiçoamento de Pessoal de Nível Superior (CAPES) – Finance Code 001 and Conselho Nacional de Desenvolvimento Científico e Tecnológico (CNPq) – 302119/2022-1.
Data Availability Statement
The raw data supporting the conclusions of this article will be made available by the authors upon request.
Acknowledgments
The authors would like to thank Fundação de Coordenação de Aperfeiçoamento de Pessoal de Nível Superior (CAPES) and the Conselho Nacional de Desenvolvimento Científico e Tecnológico (CNPq) for funding this work.
Conflicts of Interest
The authors declare no conflicts of interest.
Abbreviations
The following abbreviations are used in this manuscript:
| ABL | Atmospheric Boundary Layer |
| CFD | Computational Fluid Dynamics |
| FB | Fractional Bias |
| GAMG | Geometric Agglomeration Multi-Grid |
| LES | Large-Eddy Simulation |
| MAE | Mean Absolute Error |
| MVR | Mean Velocity Ratio |
| OMVR | Overall Mean Velocity Ratio |
| RNG | Re-Normalization Group |
| RANS | Reynolds-Averaged Navier-Stokes |
| RSM | Reynolds Stress Models |
| RMSE | Root Mean Square Error |
| SGS | SubGrid-Scale |
| TKE | Turbulent Kinetic Energy |
Appendix A
This appendix presents tables detailing the streamlines for each numerical simulation case, alongside a plot of the MVR pedestrian Comfort criterion traced along the streets, referencing the axes defined in Figure 4. In total, it consists of seven tables, A1 through A7. Each table corresponds to a specific neighborhood height and contains the results for all wind incidence angles for that configuration. The tables are organized in ascending order of , all streamlines are visualized at a slice plane of = 0.0075L.

Table A1.
MVR criteria for cases h = 0 L.
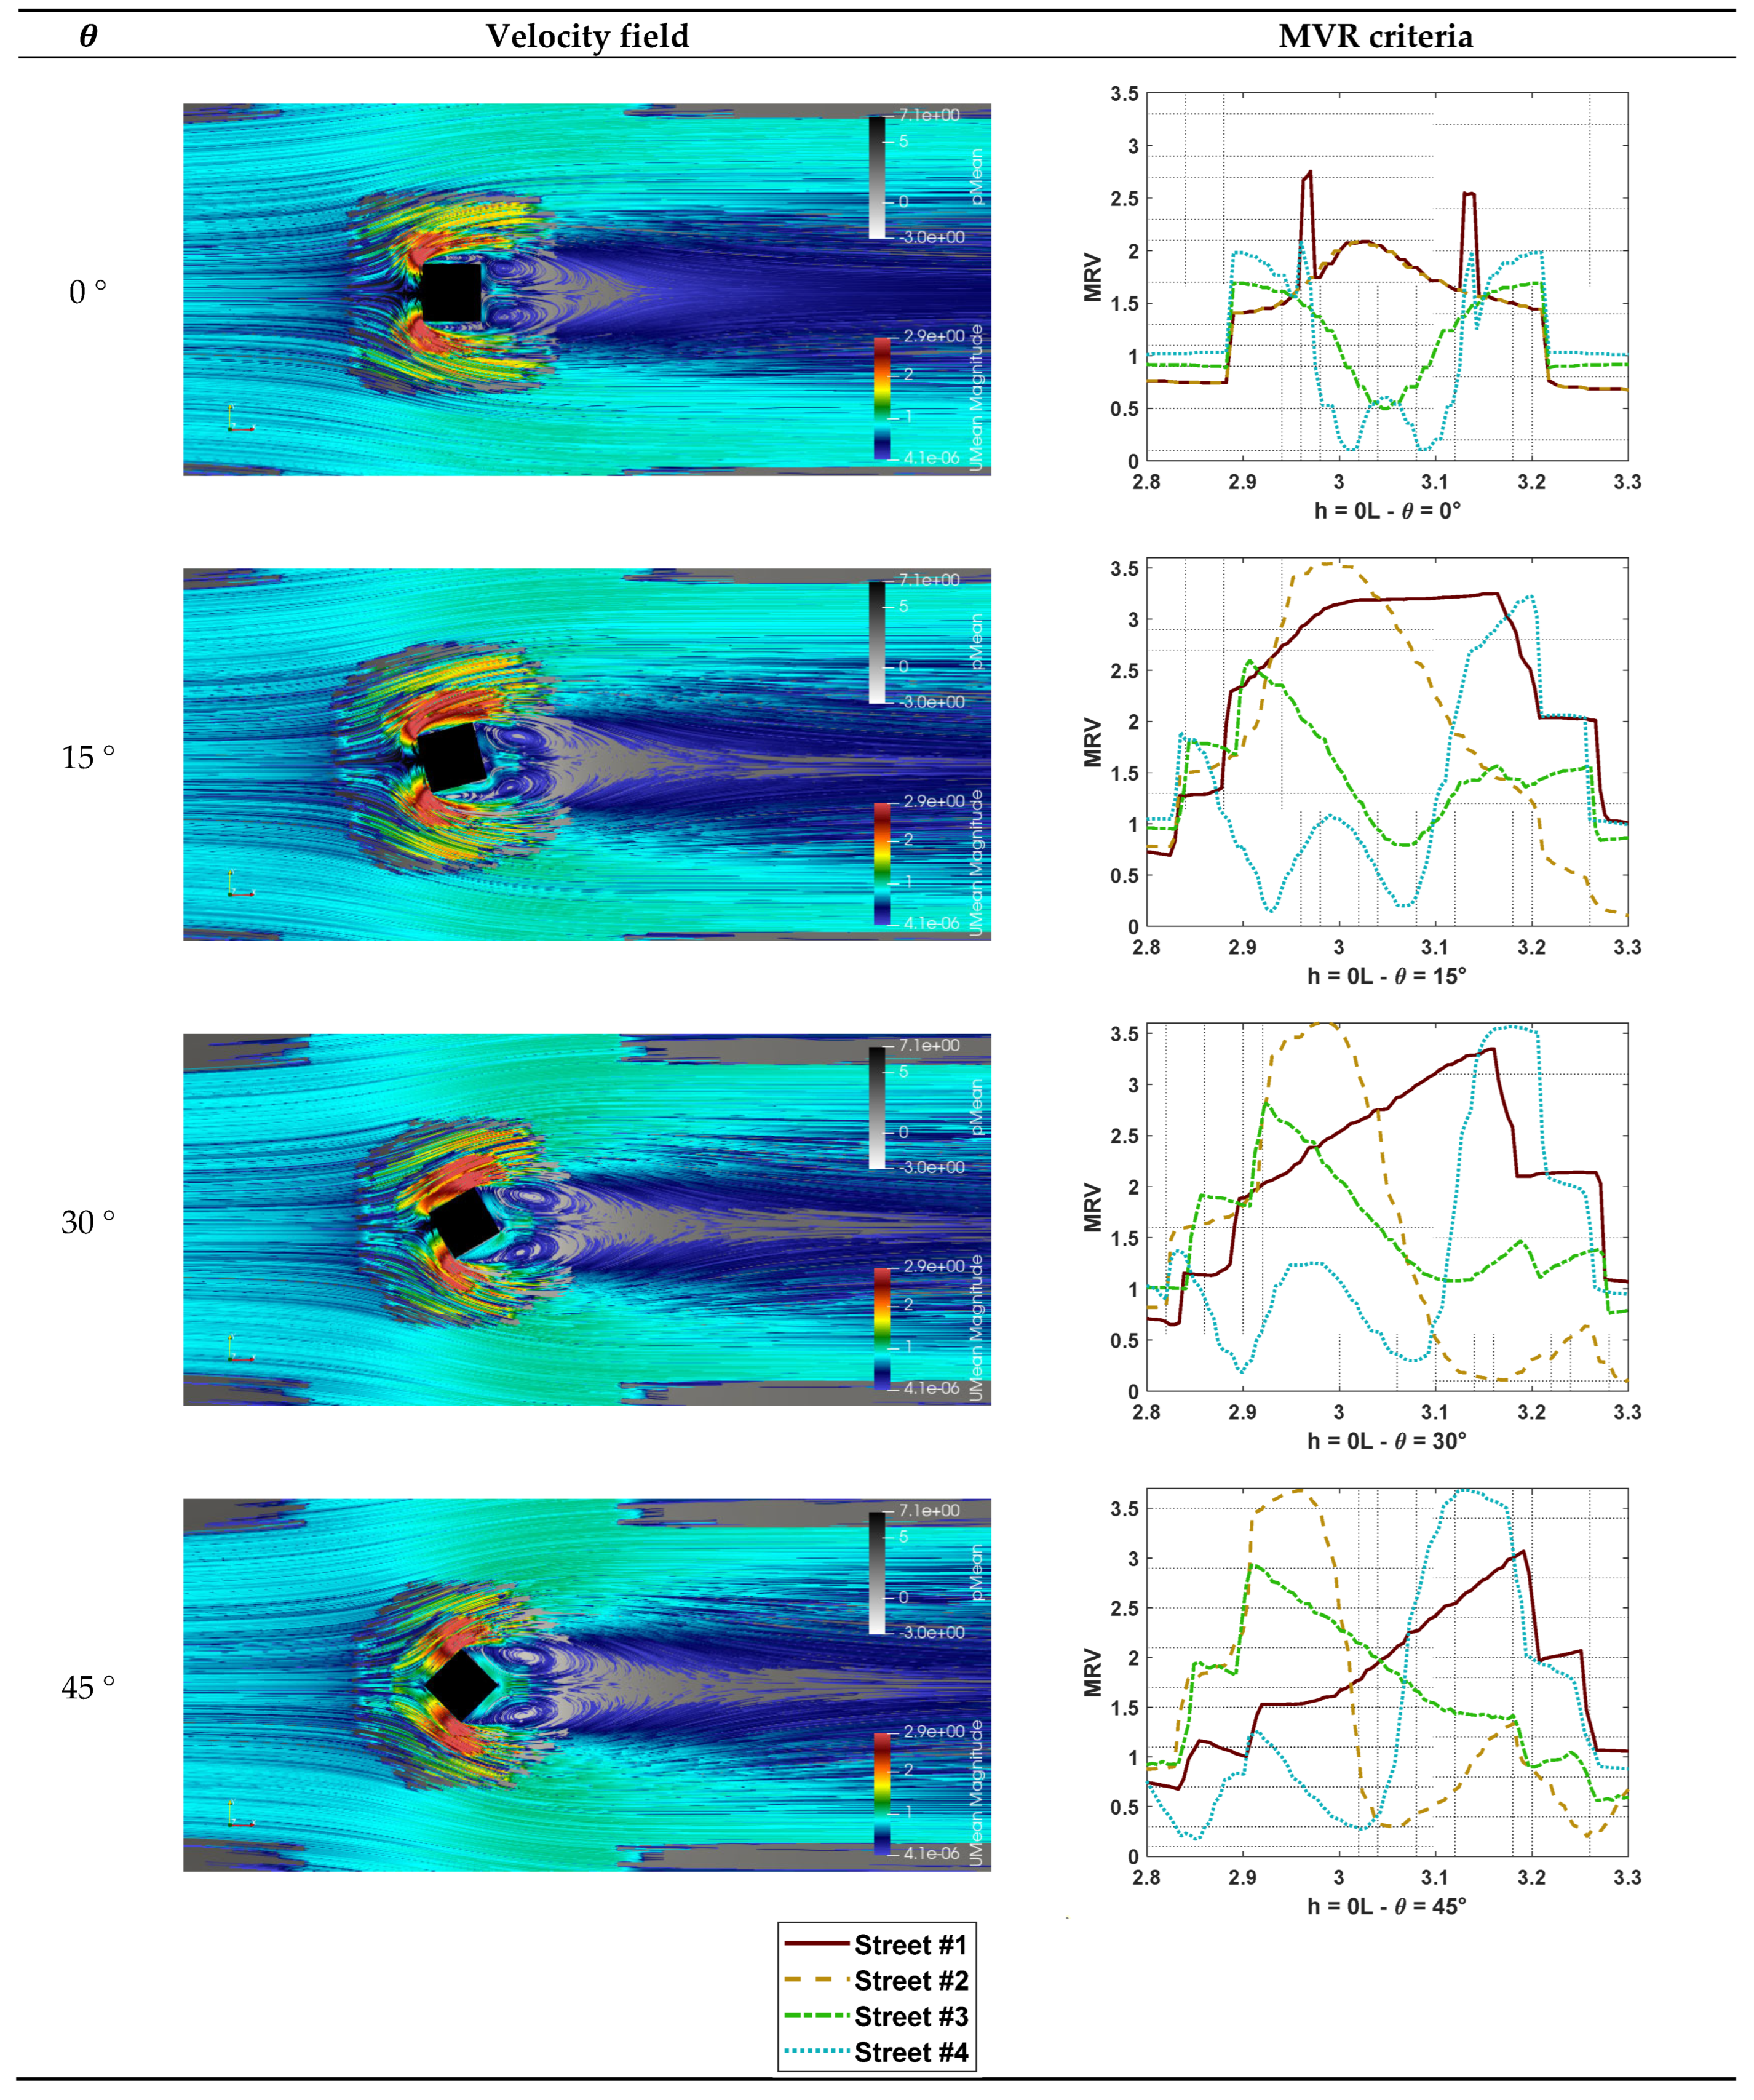 |
Table A2.
MVR criteria for cases h = 1 L.
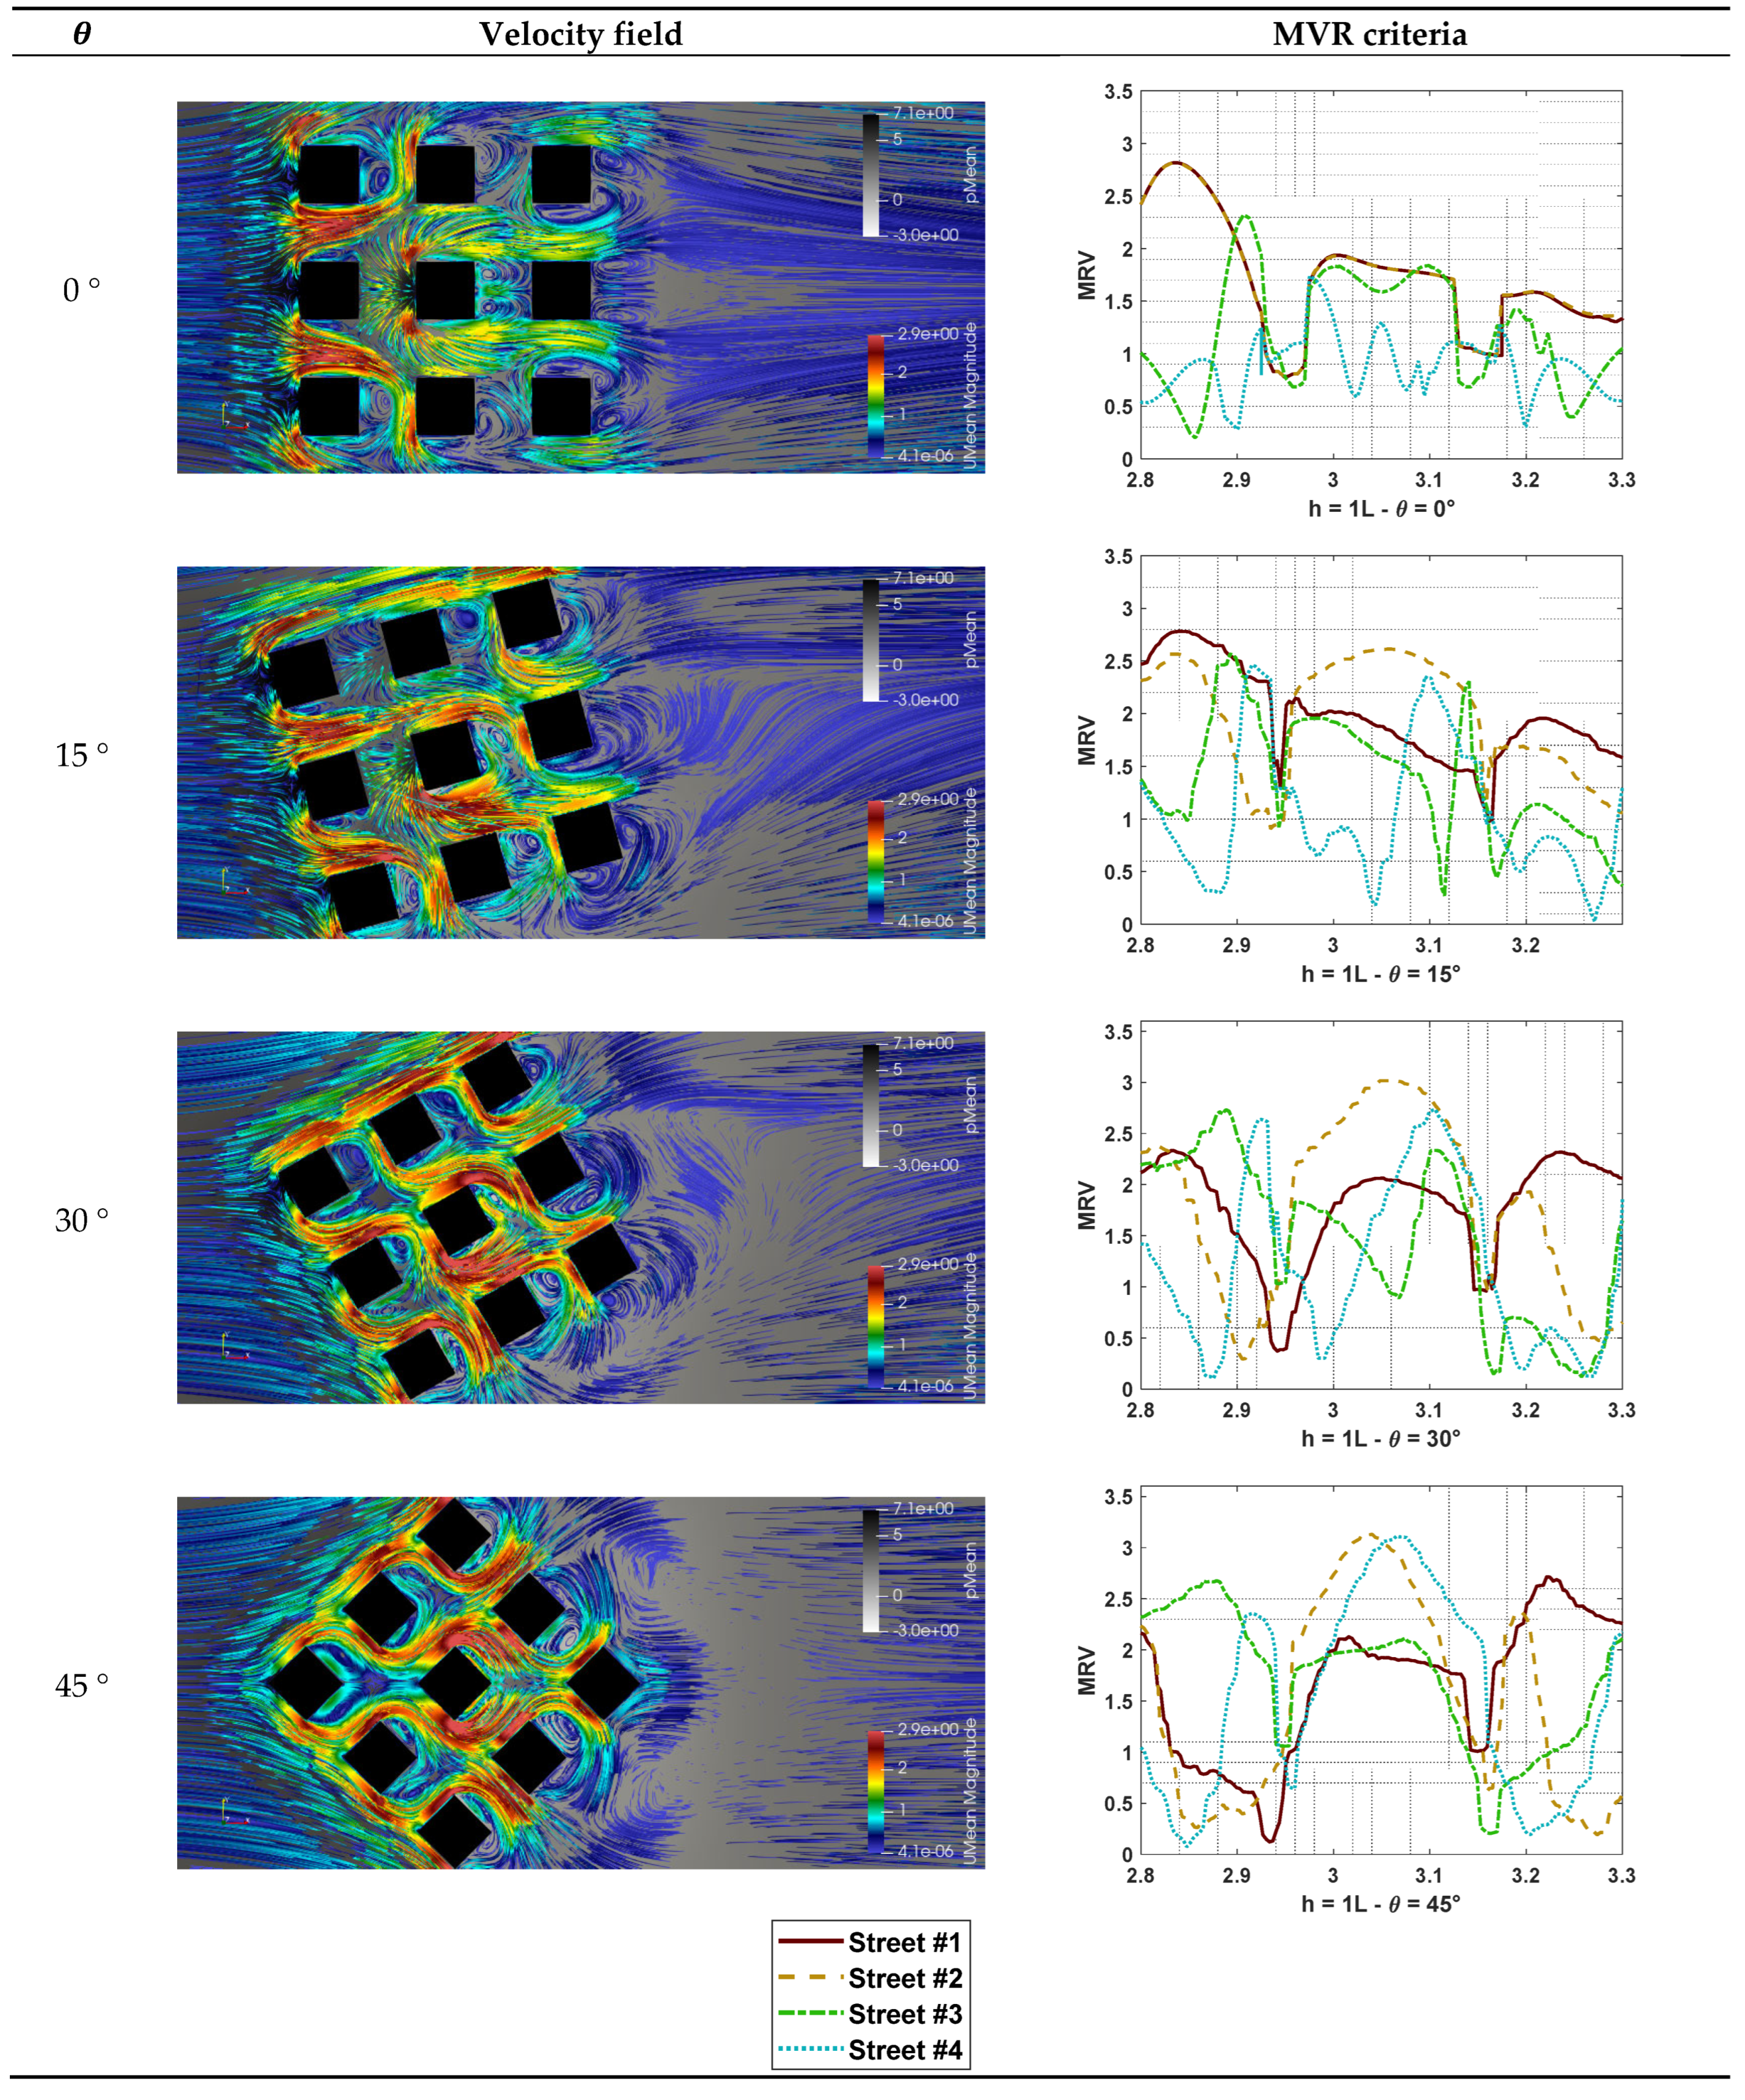 |
Table A3.
MVR criteria for cases h = 2 L.
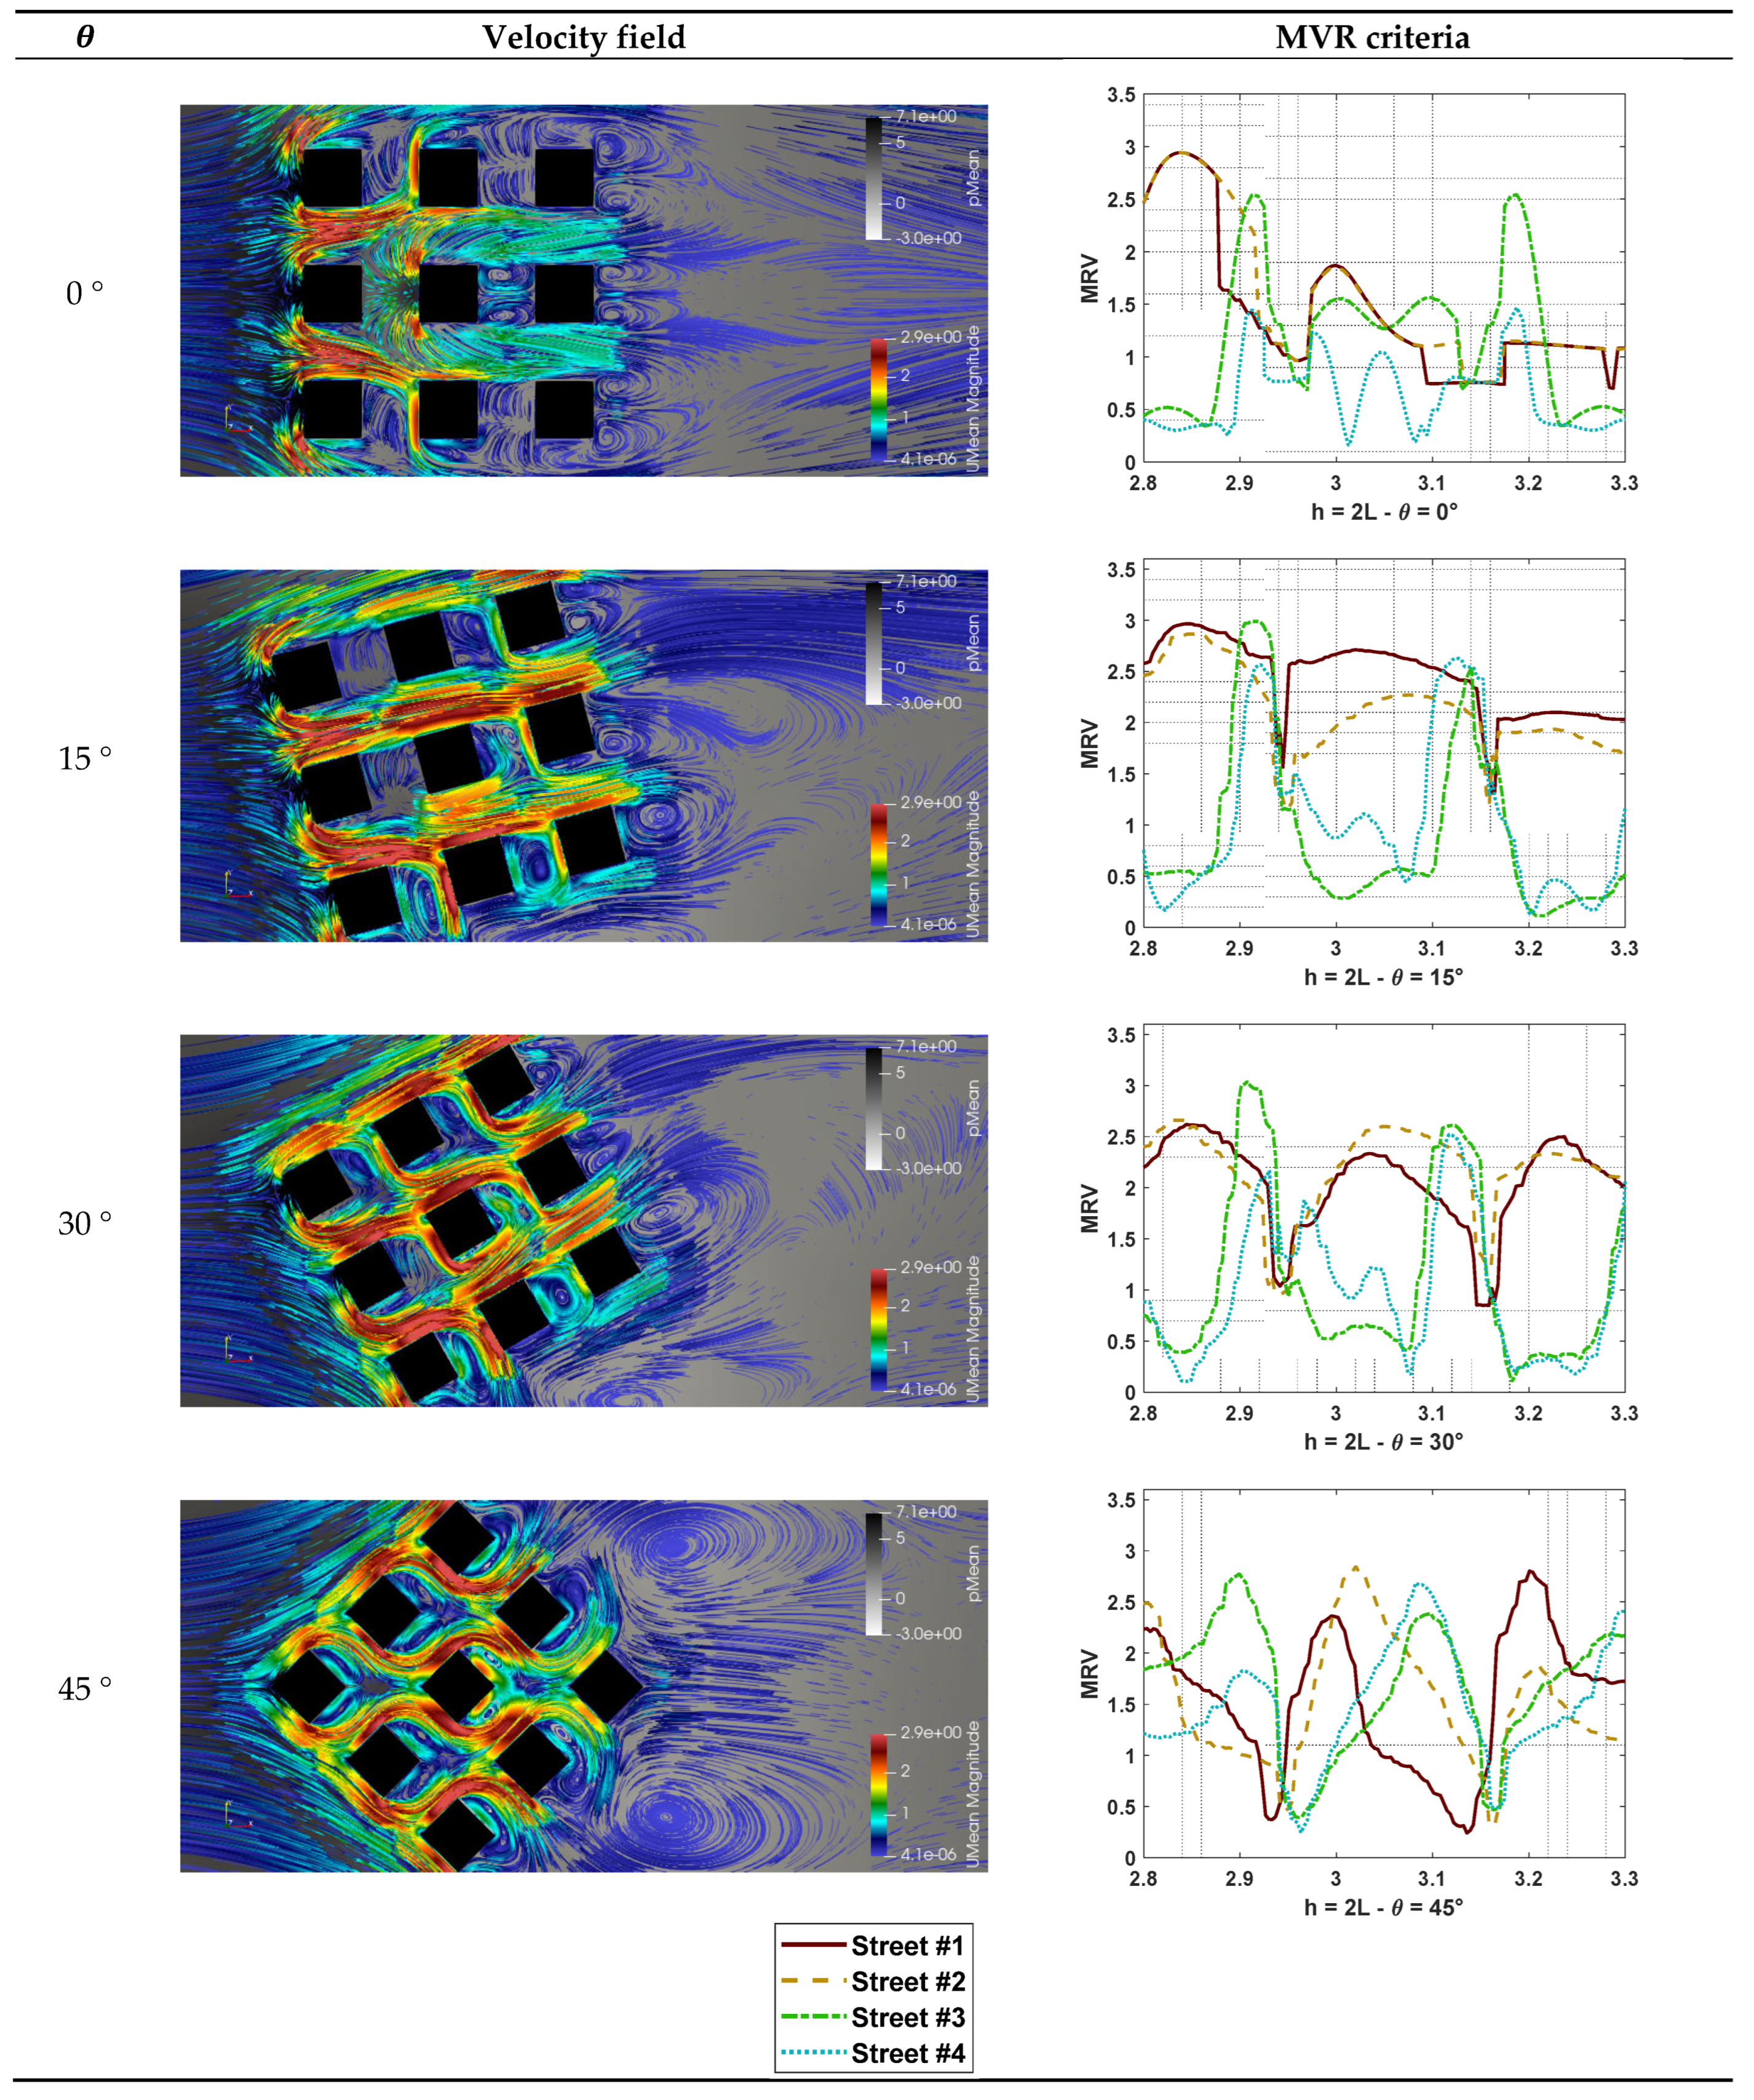 |
Table A4.
MVR criteria for cases h = 3 L.
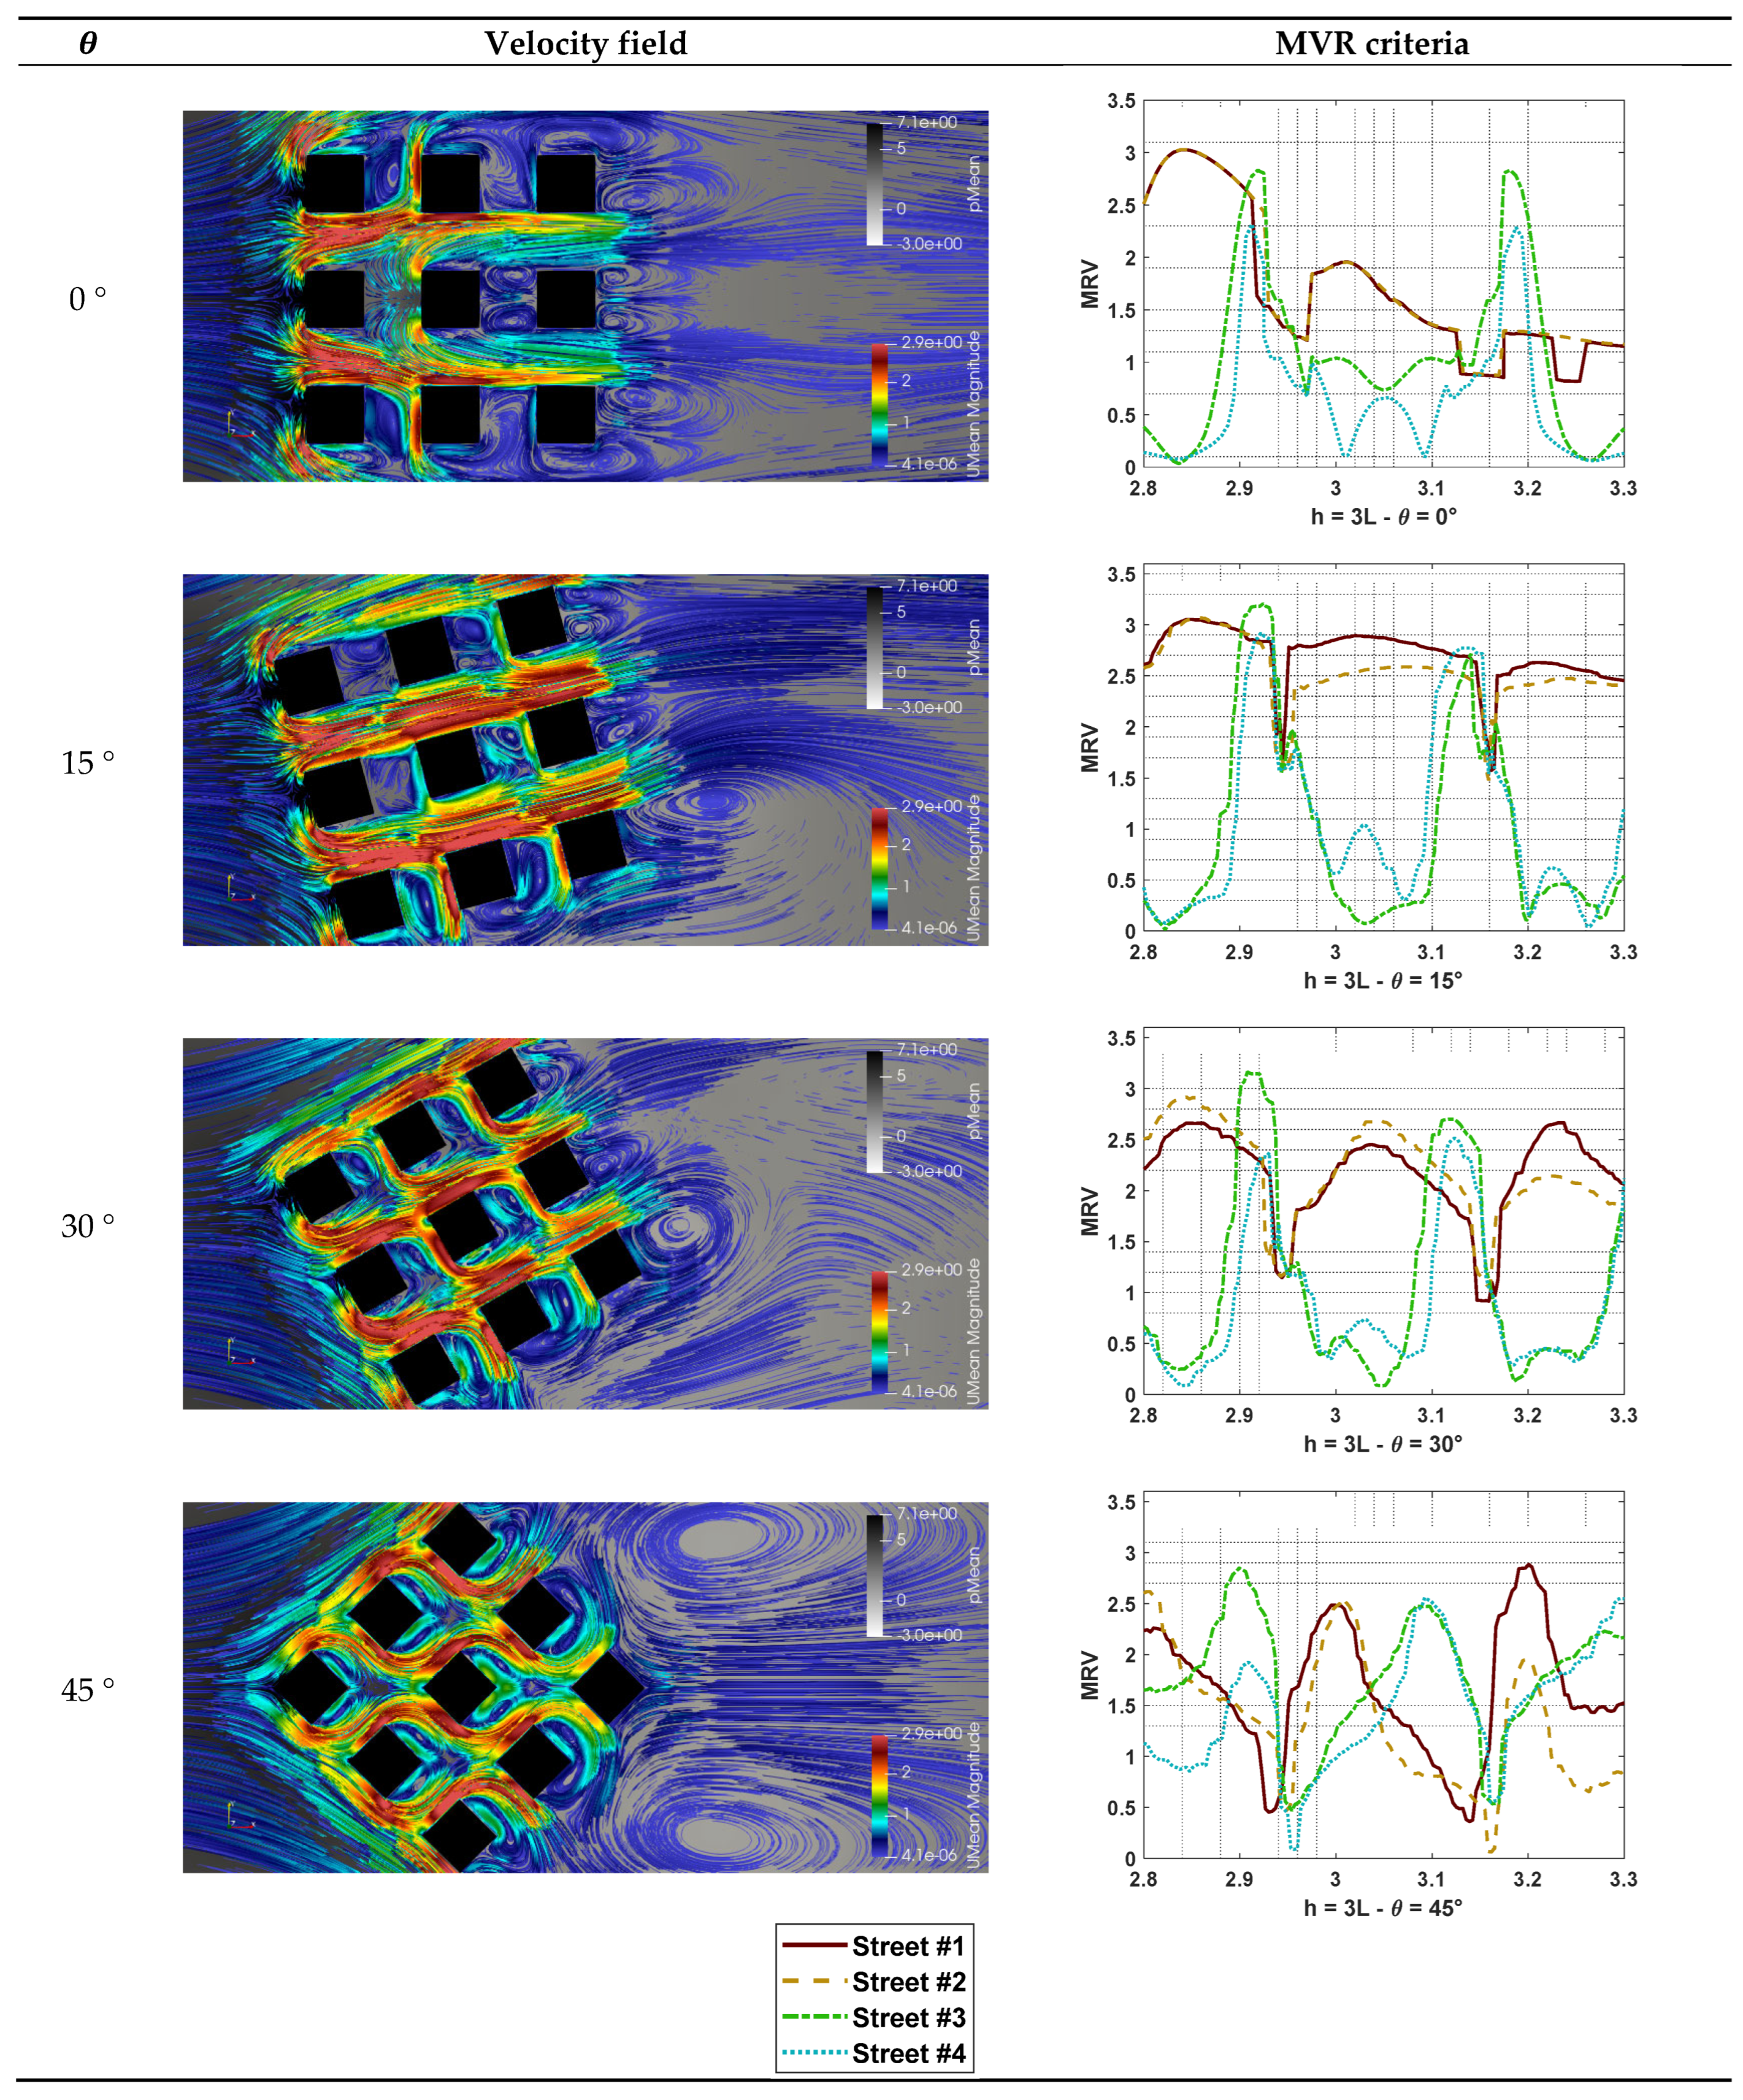 |
Table A4.
MVR criteria for cases h = 4 L.
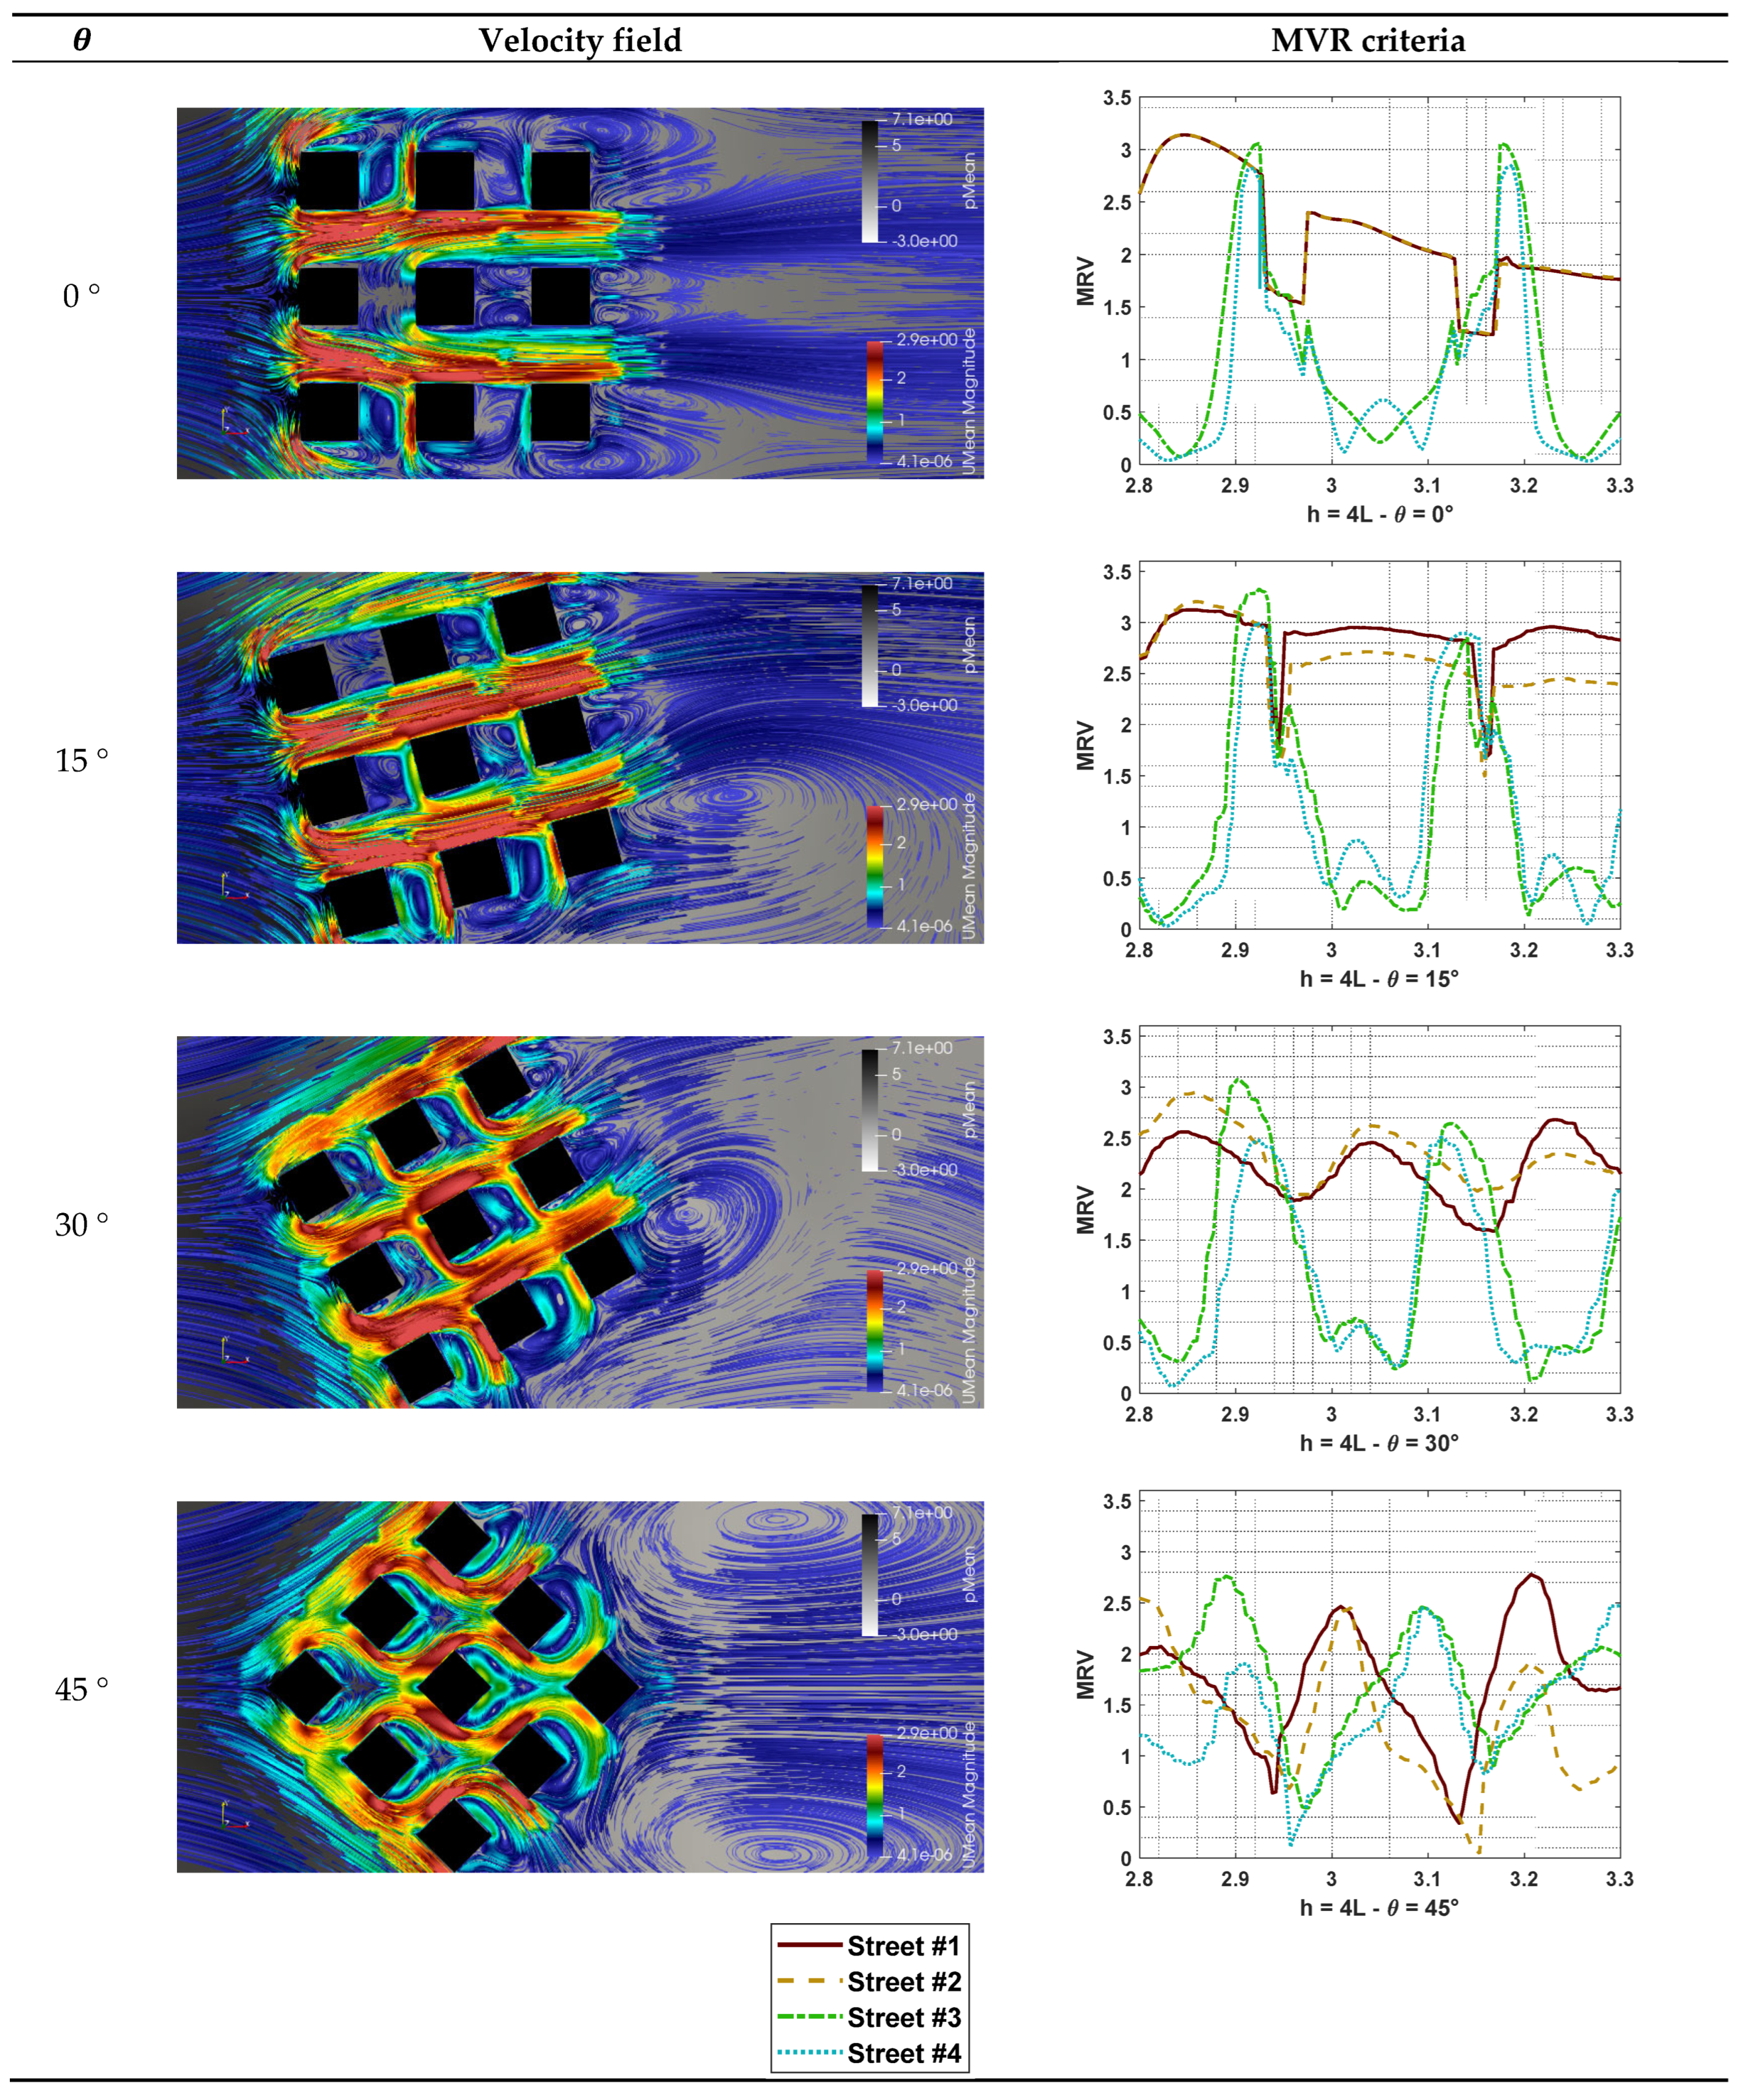 |
Table A4.
MVR criteria for cases h = 5 L.
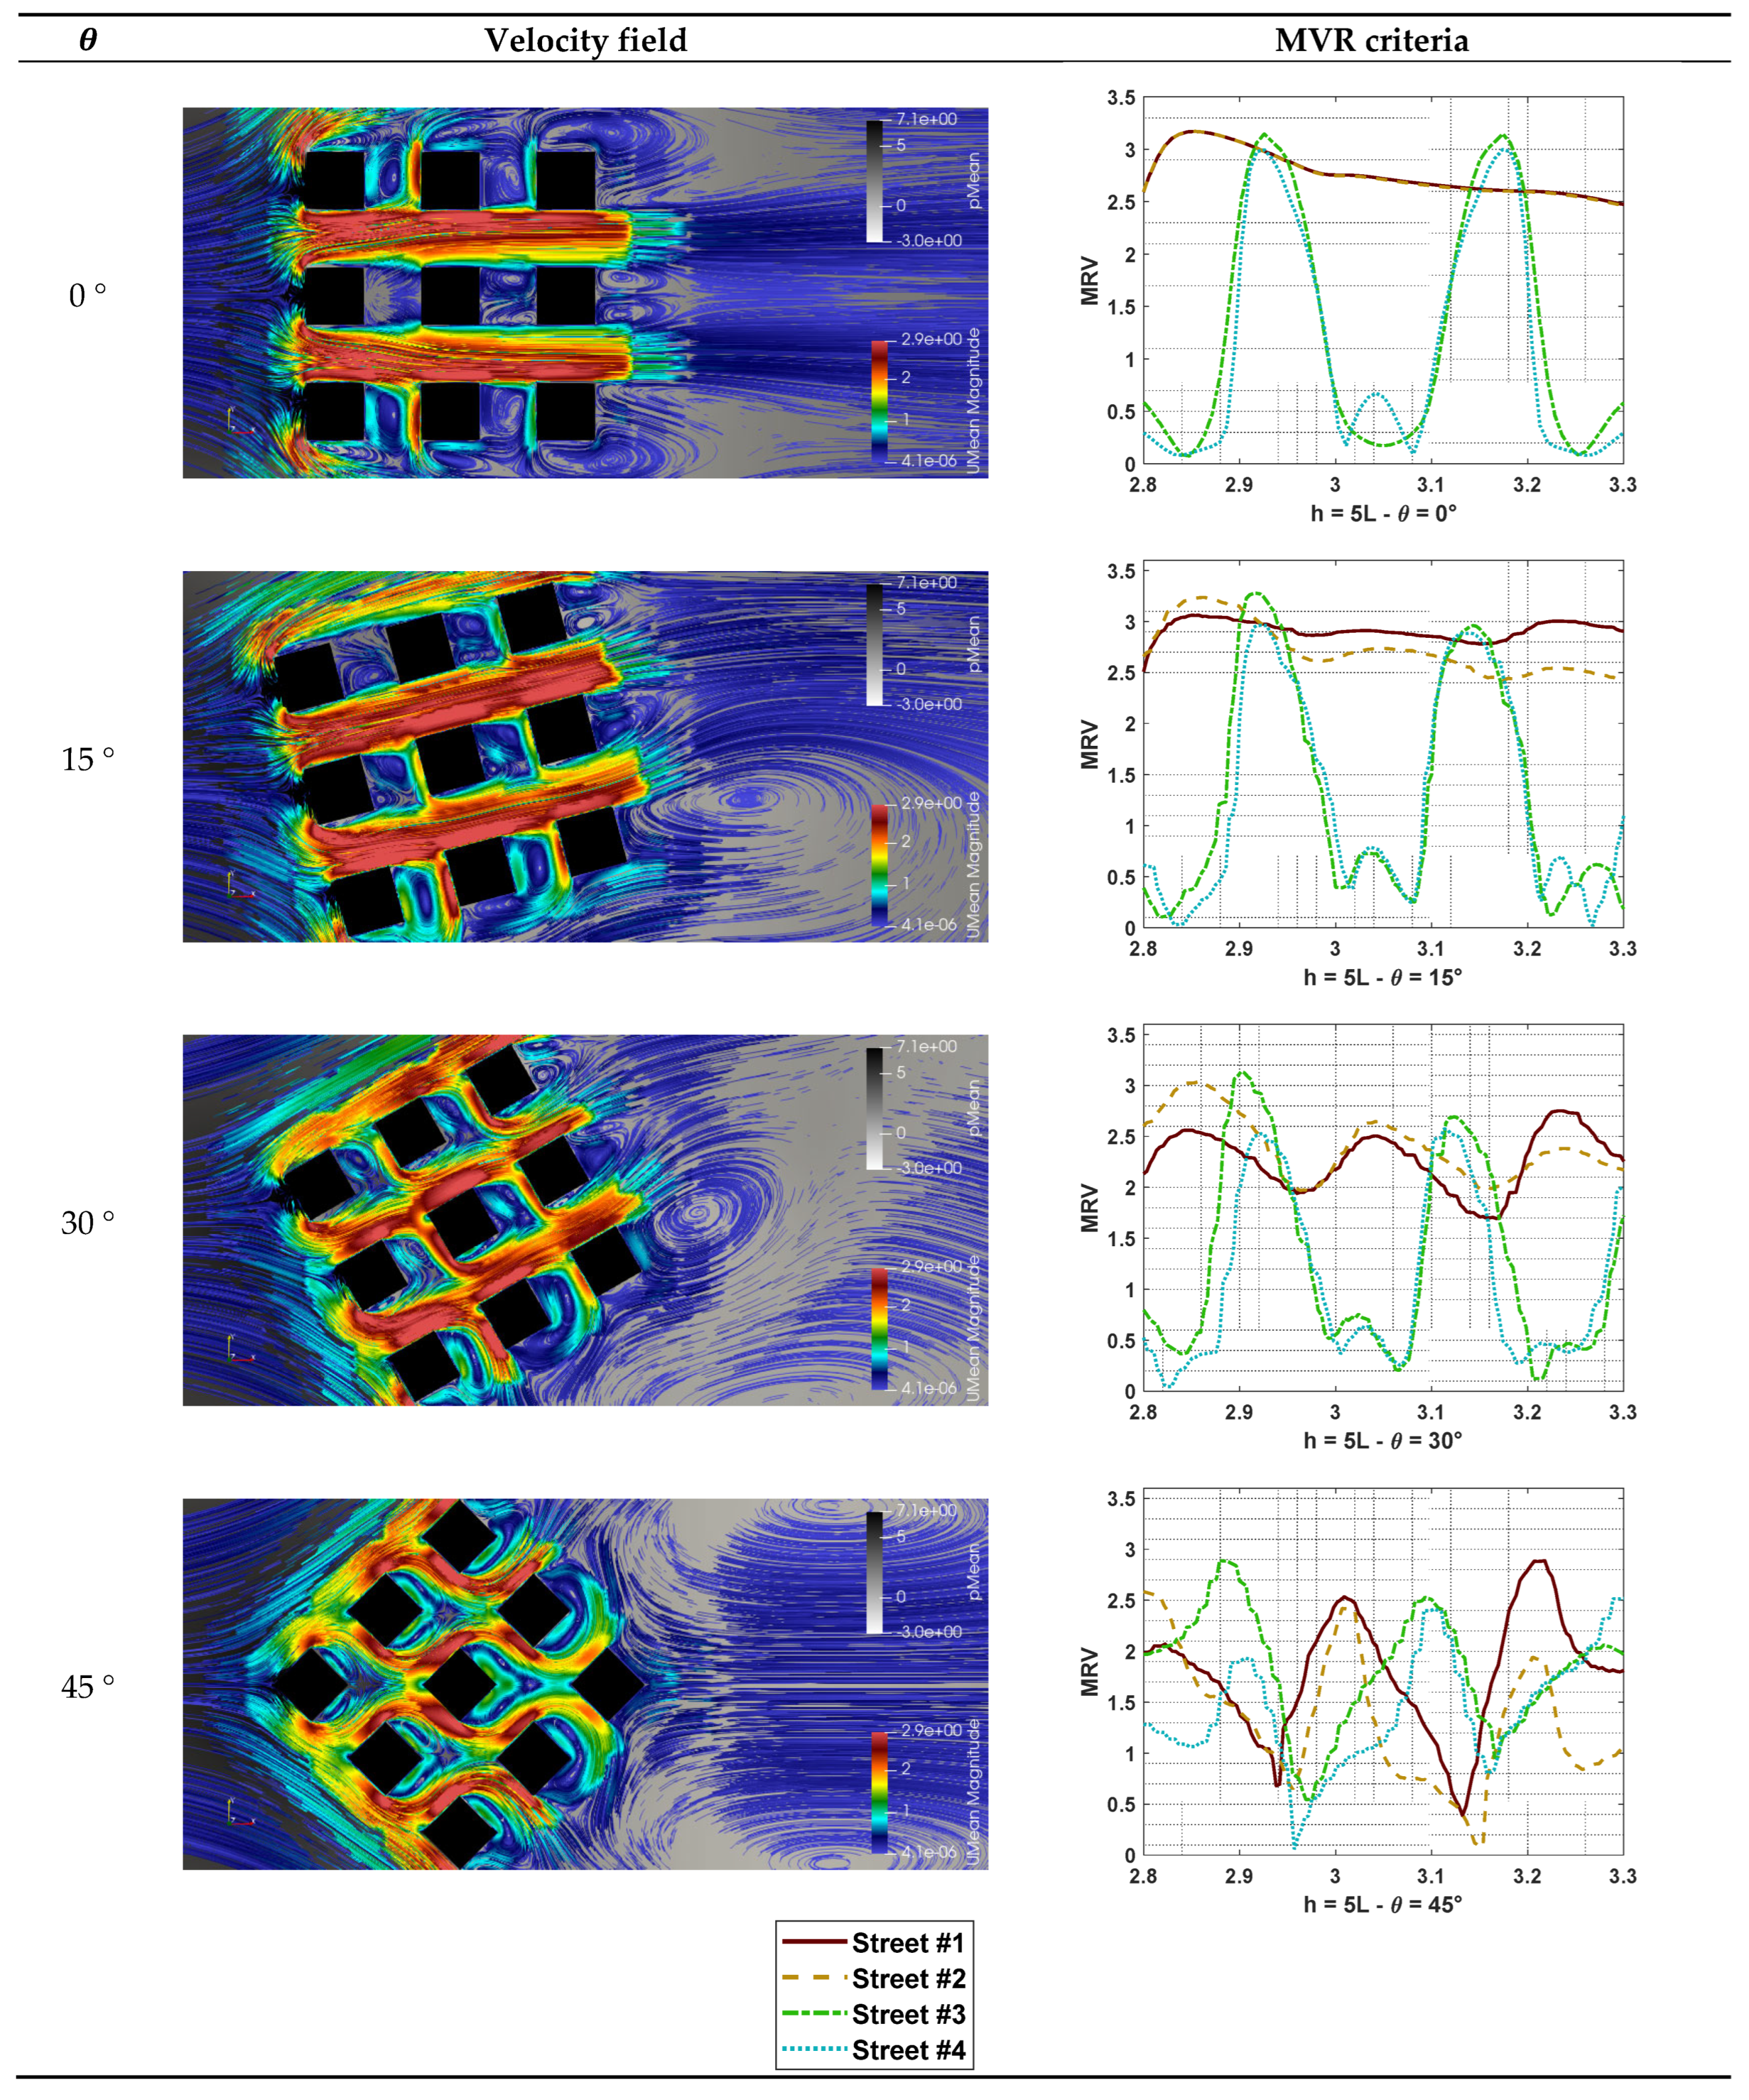 |
Table A4.
MVR criteria for cases h = 6 L.
 |
References
- Amerio, A.; Brambilla, A.; Morganti, A.; Aguglia, A.; Bianchi, D.; Santi, F.; Costantini, L.; Odone, A.; Costanza, A.; Signorelli, C.; Serafini, G.; Amore, M.; Capolongo, S. COVID-19 Lockdown: Housing Built Environment’s Effects on Mental Health. Int. J. Environ. Res. Public Health 2020, 17, 5973. [Google Scholar] [CrossRef] [PubMed]
- Millán-Jiménez, A.; Herrera-Limones, R.; López-Escamilla, Á.; López-Rubio, E.; Torres-García, M. Confinement, Comfort and Health: Analysis of the Real Influence of Lockdown on University Students during the COVID-19 Pandemic. Int. J. Environ. Res. Public Health 2021, 18, 5572. [Google Scholar] [CrossRef] [PubMed]
- Met Office. Urban Heat Island Introduction. Available online: https://www.metlink.org/fieldwork-resource/urban-heat-island-introduction/ (accessed on 2 June 2025).
- Liu, Z.; Zheng, C.; Lu, D.; Wang, Y.; Chen, Y.; Jin, Z.; Zhang, Z. Effects of Wind Shields on Pedestrian-Level Wind Environment around Outdoor Platforms of a Megatall Building. Atmosphere 2024, 15, 171. [Google Scholar] [CrossRef]
- Hashemi, S.; Ghaffarianhoseini, A.; Ghaffarianhoseini, A.; Naismith, N.; Santamouris, M.; Kikumoto, H. Pedestrian-Level Wind Speed Analysis: A Case Study. Archit. Sci. Rev. 2024. [CrossRef]
- Liu, F.; Ren, Y.; Zhang, L.; Li, X. Impact of Super High-Rise Buildings on Wind Comfort and Safety of Pedestrian Wind Environment: A Case Study in Shanghai, China. Case Stud. Therm. Eng. 2025, 71, 106197. [Google Scholar] [CrossRef]
- Shi, X.; Zhu, Y.; Duan, J.; Shao, R.; Wang, J. Assessment of Pedestrian Wind Environment in Urban Planning Design. Landsc. Urban Plan. 2015, 140, 17–28. [Google Scholar] [CrossRef]
- Chen, L.; Mak, C.M. Integrated Impacts of Building Height and Upstream Building on Pedestrian Comfort around Ideal Lift-Up Buildings in a Weak Wind Environment. Build. Environ. 2021, 200, 107963. [Google Scholar] [CrossRef]
- Du, Y.; Mak, C.M.; Liu, J.; Xia, Q.; Niu, J.; Kwok, K.C.S. Effects of Lift-Up Design on Pedestrian Level Wind Comfort in Different Building Configurations under Three Wind Directions. Build. Environ. 2017, 117, 84–99. [Google Scholar] [CrossRef]
- Nevers, C.; Kubilay, A.; Carmeliet, J.; Derome, D. CFD Simulation of the Wind Flow under Lift-Up Buildings Using a Porous Approach. Build. Environ. 2024, 263, 111867. [Google Scholar] [CrossRef]
- Simões, T.; Estanqueiro, A. A new methodology for urban wind resource assessment. Renew. Energy 2016, 89, 598–605. [Google Scholar] [CrossRef]
- Abohela, I.; Sundararajan, R. Analytical Review of Wind Assessment Tools for Urban Wind Turbine Applications. Atmosphere 2024, 15, 1049. [Google Scholar] [CrossRef]
- Tominaga, Y.; Wang, L.; Zhai, Z.; Stathopoulos, T. Accuracy of CFD simulations in urban aerodynamics and microclimate: Progress and challenges. Build. Environ. 2023, 243, 110723. [Google Scholar] [CrossRef]
- Wijesooriya, K.; Mohotti, D.; Lee, C.-K.; Mendis, P. A technical review of computational fluid dynamics (CFD) applications on wind design of tall buildings and structures: Past, present and future. J. Build. Eng. 2023, 74, 106828. [Google Scholar] [CrossRef]
- Soares, R.C.A.; Silva, P.U.; Bono, G. Estudo Numérico do Conforto Térmico em Arranjo de Edificações com Uso do OpenFOAM. Mecánica Computacional 2024, 41. [Google Scholar] [CrossRef]
- Ozsagiroglu, S.; Camci, M.; Taner, T.; Acikgoz, O.; Dalkilic, A.S.; Wongwises, S. CFD analyses on the thermal comfort conditions of a cooled room: a case study. J. Therm. Anal. Calorim. 2022, 147, 2615–2639. [Google Scholar] [CrossRef]
- Rohdin, P.; Moshfegh, B. Numerical predictions of indoor climate in large industrial premises. A comparison between different k–ε models supported by field measurements. Build. Environ. 2007, 42, 3872–3882. [Google Scholar] [CrossRef]
- Yadav, H.; Roy, A.K. Optimization of twisted high-rise building geometries for wind load mitigation and pedestrian comfort. Asian J. Civ. Eng. 2025, 26, 1595–1620. [Google Scholar] [CrossRef]
- Chu, R.; Wang, K. CFD in Urban Wind Resource Assessments: A Review. Energies 2025, 18, 2626. [Google Scholar] [CrossRef]
- Liu, M.; Wang, X. Three-Dimensional Wind Field Construction and Wind Turbine Siting in an Urban Environment. Fluids 2020, 5, 137. [Google Scholar] [CrossRef]
- Guillas, S.; Glover, N.; Malki-Epshtein, L. Bayesian calibration of the constants of the k–ε turbulence model for a CFD model of street canyon flow. Comput. Methods Appl. Mech. Eng. 2014, 279, 536–553. [Google Scholar] [CrossRef]
- Shirzadi, M.; Mirzaei, P.A.; Naghashzadegan, M. Improvement of k-epsilon turbulence model for CFD simulation of atmospheric boundary layer around a high-rise building using stochastic optimization and Monte Carlo Sampling technique. J. Wind Eng. Ind. Aerodyn. 2017, 171, 366–379. [Google Scholar] [CrossRef]
- Houda, S.; Belarbi, R.; Zemmouri, N. A CFD Comsol model for simulating complex urban flow. Energy Procedia 2017, 139, 373–378. [Google Scholar] [CrossRef]
- Zhao, R.; Liu, S.; Liu, J.; Jiang, N.; Chen, Q. Equation discovery of dynamized coefficients in the k-ε model for urban airflow and airborne contaminant dispersion. Sustain. Cities Soc. 2023, 99, 10488. [Google Scholar] [CrossRef]
- Mohotti, D.; Wijesooriya, K.; Dias-da-Costa, D. Comparison of Reynolds Averaging Navier-Stokes (RANS) turbulent models in predicting wind pressure on tall buildings. J. Build. Eng. 2019, 21, 1–17. [Google Scholar] [CrossRef]
- Toja-Silva, F.; Kono, T.; Peralta, C.; Lopez-Garcia, O.; Chen, J. A review of computational fluid dynamics (CFD) simulations of the wind flow around buildings for urban wind energy exploitation. J. Wind Eng. Ind. Aerodyn. 2018, 180, 66–87. [Google Scholar] [CrossRef]
- Blocken, B.; Stathopoulos, T.; van Beeck, J.P.A.J. Pedestrian-level wind conditions around buildings: Review of wind-tunnel and CFD techniques and their accuracy for wind comfort assessment. Build. Environ. 2016, 100, 50–81. [Google Scholar] [CrossRef]
- Toparlar, Y.; Blocken, B.; Maiheu, B.; van Heijst, G.J.F. A review on the CFD analysis of urban microclimate. Renew. Sustain. Energy Rev. 2017, 80, 1613–1640. [Google Scholar] [CrossRef]
- Ricci, A. Review of OpenFOAM applications in the computational wind engineering: from wind environment to wind structural engineering. Meccanica 2024. [CrossRef]
- Aristodemou, E.; Mottet, L.; Constantinou, A.; Pain, C. Turbulent flows and pollution dispersion around tall buildings using adaptive large eddy simulation (LES). Buildings, 2020, 10, 127. [Google Scholar] [CrossRef]
- Zheng, X.; Yang, J. CFD simulations of wind flow and pollutant dispersion in a street canyon with traffic flow: Comparison between RANS and LES. Sustain. Cities Soc., 2021, 75, 103307. [Google Scholar] [CrossRef]
- Talwar, T.; Yuan, C. Impact of natural urban terrain on the pedestrian wind environment in neighborhoods: A CFD study with both wind and buoyancy-driven scenarios. Build. Environ., 2024, 261, 111746. [Google Scholar] [CrossRef]
- Acarer, S.; Uyulan, Ç.; Karadeniz, Z.H. Optimization of radial inflow wind turbines for urban wind energy harvesting. Energy 2020, 202, 117772. [Google Scholar] [CrossRef]
- Juan, Y.-H.; Wen, C.-Y.; Chen, W.-Y.; Yang, A.-S. Numerical assessments of wind power potential and installation arrangements in realistic highly urbanized areas. Renew. Sustain. Energy Rev. 2021, 135, 110165. [Google Scholar] [CrossRef]
- Juan, Y.-H.; Wen, C.-Y.; Li, Z.; Yang, A.-S. Impacts of urban morphology on improving urban wind energy potential for generic high-rise building arrays. Appl. Energy, 2021, 299, 117304. [Google Scholar] [CrossRef]
- Mirzaei, P.A. CFD modeling of micro and urban climates: Problems to be solved in the new decade. Sustain. Cities Soc., 2021, 69, 102839. [Google Scholar] [CrossRef]
- Li, J.; Guo, F.; Chen, H. A study on urban block design strategies for improving pedestrian-level wind conditions: CFD-based optimization and generative adversarial networks. Energy Build., 2024, 304, 113863. [Google Scholar] [CrossRef]
- Mattar, S.J.; Kavian Nezhad, M.R.; Versteege, M.; Lange, C.F.; Fleck, B.A. Validation process for rooftop wind regime CFD model in complex urban environment using an experimental measurement campaign. Energies, 2021, 14, 2497. [Google Scholar] [CrossRef]
- Vita, G.; Salvadori, S.; Misul, D.A.; Hemida, H. Effects of inflow condition on RANS and LES predictions of the flow around a high-rise building. Fluids, 2020, 5, 233. [Google Scholar] [CrossRef]
- Associação Brasileira de Normas Técnicas. NBR 6123: Forças Devidas ao Vento em Edificações; ABNT: Rio de Janeiro, Brazil, 2023. [Google Scholar]
- Blessmann, J. Ação do Vento em Telhados, 2nd ed.; Editora da UFRGS: Porto Alegre, Brasil, 2009. [Google Scholar]
- Du, Y.; Mak, C.M.; Kwok, K.; Tse, K.-T.; Lee, T.-C.; Ai, Z.; Liu, J.; Niu, J. New criteria for assessing low wind environment at pedestrian level in Hong Kong. Build. Environ., 2017, 123, 23–36. [Google Scholar] [CrossRef]
- Chen, L.; Mak, C.M. Numerical evaluation of pedestrian-level wind comfort around “lift-up” buildings with various unconventional configurations. Build. Environ., 2021, 188, 107429. [Google Scholar] [CrossRef]
- Chen, L.; Mak, C.M. Integrated impacts of building height and upstream building on pedestrian comfort around ideal lift-up buildings in a weak wind environment. Build. Environ., 2021, 200, 107963. [Google Scholar] [CrossRef]
- Li, W.; Mak, C.M.; Cai, C.; Fu, Y.; Tse, K.T.; Niu, J. Wind tunnel measurement of pedestrian-level gust wind flow and comfort around irregular lift-up buildings within simplified urban arrays. Build. Environ., 2024, 256, 111487. [Google Scholar] [CrossRef]
- Silva, P.U.d.; Bono, G.; Greco, M. Application of Topology Optimization as a Tool for the Design of Bracing Systems of High-Rise Buildings. Buildings 2025, 15, 1180. [Google Scholar] [CrossRef]
- Launder, B.E.; Spalding, D.B. The numerical computation of turbulent flows. Comput. Methods Appl. Mech. Eng. 1974, 3, 269–289. [Google Scholar] [CrossRef]
- Launder, B.E.; Reece, G.J.; Rodi, W. Progress in the development of a Reynolds-stress turbulence closure. J. Fluid Mech. 1975, 68, 537–566. [Google Scholar] [CrossRef]
- El Tahry, S.H. k-epsilon equation for compressible reciprocating engine flows. J. Energy 1983, 7, 345–353. [Google Scholar] [CrossRef]
- Franke, J.; Hirsch, C.; Jensen, A.G.; Krüs, H.W.; Schatzmann, M.; Westbury, P.S.; Miles, S.D.; Wisse, J.A.; Wright, N.G. Recommendations on the use of CFD in wind engineering. In: Proceedings of the International Conference on Urban Wind Engineering and Building Aerodynamics, Sint Genesius Rode, Belgium, 2004.
- Tominaga, Y.; Mochida, A.; Yoshie, R.; Kataoka, H.; Nozu, T.; Masaru, Y.; Shirasawa, T. AIJ guidelines for practical applications of CFD to pedestrian wind environment around buildings. J. Wind Eng. Ind. Aerodyn. 2008, 96, 1749–1761. [Google Scholar] [CrossRef]
- Silva, P.U.d. Emprego de otimização topológica e DFC no projeto de sistemas de contraventamento em ambientes urbanos. Master’s Thesis, Universidade Federal de Pernambuco, Caruaru, 2022. Available online: https://repositorio.ufpe.br/handle/123456789/47230 (accessed on 4 June 2025).
- New Frontier of Education and Research in Wind Engineering Proposed by School of Architecture and Wind Engineering at the Tokyo Polytechnic University. Available online: http://www.wind.arch.t-kougei.ac.jp/system/eng/contents/code/tpu (accessed on 9 June 2025).
Figure 1.
Urban discomfort: (a) profile of a typical heat island effect in England; (b) Pollutant dispersion in a street canyon; (c) Acoustic contamination of densely built areas.
Figure 1.
Urban discomfort: (a) profile of a typical heat island effect in England; (b) Pollutant dispersion in a street canyon; (c) Acoustic contamination of densely built areas.
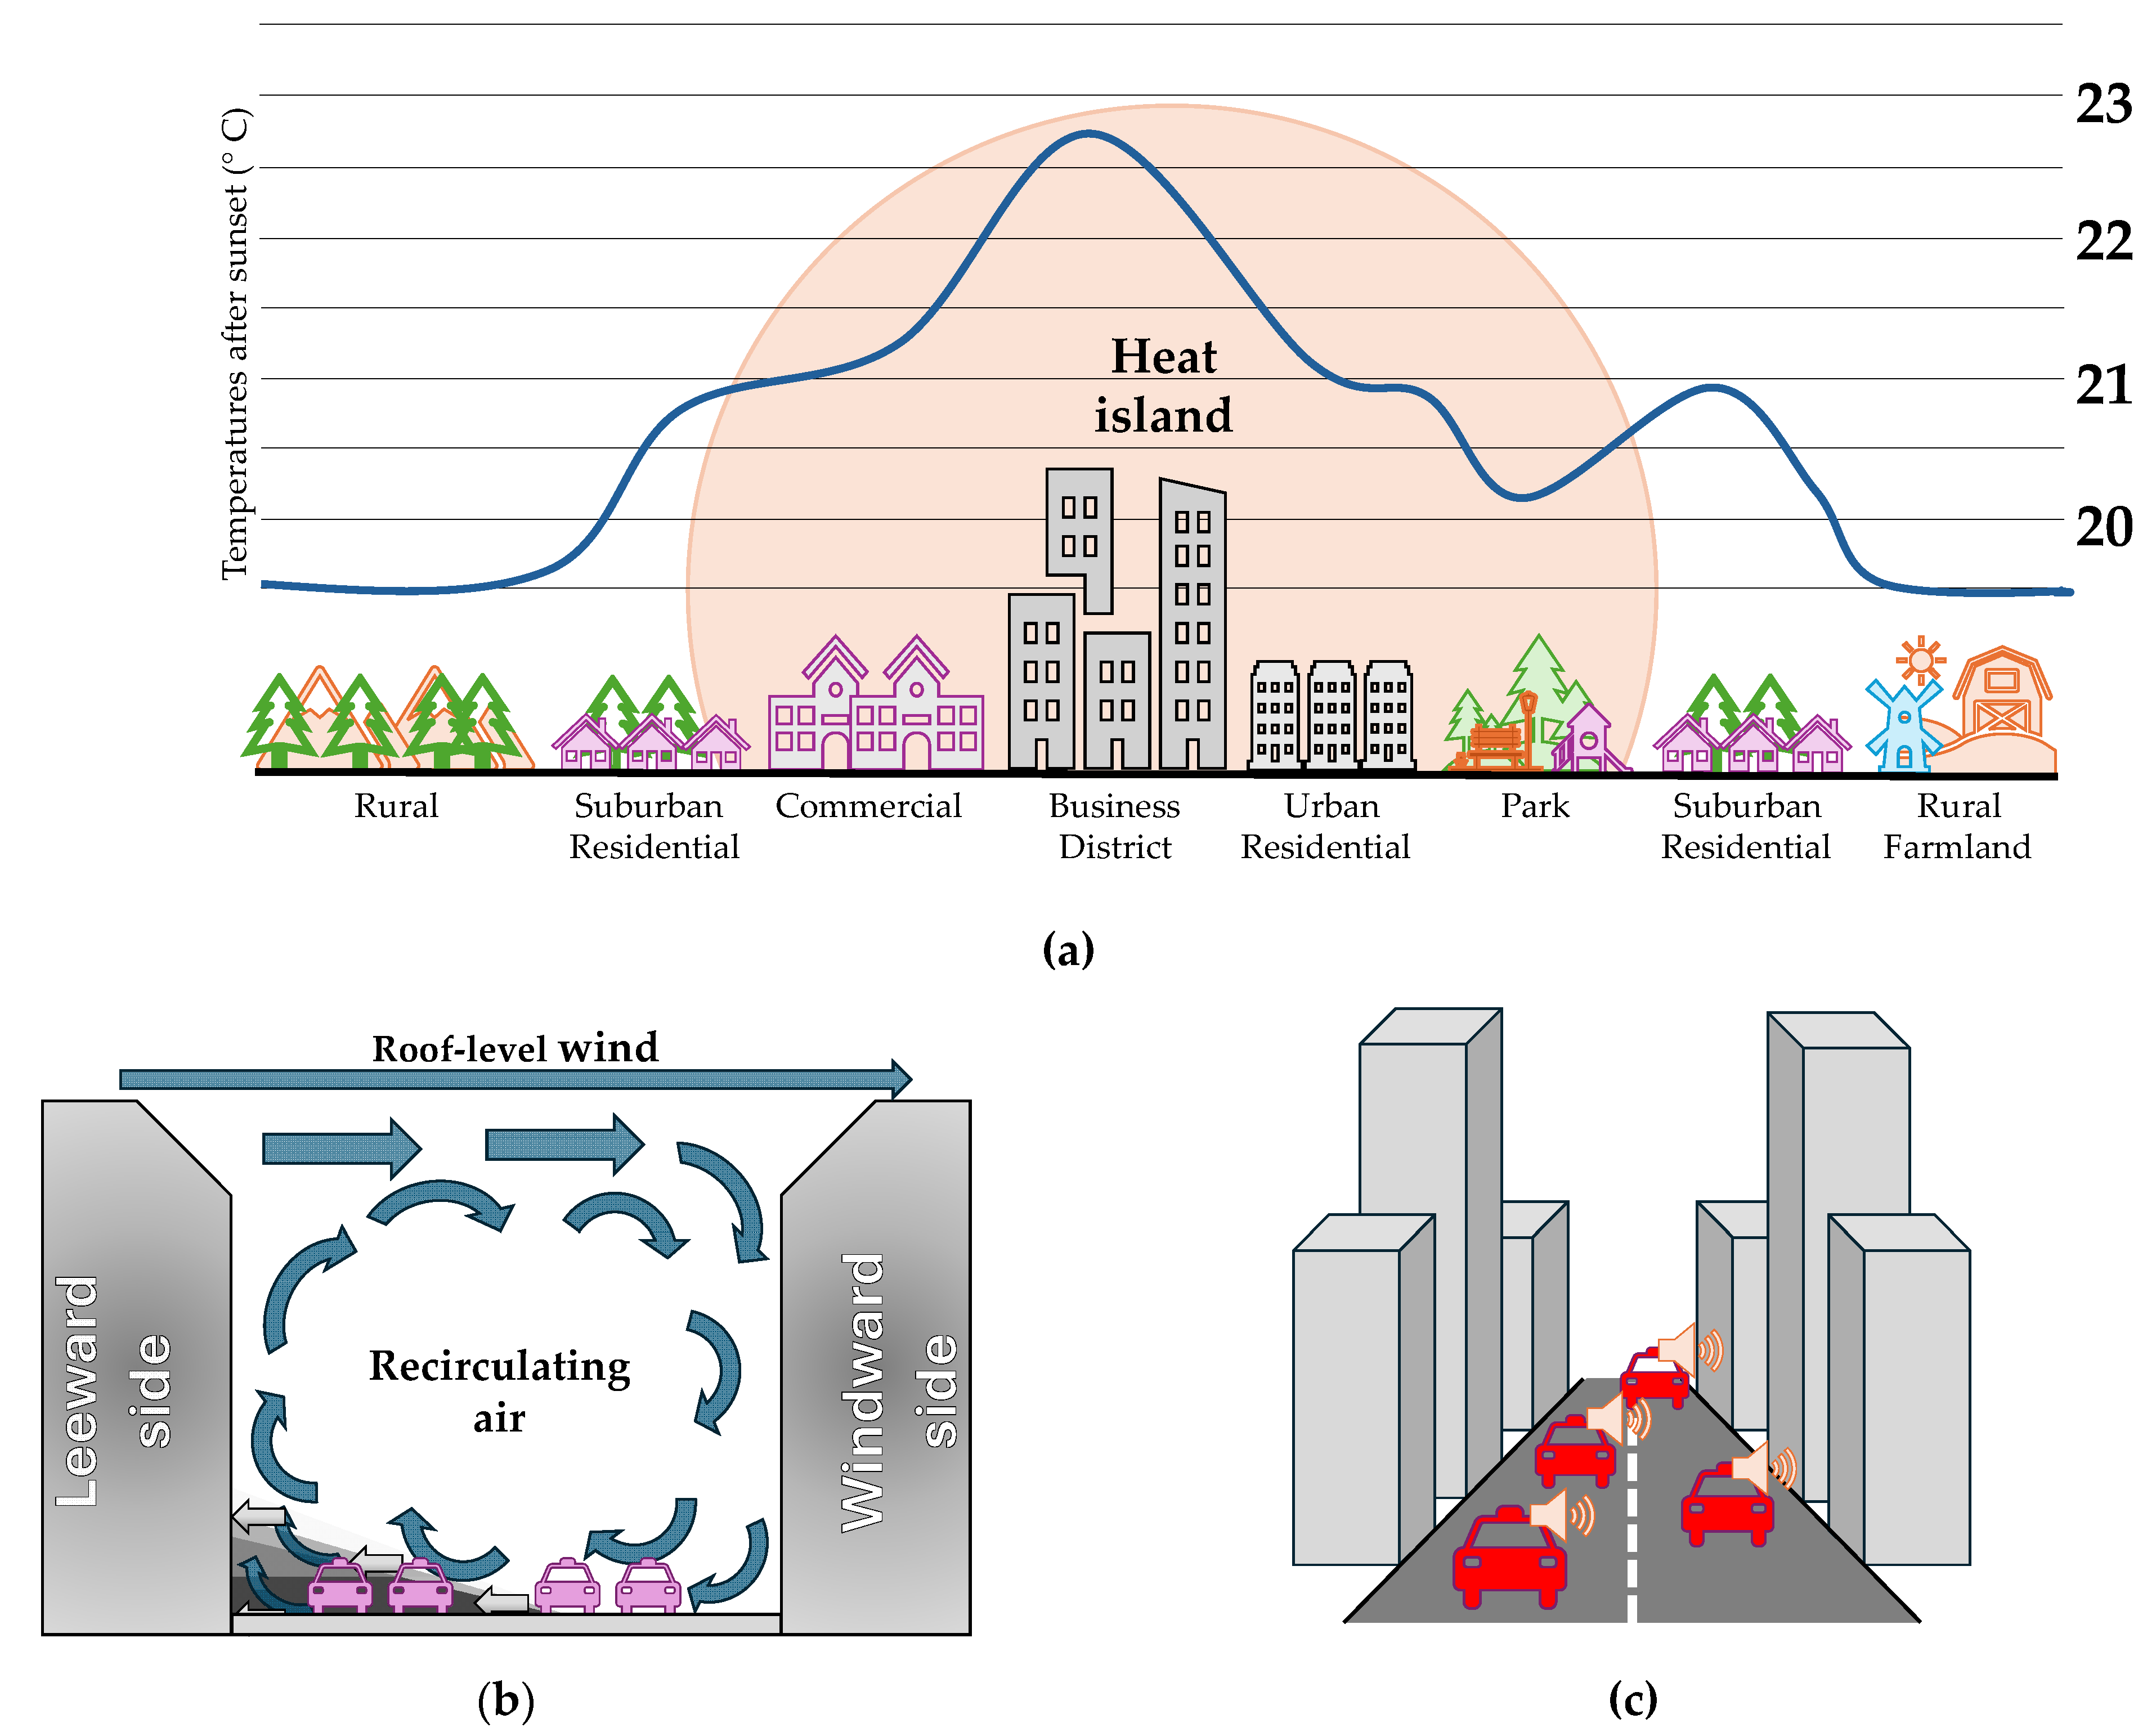
Figure 2.
Simulation domain.
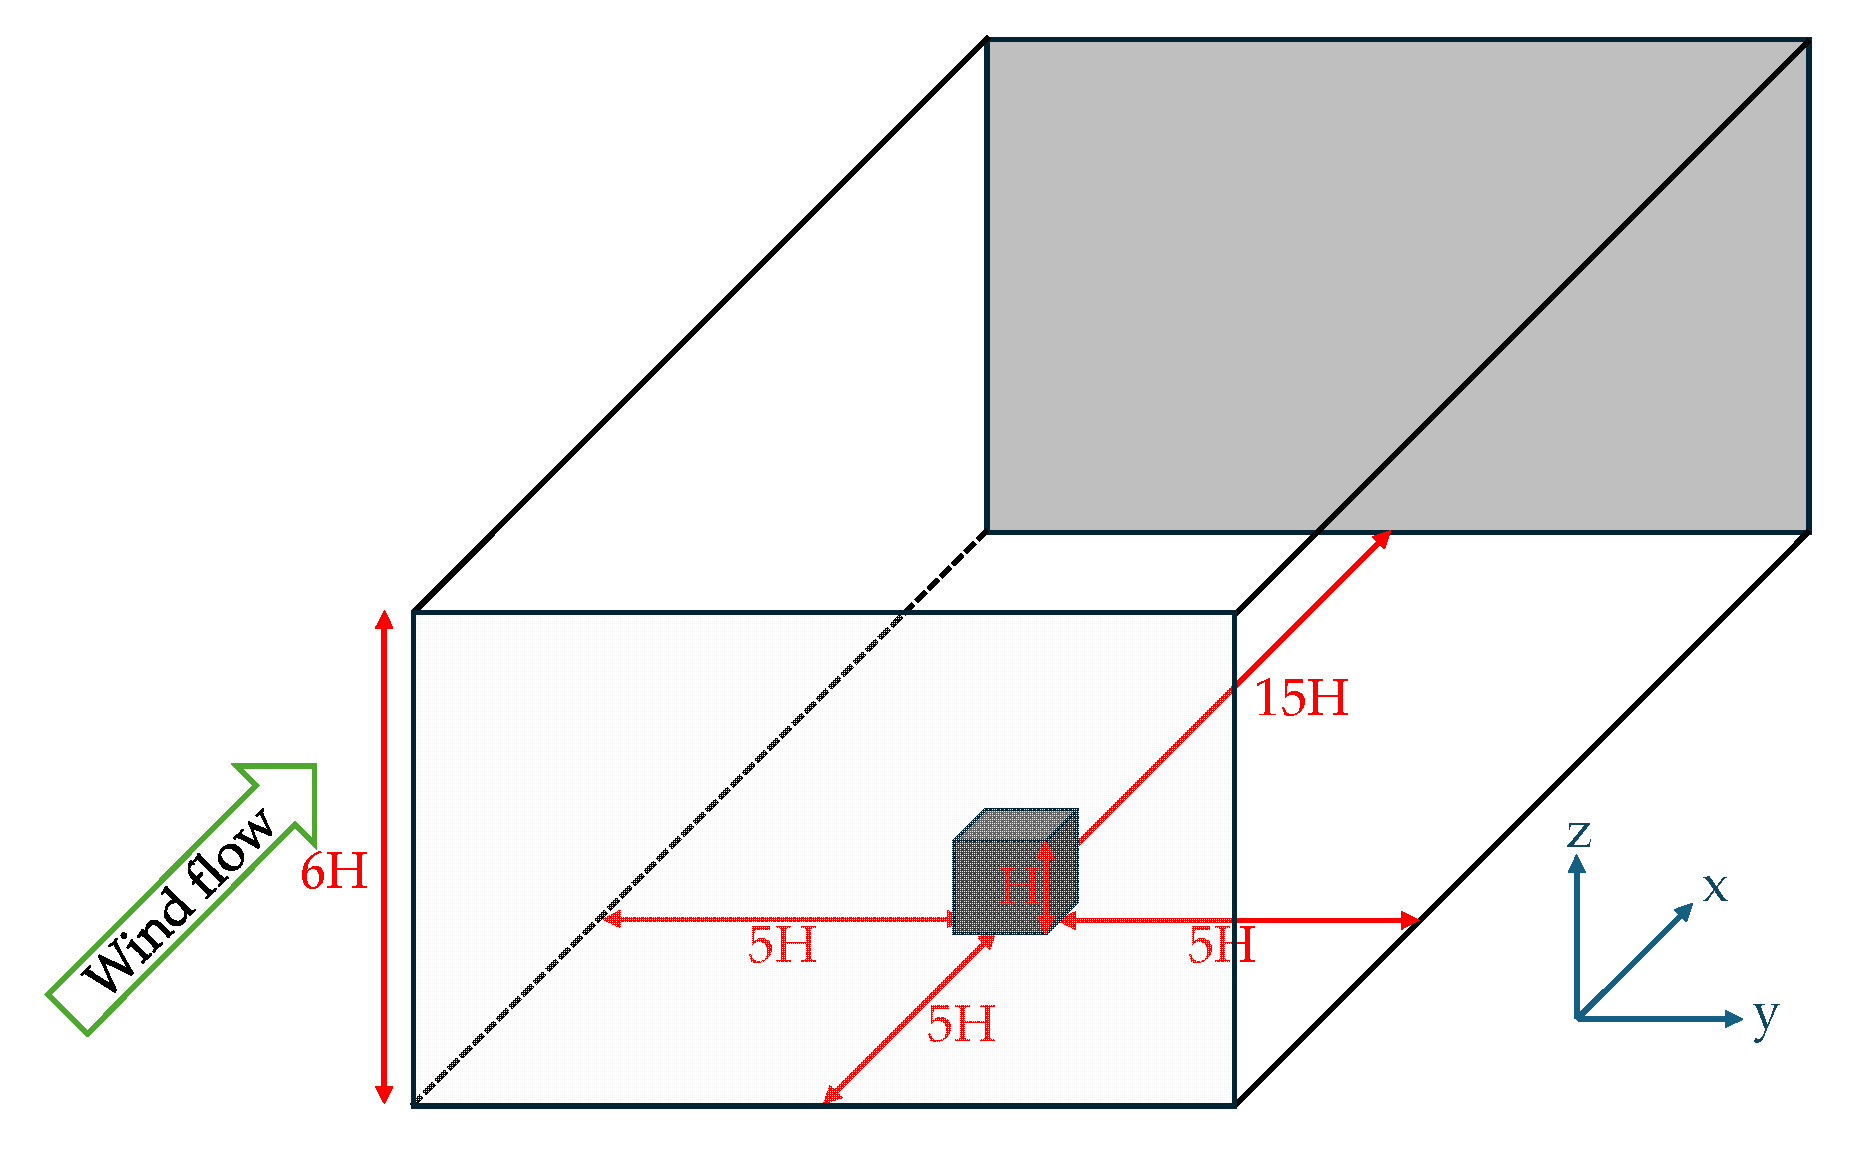
Figure 3.
Simulation cases: (a) perspective view and (b) top view.
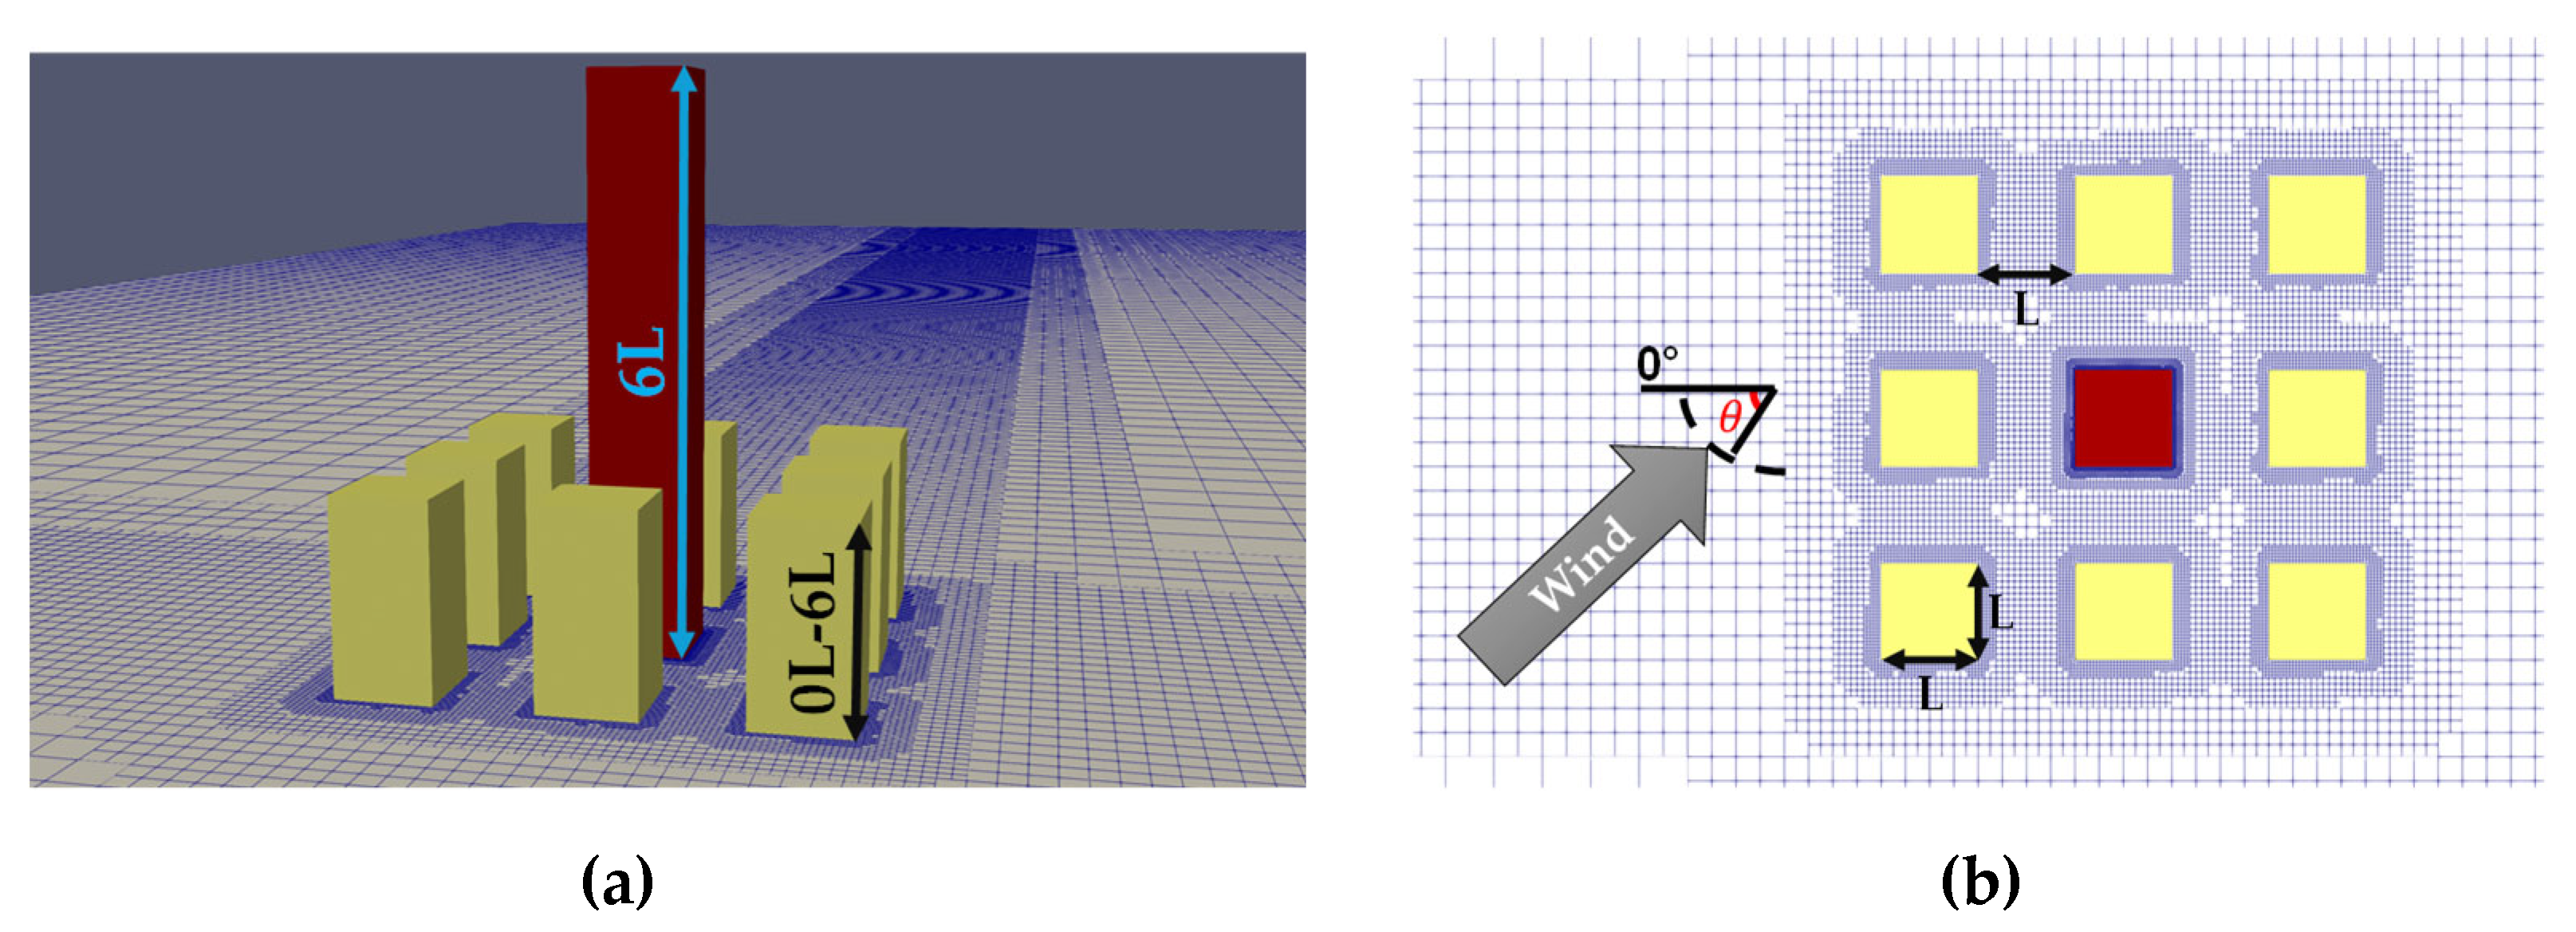
Figure 4.
MVR assessment lines.
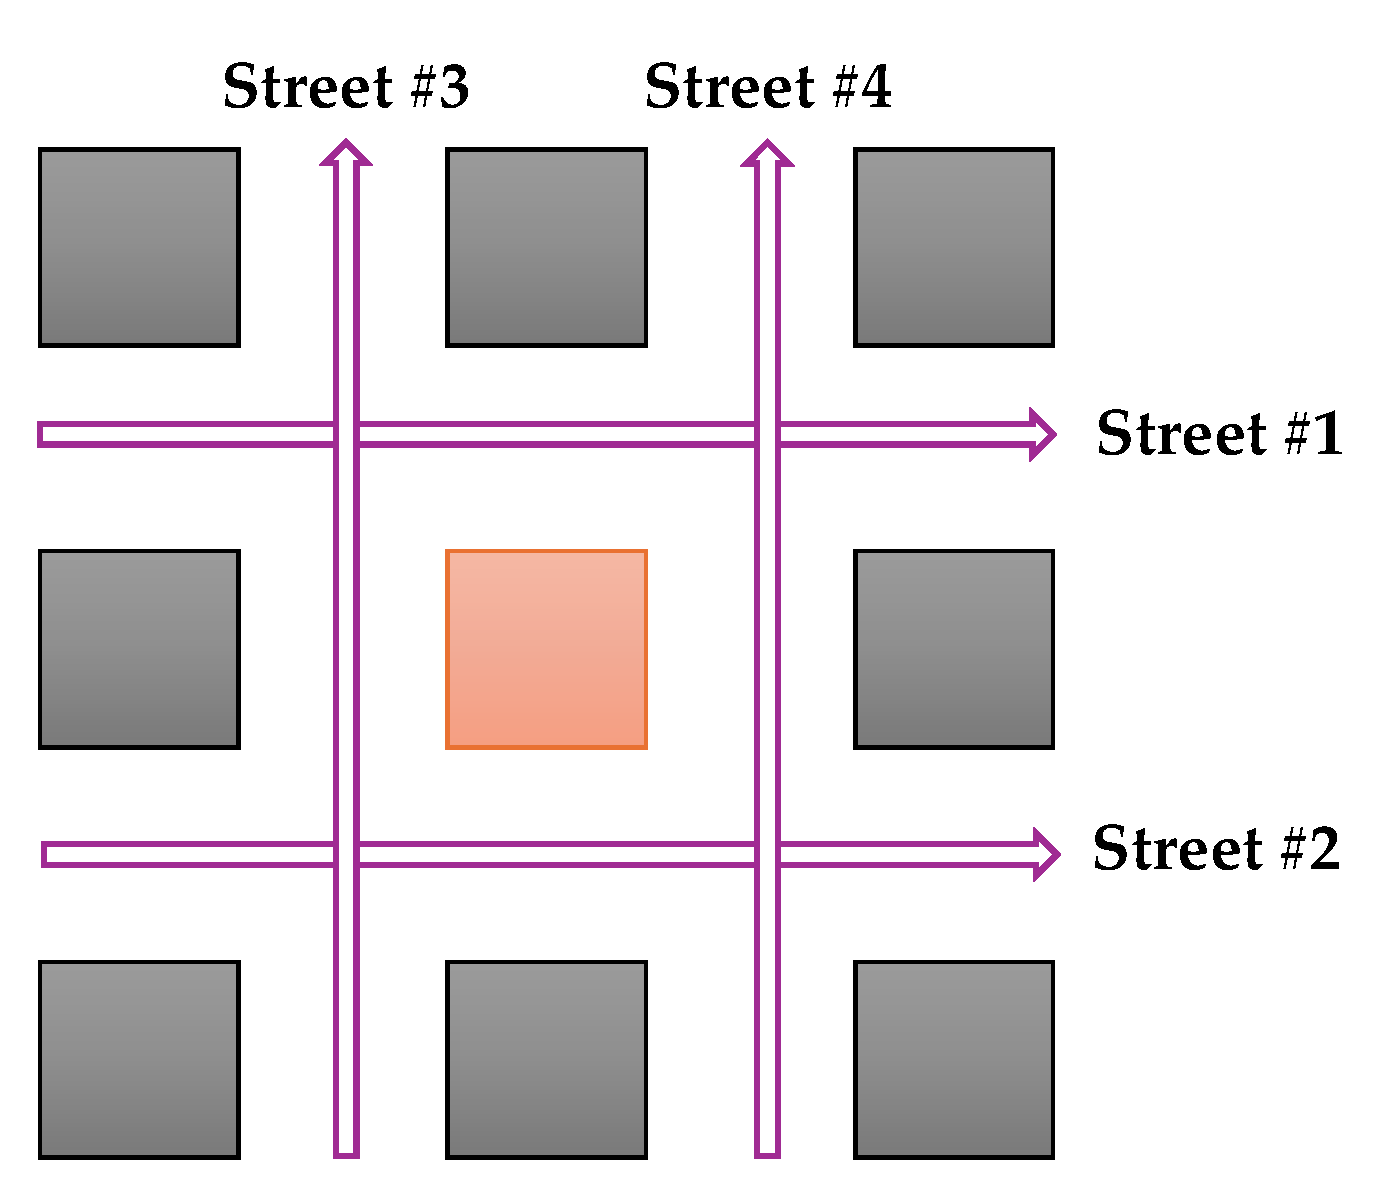
Figure 5.
Validation case: side view with wind incidence angle at 0°.
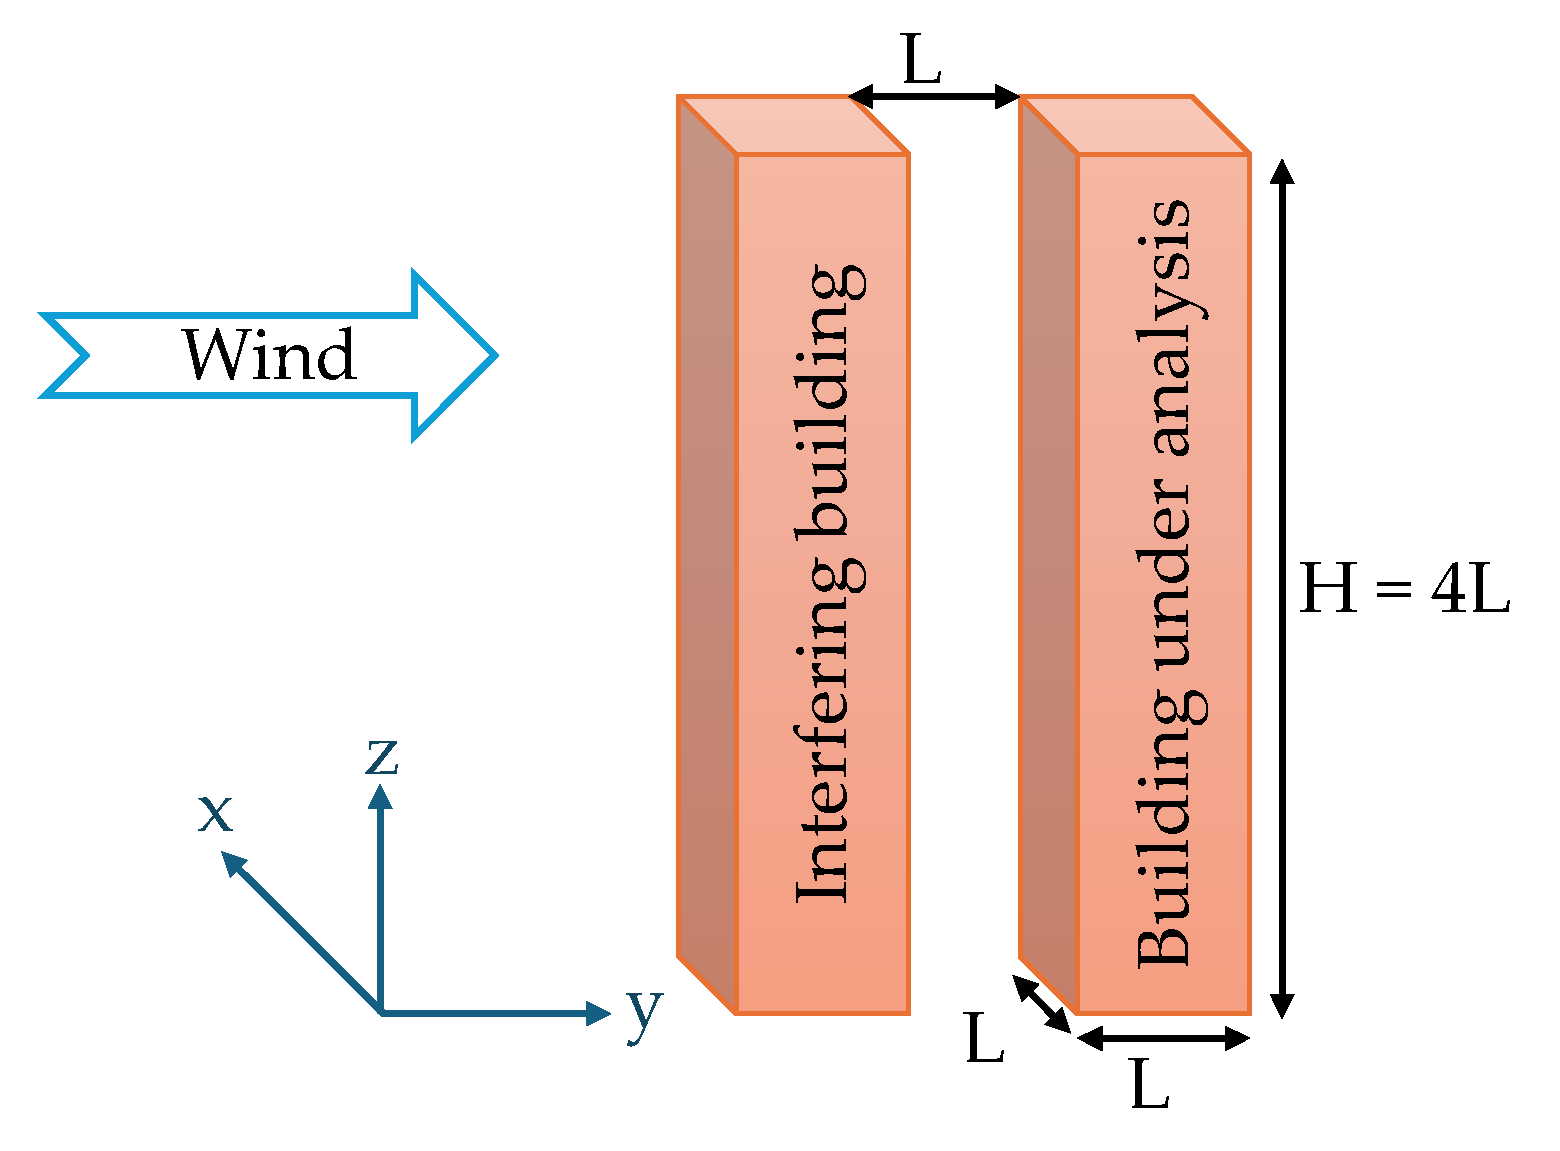
Figure 6.
Numerical data against experimental data scatter plot: (a) M1, (b) M2 and (c) M3 meshes.
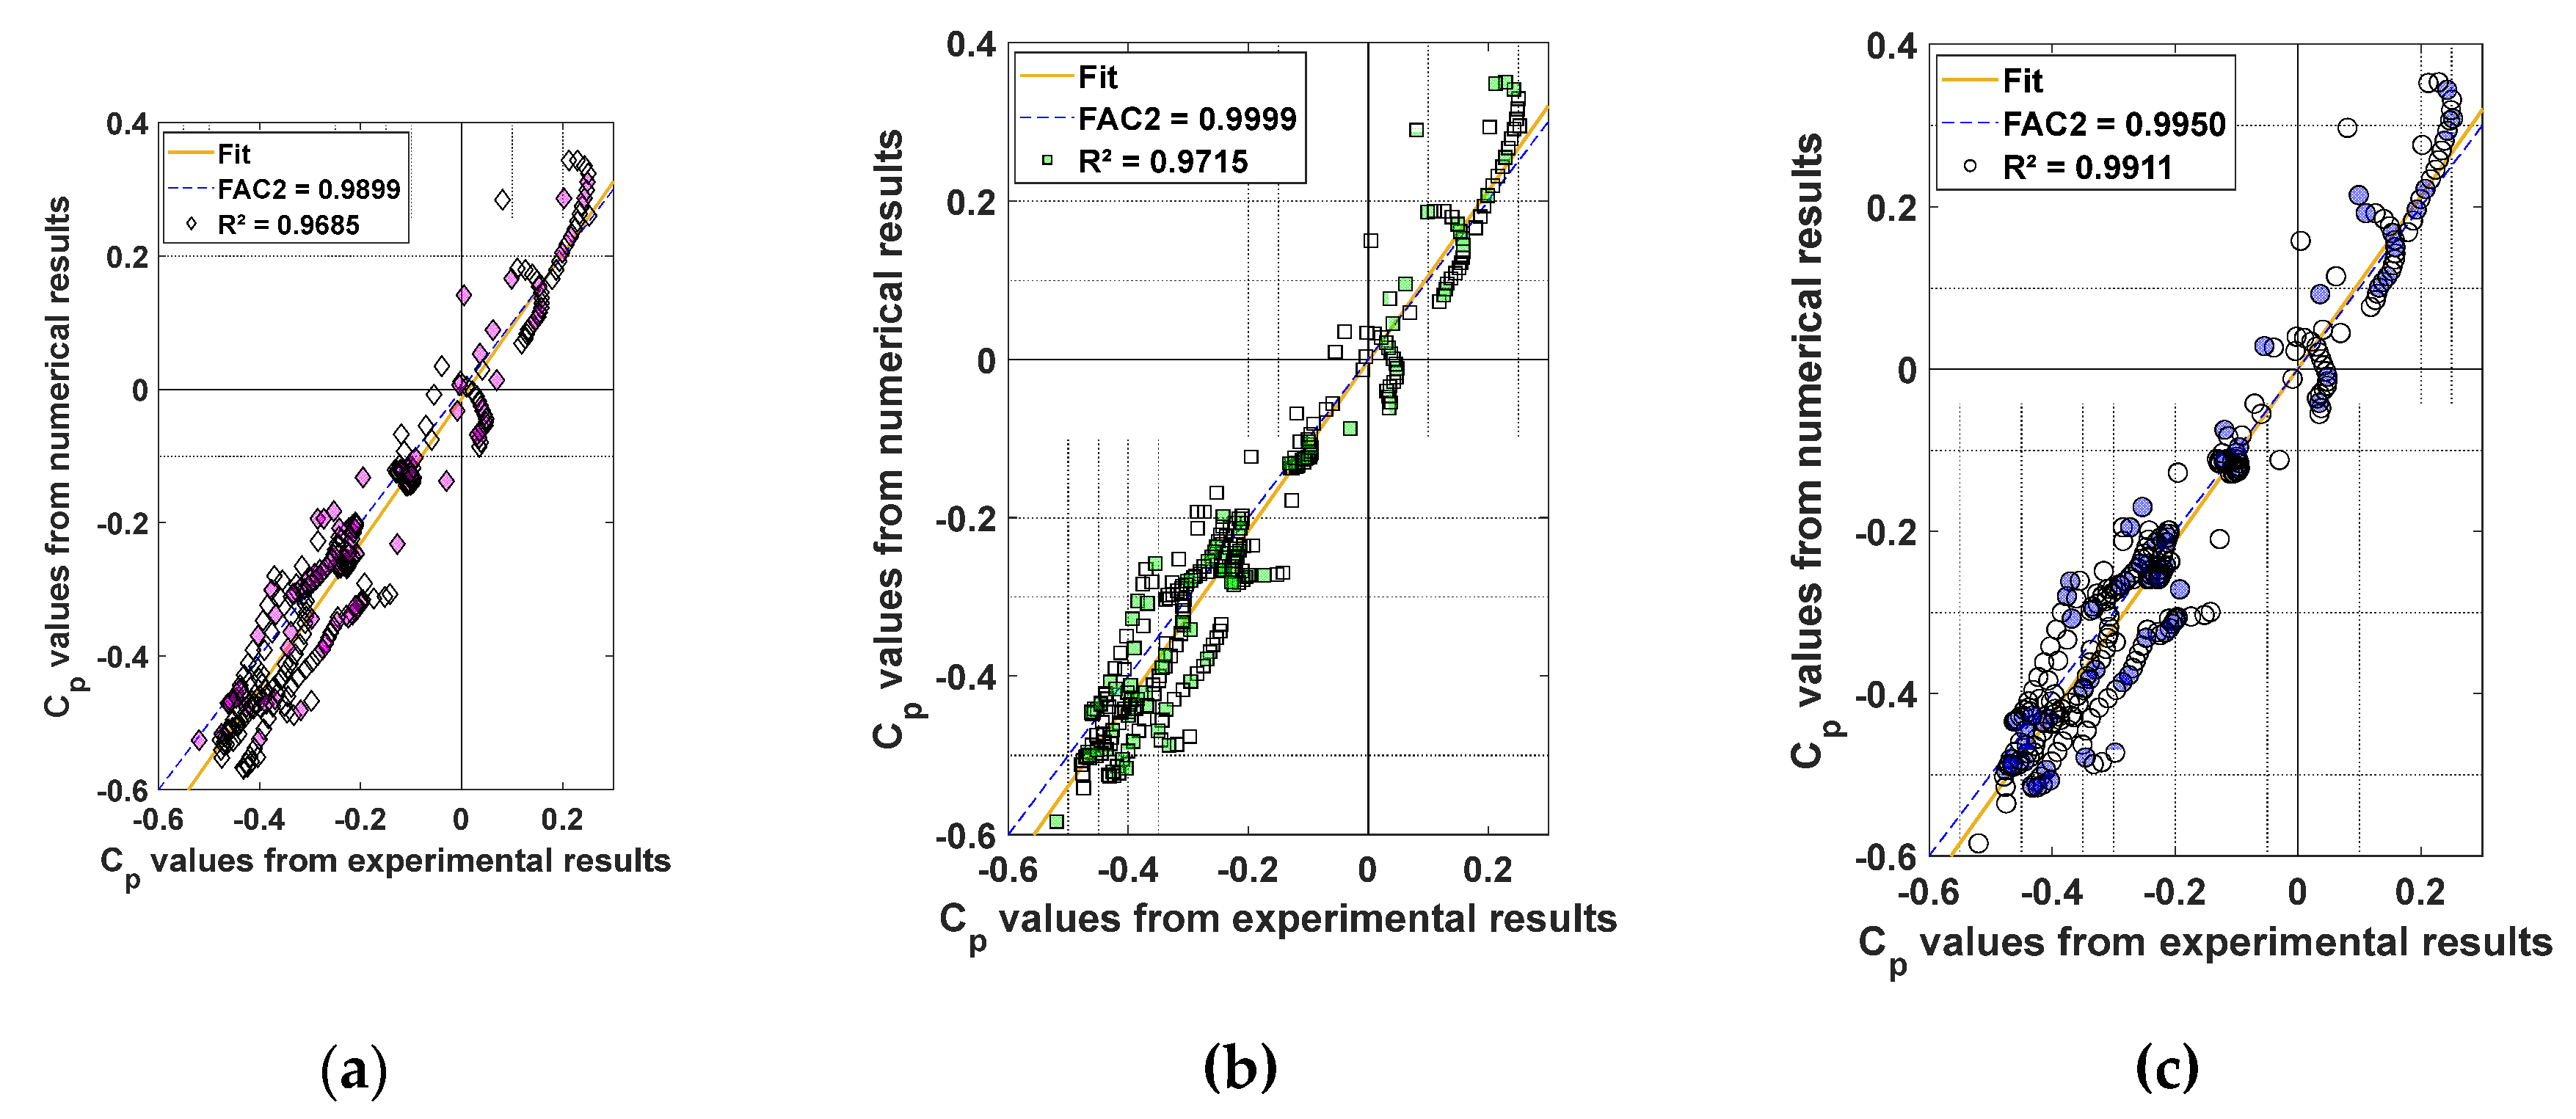
Figure 7.
Mean MVR values for (a) Street #1, (b) Street #2, (c) Street #3 and (d) Street #4.
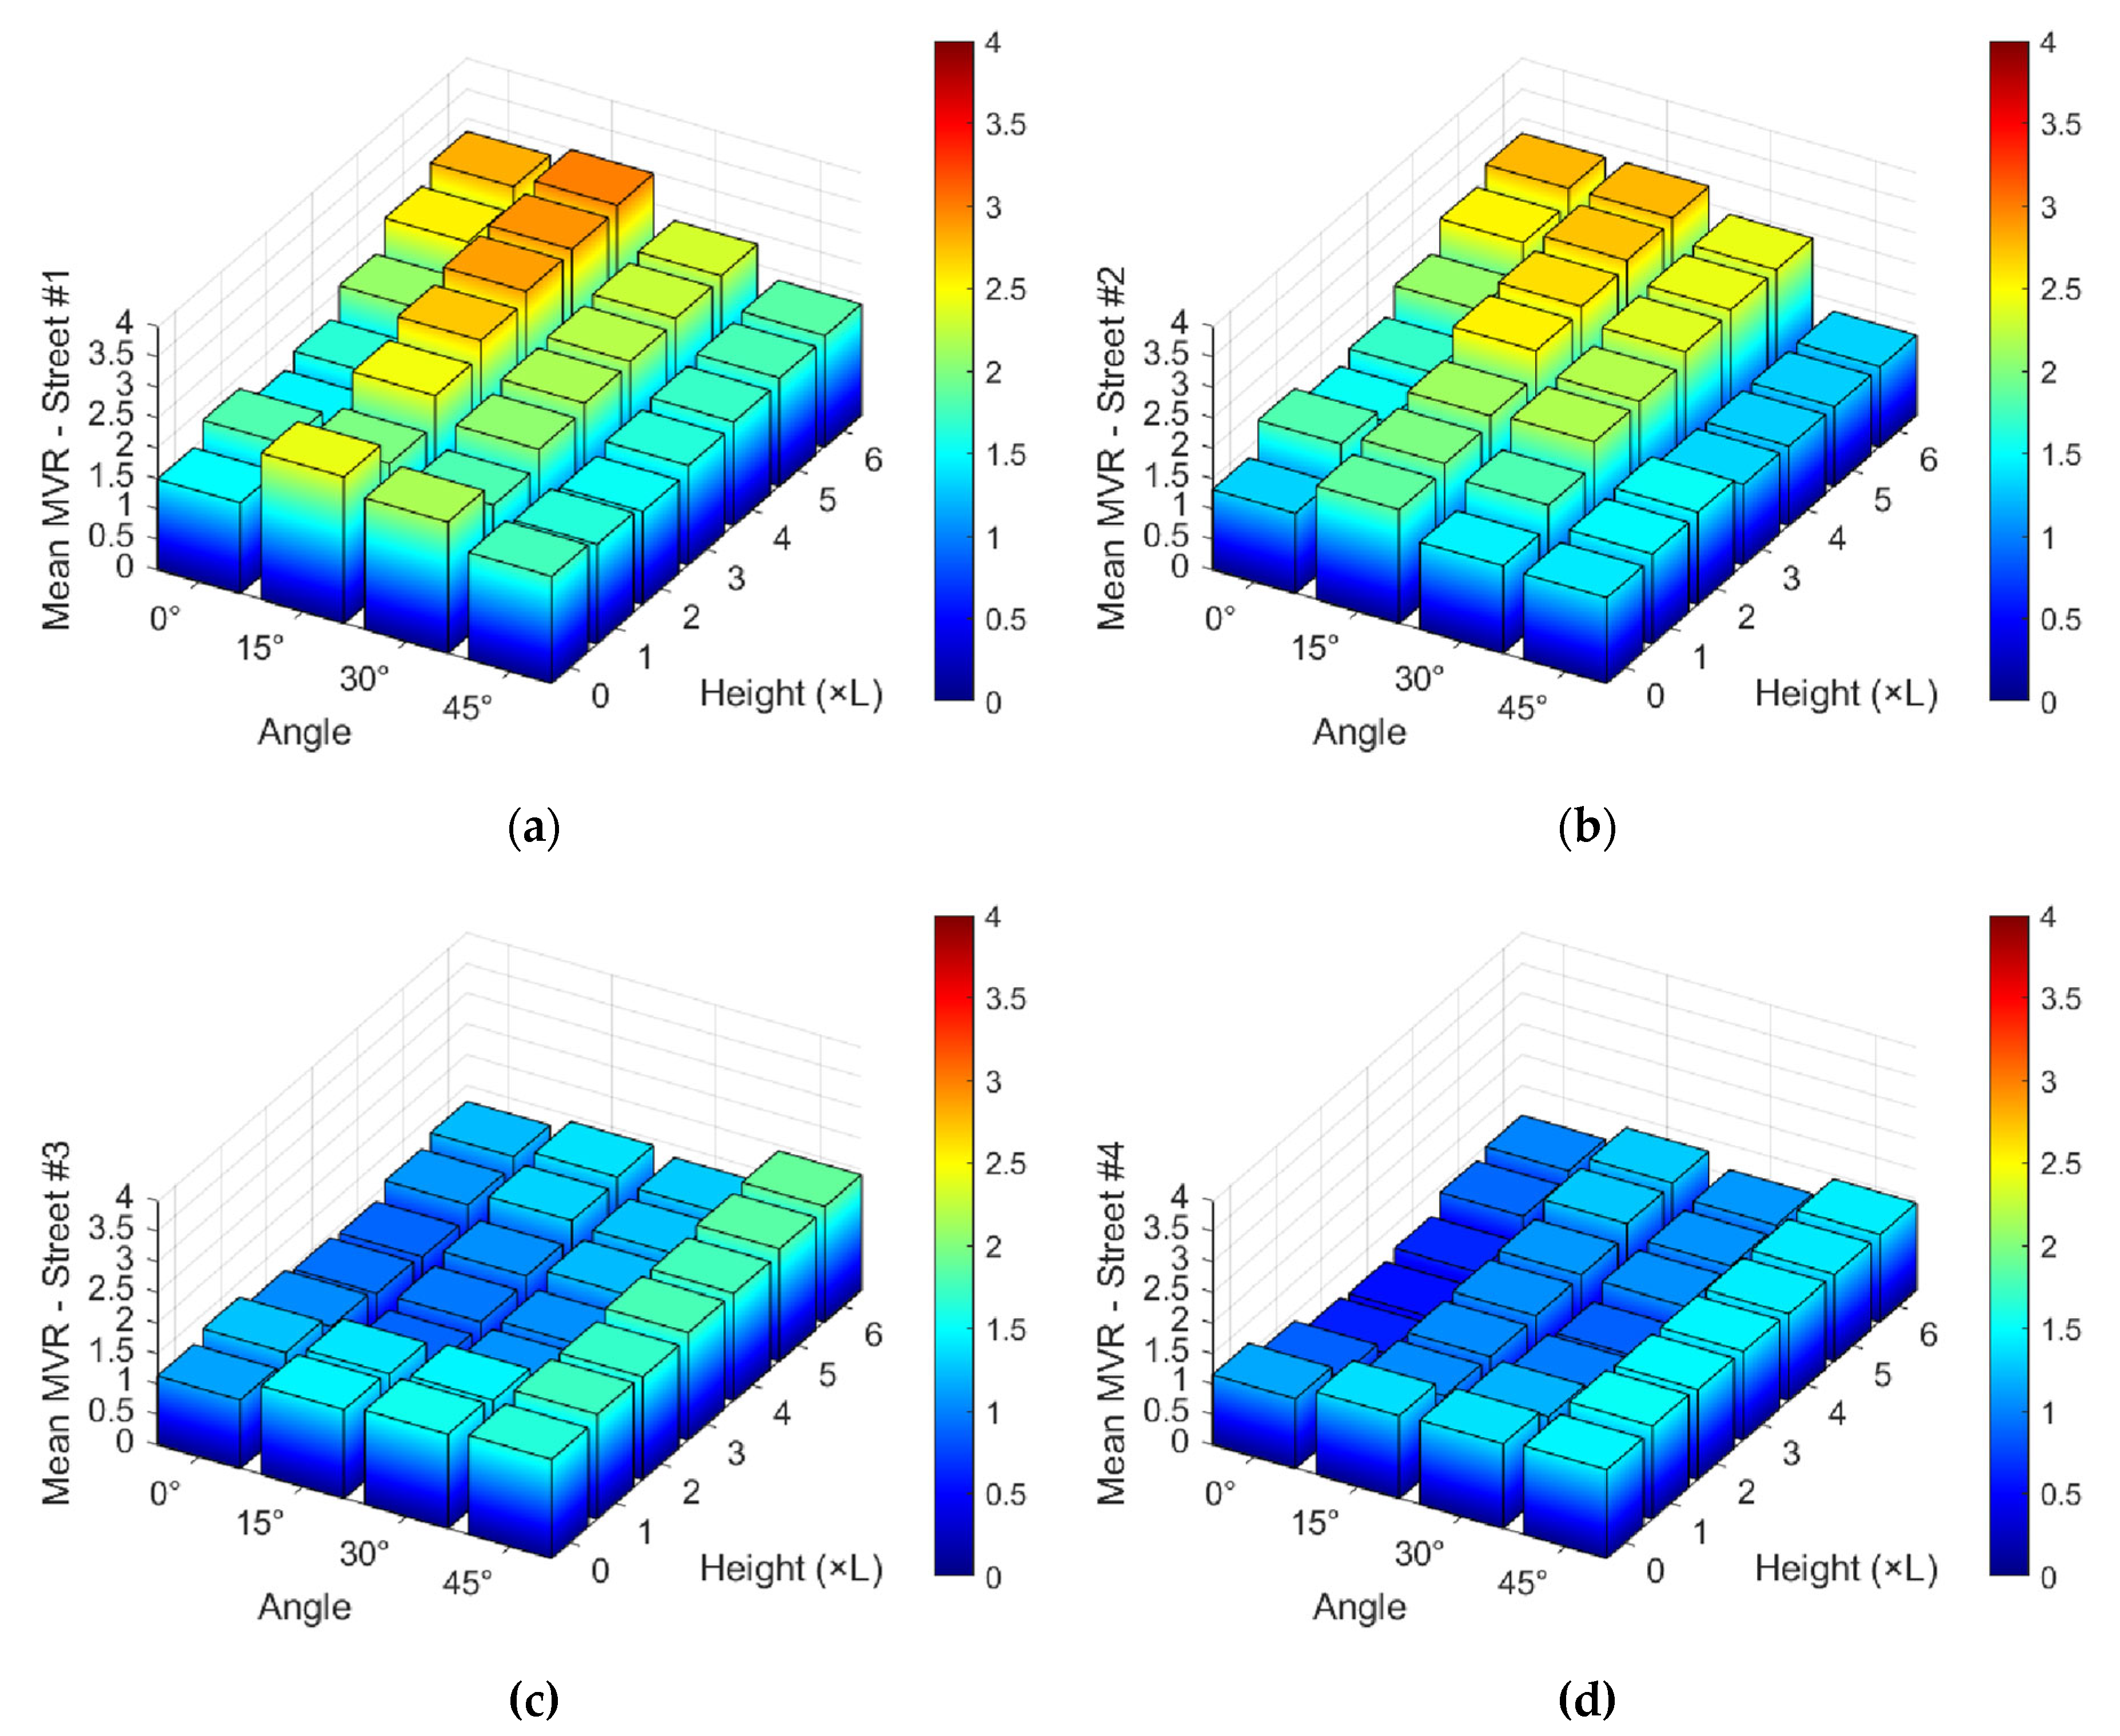
Figure 8.
Max MVR values for (a) Street #1, (b) Street #2, (c) Street #3 and (d) Street #4.
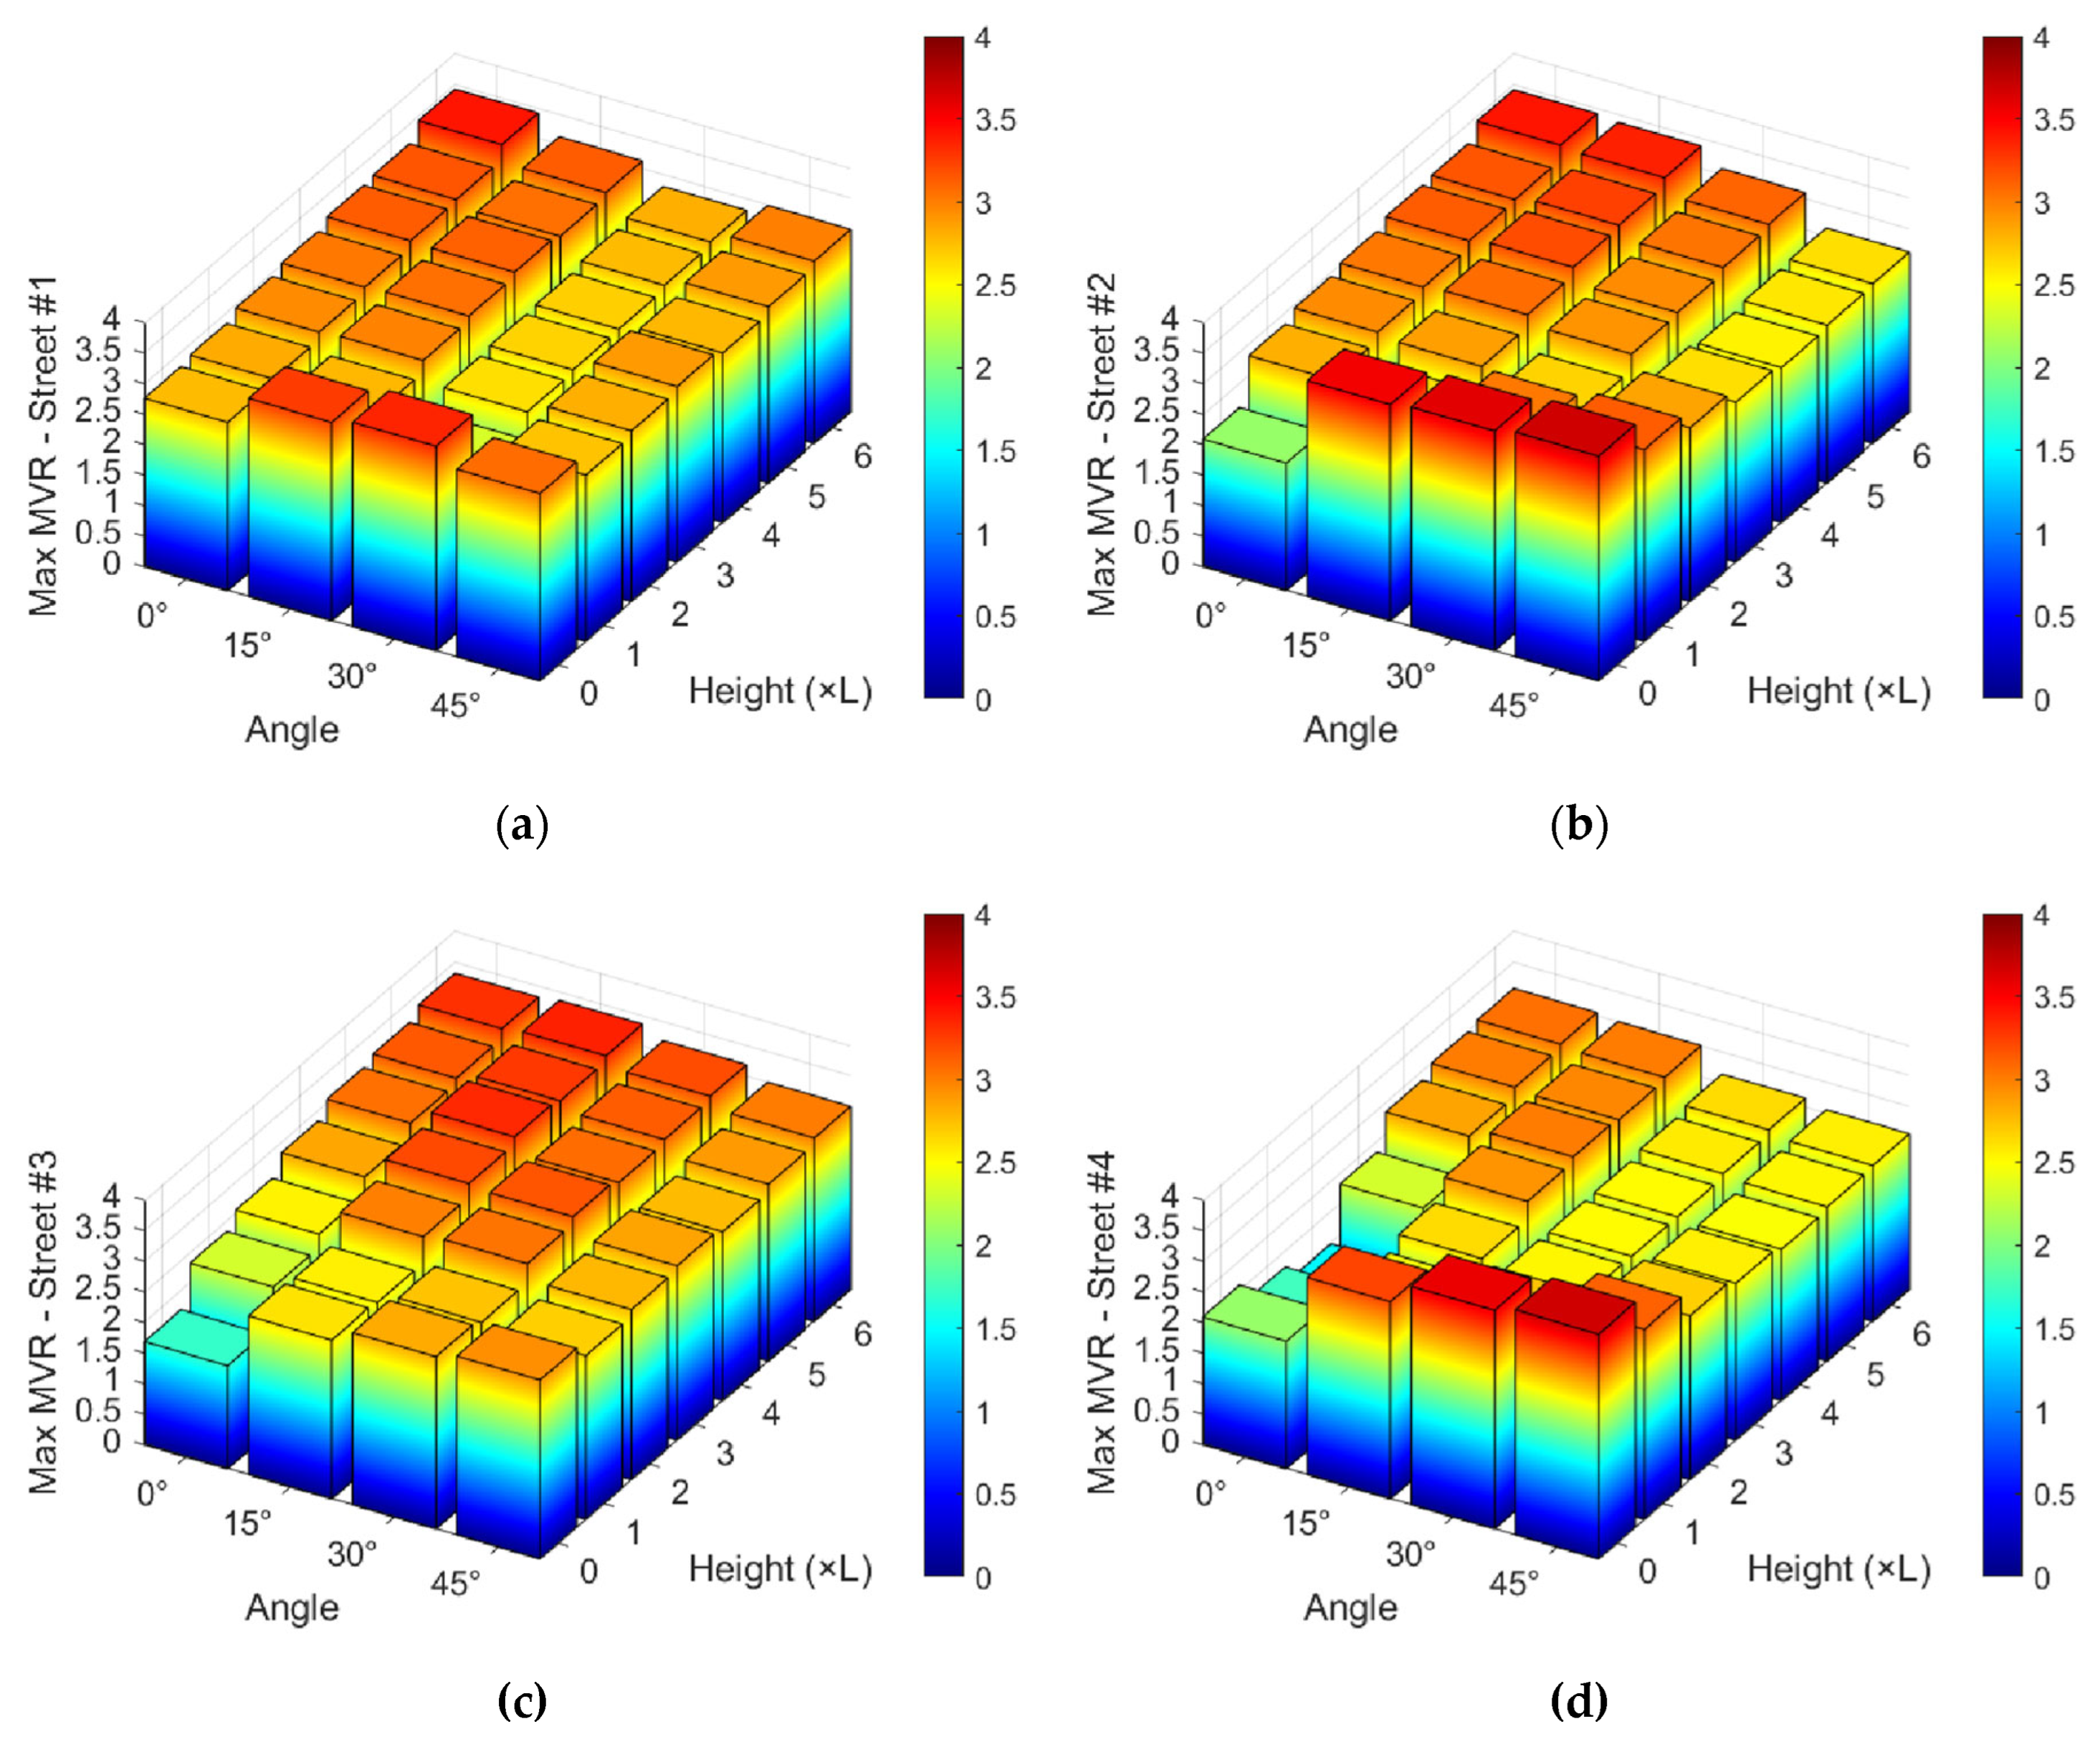
Figure 9.
Min MVR values for (a) Street #1, (b) Street #2, (c) Street #3 and (d) Street #4.
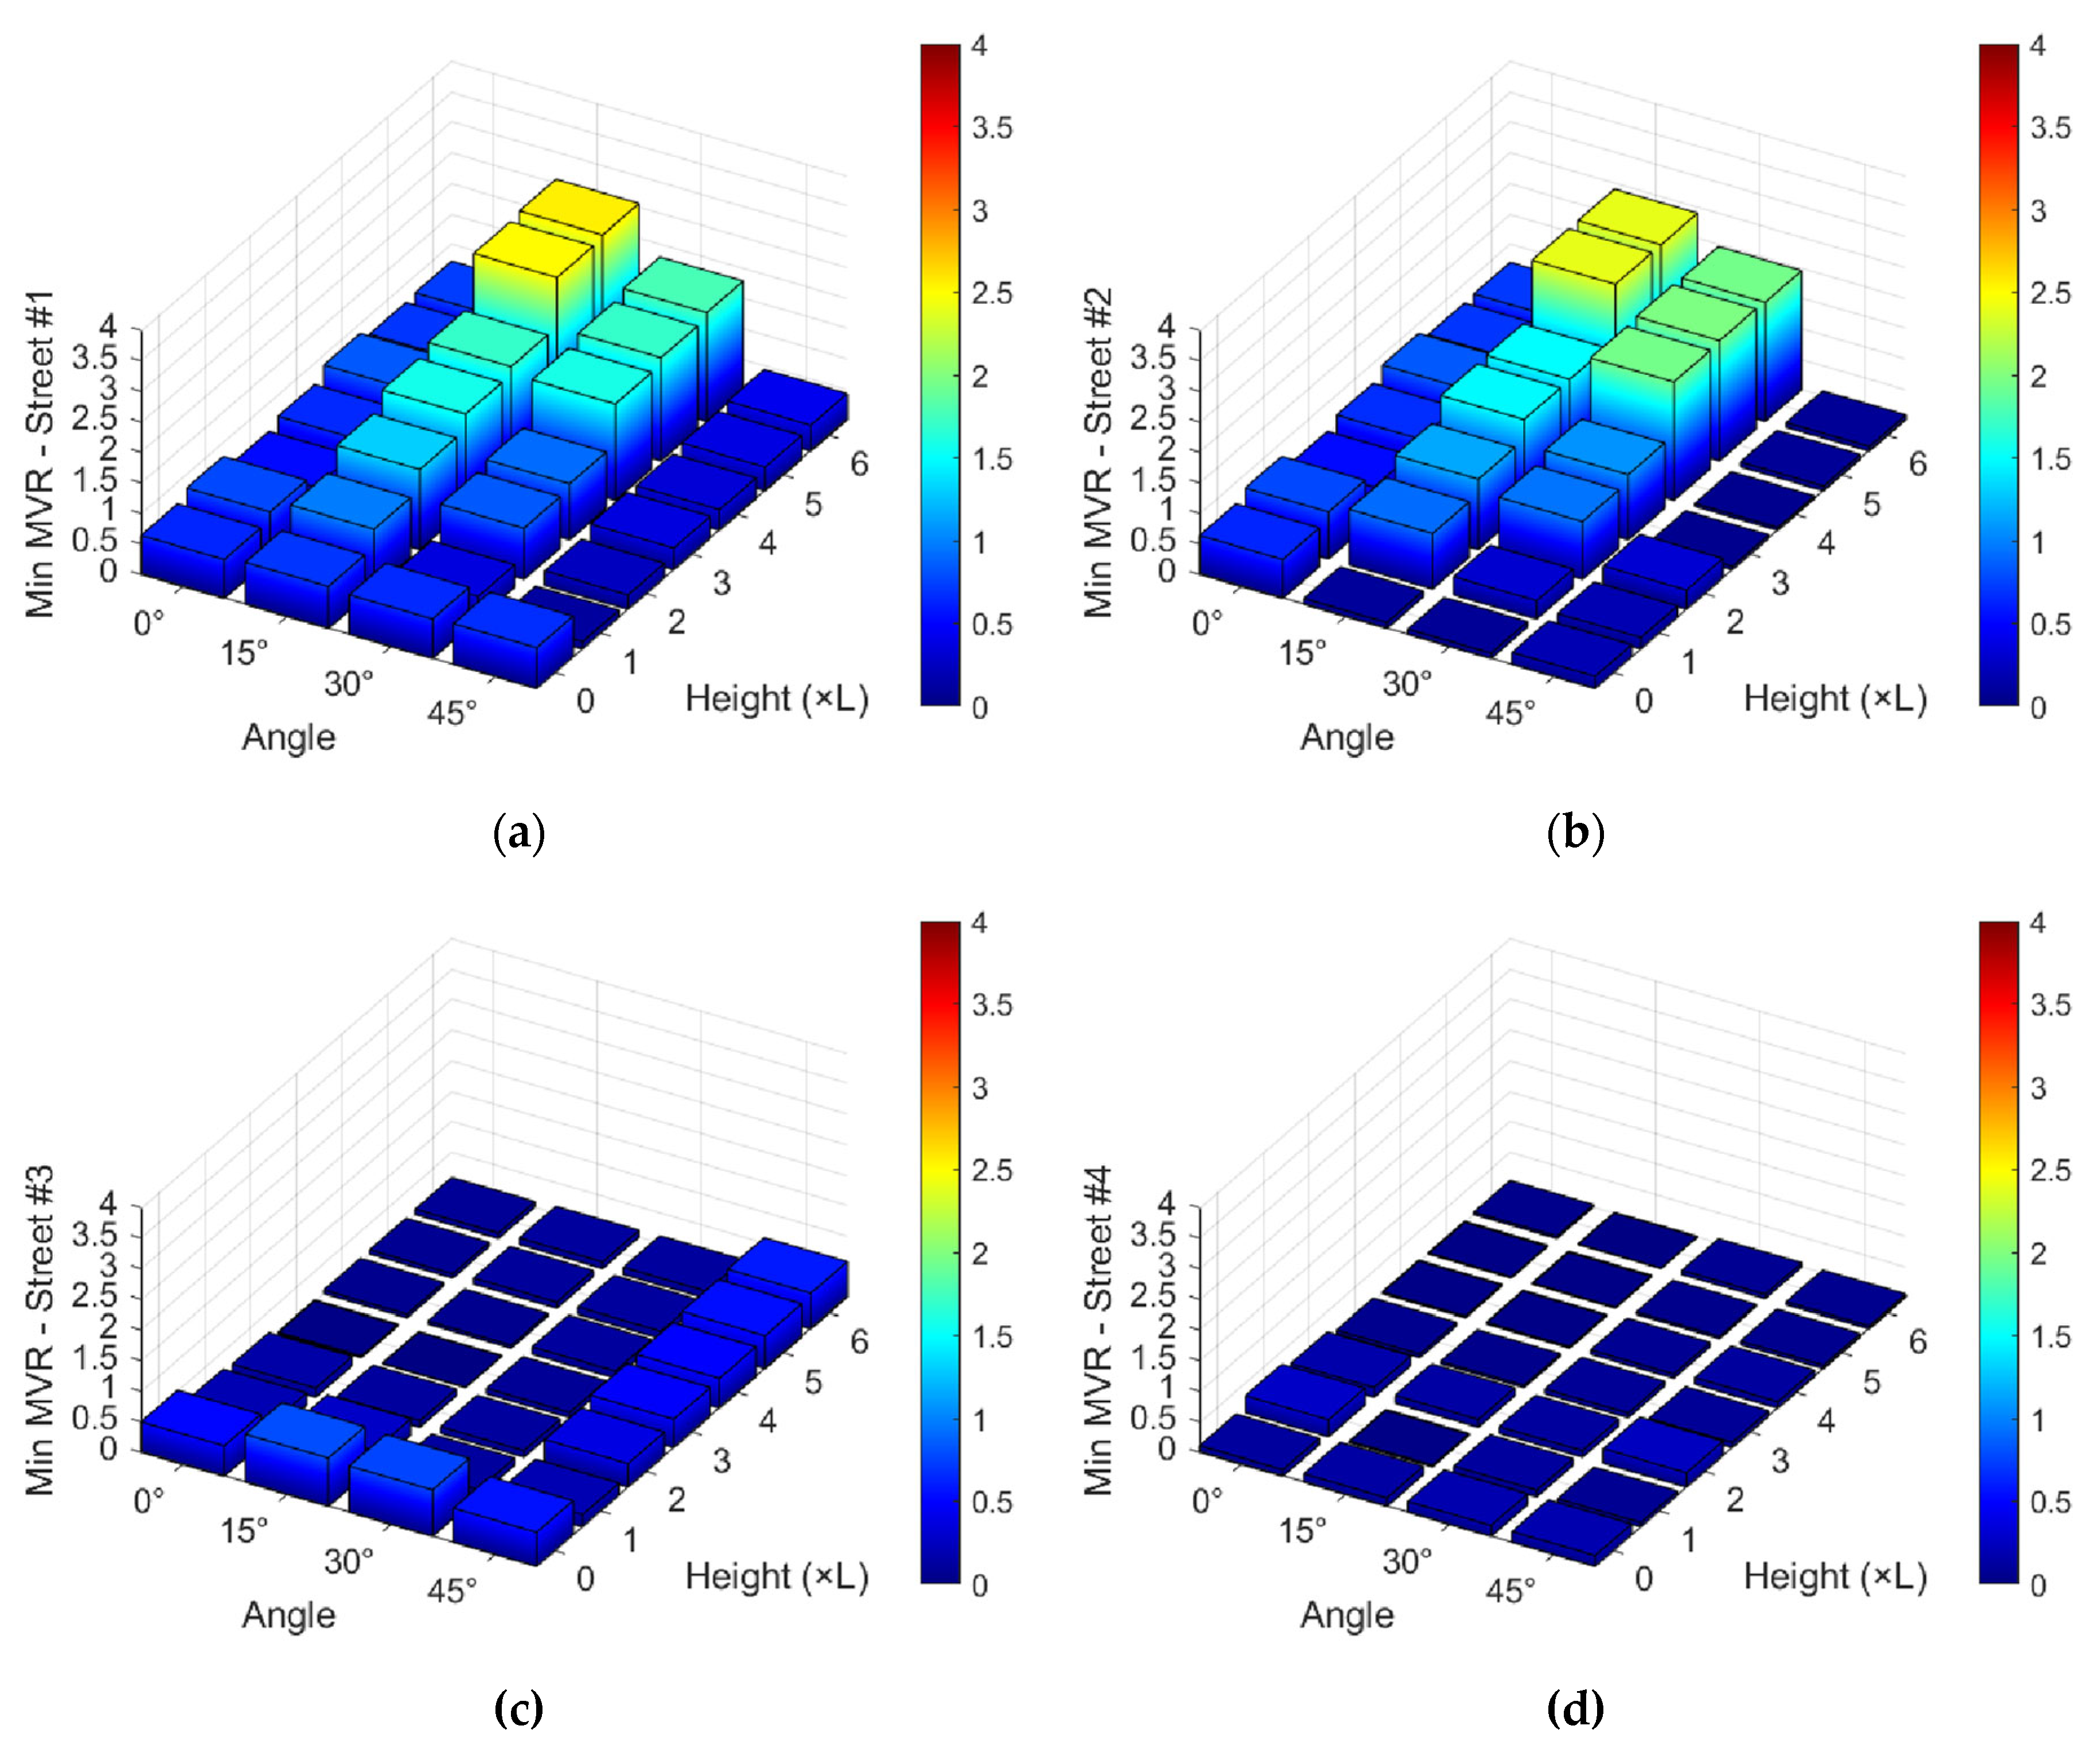
Figure 10.
OMVR criterion for all neighborhood configurations.
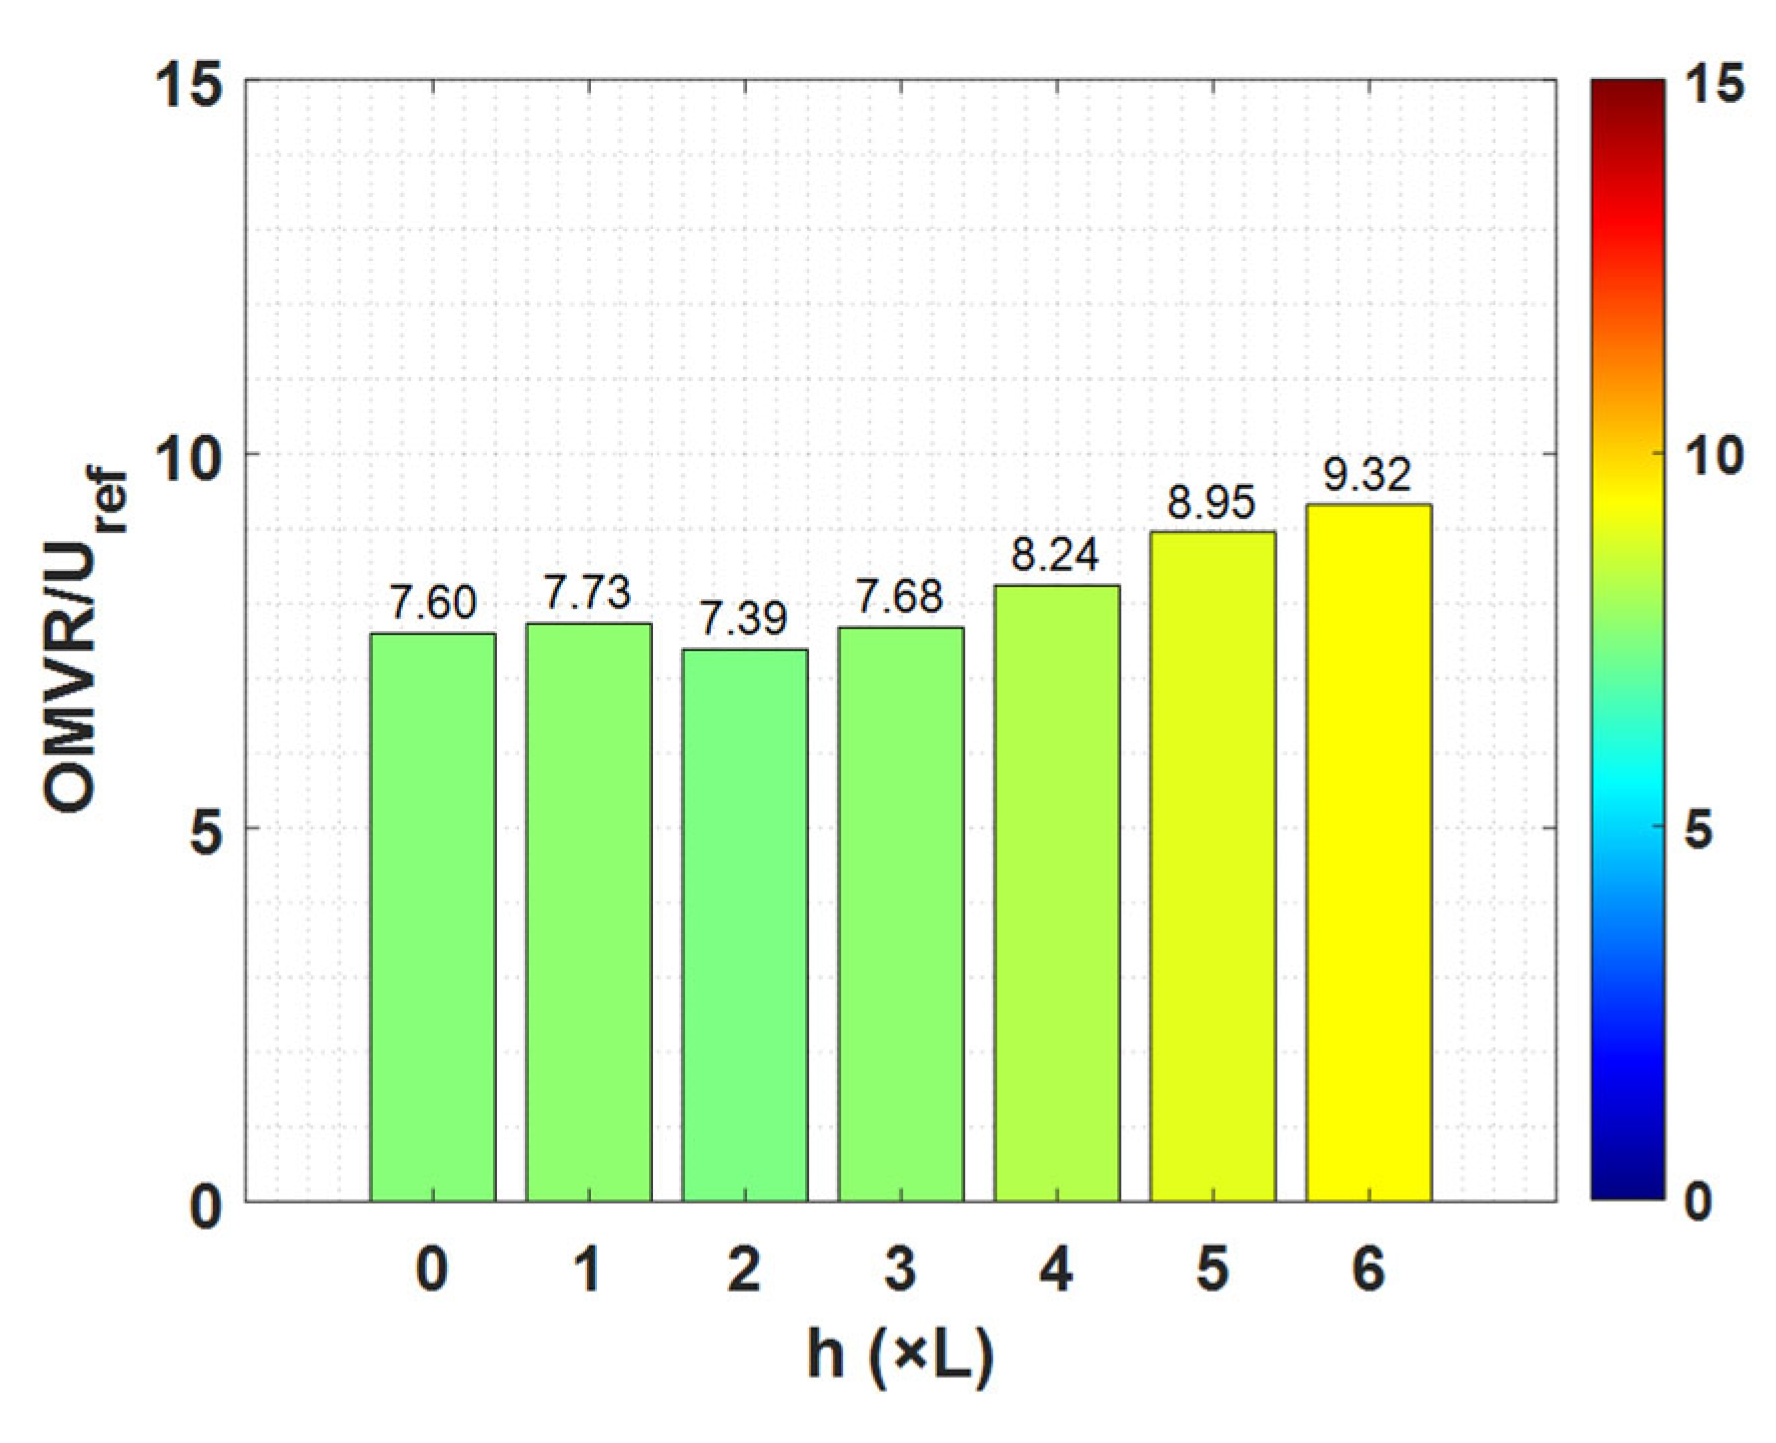
Table 1.
MVR and OMVR criteria for pedestrian comfort.
| Category | Threshold wind velocity (m/s) | MVR | OMVR | Remarks |
|---|---|---|---|---|
| Unfavorable | < 1.5 | < 0.3 | < 1.5 |
Low wind velocity. |
| Acceptable | < 1.8 < 3.6 < 5.3 |
< 0.36 < 0.72 < 1.06 |
< 1.8 < 3.6 < 5.3 |
Moderate wind velocity: good for outdoor activities. |
| Tolerable | < 7.6 | < 1.52 | < 7.6 |
High wind velocity: not suitable for all outdoors activities. |
| Intolerable | > 7.6 | > 1.52 | > 7.6 |
Dangerous wind velocity: not suitable for any outdoors activities. |
| Dangerous | > 15 | > 3 | > 15 |
Hazardous wind velocity. |
Table 2.
Agreement coefficients between experimental data and the three refinement levels.
| Mesh | Fit Equation | R² | FB | FAC2 | RMSE | MAE |
|---|---|---|---|---|---|---|
| M1 | 1.084x – 0.0139 | 0.9685 | 0.0430 | 0.9899 | 0.0630 | 0.0525 |
| M2 | 1.073x – 0.0021 | 0.9715 | 0.0896 | 0.9999 | 0.0522 | 0.0444 |
| M3 | 1.064x + 0.0004 | 0.9911 | 0.0160 | 0.9950 | 0.0323 | 0.0257 |
| Average | - | 0.9770 | 0.0495 | 0.9949 | 0.0491 | 0.0409 |
Disclaimer/Publisher’s Note: The statements, opinions and data contained in all publications are solely those of the individual author(s) and contributor(s) and not of MDPI and/or the editor(s). MDPI and/or the editor(s) disclaim responsibility for any injury to people or property resulting from any ideas, methods, instructions or products referred to in the content. |
© 2025 by the authors. Licensee MDPI, Basel, Switzerland. This article is an open access article distributed under the terms and conditions of the Creative Commons Attribution (CC BY) license (http://creativecommons.org/licenses/by/4.0/).
Copyright: This open access article is published under a Creative Commons CC BY 4.0 license, which permit the free download, distribution, and reuse, provided that the author and preprint are cited in any reuse.


