
Submitted:
07 July 2025
Posted:
08 July 2025
You are already at the latest version
Abstract
Accurate prediction of soil phosphorus (P) adsorption capacity is essential for efficient fertilizer management and environmental protection. Traditional isotherm models, such as the Langmuir equation, have been widely used to quantify P sorption, but they obviously fail to account for the nonlinear and multivariate nature of soil systems. This study evaluates the performance of a multi-output XGBoost regression model trained on laboratory-measured P adsorption data from 147 soils, representing a wide range of textures, pH levels, and CaCO₃ contents. The model was developed to simultaneously predict P adsorption at five different equilibrium concentrations (1, 2, 4, 6, and 10 mg/L). SHAP analysis and causal discovery via DirectLiNGAM revealed that initial Olsen P concentration and sand content are the primary factors reducing P adsorption. The multi-output XGBoost model was compared against classical Langmuir isotherms using an extended dataset of 10,389 soil samples. The extended dataset, comprising 10,389 rows, was binned into four groups based on Olsen P concentrations and four groups based on sand content. This binning was based on the identification of these variables as highly influential by the XGBoost model, and on their demonstrated causal relationship with soil P sorption capacity through causal inference analysis. The XGBoost model outperformed the Langmuir model in capturing the effect of Olsen P and sand content, as it predicted a 12.6% drop in P adsorption in the very high Olsen P group and a 19.2% drop in the very high sand content groups, which are substantially higher than the reductions estimated by Langmuir isotherms. These results demonstrate that machine learning models, trained on well-designed experimental data, offer a superior alternative to classical isotherms for modeling P sorption dynamics.
Keywords:
Phosphorus adsorption
; Langmuir isotherm
; Machine Learning
; Predictive modeling
; Soil properties
; Crop phosphorus requirements
1. Introduction
Phosphorus (P) deficiency is among the primary constraints of agricultural crop production [1,2,3]. Most cultivated soils in Greece are calcareous and contain relatively high levels of calcium carbonate (CaCO3), which gives them a high P sorption capacity. As a result, general fertilizer recommendations may not provide adequate P on some soils, since they do not account for their sorption capacity. P fertilizers are expensive and their uptake efficiency by crops is often limited, typically ranging between 10-30% [4]. Even though soil may contain several hundred to thousand kilograms of P per hectare, much of this may not be available to crops [5]. Fertilizer P rapidly binds to the soil and becomes fixed in forms that are unavailable to plants, particularly in soils with pH levels below 5.0 or in highly alkaline conditions [6]. Given this low efficiency and high cost, it is essential to optimize P application based on knowledge obtained by quantitative models according to diverse soil properties.
On the other hand, excessive P fertilization can be highly detrimental to the environment. When P is applied in quantities exceeding crop demand, it can lead to contamination of aquatic ecosystems through soil erosion or surface runoff [7]. Elevated P levels in water bodies contribute to eutrophication, which promotes unnaturally dense algal growth, which is commonly known as algal blooms. These blooms can harm both wildlife and humans, as certain algal species release dermatoxins, neurotoxins, cytotoxins, and hepatotoxins. Additionally, eutrophication can produce unpleasant odors due to the decomposition of algae and degrade water quality, impairing its use not only for irrigation and drinking but also for recreational purposes. Therefore, reducing P losses from agricultural fields is essential to prevent aquatic ecosystems from becoming hypereutrophic [8].
To assess the P sorption capacity of soils, many researchers have recommended the use of sorption isotherm techniques [3,9,10,11,12]. Many models have been developed to describe this process quantitatively, with the Langmuir and Freundlich equations being the most widely used [13,14,15,16]. For the current study, two main approaches have been used to model P sorption capacity of soils: The Langmuir adsorption isotherm and a data driven approach, which is based on a Multioutput XGBoost model.
2. Materials and Methods
2.1. Laboratory Analysis
Surface soil samples (0-15cm) were collected and then air-dried, ground, homogenized, and sieved to pass through a < 2-mm sieve after removing stones and residual roots. From these soil samples 147 soil samples were selected with different physicochemical properties with regards to pH and calcium carbonate (CaCO3) and analyzed for a set of 18 soil properties: sand%, clay%, silt%, bulk density, soil acidity (pH), electrical conductivity (EC), organic matter (OM), CaCO3, nitrate nitrogen, phosphorus (P), potassium (K), magnesium (Mg), iron (Fe), zinc (Zn), manganese (Mn), copper (Cu), boron (B), and calcium (Ca). The pH and EC values were measured using the saturated paste method with specific meters [17]. Nitrate–nitrogen was extracted using the 2M potassium chloride (KCl) extraction method quantified via the UV-VIS spectrophotometric procedure [18], while organic matter was determined through the Walkley–Black method [19]. The CaCO3 content was assessed through titration [20], and the soil texture was evaluated using the Bouyoucos hydrometer approach [21]. The Olsen method was employed for P [6]. The ammonium acetate method was used for the extraction of Na, K, Ca, and Mg, and these elements were quantified using Inductively Coupled Plasma Spectroscopy (ICP) [22]. Additionally, Mn, Cu, Fe, and Zn were extracted using DTPA and quantified with ICP [23]. Soil B was extracted using the hot 0.02M CaCl2 method, which involves boiling the soil solution for 5 min, and the extracted B was measured using ICP [24].
The soils were classified into four groups representing all possible combinations of soil texture, pH, and CaCO3 content (Table 1 – 2).
2.2. P Sorption Capacity
P adsorption and desorption experiment was performed for these soil samples. Each sample (3 g) was placed into a 50-ml centrifuge tube and then was equilibrated with 30 ml of Ca2PO4 at different concentrations (1, 2, 4, 6 and 10 mg/L). These P concentrations were selected because they are more likely to be encountered in natural agronomic conditions, despite that higher P levels were often used in previously published P adsorption experiments [25]. The suspension was added with three drops of chloroform to avoid microbial growth and horizontally shaken for 24 h and then centrifuged at 4,000 r/min for 30 min producing a clear supernatant [26]. The supernatant was filtered through 0.45 μM filters. P in the solutions was measured by ICP. Sorbed P was calculated using the difference between P in the initial solution and P in the equilibrium solution and mass of soil. Sorption isotherms were constructed by plotting sorbed P (mg kg-1 of soil P) against P in the equilibrium solution.
2.3. Machine Learning
To preprocess the P sorption dataset for training a multi-output XGBoost regression model, we constructed a feature-augmented dataset in which equilibrium concentration (Ce) values (1, 2, 4, 6, 10 mg/L) were incorporated as an additional input alongside the unchanging soil property vectors, generating a sequence of 5 rows for each soil sample. Although the soil features remained constant, each Ce level corresponded to a different P adsorption value, allowing the model to learn how adsorption varies with equilibrium concentration for a given soil profile. This resulted in a dataset of 735 rows, where each row combined constant soil features with a specific Ce level, and the corresponding P sorption value served as the prediction target. This formulation enabled feature importance interpretation using SHAP analysis [27]. The dataset was randomly split into a training set (80%, 588 samples) and a test set (20%, 147 samples). To reduce dimensionality and eliminate less informative features, we applied Recursive Feature Elimination (RFE) on this augmented dataset with a Random Forest Regressor as the base estimator [28,29]. RFE recursively ranks and removes features based on their importance, ultimately selecting the most predictive subset for model training.
After feature selection, a multi-output XGBoost regression model was implemented to estimate P adsorption across multiple equilibrium concentrations [30,31]. Importantly, this model was not trained on the feature-augmented dataset (735 rows), but rather on the original dataset comprising 147 soil samples, each represented by a single row with five P sorption values corresponding to the Ce levels (1, 2, 4, 6, 10 mg/L) as output targets. This approach was deliberately chosen to avoid overfitting, which could have occurred if the model were trained on the artificially expanded dataset, where each soil sample was repeated across Ce levels, potentially introducing redundant patterns. The reduced dataset (with only the selected features) was randomly split into a training set (80%, 117 samples) and a test set (20%, 30 samples). We employed the XGBoost regressor with the multi_strategy=“multi_output_tree” option, enabling native multi-target prediction using a single ensemble of gradient-boosted trees. This architecture was selected for its scalability and high predictive performance on structured data with multiple outputs.
To optimize the model, Optuna was applied [32], which is a Bayesian hyperparameter optimization framework, with the objective of minimizing the Mean Absolute Error (MAE) across all output targets. The optimal configuration included 257 boosting rounds (n_estimators=257), a learning rate of 0.137, regularization (gamma=2.46, min_child_weight=2), a tree depth of 8 (max_depth=8), and stochastic subsampling (subsample=0.858, colsample_bytree=0.898).
2.4. Causal Discovery
After model training, the Directed Acyclic Graph (DAG) approach was applied on the reduced original dataset (including only the selected features comprising the 147 soil samples) to uncover the causal relationships between variables. For this purpose, the Direct Linear Non-Gaussian Acyclic Model (DirectLiNGAM) was employed. This algorithm is an extension of the original LiNGAM method and offers improved robustness when the assumption of strict non-Gaussianity is not fully met. DirectLiNGAM assumes that the underlying causal structure is linear, acyclic, and free from hidden confounders. It enhances causal discovery by introducing a more reliable method for determining causal order, which involves three main steps: (1) pairwise causality tests, (2) estimation of causal ordering based on those tests, and (3) estimation of connection strengths among variables. The assumption of non-Gaussianity is essential because it allows the model to move beyond second-order statistical measures (e.g., covariance) and uncover more complex causal dependencies in the data [33,34,35].
2.5. Comparison of the Langmuir Isotherms and the Multi-Output XGBoost Regressor on a Large Soil Dataset
The performance of the Langmuir isotherms and the multi-output XGBoost model were evaluated using a large soil dataset consisting of 10,389 samples. P sorption capacity was estimated for each sample using both methods, and the results were subsequently compared to assessing their relative effectiveness.
To compare mean differences among soil texture groups, Tukey’s HSD (Honestly Significant Difference) test was applied [36]. This post-hoc multiple comparison test identifies statistically significant differences between all possible pairs of group means following an ANOVA. It was used here to assess whether P adsorption percentages differed significantly between soil textures at each equilibrium concentration (Ce), with a significance threshold of p < 0.05.
3. Results
3.1. Feature Engineering
Feature selection on the feature-augmented dataset using RFE identified nine soil variables as important, as shown in Figure 1. An XGBoost model was then trained on the same dataset, using P adsorption as the target variable, and including the P equilibrium concentration (Ce) as an additional input feature. The feature importance plot, which was generated using SHAP, indicated that, aside from Ce, the most influential features were Olsen P, manganese, sand content, and magnesium concentration in the soil (Figure 1).
The SHAP dependence plot revealed also that P adsorption in the soil samples had a downward trend as the initial Olsen P concentrations increased, which was something expected (Figure 2a). However, the intensity of the reduction of P sorption capacity due to the initial Olsen P was surprising. In contrast, P sorption capacity increased with higher manganese availability in the soil (Figure 2b), while it decreased with increasing sand content (Figure 2c). Finally, P sorption increased with higher magnesium concentrations in the soil (Figure 2d).
3.2. Causal Inference
Causal inference analysis applied on the reduced original dataset confirmed that initial Olsen P concentration and sand content had causal relationship with P adsorption in the soil samples (Figure 3). All DAGs in Figure 3 consistently show sand content as causal factors contributing to the reduction of P adsorption. Also, there is a causal link between Olsen P and P adsorption for 1, 2, 4 and 6 mg/L of P equilibrium concentrations. This finding aligns with the feature importance plot (Figure 1), where Olsen P and sand content are among the most significant predictors.
3.3. Langmuir Equations
Since sand content emerged as the most significant soil property influencing P sorption capacity, according to both feature importance and causal inference analyses, Langmuir P sorption isotherms were constructed based on soil classification (clay, sand, loam) and soil texture groups (Figure 4a, b). General equations based on soil classification were developed because the original dataset of 147 samples lacked representation from the sandy, sandy clay, and silty texture groups, which are extremely rare in Greek soils. However, as the extended dataset included some samples from these underrepresented groups, broader equations were generated using the main soil classifications (sand, clay, and loam) to enable Langmuir adsorption estimates for all samples. Figure 4b displays the Langmuir isotherms for the remaining soil texture groups, where it is shown that loamy sand and sandy loam soils have the lowest P adsorptions capacities. This observation is consistent with the feature importance and causal inference analyses, which identified sand content as one of the main drivers reducing P adsorption. The resulting fitted parameters are presented in Table 3 and Table 4. Table 5, which presents P adsorption percentages across soil types, confirms that clay and silty clay loam soils exhibit the highest adsorption, while sandy textures show the lowest (p < 0.05) across all equilibrium concentrations.
3.4. Multiple Linear Regression Equations
For simplicity, and because the Langmuir isotherms are nearly linear over this specific range of equilibrium concentrations, multiple linear regression equations are provided below. These equations allow soil laboratories to easily estimate P adsorption based on standard soil test data. Multiple linear regression analysis revealed that the overall interaction between soil classification and the predictor variables was statistically significant (p < 0.001).
Regression equation for Sandy soils:
Adsorbed_P = 192.1 – 2.4 × Sand – 3.6 × Clay – 5.9 × pH + 16.3 × EC –
1.7 × Organic_matter – 4.2 × P + 15.7 × Mg + 1.4 × Mn + 3.6 × Cu + 78.8 × Ce
Regression equation for Loamy soils:
Adsorbed_P = 48.0 – 1.2 × Sand + 1.9 × Clay – 4.3 × pH + 4.0 × EC –
0.9 × Organic_matter – 1.9 × P – 3.5 × Mg + 0.9 × Mn – 0.3 × Cu + 86.9 × Ce
Regression equation for Clayey soils:
Adsorbed_P = 308.5 – 1.0 × Sand + 1.5 × Clay – 31.0 × pH – 25.1 × EC –
25.7 × Organic_matter + 3.2 × P + 0.6 × Mg - 3.9 × Mn - 1.0 × Cu + 86.3 × Ce
where Ce is the equilibrium concentration of P.
3.5. Multi-output XGBoost model performance
The final multi-output model captured complex, nonlinear relationships between soil features and P adsorption across different Ce levels, achieving an overall MAE of 26.5 mg/kg and an R2 score of 0.50 on the test set (Figure 5).
3.6. Performance of the multi-output XGBoost model and Langmuir isotherms on an extended soil dataset
The extended dataset, comprising 10,389 rows, was binned into four categories based on Olsen P concentrations and four categories based on sand content. This binning was based on the identification of these variables as highly influential by the XGBoost model, and on their demonstrated causal relationship with soil P sorption capacity through causal inference analysis. For each row, P adsorption was estimated using both the Langmuir isotherm and the XGBoost model across five equilibrium concentrations (Ce values: 1, 2, 4, 6, and 10 mg/L), resulting in an augmented dataset of 51,945 rows.
The bins for Olsen P were calculated using quantile-based binning on the extended dataset as follows:
Low P: 1.00–6.83 mg/kg,
Medium P: 6.84–12.89 mg/kg,
High P: 12.90–25.77 mg/kg, and
Very High P: 25.78–360.44 mg/kg.
The bins for sand content were calculated using quantile-based binning on the extended dataset as follows:
Low P: 4–30%,
Medium P: 30–44%,
High P: 44–56%, and
Very High P: 56–94%.
Applying the Langmuir isotherms to the extended dataset revealed that P adsorption was 2.3% lower in the very high Olsen P group compared to the low Olsen P group (p = 0.005) (Figure 6). However, the multi-output XGBoost model estimated a substantially greater reduction, with a 12.6% lower adsorption value in the very high Olsen P group compared to the low Olsen P group (p < 0.001) (Figure 6). These results highlight a stronger sensitivity of the machine learning model to changes in Olsen P levels compared to the Langmuir isotherm.
Similarly, P adsorption was found to be 11.9% lower in the very high sand content group compared to the low sand content group, according to the Langmuir isotherms (p < 0.001) (Figure 7). Once again, the multi-output XGBoost model predicted a more pronounced decline, estimating a 19.2% lower adsorption in the very high sand content group relative to the low sand content group (p < 0.001) (Figure 7). This further supports the capacity of the XGBoost model to capture complex nonlinear relationships between key soil properties on P sorption.
Table 6 presents P adsorption percentages predicted by the multi-output XGBoost model across soil texture classes for the extended dataset. Silty clay loam and silty clay soils generally exhibit among the highest predicted adsorption values, consistent with observations from the original dataset (Table 5), while sandy textures (e.g., sandy loam, sandy) show the lowest, particularly at higher equilibrium concentrations.
4. Discussion
Data presented here show that a multi-output XGBoost model is more responsive to changes in P adsorption compared to the Langmuir isotherms. This is not surprising, as XGBoost is well known for delivering state-of-the-art performance in data analysis tasks [39]. It is particularly effective at capturing nonlinear patterns, handling multivariate data, and minimizing the prediction error [30,40]. However, the innovative aspect of the present study lies in the fact that the XGBoost model was trained on P adsorption data generated from a large-scale experiment involving multiple levels of equilibrium P concentrations applied on soils representing a wide range of textures, pH levels, and calcium carbonate content. This comprehensive dataset enabled the development of an XGBoost model that more accurately estimated soil P sorption capacity compared to the traditional Langmuir isotherms.
Initial Olsen P and sand content were identified as the primary factors negatively influencing P adsorption, thereby increasing P availability in the soil solution for plant uptake. This finding was supported by both SHAP analysis and causal inference. The SHAP dependence plot (Figure 2a) shows a sharp decrease in P adsorption as Olsen P increases in the soil, highlighting why Olsen P is the primary driver behind the reduction in the soil’s P adsorption capacity. SHAP analysis also revealed a positive correlation between soil manganese concentration and P adsorption (Figure 2b). This is likely an indirect correlation resulting from increased manganese availability in acid soils, which typically have high P adsorption capacity. In acidic conditions, manganese exists predominantly in its soluble Mn2+ form, making it readily available for plant uptake. A similar positive correlation was observed between magnesium and P adsorption, likely due to higher magnesium availability in alkaline soils, which also tend to exhibit high P adsorption capacity (Figure 2d).
The causal discovery algorithm DirectLiNGAM successfully captured the causal relationships among P adsorption capacity, sand content, and initial Olsen P in the soil. Causal analysis revealed a consistent link between sand content and P adsorption across all P equilibrium concentrations, and a link between Olsen P and P adsorption at 1, 2, 4, and 6 mg/L of P equilibrium concentrations (Figure 3). These findings strongly confirm the feature importance results of the XGBoost model, highlighting the key roles of initial Olsen P and sand content in determining the soil’s P adsorption capacity. The absence of a detected causal link between manganese or magnesium with P adsorption capacity, despite their high ranking in the XGBoost feature importance score, is likely due to their indirect relationship with P adsorption in soils.
Many models have been developed to describe adsorption isotherms, but the Langmuir equation is among the most widely used for quantitatively fitting P adsorption isotherms [41,42,43,44]. The results of the current study showed that the Langmuir isotherms adequately described the P adsorption properties of the soils, with adsorption levels varying according to sand content. Loamy sand and sandy loam soils exhibited the lowest P adsorption, which is consistent with the importance of sand content identified by the XGBoost feature importance and the causal inference analysis (Figure 4a).
The final multi-output model achieved an overall mean absolute error (MAE) of 26.5 mg/kg and an R2 score of 0.50 on the test set, indicating good predictive performance. The model performed better at lower P equilibrium concentrations, while predictions at the higher concentration of 10 mg/kg showed greater scatter (Figure 5).
Data from the extended dataset shows that the multi-output XGBoost model is more responsive to variations in initial Olsen P content and sand content in soils compared to the Langmuir isotherms (Figure 7). The XGBoost model is especially sensitive to Olsen P, as it was trained using Olsen P as an input variable, whereas the Langmuir model does not account for this factor. In addition, the XGBoost model demonstrated greater responsiveness to changes in sand content, indicating overall better performance than the Langmuir isotherms. It is not surprising that machine learning outperforms the Langmuir model, given its ability to capture non-linear relationships [45]. However, the novelty of this study lies in incorporating data from diverse soil types during the adsorption experiment, enabling the training of a robust machine learning model that offers an improved solution to the P adsorption prediction problem. The XGBoost model showed high sensitivity to initial Olsen P levels, which was ranked as the most influential feature in the feature importance score, and to sand content. Specifically, P adsorption dropped by 12.6% in the very high Olsen P group compared to the low Olsen P group, which is a substantially stronger effect than observed with the Langmuir model. Similarly, P adsorption decreased by 19.2% in soils with very high sand content compared to those with low sand content, again exceeding the Langmuir model’s sensitivity. These results highlight that machine learning is a more effective approach for predicting soil P adsorption capacity than relying solely on Langmuir isotherms.
The consistency between the experimentally derived adsorption values (Table 5) and the model-predicted values from the extended dataset (Table 6) highlights the robustness of the multi-output XGBoost model in capturing the effect of soil texture on P adsorption. In both cases, silty clay loam and silty clay soils demonstrated the highest adsorption capacities, while sandy soils consistently exhibited the lowest. These results reinforce the dominant role of fine-textured soils in retaining P and validate the model’s potential for reliable prediction in data-sparse environments. The data presented in Table 5 and Table 6 align with the uptake efficiency (10–30%) reported by Liu et al. [4] and the average soil P adsorption capacity of 75% reported by Halliday [46].
5. Conclusions
This study demonstrated that a multi-output XGBoost regression model significantly outperforms the classical Langmuir isotherm in predicting P adsorption across diverse soil types. By incorporating a wide array of soil physicochemical properties, the XGBoost model captured complex nonlinear patterns and was found to be more responsive to changes in Olsen P and sand content compared to the Langmuir isotherms. The model’s robustness was further supported by SHAP-based feature importance and causal inference analysis, which consistently identified initial Olsen P and sand content as primary drivers of P sorption variability. These findings highlight the advantages of combining laboratory data with modern machine learning techniques for modeling soil nutrient dynamics. The multi-output XGBoost model developed here offers a promising tool for P management, with the potential to improve fertilizer use efficiency and reduce environmental risks from over-fertilization.
Author Contributions
Conceptualization, A.P.; methodology, M.I. and A.P.; software, M.I.; validation, M.I; formal analysis, M.I.; investigation, A.P.; resources, A.P.; data curation, M.I.; writing—original draft preparation, M.I. and A.P.; writing—review and editing, M.I. and A.P.; visualization, M.I.; supervision, A.P.; project administration, A.P.; funding acquisition, A.P. All authors have read and agreed to the published version of the manuscript.
Funding
This research received no external funding
Data Availability Statement
The data can be made available by contacting the corresponding authors.
Conflicts of Interest
The authors declare no conflicts of interest.
Abbreviations
The following abbreviations are used in this manuscript:
| MDPI | Multidisciplinary Digital Publishing Institute |
| P | Phosphorus |
| RFE | Recursive Feature Elimination |
| MAE | Mean Absolute Error |
| DirectLiNGAM | Direct Linear Non-Gaussian Acyclic Model |
| DAG | Directed Acyclic Graph |
References
- Kirkby, E.A.; Johnston, A.E. (Johnny) Soil and Fertilizer Phosphorus in Relation to Crop Nutrition. In The Ecophysiology of Plant-Phosphorus Interactions; White, P.J., Hammond, J.P., Eds.; Springer Netherlands: Dordrecht, 2008; pp. 177–223 ISBN 978-1-4020-8435-5.
- Marschner, P. Marschner’s Mineral Nutrition of Higher Plants; 2012.
- Mihoub, A.; Daddi Bouhoun, M.; Saker, M. Phosphorus Adsorption Isotherm: A Key Aspect for Effective Use and Environmentally Friendly Management of Phosphorus Fertilizers in Calcareous Soils. Commun Soil Sci Plant Anal 2016, 47. [Google Scholar] [CrossRef]
- Liu, D.; Xiao, Z.; Zhang, Z.; Qiao, Y.; Chen, Y.; Wu, H.; Hu, C. The Crop Phosphorus Uptake, Use Efficiency, and Budget under Long-Term Manure and Fertilizer Application in a Rice–Wheat Planting System. Agriculture 2024, 14. [Google Scholar] [CrossRef]
- Amarh, F.; Voegborlo, R.B.; Essuman, E.K.; Agorku, E.S.; Tettey, C.O.; Kortei, N.K. Effects of Soil Depth and Characteristics on Phosphorus Adsorption Isotherms of Different Land Utilization Types: Phosphorus Adsorption Isotherms of Soil. Soil Tillage Res 2021, 213, 105139. [Google Scholar] [CrossRef]
- Iatrou, M.; Papadopoulos, a.; Papadopoulos, F.; Dichala, O.; Psoma, P.; Bountla, a. Determination of Soil Available Phosphorus Using the Olsen and Mehlich 3 Methods for Greek Soils Having Variable Amounts of Calcium Carbonate. Commun Soil Sci Plant Anal 2014, 45, 2207–2214. [Google Scholar] [CrossRef]
- Heredia, O.S.; Fernández Cirelli, A. Environmental Risks of Increasing Phosphorus Addition in Relation to Soil Sorption Capacity. Geoderma 2007, 137, 426–431. [Google Scholar] [CrossRef]
- Holman, I.P.; Howden, N.J.K.; Bellamy, P.; Willby, N.; Whelan, M.J.; Rivas-Casado, M. An Assessment of the Risk to Surface Water Ecosystems of Groundwater P in the UK and Ireland. Science of The Total Environment 2010, 408, 1847–1857. [Google Scholar] [CrossRef]
- Olsen, S.R.; Watanabe, F.S. A Method to Determine a Phosphorus Adsorption Maximum of Soils as Measured by the Langmuir Isotherm. Soil Science Society of America Journal 1957, 21, 144–149. [Google Scholar] [CrossRef]
- HELYAR, K.R.; MUNNS, D.N.; BURAU, R.G. ADSORPTION OF PHOSPHATE BY GIBBSITE. Journal of Soil Science 1976, 27, 307–314. [Google Scholar] [CrossRef]
- Bolster, C.; Sistani, K. Sorption of Phosphorus from Swine, Dairy, and Poultry Manures. Commun Soil Sci Plant Anal 2009, 40. [Google Scholar] [CrossRef]
- Gjettermann, B. Modelling P Dynamics in Soil - Decomposition and Sorption: Technical Report; Concepts and User Manual. ; 2004.
- Zawadzka, B.; Siwiec, T.; Reczek, L.; Marzec, M.; Jóźwiakowski, K. Modeling of Phosphate Sorption Process on the Surface of Rockfos® Material Using Langmuir Isotherms. Applied Sciences 2024, 14. [Google Scholar] [CrossRef]
- Dari, B.; Nair, V.D.; Colee, J.; Harris, W.G.; Mylavarapu, R. Estimation of Phosphorus Isotherm Parameters: A Simple and Cost-Effective Procedure. Front Environ Sci 2015, Volume 3-2015.
- Del Bubba, M.; Arias, C.A.; Brix, H. Phosphorus Adsorption Maximum of Sands for Use as Media in Subsurface Flow Constructed Reed Beds as Measured by the Langmuir Isotherm. Water Res 2003, 37, 3390–3400. [Google Scholar] [CrossRef] [PubMed]
- Dossa, E.; Baham, J.; Khouma, M.; Sene, M.; Kizito, F.; Dick, R. Phosphorus Sorption and Desorption in Semiarid Soils of Senegal Amended With Native Shrub Residues. Soil Sci 2008, 173, 669–682. [Google Scholar] [CrossRef]
- Jones, J.B. Laboratory Guide for Conducting Soil Tests and Plant Analysis; Taylor & Francis, 2001; ISBN 9780849302060.
- Magdoff, F.R.; Jokela, W.E.; Fox, R.H.; Griffin, G.F. A Soil Test for Nitrogen Availability in the Northeastern United States. Commun Soil Sci Plant Anal 1990, 21, 1103–1115. [Google Scholar] [CrossRef]
- Walkley, A.; Black, I.A. AN EXAMINATION OF THE DEGTJAREFF METHOD FOR DETERMINING SOIL ORGANIC MATTER, AND A PROPOSED MODIFICATION OF THE CHROMIC ACID TITRATION METHOD. Soil Sci 1934, 37, 29–38. [Google Scholar] [CrossRef]
- van Reeuwijk, L.P. Procedures for Soil Analysis. 2002.
- Bouyoucos, G.J. Hydrometer Method Improved for Making Particle Size Analyses of Soils1. Agron J 1962, 54, 464–465. [Google Scholar] [CrossRef]
- Knudsen, D.; Peterson, G.A.; Pratt, P.F. Lithium, Sodium, and Potassium. In Methods of Soil Analysis; Agronomy Monographs; 1983; pp. 225–246 ISBN 9780891189770.
- Iatrou, M.; Papadopoulos, A.; Papadopoulos, F.; Dichala, O.; Psoma, P.; Bountla, A. Determination of Soil-Available Micronutrients Using the DTPA and Mehlich 3 Methods for Greek Soils Having Variable Amounts of Calcium Carbonate. Commun Soil Sci Plant Anal 2015, 46, 1905–1912. [Google Scholar] [CrossRef]
- Jeffrey, A.J.; McCallum, L.E. Investigation of a Hot 0.01m CaCl2 Soil Boron Extraction Procedure Followed by ICP-AES Analysis. Commun Soil Sci Plant Anal 1988, 19, 663–673. [Google Scholar] [CrossRef]
- Wang, Z.; Hou, L.; Liu, Z.; Cao, N.; Wang, X. Using a Modified Langmuir Equation to Estimate the Influence of Organic Materials on Phosphorus Adsorption in a Mollisol From Northeast, China. Front Environ Sci 2022, Volume 10-2022.
- Nair, P.S.; Logan, T.J.; Sharpley, A.N.; Sommers, L.; Tabatabai, M.; Yuan, T.L. Interlaboratory Comparison of a Standardized Phosphorus Adsorption Procedure. J Environ Qual 1984, 13. [Google Scholar] [CrossRef]
- Lundberg, S.M.; Lee, S.-I. A Unified Approach to Interpreting Model Predictions. CoRR 2017, abs/1705.0.
- Guyon, I.; Weston, J.; Barnhill, S.; Vapnik, V. Gene Selection for Cancer Classification Using Support Vector Machines. Mach Learn 2002, 46, 389–422. [Google Scholar] [CrossRef]
- Breiman, L. Random Forests. Mach Learn 2001, 45, 5–32. [Google Scholar] [CrossRef]
- Chen, T.; Guestrin, C. XGBoost: A Scalable Tree Boosting System. In Proceedings of the Proceedings of the 22Nd ACM SIGKDD International Conference on Knowledge Discovery and Data Mining; ACM: New York, NY, USA, 2016; pp. 785–794. [Google Scholar]
- Xu, D.; Shi, Y.; Tsang, I.W.; Ong, Y.-S.; Gong, C.; Shen, X. Survey on Multi-Output Learning. IEEE Trans Neural Netw Learn Syst 2020, 31, 2409–2429. [Google Scholar] [CrossRef] [PubMed]
- Akiba, T.; Sano, S.; Yanase, T.; Ohta, T.; Koyama, M. Optuna: {A} Next-Generation Hyperparameter Optimization Framework. CoRR 2019, abs/1907.1.
- Shimizu, S.; Inazumi, T.; Kawahara, Y.; Washio, T.; Hoyer PATRIKHOYER, P.O.; Bollen, K.; Sogawa, Y.; Hyvärinen, A.; Hoyer, P.O.; Bollen SHIMIZU, K. DirectLiNGAM: A Direct Method for Learning a Linear Non-Gaussian Structural Equation Model Yasuhiro Sogawa Aapo Hyvärinen; 2011; Vol. 12.
- Niyogi, D.; Kishtawal, C.; Tripathi, S.; Govindaraju, R. Observational Evidence That Agricultural Intensification and Land Use Change May Be Reducing the Indian Summer Monsoon Rainfall. Water Resources Research - WATER RESOUR RES 2010, 46. [Google Scholar] [CrossRef]
- Hyvärinen, A.; Smith, S.M.; Spirtes, P. Pairwise Likelihood Ratios for Estimation of Non-Gaussian Structural Equation Models.
- Tukey, J.W. Comparing Individual Means in the Analysis of Variance. Biometrics 1949, 5 2, 99–114. [Google Scholar] [CrossRef]
- Rossum, G. Van; Drake, F.L. Python Tutorial. History 2010, 42, 1–122. [Google Scholar] [CrossRef]
- Hunter, J.D. Matplotlib: A 2D Graphics Environment. Computing in Science Engineering 2007, 9, 90–95. [Google Scholar] [CrossRef]
- Iatrou, M.; Karydas, C.; Tseni, X.; Mourelatos, S. Representation Learning with a Variational Autoencoder for Predicting Nitrogen Requirement in Rice. Remote Sens (Basel) 2022, 14. [Google Scholar] [CrossRef]
- Iatrou, M.; Karydas, C.; Iatrou, G.; Pitsiorlas, I.; Aschonitis, V.; Raptis, I.; Mpetas, S.; Kravvas, K.; Mourelatos, S. Topdressing Nitrogen Demand Prediction in Rice Crop Using Machine Learning Systems. Agriculture 2021, 11. [Google Scholar] [CrossRef]
- HUSSAIN, A.; Ghafoor, A.; Anwar-ul-Haq, M.; NAWAZ, M. Application of the Langmuir and Freundlich Equations for P Adsorption Phenomenon in Saline-Sodic Soils. 2002, 5.
- Lair, G.J.; Zehetner, F.; Khan, Z.H.; Gerzabek, M.H. Phosphorus Sorption–Desorption in Alluvial Soils of a Young Weathering Sequence at the Danube River. Geoderma 2009, 149, 39–44. [Google Scholar] [CrossRef]
- Rossi, C.G.; Heil, D.M.; Bonumà, N.B.; Williams, J.R. Evaluation of the Langmuir Model in the Soil and Water Assessment Tool for a High Soil Phosphorus Condition. Environmental Modelling & Software 2012, 38, 40–49. [Google Scholar] [CrossRef]
- Yang, X.; Chen, X.; Yang, X. Effect of Organic Matter on Phosphorus Adsorption and Desorption in a Black Soil from Northeast China. Soil Tillage Res 2019, 187, 85–91. [Google Scholar] [CrossRef]
- Iatrou, M.; Tziachris, P.; Bilias, F.; Kekelis, P.; Pavlakis, C.; Theofilidou, A.; Papadopoulos, I.; Strouthopoulos, G.; Giannopoulos, G.; Arampatzis, D.; et al. Data-Driven and Mechanistic Soil Modeling for Precision Fertilization Management in Cotton. Nitrogen 2025, 6. [Google Scholar] [CrossRef]
- Halliday, D.J.; Association, I.F.I. IFA World Fertilizer Use Manual; International Fertilizer Industry Association, 1992; ISBN 9782950629906.
Figure 1.
The results of the feature evaluation using SHAP for the feature importance of the XGBoost model trained on the feature-augmented dataset.
Figure 1.
The results of the feature evaluation using SHAP for the feature importance of the XGBoost model trained on the feature-augmented dataset.
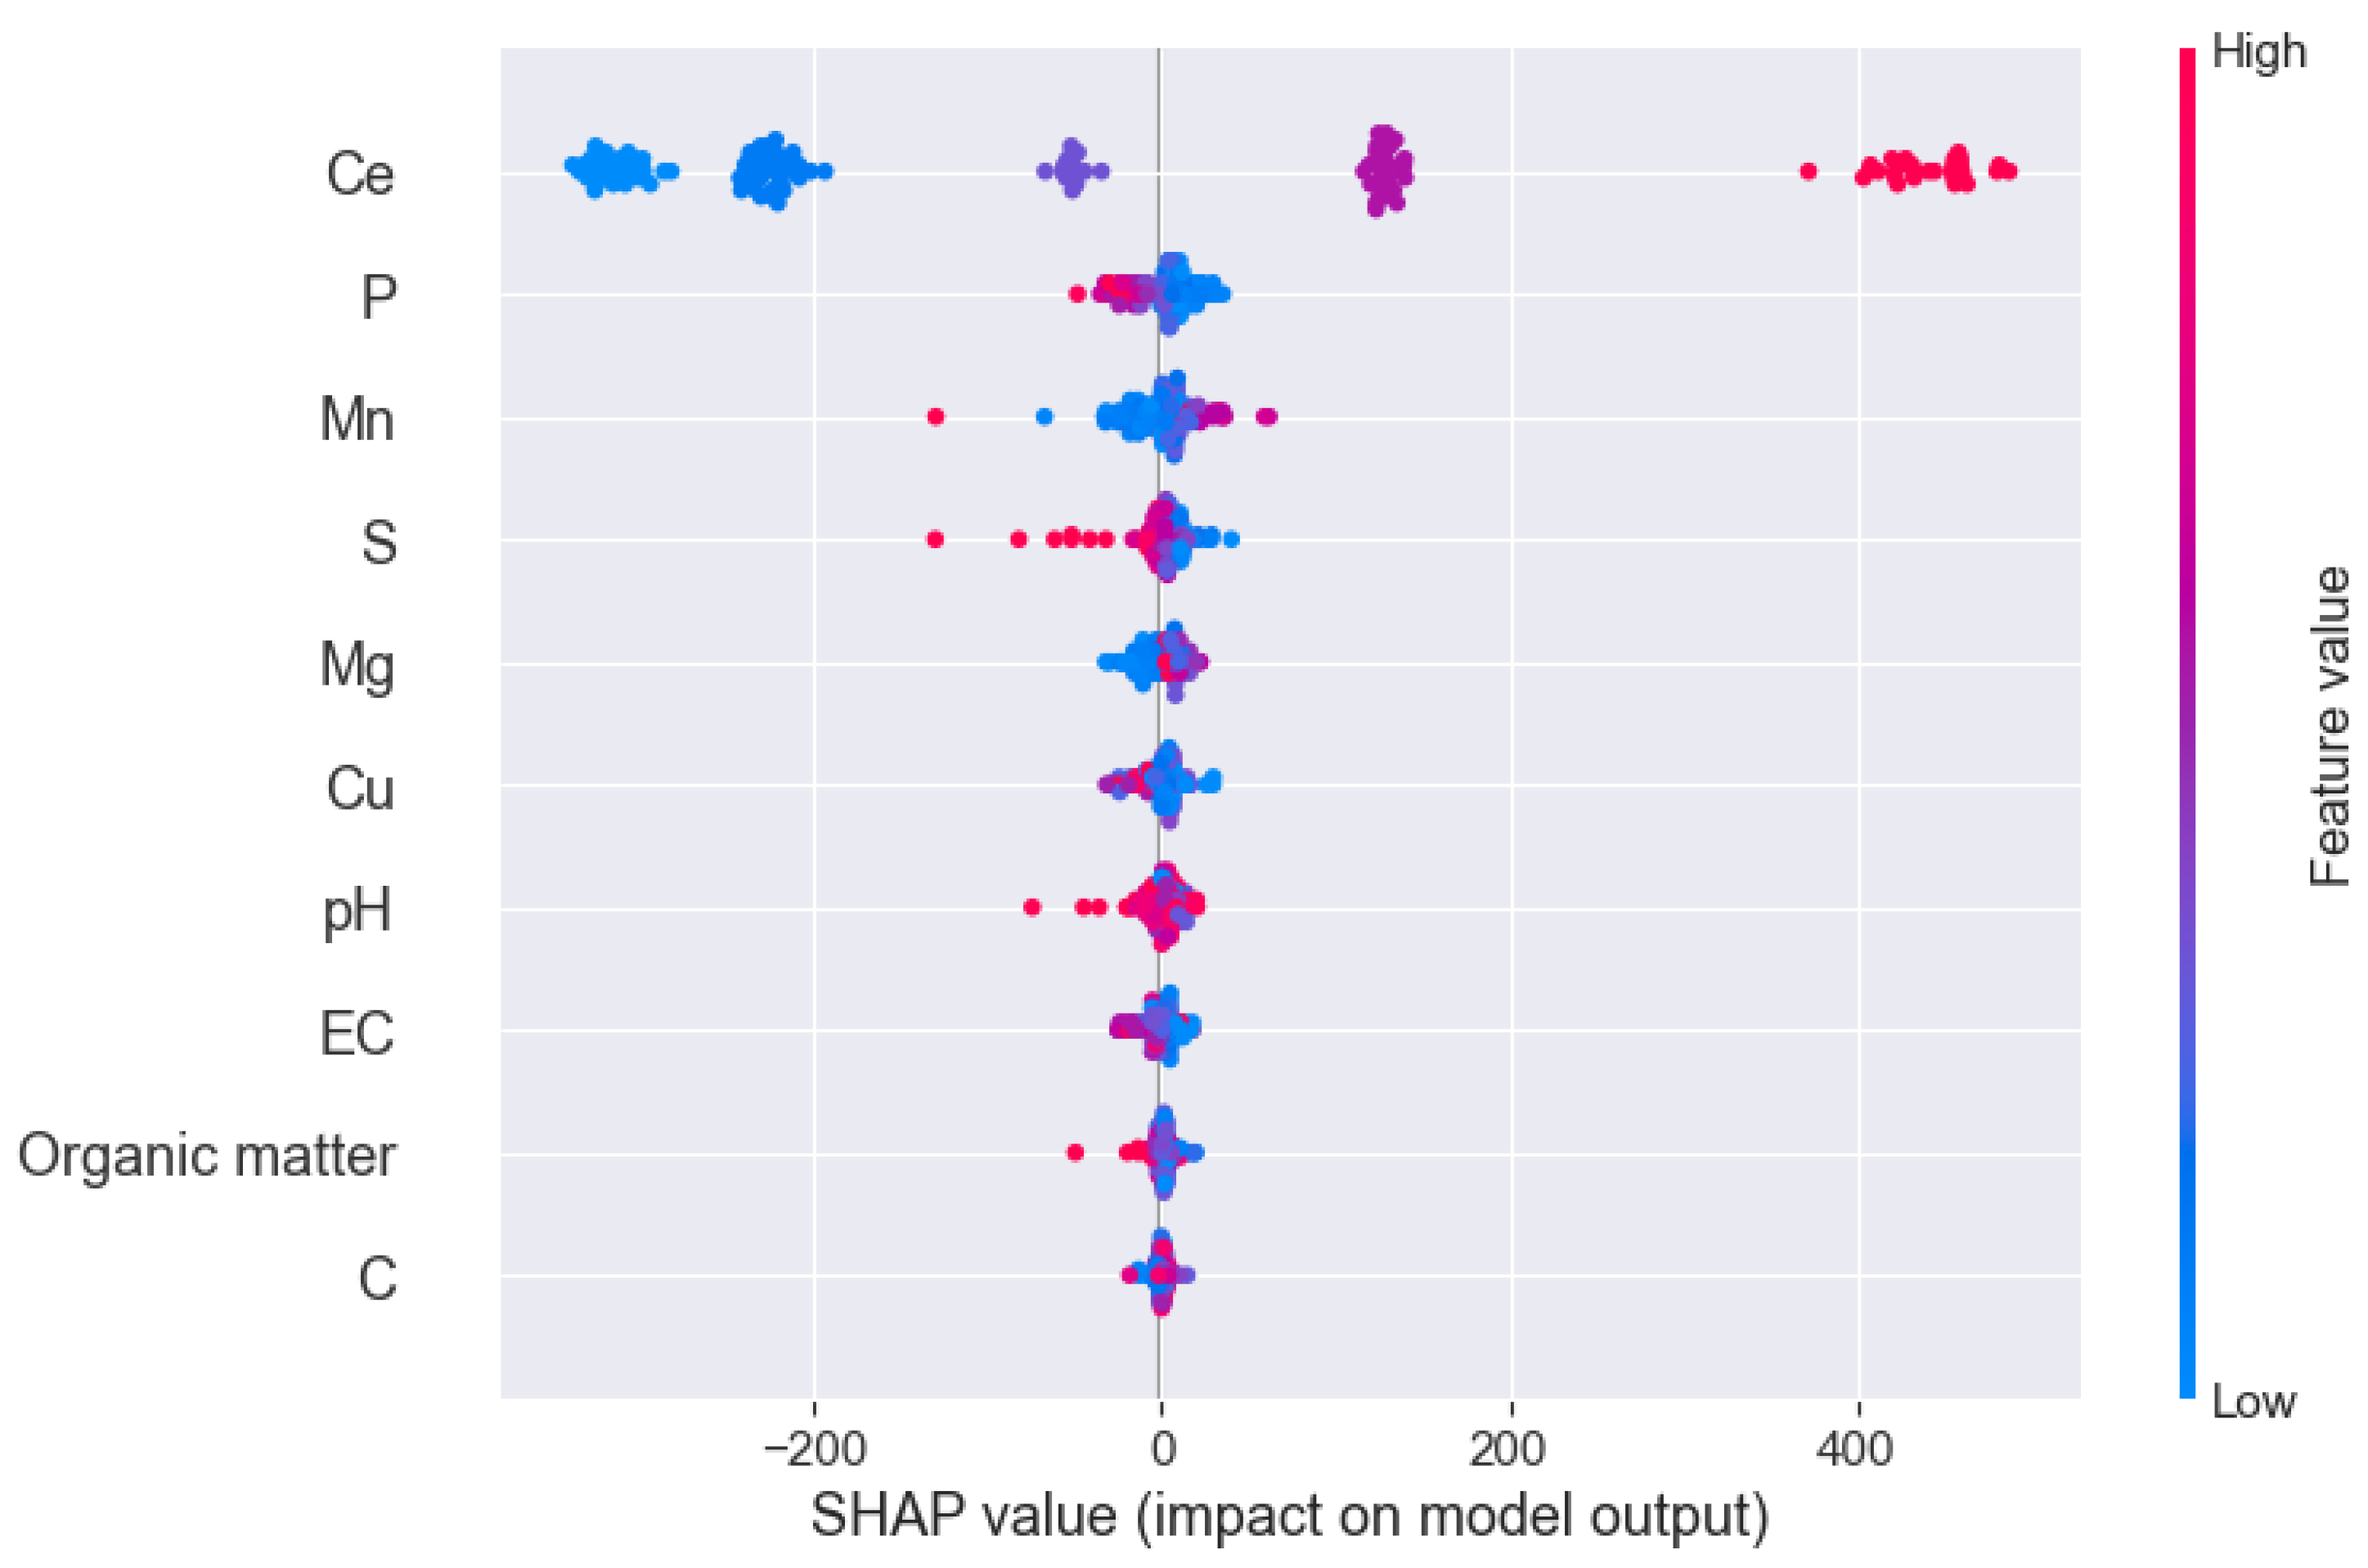
Figure 2.
SHAP dependence plots show how much the value of the most significant variables (Olsen P (a), Manganese (b), Sand content (c) and Magnesium (d)) changes the prediction of the P sorption capacity in the soil.
Figure 2.
SHAP dependence plots show how much the value of the most significant variables (Olsen P (a), Manganese (b), Sand content (c) and Magnesium (d)) changes the prediction of the P sorption capacity in the soil.
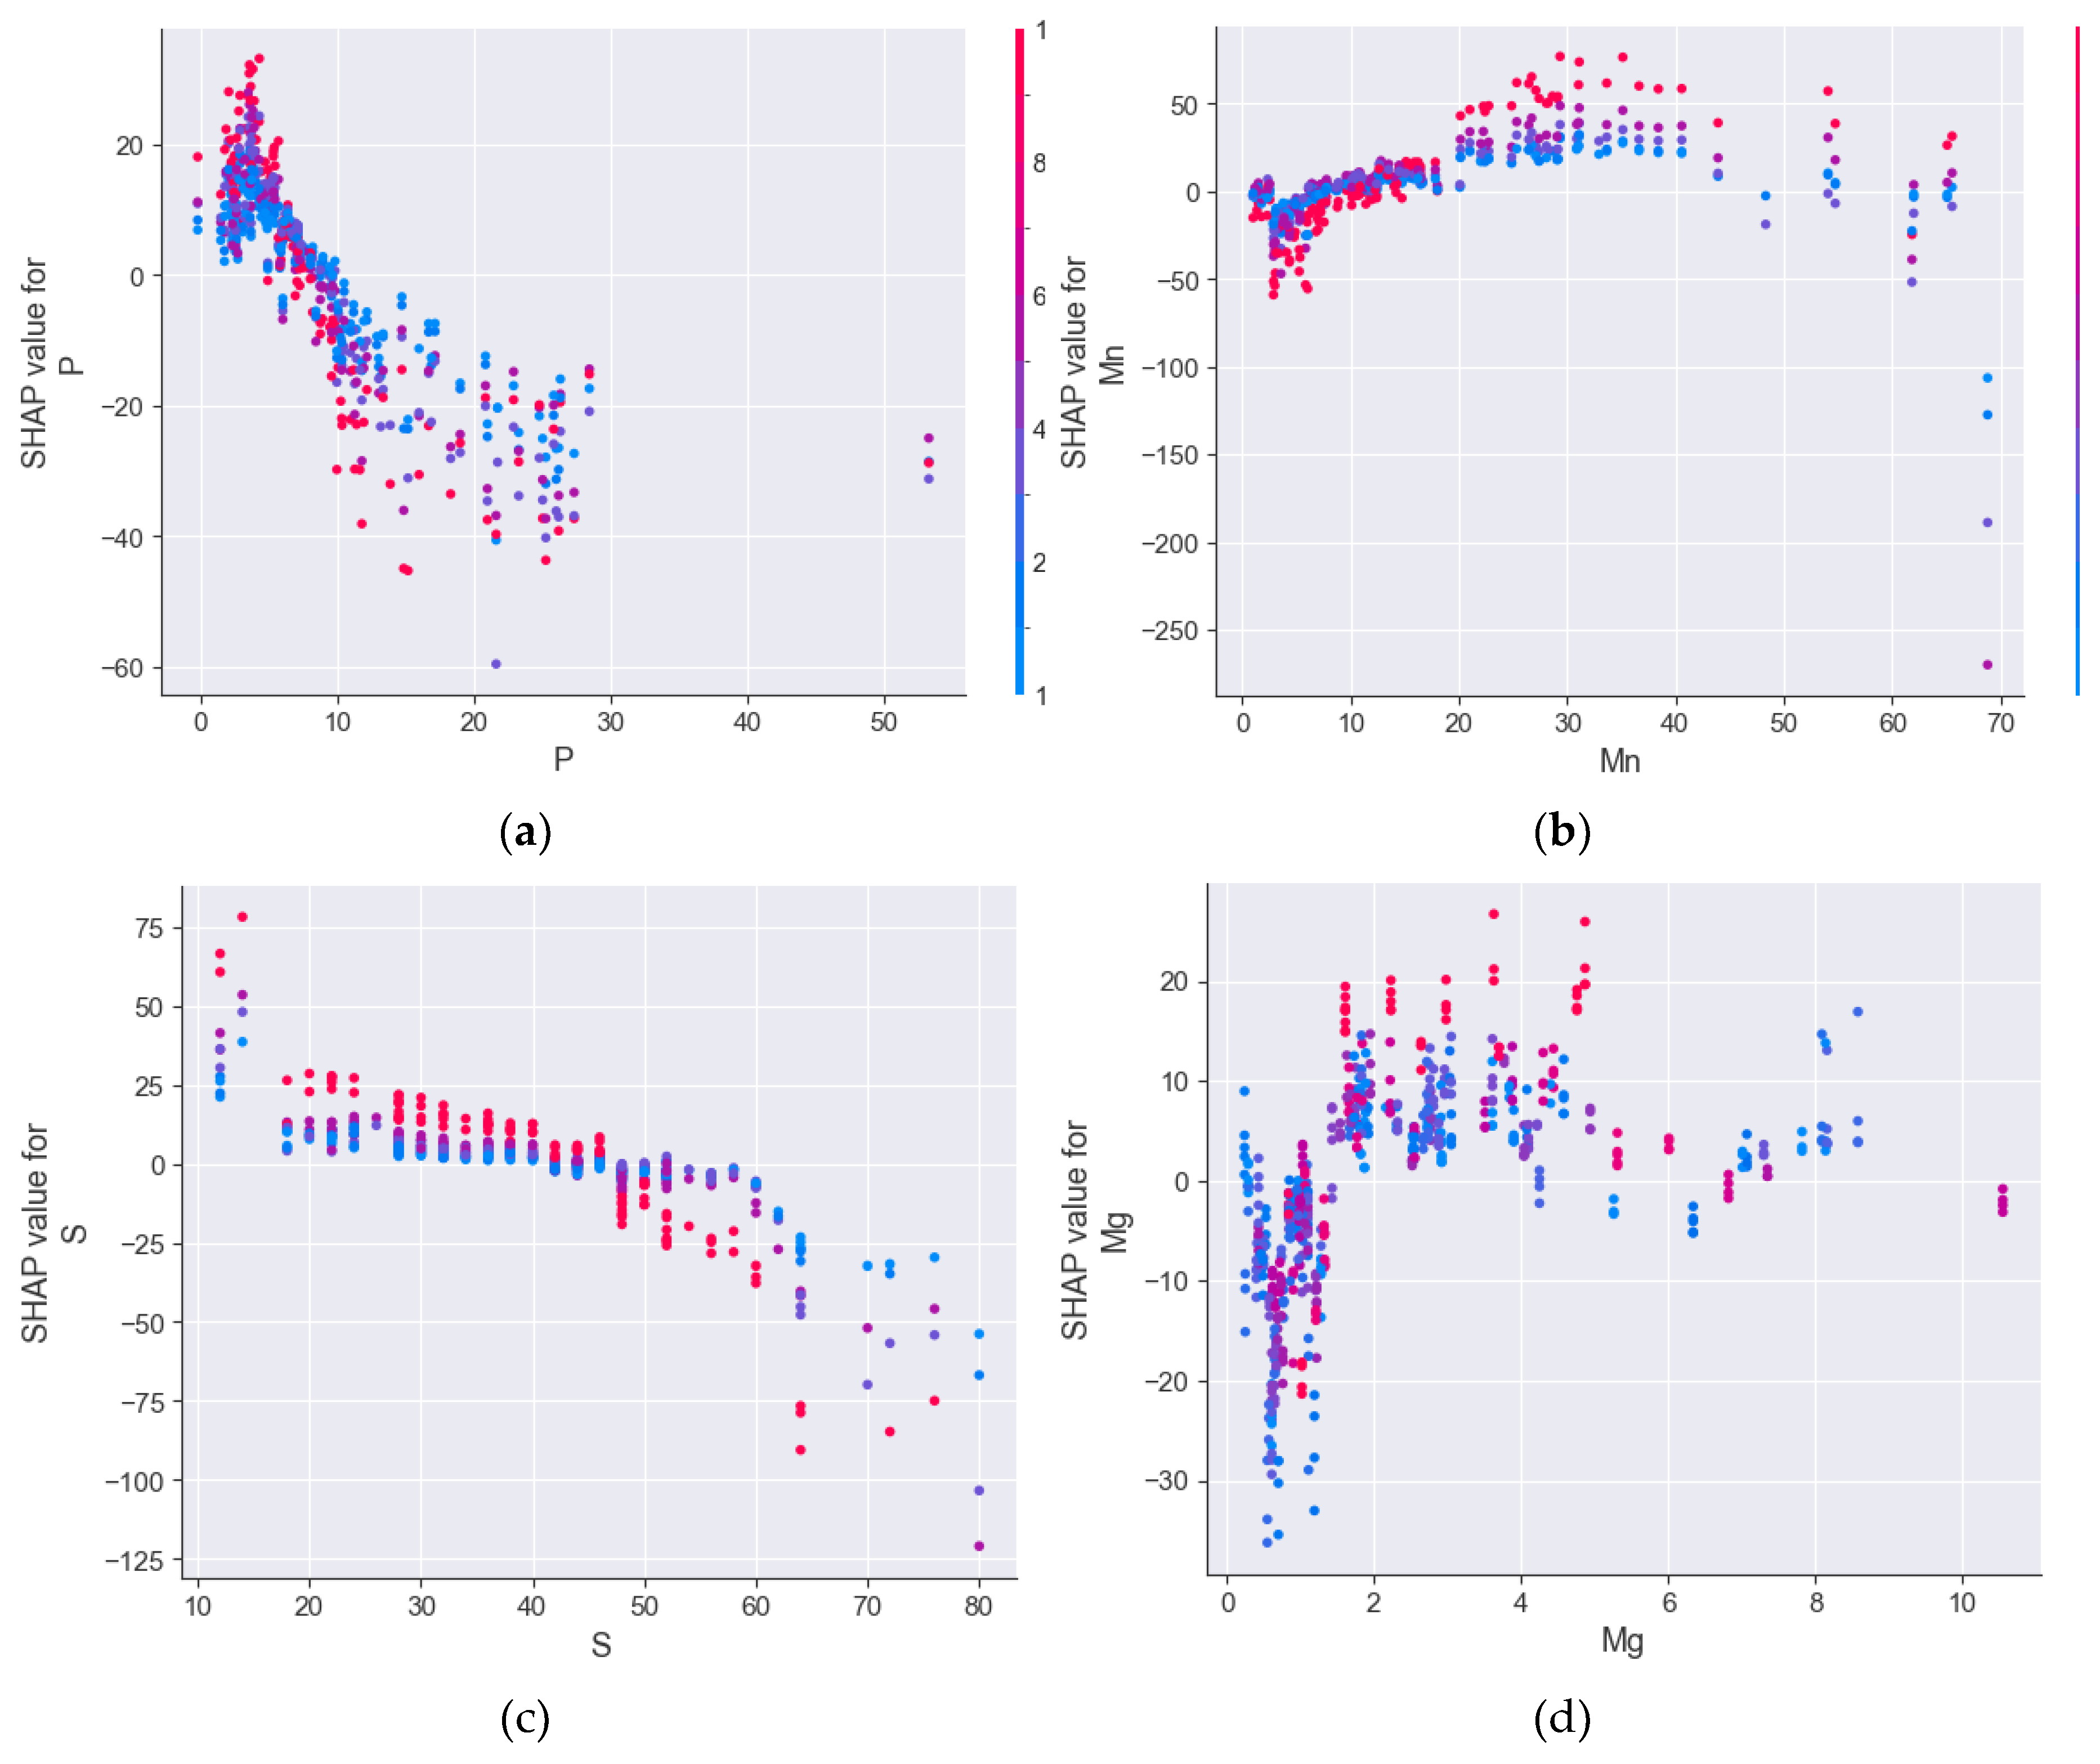
Figure 3.
Directed acyclic graph indicating the causal relationship between the variables for the soil samples equilibrated with a) 1, b) 2, c) 4, d) 6 and e) 10 mg P kg-1. The direction of the arrow captures the direction of the causality, showing that Olsen P and sand content consistently act as causal factors contributing to the reduction of P adsorption.
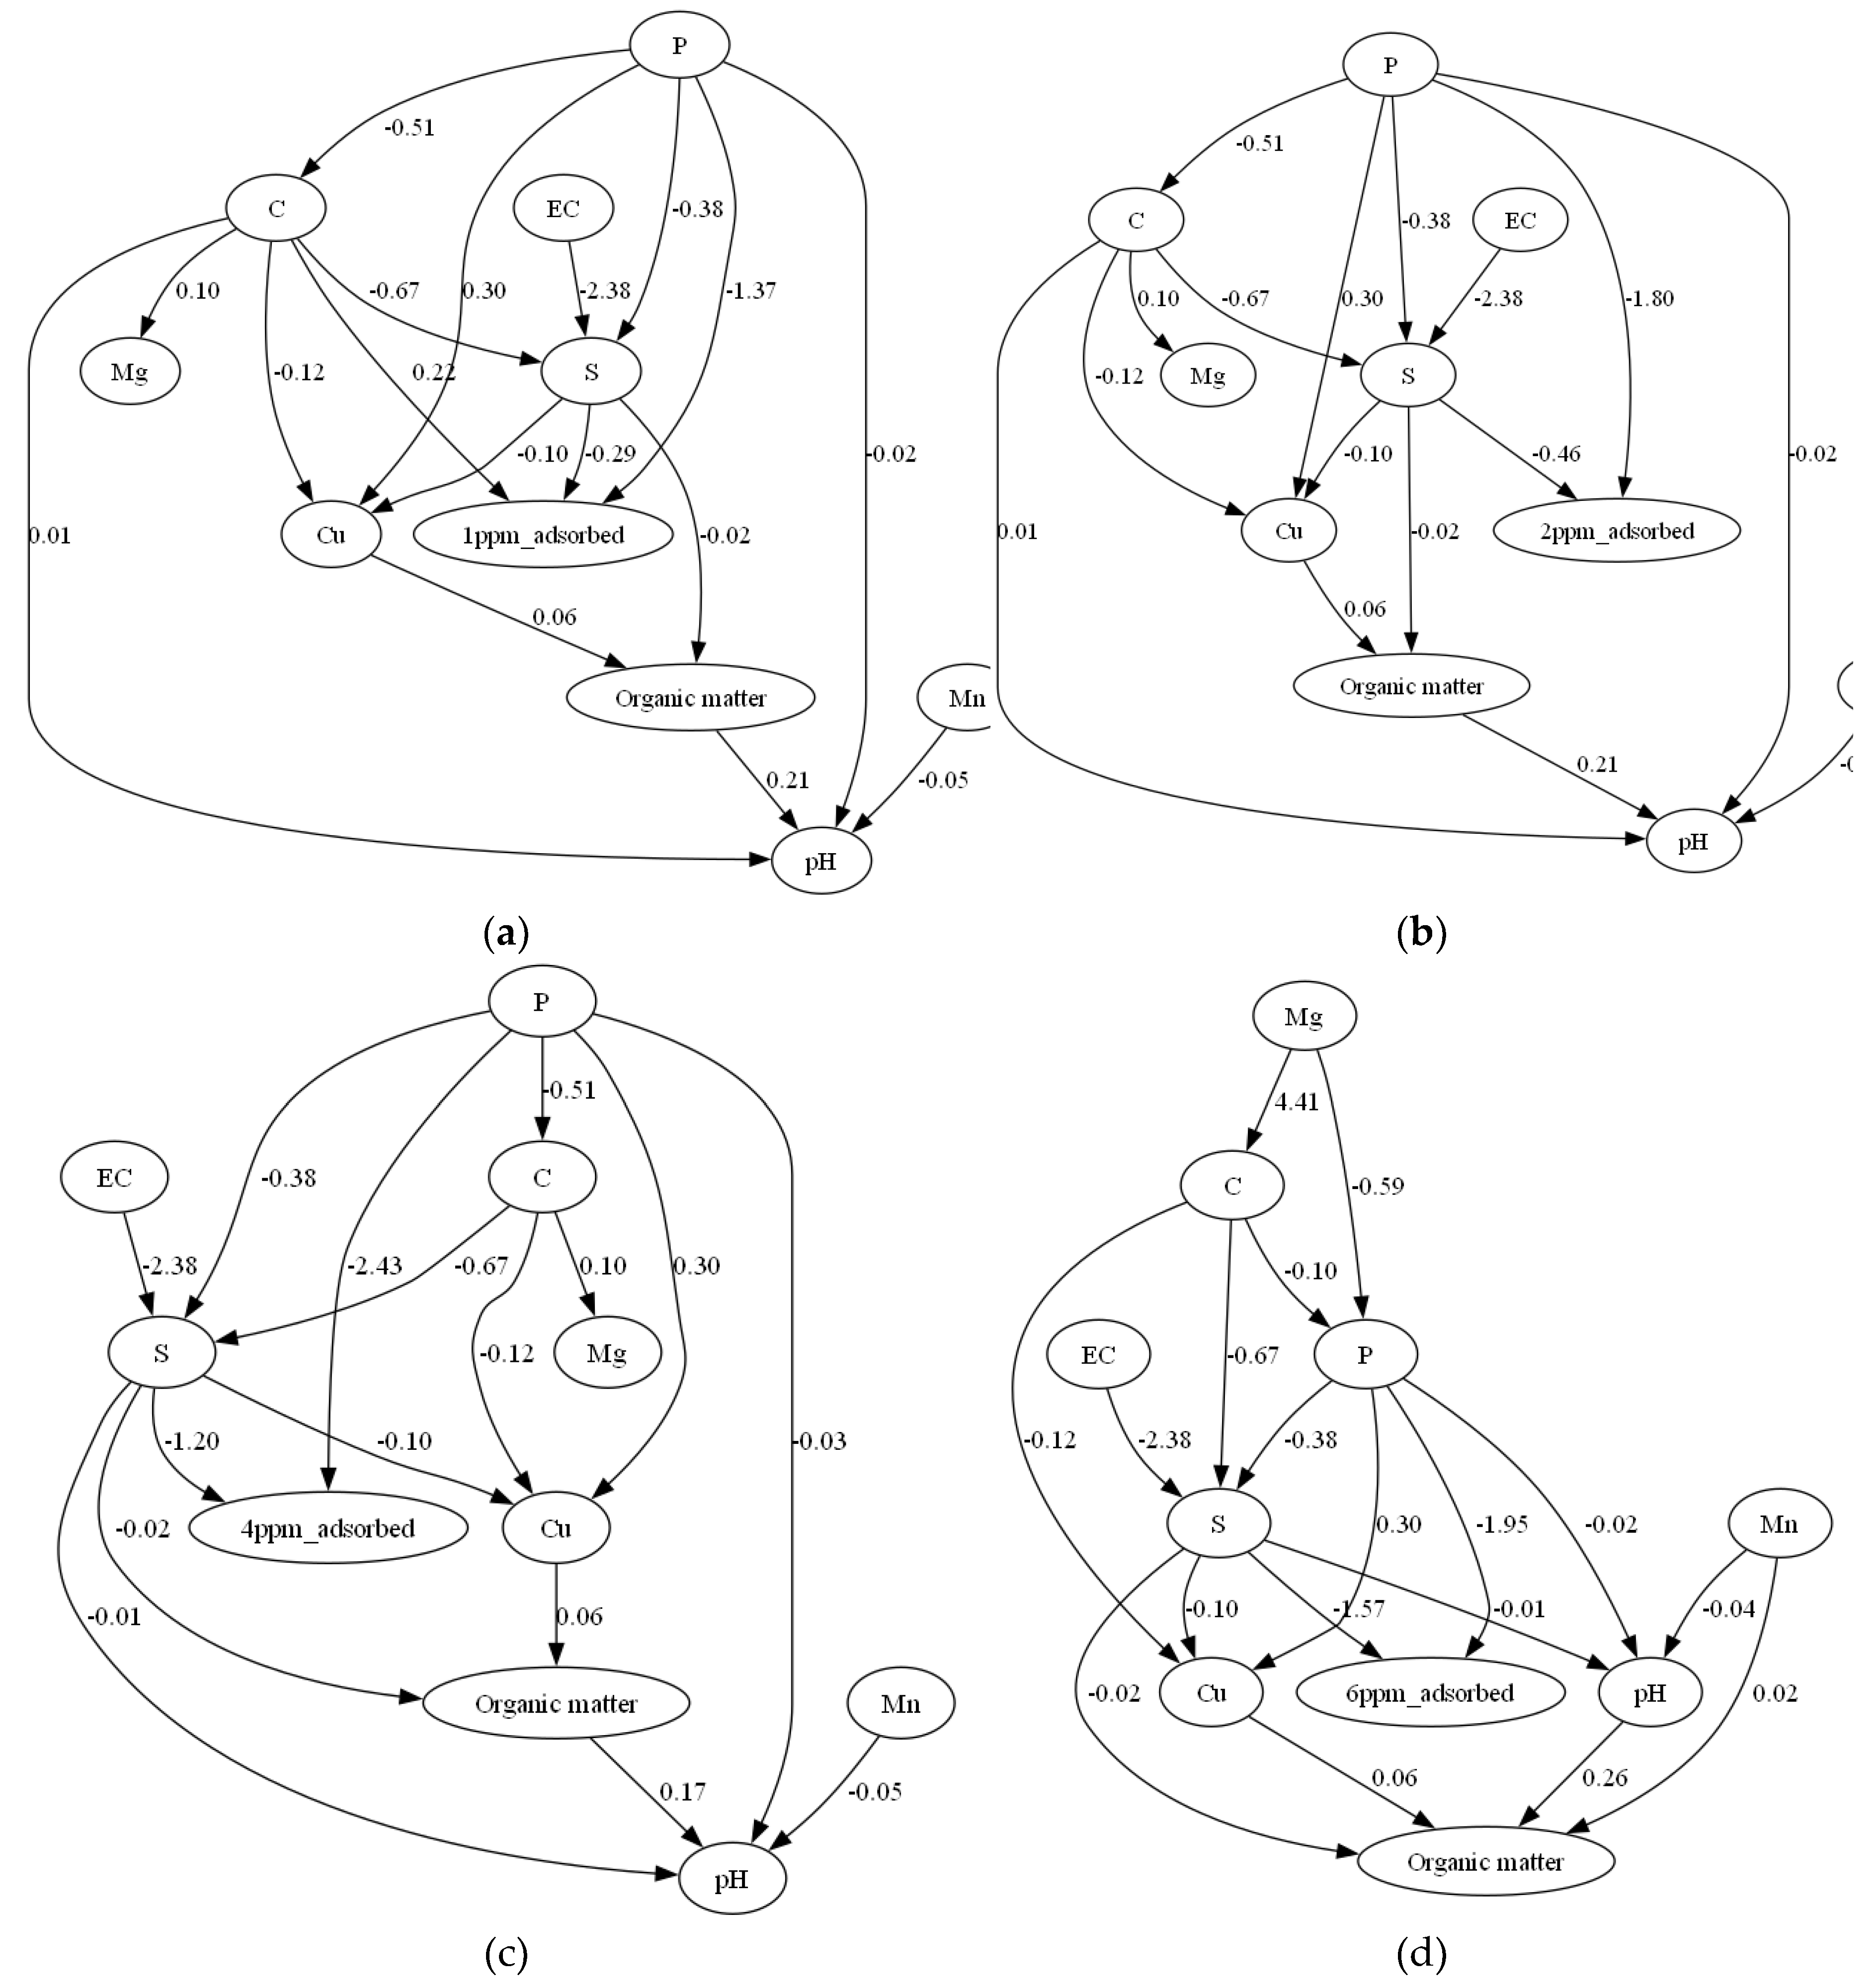
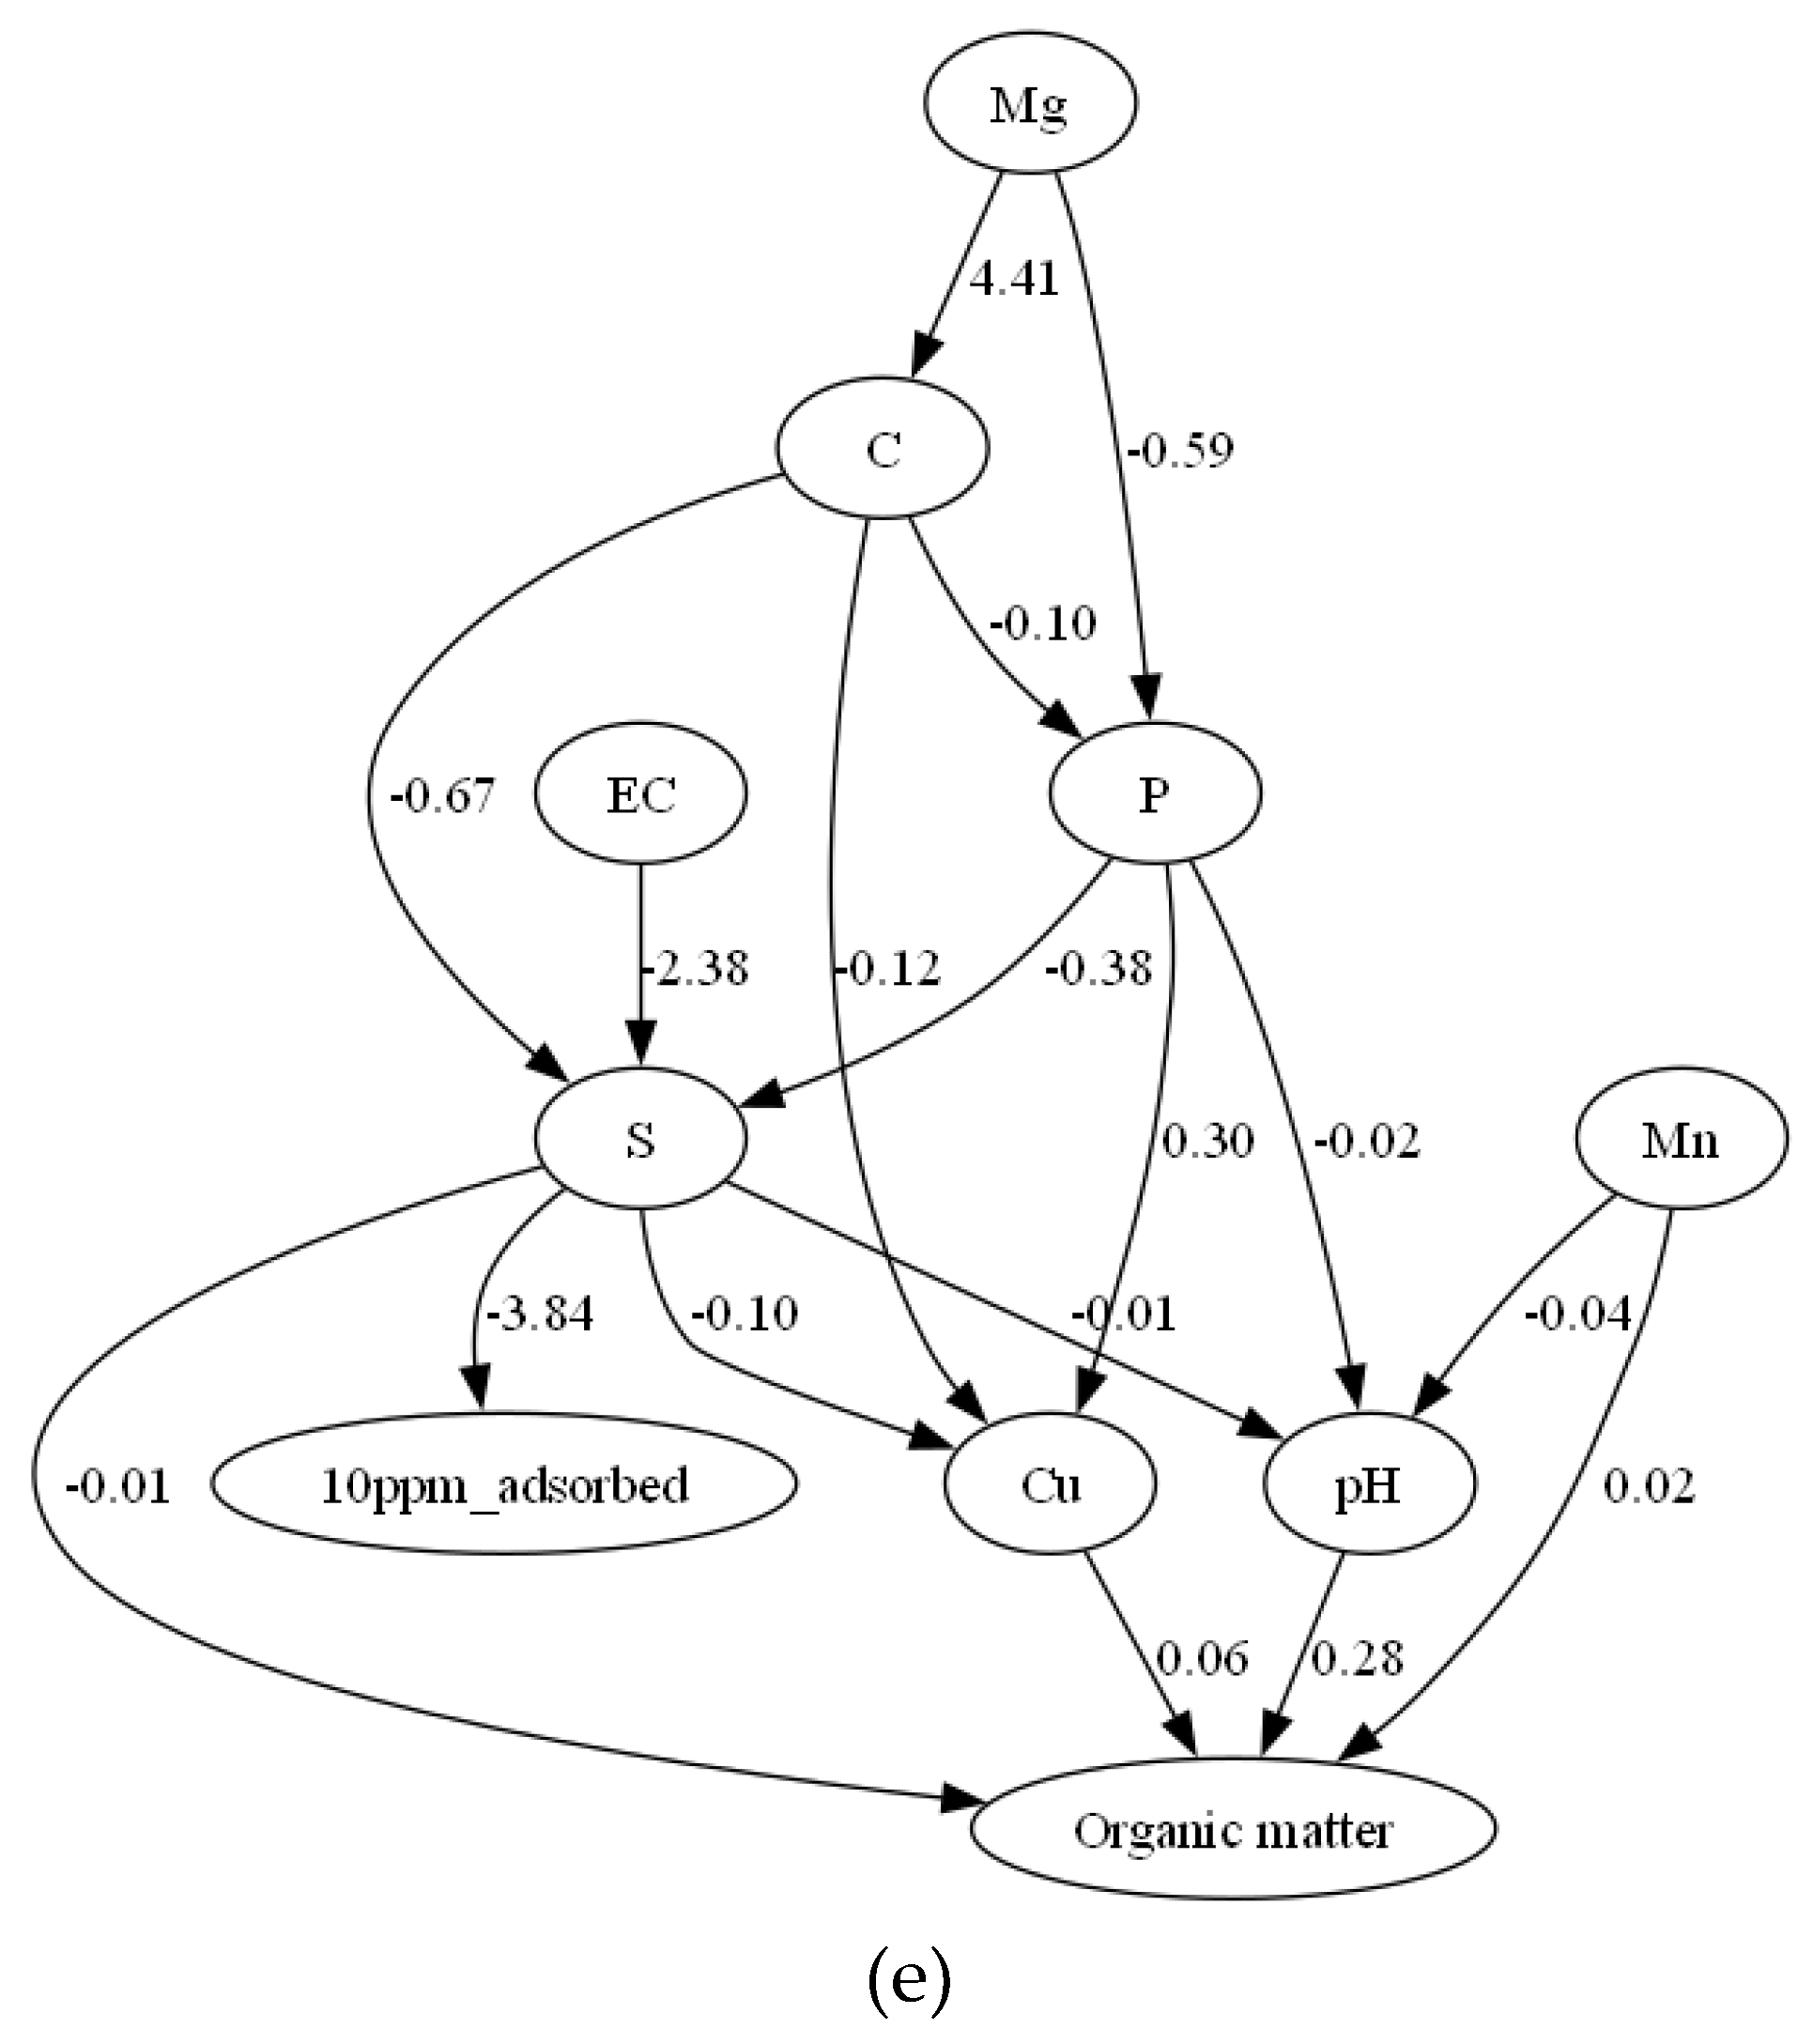
Figure 4.
Langmuir isotherms of P adsorbed onto soils equilibrated with different contents of P for a) the different soil types and b) based on the three main soil classes (sandy, loamy, clayey).
Figure 4.
Langmuir isotherms of P adsorbed onto soils equilibrated with different contents of P for a) the different soil types and b) based on the three main soil classes (sandy, loamy, clayey).
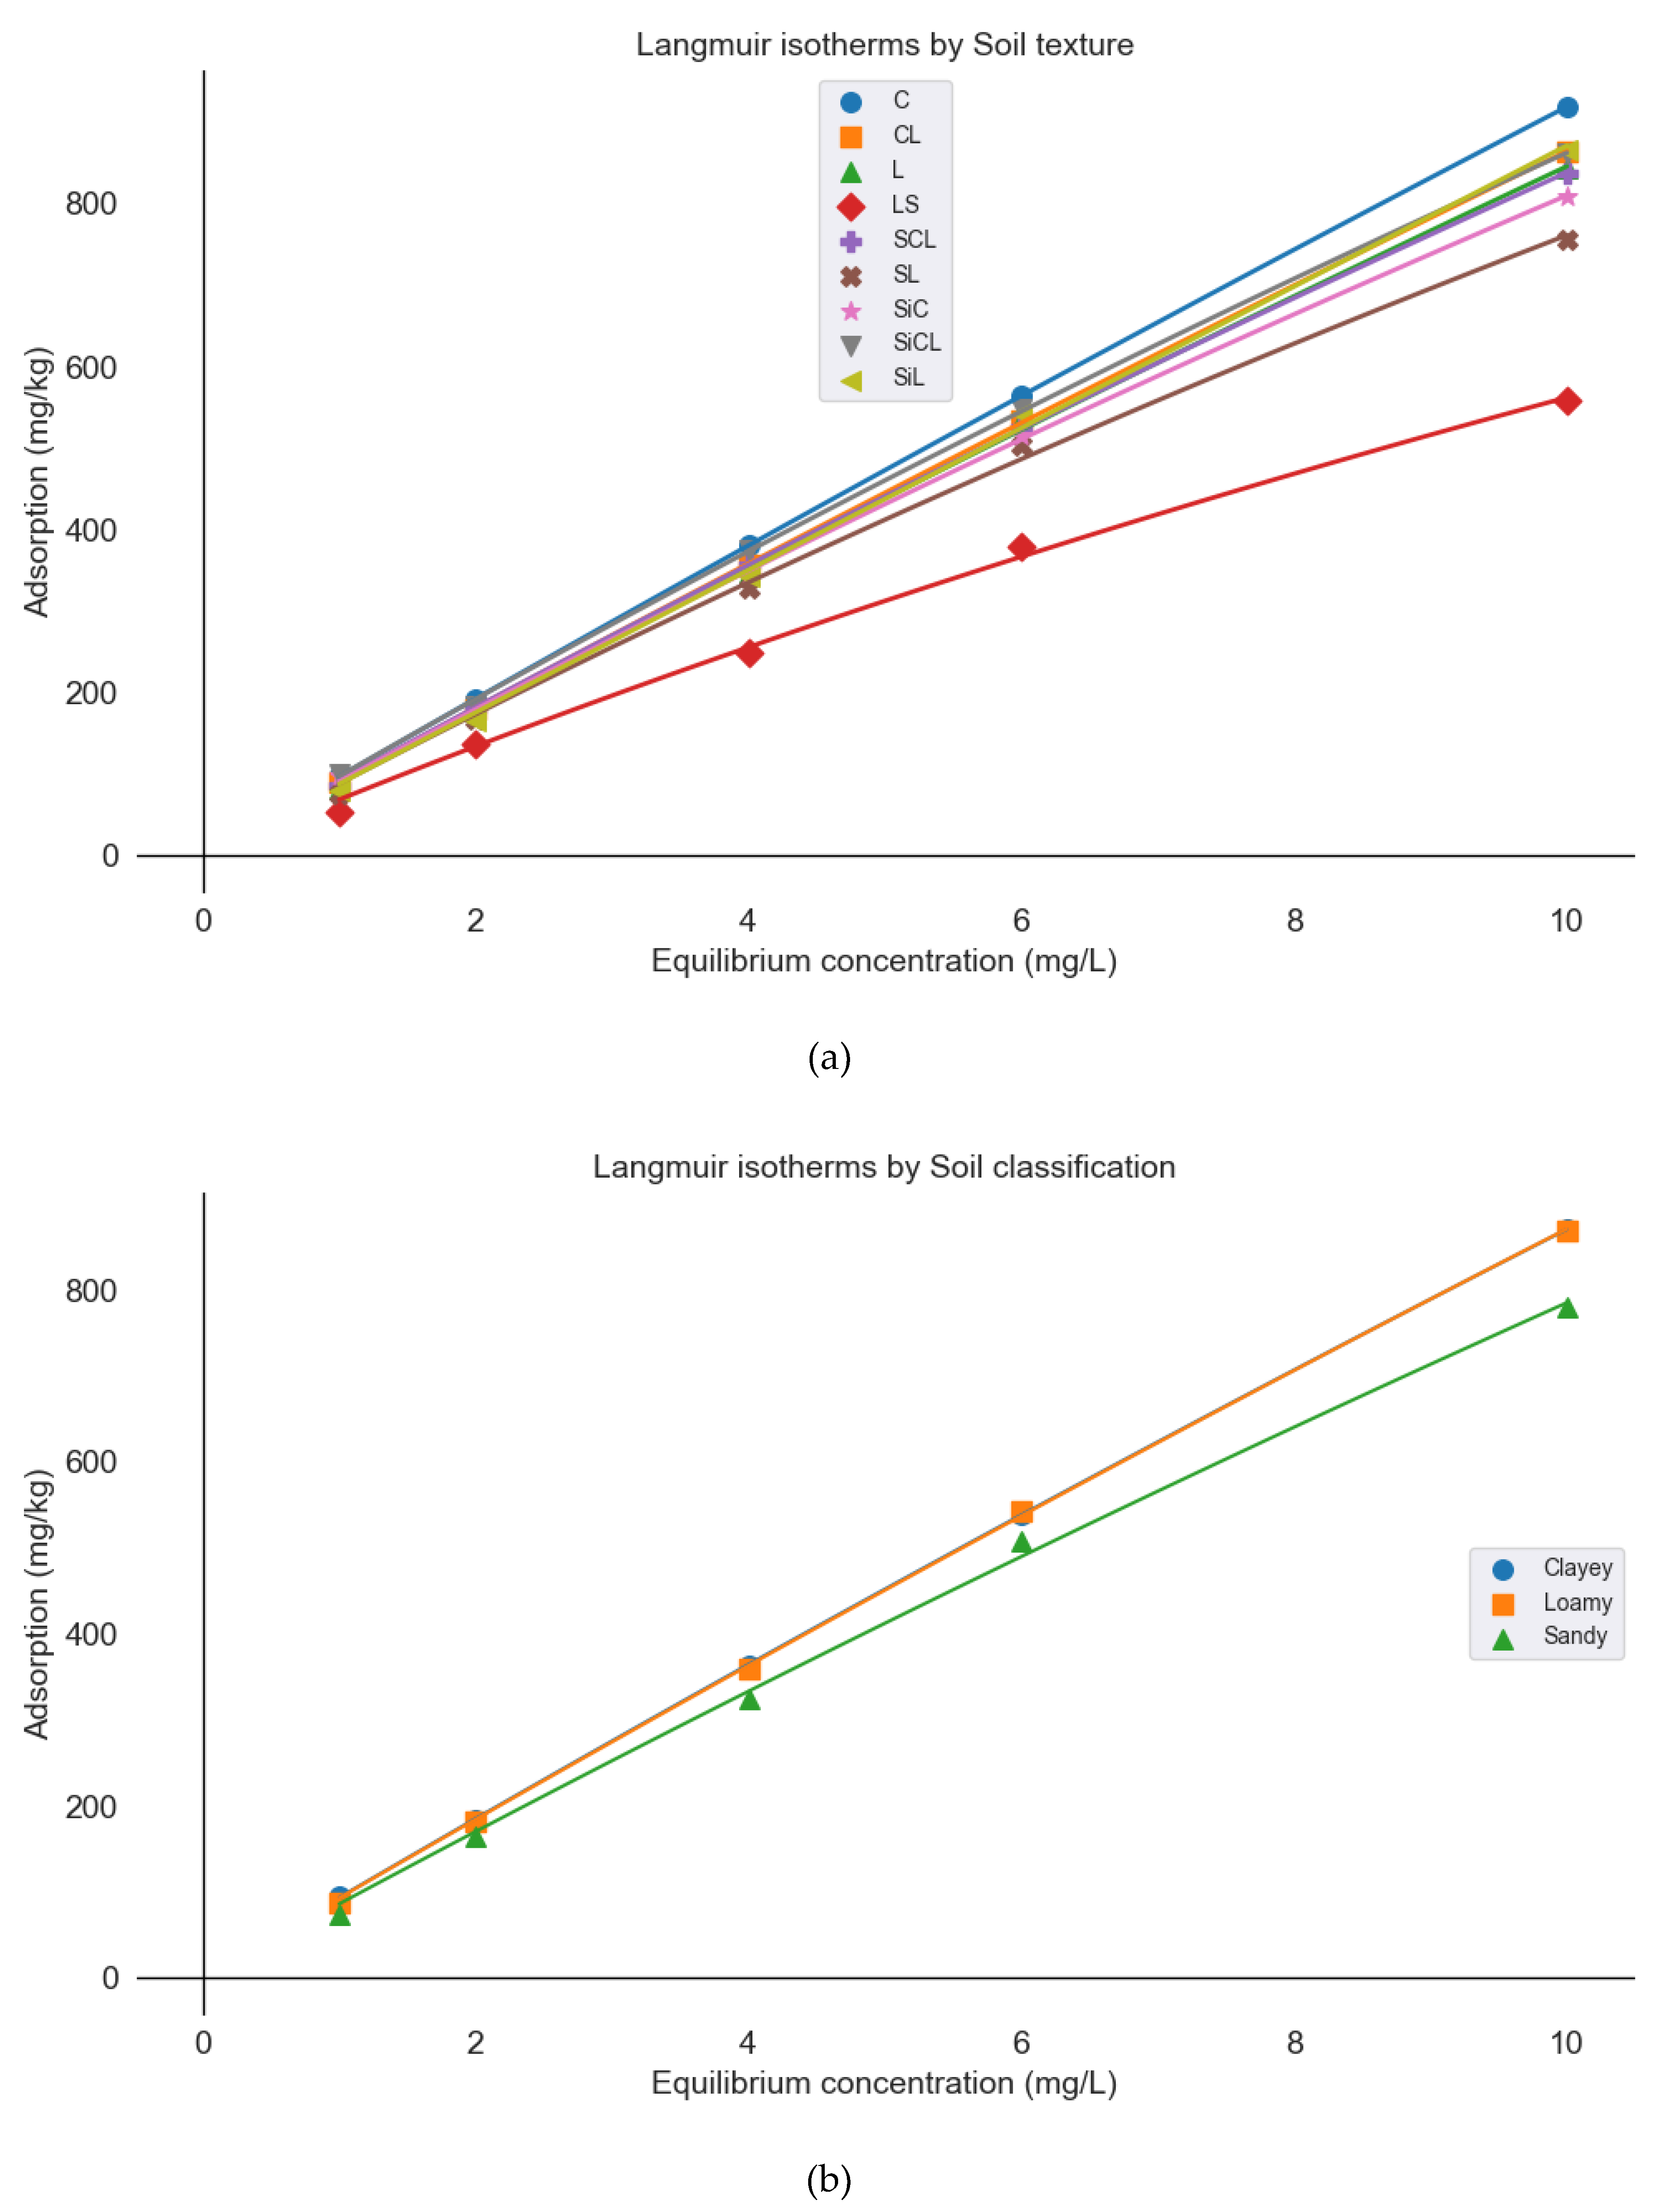
Figure 5.
Relationship between actual and predicted P adsorption values using the multi-output XGBoost model on the test set. The model predicts P adsorption at five equilibrium concentrations (Ce = 1, 2, 4, 6, and 10 mg/L) for each of the 30 test samples, resulting in a total of 150 data points. The red dashed line represents the linear regression fit, and the R2 value reflects the model’s overall predictive performance across all outputs.
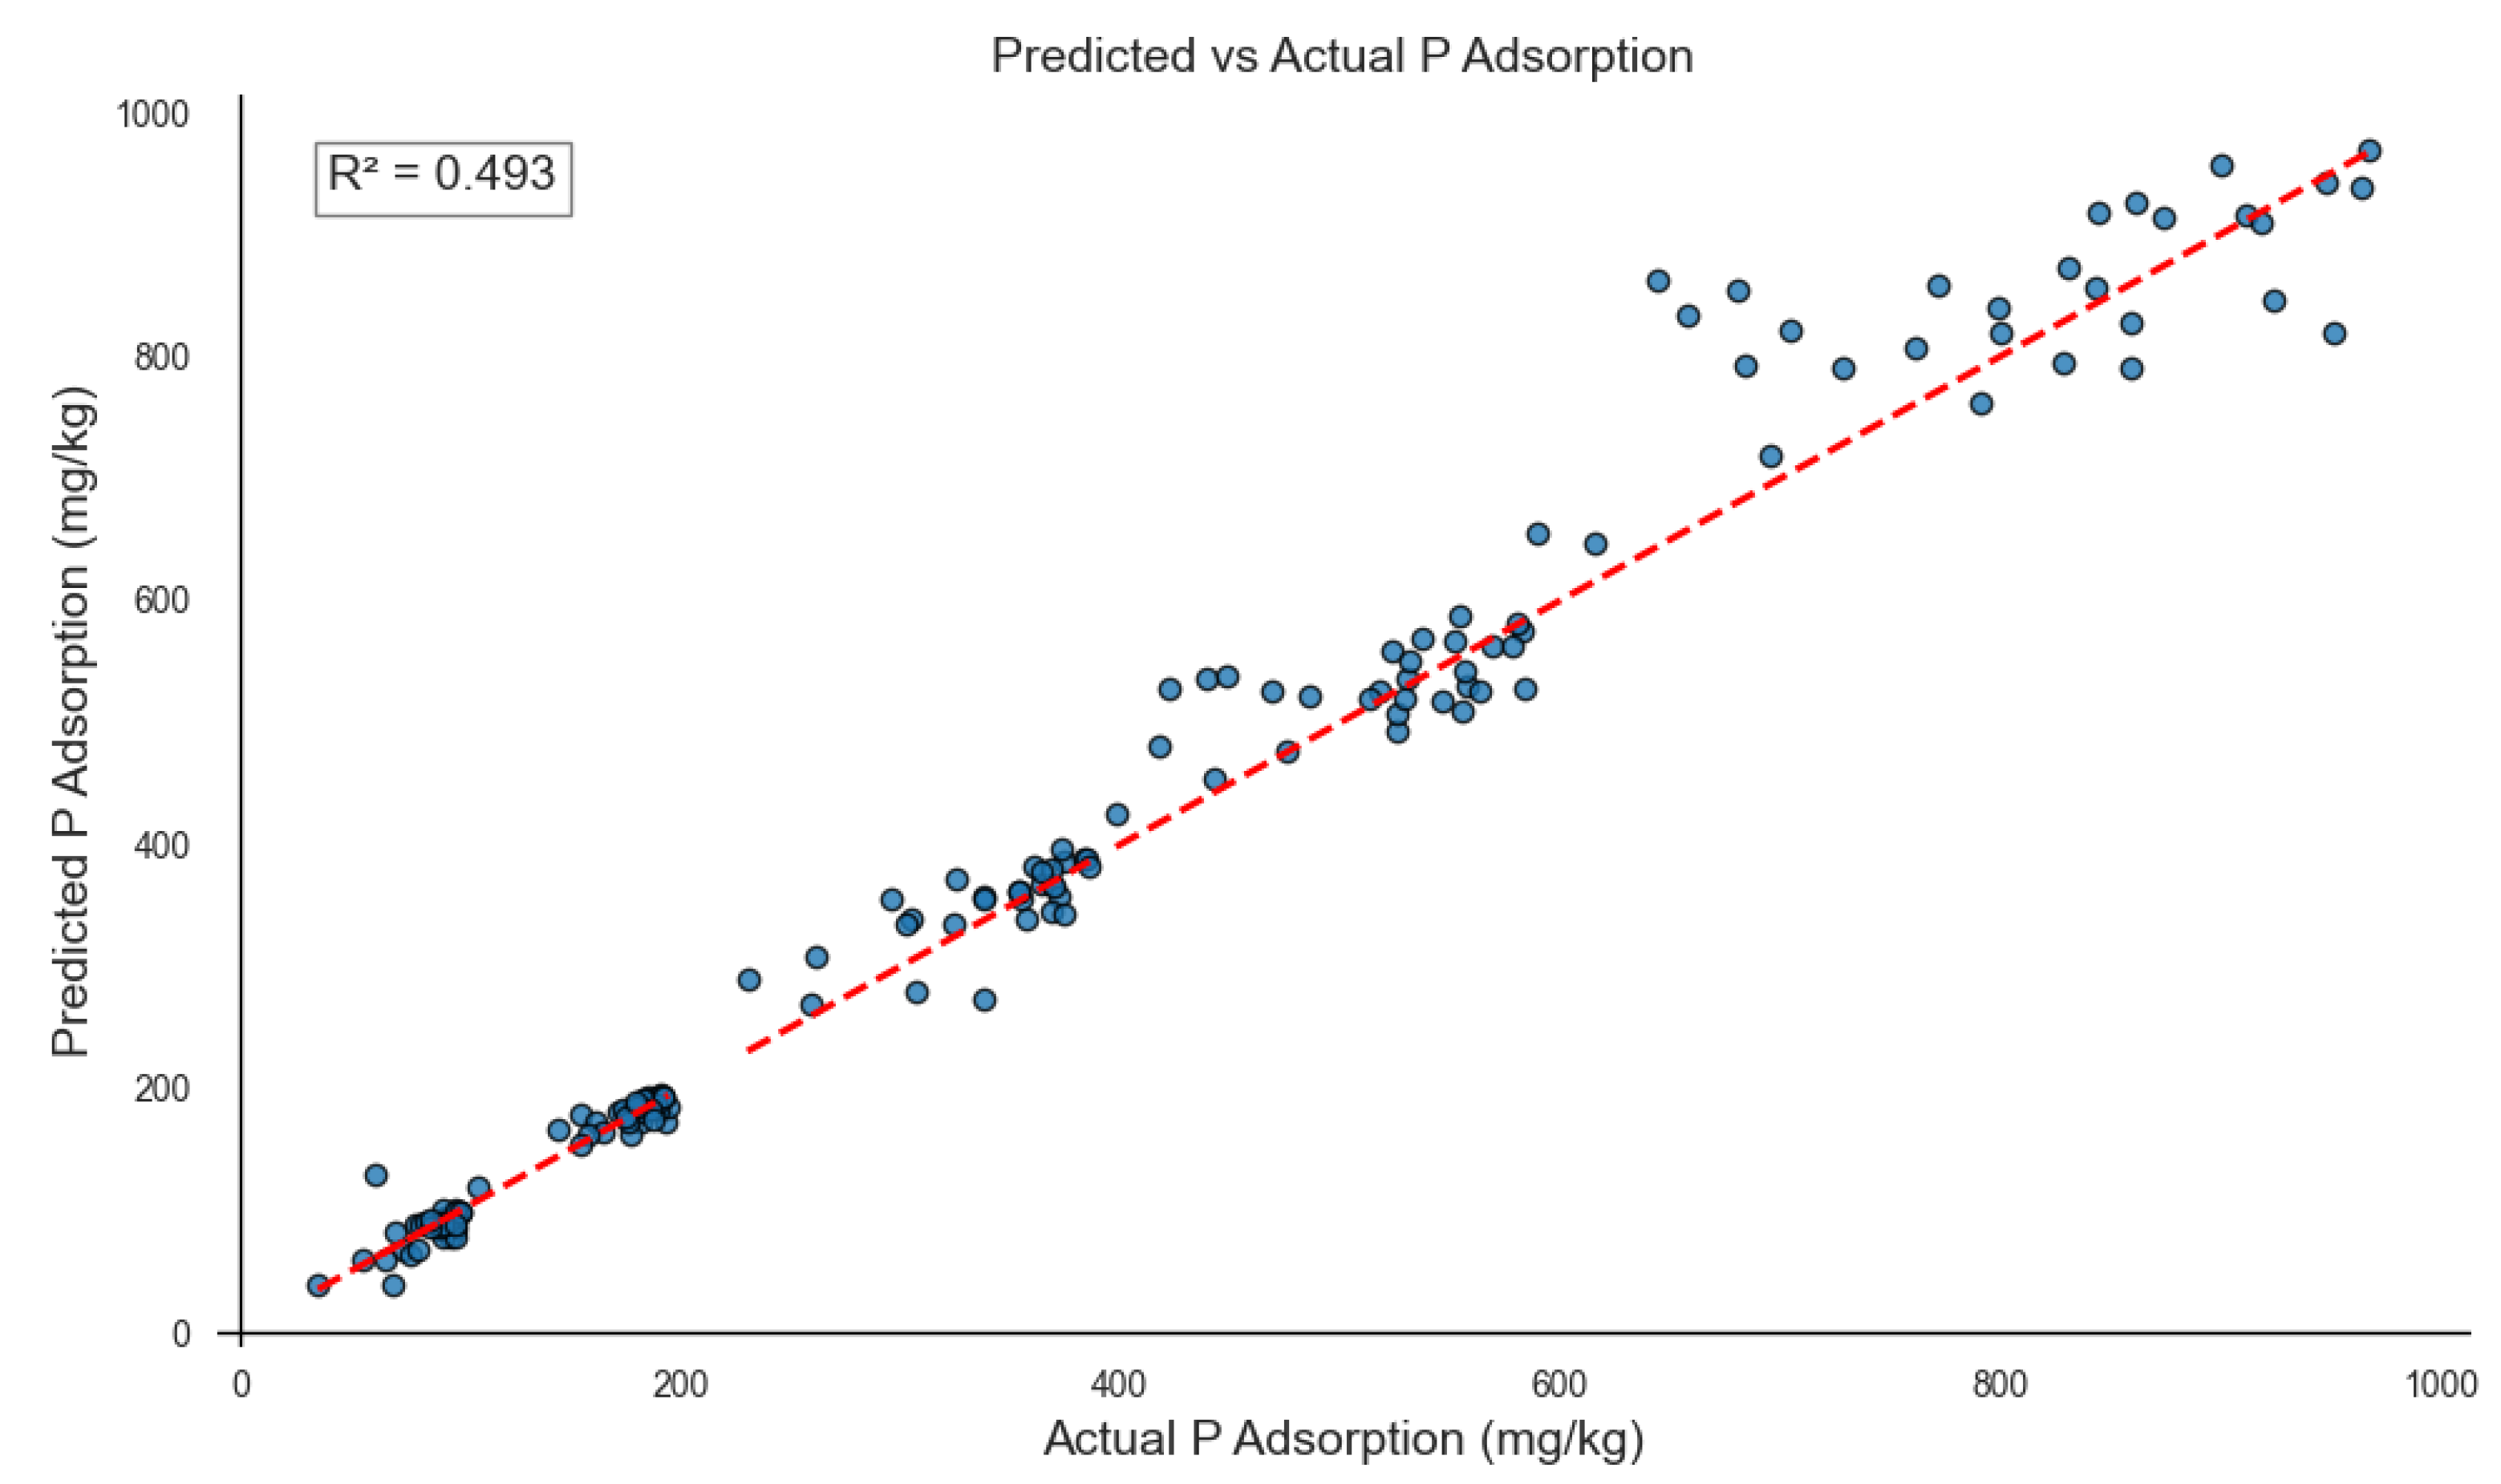
Figure 6.
P adsorption across Olsen P bins as estimated by the Langmuir isotherms and the multi-output XGBoost model.
Figure 6.
P adsorption across Olsen P bins as estimated by the Langmuir isotherms and the multi-output XGBoost model.
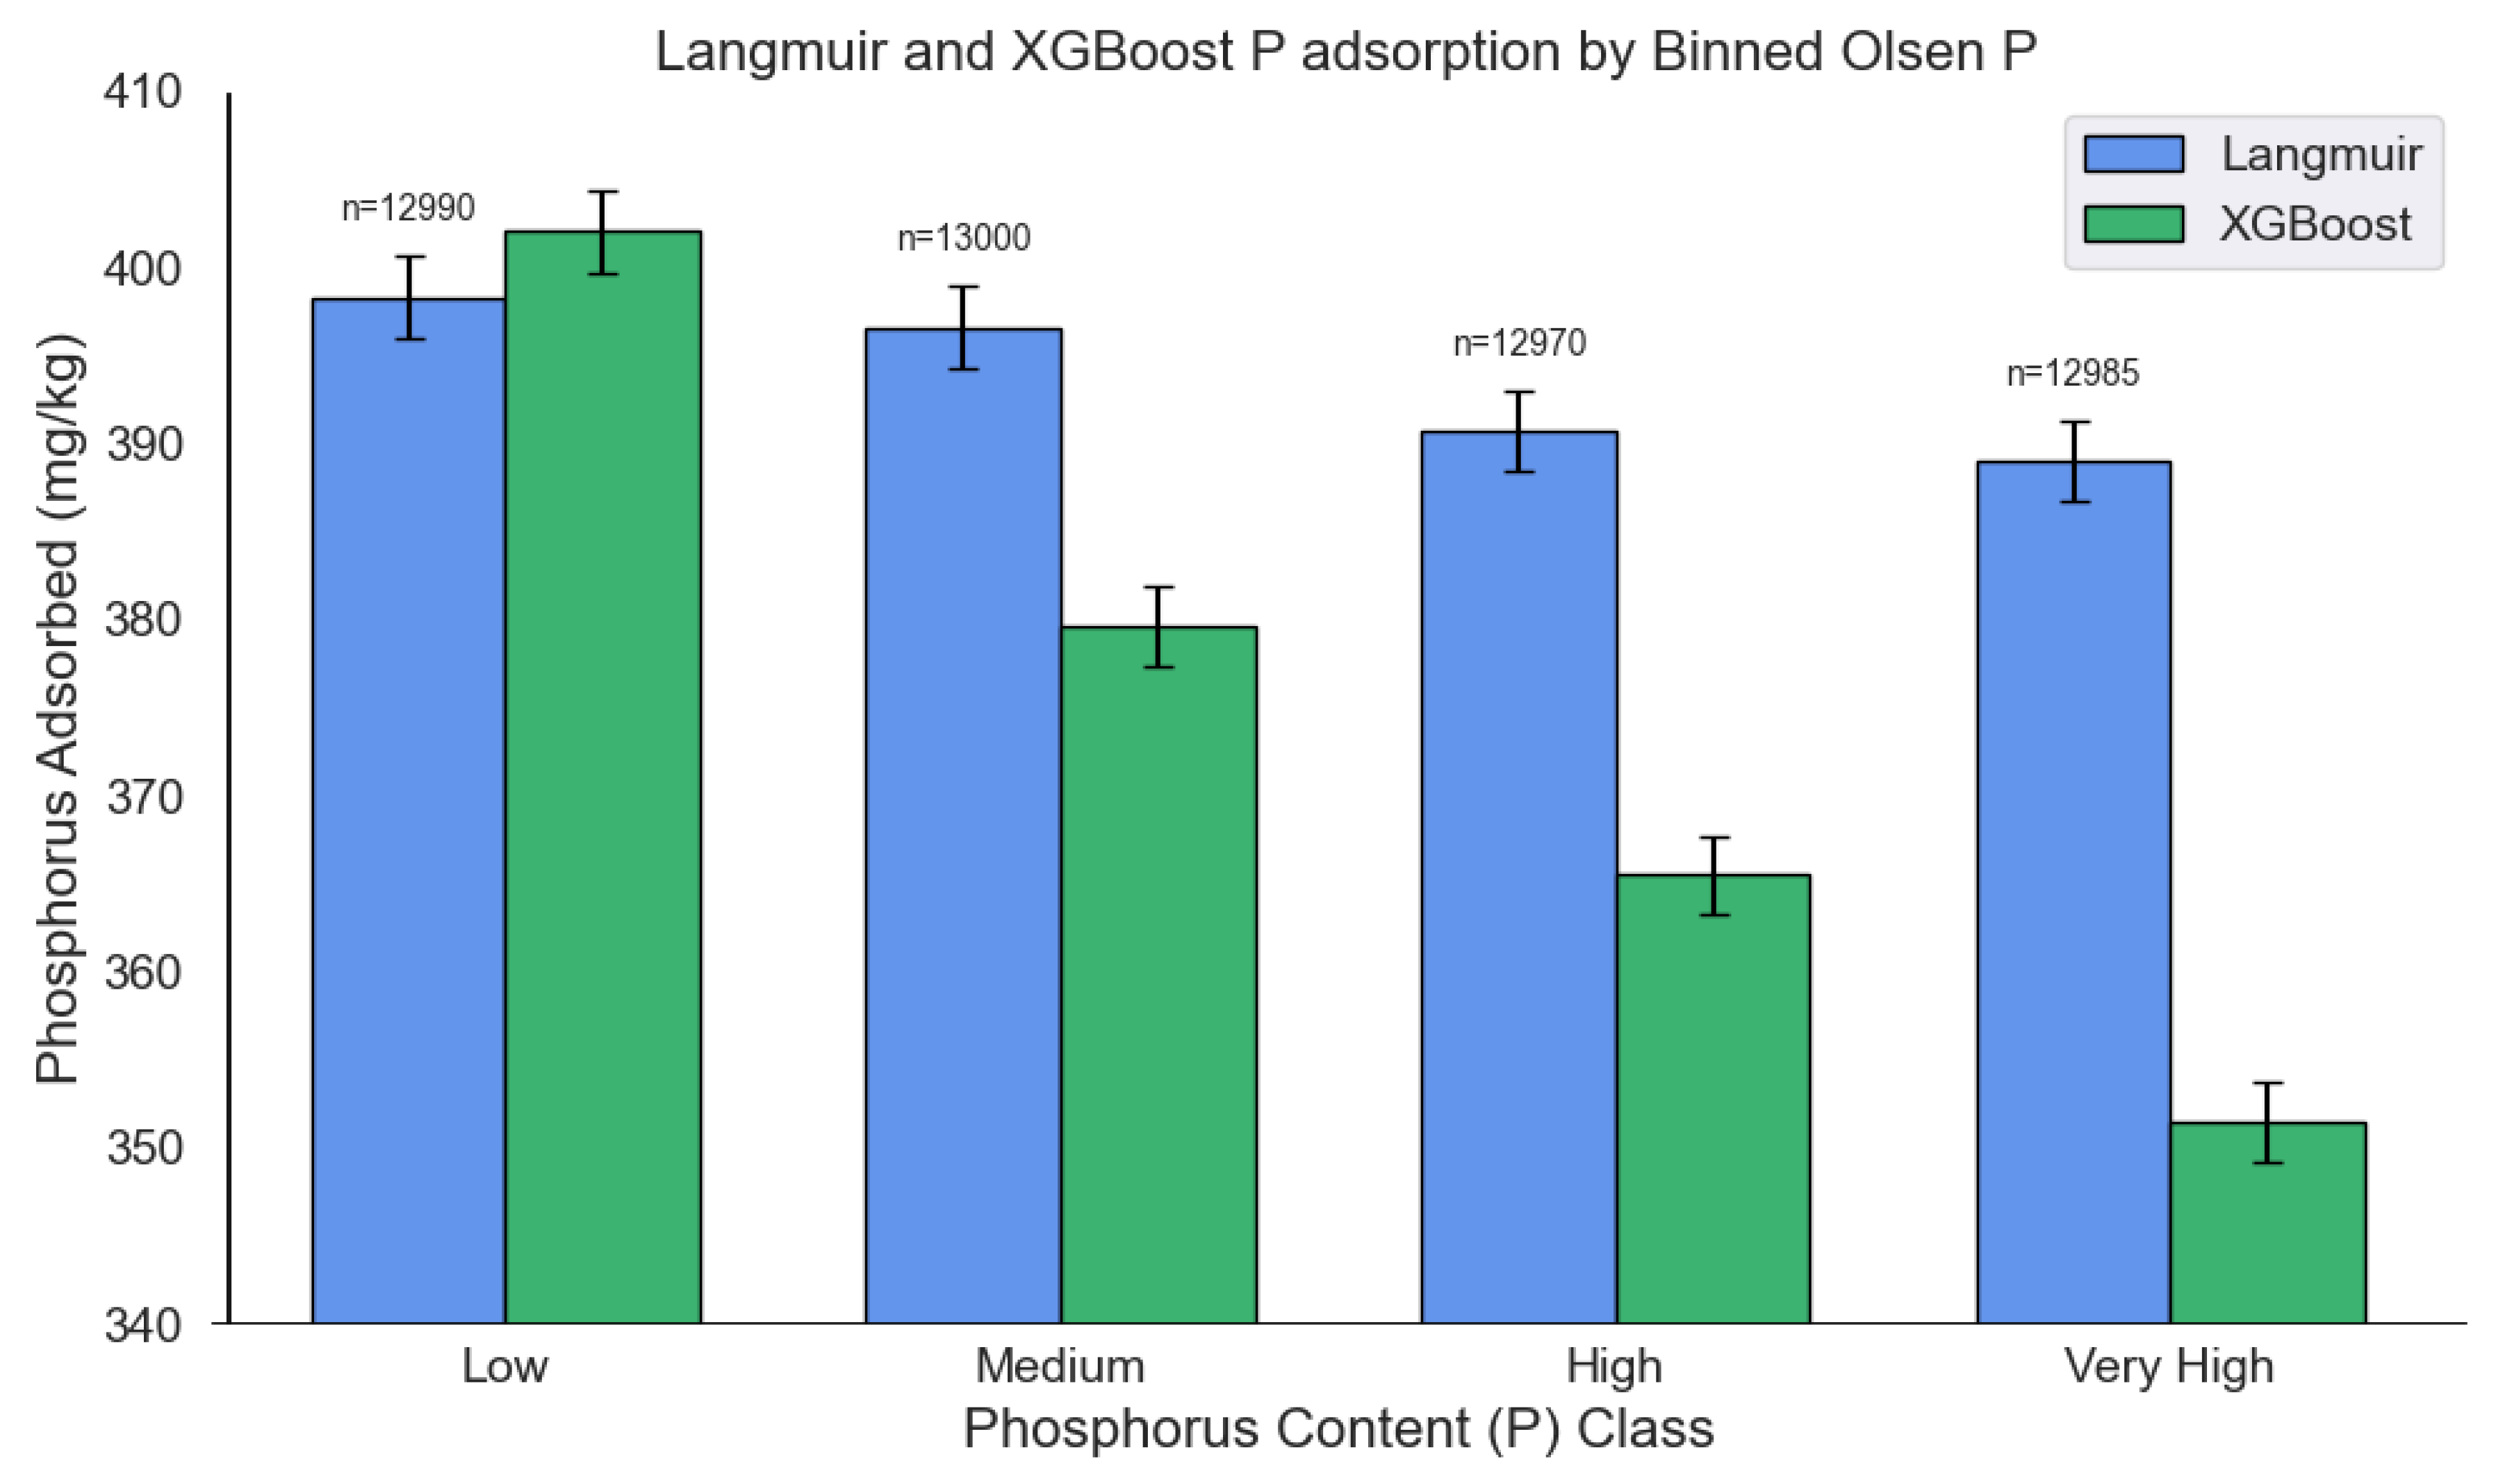
Figure 7.
P adsorption across sand bins as estimated by the Langmuir isotherms and the multi-output XGBoost model.
Figure 7.
P adsorption across sand bins as estimated by the Langmuir isotherms and the multi-output XGBoost model.
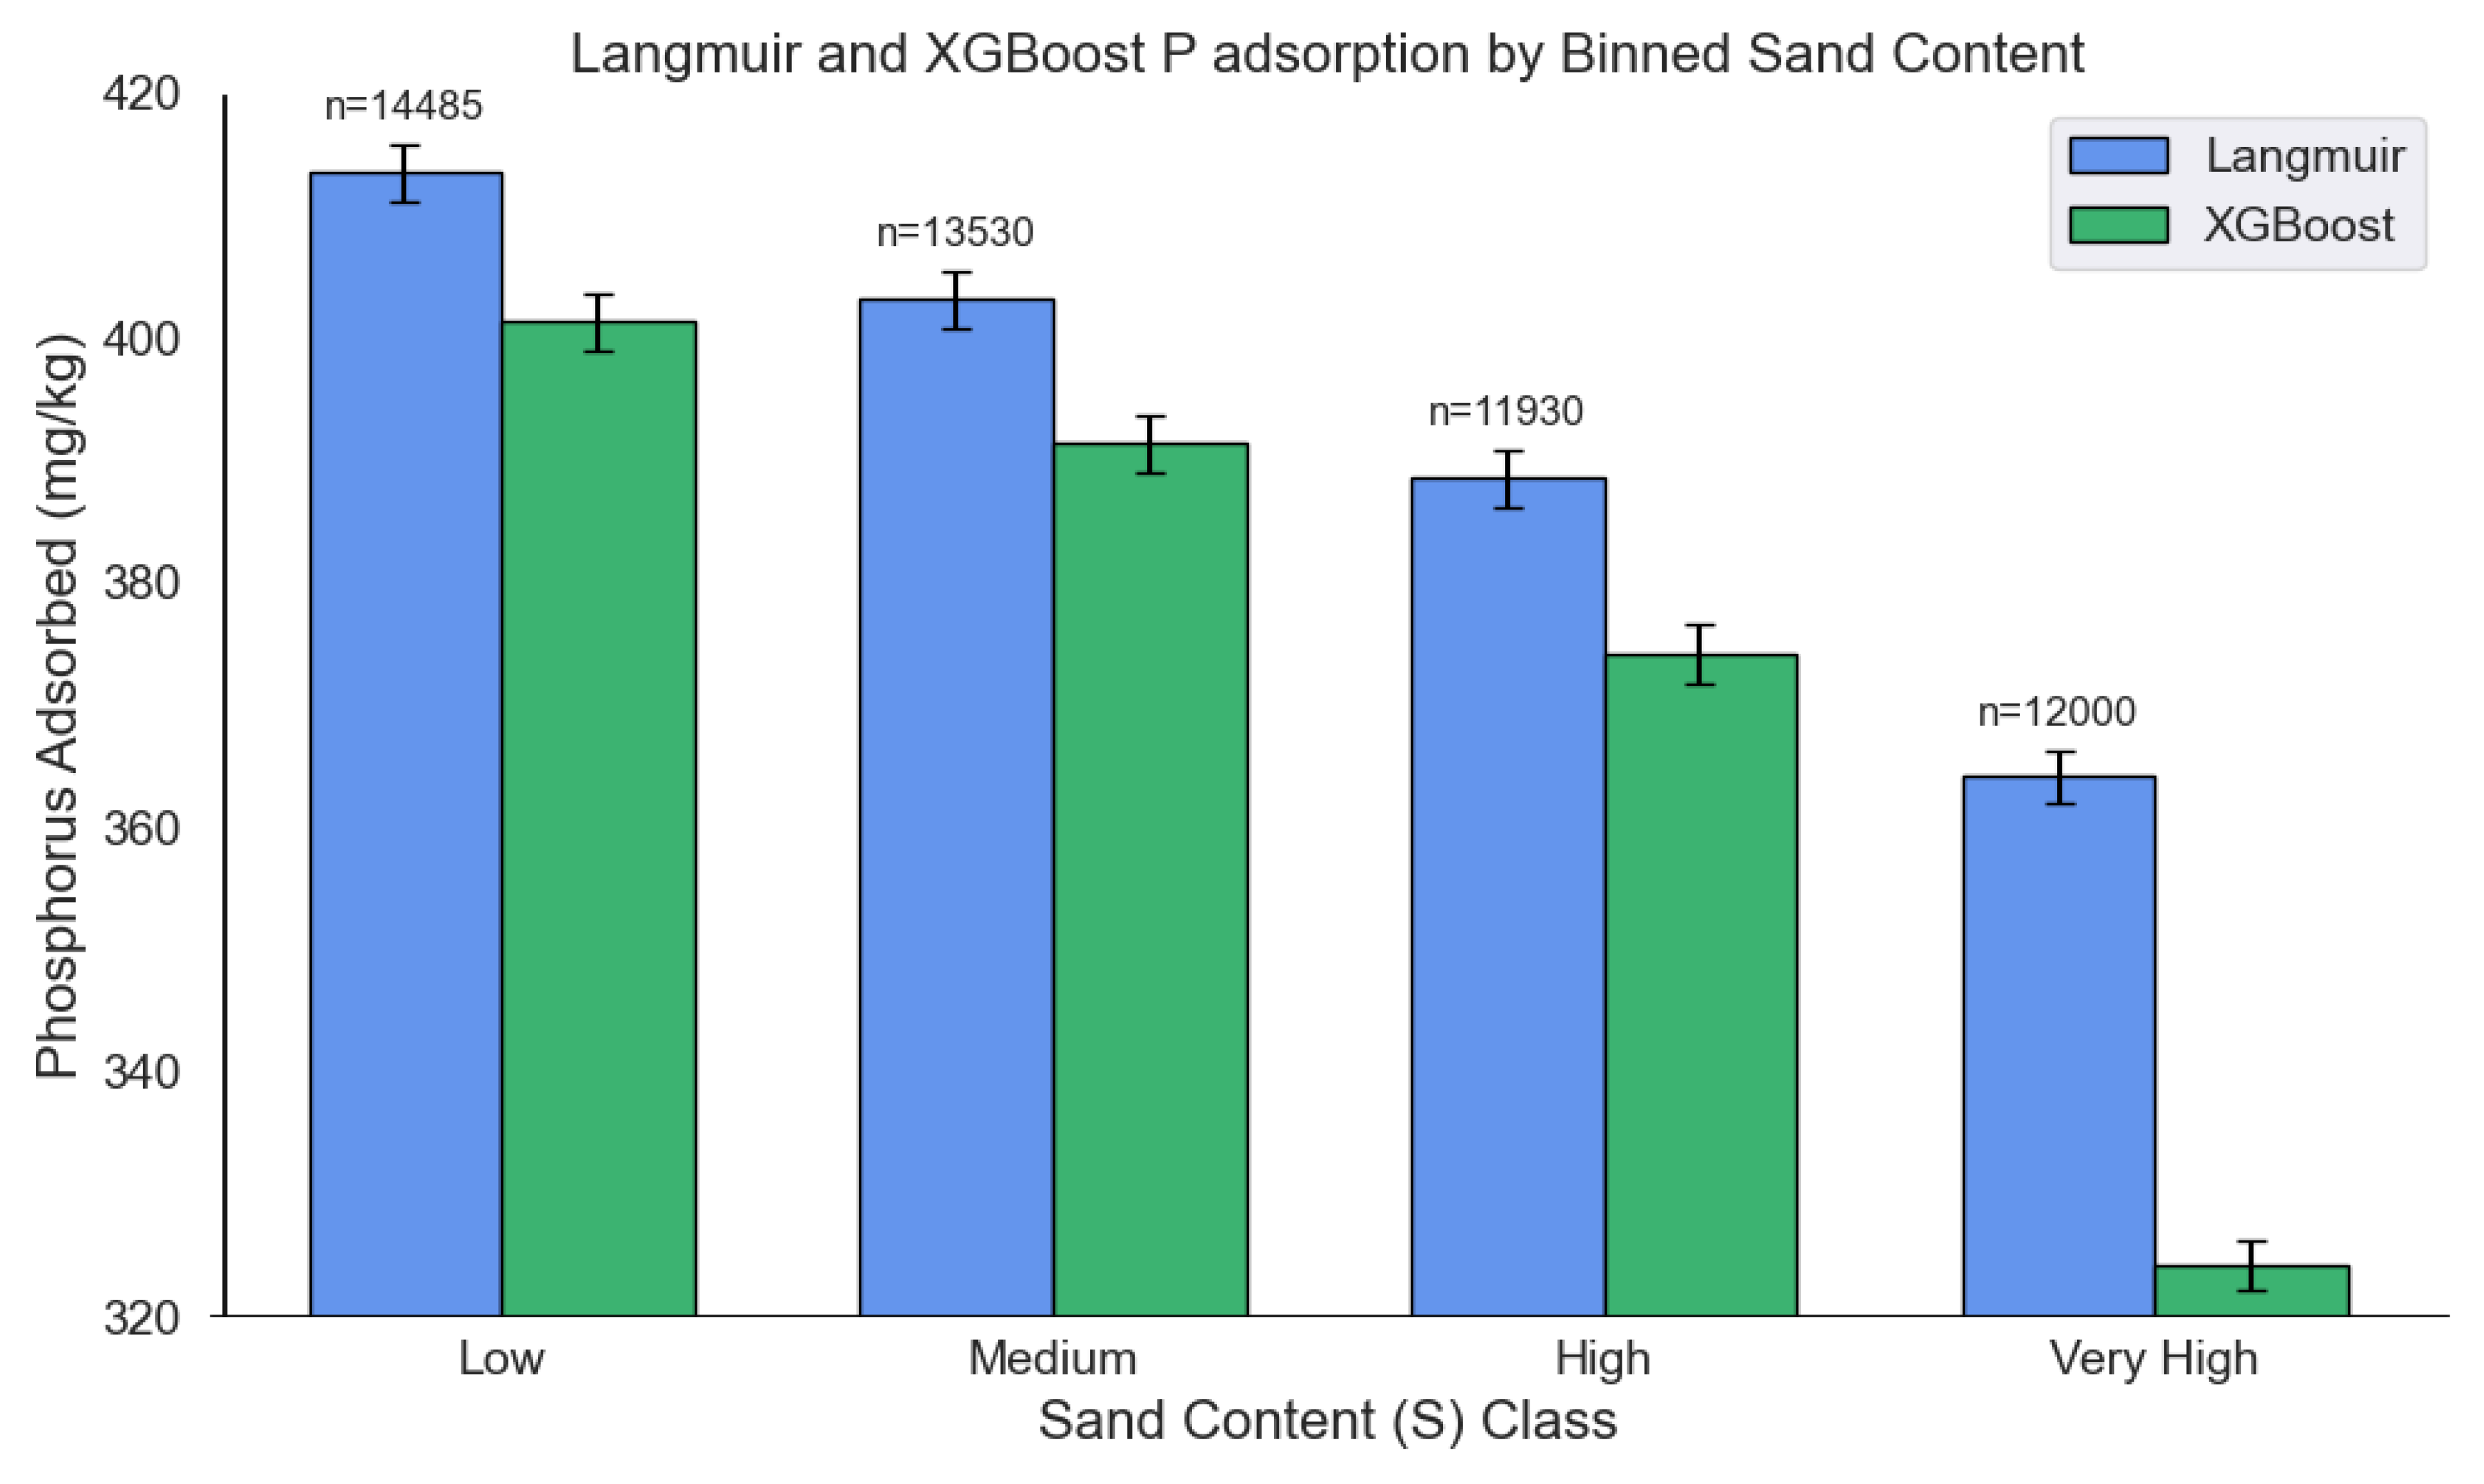

Table 1.
Soil groups included in the study.
| Group | pH Range | CaCO3 Range | Description | Soil Texture |
| 1 | 4.30 – 6.20 | 0 | Acidic | Clayey, Loamy, Sandy |
| 2 | 6.25 – 7.96 | 0 – 0.9% | Neutral, low carbonate | Clayey, Loamy, Sandy |
| 3 | 6.83 – 8.18 | 1 – 10% | Alkaline, moderately calcareous | Clayey, Loamy, Sandy |
| 4 | 7.20 – 8.28 | 10.3 – 48.3% | Strongly alkaline, calcareous | Clayey, Loamy, Sandy |
Table 2.
Soil sample distribution by pH, CaCO3 and soil texture.
| pH → | 4-6 | 6-7 | >7 | >7 | >7 | >7 | >7 |
| Clayey | 5 | 5 | 5 | 8 | 10 | 2 | 5 |
| Loamy | 9 | 10 | 10 | 9 | 9 | 9 | 6 |
| Sandy | 9 | 12 | 12 | 5 | 6 | 0 | 1 |
| CaCO3 → | 0% | 0-1% | 1-5% | 5-10% | 10-20% | 20-30% | >30% |
Table 3.
Parameters of the Langmuir isotherms for P adsorbed of the main soil classifications (sand, clay, and loam).
Table 3.
Parameters of the Langmuir isotherms for P adsorbed of the main soil classifications (sand, clay, and loam).
| Soil classification | Qm | K |
| Clayey | 11,822.86 | 0.0080 |
| Loamy | 12,899.80 | 0.0072 |
| Sandy | 8,231.61 | 0.0106 1 |
1 Qm refers to the maximum adsorption capacity (mg/kg), and K, the Langmuir binding strength at the adsorption sites.
Table 4.
Parameters of the Langmuir isotherms for P adsorbed in the various types of soils.
| Soil type | Qm | K |
| Clay (C) | 16,366.06 | 0.0059 |
| Clay loam (CL) | 14,959.94 | 0.0061 |
| Loamy (L) | 12,055.41 | 0.0075 |
| Silty loam (SiL) | 10,4509.79 | 0.0008 |
| Loamy Sand (LS) | 2,803.55 | 0.0251 |
| Sandy Clay Loam (SCL) | 8,517.25 | 0.0109 |
| Sandy Loam (SL) | 4,998.74 | 0.0180 |
| Silty Clay (SiC) | 6,686.86 | 0.0138 |
| Silty Clay Loam (SiCL) | 6,840.72 | 0.01441 |
1 Qm refers to the maximum adsorption capacity (mg/kg), and K, the Langmuir binding strength at the adsorption sites.
Table 5.
Mean P adsorption percentage (± standard deviation) for each soil texture class for the original dataset including 147 soil samples.
Table 5.
Mean P adsorption percentage (± standard deviation) for each soil texture class for the original dataset including 147 soil samples.
| Equilibrium concentrations (mg/L) | |||||
| Soil type | 1 | 2 | 4 | 6 | 10 |
| Clay (C) | 98.2 ± 3.5a | 93.6 ± 11.1a | 93.3 ± 10.1a | 92.4 ± 9.5a | 91.2 ± 7.6a |
| Clay loam (CL) | 92.3 ± 8.2b | 91.8 ± 8.0b | 90.7 ± 8.2b | 90.6 ± 7.6b | 87.5 ± 9.7b |
| Loamy (L) | 81.8 ± 17.2a | 88.5 ± 9.3c | 86.6 ± 15.5c | 88.5 ± 7.9c | 83.6 ± 9.8c |
| Loamy Sand (LS) | 52.6 ± 9.9b | 68.3 ± 31.7d | 62.2 ± 23.2a | 63.4 ± 27.9a | 55.8 ± 27.9a |
| Sandy Clay Loam (SCL) | 86.7 ± 11.1c | 90.1 ± 6.9e | 89.4 ± 6.7d | 87.7 ± 8.7d | 83.8 ± 11.0d |
| Sandy Loam (SL) | 75.7 ± 23.3d | 83.2 ± 17.3f | 81.7 ± 17.2e | 83.4 ± 12.0e | 75.1 ± 12.9b |
| Silty Clay (SiC) | 98.5 ± 0.7e | 87.3 ± 14.0g | 86.4 ± 17.7f | 85.9 ± 17.9f | 81.0 ± 23.3e |
| Silty Clay Loam (SiCL) | 99.8 ± 0.3f | 91.8 ± 8.1h | 93.8 ± 4.2g | 91.5 ± 4.4g | 86.2 ± 6.3f |
| Silty loam (SiL) | 80.0 ± 24.9g | 83.1 ± 21.1i | 85.6 ± 12.5h | 90.4 ± 7.7h | 86.7 ± 7.4g |
Note: Different letters within columns are significantly different at p < 0.05 according to Tukey’s HSD test.
Table 6.
Mean P adsorption percentage (± standard deviation) for each soil texture class, as predicted from the multi-output XGBoost model for the extended dataset including 10,389 soil samples.
Table 6.
Mean P adsorption percentage (± standard deviation) for each soil texture class, as predicted from the multi-output XGBoost model for the extended dataset including 10,389 soil samples.
| Equilibrium concentrations (mg/L) | |||||
| Soil type | 1 | 2 | 4 | 6 | 10 |
| Clay (C) | 91.1 ± 12.9a | 89.7 ± 8.5a | 88.8 ± 8.2a | 88.5 ± 7.6a | 85.1 ± 7.4a |
| Clay loam (CL) | 83.6 ± 14.6a | 87.0 ± 8.9a | 86.8 ± 7.9a | 87.7 ± 6.5b | 84.7 ± 6.3b |
| Loamy (L) | 76.9 ± 14.4a | 84.3 ± 8.8a | 83.1 ± 8.6a | 85.6 ± 6.9a | 82.2 ± 7.0a |
| Loamy Sand (LS) | 76.3 ± 10.9b | 76.9 ± 9.5a | 65.8 ± 7.4a | 69.8 ± 7.6a | 61.6 ± 7.3a |
| Sandy (S) | 76.6 ± 11.1c | 76.9 ± 10.2b | 65.4 ± 5.1b | 69.8 ± 7.6b | 61.1 ± 6.6b |
| Sandy Clay (SC) | 81.5 ± 10.1d | 85.4 ± 6.4b | 84.3 ± 6.3b | 85.8 ± 3.3c | 82.3 ± 3.3c |
| Sandy Clay Loam (SCL) | 77.7 ± 12.7e | 84.0 ± 8.0c | 82.6 ± 8.2c | 83.6 ± 6.5a | 79.4 ± 6.8a |
| Sandy Loam (SL) | 74.4 ± 12.8a | 78.7 ± 9.8c | 73.8 ± 10.4a | 76.4 ± 9.8a | 70.2 ± 10.7a |
| Silty Clay (SiC) | 93.6 ± 10.0b | 89.7 ± 7.0c | 89.2 ± 7.7c | 88.6 ± 7.3d | 84.7 ± 7.2d |
| Silty Clay Loam (SiCL) | 93.1 ± 9.5c | 90.7 ± 5.7d | 90.4 ± 5.8a | 90.1 ± 5.4a | 86.4 ± 5.5b |
| Silty loam (SiL) | 84.6 ± 13.9b | 87.9 ± 7.2d | 87.2 ± 6.7d | 89.0 ± 5.0b | 85.4 ± 5.3e |
Note: Different letters within columns are significantly different at p < 0.05 according to Tukey’s HSD test.
Disclaimer/Publisher’s Note: The statements, opinions and data contained in all publications are solely those of the individual author(s) and contributor(s) and not of MDPI and/or the editor(s). MDPI and/or the editor(s) disclaim responsibility for any injury to people or property resulting from any ideas, methods, instructions or products referred to in the content. |
© 2025 by the authors. Licensee MDPI, Basel, Switzerland. This article is an open access article distributed under the terms and conditions of the Creative Commons Attribution (CC BY) license (http://creativecommons.org/licenses/by/4.0/).
Copyright: This open access article is published under a Creative Commons CC BY 4.0 license, which permit the free download, distribution, and reuse, provided that the author and preprint are cited in any reuse.


