
Submitted:
07 July 2025
Posted:
08 July 2025
You are already at the latest version
Abstract
Background/Objectives: Melanoma cells enhance glycolysis and expand lysosomes to support energy metabolism, proliferation, and metastasis. However, lysosomal membrane permeabilization (LMP)-mediated release of lysosomal proteases cathepsins into cytoplasm triggers cytotoxicity. This study investigated antimelanoma effect of glycolytic inhibitor 2-deoxy-D-glucose (2DG) in combination with cathepsin C-dependent LMP inducer L-leucyl-L-leucine methyl ester (LLOMe). Methods: Viability of human melanoma A375 cells and fibroblasts treated with 2DG and/or LLOMe was measured by crystal violet. Apoptosis/necrosis/LMP were assessed by flow cytometry. Caspase activation/mitochondrial depolarization/mitochondrial superoxide production/energy metabolism were evaluated by fluorimetry. Appropriate inhibitors/antioxidant/energy boosters were used to confirm involvement of LMP/cathepsins/caspases/oxidative stress/energy stress in LLOMe+2DG-induced cytotoxicity. Expression of glycolytic enzymes and cathepsins in melanoma patients was analyzed in publicly available GEO datasets. Results: LLOMe with/without 2DG triggered LMP, mitochondrial depolarization, mitochondrial superoxide production, caspase activation, and mixed apoptosis/necrosis in A375 cells. LLOMe inhibited oxidative phosphorylation, 2DG suppressed glycolysis, which together synergized in ATP depletion. Inhibitors of lysosomal acidification/cathepsins/caspases, antioxidant, and energy boosters reduced 2DG+LLOMe-induced toxicity. Fibroblasts were highly sensitive to LLOMe but not to LMP-inducing drugs mefloquine and siramesine, whose toxicity is cathepsin B-mediated. Several glycolytic enzymes and cathepsins were increased, whereas cathepsin C expression was decreased in melanoma patients. Conclusions: LLOMe-induced LMP causes cathepsin-dependent mitochondrial dysfunction with oxidative phosphorylation suppression, which together with 2DG-inhibited glycolysis, synergizes in induction of energy stress and mixed apoptotic-necrotic cell death. Given its non-selective toxicity, possibly due to cathepsin C loss in melanoma, LLOMe should be replaced with cathepsin C-independent LMP inducers for use with 2DG in antimelanoma therapy.
Keywords:
melanoma
; lysosome membrane permeabilization
; glycolysis
; L-leucyl-L-leucine methyl ester
; 2-deoxy-D-glucose
; cathepsins
; mitochondrial dysfunction
; oxidative phosphorylation
; apoptosis
; necrosis
1. Introduction
Melanoma is a highly aggressive skin cancer whose incidence has increased more rapidly than that of any other cancer type since the mid-1950s [1]. Global estimates indicate a current incidence of ~3.3 per 100,000 individuals [2]. While early-stage melanoma can often be successfully treated with surgical excision, metastatic melanoma remains a major therapeutic challenge, with a dismal 5-year survival rate of only 23% [3]. Approximately half of patients with advanced melanoma harbor activating BRAF mutations that drive MEK/ERK pathway activation and initially respond to BRAF inhibitors, but most relapse within months due to acquired resistance [4]. Therefore, there is an urgent need for novel and durable therapeutic strategies.
A hallmark of many cancers, including BRAF-mutant melanoma, is their strong reliance on aerobic glycolysis to meet the energy demands of rapid growth and proliferation [5,6]. In addition to enabling rapid ATP generation, glycolysis supplies key metabolic intermediates required for biomass synthesis, further fueling tumor expansion. This metabolic dependency renders melanoma cells particularly vulnerable to glycolysis inhibition. For instance, 2-deoxy-D-glucose (2DG), a glucose analog that competitively inhibits the glycolytic enzymes hexokinase (HK) and phosphoglucoisomerase (GPI) [7], has been shown to reduce ATP production and enhance the cytotoxic effects of several conventional [8,9] and experimental antimelanoma agents [10,11,12,13]. Importantly, 2DG is well tolerated in combination with chemotherapy and radiotherapy in patients with solid tumors [14,15,16].
In addition to metabolic rewiring, melanoma cells exhibit an increased number, size, and enzymatic content of lysosomes, accompanied by structural instability of the lysosomal membrane [17,18,19]. These altered lysosomes promote invasion and metastasis by secreting hydrolytic enzymes cathepsins that degrade the extracellular matrix [17,20]. They also contribute to drug resistance by sequestering and exporting weakly basic chemotherapeutics [17,20]. Moreover, as final effectors of the autophagy pathway, lysosomes support tumor growth by degrading damaged organelles and recycling their components into biosynthetic precursors and energy-yielding metabolites [20]. In contrast, elevated lysosomal content and cathepsin levels, together with membrane instability, may render melanoma cells particularly susceptible to lysosomal membrane permeabilization (LMP). LMP causes cathepsin release into the cytosol, where they non-specifically cleave intracellular proteins and initiate cell death [18,20]. Consequently, several LMP-inducing agents have been investigated for melanoma therapy [17,21,22,23,24,25,26,27]. L-leucyl-L-leucine methyl ester (LLOMe) is a lysosomotropic dipeptide that accumulates in lysosomes, where it is processed by cathepsin C into membrane-disrupting polymers, resulting in LMP and subsequent release of cathepsins into the cytosol [28,29,30,31,32]. To date, only one study has evaluated LLOMe’s antimelanoma potential, showing selective toxicity toward melanoma cells over primary melanocytes [33].
Combination therapy is routinely employed in oncology to simultaneously target multiple pathways, thereby increasing therapeutic impact and limiting resistance evolution [34]. Accordingly, our therapeutic strategy focuses on the simultaneous targeting of two specific vulnerabilities of melanoma cells: their reliance on glycolytic metabolism and the structural instability of their lysosomes. We demonstrated that 2DG and LLOMe synergistically induce severe energy depletion and mixed apoptotic–necrotic death of A375 melanoma cells by inhibiting both glycolysis and oxidative phosphorylation (OXPHOS), with 2DG primarily targeting glycolysis, while LLOMe predominantly impairs OXPHOS through LMP-induced cathepsin release and subsequent mitochondrial dysfunction. However, the therapeutic potential of the combined treatment was compromised by the high toxicity of LLOMe toward primary cells. Therefore, we further identified two LMP-inducing compounds that may represent more suitable candidates for synergistic combination with 2DG in future antimelanoma strategies.
2. Materials and Methods
2.1. Cell Culture
A375 melanoma cells with a BRAFV600E mutation (a kind gift from Dr. Jelena Grahovac, Institute for Oncology and Radiology of Serbia) and Normal Human Dermal Fibroblasts (NHDF; Merck, Darmstadt, Germany) were cultured at 37 °C in a humidified atmosphere with 5% CO₂ in high-glucose (4.5 g/L) DMEM with L-glutamine (Capricorn Scientific, Ebsdorfergrund, Germany), supplemented with 10% fetal bovine serum (FBS; Gibco, Thermo Fisher Scientific, Waltham, MA, USA), 1 mM sodium pyruvate, and antibiotic/antimycotic solution (both from Capricorn Scientific). After a 24 h resting period, cells were treated with 2-deoxy-D-glucose (2DG; Merck) and/or L-leucyl-L-leucine methyl ester (LLOMe; MedChemExpress, Monmouth Junction, NJ, USA) in the presence or absence of the following compounds: necrostatin-1, ferrostatin-1, wortmannin, Q-VD-OPh, bafilomycin A1, MG132, N-acetylcysteine (NAC), BAPTA-AM, sodium succinate dibasic hexahydrate, or L-carnitine (all from Merck); and pepstatin A or superoxide dismutase 1 (SOD1) (both from Santa Cruz Biotechnology, Dallas, TX, USA). Alternatively, cells were treated with 2DG in the presence or absence of mefloquine or siramesine (both from Merck), or with LLOMe in the presence of sodium dichloroacetate (DCA; Merck) or shikonin (MedChemExpress). A375 cells were seeded at 15 × 103 cells/well in 96-well plates for crystal violet test, 25 × 103 cells/well in 96-well plates for oxygen consumption rate (OCR) and extracellular acidification rate (ECAR) measurement, 15 × 105 cells/well in 24-well plates for flow cytometric analysis and fluorometry, 10 × 105 cells/well in 24-well plates for fluorescent microscopy, 1 × 10⁶ cells/well in 24-well plates for cell transfection and immunoblotting. NHDF cells were seeded at 9 × 10³ cells/well in 96-well plates for crystal violet test.
2.2. Cell Viability
Cell viability was assessed by staining adherent cells with crystal violet (Merck), as previously described [35].
2.3. Synergism Assessment
The type of interaction between the two treatments (additive, synergistic, or antagonistic) was evaluated using the equation: α = (SF2DG×SFLLOMe)/SF2DG+LLOMe, where SF2DG and SFLLOMe represent the surviving fractions after treatment with 2DG and LLOMe, respectively, and SF2DG +LLOMe represents the surviving fraction after the combined treatment. Statistical significance of the α values was determined using a one-sample t-test against the theoretical value of 1. An α = 1 indicates an additive effect, α > 1 indicates synergism, and α < 1 indicates antagonism.
2.4. Apoptosis/Necrosis Analysis
Apoptotic and necrotic cell death were analyzed upon double staining with annexin V-FITC and 7-AAD (BD Biosciences, San Diego, CA, USA), according to the manufacturer’s protocol. Annexin V binds to phosphatidylserine on apoptotic cells, while 7-AAD labels necrotic cells with compromised membranes, enabling distinction of viable (annexin⁻/7-AAD⁻), apoptotic (annexin⁺/7-AAD⁻), and necrotic (annexin⁺/7-AAD⁺) populations. DNA fragmentation (sub-G0/G1 compartment), a hallmark of apoptotic cell death, was evaluated by cell cycle analysis of propidium iodide-stained cells exactly as previously described [36]. Both analyses were performed on the FACS Aria III flow cytometer, using FACSDiva 6.0 software for acquisition and FlowJo 10.7 software for analysis (BD Biosciences).
2.5. Lysosomal Staining
Lysosomes were stained with acridine orange (Thermo Fisher Scientific) or LysoTracker Red (MedChemExpress) according to the manufacturers’ instructions. Acridine orange-stained cells were analyzed using inverted fluorescent microscope (Leica Microsystems DMIL, Wetzlar, Germany), Leica Microsystems DFC320 camera and Leica Application Suite software (version 2.8.1), where lysosomes appeared as orange/red cytoplasmic vesicles, while nuclei and cytoplasm were stained green. Alternatively, acridine orange- and LysoTracker Red-stained cells were analyzed by flow cytometry using a FACS Aria III flow cytometer. The acidic lysosomal content was quantified as the mean red-to-green fluorescence ratio (FL3/FL1) for acridine orange, and as the mean red fluorescence intensity for LysoTracker Red (FL1). In both cases, results are presented relative to untreated control cells, which were arbitrarily set to 1.
2.6. Caspase Activation, Mitochondrial Membrane Potential and Superoxide Measurement
Caspase activation was assessed using the cell-permeable, FITC-conjugated pan-caspase inhibitor Z-VAD-FMK (ApoStat; R&D Systems, Minneapolis, MN, USA), by quantifying the increase in green fluorescence intensity. Mitochondrial membrane potential (MMP) was evaluated using JC-1 dye (MedChemExpress). In polarized mitochondria, JC-1 forms red fluorescent aggregates, whereas in depolarized mitochondria it remains in the green fluorescent monomeric form. MMP changes were expressed as the ratio of green to red fluorescence. Mitochondrial superoxide (O₂⁻•) was detected using MitoSOX Red (MedChemExpress), which selectively reacts with O₂⁻• to emit red fluorescence proportional to its concentration. All fluorescent probes were used according to the manufacturers’ instructions for flow cytometry staining, but prior to fluorescence measurement on a Hidex Sense microplate reader (Hidex, Turku, Finland), stained cells were transferred into black 96-well plates. Fluorescence was measured using appropriate filter sets with excitation/emission wavelengths of 488/530 nm for FITC-labeled Z-VAD-FMK and JC-1 monomers, 540/590 nm for JC-1 aggregates, and 510/580 nm for MitoSOX Red. Caspase activity and MitoSOX Red fluorescence were normalized to DAPI fluorescence (Thermo Fisher Scientific) as an estimate of cell number per well. All results are presented as fold change relative to untreated control cells arbitrarily set to 1.
2.7. Measurements of Oxygen Consumption and Extracellular Acidification Rates
OXPHOS activity and glycolytic flux in A375 melanoma cells were assessed by measuring the oxygen consumption rate (OCR) and extracellular acidification rate (ECAR), using the MitoXpress Xtra Oxygen Consumption Assay and the pH-Xtra Glycolysis Assay, respectively (both from Agilent, Santa Clara, CA, USA), according to the manufacturer’s instructions. Fluorescence was recorded in real time for 1 hour using a Hidex Sense microplate reader in time-resolved mode, starting 2 hours after treatment. The rate of signal change (slope) across measurement cycles was calculated for each condition and used as a measure of OCR and ECAR. For comparative analysis, values were normalized to the slope obtained in the untreated control group, which was set to 1.
2.8. Intracellular ATP Quantification
The intracellular concentration of ATP was determined using a Hidex Sense microplate reader and the Luminescent ATP Detection Assay Kit (Abcam, Cambridge, UK), according to the manufacturer’s instructions. Luminescence values were normalized to crystal violet staining performed in a parallel plate to account for differences in cell number. Results are presented as fold change relative to untreated control cells, arbitrarily set to 1.
2.9. RNA Interference
Small interfering RNA (siRNA) targeting human HK2 and ATG5, and corresponding control siRNA (all from Santa Cruz Biotechnology) were transfected into A375 cells by electroporation in the 4D-Nucleofector X Unit, using the SF Cell Line 4D-Nucleofector X Kit and DC-135 program (Lonza, Basel, Switzerland), according to the manufacturer’s instructions. The cells were rested for 24 h before treatment.
2.10. Immunoblotting
Knockdown efficiency of HK2 and ATG5 was confirmed by immunoblotting exactly as previously described [36], using specific primary antibodies: anti-ATG5 (#12994, Cell Signaling Technology, Beverly, MA, USA), anti-HK2 (sc-130358, Santa Cruz Biotechnology), and glyceraldehyde-3-phosphate dehydrogenase (GAPDH) (MA5-15738; Thermo Fisher Scientific) as a loading control. Peroxidase-conjugated anti-rabbit IgG (111-035-144) or anti-mouse IgG (115-035-146) (both from Jackson ImmunoResearch, West Grove, PA, USA) were used as secondary antibodies. Protein bands were visualized by enhanced chemiluminescence on a ChemiDoc MP Imaging System (Bio-Rad, Hercules, CA, USA).
2.11. In Silico Analysis of Gene Expression
Raw gene expression data were retrieved from the GEO dataset GSE3189 (platform: Affymetrix U133A; accession GDS1375). The study groups were balanced in terms of age and sex, and clinical/pathological characteristics are described in the original publication by Talantov et al. [37]. Normalized log₂ expression values for selected probe sets were downloaded directly from the GEO portal. Samples were categorized into three groups: normal skin (n = 7), benign nevi (n = 18), and primary melanoma (n = 45). Statistical comparisons between groups were performed using the Mann-Whitney U test (GraphPad Software, San Diego, CA, USA), while the data were presented as median values and interquartile range. To prioritize sensitivity over stringency in this exploratory analysis, no correction for multiple testing was applied, in line with recommendations for hypothesis-generating studies [38]. Statistical significance is indicated as follows: *p < 0.05, **p < 0.01, ***p < 0.001, ****p < 0.0001.
2.12. Statistical Analysis
Statistical significance of differences between treatments was assessed using Student’s t-test or one-way ANOVA followed by Tukey’s post hoc test for multiple comparisons, unless otherwise stated. A p value < 0.05 was considered statistically significant.
3. Results
3.1. 2DG and LLOMe Synergistically Reduce Viability of A375 Melanoma Cells
Given the upregulated glycolysis [5,6] and expanded lysosomal compartment [17,18,19] observed in melanoma cells, we investigated whether their simultaneous targeting could synergistically reduce cell viability. Cell viability of A375 cells treated with increasing concentrations of 2DG and LLOMe for 24 and 48 hours was evaluated using the crystal violet assay. The results showed that cell viability decreased in a dose- and time-dependent manner for both compounds individually, and more pronouncedly when used in combination (Figure 1A, D). To quantify potential synergistic effects, we calculated α-indices, where values above 1 indicate synergy (Figure 1B, E). Based on the α-index, the combination of 5 mM 2DG and 1 mM LLOMe was selected for subsequent mechanistic analyses. Phase-contrast microscopy showed that 2DG or LLOMe alone caused partial cell rounding, while their combination induced widespread rounding, detachment, and shrinkage, indicating extensive cell death (Figure 1C). Together, these findings demonstrate that co-targeting glycolysis and lysosomal integrity synergistically reduces melanoma cell viability in a dose- and time-dependent manner, highlighting a potentially exploitable vulnerability in melanoma cells.
3.2. 2DG+LLOMe Induces Mixed Apoptotic and Necrotic Death in Melanoma Cells
We next investigated the mode of cell death induced by 2DG, LLOMe and their combination. Ferrostatin-1 and necrostatin-1 failed to protect A375 cells from 2DG+LLOMe-induced cytotoxicity, suggesting that ferroptosis and necroptosis are not involved in the antimelanoma effect of the combined treatment (Figure 2A and B). Furthermore, autophagy inhibition by either wortmannin or ATG5 knockdown did not affect the viability of cells treated with 2DG, LLOMe, or their combination (Figure 2C, D), suggesting that the cytotoxic effects of these treatments are independent of autophagy modulation. Both 2DG and LLOMe induced caspase activation, with the strongest effect observed upon their combination, as measured by Apostat fluorescence using fluorometry (Figure 2F). Annexin V-FITC/PI flow cytometry showed that 2DG, LLOMe, and especially their combination increased the proportion of Annexin V⁺/PI⁻ apoptotic cells, while the combined treatment also elevated the proportion of Annexin V⁺/PI⁺ necrotic cells (Figure 2E). Moreover, the two agents synergistically induced apoptosis-associated DNA fragmentation, as evidenced by an increased sub-G0/G1 population in cell cycle analysis (Figure 2G). Finally, inhibition of caspases by Q-VD-OPh reduced the cytotoxicity induced by 2DG and/or LLOMe, supporting a key role for caspase-mediated apoptosis in these treatments. Collectively, our findings demonstrate that 2DG+LLOMe induce caspase-mediated apoptosis accompanied by necrosis, while ferroptosis, necroptosis, and autophagy-related pathways appear not to be involved.
3.3. Antimelanoma Effect of 2DG+LLOMe Is Mediated by Lysosomal Destabilization
As LLOMe is a well-known lysosome-destabilizing agent [39], we next investigated whether LMP contributes to cell death induced by the combination of 2DG and LLOMe. Phase-contrast microscopy revealed that cells treated with LLOMe or 2DG+LLOMe exhibited vacuole-like intracellular structures as early as 30 min after treatment, which may represent swollen lysosomes (Figure 3A). Fluorescence microscopy (Figure 3B) and flow cytometry (Figure 3C) showed that LLOMe alone or in combination with 2DG induced a red-to-green fluorescence shift of acridine orange (AO) 30 min after treatment, indicating decreased acidity of lysosomes or autolysosomes. Consistently, LysoTracker Red fluorescence intensity was markedly reduced within 30 min of LLOMe ± 2DG treatment (Figure 3D), further confirming rapid lysosomal damage. Bafilomycin A1, an inhibitor of lysosomal acidification and the entry of acidophilic agents into lysosomes [40], and MG132, a proteasome inhibitor that also targets cysteine cathepsins B, C, L, and S [41,42,43,44] suppressed the cytotoxicity of LLOMe-containing treatments (Figure 3E, F). The toxicity of LLOMe and 2DG+LLOMe was not reduced by pepstatin A, an inhibitor of aspartic proteases such as CTSD and CTSE [45,46] (Figure 3G). On the other hand, the Ca²⁺ chelator BAPTA-AM further enhanced LLOMe- and 2DG+LLOMe-induced cytotoxicity (Figure 3H), likely due to the requirement of Ca²⁺ for lysosomal membrane repair [39]. These findings indicate that the entry of LLOMe into lysosomes, lysosomal destabilization, and the activity of cysteine cathepsins are essential for the cytotoxic effect of LLOMe, both alone and in combination with 2DG.
3.4. 2DG+LLOMe-induced Cell Death is Mediated by LMP-dependent Mitochondrial Depolarization and Superoxide
Apoptosis and necrosis are frequently associated with oxidative stress [47,48] and mitochondrial membrane potential (MMP) loss [49,50]. We next examined if these processes are involved in 2DG and/or LLOMe induced cytotoxicity. An increased green-to-red fluorescence ratio of the JC-1 dye, measured using a fluorescence plate reader, demonstrated that LLOMe, both alone and in combination with 2DG, induced significant MMP loss, which was prevented by bafilomycin A1 and MG132, inhibitors of lysosomal acidification and cysteine cathepsins, respectively (Figure 4A). Furthermore, as evidenced by enhanced fluorescence in cells stained with MitoSOX Red, LLOMe-containing treatments also increased mitochondrial O₂•⁻ production, which was also attenuated in the presence of bafilomycin A1 and MG132 (Figure 4B). Pretreatment with the antioxidant N-acetyl cysteine (NAC) partially rescued cell viability, indicating that ROS contributes to 2DG+LLOMe-induced cytotoxicity (Figure 4C). On the other hand, pretreatment with superoxide dismutase (SOD) exacerbated 2DG- and/or LLOMe-induced cytotoxicity, indicating that O₂•⁻-derived oxidants, rather than O₂•⁻ itself, mediate 2DG+LLOMe-induced cell death (Figure 4D). Together, these findings indicate that cell death induced by LLOMe, both alone and in combination with 2DG, is mediated, at least in part, by LMP, which leads to mitochondrial damage manifested by membrane depolarization and O₂•⁻ production.
3.5. Combined Glycolytic and Mitochondrial Inhibition by 2DG and LLOMe Triggers Energetic Collapse and Loss of Viability
Since MMP loss is typically associated with mitochondrial dysfunction, we next measured OXPHOS following treatment with 2DG, LLOMe, or their combination. OCR measurements showed that LLOMe, both alone and more strongly in combination with 2DG, reduced OXPHOS (Figure 5A). In parallel, ECAR analysis revealed that 2DG strongly and LLOMe moderately suppressed glycolysis, while the most pronounced reduction in glycolytic activity was observed with the 2DG+LLOMe combination (Figure 5A). Accordingly, treatment with 2DG, more prominently with LLOMe, and most strongly with their combination led to a gradual, time-dependent reduction in ATP levels (Figure 5C). OXPHOS enhancers L-carnitine and succinate [51,52], partially rescued cell viability reduced by 2DG+LLOMe (Figure 5C), indicating that energy depletion contributed to the cytotoxic effect of the combined treatment. Furthermore, LLOMe synergized with other glycolytic inhibitors pyruvate dehydrogenase kinase (PDK) inhibitor dichloroacetate (DCA) [53] and pyruvate kinase M2 inhibitor (PKM2) shikonin (SHI) [54] in exerting an antimelanoma effect (Figure 5D, F). In addition, LLOMe potentiated the cytotoxicity induced by genetic knockdown of HK2, a key glycolytic enzyme and the primary target of 2DG [55] (Figure 5E), indicating that glycolysis inhibition by 2DG is critical for the synergistic antimelanoma effect with LLOMe. These results demonstrate that 2DG+LLOMe-induced cell death is driven by severe energy depletion resulting from combined inhibition of glycolysis and OXPHOS.
3.6. In Contrast to Mefloquine and Siramesine, LLOMe Exhibits Non-Selective Toxicity
To evaluate the therapeutic potential and selectivity of the 2DG+LLOMe combination, we compared its cytotoxicity in melanoma cells and primary human dermal fibroblasts (NHDF). As demonstrated by MTT test, fibroblasts were slightly less sensitive to 2DG than A375 cells, but significantly more sensitive to LLOMe (Figure 6A). Notably, both cell types exhibited similar sensitivity to the 2DG+LLOMe combination (Figure 6A), arguing against its therapeutic applicability. Therefore, we tested the melanoma selectivity of two other LMP-inducing agents, mefloquine and siramesine [20]. As shown in Figure 6B, fibroblasts were less sensitive to mefloquine, and especially to 2DG+mefloquine, than A375 cells (Figure 6B). Moreover, although siramesine alone killed A375 cells and fibroblasts to a similar extent, melanoma cells were more sensitive than fibroblasts to the 2DG+siramesine combination (Figure 6C). These findings suggest that, unlike LLOMe, the combination of 2DG with mefloquine or siramesine exhibits greater selectivity toward melanoma cells and may represent a more promising therapeutic approach.
3.7. Melanoma Progression in Patient Samples Is Associated with Enhanced Expression of Glycolytic Enzymes and Cathepsins
We analyzed publicly available gene expression data GSE3189 to compare glycolytic enzyme and lysosomal protease expression in normal skin, benign nevi, and primary melanoma. Among glycolytic enzymes, we observed significantly increased expression of HK isoform 3 (HK3), GPI, phosphofructokinase muscle type (PFKM), aldolase A (ALDOA), triosephosphate isomerase 1 (TPI1), GAPDH, and PKM, and lactate dehydrogenase A (LDHA) in melanoma samples compared to both benign nevi and normal skin. Moreover, GPI, PFKM, GAPDH, and PKM were also significantly upregulated in benign nevi relative to normal skin, suggesting that early metabolic changes may occur during the formation of nevi, while full activation of glycolysis characterizes melanoma progression. In contrast, the expression levels of HK1 and HK2 did not significantly differ between melanoma and healthy skin, whereas ALDOC expression was significantly reduced in melanoma compared to both healthy controls and benign nevi (Figure 7A).
Moreover, cathepsin B (CTSB), cathepsin D (CTSD), and cathepsin Z (CTSZ) were progressively upregulated from normal skin to nevi and melanoma, indicating stepwise lysosomal protease activation during melanocytic progression (Figure 7B). In contrast, the expression of cathepsin C (CTSC), the main mediator of LLOMe-induced cytotoxicity, was significantly reduced in melanoma compared to both nevi and normal skin. Interestingly, cathepsin L (CTSL) expression was decreased in benign nevi compared to both normal and melanoma samples (Figure 7B). Overall, the results indicate a global upregulation of glycolytic genes (9 out of 13 analyzed) and cathepsins (3 out of 6 analyzed) during the progression from normal skin to melanoma.
4. Discussion
The present study provides evidence that combined disruption of lysosomal integrity and glycolytic function leads to a profound metabolic collapse and cell death in melanoma cells. LLOMe disrupts mitochondrial function via cysteine cathepsin-dependent mechanisms, leading to OXPHOS suppression and partial glycolysis inhibition, while 2DG inhibits glycolysis. Their combined action induces a profound energy deficit, resulting in both apoptotic and necrotic cell death. Although this approach effectively reduced melanoma cell viability, the non-selective toxicity of LLOMe remains a critical limitation for its therapeutic application. This underscores the need to identify safer LMP inducers, and highlights mefloquine and siramesine as promising candidates for further investigation in combination with glycolysis inhibitors.
Consistent with our previous findings that 2DG synergizes with the lysosomal detergent N-dodecylimidazole (NDI) in killing B16 mouse melanoma cells [21], its combination with LLOMe similarly produced a synergistic reduction in the viability of A375 human melanoma cells (Figure 1A-E). Similarly to that study, the cytotoxicity of combined treatment was not mediated by necroptosis or ferroptosis (Figure 2A, B). 2DG has been shown to stimulate prosurvival autophagy [56,57] and to inhibit cytotoxic autophagy [58]. Although lysosomal damage is generally expected to impair autophagic flux by compromising lysosomal degradative capacity [59], we found no literature evidence supporting such an effect for LLOMe. Instead, LLOMe has been reported to induce lysophagy, a selective, cytoprotective autophagy that removes damaged lysosomes [39,60,61,62,63,64]. It is therefore plausible that 2DG may interfere with LLOMe-induced lysophagy. However, neither pharmacologic nor genetic inhibition of autophagy affected the cytotoxicity of 2DG, LLOMe, or their combination (Figure 2C, D), arguing against a role for autophagy modulation in mediating their cytotoxic effects. 2DG induces apoptosis [65,66], while LLOMe can trigger either apoptosis [32,39,67,68] or necrosis [44,69,70,71], depending on the dose and cell type. Consistent with this, we observed that both 2DG and LLOMe individually induced caspase-dependent apoptosis in melanoma cells (Figure 2E-H). However, their combination triggered both apoptotic and necrotic death, with apoptosis still predominating (Figure 2E). Given that apoptosis is a highly energy-dependent process, unlike necrosis [72], it is plausible that the strong energy depletion caused by combination of 2DG and LLOMe may have diverted part of the apoptotic response toward necrosis.
LLOMe is an acidophilic compound that is cleaved and polymerized by cathepsin C inside lysosomes, generating membranolytic products that trigger LMP [28]. Following LMP, some authors attribute LLOMe-induced cytotoxicity to the translocation of cathepsins B and L from lysosomes to mitochondria, where they degrade mitochondrial proteins and trigger MMP loss [29]. Others report that cysteine cathepsins B, L, S, K, and H activate pore-forming Bid and degrade anti-apoptotic proteins such as Bcl-2, Bcl-xL, and Mcl-1, thereby also promoting MMP loss [30,31]. Alternatively, cathepsins B and L were shown to activate caspases in cytoplasm [32]. We demonstrated that LLOMe, alone or in combination with 2DG, induces rapid lysosomal deacidification (Figure 3A-D), while cytotoxicity of these treatments was partially prevented by the V-ATPase inhibitor bafilomycin A1 (Figure 3E), which probably prevented accumulation of acidophilic LLOMe inside lysosomes. The Ca²⁺ chelator BAPTA-AM further enhanced LLOMe- and LLOMe+2DG-induced cytotoxicity (Figure 3H), which indirectly supports the involvement of LMP in cell death, given the established role of Ca²⁺ in promoting lysosomal membrane repair [39]. Partial protection was also observed with MG132, a proteasome inhibitor that also targets cathepsins B, C, L, and S [41,42,43,44], suggesting that one or more of cysteine cathepsins may contribute to the observed cytotoxicity. However, the only partial protection implies that cathepsin activity is not the sole mediator and that additional cathepsin-independent cytotoxic mechanisms are likely involved.
Mitochondrial depolarization is a key event in the intrinsic pathway of apoptosis, often preceding cytochrome c release and caspase activation, but it can also indicate irreversible mitochondrial dysfunction leading to necrosis when ATP levels are insufficient to support apoptotic execution [49]. In accordance with previous results [29,30], we demonstrated LLOMe triggers MMP loss (Figure 4A). Mitochondrial depolarization was even more pronounced in the presence of 2DG (Figure 4A), possibly due to the cell’s inability to maintain mitochondrial membrane potential under conditions of severe ATP depletion [73]. The partial prevention of MMP loss by bafilomycin A1 and MG132 suggests that lysosomal acidification, required for LLOMe accumulation in lysosomes, as well as the activity of cysteine cathepsins contribute to LLOMe-induced mitochondrial depolarization. However, whether LLOMe-induced mitochondrial depolarization results from cysteine cathepsin-mediated degradation of proteins that regulate mitochondrial permeability in the cytoplasm (as suggested by [30,31,32], or within mitochondria [29], remains to be clarified.
MMP loss can enhance O₂•⁻ production by disrupting electron flow through the electron transport chain [74], while O₂•⁻ itself exacerbates mitochondrial dysfunction by promoting permeability transition pore opening and further depolarization [75], thereby establishing a positive feedback loop. LLOMe was previously shown to stimulate both mitochondrial O₂•⁻ production and MMP loss in a cathepsin B-dependent manner [76]. Accordingly, we observed that LLOMe, alone or in combination with 2DG, significantly increased mitochondrial O₂•⁻ levels (Figure 4B), an effect that was partially prevented by bafilomycin A1 and MG132, further implicating lysosomal involvement in mitochondrial oxidative stress. Moreover, the non-specific antioxidant NAC protected against LLOMe±2DG-induced toxicity, while SOD exacerbated it (Figure 4C), suggesting that hydrogen peroxide (H₂O₂), a product of SOD-mediated O₂•⁻ dismutation [77], or its downstream products may contribute to oxidative damage. Lysosomes serve as major reservoirs of chelatable iron due to autophagic degradation of iron-containing proteins, and upon LMP, the released iron can catalyze Fenton reactions, generating highly reactive hydroxyl radicals (•OH) from H₂O₂ [78]. While •OH can initiate lipid peroxidation of membrane phospholipids, including those in lysosomes [78], the inability of the lipid radical-trapping antioxidant Ferrostatin-1 [79] to rescue cells from LLOMe or 2DG+LLOMe (Figure 2A) argues against lipid peroxidation as the primary cytotoxic mechanism, pointing instead to oxidative damage to proteins, mitochondria, or DNA.
Since ATP synthase relies on MMP as a driving force [73], MMP loss disrupts OXPHOS and impairs ATP production. Accordingly, LLOMe-induced MMP loss was associated with a decrease in OXPHOS activity (Figure 5A). Consistent with this, a previous study showed that LLOMe impaired mitochondrial respiration, which was reversed by cathepsin inhibition [29]. While 2DG has been shown to enhance OXPHOS in cells with metabolically flexible mitochondria as a compensatory response to glycolytic inhibition [80,81], it can suppress mitochondrial respiration in highly glycolytic cells by limiting pyruvate availability for the TCA cycle and subsequent OXPHOS [82,83]. In line with the latter, 2DG tended to reduce OXPHOS in our model, although this effect did not reach statistical significance (Figure 5A). As expected, the strongest inhibition was observed when both treatments were applied in combination (Figure 5A). Interestingly, although LLOMe was previously shown to transiently increase glycolysis after 1 hour in macrophages [29], it reduced glycolytic activity in our model (Figure 5A), suggesting that its metabolic effects may depend on cell type and duration of exposure. The observed glycolysis suppression by LLOMe may be attributed to cathepsin-mediated degradation of glycolytic enzymes [84] and/or a global metabolic decline caused by severe cellular damage [85]. As expected, the glycolytic inhibitor 2DG [7] suppressed ECAR and the strongest inhibition was observed following the combined treatment (Figure 5B). L-carnitine promotes ATP production by facilitating the transport of long-chain fatty acids into mitochondria for β-oxidation [86], while succinate supports mitochondrial respiration by acting as both a TCA cycle intermediate and an electron donor to complex II of the electron transport chain [87,88]. Both energy-boosting agents partially attenuated 2DG+LLOMe-induced cytotoxicity, indicating that energy depletion mediates the cytotoxicity of the combined treatment. However, the rescue was limited, most likely because mitochondria were already largely dysfunctional and unable to efficiently synthesize ATP. Inhibition of glycolysis by DCA, shikonin, or HK2 knockdown mimicked the effect of 2DG and enhanced LLOMe-induced cytotoxicity (Figure 5D-F), confirming that glycolysis suppression underlies the synergy and that 2DG could potentially be replaced by other glycolysis-targeting agents.
Our analysis of publicly available gene expression data is consistent with previous studies reporting upregulation of glycolytic enzymes GPI [89], ALDOA [90], GAPDH [91,92], PKM2 [92,93], and LDHA [94,95], as well as downregulation of ALDOC [96] in melanoma patients. However, while previous studies reported increased expression of the platelet form of PFK (PFKP) [97], our study is the first to show a progressive upregulation of its muscle isoform PFKM from healthy skin to benign nevi and malignant melanoma (Figure 7A). TPI1 was upregulated in metastatic uveal melanoma [98,99,100], but we demonstrated its increase in cutaneous melanoma (Figure 7A). Unlike earlier reports showing HK2 upregulation in melanoma cell lines relative to immune cells [101], we found reduced HK2 expression in benign nevi compared to healthy skin, which may reflect differences in the degree of malignant transformation and the choice of control groups. Importantly, while previous studies described HK3 overexpression in non-melanoma cancers [102,103,104,105,106], we demonstrated its increased expression in malignant melanoma relative to both benign and normal tissue (Figure 7A).
In line with previous findings [107,108,109,110,111,112], our analysis revealed a progressive upregulation of CTSB and CTSD from normal skin through benign nevi to malignant melanoma (Figure 7B), confirming their potential involvement in melanocytic transformation and tumor progression. While CTSZ has been reported to be elevated in metastatic uveal melanoma compared to non-metastatic tissue or primary uveal melanocytes [113,114], our analysis demonstrates its upregulation in cutaneous melanoma samples (Figure 7B). Importantly, although CTSC is upregulated in various non-melanoma cancers [115,116], our study revealed its decreased expression in malignant melanoma compared to healthy skin and nevi (Figure 7B). Fibroblasts represent a major population of skin-resident cells [117,118], and the higher CTSC expression in healthy skin than in melanoma tissue may explain the greater sensitivity of skin fibroblasts to LLOMe than melanoma cells (Figure 6A). In contrast, the cytotoxic effects of mefloquine and siramesine are primarily mediated by cathepsin B [119,120,121], whose expression increases during malignant transformation (Figure 7B), potentially accounting for the enhanced selectivity of these agents toward melanoma (Figure 6B, C). We did not observe increased expression of HK2, the primary target of 2DG [122] but rather of HK3, for which no evidence of 2DG sensitivity has been reported. However, we detected elevated levels of PGI, another enzyme affected by 2DG [123], which may contribute to the increased susceptibility of melanoma cells to 2DG compared to dermal fibroblasts.
5. Conclusions
In summary, our results indicate that LLOMe disrupts lysosomal integrity and, likely through cysteine cathepsin activity, induces mitochondrial dysfunction and suppression of OXPHOS, but also inhibits glycolysis to a lesser extent through an unknown mechanism. In addition 2DG inhibits glycolysis. The combination of 2DG and LLOMe causes a severe energy crisis, ultimately resulting in mixed apoptotic and necrotic cell death. Although LLOMe was effective, its considerable toxicity toward non-malignant cells limits its translational potential, whereas alternative lysosome-destabilizing agents such as siramesine and mefloquine show greater selectivity for melanoma cells, spare fibroblasts, and synergize with 2DG. These findings support the rationale for further exploration of selective LMP inducers in combination with glycolysis inhibitors as a promising therapeutic strategy against melanoma.
Author Contributions
Conceptualization, Ljubica Harhaji-Trajkovic; Formal analysis, Ljubica Vucicevic, Maja Misirkic-Marjanovic and Ljubica Harhaji-Trajkovic; Funding acquisition, Ljubica Harhaji-Trajkovic; Investigation, Milica Kosic, Mihajlo Bosnjak and Milos Mandic; Methodology, Milica Kosic, Mihajlo Bosnjak, Milos Mandic, Ljubica Vucicevic and Maja Misirkic-Marjanovic; Supervision, Ljubica Harhaji-Trajkovic; Writing – original draft, Ljubica Harhaji-Trajkovic; Writing – review & editing, Milica Kosic, Mihajlo Bosnjak, Milos Mandic, Ljubica Vucicevic, Maja Misirkic-Marjanovic and Ljubica Harhaji-Trajkovic.
Funding
This study was founded by the Ministry of Science, Technological Development and Innovation of the Republic of Serbia, Grants No. 451-03-136/2025-03/ 200007 and 451-03-137/2025-03/ 200110. L.H.T. has received a research donation from the nonprofit organization Climbers Against Cancer.
Acknowledgments
We thank Prof. Dr. Vladimir Trajkovic (Faculty of Medicine, University of Belgrade) for generously providing part of the laboratory reagents and materials used in this study and Dr. Jelena Grahovac (Institute for Oncology and Radiology of Serbia) for kindly providing the A375 melanoma cells. The results presented in this manuscript are in line with Sustainable Development Goal 3 (Good Health and Well-being) of the United Nations 2030 Agenda.
Conflicts of Interest
The authors report no competing interests.
Abbreviations
The following abbreviations are used in this manuscript:
| 2DG | 2-deoxy-D-glucose |
| 7-AAD | 7-Aminoactinomycin D |
| ALDOA | aldolase A |
| ALDOB | aldolase B |
| ALDOC | aldolase C |
| AO | acridine orange |
| ATP | adenosine triphosphate |
| BAF | bafilomycin A1 |
| BAPTA | 1,2-bis(o-aminophenoxy)ethane-N,N,N′,N′-tetraacetic acid |
| Bcl-2 | B-cell lymphoma 2 |
| Bcl-xL | B-cell lymphoma-extra large |
| BRAF | v-Raf murine sarcoma viral oncogene homolog B |
| BSA | bovine serum albumin |
| CARN | L-carnitine |
| CTSB | cathepsin B |
| CTSC | cathepsin C |
| CTSD | cathepsin D |
| CTSL | cathepsin L |
| CTSS | cathepsin S |
| CTSZ | cathepsin Z |
| DAPI | 4′,6-diamidino-2-phenylindole |
| DCA | dichloroacetate |
| DHR123 | dihydrorhodamine 123 |
| DMEM | Dulbecco’s Modified Eagle Medium |
| DMSO | dimethyl sulfoxide |
| ECAR | extracellular acidification rate |
| FACS | fluorescence-activated cell sorting |
| FBS | fetal bovine serum |
| FERRO | Ferrostatin-1 |
| FITC | fluorescein isothiocyanate |
| GAPDH | glyceraldehyde-3-phosphate dehydrogenase |
| GEO | Gene Expression Omnibus |
| GPI | glucose-6-phosphate isomerase |
| HK1 | hexokinase 1 |
| HK2 | hexokinase 2 |
| HK3 | hexokinase 3 |
| JC-1 | 5,5′,6,6′-tetrachloro-1,1′,3,3′-tetraethylbenzimidazolylcarbocyanine iodide |
| LDHA | lactate dehydrogenase A |
| LLOMe | L-leucyl-L-leucine methyl ester |
| Mcl-1 | Myeloid cell leukemia 1 |
| MEF | Mefloquine |
| MEK/ERK | Mitogen-Activated Protein Kinase Kinase / Extracellular Signal-Regulated Kinase |
| MG132 | carbobenzoxy-Leu-Leu-leucinal |
| MMP | mitochondrial membrane potential |
| MMP+ | 1-methyl-4-phenylpyridinium ion |
| MitoSOX | mitochondrial superoxide indicator |
| NAC | N-Acetylcysteine |
| NECRO | Necrostatin-1 |
| NHDF | Normal Human Dermal Fibroblasts |
| OCR | oxygen consumption rate |
| PEP | Pepstatin A |
| PFKM | phosphofructokinase, muscle |
| PFKP | phosphofructokinase, Platelet isoform |
| PI | Propidium Iodide |
| PKM | pyruvate kinase M1/2 |
| QVD | Q-VD-OPh |
| ROS | reactive oxygen species |
| SHI | Shikonin |
| SIR | Siramesine |
| SOD | superoxide dismutase |
| TCA | tricarboxylic acid |
| TPI1 | triosephosphate isomerase 1 |
| siRNA | small interfering RNA |
| WORT | Wortmannin |
References
- Erdei, E.; Torres, S.M. A new understanding in the epidemiology of melanoma. Expert review of anticancer therapy 2010, 10, 1811-1823. [CrossRef]
- Bray, F.; Laversanne, M.; Sung, H.; Ferlay, J.; Siegel, R.L.; Soerjomataram, I.; Jemal, A. Global cancer statistics 2022: GLOBOCAN estimates of incidence and mortality worldwide for 36 cancers in 185 countries. CA: a cancer journal for clinicians 2024, 74, 229-263. [CrossRef]
- Rebecca, V.W.; Somasundaram, R.; Herlyn, M. Pre-clinical modeling of cutaneous melanoma. Nature communications 2020, 11, 2858. [CrossRef]
- Kakadia, S.; Yarlagadda, N.; Awad, R.; Kundranda, M.; Niu, J.; Naraev, B.; Mina, L.; Dragovich, T.; Gimbel, M.; Mahmoud, F. Mechanisms of resistance to BRAF and MEK inhibitors and clinical update of US Food and Drug Administration-approved targeted therapy in advanced melanoma. OncoTargets and therapy 2018, 11, 7095-7107. [CrossRef]
- Ferretta, A.; Maida, I.; Guida, S.; Azzariti, A.; Porcelli, L.; Tommasi, S.; Zanna, P.; Cocco, T.; Guida, M.; Guida, G. New insight into the role of metabolic reprogramming in melanoma cells harboring BRAF mutations. Biochimica et biophysica acta 2016, 1863, 2710-2718. [CrossRef]
- Scott, D.A.; Richardson, A.D.; Filipp, F.V.; Knutzen, C.A.; Chiang, G.G.; Ronai, Z.A.; Osterman, A.L.; Smith, J.W. Comparative metabolic flux profiling of melanoma cell lines: beyond the Warburg effect. The Journal of biological chemistry 2011, 286, 42626-42634. [CrossRef]
- Pajak, B.; Siwiak, E.; Sołtyka, M.; Priebe, A.; Zieliński, R.; Fokt, I.; Ziemniak, M.; Jaśkiewicz, A.; Borowski, R.; Domoradzki, T.; et al. 2-Deoxy-d-Glucose and Its Analogs: From Diagnostic to Therapeutic Agents. International journal of molecular sciences 2019, 21. [CrossRef]
- Giammarioli, A.M.; Gambardella, L.; Barbati, C.; Pietraforte, D.; Tinari, A.; Alberton, M.; Gnessi, L.; Griffin, R.J.; Minetti, M.; Malorni, W. Differential effects of the glycolysis inhibitor 2-deoxy-D-glucose on the activity of pro-apoptotic agents in metastatic melanoma cells, and induction of a cytoprotective autophagic response. International journal of cancer 2012, 131, E337-347. [CrossRef]
- Pattni, B.S.; Jhaveri, A.; Dutta, I.; Baleja, J.D.; Degterev, A.; Torchilin, V. Targeting energy metabolism of cancer cells: Combined administration of NCL-240 and 2-DG. International journal of pharmaceutics 2017, 532, 149-156. [CrossRef]
- Hill-Mündel, K.; Nohr, D. Cytotoxic activity of high dose ascorbic acid is enhanced by 2-deoxy-d-glucose in glycolytic melanoma cells. Biochemical and biophysical research communications 2021, 546, 90-96. [CrossRef]
- Malyarenko, O.S.; Usoltseva, R.V.; Silchenko, A.S.; Zueva, A.O.; Ermakova, S.P. The Combined Metabolically Oriented Effect of Fucoidan from the Brown Alga Saccharina cichorioides and Its Carboxymethylated Derivative with 2-Deoxy-D-Glucose on Human Melanoma Cells. International journal of molecular sciences 2023, 24. [CrossRef]
- Liu, H.; Jiang, C.C.; Lavis, C.J.; Croft, A.; Dong, L.; Tseng, H.Y.; Yang, F.; Tay, K.H.; Hersey, P.; Zhang, X.D. 2-Deoxy-D-glucose enhances TRAIL-induced apoptosis in human melanoma cells through XBP-1-mediated up-regulation of TRAIL-R2. Molecular cancer 2009, 8, 122. [CrossRef]
- Liu, H.; Kurtoglu, M.; León-Annicchiarico, C.L.; Munoz-Pinedo, C.; Barredo, J.; Leclerc, G.; Merchan, J.; Liu, X.; Lampidis, T.J. Combining 2-deoxy-D-glucose with fenofibrate leads to tumor cell death mediated by simultaneous induction of energy and ER stress. Oncotarget 2016, 7, 36461-36473. [CrossRef]
- Raez, L.E.; Papadopoulos, K.; Ricart, A.D.; Chiorean, E.G.; Dipaola, R.S.; Stein, M.N.; Rocha Lima, C.M.; Schlesselman, J.J.; Tolba, K.; Langmuir, V.K.; et al. A phase I dose-escalation trial of 2-deoxy-D-glucose alone or combined with docetaxel in patients with advanced solid tumors. Cancer chemotherapy and pharmacology 2013, 71, 523-530. [CrossRef]
- Singh, D.; Banerji, A.K.; Dwarakanath, B.S.; Tripathi, R.P.; Gupta, J.P.; Mathew, T.L.; Ravindranath, T.; Jain, V. Optimizing cancer radiotherapy with 2-deoxy-d-glucose dose escalation studies in patients with glioblastoma multiforme. Strahlentherapie und Onkologie : Organ der Deutschen Rontgengesellschaft ... [et al] 2005, 181, 507-514. [CrossRef]
- Stein, M.; Lin, H.; Jeyamohan, C.; Dvorzhinski, D.; Gounder, M.; Bray, K.; Eddy, S.; Goodin, S.; White, E.; Dipaola, R.S. Targeting tumor metabolism with 2-deoxyglucose in patients with castrate-resistant prostate cancer and advanced malignancies. The Prostate 2010, 70, 1388-1394. [CrossRef]
- Hsu, C.H.; Lee, K.J.; Chiu, Y.H.; Huang, K.C.; Wang, G.S.; Chen, L.P.; Liao, K.W.; Lin, C.S. The Lysosome in Malignant Melanoma: Biology, Function and Therapeutic Applications. Cells 2022, 11. [CrossRef]
- Berg, A.L.; Rowson-Hodel, A.; Wheeler, M.R.; Hu, M.; Free, S.R.; Carraway, K.L., III. III. Engaging the Lysosome and Lysosome-Dependent Cell Death in Cancer. In Breast Cancer; Mayrovitz, H.N., Ed.; Exon Publications: Brisbane (AU), 2022; pp. 123–135.
- Yin, M.; Soikkeli, J.; Jahkola, T.; Virolainen, S.; Saksela, O.; Hölttä, E. TGF-β signaling, activated stromal fibroblasts, and cysteine cathepsins B and L drive the invasive growth of human melanoma cells. The American journal of pathology 2012, 181, 2202-2216. [CrossRef]
- Paunovic, V.; Kosic, M.; Misirkic-Marjanovic, M.; Trajkovic, V.; Harhaji-Trajkovic, L. Dual targeting of tumor cell energy metabolism and lysosomes as an anticancer strategy. Biochimica et biophysica acta. Molecular cell research 2021, 1868, 118944. [CrossRef]
- Kosic, M.; Arsikin-Csordas, K.; Paunovic, V.; Firestone, R.A.; Ristic, B.; Mircic, A.; Petricevic, S.; Bosnjak, M.; Zogovic, N.; Mandic, M.; et al. Synergistic Anticancer Action of Lysosomal Membrane Permeabilization and Glycolysis Inhibition. The Journal of biological chemistry 2016, 291, 22936-22948. [CrossRef]
- Harhaji-Trajkovic, L.; Arsikin, K.; Kravic-Stevovic, T.; Petricevic, S.; Tovilovic, G.; Pantovic, A.; Zogovic, N.; Ristic, B.; Janjetovic, K.; Bumbasirevic, V.; et al. Chloroquine-mediated lysosomal dysfunction enhances the anticancer effect of nutrient deprivation. Pharmaceutical research 2012, 29, 2249-2263. [CrossRef]
- Jo, M.H.; Kim, Y.T.; Park, S.J. Dieckol Inhibits Autophagic Flux and Induces Apoptotic Cell Death in A375 Human Melanoma Cells via Lysosomal Dysfunction and Mitochondrial Membrane Impairment. International journal of molecular sciences 2022, 23. [CrossRef]
- Chang, S.H.; Lin, P.Y.; Wu, T.K.; Hsu, C.S.; Huang, S.W.; Li, Z.Y.; Liu, K.T.; Kao, J.K.; Chen, Y.J.; Wong, T.W.; et al. Imiquimod-induced ROS production causes lysosomal membrane permeabilization and activates caspase-8-mediated apoptosis in skin cancer cells. Journal of dermatological science 2022, 107, 142-150. [CrossRef]
- Zhang, X.; Ding, K.; Ji, J.; Parajuli, H.; Aasen, S.N.; Espedal, H.; Huang, B.; Chen, A.; Wang, J.; Li, X.; et al. Trifluoperazine prolongs the survival of experimental brain metastases by STAT3-dependent lysosomal membrane permeabilization. American journal of cancer research 2020, 10, 545-563.
- Noguchi, S.; Shibutani, S.; Fukushima, K.; Mori, T.; Igase, M.; Mizuno, T. Bosutinib, an SRC inhibitor, induces caspase-independent cell death associated with permeabilization of lysosomal membranes in melanoma cells. Veterinary and comparative oncology 2018, 16, 69-76. [CrossRef]
- Al Sinani, S.S.; Eltayeb, E.A.; Coomber, B.L.; Adham, S.A. Solamargine triggers cellular necrosis selectively in different types of human melanoma cancer cells through extrinsic lysosomal mitochondrial death pathway. Cancer cell international 2016, 16, 11. [CrossRef]
- Thiele, D.L.; Lipsky, P.E. Mechanism of L-leucyl-L-leucine methyl ester-mediated killing of cytotoxic lymphocytes: dependence on a lysosomal thiol protease, dipeptidyl peptidase I, that is enriched in these cells. Proceedings of the National Academy of Sciences of the United States of America 1990, 87, 83-87. [CrossRef]
- Bussi, C.; Heunis, T.; Pellegrino, E.; Bernard, E.M.; Bah, N.; Dos Santos, M.S.; Santucci, P.; Aylan, B.; Rodgers, A.; Fearns, A.; et al. Lysosomal damage drives mitochondrial proteome remodelling and reprograms macrophage immunometabolism. Nature communications 2022, 13, 7338. [CrossRef]
- Droga-Mazovec, G.; Bojic, L.; Petelin, A.; Ivanova, S.; Romih, R.; Repnik, U.; Salvesen, G.S.; Stoka, V.; Turk, V.; Turk, B. Cysteine cathepsins trigger caspase-dependent cell death through cleavage of bid and antiapoptotic Bcl-2 homologues. The Journal of biological chemistry 2008, 283, 19140-19150. [CrossRef]
- Cirman, T.; Oresić, K.; Mazovec, G.D.; Turk, V.; Reed, J.C.; Myers, R.M.; Salvesen, G.S.; Turk, B. Selective disruption of lysosomes in HeLa cells triggers apoptosis mediated by cleavage of Bid by multiple papain-like lysosomal cathepsins. The Journal of biological chemistry 2004, 279, 3578-3587. [CrossRef]
- Kavčič, N.; Butinar, M.; Sobotič, B.; Hafner Česen, M.; Petelin, A.; Bojić, L.; Zavašnik Bergant, T.; Bratovš, A.; Reinheckel, T.; Turk, B. Intracellular cathepsin C levels determine sensitivity of cells to leucyl-leucine methyl ester-triggered apoptosis. The FEBS journal 2020, 287, 5148-5166. [CrossRef]
- Eriksson, I.; Vainikka, L.; Wäster, P.; Öllinger, K. Lysosomal Function and Intracellular Position Determine the Malignant Phenotype in Malignant Melanoma. The Journal of investigative dermatology 2023, 143, 1769-1778.e1712. [CrossRef]
- Plana, D.; Palmer, A.C.; Sorger, P.K. Independent Drug Action in Combination Therapy: Implications for Precision Oncology. Cancer discovery 2022, 12, 606-624. [CrossRef]
- Kaludjerović, G.N.; Miljković, D.; Momcilović, M.; Djinović, V.M.; Mostarica Stojković, M.; Sabo, T.J.; Trajković, V. Novel platinum(IV) complexes induce rapid tumor cell death in vitro. International journal of cancer 2005, 116, 479-486. [CrossRef]
- Kosic, M.; Paunovic, V.; Ristic, B.; Mircic, A.; Bosnjak, M.; Stevanovic, D.; Kravic-Stevovic, T.; Trajkovic, V.; Harhaji-Trajkovic, L. 3-Methyladenine prevents energy stress-induced necrotic death of melanoma cells through autophagy-independent mechanisms. Journal of pharmacological sciences 2021, 147, 156-167. [CrossRef]
- Talantov, D.; Mazumder, A.; Yu, J.X.; Briggs, T.; Jiang, Y.; Backus, J.; Atkins, D.; Wang, Y. Novel genes associated with malignant melanoma but not benign melanocytic lesions. Clinical cancer research : an official journal of the American Association for Cancer Research 2005, 11, 7234-7242. [CrossRef]
- Feise, R.J. Do multiple outcome measures require p-value adjustment? BMC medical research methodology 2002, 2, 8. [CrossRef]
- Eriksson, I.; Wäster, P.; Öllinger, K. Restoration of lysosomal function after damage is accompanied by recycling of lysosomal membrane proteins. Cell death & disease 2020, 11, 370. [CrossRef]
- Yoshimori, T.; Yamamoto, A.; Moriyama, Y.; Futai, M.; Tashiro, Y. Bafilomycin A1, a specific inhibitor of vacuolar-type H(+)-ATPase, inhibits acidification and protein degradation in lysosomes of cultured cells. The Journal of biological chemistry 1991, 266, 17707-17712.
- Repnik, U.; Borg Distefano, M.; Speth, M.T.; Ng, M.Y.W.; Progida, C.; Hoflack, B.; Gruenberg, J.; Griffiths, G. L-leucyl-L-leucine methyl ester does not release cysteine cathepsins to the cytosol but inactivates them in transiently permeabilized lysosomes. Journal of cell science 2017, 130, 3124-3140. [CrossRef]
- Costanzi, E.; Kuzikov, M.; Esposito, F.; Albani, S.; Demitri, N.; Giabbai, B.; Camasta, M.; Tramontano, E.; Rossetti, G.; Zaliani, A.; et al. Structural and Biochemical Analysis of the Dual Inhibition of MG-132 against SARS-CoV-2 Main Protease (Mpro/3CLpro) and Human Cathepsin-L. International journal of molecular sciences 2021, 22. [CrossRef]
- Falke, S.; Lieske, J.; Herrmann, A.; Loboda, J.; Karničar, K.; Günther, S.; Reinke, P.Y.A.; Ewert, W.; Usenik, A.; Lindič, N.; et al. Structural Elucidation and Antiviral Activity of Covalent Cathepsin L Inhibitors. Journal of medicinal chemistry 2024, 67, 7048-7067. [CrossRef]
- Brojatsch, J.; Lima, H.; Kar, A.K.; Jacobson, L.S.; Muehlbauer, S.M.; Chandran, K.; Diaz-Griffero, F. A proteolytic cascade controls lysosome rupture and necrotic cell death mediated by lysosome-destabilizing adjuvants. PloS one 2014, 9, e95032. [CrossRef]
- Knight, C.G.; Barrett, A.J. Interaction of human cathepsin D with the inhibitor pepstatin. The Biochemical journal 1976, 155, 117-125. [CrossRef]
- Pontious, C.; Kaul, S.; Hong, M.; Hart, P.A.; Krishna, S.G.; Lara, L.F.; Conwell, D.L.; Cruz-Monserrate, Z. Cathepsin E expression and activity: Role in the detection and treatment of pancreatic cancer. Pancreatology : official journal of the International Association of Pancreatology (IAP) ... [et al.] 2019, 19, 951-956. [CrossRef]
- Kannan, K.; Jain, S.K. Oxidative stress and apoptosis. Pathophysiology : the official journal of the International Society for Pathophysiology 2000, 7, 153-163. [CrossRef]
- Choi, K.; Kim, J.; Kim, G.W.; Choi, C. Oxidative stress-induced necrotic cell death via mitochondira-dependent burst of reactive oxygen species. Current neurovascular research 2009, 6, 213-222. [CrossRef]
- Bernardi, P.; Gerle, C.; Halestrap, A.P.; Jonas, E.A.; Karch, J.; Mnatsakanyan, N.; Pavlov, E.; Sheu, S.S.; Soukas, A.A. Identity, structure, and function of the mitochondrial permeability transition pore: controversies, consensus, recent advances, and future directions. Cell death and differentiation 2023, 30, 1869-1885. [CrossRef]
- Tsujimoto, Y.; Shimizu, S. Role of the mitochondrial membrane permeability transition in cell death. Apoptosis : an international journal on programmed cell death 2007, 12, 835-840. [CrossRef]
- Roussel, D.; Janillon, S.; Teulier, L.; Pichaud, N. Succinate oxidation rescues mitochondrial ATP synthesis at high temperature in Drosophila melanogaster. FEBS letters 2023, 597, 2221-2229. [CrossRef]
- Iossa, S.; Mollica, M.P.; Lionetti, L.; Crescenzo, R.; Botta, M.; Barletta, A.; Liverini, G. Acetyl-L-carnitine supplementation differently influences nutrient partitioning, serum leptin concentration and skeletal muscle mitochondrial respiration in young and old rats. The Journal of nutrition 2002, 132, 636-642. [CrossRef]
- Sanchez, W.Y.; McGee, S.L.; Connor, T.; Mottram, B.; Wilkinson, A.; Whitehead, J.P.; Vuckovic, S.; Catley, L. Dichloroacetate inhibits aerobic glycolysis in multiple myeloma cells and increases sensitivity to bortezomib. British journal of cancer 2013, 108, 1624-1633. [CrossRef]
- Chen, J.; Xie, J.; Jiang, Z.; Wang, B.; Wang, Y.; Hu, X. Shikonin and its analogs inhibit cancer cell glycolysis by targeting tumor pyruvate kinase-M2. Oncogene 2011, 30, 4297-4306. [CrossRef]
- Xi, H.; Kurtoglu, M.; Lampidis, T.J. The wonders of 2-deoxy-D-glucose. IUBMB life 2014, 66, 110-121. [CrossRef]
- Xi, H.; Kurtoglu, M.; Liu, H.; Wangpaichitr, M.; You, M.; Liu, X.; Savaraj, N.; Lampidis, T.J. 2-Deoxy-D-glucose activates autophagy via endoplasmic reticulum stress rather than ATP depletion. Cancer chemotherapy and pharmacology 2011, 67, 899-910. [CrossRef]
- Huang, X.M.; Huang, J.J.; Du, J.J.; Zhang, N.; Long, Z.; Yang, Y.; Zhong, F.F.; Zheng, B.W.; Shen, Y.F.; Huang, Z.; et al. Autophagy inhibitors increase the susceptibility of KRAS-mutant human colorectal cancer cells to a combined treatment of 2-deoxy-D-glucose and lovastatin. Acta pharmacologica Sinica 2021, 42, 1875-1887. [CrossRef]
- Jeon, J.Y.; Kim, S.W.; Park, K.C.; Yun, M. The bifunctional autophagic flux by 2-deoxyglucose to control survival or growth of prostate cancer cells. BMC cancer 2015, 15, 623. [CrossRef]
- Qi, Z.; Yang, W.; Xue, B.; Chen, T.; Lu, X.; Zhang, R.; Li, Z.; Zhao, X.; Zhang, Y.; Han, F.; et al. ROS-mediated lysosomal membrane permeabilization and autophagy inhibition regulate bleomycin-induced cellular senescence. Autophagy 2024, 20, 2000-2016. [CrossRef]
- Otomo, T.; Yoshimori, T. Lysophagy: A Method for Monitoring Lysosomal Rupture Followed by Autophagy-Dependent Recovery. Methods in molecular biology (Clifton, N.J.) 2017, 1594, 141-149. [CrossRef]
- Maejima, I.; Takahashi, A.; Omori, H.; Kimura, T.; Takabatake, Y.; Saitoh, T.; Yamamoto, A.; Hamasaki, M.; Noda, T.; Isaka, Y.; et al. Autophagy sequesters damaged lysosomes to control lysosomal biogenesis and kidney injury. The EMBO journal 2013, 32, 2336-2347. [CrossRef]
- Zein, L.; Dietrich, M.; Balta, D.; Bader, V.; Scheuer, C.; Zellner, S.; Weinelt, N.; Vandrey, J.; Mari, M.C.; Behrends, C.; et al. Linear ubiquitination at damaged lysosomes induces local NFKB activation and controls cell survival. Autophagy 2025, 21, 1075-1095. [CrossRef]
- Jia, J.; Claude-Taupin, A.; Gu, Y.; Choi, S.W.; Peters, R.; Bissa, B.; Mudd, M.H.; Allers, L.; Pallikkuth, S.; Lidke, K.A.; et al. Galectin-3 Coordinates a Cellular System for Lysosomal Repair and Removal. Developmental cell 2020, 52, 69-87.e68. [CrossRef]
- Park, N.Y.; Jo, D.S.; Kim, Y.H.; Bae, J.E.; Kim, J.B.; Park, H.J.; Choi, J.Y.; Lee, H.J.; Chang, J.H.; Bunch, H.; et al. Triamterene induces autophagic degradation of lysosome by exacerbating lysosomal integrity. Archives of pharmacal research 2021, 44, 621-631. [CrossRef]
- Aft, R.L.; Zhang, F.W.; Gius, D. Evaluation of 2-deoxy-D-glucose as a chemotherapeutic agent: mechanism of cell death. British journal of cancer 2002, 87, 805-812. [CrossRef]
- Kano, A.; Fujiki, M.; Fukami, K.; Shindo, M.; Kang, J.-H. Bongkrekic acid inhibits 2-deoxygulcose-induced apoptosis, leading to enhanced cytotoxicity and necrotic cell death. Pharmacological Research - Reports 2024, 2, 100017. [CrossRef]
- Uchimoto, T.; Nohara, H.; Kamehara, R.; Iwamura, M.; Watanabe, N.; Kobayashi, Y. Mechanism of apoptosis induced by a lysosomotropic agent, L-Leucyl-L-Leucine methyl ester. Apoptosis : an international journal on programmed cell death 1999, 4, 357-362. [CrossRef]
- Thiele, D.L.; Lipsky, P.E. Apoptosis is induced in cells with cytolytic potential by L-leucyl-L-leucine methyl ester. Journal of immunology (Baltimore, Md. : 1950) 1992, 148, 3950-3957.
- Jacobson, L.S.; Lima, H., Jr.; Goldberg, M.F.; Gocheva, V.; Tsiperson, V.; Sutterwala, F.S.; Joyce, J.A.; Gapp, B.V.; Blomen, V.A.; Chandran, K.; et al. Cathepsin-mediated necrosis controls the adaptive immune response by Th2 (T helper type 2)-associated adjuvants. The Journal of biological chemistry 2013, 288, 7481-7491. [CrossRef]
- Brojatsch, J.; Lima, H., Jr.; Palliser, D.; Jacobson, L.S.; Muehlbauer, S.M.; Furtado, R.; Goldman, D.L.; Lisanti, M.P.; Chandran, K. Distinct cathepsins control necrotic cell death mediated by pyroptosis inducers and lysosome-destabilizing agents. Cell cycle (Georgetown, Tex.) 2015, 14, 964-972. [CrossRef]
- Champa, D.; Orlacchio, A.; Patel, B.; Ranieri, M.; Shemetov, A.A.; Verkhusha, V.V.; Cuervo, A.M.; Di Cristofano, A. Obatoclax kills anaplastic thyroid cancer cells by inducing lysosome neutralization and necrosis. Oncotarget 2016, 7, 34453-34471. [CrossRef]
- Tsujimoto, Y. Apoptosis and necrosis: intracellular ATP level as a determinant for cell death modes. Cell death and differentiation 1997, 4, 429-434. [CrossRef]
- Zorova, L.D.; Popkov, V.A.; Plotnikov, E.Y.; Silachev, D.N.; Pevzner, I.B.; Jankauskas, S.S.; Babenko, V.A.; Zorov, S.D.; Balakireva, A.V.; Juhaszova, M.; et al. Mitochondrial membrane potential. Analytical biochemistry 2018, 552, 50-59. [CrossRef]
- Murphy, M.P. How mitochondria produce reactive oxygen species. The Biochemical journal 2009, 417, 1-13. [CrossRef]
- Zorov, D.B.; Filburn, C.R.; Klotz, L.O.; Zweier, J.L.; Sollott, S.J. Reactive oxygen species (ROS)-induced ROS release: a new phenomenon accompanying induction of the mitochondrial permeability transition in cardiac myocytes. The Journal of experimental medicine 2000, 192, 1001-1014. [CrossRef]
- Ni, J.; Wu, Z.; Stoka, V.; Meng, J.; Hayashi, Y.; Peters, C.; Qing, H.; Turk, V.; Nakanishi, H. Increased expression and altered subcellular distribution of cathepsin B in microglia induce cognitive impairment through oxidative stress and inflammatory response in mice. Aging cell 2019, 18, e12856. [CrossRef]
- Perry, J.J.; Shin, D.S.; Getzoff, E.D.; Tainer, J.A. The structural biochemistry of the superoxide dismutases. Biochimica et biophysica acta 2010, 1804, 245-262. [CrossRef]
- Kurz, T.; Terman, A.; Gustafsson, B.; Brunk, U.T. Lysosomes in iron metabolism, ageing and apoptosis. Histochemistry and cell biology 2008, 129, 389-406. [CrossRef]
- Scarpellini, C.; Klejborowska, G.; Lanthier, C.; Hassannia, B.; Vanden Berghe, T.; Augustyns, K. Beyond ferrostatin-1: a comprehensive review of ferroptosis inhibitors. Trends in pharmacological sciences 2023, 44, 902-916. [CrossRef]
- Cai, W.; Cheng, J.; Zong, S.; Yu, Y.; Wang, Y.; Song, Y.; He, R.; Yuan, S.; Chen, T.; Hu, M.; et al. The glycolysis inhibitor 2-deoxyglucose ameliorates adjuvant-induced arthritis by regulating macrophage polarization in an AMPK-dependent manner. Molecular immunology 2021, 140, 186-195. [CrossRef]
- Sinthupibulyakit, C.; Ittarat, W.; St Clair, W.H.; St Clair, D.K. p53 Protects lung cancer cells against metabolic stress. International journal of oncology 2010, 37, 1575-1581. [CrossRef]
- Maximchik, P.; Abdrakhmanov, A.; Inozemtseva, E.; Tyurin-Kuzmin, P.A.; Zhivotovsky, B.; Gogvadze, V. 2-Deoxy-D-glucose has distinct and cell line-specific effects on the survival of different cancer cells upon antitumor drug treatment. The FEBS journal 2018, 285, 4590-4601. [CrossRef]
- Dodson, M.; Benavides, G.A.; Darley-Usmar, V.; Zhang, J. Differential Effects of 2-Deoxyglucose and Glucose Deprivation on 4-Hydroxynonenal Dependent Mitochondrial Dysfunction in Primary Neurons. Frontiers in aging 2022, 3, 812810. [CrossRef]
- Weiss-Sadan, T.; Itzhak, G.; Kaschani, F.; Yu, Z.; Mahameed, M.; Anaki, A.; Ben-Nun, Y.; Merquiol, E.; Tirosh, B.; Kessler, B.; et al. Cathepsin L Regulates Metabolic Networks Controlling Rapid Cell Growth and Proliferation. Molecular & cellular proteomics : MCP 2019, 18, 1330-1344. [CrossRef]
- Pradelli, L.A.; Villa, E.; Zunino, B.; Marchetti, S.; Ricci, J.E. Glucose metabolism is inhibited by caspases upon the induction of apoptosis. Cell death & disease 2014, 5, e1406. [CrossRef]
- Owen, L.; Sunram-Lea, S.I. Metabolic agents that enhance ATP can improve cognitive functioning: a review of the evidence for glucose, oxygen, pyruvate, creatine, and L-carnitine. Nutrients 2011, 3, 735-755. [CrossRef]
- Nowak, G.; Clifton, G.L.; Bakajsova, D. Succinate ameliorates energy deficits and prevents dysfunction of complex I in injured renal proximal tubular cells. The Journal of pharmacology and experimental therapeutics 2008, 324, 1155-1162. [CrossRef]
- Tretter, L.; Patocs, A.; Chinopoulos, C. Succinate, an intermediate in metabolism, signal transduction, ROS, hypoxia, and tumorigenesis. Biochimica et biophysica acta 2016, 1857, 1086-1101. [CrossRef]
- Lu, H.; Zhao, Y.; Zhang, Y.; Shi, S.; Hu, H.; Li, X.; Niu, Y.; Qi, H.; Ji, S.; Duan, X.; et al. Long non-coding RNA CYTOR promotes the progression of melanoma via the miR-485-5p/GPI axis. PeerJ 2025, 13, e19284. [CrossRef]
- Suzuki, A.; Iizuka, A.; Komiyama, M.; Takikawa, M.; Kume, A.; Tai, S.; Ohshita, C.; Kurusu, A.; Nakamura, Y.; Yamamoto, A.; et al. Identification of melanoma antigens using a Serological Proteome Approach (SERPA). Cancer genomics & proteomics 2010, 7, 17-23.
- Giricz, O.; Lauer-Fields, J.L.; Fields, G.B. The normalization of gene expression data in melanoma: investigating the use of glyceraldehyde 3-phosphate dehydrogenase and 18S ribosomal RNA as internal reference genes for quantitative real-time PCR. Analytical biochemistry 2008, 380, 137-139. [CrossRef]
- Nájera, L.; Alonso-Juarranz, M.; Garrido, M.; Ballestín, C.; Moya, L.; Martínez-Díaz, M.; Carrillo, R.; Juarranz, A.; Rojo, F.; Cuezva, J.M.; et al. Prognostic implications of markers of the metabolic phenotype in human cutaneous melanoma. The British journal of dermatology 2019, 181, 114-127. [CrossRef]
- Zerhouni, M.; Martin, A.R.; Furstoss, N.; Gutierrez, V.S.; Jaune, E.; Tekaya, N.; Beranger, G.E.; Abbe, P.; Regazzetti, C.; Amdouni, H.; et al. Dual Covalent Inhibition of PKM and IMPDH Targets Metabolism in Cutaneous Metastatic Melanoma. Cancer research 2021, 81, 3806-3821. [CrossRef]
- Feichtinger, R.G.; Lang, R.; Geilberger, R.; Rathje, F.; Mayr, J.A.; Sperl, W.; Bauer, J.W.; Hauser-Kronberger, C.; Kofler, B.; Emberger, M. Melanoma tumors exhibit a variable but distinct metabolic signature. Experimental dermatology 2018, 27, 204-207. [CrossRef]
- Zhuang, L.; Scolyer, R.A.; Murali, R.; McCarthy, S.W.; Zhang, X.D.; Thompson, J.F.; Hersey, P. Lactate dehydrogenase 5 expression in melanoma increases with disease progression and is associated with expression of Bcl-XL and Mcl-1, but not Bcl-2 proteins. Modern pathology : an official journal of the United States and Canadian Academy of Pathology, Inc 2010, 23, 45-53. [CrossRef]
- Pamidimukkala, N.V.; Leonard, M.K.; Snyder, D.; McCorkle, J.R.; Kaetzel, D.M. Metastasis Suppressor NME1 Directly Activates Transcription of the ALDOC Gene in Melanoma Cells. Anticancer research 2018, 38, 6059-6068. [CrossRef]
- Chen, C.; Zhang, X. Glycolysis regulator PFKP induces human melanoma cell proliferation and tumor growth. Clinical & translational oncology : official publication of the Federation of Spanish Oncology Societies and of the National Cancer Institute of Mexico 2023, 25, 2183-2191. [CrossRef]
- Linge, A.; Kennedy, S.; O’Flynn, D.; Beatty, S.; Moriarty, P.; Henry, M.; Clynes, M.; Larkin, A.; Meleady, P. Differential expression of fourteen proteins between uveal melanoma from patients who subsequently developed distant metastases versus those who did Not. Investigative ophthalmology & visual science 2012, 53, 4634-4643. [CrossRef]
- Ramasamy, P.; Murphy, C.C.; Clynes, M.; Horgan, N.; Moriarty, P.; Tiernan, D.; Beatty, S.; Kennedy, S.; Meleady, P. Proteomics in uveal melanoma. Experimental eye research 2014, 118, 1-12. [CrossRef]
- Guo, X.; Yu, X.; Li, F.; Xia, Q.; Ren, H.; Chen, Z.; Xing, Y. Identification of Survival-Related Metabolic Genes and a Novel Gene Signature Predicting the Overall Survival for Patients with Uveal Melanoma. Ophthalmic research 2022, 65, 516-528. [CrossRef]
- Bradshaw, G.; Haupt, L.M.; Aquino, E.M.; Lea, R.A.; Sutherland, H.G.; Griffiths, L.R. Single Nucleotide Polymorphisms in MIR143 Contribute to Protection Against Non-Hodgkin Lymphoma (NHL) in Caucasian Populations. Genes 2019, 10. [CrossRef]
- Pudova, E.A.; Kudryavtseva, A.V.; Fedorova, M.S.; Zaretsky, A.R.; Shcherbo, D.S.; Lukyanova, E.N.; Popov, A.Y.; Sadritdinova, A.F.; Abramov, I.S.; Kharitonov, S.L.; et al. HK3 overexpression associated with epithelial-mesenchymal transition in colorectal cancer. BMC genomics 2018, 19, 113. [CrossRef]
- Xu, W.; Liu, W.R.; Xu, Y.; Tian, X.; Anwaier, A.; Su, J.Q.; Zhu, W.K.; Shi, G.H.; Wei, G.M.; Huang, Y.P.; et al. Hexokinase 3 dysfunction promotes tumorigenesis and immune escape by upregulating monocyte/macrophage infiltration into the clear cell renal cell carcinoma microenvironment. International journal of biological sciences 2021, 17, 2205-2222. [CrossRef]
- Harami-Papp, H.; Pongor, L.S.; Munkácsy, G.; Horváth, G.; Nagy Á, M.; Ambrus, A.; Hauser, P.; Szabó, A.; Tretter, L.; Győrffy, B. TP53 mutation hits energy metabolism and increases glycolysis in breast cancer. Oncotarget 2016, 7, 67183-67195. [CrossRef]
- Yang, Y.; Fu, X.; Liu, R.; Yan, L.; Yang, Y. Exploring the prognostic value of HK3 and its association with immune infiltration in glioblastoma multiforme. Frontiers in genetics 2022, 13, 1033572. [CrossRef]
- Wu, X.; Mi, T.; Jin, L.; Ren, C.; Wang, J.; Zhang, Z.; Liu, J.; Wang, Z.; Guo, P.; He, D. Dual roles of HK3 in regulating the network between tumor cells and tumor-associated macrophages in neuroblastoma. Cancer immunology, immunotherapy : CII 2024, 73, 122. [CrossRef]
- Podhajcer, O.L.; Bover, L.; Bravo, A.I.; Ledda, M.F.; Kairiyama, C.; Calb, I.; Guerra, L.; Capony, F.; Mordoh, J. Expression of cathepsin D in primary and metastatic human melanoma and dysplastic nevi. The Journal of investigative dermatology 1995, 104, 340-344. [CrossRef]
- Bassalyk, L.S.; Tsanev, P.E.; Parshikova, S.M.; Demidov, L.V. [Lysosomal proteolytic enzymes in the processes of melanoma invasion and metastasis]. Voprosy onkologii 1992, 38, 418-425.
- Kos, J.; Stabuc, B.; Schweiger, A.; Krasovec, M.; Cimerman, N.; Kopitar-Jerala, N.; Vrhovec, I. Cathepsins B, H, and L and their inhibitors stefin A and cystatin C in sera of melanoma patients. Clinical cancer research : an official journal of the American Association for Cancer Research 1997, 3, 1815-1822.
- Kageshita, T.; Yoshii, A.; Kimura, T.; Maruo, K.; Ono, T.; Himeno, M.; Nishimura, Y. Biochemical and immunohistochemical analysis of cathepsins B, H, L and D in human melanocytic tumours. Archives of dermatological research.. 1995, 287, 266-272. [CrossRef]
- Bartenjev, I.; Rudolf, Z.; Stabuc, B.; Vrhovec, I.; Perkovic, T.; Kansky, A. Cathepsin D expression in early cutaneous malignant melanoma. International journal of dermatology 2000, 39, 599-602. [CrossRef]
- Fröhlich, E.; Schlagenhauff, B.; Möhrle, M.; Weber, E.; Klessen, C.; Rassner, G. Activity, expression, and transcription rate of the cathepsins B, D, H, and L in cutaneous malignant melanoma. Cancer 2001, 91, 972-982.
- Crabb, J.W.; Hu, B.; Crabb, J.S.; Triozzi, P.; Saunthararajah, Y.; Tubbs, R.; Singh, A.D. iTRAQ Quantitative Proteomic Comparison of Metastatic and Non-Metastatic Uveal Melanoma Tumors. PloS one 2015, 10, e0135543. [CrossRef]
- Zuidervaart, W.; Hensbergen, P.J.; Wong, M.C.; Deelder, A.M.; Tensen, C.P.; Jager, M.J.; Gruis, N.A. Proteomic analysis of uveal melanoma reveals novel potential markers involved in tumor progression. Investigative ophthalmology & visual science 2006, 47, 786-793. [CrossRef]
- Zhang, G.P.; Yue, X.; Li, S.Q. Cathepsin C Interacts with TNF-α/p38 MAPK Signaling Pathway to Promote Proliferation and Metastasis in Hepatocellular Carcinoma. Cancer research and treatment 2020, 52, 10-23. [CrossRef]
- Cheng, X.; Ren, Z.; Liu, Z.; Sun, X.; Qian, R.; Cao, C.; Liu, B.; Wang, J.; Wang, H.; Guo, Y.; et al. Cysteine cathepsin C: a novel potential biomarker for the diagnosis and prognosis of glioma. Cancer cell international 2022, 22, 53. [CrossRef]
- Grilc, S.; Kreft, M.; Luzar, B.; Gabrijel, M.; Bartenjev, M.S.; Zorec, R.; Bartenjev, I. Histological Skin Remodeling Following Autologous Fibroblast Application. Acta dermatovenerologica Croatica : ADC 2022, 30, 1-7.
- Zorina, A.; Zorin, V.; Isaev, A.; Kudlay, D.; Vasileva, M.; Kopnin, P. Dermal Fibroblasts as the Main Target for Skin Anti-Age Correction Using a Combination of Regenerative Medicine Methods. Current issues in molecular biology 2023, 45, 3829-3847. [CrossRef]
- Lam Yi, H.; Than, H.; Sng, C.; Cheong, M.A.; Chuah, C.; Xiang, W. Lysosome Inhibition by Mefloquine Preferentially Enhances the Cytotoxic Effects of Tyrosine Kinase Inhibitors in Blast Phase Chronic Myeloid Leukemia. Translational oncology 2019, 12, 1221-1228. [CrossRef]
- Sukhai, M.A.; Prabha, S.; Hurren, R.; Rutledge, A.C.; Lee, A.Y.; Sriskanthadevan, S.; Sun, H.; Wang, X.; Skrtic, M.; Seneviratne, A.; et al. Lysosomal disruption preferentially targets acute myeloid leukemia cells and progenitors. The Journal of clinical investigation 2013, 123, 315-328. [CrossRef]
- Ostenfeld, M.S.; Fehrenbacher, N.; Høyer-Hansen, M.; Thomsen, C.; Farkas, T.; Jäättelä, M. Effective tumor cell death by sigma-2 receptor ligand siramesine involves lysosomal leakage and oxidative stress. Cancer research 2005, 65, 8975-8983. [CrossRef]
- Chen, W.; Guéron, M. The inhibition of bovine heart hexokinase by 2-deoxy-D-glucose-6-phosphate: characterization by 31P NMR and metabolic implications. Biochimie 1992, 74, 867-873. [CrossRef]
- Wick, A.N.; Drury, D.R.; Nakada, H.I.; Wolfe, J.B. Localization of the primary metabolic block produced by 2-deoxyglucose. The Journal of biological chemistry 1957, 224, 963-969.
Figure 1.
2DG and LLOMe Synergistically Reduce Viability of A375 Melanoma Cells. A375 cells were treated with 2DG (1.25-10 mM) and/or LLOMe (0.5-2 mM) for 24 h (A, B) or 48 h (D, E) and cell viability was assessed using the crystal violet assay (A, D). (C) A375 cells were treated with 5 mM 2DG and/or 1 mM LLOMe for 24 h and cell morphology was examined by phase-contrast microscopy and representative micrographs from three independent experiments are shown. (A, D) Data are presented as mean ± S.D. of triplicates from a representative experiment out of three independent repeats (*p < 0.05 vs. untreated control; #p < 0.05 vs. untreated control and single treatments with 2DG or LLOMe). (B, E) α index values were calculated from viability data in three independent experiments and are shown as mean ± S.D. (*p < 0.05 denotes α > 1, indicating synergism).
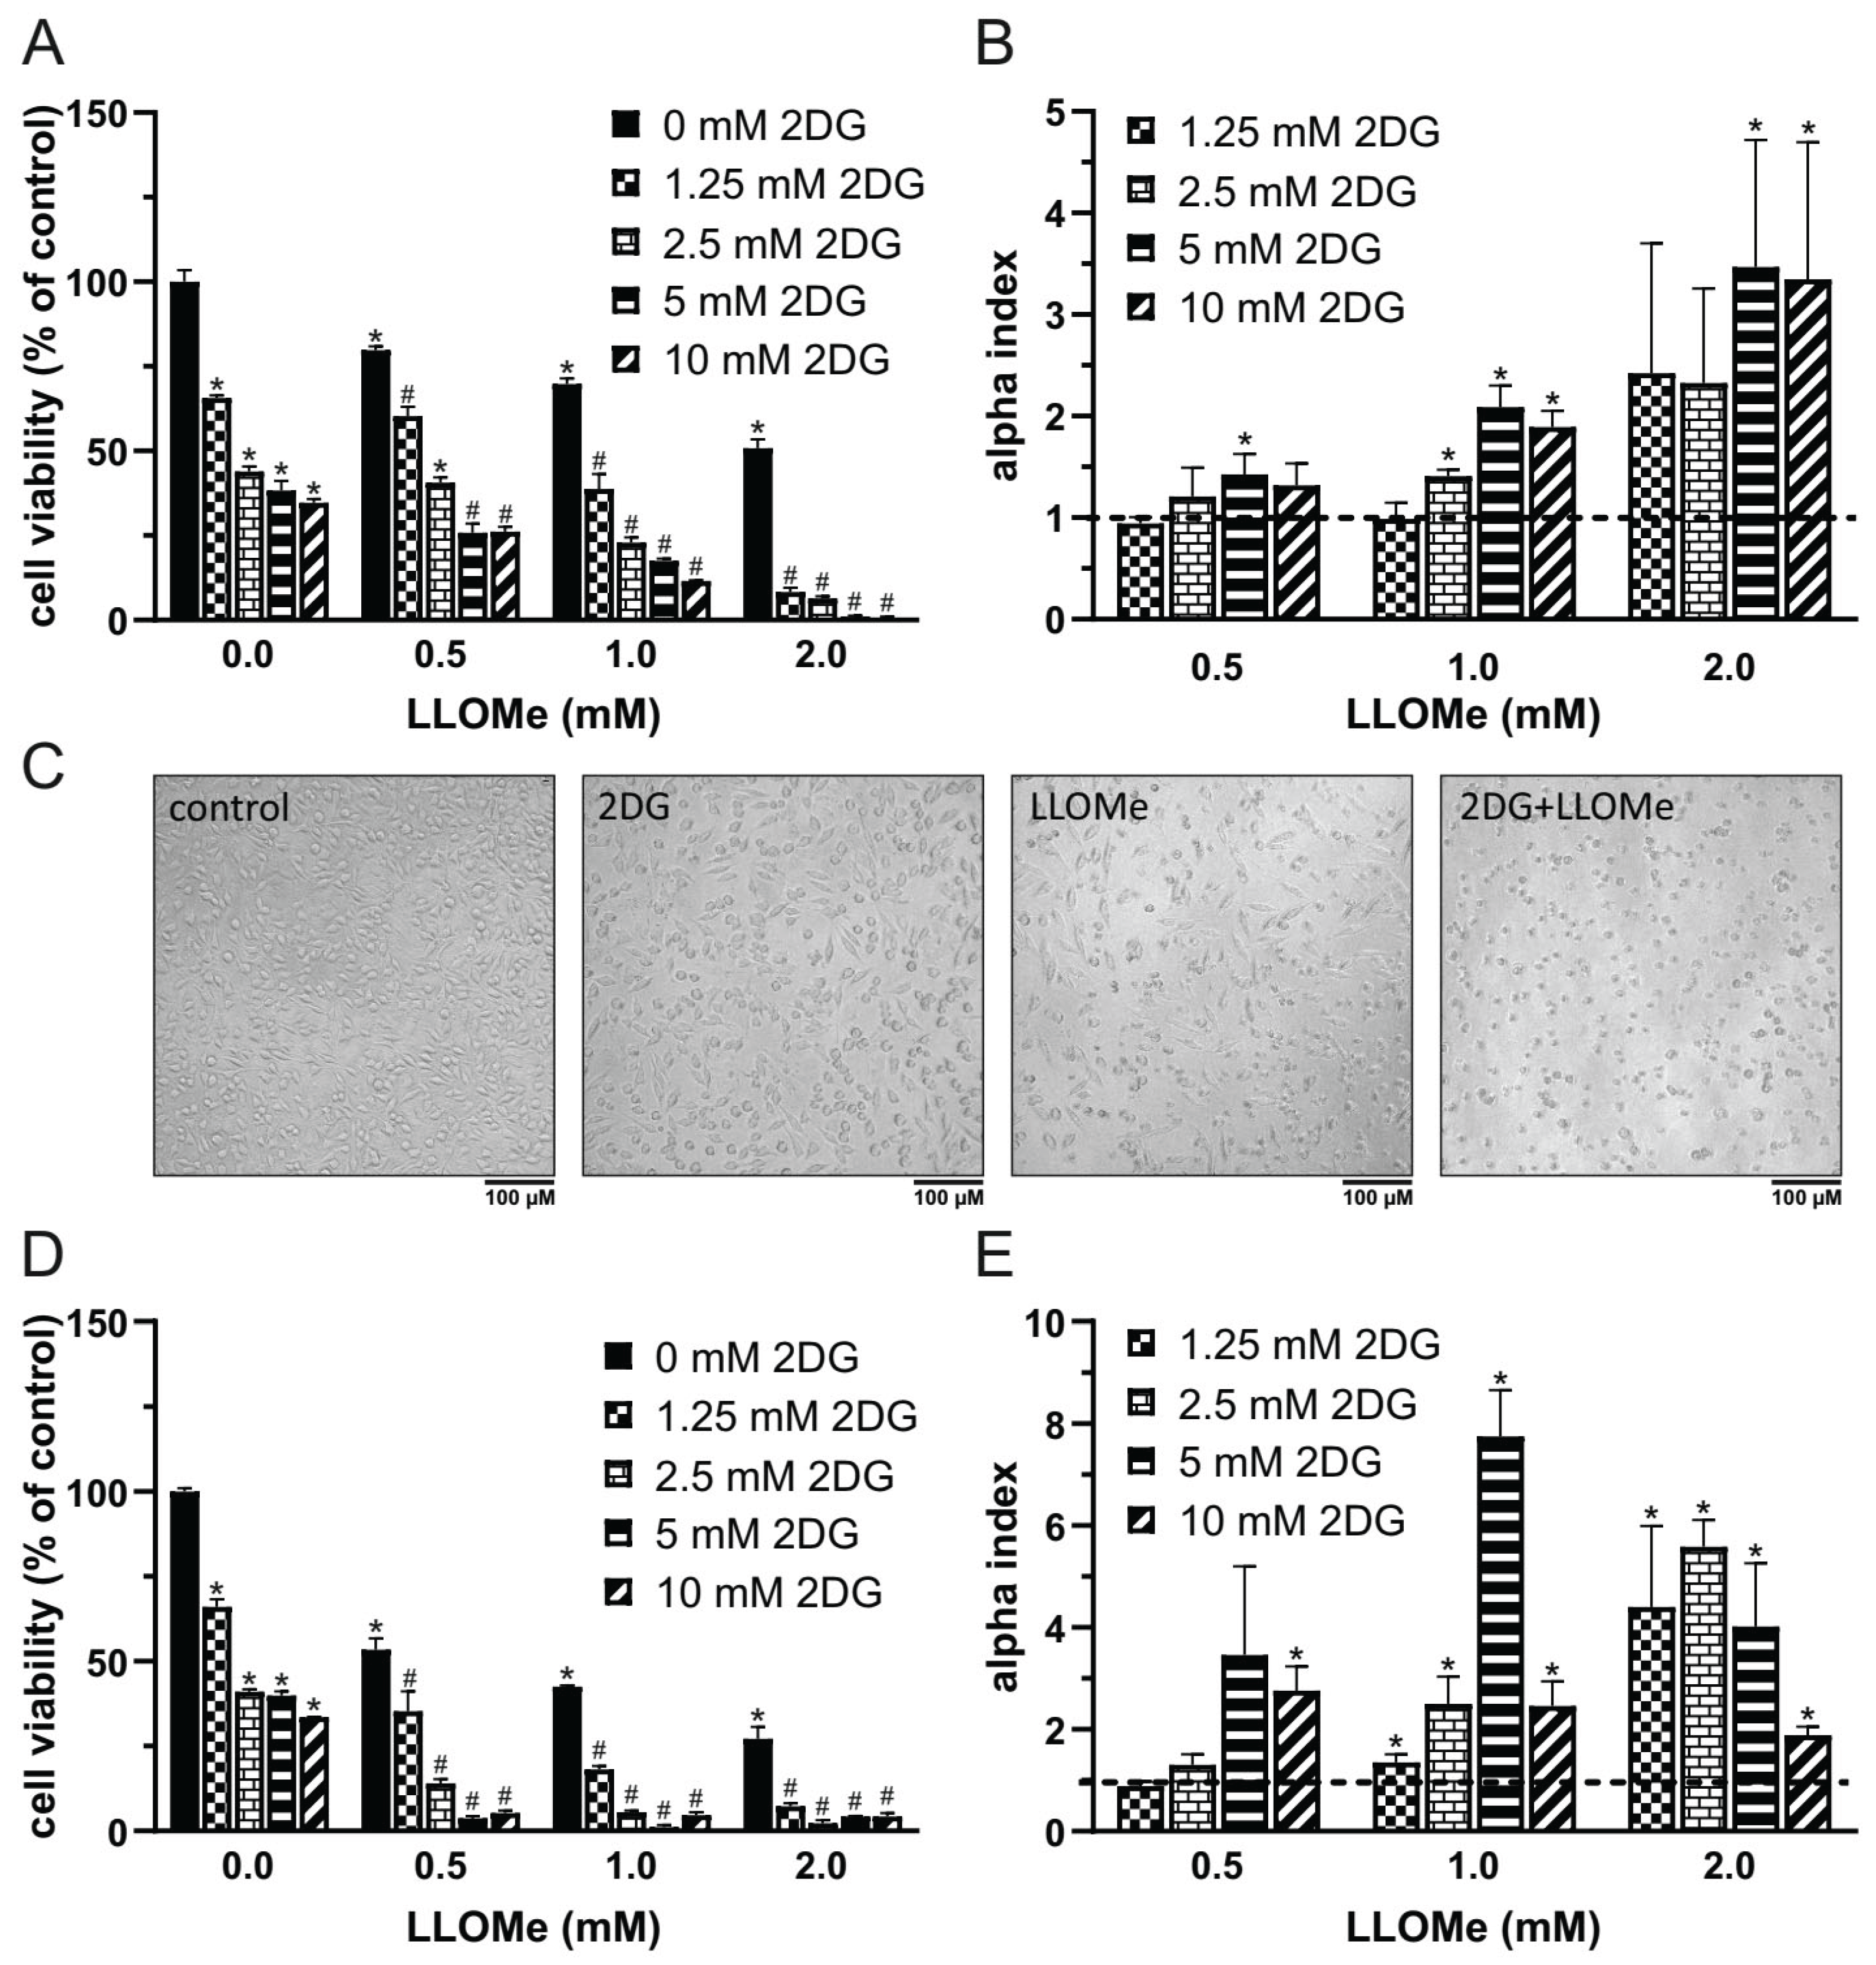
Figure 2.
2DG+LLOMe Induces Mixed Apoptotic and Necrotic Death in Melanoma Cells. A375 cells were treated with 5 mM 2DG and/or 1 mM LLOMe in the presence or absence of Ferrostatin-1 (FERRO; A), Necrostatin-1 (NECRO; B), Wortmannin (WORT; C), or Q-VD-OPh (QVD; H). (D) A375 cells were transfected with control or ATG5-targeting siRNA (ATG5⁻) prior to treatment with 5 mM 2DG and/or 1 mM LLOMe (insets show immunoblot verification of ATG5 knockdown). After 24 h cell viability was determined by crystal violet (A-D, H), while caspase activation was assessed by fluorescence microplate reader (F). Phosphatidylserine externalization (Annexin V⁺ cells), cell membrane damage (7-AAD⁺ cells) (E), and DNA fragmentation (sub-G₁ compartment) (G) were assessed by flow cytometry after 36 h and 48 h, respectively. The representative dot plots (E) and histograms (G) are shown. The data are presented as the mean ± SD values of triplicates from a representative of three independent experiments (A-D, F, and H) (*p < 0.05 vs. untreated control; #p < 0.05 vs. untreated control and single treatments with 2DG or LLOMe; &p < 0.05 vs. same treatments without QVD).
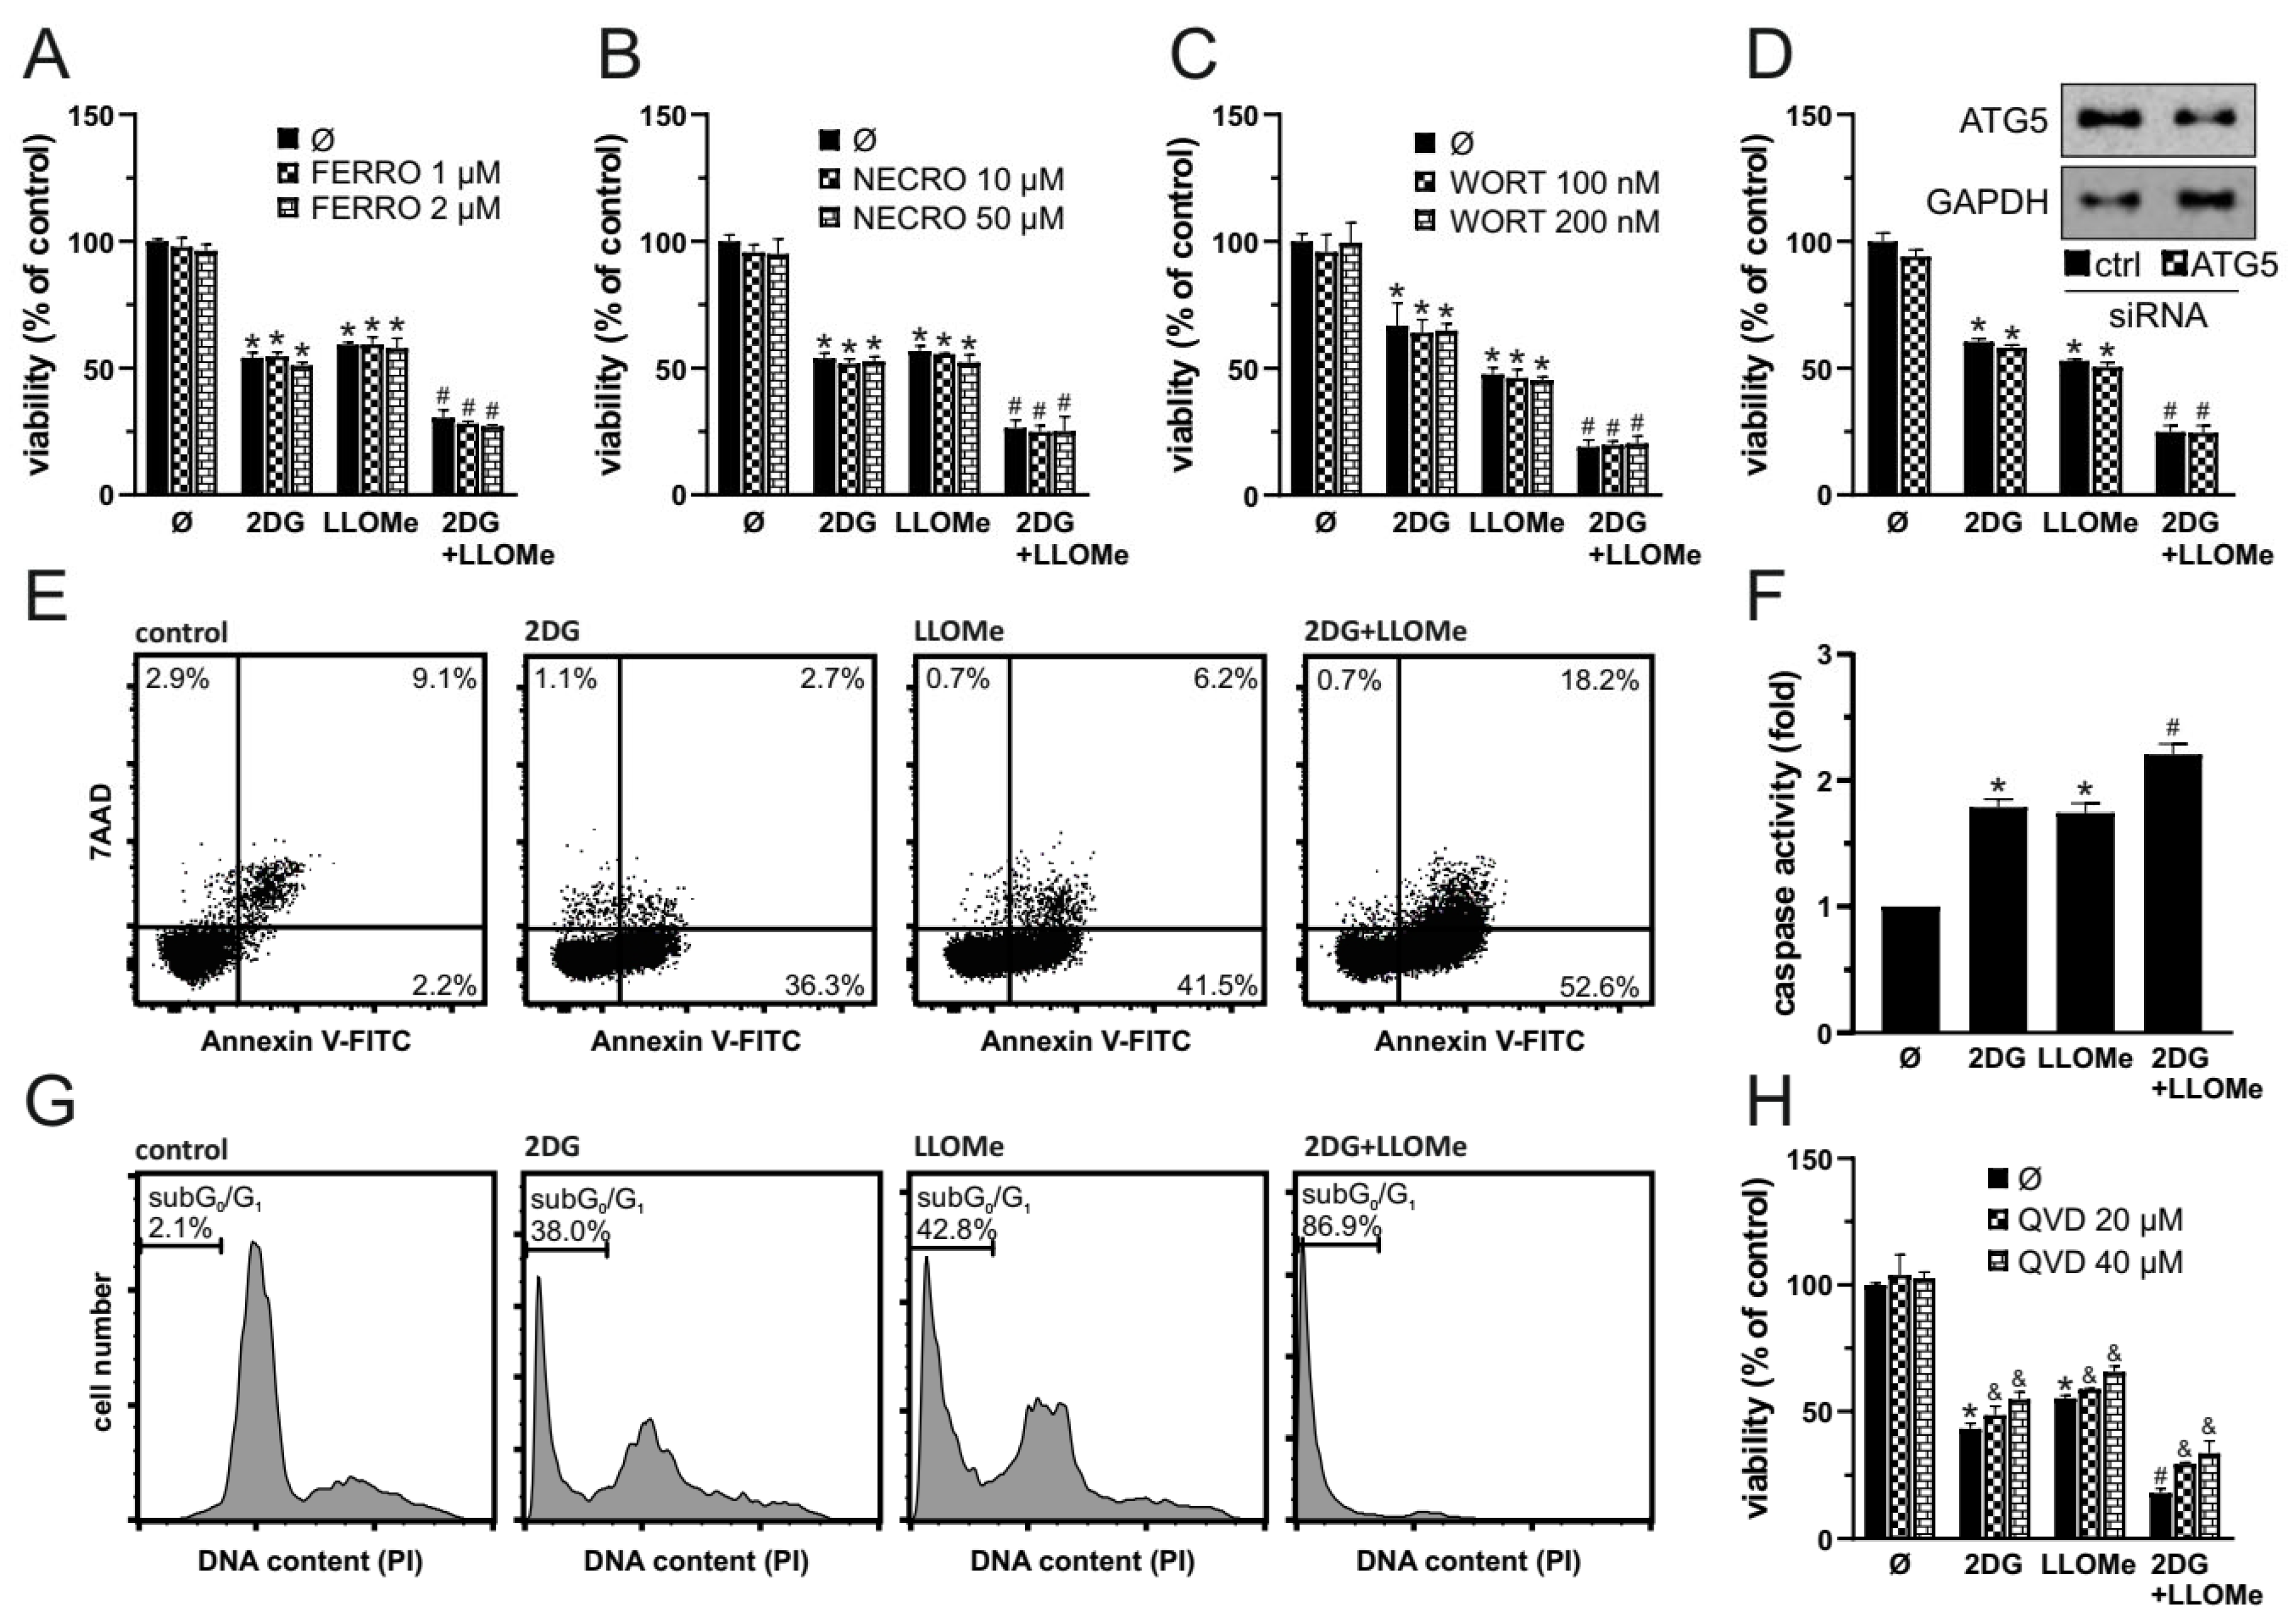
Figure 3.
Antimelanoma Effect of 2DG+LLOMe Is Mediated by Lysosomal Destabilization. A375 cells were treated with 5 mM 2DG and/or 1 mM LLOMe in the absence (A-D) or presence of bafilomycin A1 (BAF; E), MG132 (F), pepstatin A (PEP; G), or BAPTA-AM (BAPTA; H). After 30 min of treatment, cell morphology was examined by phase-contrast microscopy (A), lysosomal acidification in LysoTracker Red-stained cells by flow cytometry (B), and in acridine orange (AO)-stained cells by fluorescence microscopy (C) or flow cytometry (D). The representative micrographs (A, C) and histograms (B, D) from three independent experiments are shown. After 24 h cell viability was determined by crystal violet (E-H). The data are presented as the mean ± SD values of triplicates from a representative of three independent experiments (E-H) (*p < 0.05 vs. untreated control; #p < 0.05 vs. untreated control and single treatments with 2DG or LLOMe; &p < 0.05 vs. same treatments without BAF (E), MG132 (F), or BAPTA (H)).
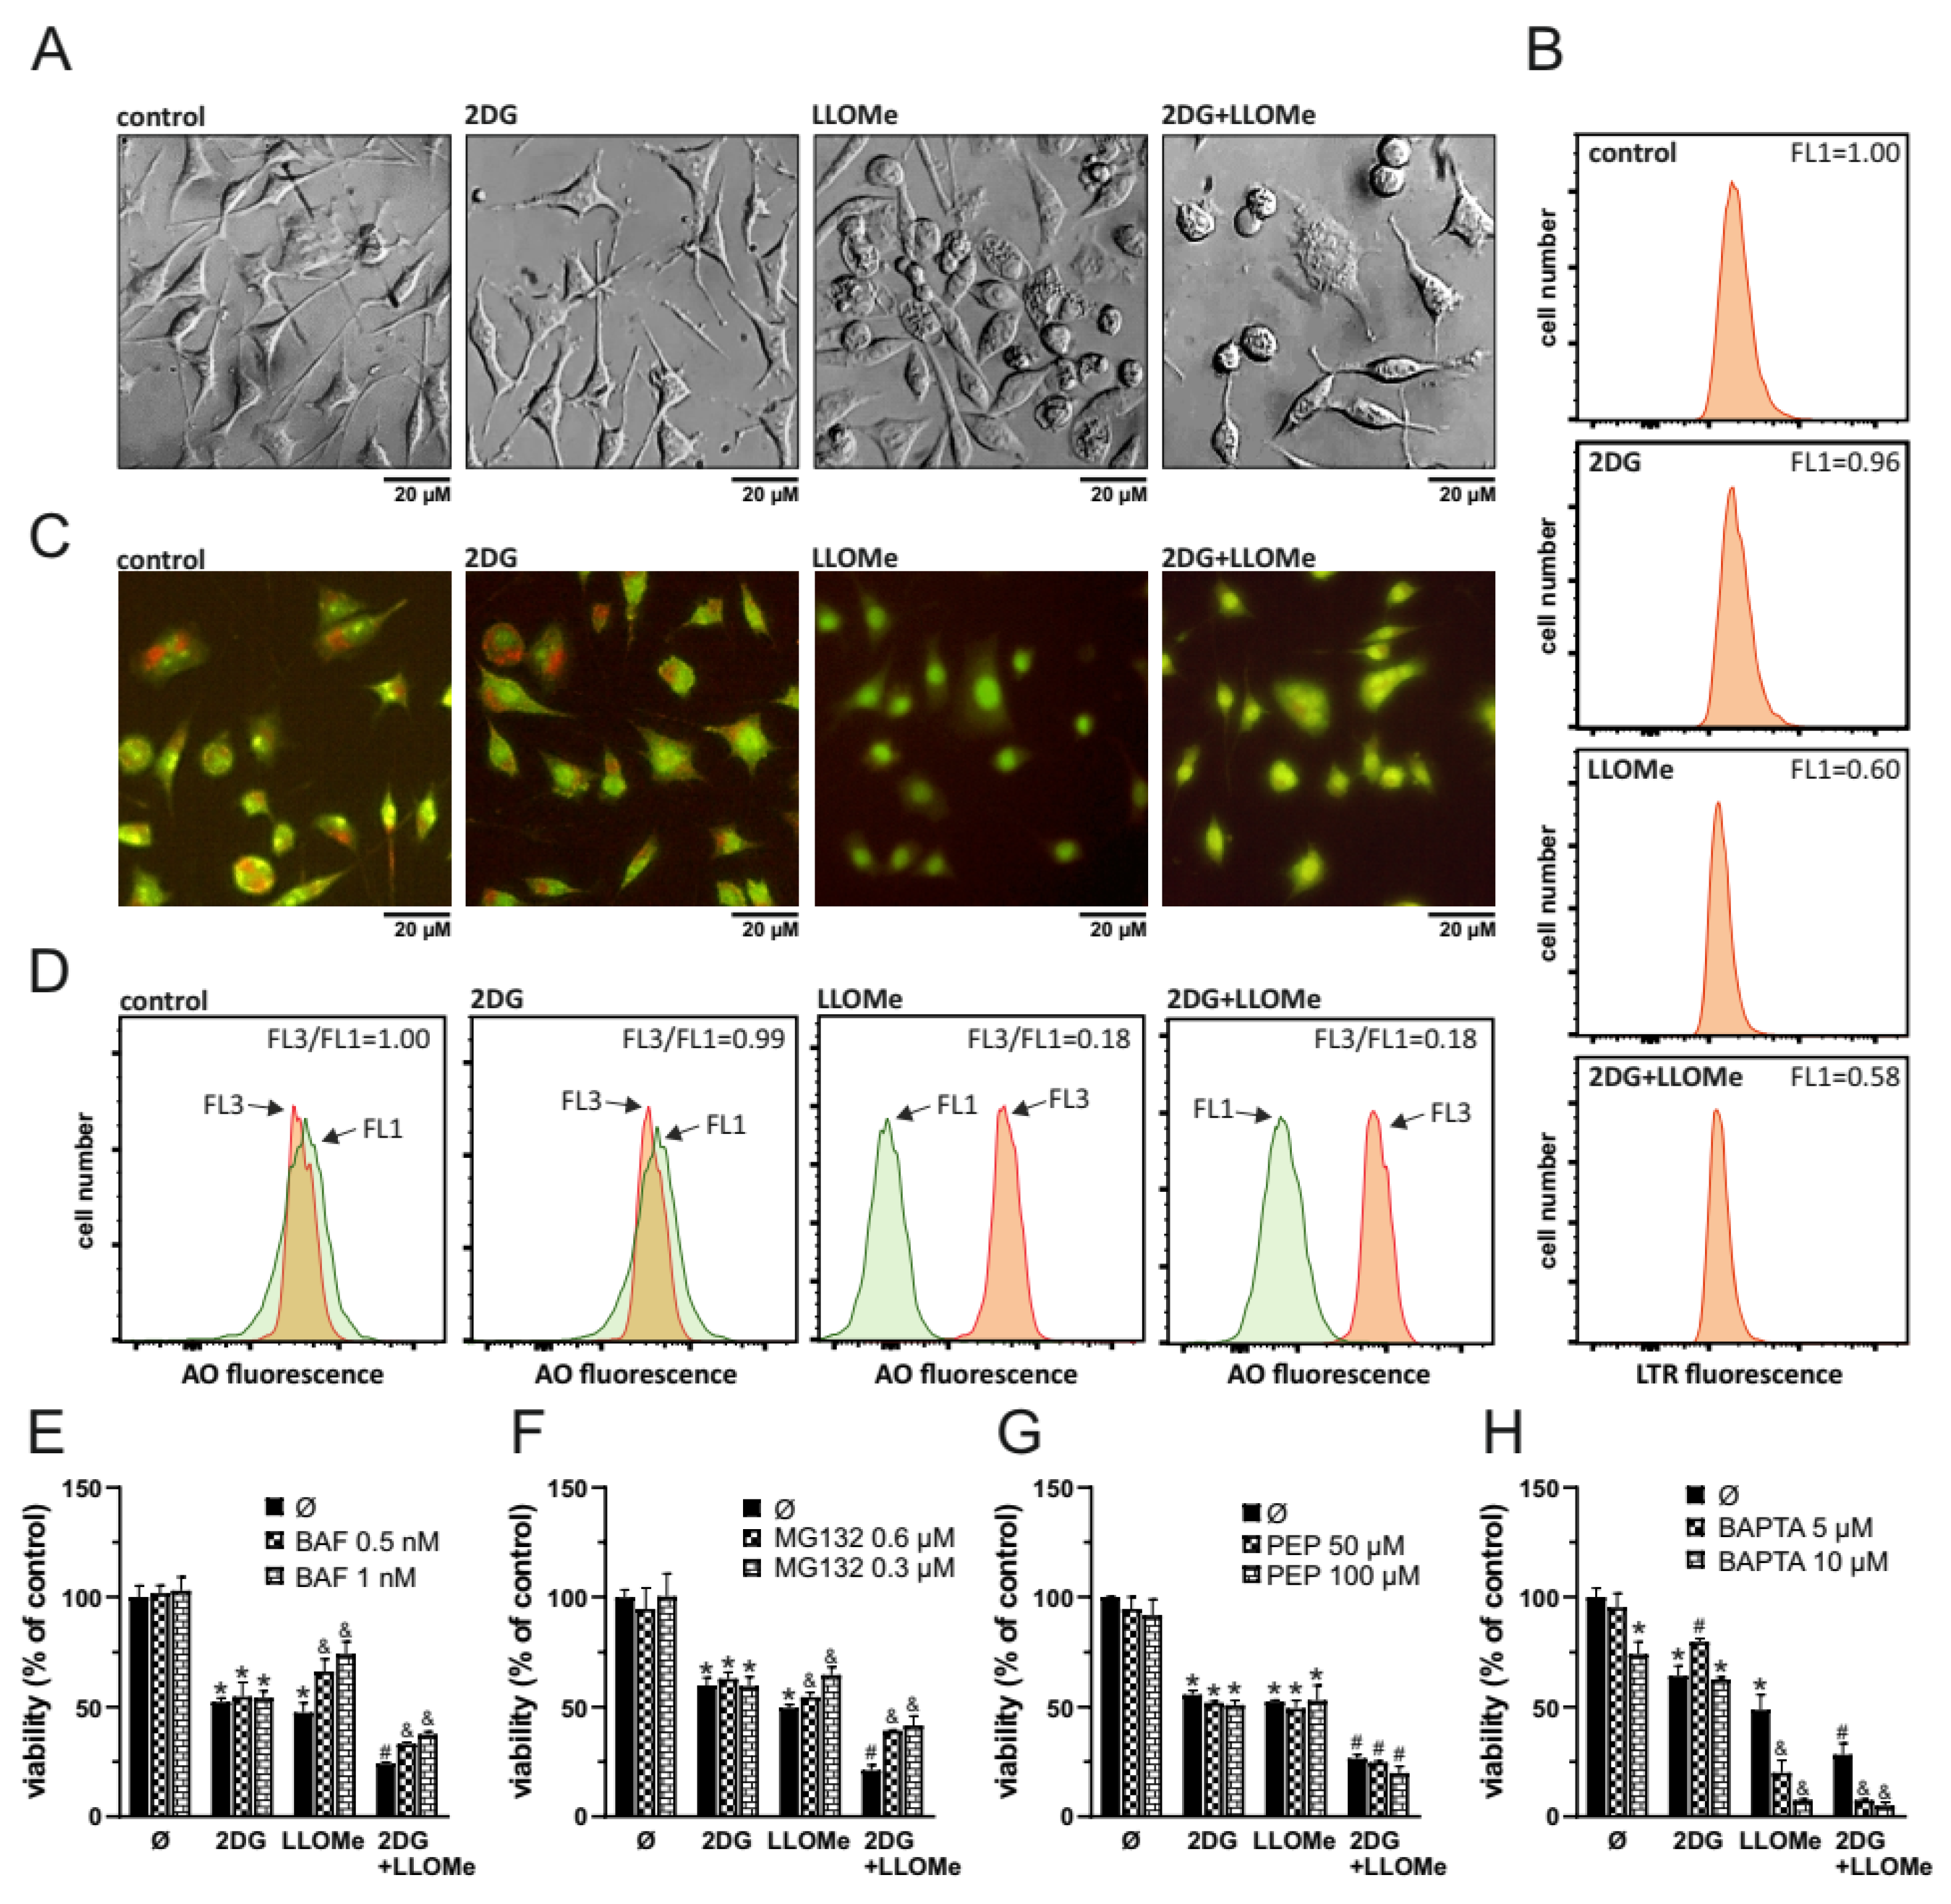
Figure 4.
A375 cells were treated with 5 mM 2DG and/or 1 mM LLOMe (A-C) in the presence or absence of 1 nM bafilomycin A1 (BAF) and 0.6 mM MG132 (A, B), or N-acetylcysteine (NAC; 5 mM) and superoxide dismutase (SOD; 5 µM). After 2 h MMP loss in JC-1-stained cells (A) or mitochondrial O₂•⁻ production in MitoSOX-stained cells was assessed by fluorescence microplate reader, while after 24 h cell viability was determined by crystal violet (C). The data are presented as the mean ± SD values of triplicates from a representative of three independent experiments (*p < 0.05 vs. untreated control; #p <0.05 vs. untreated control and single treatments with 2DG or LLOMe; &p < 0.05 vs. same treatments without BAF, MG132, NAC, or SOD.
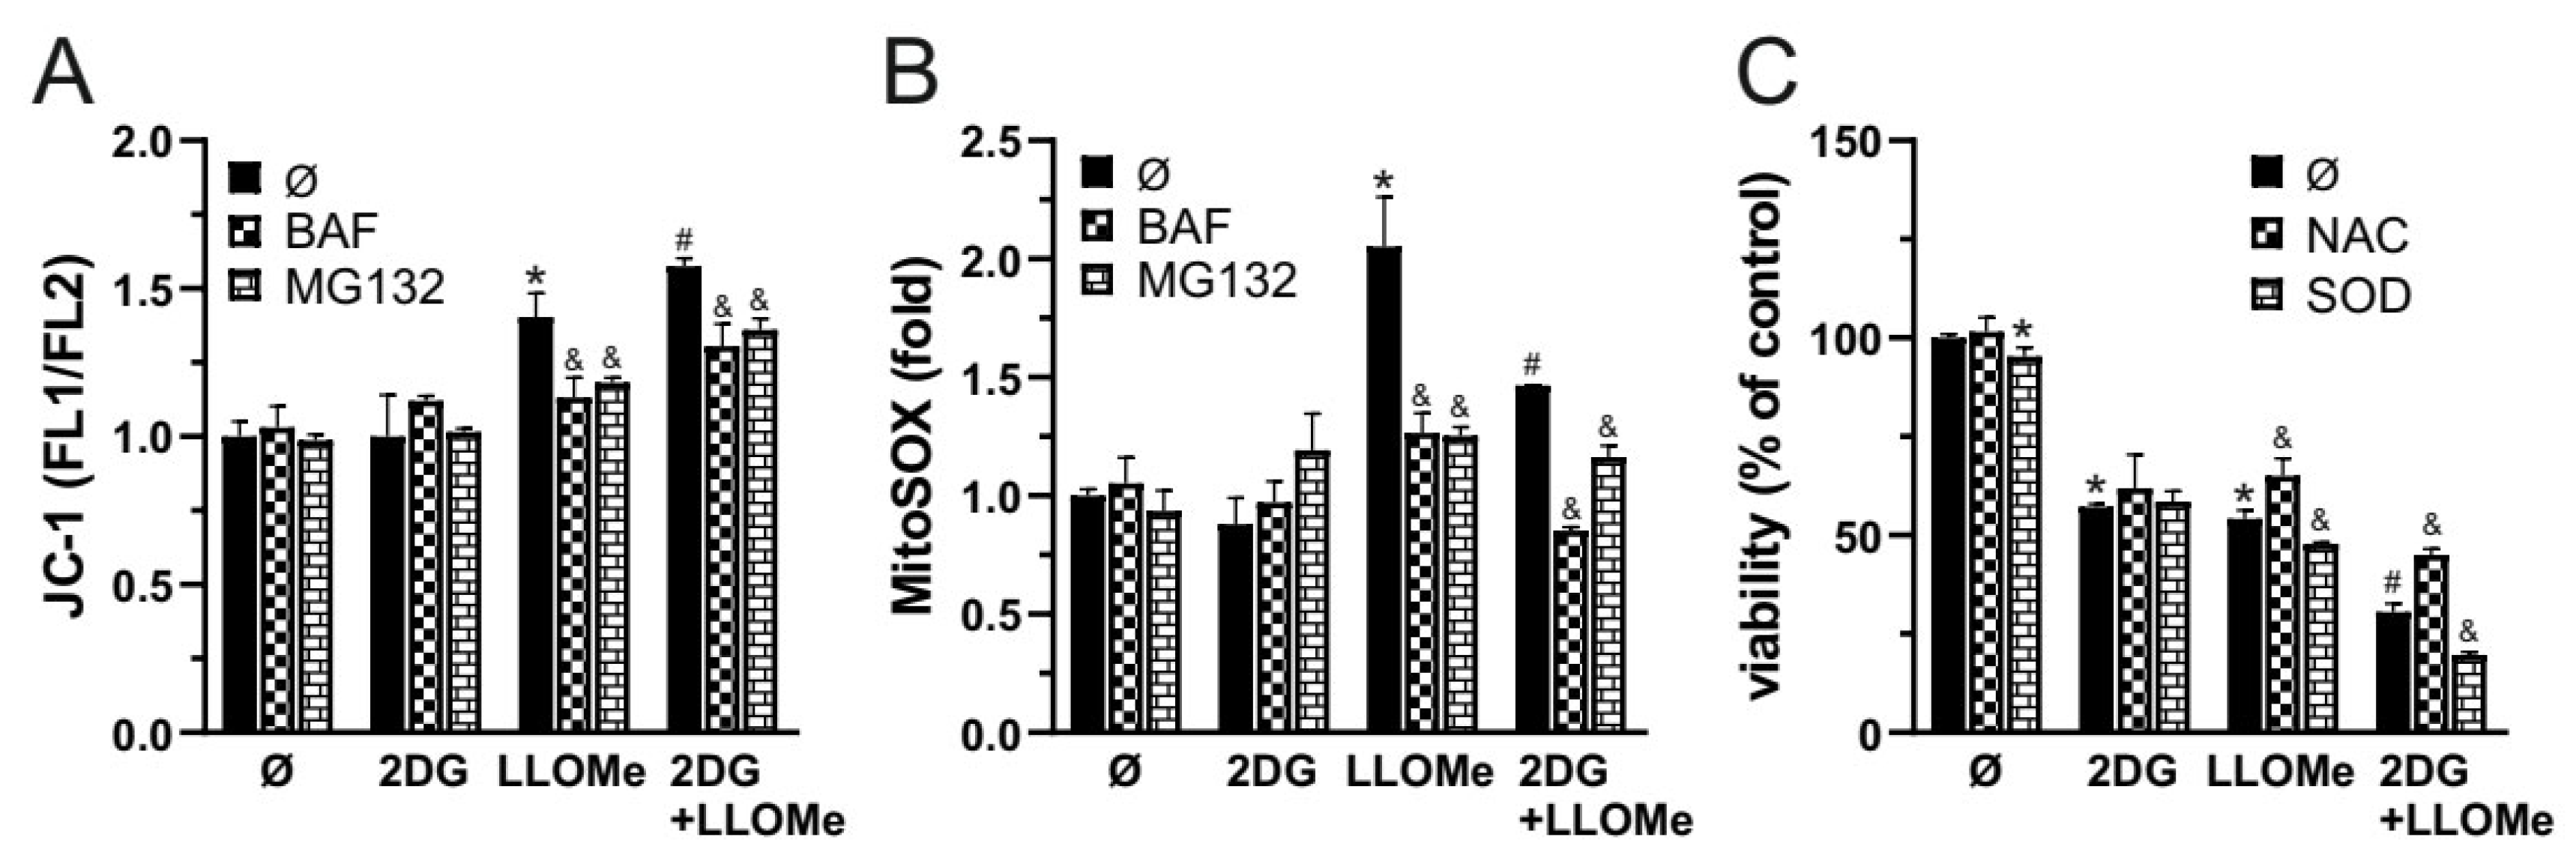
Figure 5.
Combined Glycolytic and Mitochondrial Inhibition by 2DG and LLOMe Triggers Energetic Collapse and Loss of Viability. (A-C) A375 cells were treated with 5 mM 2DG and/or 1 mM LLOMe in the absence (A, B) or the presence of 200 µM L-carnitine (CARN) or 1 mM succinate (SUCC) (C). (A) Oxygen consumption rate (OCR) and extracellular acidification rate (ECAR) were measured using fluorescence-based assays between 2 and 3 h post-treatment. (B) Intracellular ATP levels were measured at the indicated time points using a bioluminescence assay. (D, E) A375 cells were treated with 1 mM of LLOMe in the presence or absence of 40 mM dichloroacetate (DCA; D) or 1 mM shikonin (SHI; E). (F) A375 cells were transfected with control or HK2-targeting siRNA prior to treatment with 1 mM LLOMe (insets show immunoblot verification of HK2 knockdown). (C-F) After 24 h cell viability was determined by crystal violet. (A-F) The data are presented as the mean ± SD values of triplicates from a representative of three independent experiments (*p < 0.05 vs. untreated control; #p < 0.05 vs. untreated control, and single treatments with 2DG, SHI, DCA, or LLOMe; &p < 0.05 vs. same treatments without CARN or SUCC; $p < 0.05 vs. control siRNA).
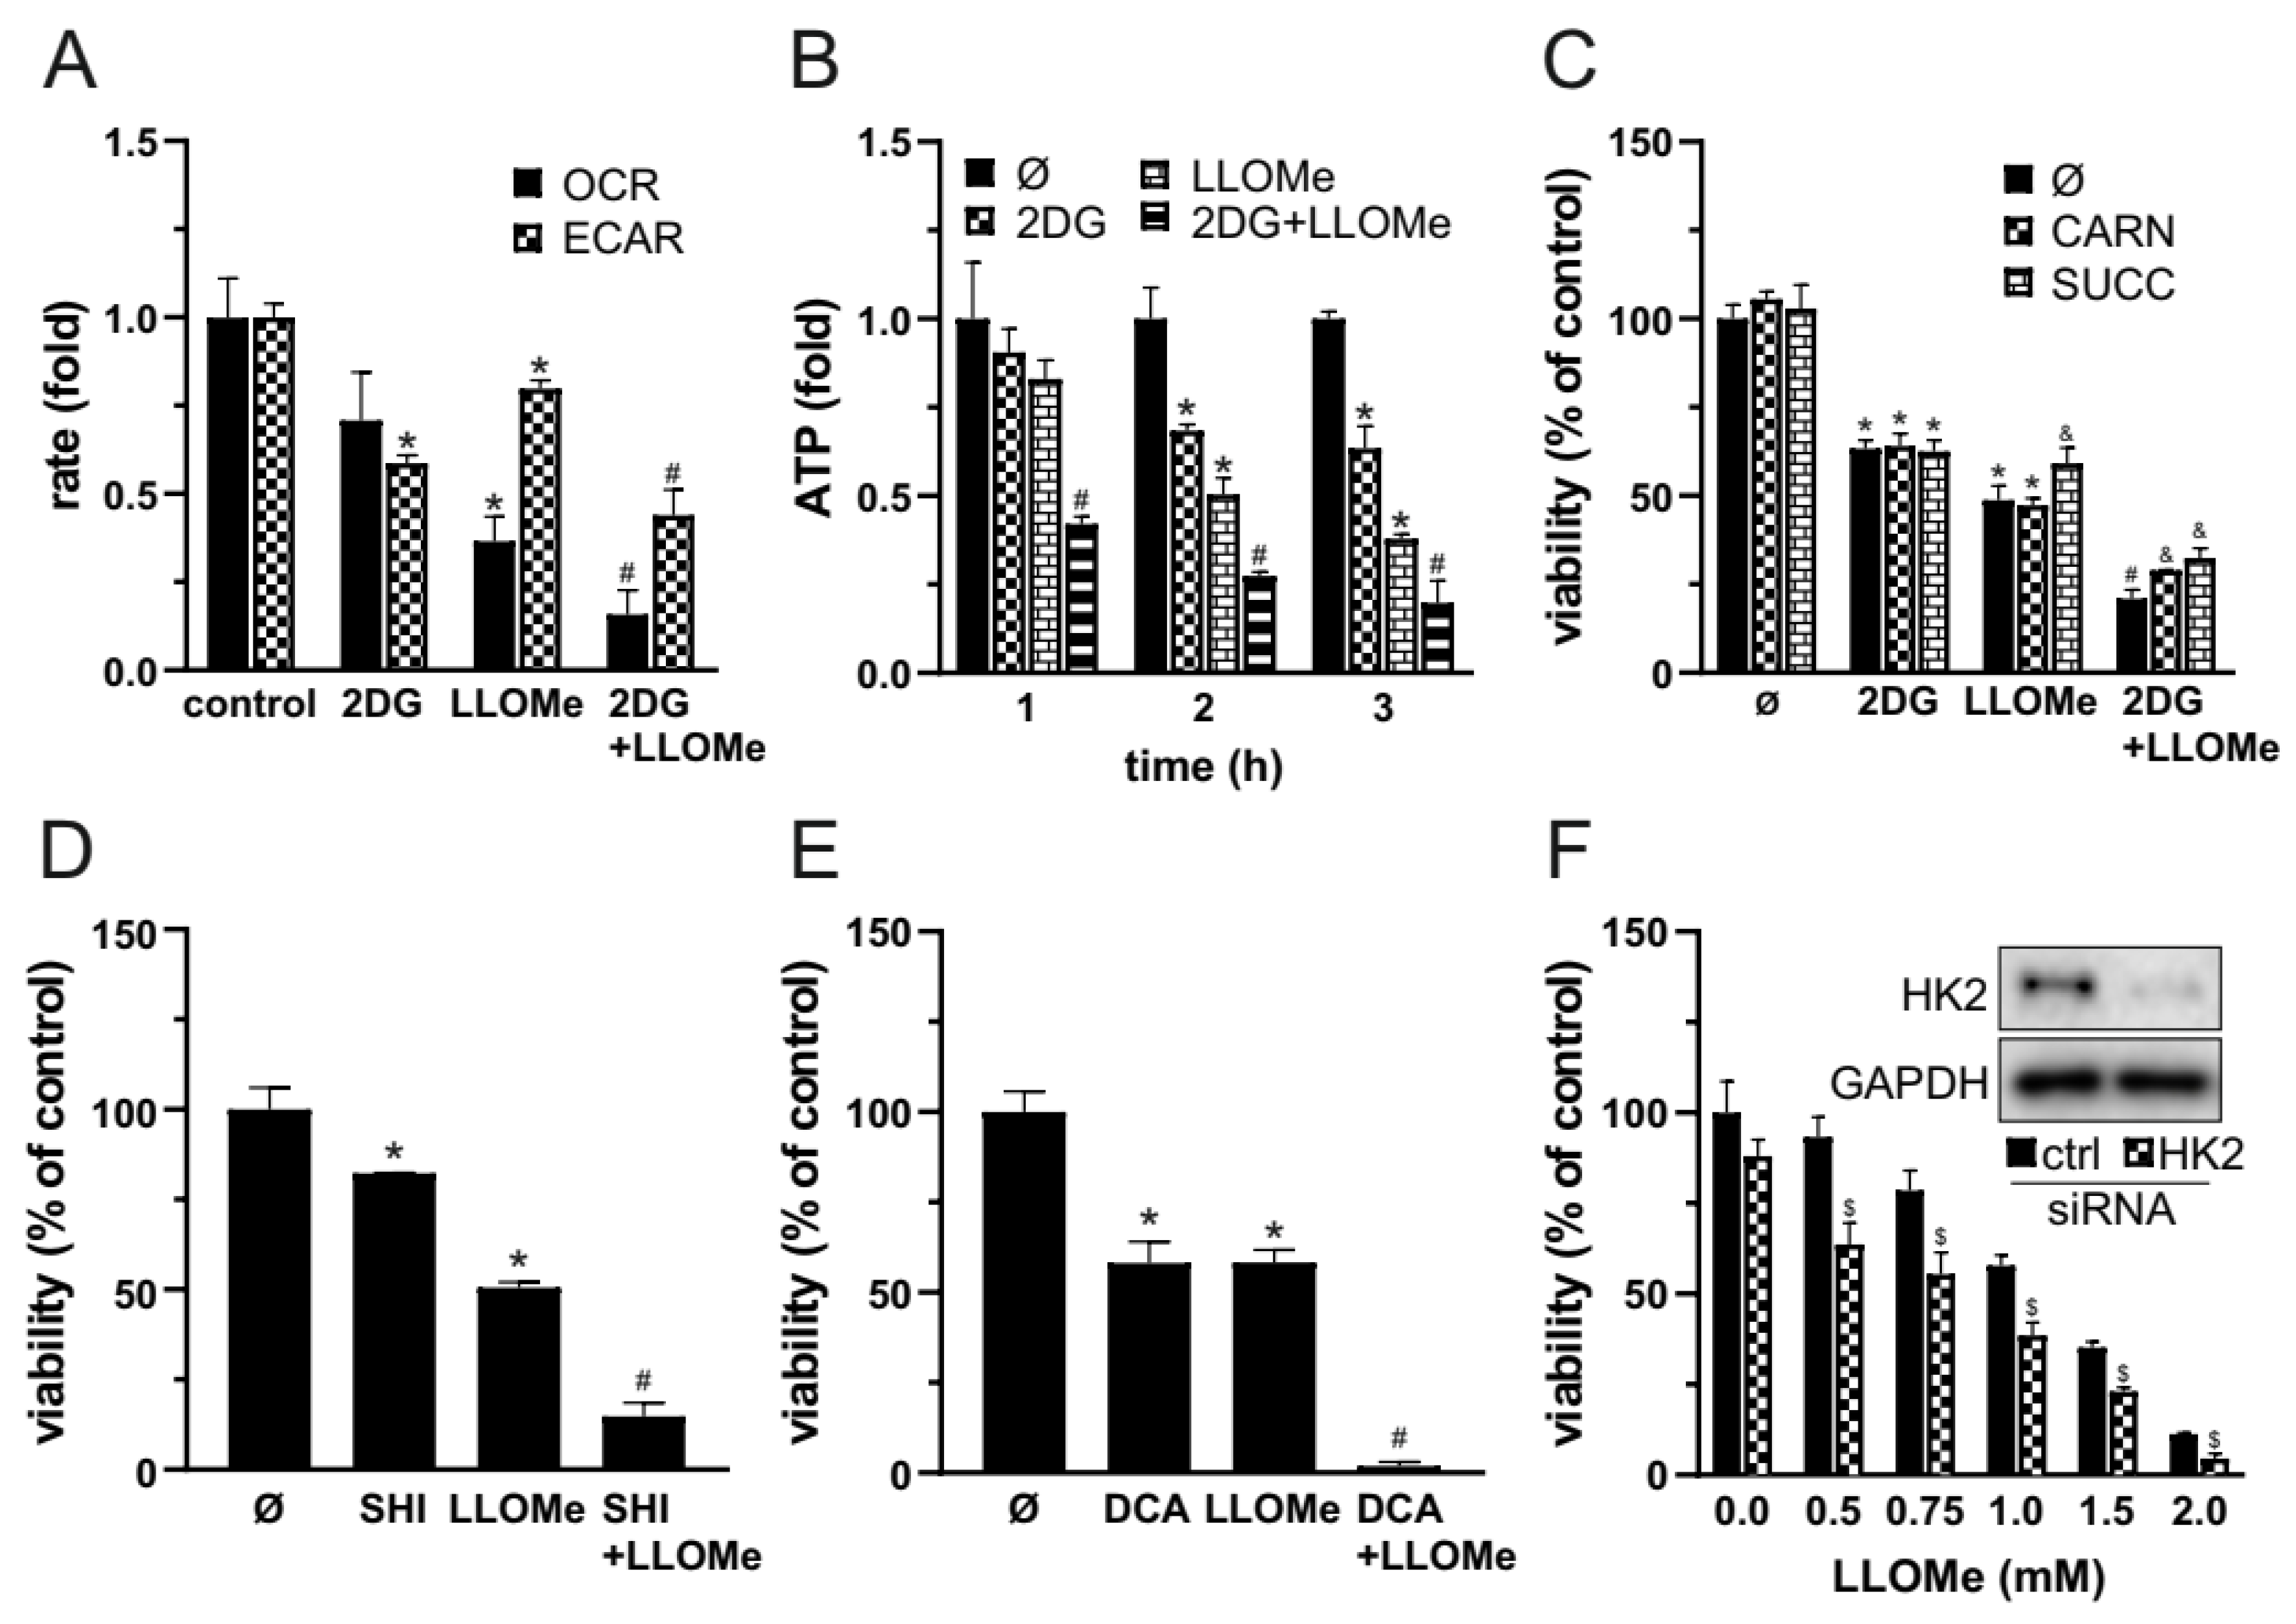
Figure 6.
In Contrast to Mefloquine and Siramesine, LLOMe Exhibits Non-Selective Toxicity. (A-C) A375 and NHDF cells were treated with 5 mM 2DG in the presence or absence of 1 mM LLOMe (A), 20 µM mefloquine (MEF; B), or 10 µM siramesine (SIR; C). After 24 h cell viability was determined by crystal violet. The data are presented as the mean ± SD values of triplicates from a representative of three independent experiments (*p < 0.05 vs. A375 under the same treatment).
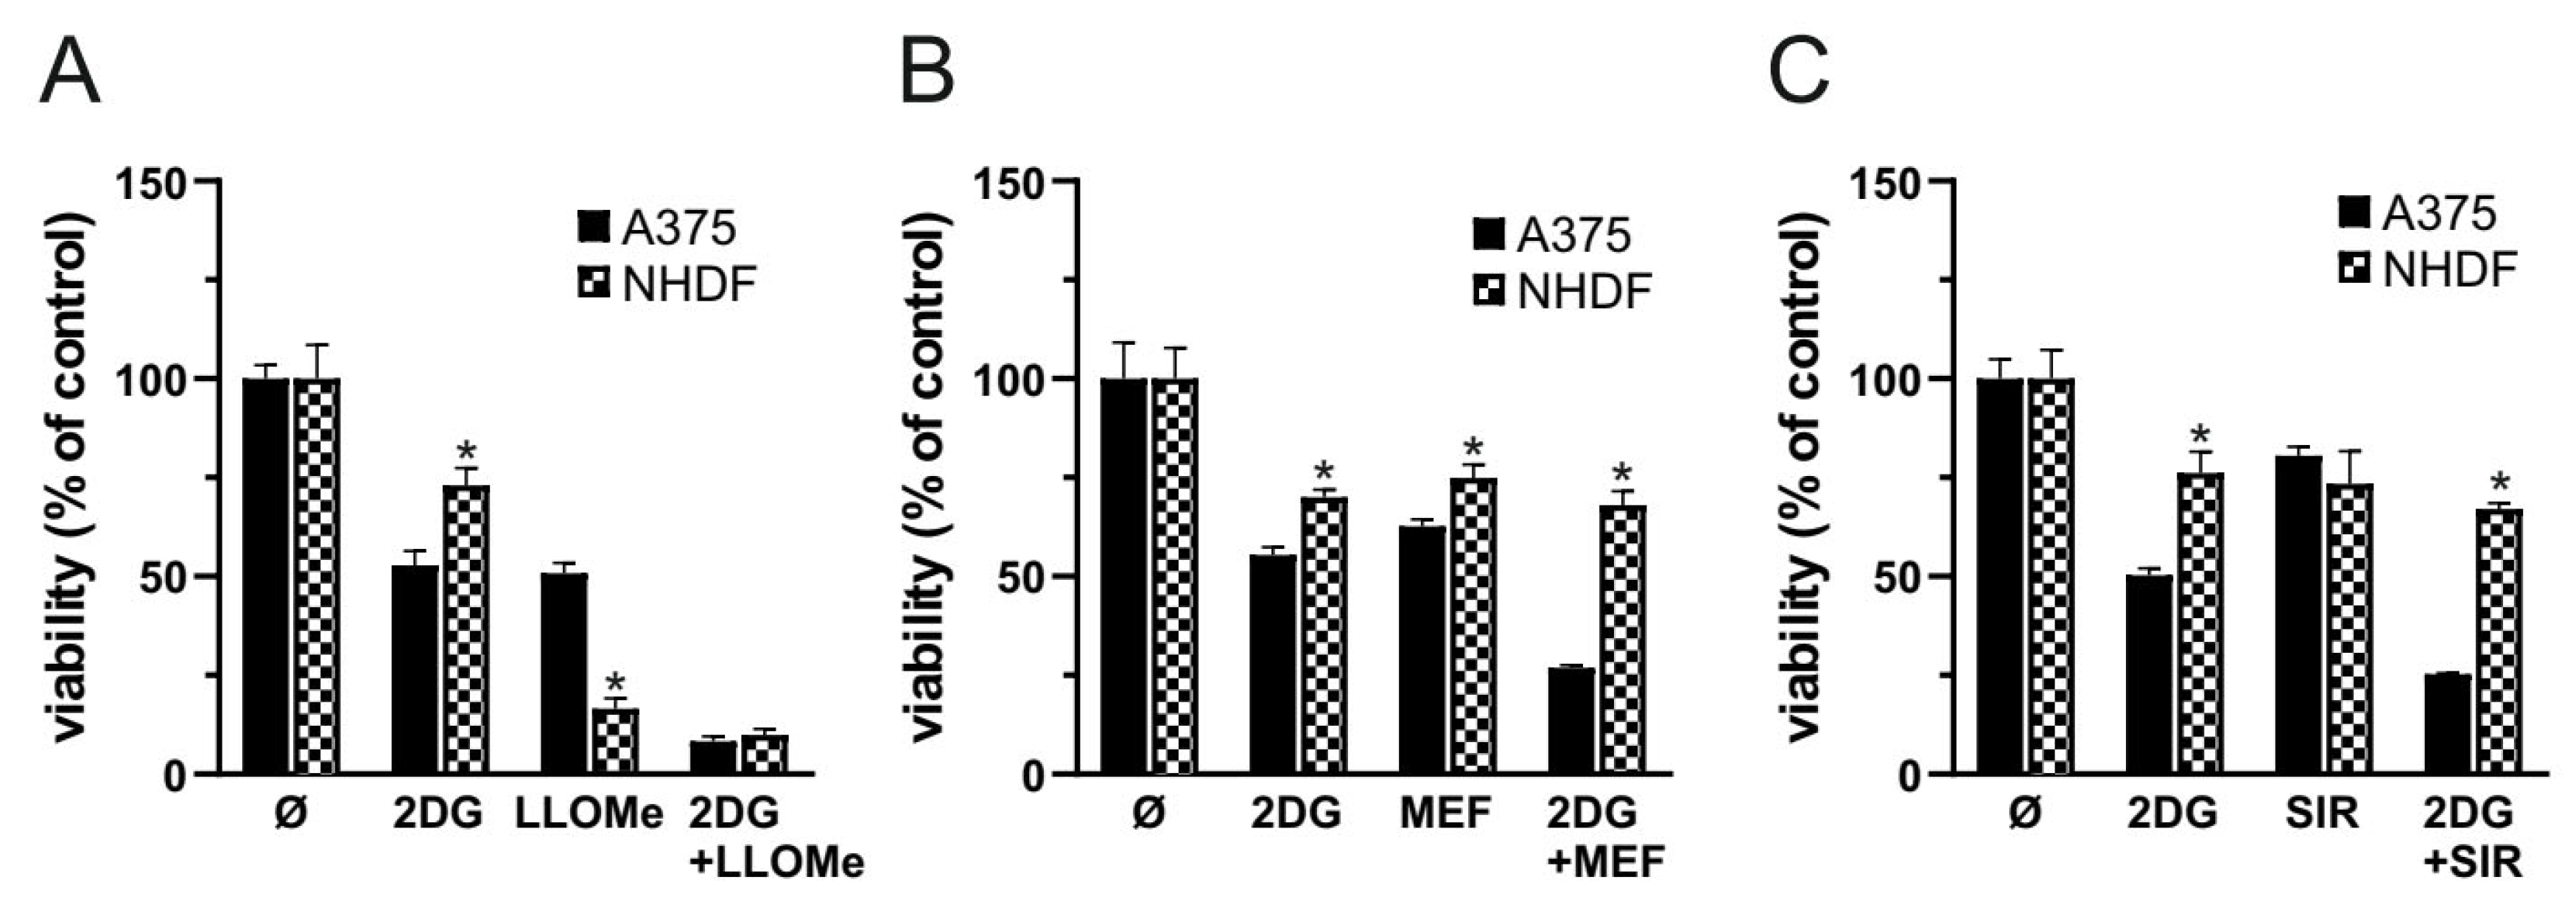
Figure 7.
Gene expression analysis of glycolytic enzymes and cathepsins during melanoma progression. (A, B) Expression levels of glycolytic enzymes including hexokinase isoforms 1-3 (HK1-HK3), glucose-6-phosphate isomerase (GPI), phosphofructokinase muscle type (PFKM), aldolase isoforms A, B, and C (ALDOA, ALDOB, ALDOC), triosephosphate isomerase 1 (TPI1), glyceraldehyde-3-phosphate dehydrogenase (GAPDH), pyruvate kinase M1/2 (PKM), and lactate dehydrogenase A (LDHA) (A) and cathepsins B (CTSB), C (CTSC), D (CTSD), L (CTSL), S (CTSS), and Z (CTSZ) (B) were analyzed in samples from normal skin (control; n = 7), benign nevi (benign; n = 18), and primary melanoma (malignant; n = 45) using the GEO microarray dataset GSE3189. Expression values are shown relative to the control group (normal skin), arbitrarily set to 1. Statistical significance of pairwise comparisons was assessed using the Mann-Whitney U test. Significant differences are shown (*p ≤ 0.05, **p ≤ 0.01, ***p ≤ 0.005, ****p ≤ 0.001), while ns indicates non-significant comparisons.
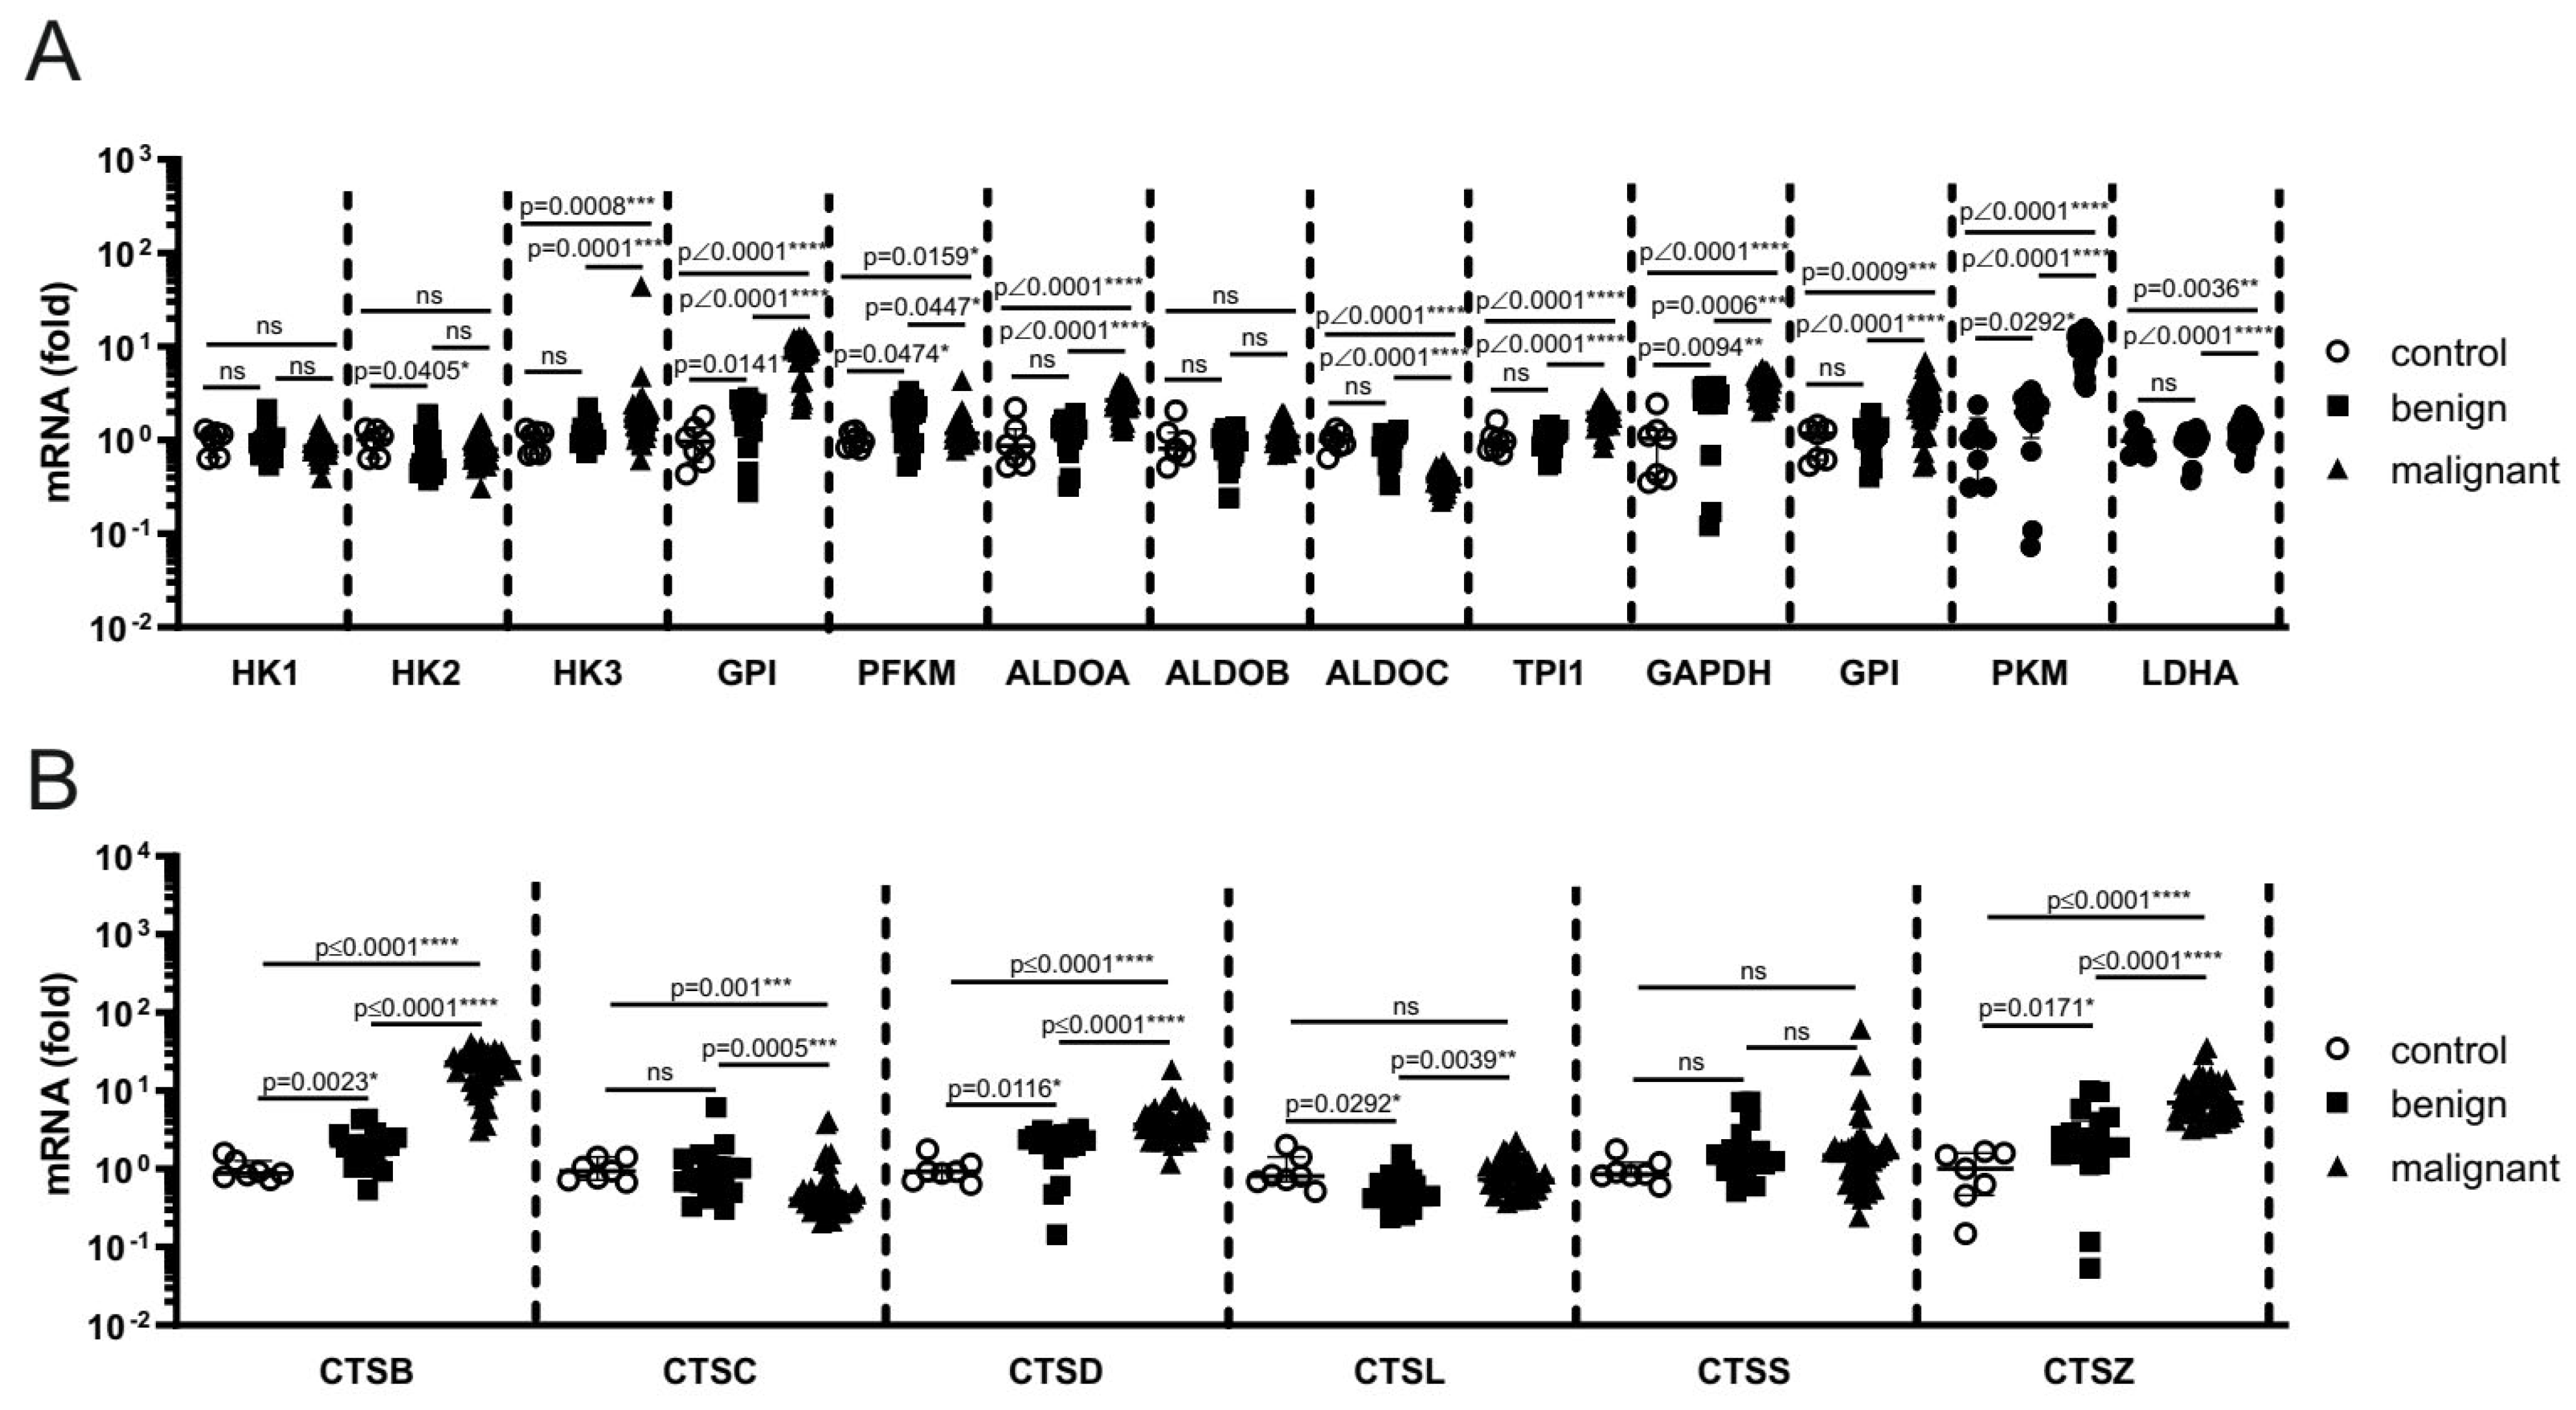
Disclaimer/Publisher’s Note: The statements, opinions and data contained in all publications are solely those of the individual author(s) and contributor(s) and not of MDPI and/or the editor(s). MDPI and/or the editor(s) disclaim responsibility for any injury to people or property resulting from any ideas, methods, instructions or products referred to in the content. |
© 2025 by the authors. Licensee MDPI, Basel, Switzerland. This article is an open access article distributed under the terms and conditions of the Creative Commons Attribution (CC BY) license (https://creativecommons.org/licenses/by/4.0/).
Copyright: This open access article is published under a Creative Commons CC BY 4.0 license, which permit the free download, distribution, and reuse, provided that the author and preprint are cited in any reuse.


