
Submitted:
01 April 2025
Posted:
01 April 2025
You are already at the latest version
Abstract
Background/Objectives: Cancer cells exhibit metabolic reprogramming, enabling them to switch between glycolysis and oxidative phosphorylation for ATP generation necessary for survival, proliferation and metastasis. This adaptability allows cancer cells to evade conventional therapy options that target only one metabolic pathway among others and lead to cancer resurgence and treatment resistance. The goal of this investigation was to evaluate the dual inhibition of these metabolic pathways with Annonacin and 2-DG in individual and combination modalities on A549 and NL20 cells to develop selective therapies for cancer cells, sparing normal cells. This dual attack was hypothesized to improve treatment effectiveness with triggering of cancer cell death by exploiting the metabolic vulnerabilities, disrupting glucose metabolism, modulating oxidative stress and inducing apoptosis through generation of reactive oxygen species (ROS) mediated DNA damage. Methods: The [3-(4,5-dimethylthiazol-2-yl)-2,5-diphenyltetrazolium bromide]-MTT and clonogenic assays were employed to assess the viability and proliferation capacity, respectively in A549 cancer and NL20 normal cells exposed to individual and combination treatment of Annonacin and 2-DG. Superoxide Dismutase (SOD) and Glutathione Peroxidase (GPx) assays were employed to evaluate treatment mediated oxidative stress. Results: The combination treatment showed enhanced cytotoxicity compared to individual application, while normal cells exhibited differential and selective response. Conclusions: These findings provided the preclinical evidence for the potential therapeutic application of Annonacin and 2-DG as a dual metabolic targeting strategy for NSCLC. Future in vitro and in vivo research are necessary to understand the underlying mechanisms in detail and potentially translate them into treatment against NSCLC.
Keywords:
Non-small cell lung cancer
; A549
; NL20
; oxidative stress
; metabolic vulnerability
; energy metabolism
; mitochondrial dysfunction
; apoptosis
1. Introduction
Lung cancer is the leading cause of cancer-related mortality globally, with non-small cell lung cancer (NSCLC) accounting for more than 85% of all lung cancer cases diagnosed [1,2]. In the United States, it is the second most diagnosed cancer in both males and females combined after breast and prostate cancer [2,3]. Despite advancements in treatments, including surgery, chemotherapy, radiation therapy, targeted therapy and immunotherapy, the prognosis for NSCLC remains poor, primary due to late-stage diagnosis, intrinsic drug resistance, systemic toxicity, and treatment associated adverse effects [4,5]. These factors warrant urgent need for novel and effective therapeutic approaches that specifically target the unique metabolic vulnerabilities of NSCLC cells with minimal harm to normal tissues.
Cancer cells, including NSCLC, exhibit significant metabolic reprogramming characterized by an increased reliance on glycolysis for ATP production, even under aerobic conditions- a phenomenon known as Warburg effect [6,7].This metabolic shift is accompanied by alterations in mitochondrial functions, enabling cancer cells to adapt their energy metabolism dynamically between glycolysis and oxidative phosphorylation (OXPHOS) based on the tumor microenvironment and energy demands, facilitating their survival and proliferation [7,8,9,16]. Such metabolic plasticity confers resistance to therapies that target only one energy production pathway, as cancer cells readily switch to alternative pathways to meet their energy requirements [16].
Annonacin Figure 1(A), an acetogenin derived from the Annonaceae plant family, has shown promising anticancer activity through selective inhibition of mitochondrial complex I, leading to disruption of ATP production, increased oxidative stress, cell cycle arrest, and apoptosis induction in various cancer cell lines [10,11]. Similarly, 2-DG Figure 1(B), a glycolytic inhibitor, effectively targets glycolysis by competing with glucose, resulting in glycolytic flux disruption, ATP depletion, production of ROS and subsequent cell death through metabolic stress and apoptosis [12,13]. However, as a single agent 2-DG’s potential is limited by rapid metabolism, short half-life, and compensatory metabolic shifts in cancer cells [14,15].
The rationale for this study is based on exploiting the complementary metabolic vulnerabilities of NSCLC cells by concurrently targeting glycolytic and mitochondrial energy production pathways using Annonacin and 2-DG. By combining these two metabolic inhibitors, we hypothesize that cancer cells’ metabolic flexibility would be compromised, resulting in enhanced cytotoxicity, increased oxidative stress and apoptosis compared to either compound when used alone. To test this hypothesis, we evaluated the individual and combined effects of Annonacin and 2-DG on cell viability, proliferation capacity, and antioxidant defense mechanisms (SOD and GPx) leading to oxidative stress in A549 and NL20 cells under in vitro investigation model system.
Our results demonstrate that dual inhibition significantly enhances the antiproliferative and cytotoxic effects on A549 cells, with selective toxicity, sparing normal cells. These findings provide a compelling preclinical evidence supporting the therapeutic potential of combined Annonacin and 2-DG treatment as an effective and targeted strategy for NSCLC.
2. Materials and Methods
2.1. Cell Lines
A549 (human non-small cell lung carcinoma, CCL-185, LOT: 70056074) and NL20 (non-tumorigenic human bronchial epithelium, CRL-2503, LOT: 63990083) cell lines were purchased from American Type Culture Collection (ATCC). Cells were revived and maintained at 5% CO2, and 37 in a humidified incubator. A549 cells were cultured in Dulbecco’s Modified Eagle Medium/Nutrient Mixture F-12 (DMEM/F-12 1:1 Modified, ATCC 30-2006) supplemented with 10% v/v fetal bovine serum (FBS) (Peak Serum, PS-FB2), 1% v/v penicillin-streptomycin (Gibco, REF 15140-122). NL20 cells were cultured in F-12 K Kaighn’s Modification of Ham’s F-12 with glutamine medium, supplemented with 5% v/v fetal bovine serum (FBS) (Peak Serum, PS-FB2), 1 % v/v penicillin-streptomycin (Gibco, REF 15140-122), 10 ng/mL human epidermal growth factor (EGF) (Peprotech, CAT: AF-100-15-1MG), 5 mL 1X insulin transferrin-selenium ethanolamine (ITS-X) (Corning, REF 25-800-CR), 500 ng/mL of hydrocortisone (Thermo Scientific, CAT: 352450010).
2.2. Inhibitors
Cells were treated with Annonacin, a mitochondrial complex I inhibitor (AOBIOUS INC, CAT: AOB 34570, CAS: 111035-65-5, LOT: 8185B) and 2-DG, a glycolytic inhibitor (ThermoFisher Scientific, CAT: 111980050, CAS: 154-17-6, LOT: A0445842). Aliquots of compounds were formulated from the product, dissolved in dimethyl sulfoxide (DMSO) and diluted in respective cell media using serial dilutions to a final concentration of 0.05 % v/v DMSO. Based on the dose-response study, various doses of Annonacin below its IC50 values (0, 1, 2, 4 & 6 μM) and 2-DG (0, 1.25, 2.5, 5 & 7.5 mM) were chosen for individual and combination application in the experiment.
2.3. Cell Viability Assay
To determine the immediate cytotoxic potential of Annonacin and 2-DG in individual and combination application, A549 and NL20 cells were seeded in 96-well plates at a density of approximately 10,000 cells/well with 100 μL media and incubated for approximately 24 hours to allow cells to attach. To minimize edge effects during incubation and improve assay consistency, the peripheral wells of 96-well plates were filled with sterile phosphate buffered saline (PBS) and left unused for data collection. After 24-hours, varying concentration of treatments were added and the plates were returned to incubator for an exposure of additional 24 hours. Following the exposure period, 10 μL of 12 m MTT [3-(4,5-dimethylthiazol-2-yl)-2,5-diphenyltetrazolium bromide] (5mg/ml, 12 mM) stock solution (Vybrant® MTT Cell Proliferation Assay Kit V-13154, ThermoFisher Scientific) was added to each well with 100 μL of fresh culture media. For a negative control, a blank was maintained, and plates were incubated for 4 hours. After 4 hours of incubation, 100 μL of sodium dodecyl sulfate (SDS)-HCL solution was added to each well and mixed thoroughly. After pipetting, plates were incubated at 37 °C for 4 more hours. At the end of the incubation period, each well was remixed using a pipette, and the absorbance was read at 570 nm in (Agilent Biotek Epoch 2, SN: 23060616) microplate reader with Gen 6 Software (BIOTEK, 1771001N REV B). The experiment was performed in triplicate with control. The absorbance data at 570 nm was used to calculate the individual and combination application effects of Annonacin and 2-DG on cell viability. Cell viability was calculated using this formula:
where,
OD Treatment = absorbance reading of cells in treated well
OD Control = absorbance reading of cells treated with (0.05% DMSO)
OD Blank = absorbance reading of well only with PBS (negative control)
2.4. Cell Proliferation Assay
The long-term potential of A549 NSCLC cells to proliferate and form colonies in the absence and presence of test compounds was evaluated with Colony Formation Assay (CFA) [17]. Cells were trypsinized, counted and diluted to 2.5 102/mL, and plated in 6-well plates with 2 mL/well of cell mixture () and allowed to attach for 24-hours. Following 24-hour attachment step, the media was aspirated and freshly prepared varying concentrations of Annonacin and 2-DG in individual and combination modalities were added. Cells with 0.05% DMSO was maintained as control well. Cells were exposed to treatments for 24 hours and after that media with compounds were aspirated and each well was rinsed with 2 mL of sterile PBS. Each well was then replenished with 2 mL of fresh media and the plates were returned to incubator with 5 % CO2, at 37 with humidified air. Growing medium was replaced at a 3-day interval. After 14 days of incubation, the cells were stained with a mixture of 6% glutaraldehyde (Fisher Chemical, CAS: 111-30-8, LOT: 26823) and 0.5% crystal violet (Fisher Chemical, CAS: 548-62-9, LOT: 3GI0593) solution. A colony with at least 50 cells was counted using an electronic colony counting pin (Fisherbrand, 3133FS). The experiment was performed in triplicate with control. The plating efficiency (PE) (% of cells plated that give rise to colonies) was calculated as a ratio of number of colonies formed to the number of cells seeded for control. The proportion of cells that survive after treatment exposure (Surviving Fraction) was calculated to estimate their long-term proliferation capacity.
2.5. Superoxide Dismutase (SOD) Assay
To evaluate the oxidative stress due to the production of superoxide free radical (ROS) during metabolism with the application of Annonacin and 2-DG in individual and combination modalities, SOD activity assessment was performed. Cells were trypsinized, counted and diluted to 5 105/mL and seeded in 6-well plate with 2 mL of cell suspension/well (). Well with 0.05% DMSO with cells was maintained as control. Cells were allowed to attach for 24 hours. Following 24-hour attachment, varying concentrations of Annonacin and 2-DG were added and exposed for 24 hours. Following 24-hour exposure, cells were prepared, and SOD activity was assessed with a commercially available SOD activity assay kit (ab65353, Abcam) based on the manufacturer’s protocol. The experiment was performed in triplicate with control.
2.6. Glutathione Peroxidase (GPx) Assay
To evaluate the oxidative stress due to the production of hydrogen peroxide free radical another ROS during metabolism with the application of Annonacin and 2-DG in individual and combination modalities, GPx activity assessment was performed. Cells were trypsinized, counted and diluted to 5 105/mL and seeded in 6-well plate with 2 mL of cell suspension/well (). Well with 0.05% DMSO with cell was maintained as control. Cells were allowed to attach for 24 hours. Following 24-hour attachment step, varying concentrations of Annonacin and 2-DG were added and exposed for 24 hours. Following 24-hour exposure, cells were prepared and GPx enzyme activity was assessed using a commercially available GPx assay kit (ab 102530, Abcam) based on the manufacturer’s protocol. The experiment was performed in triplicate with control.
2.7. Statistical Analysis
Statistical analysis was performed with GraphPad Prism version 10.4.1 (532) for mac M2 pro computer. Two-way ANOVA, followed by Tukey’s multiple comparison test was used to measure differences among treatment groups and to evaluate the interaction between Annonacin and 2-DG on each cell type and the tested compounds. Significant interaction effect was analyzed by SynergyFinder Plus [18] Platform, applying Loewe additivity model. Data were presented mean standard error of mean (SEM) (n=3). Compact letter display (CLD) format was used and P ≤ 0.05 considered statistically significant.
3. Results
3.1. The Effects of Annonacin and 2-DG on A549 and NL20 Viability in Individual and Combination Modality
The colorimetric MTT assay determined the cytotoxic responses on A549 NSCLC and NL20 cells in response to increasing concentration of Annonacin and 2-DG, when used individually and in combination. Both compounds induced a dose-dependent decrease in cell viability across both cell lines, as shown in Figure 2 (A-D). A549 and NL20 cells showed differential susceptibility to Annonacin and 2-DG with higher doses inhibiting the cell growth. The half maximal inhibitory concentration (IC50) at 24-hour treatment was 6.87 μM for Annonacin and 9.08 mM for 2-DG on A549 NSCLC.
3.2. The Interactive Effects of Annonacin and 2-DG on A549 and NL20 Viability
The interactive effect between Annonacin and 2-DG combination application was calculated using SynergyFinder Plus, based on the Loewe additivity model. The synergy heatmap as shown in Figure 3 (A-B) illustrates the interaction profile across varying concentration in A549 and NL20. The synergy scores ≥10 indicate highly synergistic interaction, a score in the range of -10 to 10 indicates moderate to additive interaction and synergy score of ≤ -10 indicate an antagonistic interaction. The synergy scores were reported from -2.86 to 17.67 with mean score of 8.07 on A549 (A) and -3.33 to 8.61, mean being 2.4 on NL20 (B) showing distinct regions of synergy, additivity and antagonism. In A549, combinations at 2-6 μM Annonacin and 2.5-7.5 2-DG yielded synergy scores above 10, indicating statistically significant interaction/s between two compounds. In NL20, several combinations with Annonacin 1-2 μM and 1.25-2.5 mm 2-DG displayed additivity or slight antagonism, suggesting a selective response of cytotoxic effect of combination treatment on NSCLC cells, while sparing normal cells.
3.3. The Effects of Annonacin and 2-DG on A549 Proliferation Capacity in Individual and Combination Modality
The colony formation assay evaluated the long-term proliferation capacity of A549 NSCLC cells in response to increasing concentration of Annonacin and 2-DG in individual and combination modality. A dose-dependent reduction in surviving fraction was observed (P≤ 0.05), as showed in Figure 4 (A). Combination treatment demonstrated enhanced suppression of colony forming ability, compared to individual application. The interaction effect of compounds was quantified with Loewe additivity model in SynergyFinder Plus. The synergy scores ≥10 indicate highly synergistic interaction, a score in the range of -10 to 10 indicates moderate to additive interaction and synergy score of ≤ -10 indicate an antagonistic interaction/s. The synergy heat map, as shown in Figure 4 (B) illustrated distinct regions of synergy, additivity and antagonism. Combination concentration 2-4 μM Annonacin with 2.5 -5 mM 2-DG, yielded synergy scores between 10.14 to 22.91 with mean of 12.39, indicating significant synergistic interactions. These results suggest that dual inhibition of mitochondrial and glycolytic metabolism potentially reduces immediate cell viability and limit long-term proliferation capacity of A549 NSCLC effectively than monotherapy.
3.4. Administration of Annonacin and 2-DG Enhances Oxidative Stress by Modulating Superoxide Dismutase Activity on A549 and NL20
The oxidative stress response catalyzed by SOD activity following treatment on A549 and NL20 with individual and combination exposure of Annonacin and 2-DG was evaluated by SOD Activity assay. Both compounds modulated SOD activity in dose-dependent manner (P≤ 0.05), as illustrated in Figure 5 (A-D). In A549 cells, Annonacin increased SOD inhibition rate Figure 5 (A), while 2-DG induced a similar response Figure 5 (B). NL20 cells also showed increased inhibition upon treatment, although the magnitude was lower compared to A549, indicating selective oxidative stress induction in cancer cells. Combinatorial application further altered the SOD inhibition in A549 [Figure 5 (C)] and NL20 cells showed more moderate response [Figure 5 (D)]. This suggest that additive or synergistic ROS, thereby overwhelming the antioxidant defense system in cancer cells. Differential SOD activity was observed in the individual and combination treatments with Annonacin and 2-DG.
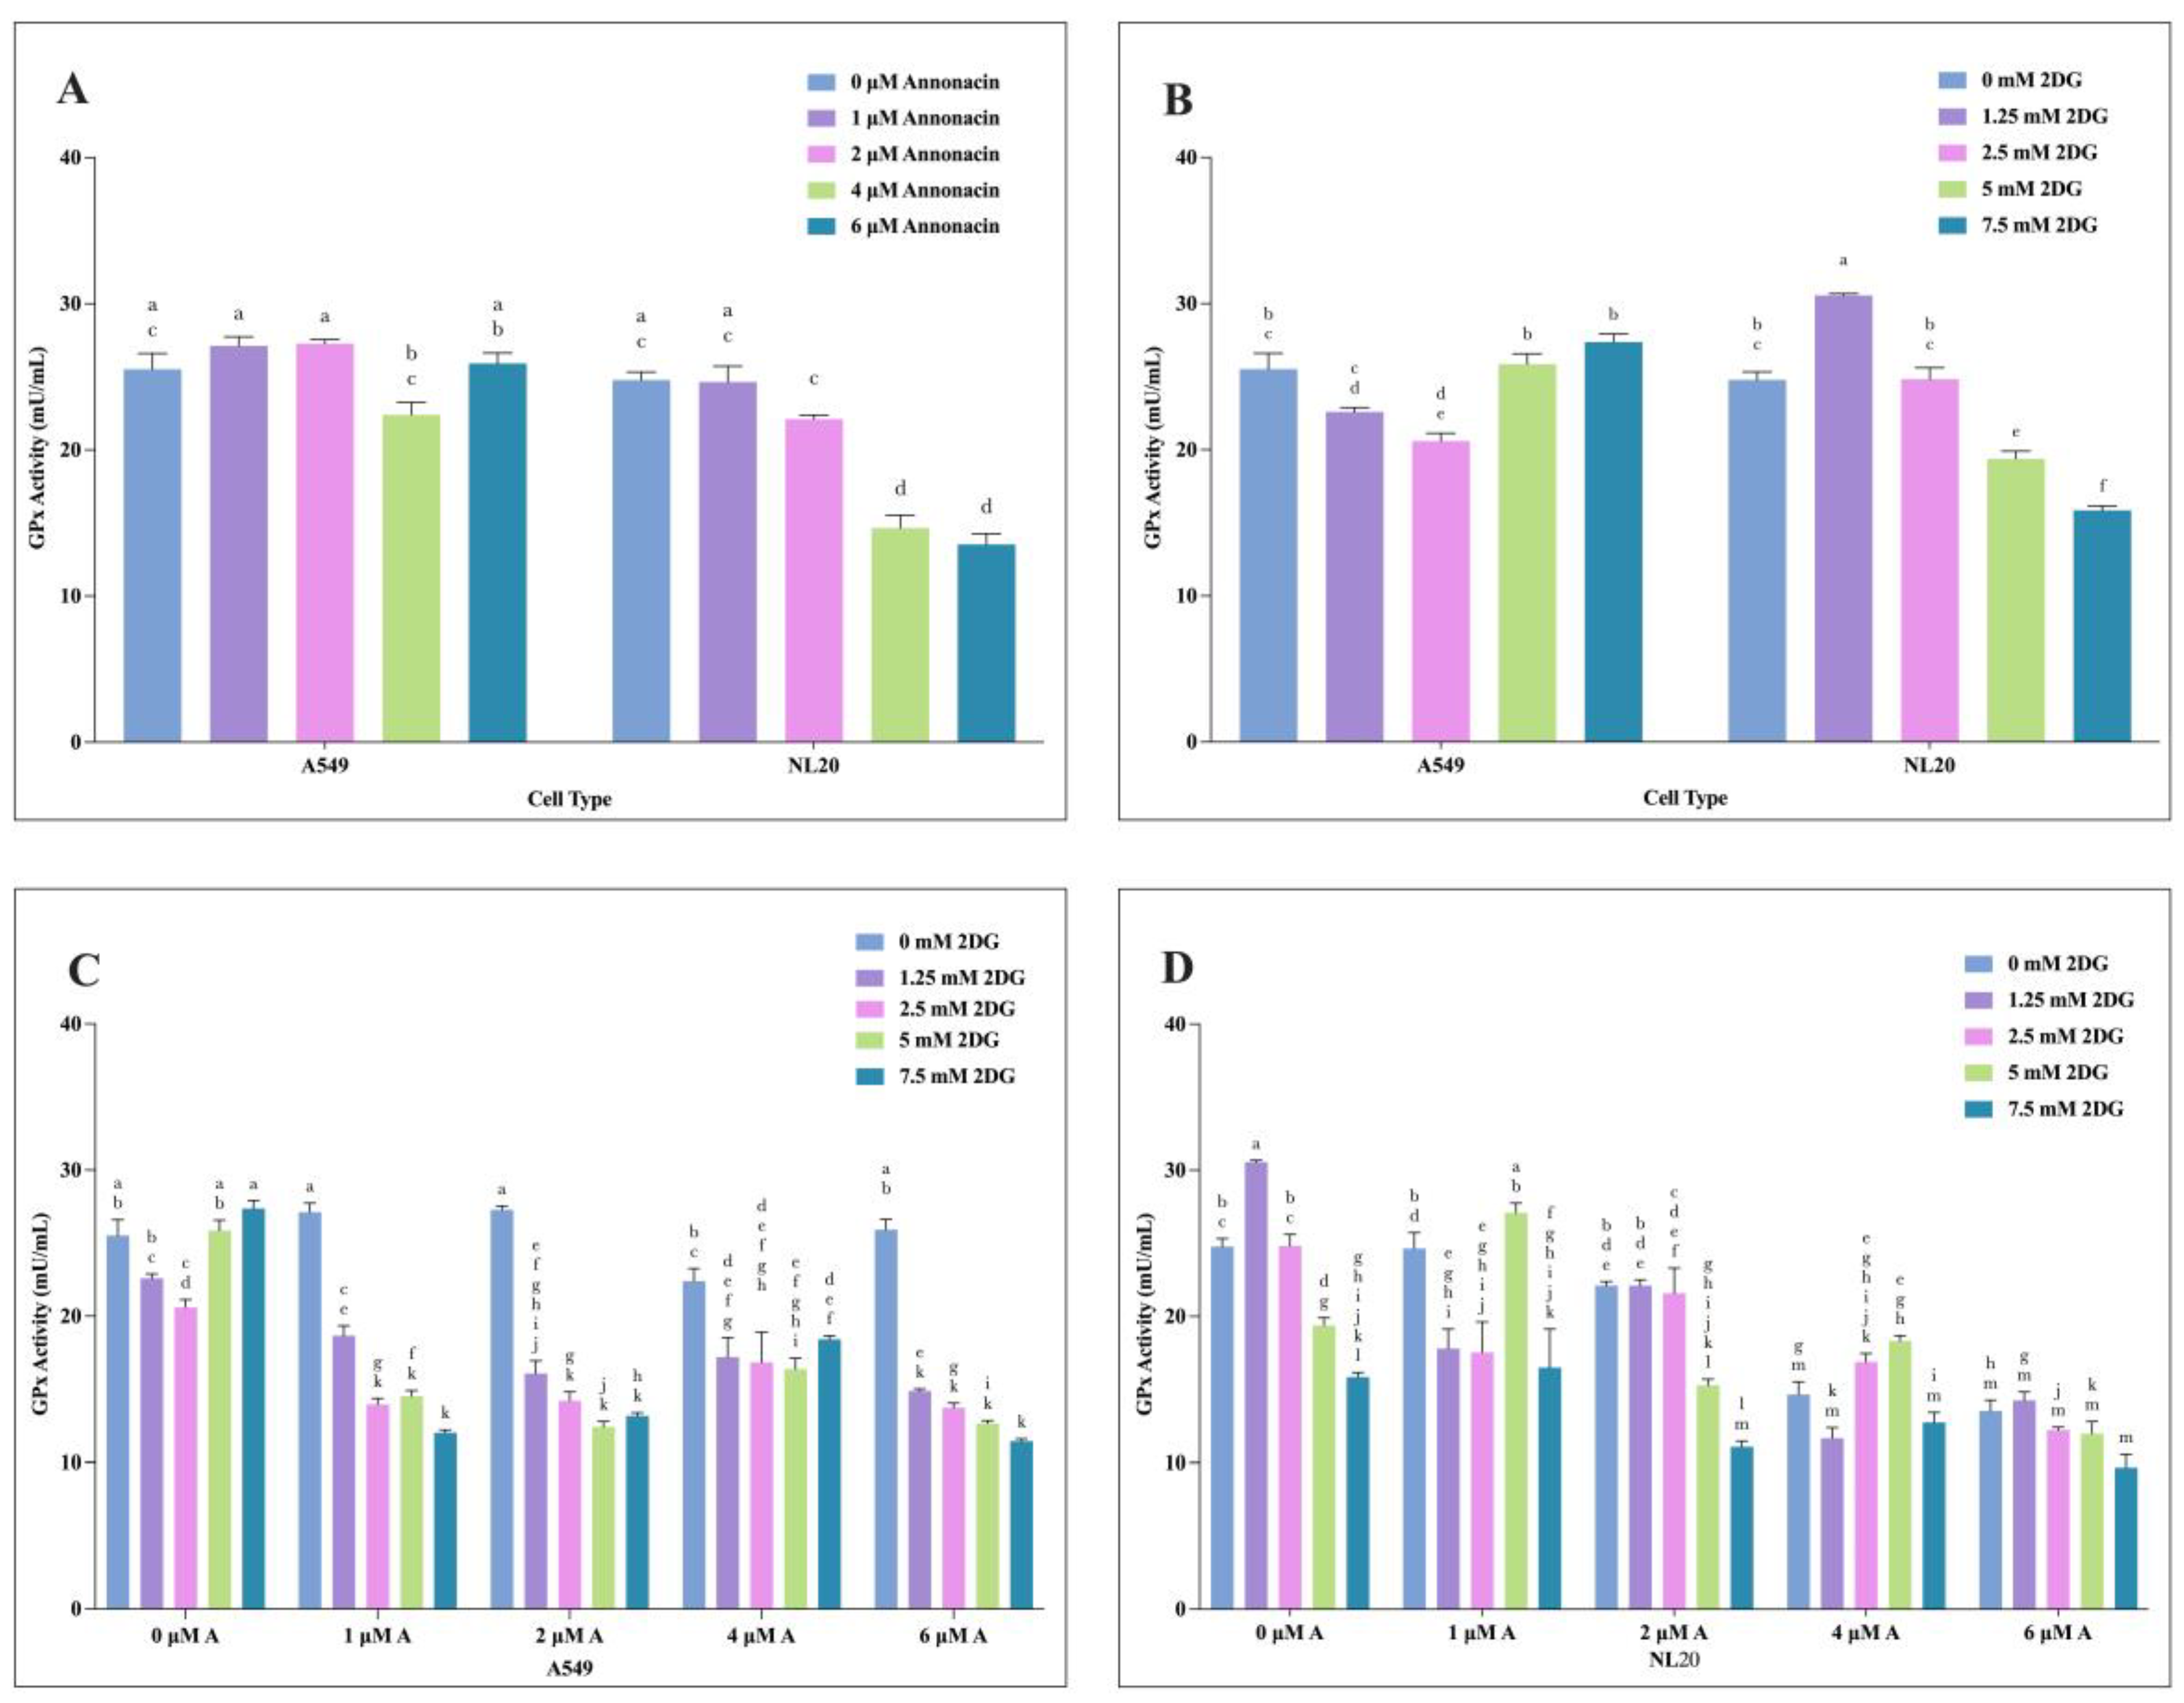
3.5. Administration of Annonacin and 2-DG Enhances Oxidative Stress by Modulating Glutathione Peroxidase Activity on A549 and NL20
The oxidative stress response-GPx activity following treatment on A549 and NL20 with individual and combination exposure of Annonacin and 2-DG was evaluated by GPx assay. Both compounds led to a dose-dependent reduction in GPx activity (P ≤ 0.05), suggesting increased oxidative stress and compromised antioxidant defense mechanism, as illustrated in Figure 6 (A-D). In A549, Annonacin showed no significant change in GPx activity at lower concentration but GPx activity decreased at higher doses Figure 6 (A). NL20 cells displayed a similar trend, with GPx activity significantly reduced at higher concentration (4-6 μM) Annonacin [Figure 6 (A)]. 2-DG decreased GPx activity significantly in A549 in dose-dependent manner, with the lowest activity observed at higher doses [Figure 6 (B)]. In contrast, NL20 cells demonstrated more pronounced decrease observed at higher doses (5 and 7.5 mM) [Figure 6 (B)]. In combination, GPx activity was. reduced significantly at higher combination concentrations in A549, indicating synergistic inhibitory effects and increased oxidative stress (p ≤ 0.05) [Figure 6 (C)]. NL20 cells also demonstrated decrease in GPx activity [Figure 6 (D)]. These observed effects indicate that both Annonacin and 2-DG reduced GPx activity more substantially when used in combination, potentially enhancing oxidative stress condition within treated cancer cells.
4. Discussion
The reliance of non-small cell lung cancer cells on metabolic flexibility, characterized by a dynamic switch between glycolysis and oxidative phosphorylation to sustain rapid proliferation and adapt to environmental stress pose a significant challenge in designing of an effective therapy [7,19,20,21]. Our study demonstrates that simultaneous targeting of glycolysis and mitochondrial respiration with Annonacin and 2-DG can potentially exploit these dual metabolic vulnerabilities, thereby significantly enhancing anticancer efficacy. The combinatorial treatments showed selective cytotoxicity against A549, while sparing NL20 cells to a considerable extent. This therapeutic strategy has shown promise and is supported by previous studies exploring the combination metabolic inhibition approach for cancer treatment [21,22,23].
Previous research has established that targeting glycolysis alone with agents such as 2-DG often lead to limited efficacy due to compensatory metabolic adaptations in cancer cells [14,15,24,25]. Similar limitations were observed in mitochondrial inhibition therapies using agents such as Annonacin, which, although effective at disrupting mitochondrial complex I activity, may be insufficient due to adaptive metabolic shifts and plasticity [26,27,28,29]. Cancer cells frequently harbor mitochondrial DNA mutations, causing respiratory chain inefficient and increased sensitivity to oxidative stress when exposed to glycolytic inhibition [30,31]. Our data support and expand upon these observations, demonstrating that a combinatorial treatment of Annonacin and 2-DG can significantly enhance the cytotoxic and antiproliferative response compared to when either agent is used alone. This synergistic efficacy may stem from the compound’s metabolic stress selectively in cancer cells, ultimately overwhelming their compensatory mechanisms, leading to increased oxidative stress, apoptosis and impaired cell proliferation [32,33,34,35].
Our study revealed that combination treatment significantly reduced cell viability, and colony formation capacity of A549 cancer cells. The observed synergy between Annonacin and 2-DG, particularly at concentrations between 2-6 μM and 2.5-7.5 mM, yielded statistically significant synergy scores (>10) in A549 cells, indicative of a highly synergistic interaction. Similar interactions were reported in prior studies indicating enhanced efficacy when combining glycolytic inhibitors with mitochondrial inhibitors, which induce severe ATP depletion and trigger apoptosis [36,37,38]. Furthermore, our findings on oxidative stress parameters- SOD and GPx activities-suggest that this dual targeting exacerbates ROS generation in cancer cells, undermining antioxidant defense more substantially than single treatments. Tumor cells compromised antioxidant defenses, such as reduced Manganese SOD (MnSOD) levels, further enhance susceptibility to oxidative damage induced by metabolic inhibitors [33,39,40]. This oxidative-stress mediated mechanism has also been supported by prior research investigating dual metabolic inhibitors in different cancer types [41,42].
Interestingly, Normal bronchial epithelial NL20 cells exhibited a differential response to the combinatorial treatment pursued in the current study. The modest effect observed in normal cells, as reflected by lower synergy scores and less pronounced oxidative stress response, underline the potential clinical relevance of this treatment strategy. This selective toxicity could translate into reduced systemic side effects and enhanced therapeutic windows in clinical applications, addressing limitations associated with conventional chemotherapies observed in similar studies [43,44]. NSCLC is notably heterogeneous, often displaying varying degree of reliance on glycolysis and mitochondrial respiration depending on specific genetic and environmental contexts [45,46]. Thus, the combination therapy approach may address tumor heterogeneity by limiting opportunities for resistance mechanisms that could arise from metabolic plasticity. In alignment with our observation, prior studies have demonstrated improved outcomes using combination strategies involving glycolytic inhibitors like 2-DG alongside other mitochondrial complex I inhibitors in diverse cancer models [20,25,41,42].
The results from our study need further investigation into the mechanistic aspects of Annonacin and 2-DG combination for further validation. Future research should elucidate precise molecular pathways underlying enhanced cytotoxicity and oxidative stress induction, including detailed studies on mitochondrial dynamics, glycolytic enzyme regulation and apoptotic pathways. In addition, exploration of this combination strategy in other cancer cell types and in vivo tumor models such as zebrafish models [47] and patient derived xenografts [48] may fully establish its broader applicability and therapeutic potential. Despite the limitations, this study provides preliminary evidence supporting dual metabolic inhibition strategy with Annonacin and 2-DG for a potential against NSCLC.
5. Conclusions
This study provided preclinical evidence on dual targeting of glycolytic and mitochondrial energy production using Annonacin and 2-DG, improving potential anticancer efficacy in NSCLC compared to monotherapy. This combinatorial strategy selectively reduced cell viability, inhibited proliferation, and significantly induced oxidative stress in NSCLC A549 cells with modest toxicity observed in NL20 cells. The observed synergistic cytotoxicity may be mediated through pronounced ROS generation, thereby overwhelming tumor specific antioxidant defense and induction of apoptosis. Findings need further exploration for validation of dual inhibition as a novel strategy to mitigate the drug resistance due to metabolic heterogeneity and adaptability of NSCLC in tumor microenvironment.
Author Contributions
B.R.B- contributed to all aspects of this work including methods, data analysis and writing. C.T.- contributed to the cell culture, various assays, data analysis, writing and review. K.K.P.- contributed to conceptualization, and review. A.M.T. – contributed to conceptualization, supervision, validation, review and editing of this work. All authors have read and agreed to the published version of the manuscript.
Funding
This work was supported by USDA NIFA, Evans-Allen Project #7001005.
Data Availability Statement
Data will be available upon request from authors.
Acknowledgments
The authors would like to acknowledge Kasondra Miller for her valuable assistance with GPx and SOD experiments. Her technical support contributed meaningfully to the completion of this work.
Conflicts of Interest
Authors declare no conflict of interests.
References
- American Cancer Society. Cancer Facts and Figures 2024; American Cancer Society: Atlanta, GA, USA, 2024; Available online: https://www.cancer.org/research/cancer-facts-statistics/all-cancer-facts-figures/2024-cancer-facts-figures.html (accessed on 25 March 2025).
- U. S. Cancer Statistics Working Group. U.S. Cancer Statistics Data Visualizations Tool; U.S. Department of Health and Human Services, Centers for Disease Control and Prevention and National Cancer Institute: Atlanta, GA, USA, Available online: https://www.cdc.gov/cancer/dataviz, (released in June 2024. [Google Scholar]
- Ferlay, J.; Erivik, M.; Lam, F.; Laversanne, M.; Colombet, M.; Mery, L.; Pineros, M.; Znaor, A.; Soerjomataram, I.; Baray, F. Global Cancer Observatory: Cancer Today; International Agency for Research on Cancer: Lyon, France, 2024; Available online: https://gco.iarc.who.int/today (accessed on 25 March 2025).
- Pant, J.; Mittal, P.; Singh, L.; Marwah, H. Evolving strategies in NSCLC care: Targeted therapies, biomarkers, predictive models, and patient management. Curr. Pharmacogenomics Pers. Med. 2023, 20, 146–164. [Google Scholar] [CrossRef]
- Lahiri, A.; Maji, A.; Potdar, P.D.; Singh, N.; Parikh, P.; Bisht, B.; Paul, M.K. Lung cancer immunotherapy: Progress, pitfalls, and promises. Mol. Cancer 2023, 22, 40. [Google Scholar] [CrossRef]
- Warburg, O. On the origin of cancer cells. Science 1956, 123, 309–314. [Google Scholar] [CrossRef] [PubMed]
- Faubert, B.; Solmonson, A.; DeBerardinis, R.J. Metabolic reprogramming and cancer progression. Science 2020, 368, eaaw5473. [Google Scholar] [CrossRef]
- Tang, Q.; Wu, S.; Zhao, B.; Li, Z.; Zhou, Q.; Yu, Y.; Yang, X.; Wang, R.; Wang, X.; Wu, W.; Wang, S. Reprogramming of glucose metabolism: The hallmark of malignant transformation and target for advanced diagnostics and treaments. Biomed. Pharmacother. 2024, 178, 117257. [Google Scholar] [CrossRef]
- McCommis, K.S.; Finck, B.N. Mitochondrial pyruvate transport: A historical perspective and future research directions. Biochem. J. 2015, 466, 443–454. [Google Scholar] [CrossRef] [PubMed]
- Bravo-Alfaro, D.A.; Montalvo-González, E.; Zapien-Macias, J.M.; Sampieri-Moran, J.M.; García, H.S.; Luna-Bárcenas, G. Annonaceae acetogenins: A potential treatment for gynecological and breast cancer. Fitoterapia 2024, 178, 178–106187. [Google Scholar] [CrossRef]
- Yap, C.V.; Subramaniam, K.S.; Khor, S.W.; Chung, I. Annonacin exerts antitumor activity through induction of apoptosis and extracellular signal-regulated kinase inhibition. Pharmacogn. Res. 2017, 9, 378–383. [Google Scholar] [CrossRef]
- Brandon, M.; Baldi, P.; Wallace, D.C. Mitochondrial mutations in cancer. Oncogene 2006, 25, 4647–4662. [Google Scholar] [CrossRef]
- Singh, R.; Gupta, V.; Kumar, A.; Singh, K. 2-Deoxy-D-Glucose: A novel pharmacological agent for killing hypoxic tumor cells, oxygen dependence-lowering in COVID-19, and other pharmacological activities. Adv. Pharmacol. Pharm. Sci. 2023, 9993386. [Google Scholar] [CrossRef]
- Zhang, Y.; Li, Q.; Huang, Z.; Li, B.; Nice, E.C.; Huang, C.; Wei, L.; Zou, B. Targeting glucose metabolism enzymes in cancer treatment: Current and emerging strategies. Cancers 2022, 14, 4568. [Google Scholar] [CrossRef] [PubMed]
- Laussel, C.; Léon, S. Cellular toxicity of the metabolic inhibitor 2-deoxyglucose and associated resistance mechanisms. Biochem. Pharmacol. 2020, 182, 114213. [Google Scholar] [CrossRef] [PubMed]
- Modica-Napolitano, J.S.; Murray, M.; Thibault, J.; Haley-Read, J.P.; Nixdorf, L.; Shanahan, B.; lacovella, N.; Reyes, C. The In vitro cytotoxic effect of Elesclomol on breast adenocarcinoma cells is enhanced by concurrent treatment with glycolytic inhibitors. Cancers 2024, 16, 4054. [Google Scholar] [CrossRef] [PubMed]
- Franken, N.A.; Rodermond, H.M.; Stap, J.; Haveman, J.; Van Bree, C. Clonogenic assay of cells in vitro. Nat. Prtoc. 2006, 1, 2315–2319. [Google Scholar] [CrossRef]
- Zheng, S.; Wang, W.; Aldahdooh, J.; Malyutina, A.; Shadbahr, T.; Tanoli, Z.; Pessia, A.; Tang, J. SynergyFinder plus: Toward better interpretation and annotation of drug combination screening datasets. Genom. Proteom. Bioinform. 2022, 2, 587–596. [Google Scholar] [CrossRef]
- Grasmann, G.; Mondal, A.; Leithner, K. Flexibility and adaptation of cancer cells in a heterogenous metabolic microenvironment. Int. J. Mol. Sci. 2021, 22, 1476. [Google Scholar] [CrossRef]
- Tufail, M.; Jiang, C.H.; Li, N. Altered metabolism in cancer: Insights into energy pathways and therapeutic targets. Mol. Cancer 2024, 23, 203. [Google Scholar] [CrossRef]
- DeBerardinis, R.J.; Chandel, N.S. Fundamentals of cancer metabolism. Sci. Adv 2016, 2, e1600200. [Google Scholar] [CrossRef]
- Stine, Z.E.; Schug, Z.T.; Salvino, J.M.; Dang, C. Targeting cancer metabolism in the era of precision oncology. Nat. Rev. Drug Discov. 2022, 21, 141–162. [Google Scholar] [CrossRef]
- Jia, D.; Lu, M.; Jung, K.H.; Park, J.H.; Yu, L.; Onuchic, J.N.; Kaipparettu, B.A.; Levine, H. Elucidating cancer metabolic plasticity by coupling gene regulation with metabolic pathways. Proc. Nat. Acad. Sci., USA 2019, 116, 3909–3918. [Google Scholar] [CrossRef]
- Maximchik, P.; Abdrakhmanov, A.; Inozemtseva, E.; Tyurin-Kuzmin, P.A.; Zhivotovsky, B.; Gogvadze, V. 2-Deoxy-D-glucose has distinct and cell line-specific effects on the survival of different cancer cells upon antitumor drug treatment. FEBS J. 2018, 285, 4590–4601. [Google Scholar] [CrossRef] [PubMed]
- Repas, J.; Zupin, M.; Vodlan, M.; Veranič, P.; Gole, B.; Potočnik, U.; Pavlin, M. Dual effect of combined metformin and 2-Deoxy-D-Glucose treatment on mitochondrial biogenesis and PD-L1 expression in triple-negative breast cancer cells. Cancers 2022, 14, 1343. [Google Scholar] [CrossRef]
- Lannuzel, A.; Michel, P.; Höglinger, G.; Champy, P.; Jousset, A.; Medja, F.; Lombès, A.; Darios, F.; Gleye, C.; Laurens, A.; Hocquemiller, R.; Hirsch, E.; Ruberg, M. The mitochondrial complex i inhibitor annonacin is toxic to mesencephalic dopaminergic neurons by impairment of energy metabolism. Neuroscience 2003, 121, 287–296. [Google Scholar] [CrossRef]
- Urra, F.A.; Muñoz, F.; Lovy, A.; Cárdenas, C. The mitochondrial complex (I) ty of cancer. Fronti. Oncol. 2017, 7, 118. [Google Scholar] [CrossRef]
- Al Assi, A.; Posty, S.; Lamarche, F.; Chebel, A.; Guitton, J.; Prudent, R.; Lafanechère, L.; Giraud, S.; Dallemagne, P.; Suzanne, P.; Verney, A.; Genestier, L.; Castets, M.; Fontaine, E.; Billaud, M. A novel inhibitor of the mitochondrial respiratory complex I with uncoupling properties exerts potent antitumor activity. Cell Death Dis. 2024, 15, 1–14. [Google Scholar] [CrossRef] [PubMed]
- Kurelac, I.; Iommarini, L.; Vatrinet, R.; Amato, L.B.; De Luise, M.; Leone, G.; Girolimetti, G.; Ganesh, N.U.; et al. Inducing cancer indolence by targeting mitochondrial Complex I is potentiated by blocking macrophage-mediated adaptive responses. Nat. Commun. 2019, 10, 1–18. [Google Scholar] [CrossRef]
- Mahmood, M.; Liu, E.M.; Shergold, A.L.; Tolla, E.; Tait-Mulder, J.; Huerta-Uribe, A.; Shokry, E.; et al. Mitochondrial DNA mutations drive aerobic glycolysis to enhance checkpoint blockade response in melanoma. Nat. cancer 2024, 5, 659–672. [Google Scholar] [CrossRef] [PubMed]
- Wallace, D.C. Mitochondria and cancer. Nat. Rev. Cancer, 2012, 12, 685–698. [Google Scholar] [CrossRef]
- Bénéteau, M.; Zunino, B.; Jacquin, M.A.; Meynet, O.; Chiche, J.; Pradelli, L.A.; Marchetti, S.; Cornille, A.; Carles, M.; Ricci, J.E. Combination of glycolysis inhibition with chemotherapy results in an antitumor immune response. Proc. Natl. Acad. Sci. USA 2012, 109, 20071–20076. [Google Scholar] [CrossRef]
- Shiratori, R.; Furuichi, K.; Yamaguchi, M.; Miyazaki, N.; Aoki, H.; Chibana, H.; Ito, k.; Aoki, S. Glycolytic suppression dramatically changes the intracellular metabolic profile of multiple cancer cell lines in a mitochondrial metabolism-dependent manner. Sci Rep. 2019, 9, 18699. [Google Scholar] [CrossRef]
- Lee, M.; Yoon, J.H. Metabolic interplay between glycolysis and mitochondrial oxidation: The reverse Warburg effect and its therapeutic implication. World J. Biol. Chem. 2015, 6, 148–161. [Google Scholar] [CrossRef] [PubMed]
- Pelicano, H.; Zhang, W.; Liu, J.; Hammoudi, N.; Dai, J.; Xu, R.H.; Pusztai, L.; Huang, P. Mitochondrial dysfunction in some triple-negative breast cancer cell lines: Role of mTOR pathway and therapeutic potential. Breast Cancer Res. 2014, 16, 1–16. [Google Scholar] [CrossRef]
- Cheng, G.; Zielonka, J.; Dranka, B.P.; McAllister, D.; Mackinnon, A.C., Jr.; Joseph, J.; Kalyanaraman, B. Mitochondria-targeted drugs synergize with 2-deoxyglucose to trigger breast cancer cell death. Cancer Res. 2012, 72, 2634–2644. [Google Scholar] [CrossRef] [PubMed]
- Wu, Y.; Sarkissyan, M.; McGhee, E.; Lee, S.; Vadgama, J.V. Combined inhibition of glycolysis and AMPK induces synergistic breast cancer cell killing. Breast Cancer Res. Treat. 2015, 151, 529–539. [Google Scholar] [CrossRef] [PubMed]
- Cheng, G.; Zielonka, J.; McAllister, D.; Tsai, S.; Dwinell, M.B.; Kalyanaraman, B. Profiling and targeting of cellular bioenergetics: Inhibition of pancreatic cancer cell proliferation. Br. J. Cancer, 2014, 111, 85–93. [Google Scholar] [CrossRef]
- Grimes, K.R.; Daosukho, C.; Zhao, Y.; Meigooni, A.; St Clair, W. Proteasome inhibition improves fractionated radiation treatment against non-small cell lung cancer: An antioxidant connection. Int. J. Oncol. 2005, 27, 1047–1052. [Google Scholar] [CrossRef]
- Robbins, D.; Zhao, Y. Manganese superoxide dismutase in cancer prevention. Antioxid. Redox Signal. 2014, 20, 1628–1645. [Google Scholar] [CrossRef]
- Aisu, Y.; Oshima, N.; Hyodo, F.; Elhelaly, A.E.; Masuo, A.; Okada, T.; Hisamori, S.; Obama, K. Dual inhibition of oxidative phosphorylation and glycolysis exerts a synergistic antitumor effect on colorectal and gastric cancer by creating energy depletion and preventing metabolic switch. PLoS ONE 2024, 19, e0309700. [Google Scholar] [CrossRef]
- Adu-Amankwaah, F.; Tapfuma, K.I.; Nyambo, K.; Maarman, G.; Munansangu, B.S.; Thagulisi, F.; Watson, D.J.; Wiesner, L.; Tshililo, N.; Mabasa, L.; Mavumengwana, V.; Baatjies, L. Targeting mitochondrial function to inhibit glycolysis and oxidative phosphorylation (OXPHOS) for therapeutic intervention in triple-negative breast cancer line (MDA-MB 231) utilising Cape fynbos. S. Afr. J. Bot. 2025, 178, 73–88. [Google Scholar] [CrossRef]
- Vuyyuri, S.B.; Rinkinen, J.; Worden, E.; Shim, H.; Lee, S.; Davis, K.R. Ascorbic acid and a cytostatic inhibitor of glycolysis synergistically induce apoptosis in non-small cell lung cancer cells. PLoS ONE 2013, 8, e67081. [Google Scholar] [CrossRef]
- Lucantoni, F.; Dussmann, H.; Prehn, J.H.M. Metabolic targeting of breast cancer cells with the 2-deoxy-d-glucose and the mitochondrial bioenergetics inhibitor MDIVI-1. Front. Cell Dev. Biol. 2018, 6, 113. [Google Scholar] [CrossRef] [PubMed]
- Hensley, C.T.; Faubert, B.; Yuan, Q.; Lev-Cohain, N.; Jin, E.; Kim, J.; Jiang, L.; Ko, B.; Skelton, R.; Loudat, L.; et al. Metabolic Heterogeneity in Human Lung Tumors. Cell 2016, 164, 681–694. [Google Scholar] [CrossRef] [PubMed]
- Chen, P.H.; Cai, L.; Huffman, K.; Yang, C.; Kim, J.; Faubert, B.; Boroughs, L.; Ko, B.; Sudderth, J.; McMillan, E.A.; et al. Metabolic diversity in human non-small cell lung cancer Cells. Mol. Cell. 2019, 76, 838–851.e5. [Google Scholar] [CrossRef]
- Astell, K.R.; Sieger, D. Zebrafish in vivo models of cancer and metastasis. Cold Spring Harb. Perspect. Med. 2020, 10, a037077. [Google Scholar] [CrossRef] [PubMed]
- Liu, Y.; Wu, W.; Cai, C.; Zhang, H.; Shen, H.; Han, Y. Patient-derived xenograft models in cancer therapy: Technologies and applications. Signal Transduct. Target. Ther. 2023, 8, 160. [Google Scholar] [CrossRef]
Figure 1.
Chemical Structure of Annonacin 1 (A) (image obtained from AOBIOUS INC, https://aobious.com/aobious/ultra-pure-pharmacological-standard/3413-annonacin.html 1 (B) 2-Deoxy-D-glucose (image obtained from Thermo Scientific Chemicals, https://www.thermofisher.com/order/catalog/product/L07338.14 ).
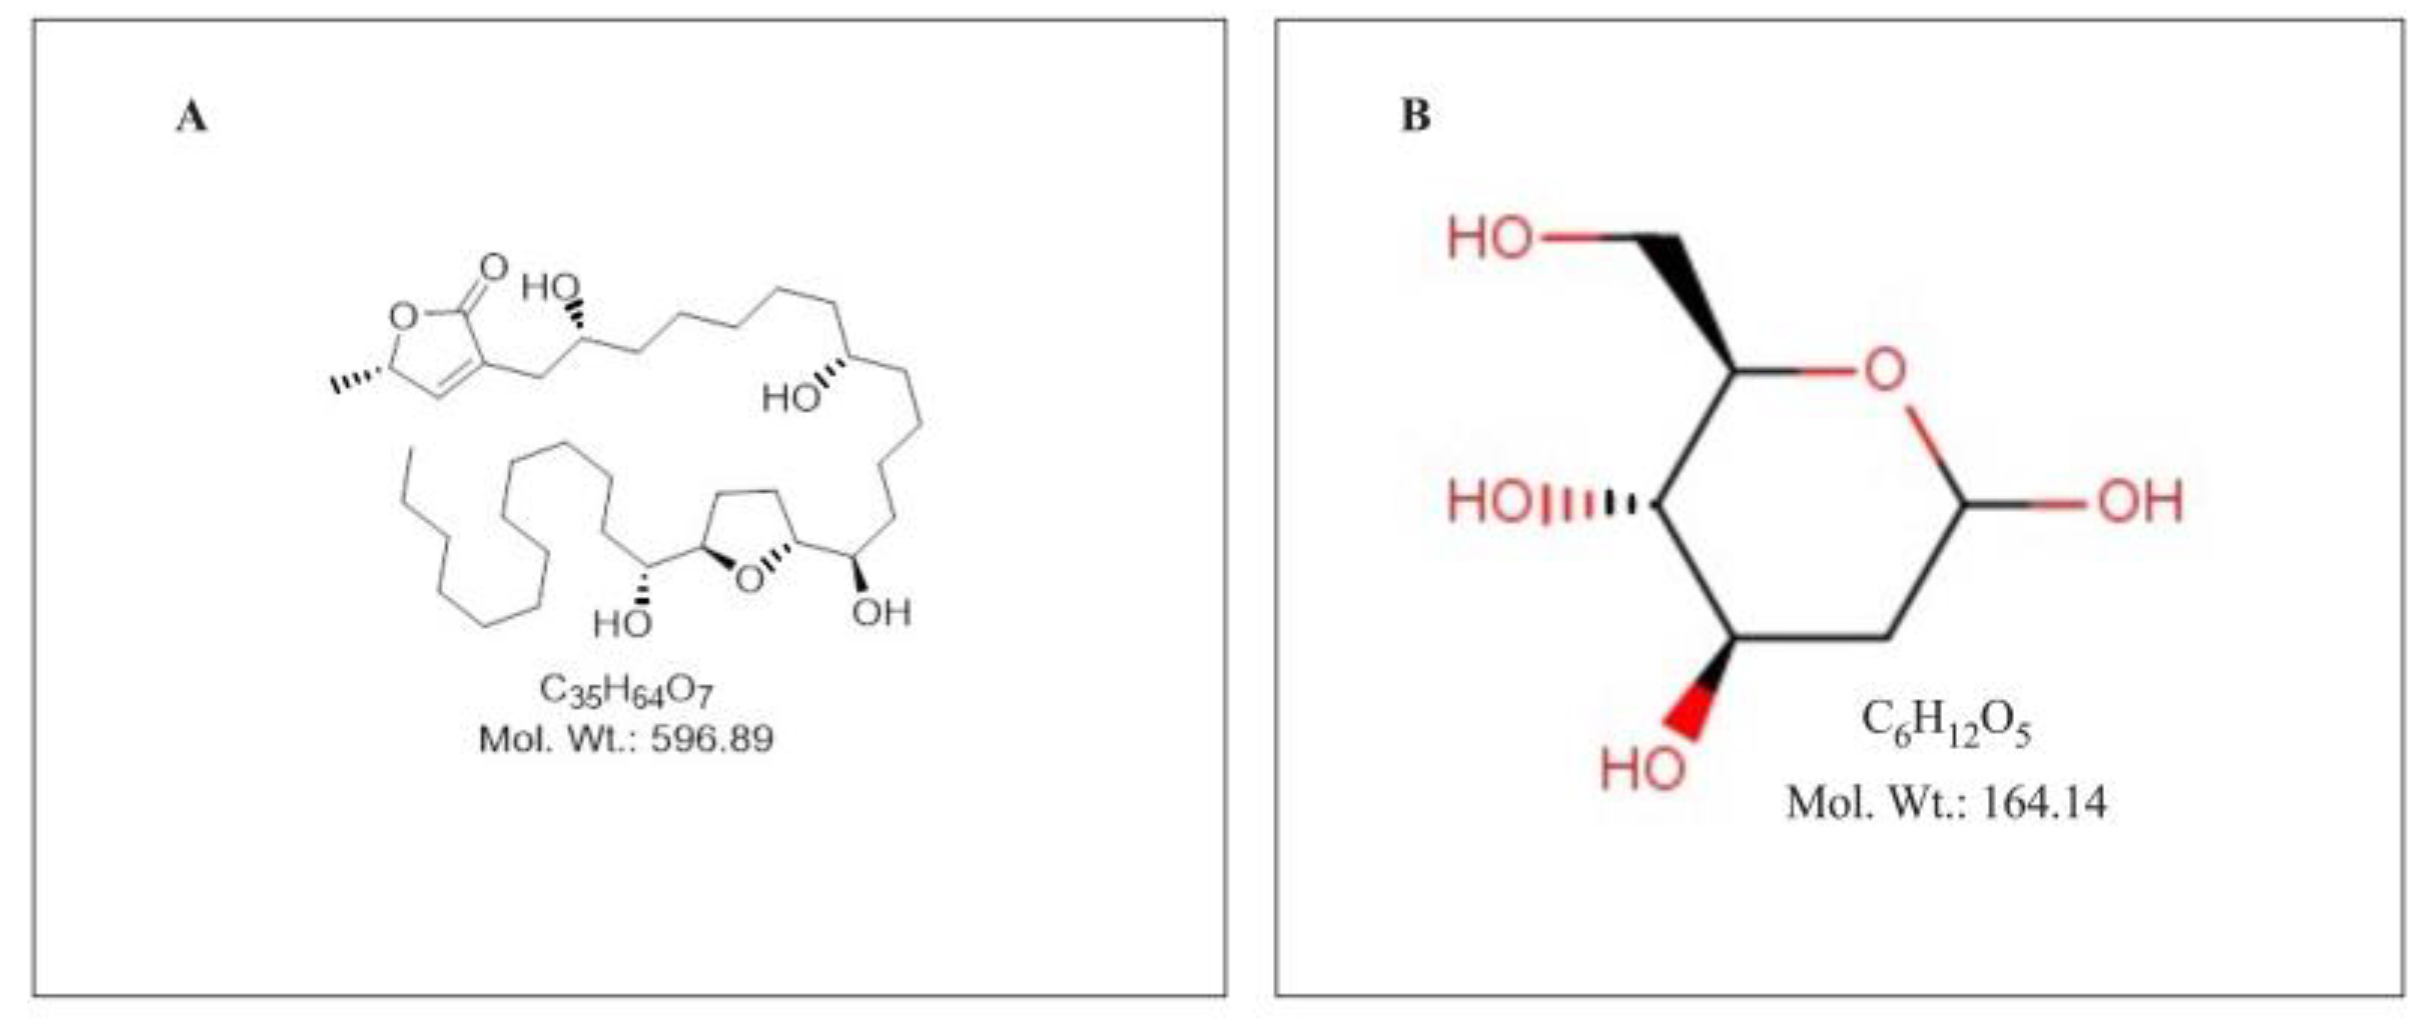
Figure 2.
The effects of varying concentration of individual and combination application of Annonacin and 2-DG on A549 and NL20 cell viability. Effects with varying concentration of Annonacin (0, 1, 2, 4 & 6 μM) (A). Effects of varying concentration of 2-DG (0, 1.25, 2.5, 5 & 7.5 mM) on A549 and NL20 cell viability (B). Effects of combination application of Annonacin and 2-DG on A549 cell viability (C). Effects of combination application of Annonacin and 2-DG on NL20 cell viability (D). Experiments were conducted in triplicate with control and bars represent mean SEM (n=3). Different letters above the bars indicate statistically significant differences (α ≤ 0.05) determined by the two-way ANOVA followed by Tukey’s multiple comparison test.
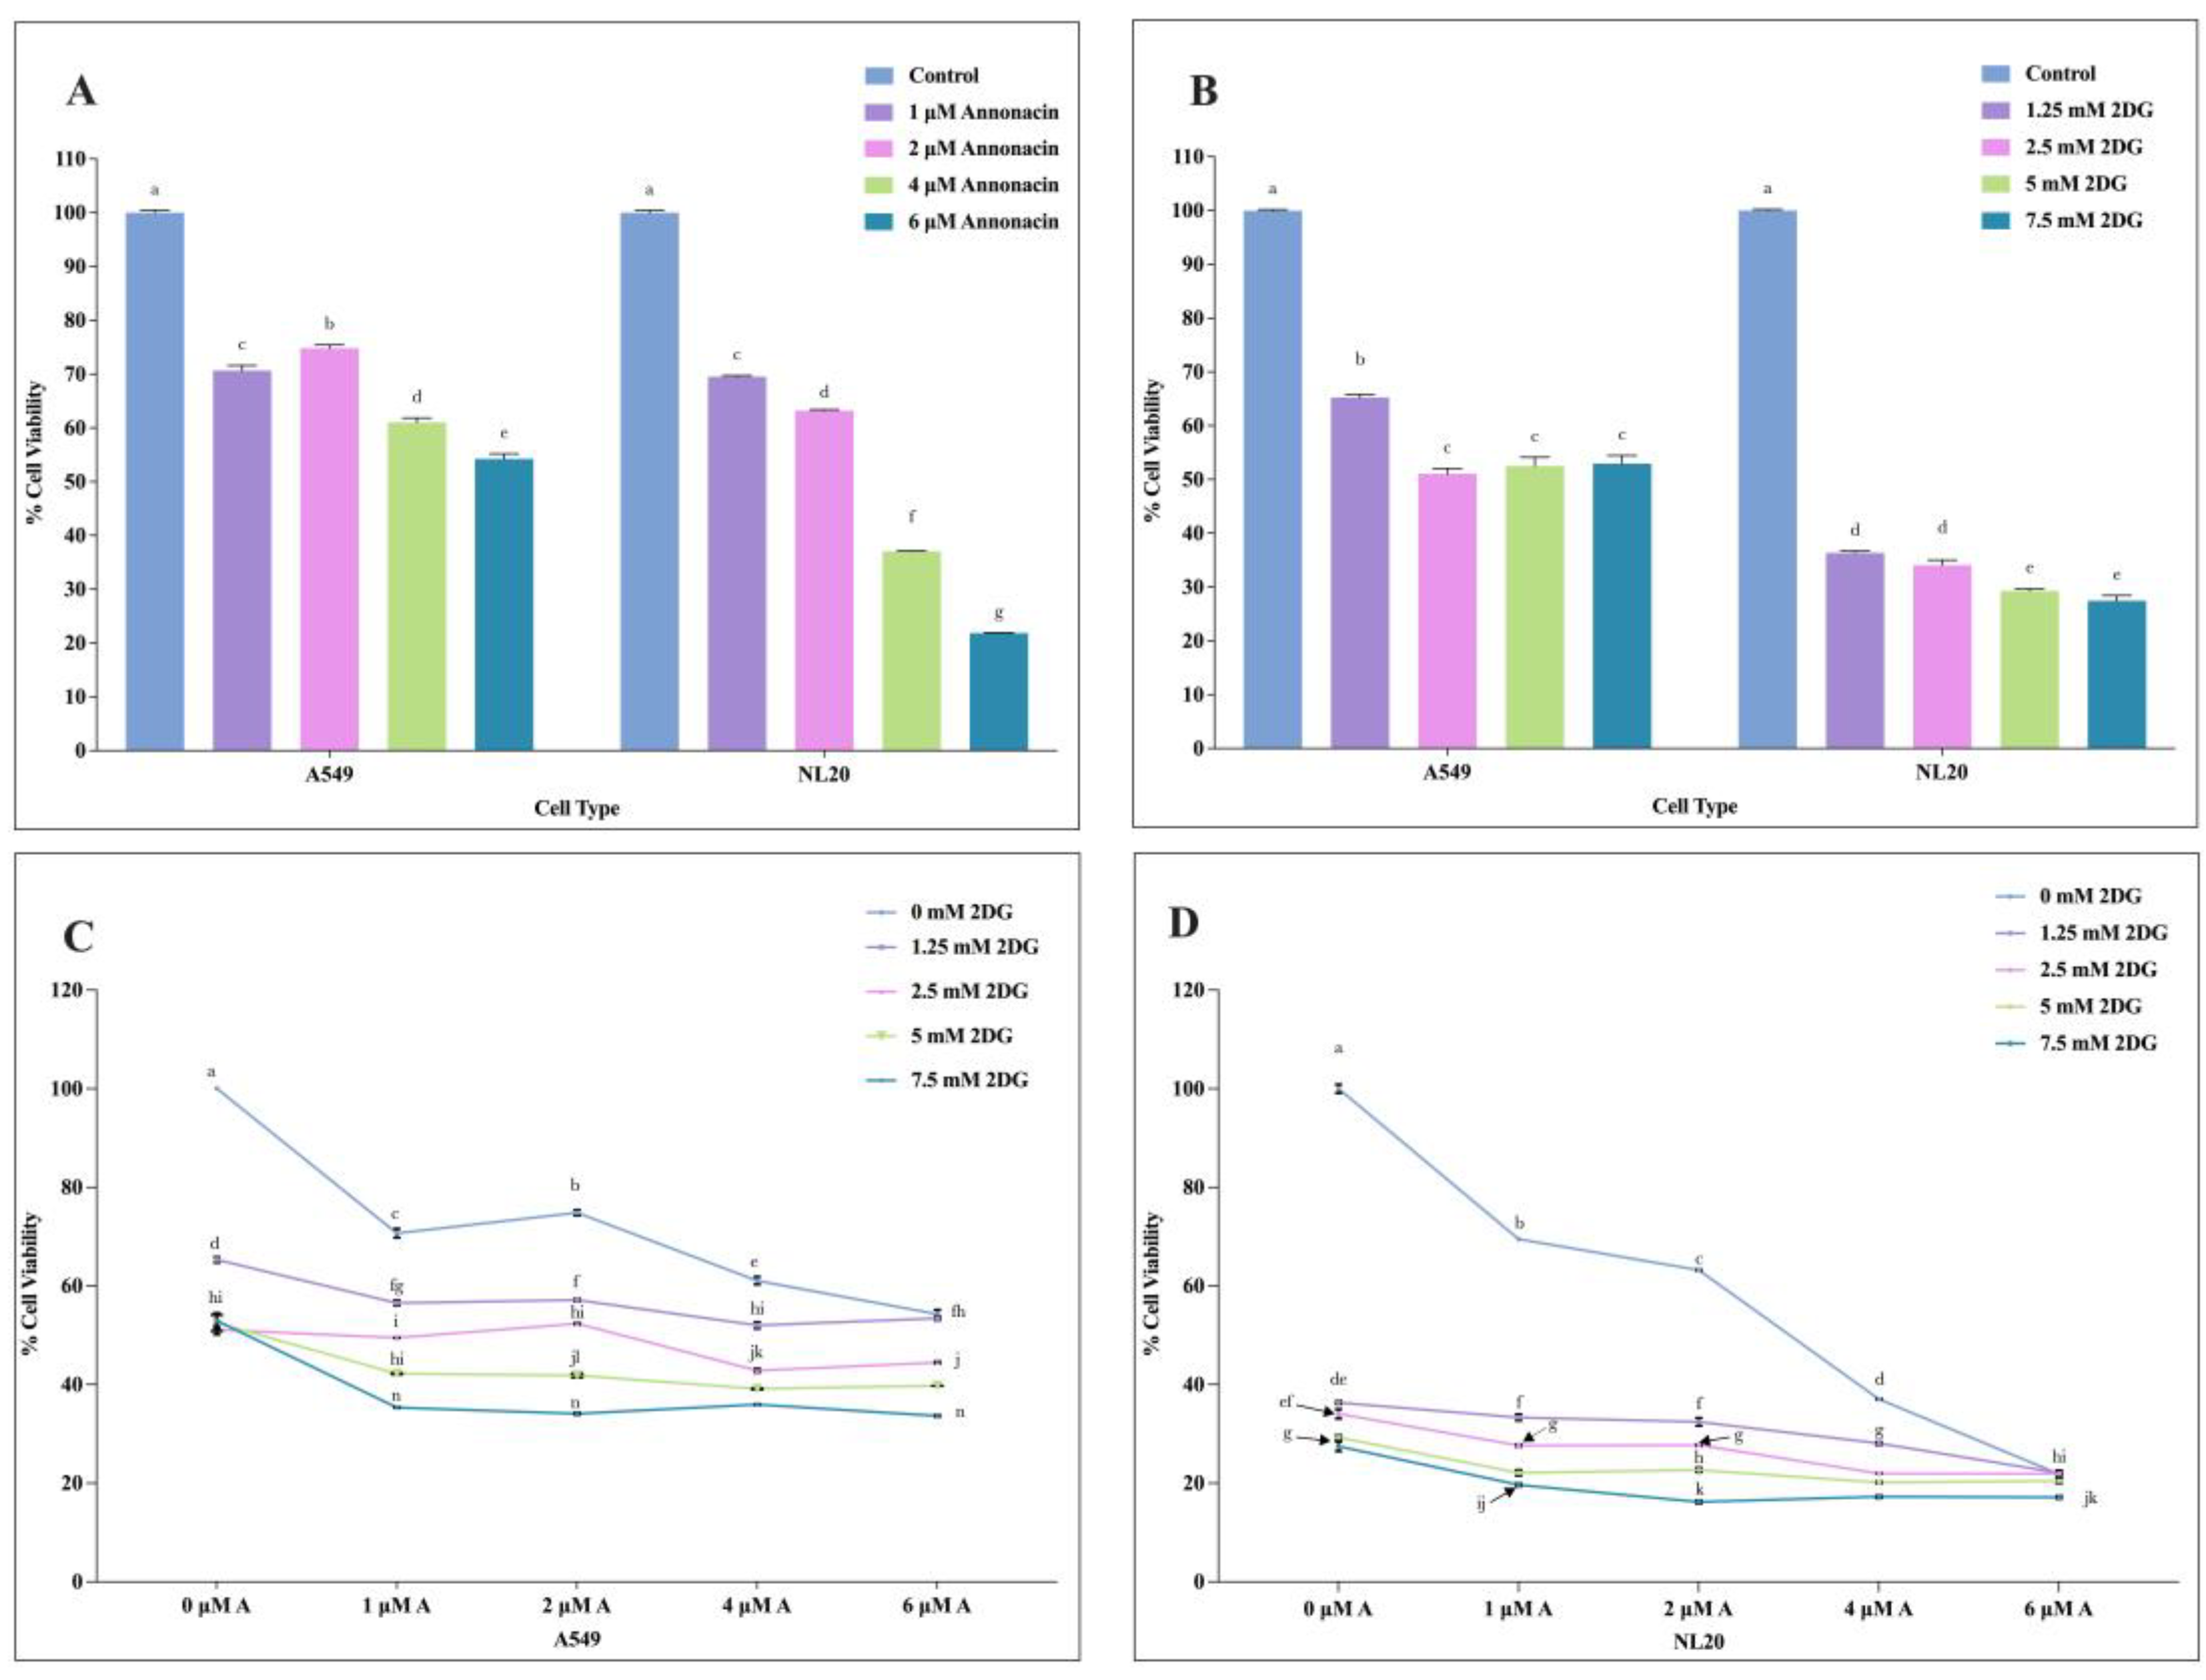
Figure 3.
A heat map showing synergistic scores of interaction effect of Annonacin (0, 1, 2, 4 & 6 μM) (A) and 2-DG (0, 1.25, 2.5, 5 & 7.5 mM) on A549 (A) and NL20 (B)with Loewe additivity model. Experiments were conducted in triplicate with control and bars represent mean SEM (n=3). Different letters above the bars indicate statistically significant differences (α < 0.05) determined by the two-way ANOVA followed by Tukey’s multiple comparison test.
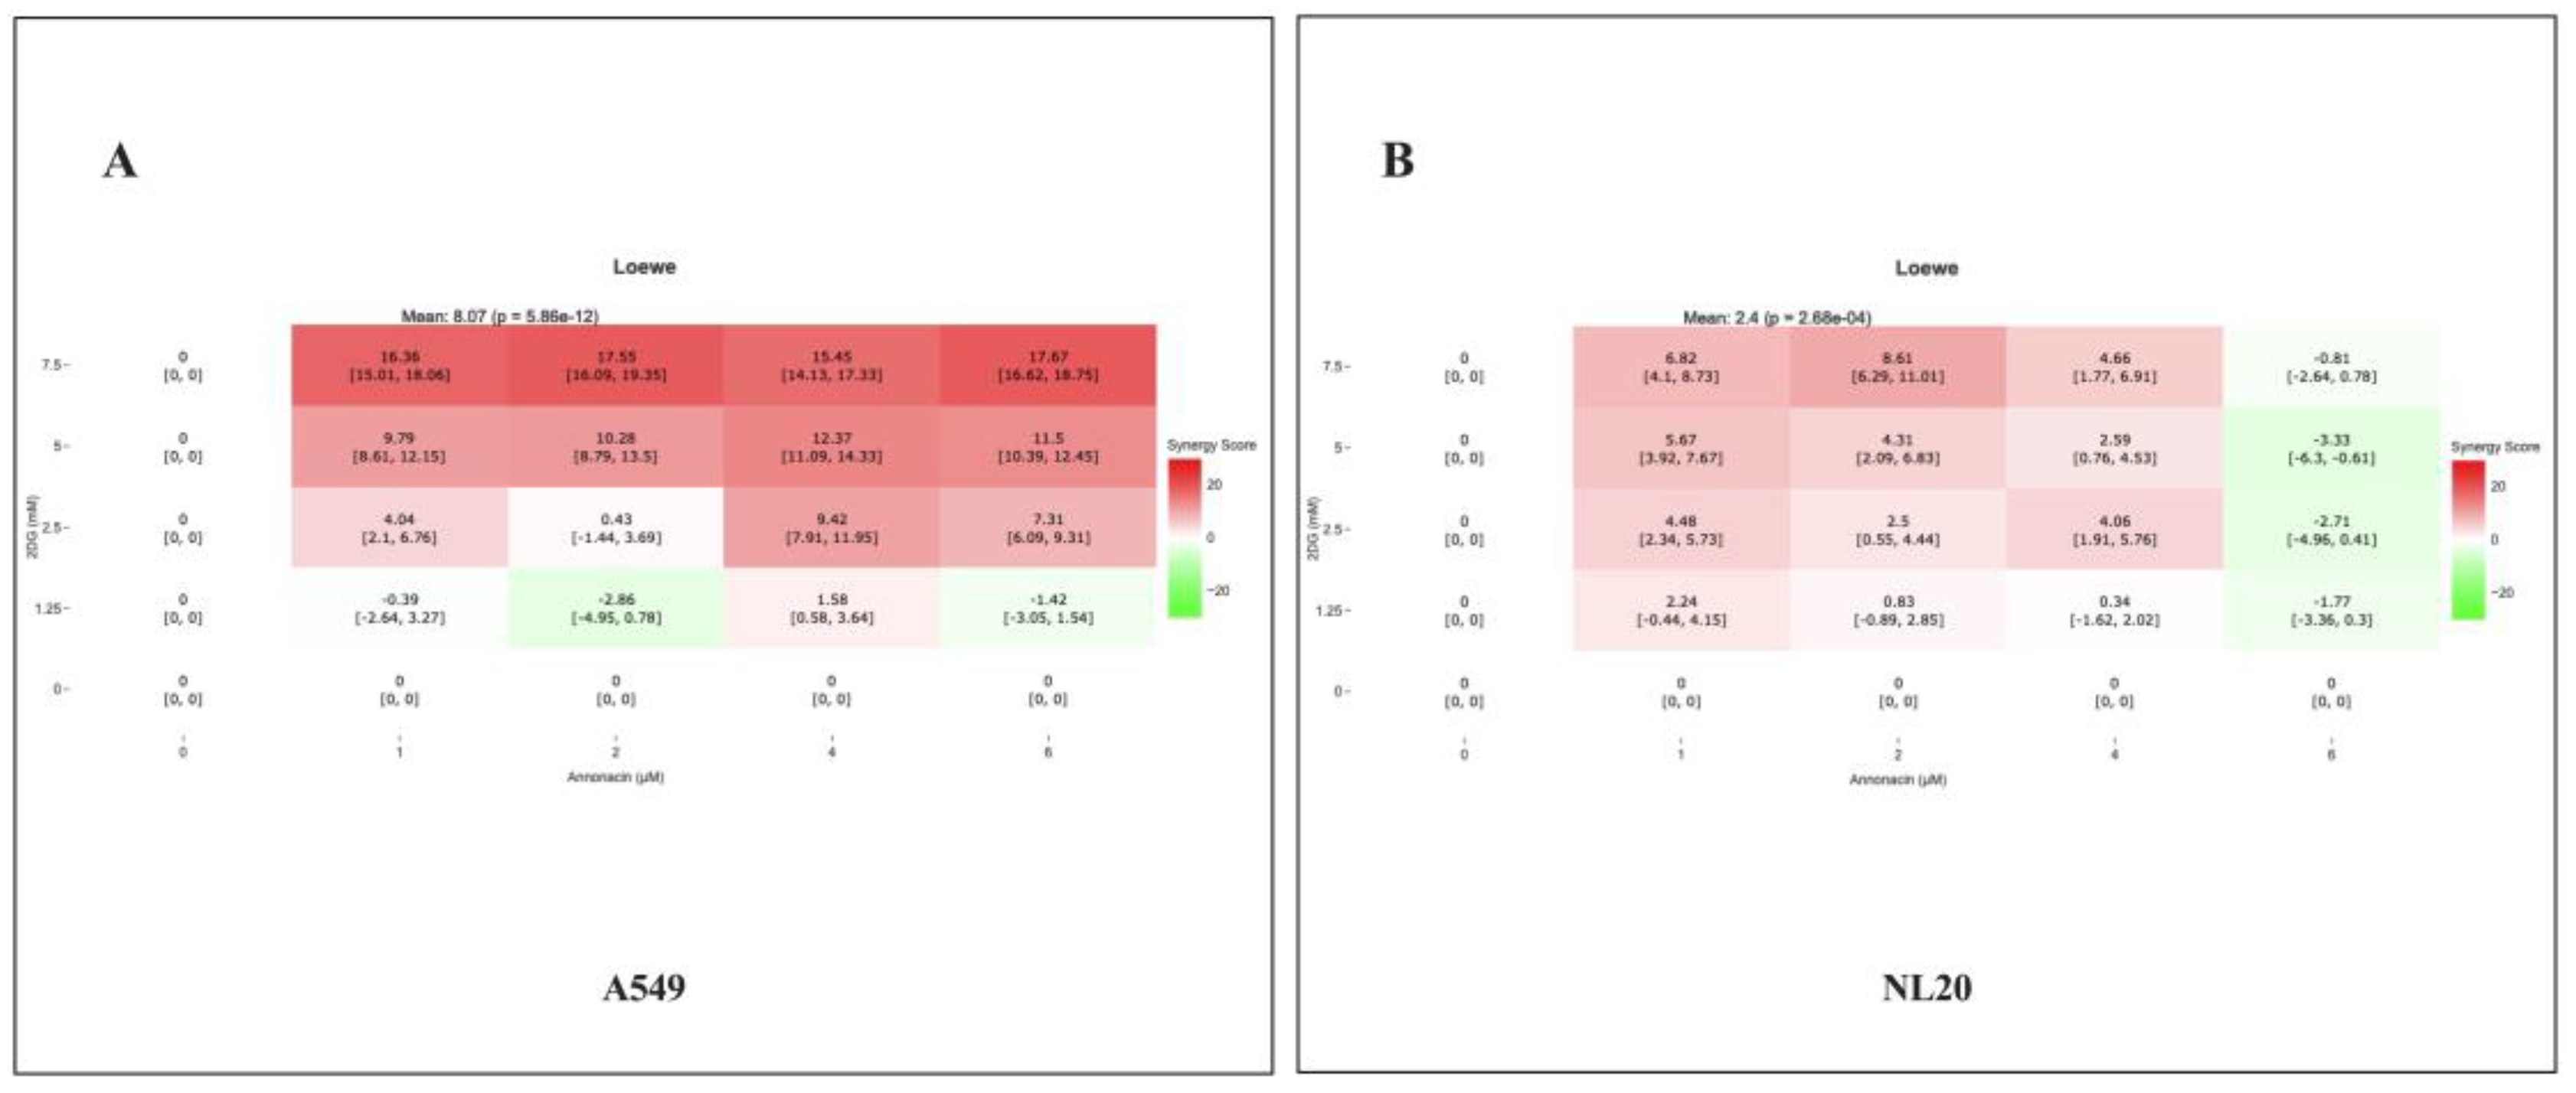
Figure 4.
The effects of varying concentration of individual and combination application of Annonacin (0, 1, 2, 4 & 6 μM) and 2-DG (0, 1.25, 2.5, 5 & 7.5 mM) on A549 proliferation capacity (A). A heat map showing synergistic scores of interaction effect of Annonacin and 2-DG with Loewe additivity model (B). Experiments were conducted in triplicate with control and bars represent mean SEM (n=3). Different letters above the bars indicate statistically significant differences (α ≤ 0.05) determined by the two-way ANOVA followed by Tukey’s multiple comparison test.
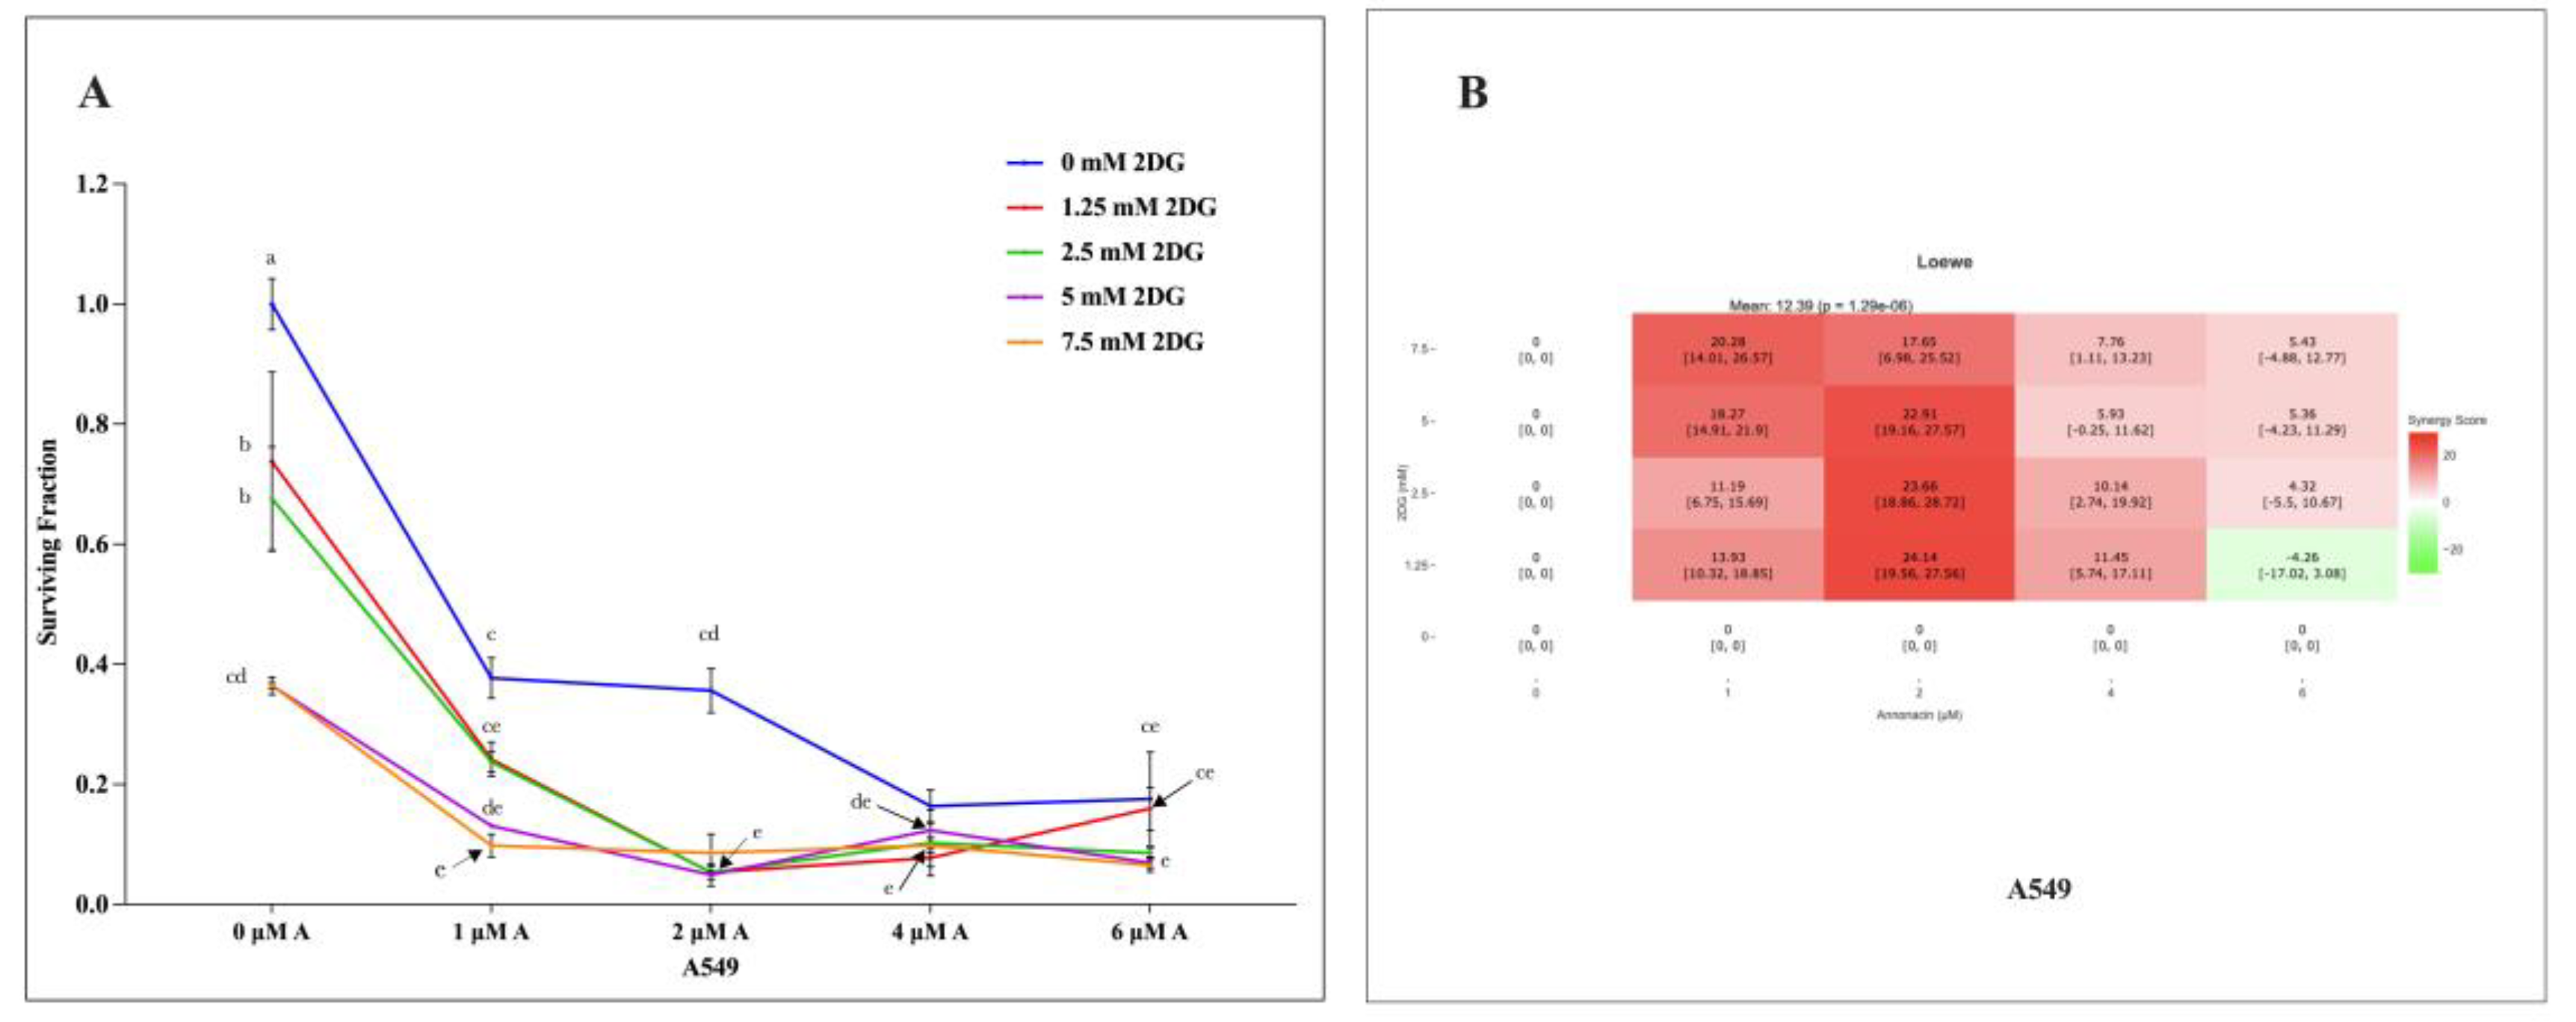
Figure 5.
The effects of varying concentration of individual and combination application of Annonacin and 2-DG on A549 and NL20 SOD activity. Effects with varying concentration of Annonacin (0, 1, 2, 4 & 6 μM) (A). Effects of varying concentration of 2-DG (0, 1.25, 2.5, 5 & 7.5 mM) on A549 and NL20 SOD activity (B). Effects of combination application of Annonacin and 2-DG on A549 SOD activity (C). Effects of combination application of Annonacin and 2-DG on NL20 SOD activity (D). Experiments were conducted in triplicate with control and bars represent mean SEM (n=3). Different letters above the bars indicate statistically significant differences (α ≤ 0.05) determined by the two-way ANOVA followed by Tukey’s multiple comparison test.
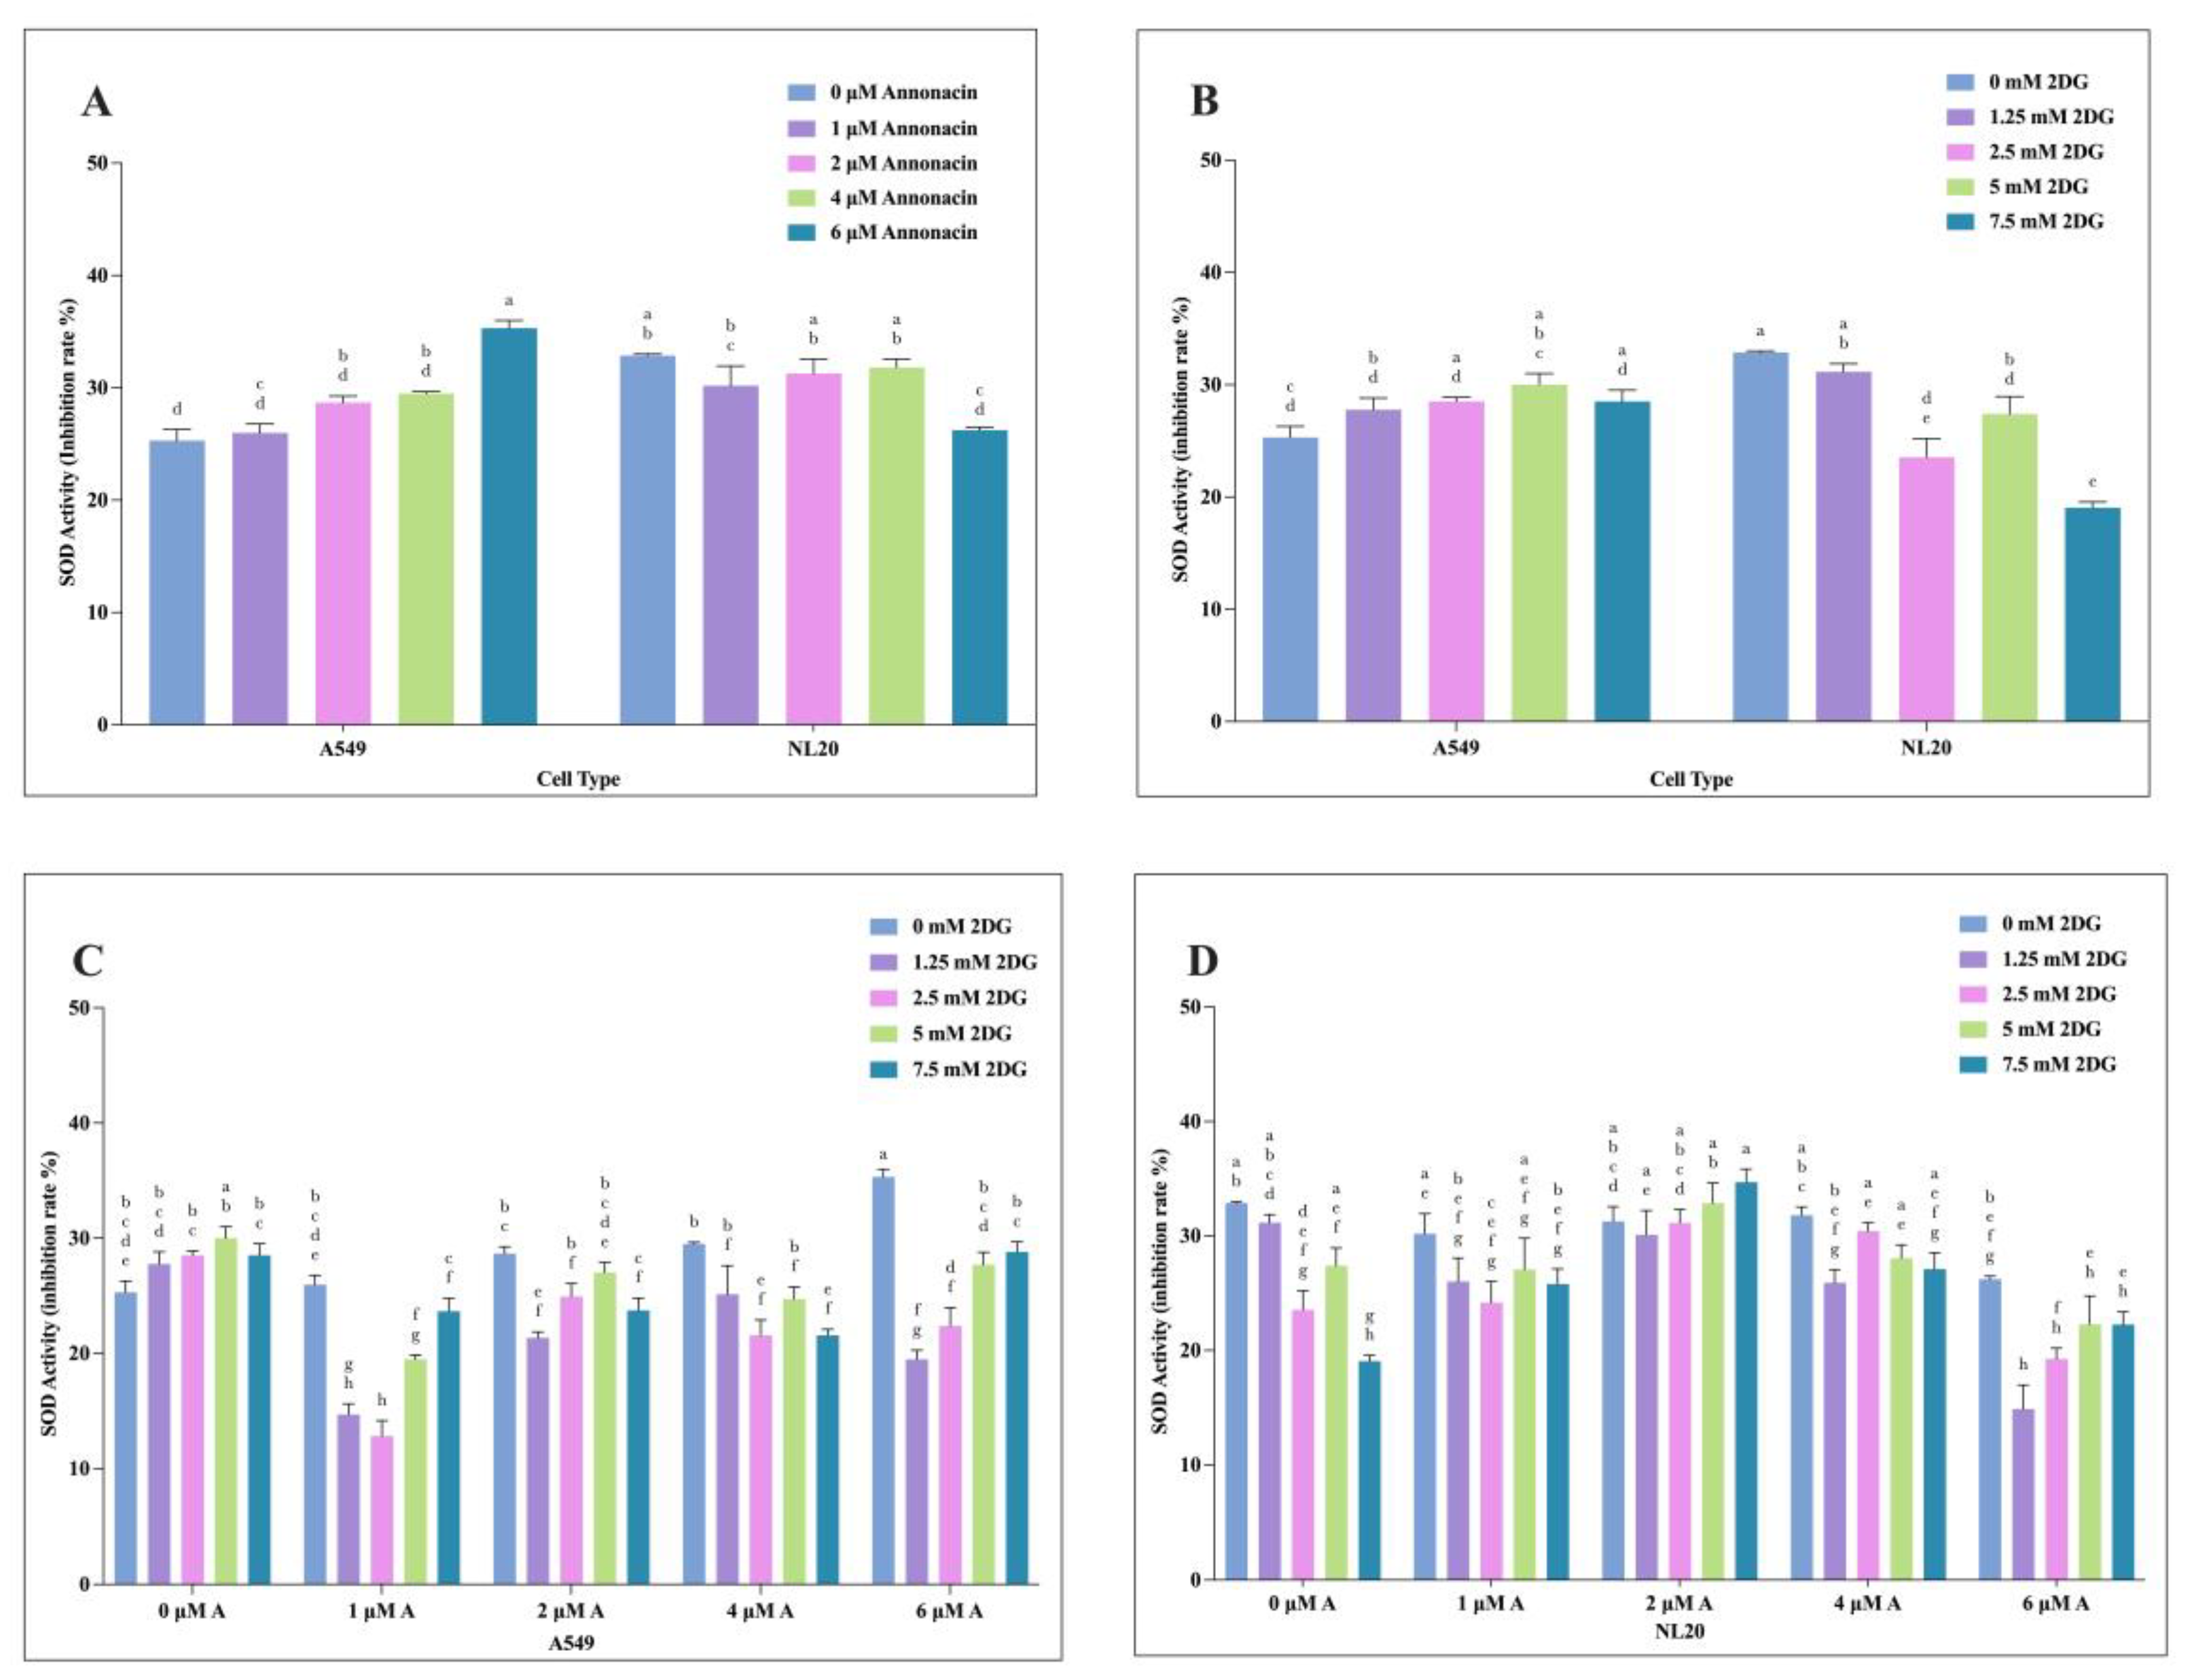
Figure 6.
The effects of varying concentration of individual and combination application of Annonacin and 2-DG on A549 and NL20 GPx activity. Effects with varying concentration of Annonacin (0, 1, 2, 4 & 6 μM) on A549 and NL20 GPx activity (A). Effects with varying concentration of 2-DG (0, 1.25, 2.5, 5 & 7.5 mM) on A549 and NL20 GPx activity (B). Effects of combination application of Annonacin and 2-DG on A549 GPx activity (C). Effects of combination application of Annonacin and 2-DG on NL20 GPx activity (D). Experiments were conducted in triplicate with control and bars represent mean SEM (n=3). Different letters above the bars indicate statistically significant differences (α ≤ 0.05) determined by the two-way ANOVA followed by Tukey’s multiple comparison test.
Disclaimer/Publisher’s Note: The statements, opinions and data contained in all publications are solely those of the individual author(s) and contributor(s) and not of MDPI and/or the editor(s). MDPI and/or the editor(s) disclaim responsibility for any injury to people or property resulting from any ideas, methods, instructions or products referred to in the content. |
© 2025 by the authors. Licensee MDPI, Basel, Switzerland. This article is an open access article distributed under the terms and conditions of the Creative Commons Attribution (CC BY) license (https://creativecommons.org/licenses/by/4.0/).
Copyright: This open access article is published under a Creative Commons CC BY 4.0 license, which permit the free download, distribution, and reuse, provided that the author and preprint are cited in any reuse.


