
Submitted:
07 July 2025
Posted:
08 July 2025
You are already at the latest version
Abstract
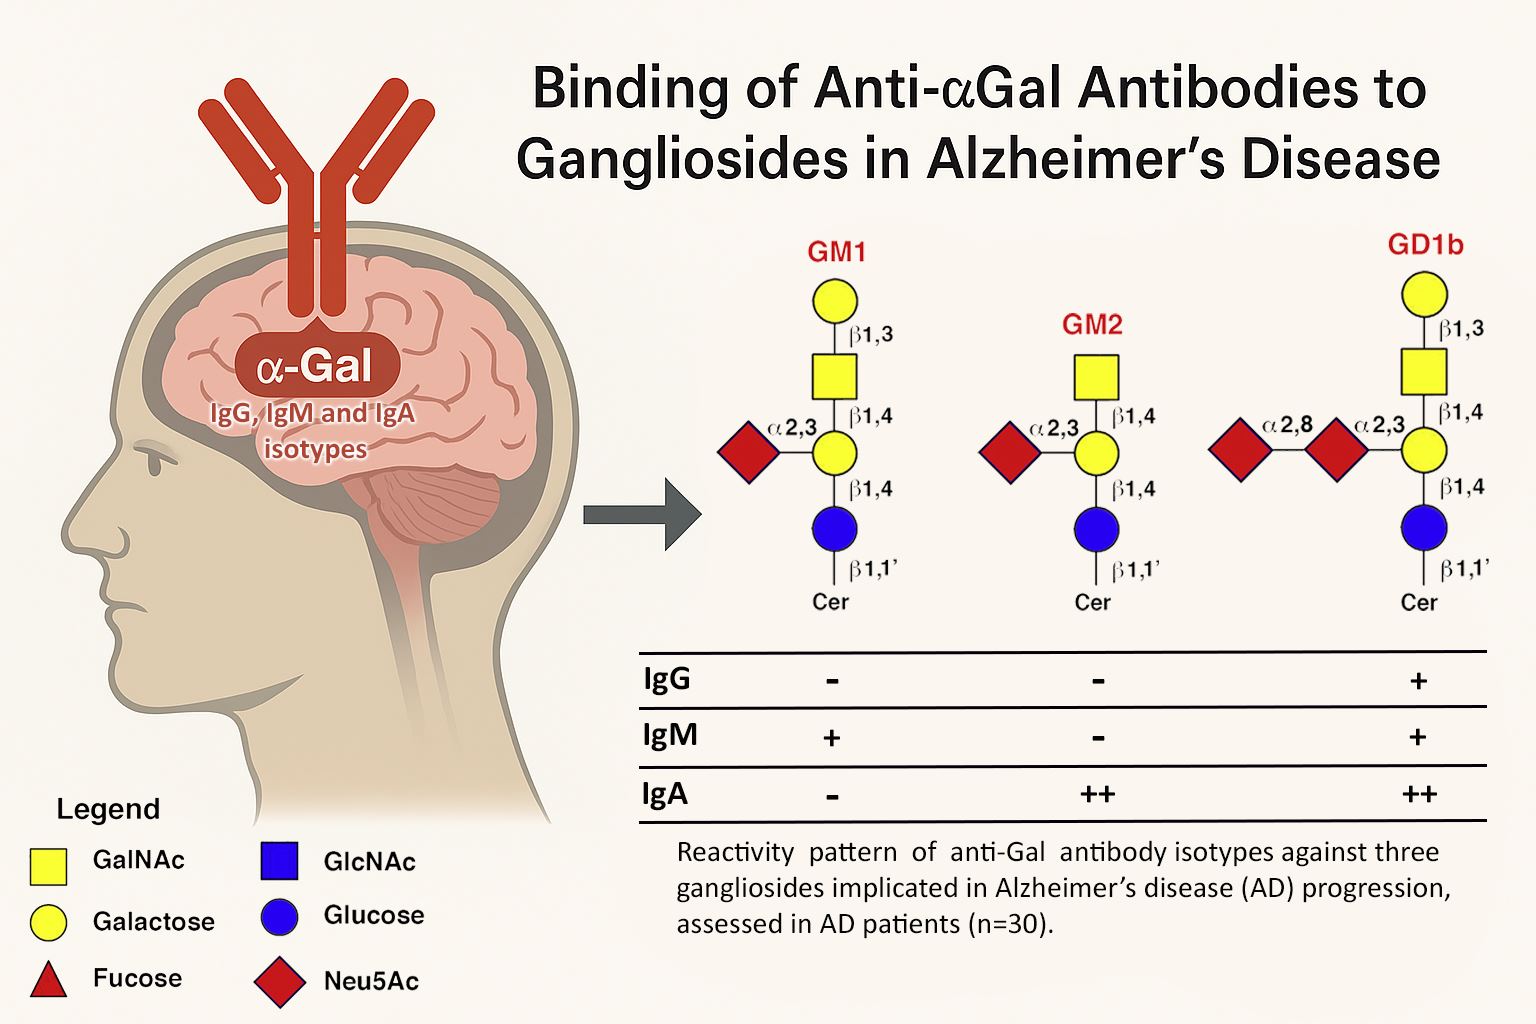
Anti-αGal antibodies, known for their polyreactivity, have been detected bound to gray matter in the brains of Alzheimer's disease (AD) patients. This study explored their potential interaction with gangliosides (GLSs), αGal-like structures abundant in the central nervous system. Using ELISA, serum profiles of anti-αGal antibody isotypes and their binding to various GLSs were analyzed in healthy subjects and AD patients. Results showed a decreased expression of anti-αGa IgG and IgM in AD patients compared to healthy controls, while IgA levels were elevated. Notably, none of the isotypes in healthy subjects exhibited GLS binding. In contrast, all isotypes in AD patients bound to ganglioside GD1b; additionally, IgM recognized GM1, and IgA targeted GM2. These findings suggest a disease-specific binding pattern of anti-αGal antibodies to gangliosides in the AD brain, supporting their potential role as diagnostic biomarkers.
Keywords:
αGal
; gangliosides
; neuroinflammation
; Alzheimer’s biomarker
; antibody pattern
; diagnostic tool
* The authors share the first position.
§ The authors share the last position.
1. Introduction
Alzheimer's disease (AD) remains one of the most pressing challenges in contemporary neuroscience and clinical medicine. As the aging global population continues to grow, the prevalence of AD has surged, exerting a profound socioeconomic burden and highlighting the urgency for a deeper understanding of its underlying mechanisms.
Historically, AD was primarily conceptualized as a proteinopathy, with amyloid-beta (Aβ) and tau aggregates as the principal culprits driving neuronal dysfunction and degeneration [1]. While these proteinaceous entities undoubtedly play a pivotal role in pathogenesis, mounting evidence supports the notion that neuroinflammation constitutes a fundamental component of the disease process, beginning to unravel the intriguing connection between the immune system and AD [2]. Microglial activation, astrocyte dysfunction, and the release of pro-inflammatory cytokines within the central nervous system (CNS) have been observed in post-mortem AD brains and experimental models, contributing to neuronal damage and exacerbating the clinical manifestations of the disease [3].
Of particular interest is the presence of antibodies (Abs) related to AD within the CNS, suggesting an active immune response to disease-related antigens. The origin, specificity, and functional implications of these Abs remain topics of active investigation. As reported in the literature, these antibodies may represent a natural immune response to the aberrant accumulation of Aβ or tau, while others have raised the possibility of immunotherapeutic approaches for AD treatment [4]. Other studies focused on the role of gut microbiota in the development and progression of the disease, connecting dots from flora bacteria, neuroinflammation, and high permeability of the blood-brain barrier (BBB) [2].
The αGal epitope (Galα1-3Galβ1-4GlcNAc-R) is a sugar moiety attached to the terminal part of glycoproteins and glycolipids present on the surface of various microorganisms and in all mammals except for Old World monkeys, apes, and humans. This epitope is generated by the α1,3-galactosyltransferase (α1,3GT) encoded by the Ggta1 genes. In humans, this gene went through mutations during evolution, which resulted in its silencing, starting to develop antibodies direct to the αGal epitope (about 1-3% of the circulating Abs are represented by anti-αGal immunoglobulins, mainly IgG, IgM, and IgA classes). The presence of this antibody pool against αGal is given by chronic exposure of the epitope by gut flora bacteria to the immune system, and it has been a positive factor in the evolution of the human species since it acts as a defence against pathogens expressing αGal [5,6].
Noteworthy, the αGal epitope and its associated Abs are implicated in other occurrences: they are responsible for the acute/hyperacute rejection process of transplantation of tissues and organs derived from animals, they can act as an adjuvant by enhancing the immune reactivity of vaccines, and they can be involved in various diseases including auto-immune and neurodegenerative ones leading to an inflammation state responsible for the alteration of the BBB permeability. Anti-αGal Abs have been found attached to grey matter in the brain of AD patients and in the cerebrospinal fluid (CSF) in people affected by multiple sclerosis, Guillan-Barrè syndrome (GBS), and meningitis [7-9]. As already been described, the anti-αGal Abs are polyreactive and possess a broad-spectrum activity [10], so they can probably bind to αGal-like structures present in the human body. In particular, the gangliosides (GLS) of the human brain can resemble or contain glycolipid structures with a high similarity to the αGal epitope.
This study wants to probe the hypothesis that an altered profile of anti-αGal Abs of different isotypes (IgM, IgG, and IgA) in the serum of AD patients, already found in previous work [11], could be correlated with specific reactivity to different GLSs as evaluated in the serum of 30 AD patients and 30 healthy subjects (HS) through the use of a specific ELISA test (Enzyme Linked Immunosorbent Assay).
2. Results
Considering the total expression of the different anti-Gal Abs isotypes, the previously reported findings are further confirmed [12]. There is a lower production of circulating antibodies of the IgG and IgM type in subjects affected by Alzheimer's compared to HS; conversely, the IgA isotypes are more expressed in AD patients (Figure 1, gray bars).
Regarding the ability of the various anti-αGal Abs isotypes to recognize and bind the three varieties of GLSs (GM1, GM2, and GD1b), a significant difference was found between HS and those affected by AD.
Noteworthy, in HS, none of the considered isotypes can interact with the GLSs (Figure 1, H bars), confirming the specificity and selectivity of anti-αGal Abs for their ligand in non-pathological conditions. Differently, in subjects affected by the disease, there was a significant decrease in IgG Abs on the plate following incubation with the GD1b ganglioside (Figure 1, orange bar). Specifically, 23.5% of IgG was capable of recognizing and binding to the GD1b ganglioside (Figure 2-A).
Such affinity for GLSs becomes even more evident for the IgM and IgA isotypes. IgM exhibited the ability to bind both to the GM1 (Figure 1, green bar) and the GD1b (Figure 1, orange bar) ganglioside (18.9% and 20.04% of the total circulating IgM respectively as detailed in Figure 2-B), and IgA exhibited a comparable affinity for both GM2 (Figure 1, blue bar) and GD1b (Figure 1, orange bar) gangliosides (26.4% and 28.1% of the total circulating IgA respectively as highlighted in Figure 2-C).
Finally, in addition to the fact that all isotypes of Alzheimer's patients have a similar affinity for the GD1b ganglioside, a clear pattern can be seen in which anti-αGal IgM recognizes GM1 and IgA GM2. (Table 1).
3. Discussion
As our understanding of AD continues to evolve, the intricate interplay between various molecular factors and lipid components of neuronal membranes has come to the forefront. Among these lipids, gangliosides, a class of complex glycosphingolipids, have recently emerged as pivotal players in the pathophysiology of AD. GLSs are particularly enriched in the CNS, where they constitute a substantial proportion of the neuronal plasma membrane lipids [13]. Structurally, GLSs are characterized by their sialic acid residues at the distal end of their carbohydrate chains, setting them apart from other glycolipids (Figure 3).
This distinctive feature renders GLSs amphipathic molecules, making them essential for the formation and stabilization of lipid rafts and membrane microdomains and crucial for neuronal signalling and synaptic function, and able to play multifaceted roles in brain development, function, and disease [14]. During brain development, GLSs play pivotal roles in neuronal migration, axon guidance, and synaptogenesis. They have also garnered attention for their neuroprotective properties, as they can act as receptors for neurotrophic factors and participate in neuroinflammatory responses. AsialoGM1 (GA1) was able, unlike GT1b, to bind specifically to Aβ peptides, in a manner that prevented β-sheet formation [15]. On the other hand, data from various knockout mice models pointed to a neuroprotective role for 0-series gangliosides (Figure 3, panel C), such as GM1b and a-series gangliosides, such as GM1 and GD1a, with some contribution by b-series gangliosides such as GD1b [16,17]. Furthermore, aberrant GLSs metabolism has been implicated in various neurodegenerative diseases, including AD, Parkinson's disease, and lysosomal storage disorders [18]. In AD, the intricate balance of GLSs in the brain appears to be disrupted with profound implications for synaptic function, membrane stability, and neuroinflammatory responses. Amyloid pore channel formation in neuronal plasma membrane, a key step in neurodegeneration, appears to be GLS-dependent. GLS-deprived neural cells did not undergo amyloid pore channel formation induced by either Aβ1-42 peptide or α-synuclein, as assessed by single-cell Ca2+ fluorescence microscopy [19]. Understanding the role of GLSs in these processes is essential for unraveling the complex pathophysiology of AD [20]. Many studies have correlated the abnormal development and progression of the inflammatory state in AD with an increase in the amount of a-series GLSs (GM1 and GM2, Figure 3). The brains of patients with AD reported a high level of a-series GLSs in both frontal and parietal cortices, which may coincide with accelerated lysosomal degradation of GLSs and/or reactive astrogliosis occurring during neuronal death [21]. Moreover, gangliosides GM1 and GM2 have been shown to accumulate in the lipid rafts of AD brains [22]. If a-series GLSs are increased in AD, b-series GLSs (Figure 3) show a decrease in most brain regions, following a pattern that correlates with the age of AD onset. Among them, GD1b exhibits the most significant reduction [20].
Chapman et al. [23] examined neuronal degeneration in AD, reporting a significant presence of anti-GLSs Abs. Increased anti-GM1 antibody concentrations were detected in 82% of 33 demented patients, with a male-to-female ratio of 1:2.7 and a mean age of 70, with the most severely demented patients having the most increased levels of anti-GM1 Abs (>40 EU/mL) [24]. It was further demonstrated that anti-GD1 Abs severely inhibited axonal regeneration after peripheral nervous system injury in mice [25]. In addition, anti-ganglioside Abs have been described in the sera of patients with peripheral neuropathy and several immune-mediated neurological diseases [26,27].
In this multifaceted context, this study highlights for the first time an unusual feature of anti-αGal Abs in AD patients. In fact, in HS, no anti-αGal Abs were able to recognize GLSs (Figure 1). Conversely, AD patients developed a specific antibody pattern that was different for the various Abs isotypes, which reacted differentially with different GLSs as summarized in Table 1.
To gain some insight into the structural determinants of the cross-reactivity between the α1-3Gal epitope and brain GLSs, it was helpful to examine the detailed characterization done by Galili et al. of Gal-13, a mouse monoclonal antibody recognizing several neutral glycosphingolipids from rabbit and bovine erythrocytes [28]. Gal-13 has linear and branched polylactosamine structures that carry non-reducing terminal Galα1-3Gal epitopes, like ceramide pentahexoside (Figure 3, panel A), but it does not bind to the human blood group B glycolipid, suggesting that binding is impeded by branching at the penultimate galactose (Figure 3, panel B). However, Gal-13 recognized the de-fucosylated derivative of group B glycolipid. Other Galα1-3Gal glycosphingolipids with a globoside or isogloboside core, such as GB3 (ceramide trihexoside) and iGB3, respectively (Figure 3, panel A), were not recognized by Gal-13, suggesting that Gal-13 could bind to a α1-3Gal epitope carried by N-acetylated residues, but not a lactose core structure [28]. However, even though the full α1-3Gal epitope is generally considered to be the trisaccharide Galα1-3Galβ1-4GlcNAc, it was shown that certain anti-αGal antibodies could recognize the Galα1-3Gal disaccharide. It was reported that αGal-specific IgE in the sera of five αGal-allergic, mammalian meat-allergic subjects were bound by CD1d monomers complexed with Galα1-3Gal-containing iGB3 and, to a lesser extent, by CD1d monomers complexed with Galα1-4Gal-containing GB3, but not by uncomplexed CD1d. Neither iGB3 nor GB3 binding was observed with control sera devoid of αGal serum IgE [29].
Thus, of the structural differences that distinguish αGal epitope-containing neutral glycolipids from brain GLSs (Figure 3, panel C), the presence of a lactose, instead of a lactosamine core, may not necessarily hinder the binding of all anti-αGal Abs. The antibodies detected in this study appeared to act like bi-specific, cross-reactive antibodies recognizing a very delimited epitope of gangliosides (e.g., of the LacCer kind) which was shared with αGal-HSA, and whose recognition was not hindered by the presence of N-acetylneuraminic and N-acetylgalactosamine. Conceivably, in AD patients in vivo, the accessibility of N-acetylneuraminic acid residues linked to galactose might be hindered by the interaction of GLSs with Aβ peptides. GM1-bound A was found in post-mortem AD and Down syndrome brains, where it was supposedly a seed for Aβ aggregation [30]. Unilamellar vesicles containing GM1 increased the rate of Aβ fibril formation in vitro [31-33]. The isolated GM1 pentasaccharide did not bind to Aβ, possibly because the interaction of GM1 with Aβ required GLS clustering, as it occurs in micelles or lipid rafts of cell plasma membranes [34]. The binding to Aβ and amyloid fibril formation in vitro was confirmed with GM1 and other GLSs, such as GM2, GD1a, GD1b, and GT1b, depending on the Aβ variant used [40]. Notably, GLSs bearing more sialic acid residues displayed higher affinity for Aβ [30,36]. This is in keeping with the more extensive binding to GD1b, compared to GM1 and GM2, by anti-αGal antibodies of the IgG, IgM, and IgA isotypes that we observed. Interactions between GLSs and Aβ may also obscure other differences between GLSs and the α1-3Gal epitope, i.e., both the additional N-acetylgalactosamine residue which is located between the inner and the outer galactose in GA1, GM1, GD1a, and GD1b, and occupies the outermost position in GM2 (Figure 3), and the β anomery of the glycosidic linkage with the terminal galactose residue at the reducing end.
It might be interesting to evaluate whether the decrease in b-series GLSs bears any relationship with the widespread attack by multiple anti-Gal immunoglobulin isotypes in AD patients, as found for the GD1b ganglioside. Also, the increase in a-series GLSs (GM1 and GM2) could act towards the immune system of AD patients as a pro-inflammatory stimulus that may trigger the binding of IgM and IgA and activate the production of antibodies. In any case, the ability to react with different types of GLSs could explain the variety of targets of the anti-Gal Abs, which have been detected in the amyloid plaques, neurofibrillary tangles, and corpora amylacea of patients with dementia, including AD [37].
4. Materials and Methods
4.1. Patients and healthy controls
The participants in the study (n. = 60) were consecutively recruited at the Centre for Research and Training in Medicine of Aging (CeRMA) of the University of Molise (Italy). The AD patients (n. = 30) fulfilled the National Institute of Aging and Alzheimer's Association (NIA-AA) diagnostic criteria for "probable AD with documented decline" [38]. They scored < 24 on the Mini Mental State Examination (MMSE) and > 0.5 on the Clinical Dementia Rating (CDR). To rule out other potential causes of cognitive impairment, all patients underwent blood tests (including full blood count, erythrocyte sedimentation rate, urea and electrolytes, thyroid function, vitamin B12, and folate) and brain imaging. Thirty sex/age-matched cognitively HS were recruited as a control group. Since anti-Gal levels can be altered in the context of different pathologies and treatments, subjects with pathologies, such as rheumatoid arthritis, interstitial cystitis, eosinophilic esophagitis [39], Henoch-Schönlein purpura, IgA nephropathy, Crohn's disease and ulcerative colitis [40], or treated with anticancer such as Cetuximab (or Erbitux) [41], animal derived tissue patches, cartilaginous grafts or bioprostheses such as biological heart valves [42], were excluded. The clinical and demographic characteristics of the two groups of participants are summarized in Table 2.
The study was conducted in accordance with ethical principles stated in the Declaration of Helsinki and with approved national and international guidelines for human research. The Institutional Review Board (IRB) of the University of Molise approved the study (IRB Prot. n. 007-08-2018). Written informed consent was obtained from participants or caregivers.
4.2. Blood collection and processing
The blood collection was performed between 8:00 and 8:30 a.m. after an overnight fasting of at least 8-10 hours. Venous blood was collected with a vacutainer system (Becton & Dickinson, Milan, Italy). To obtain the serum, the blood was centrifuged within 2 hours at 1500 g for 10 minutes. The samples were then stored at -80° C until their use.
Determination of the ability of different human anti-αGal antibodies isotypes (IgG, IgM, and IgA) to bind to different GLSs (GM1, GM2, GD1b) was performed in triplicate using a modified ELISA test (patent EP2626701). Data were expressed as the absorbance value. Each patient’s serum was diluted 50-fold with Phosphate-Buffered Saline (PBS, Merck Lifescience, Darmstadt, Germany) in a final volume of 2mL. GLSs, purchased from Merck Lifescience and BOC Sciences, (Shirley, New York, United States) have been solubilized in absolute ethanol at the concentration of 125µg/mL. Part of the sera was directly analyzed to evaluate the differences in the total anti-Gal Abs content between HS and AD patients. Conversely, to evaluate the specificity towards GLSs, 20µL of each GLS have been added to 500µL of patients’ serum and incubated overnight at +4°C. For each isotype, a Polysorp 96-well plate (Nunc, Rochester, NY, USA) was coated with 50µL of αGal/human serum albumin (HSA) (Dextra Laboratories, Berkshire, UK), 5µg/mL, for 2hs at 37°C. After washing three times with PBS, the blocking procedure was performed using 300µL per well of 2% HSA for 2hs, at RT in the darkness. Wells were then washed three times, as above. A set of four wells for each column was loaded with 100µL of serum not incubated (total Abs) and incubated with the tested GLS. The plate was placed for 3hs at 37°C. After washing, the proper secondary horseradish peroxidase (HRP)-conjugate antibody [1:100] was loaded (anti-human IgG, anti-human IgM, and anti-human IgA, Merck Lifescience, Darmstadt, Germany) and the plate incubated for 1h at 37°C. After washing, 100µL of HRP substrate buffer was added to each well for 5min, at RT, in the darkness. The plate absorbance was measured at 450nm by a microplate spectrophotometer (Multiskan Sky, Thermo Fisher Scientific, Waltham, MA, USA).
4.3. Statistical analysis
Statistical analyses were done using a two-tailed t-test or one-way ANOVA test with Dunnett correction when comparing multiple groups to specific conditions (GraphPad Prism v.8 and 9). The statistical tests, replicate experiments, and P values are all cited in the figures and/or figure captions. Statistical tests were justified as appropriate for every figure, and the data met the assumptions of the tests. The ranges of the x and y axes of scatter plots were determined to include all of the data points. The sample size for each experiment and the replicate number of experiments are included in the figure legends as well as the specific test used for the analysis.
5. Conclusions
In conclusion, the data presented here document the occurrence of antibody-mediated responses in AD patients towards a delimited epitope of GD1b, GM2, and GM1, which is shared with αGal-glycoconjugates. Conversely, a provocative hypothesis is that antibodies cross-reacting with brain GLSs in AD might arise via the sensitization to αGal-epitopes contained in gut microbiota [11] or tick-borne antigens [43]. It is very interesting how the prevalence of AD among elderly residents in the USA and the prevalence of anti-αGal IgE production in patients with αGal syndrome (AGS) involve the same geographical areas. This aspect could strengthen the link between anti-αGal antibodies and susceptibility to AD disease [44,45]. In addition, the reported recognition of glycolipids in complex with human CD1 monomers by αGal-specific IgE of subjects allergic to αGal [35] is a clue to a possible role of NK cell cytotoxicity in the pathogenesis of AD, an aspect still poorly investigated [46].
By expanding the study to a larger number of patients, we have the potential to develop a groundbreaking diagnostic tool. This tool would be based on the variation of the anti-αGal Abs pattern and would allow for the identification of the AD disease with a simple blood test. thors should discuss the results and how they can be interpreted from the perspective of previous studies and the working hypotheses. The findings and their implications should be discussed in the broadest context possible. Future research directions may also be highlighted.
Author Contributions
Conceptualization: FN, ADC, AA (Antonella Angiolillo); methodology: AA (Alessia Arcaro), AL, FN, GS; formal analysis: FN, ADC; investigation: AG, GS, AL, AA (Alessia Arcaro; writing—original draft preparation: AA, (Antonella Angiolillo), FN, FG; writing—review and editing: AA (Antonella Angiolillo), ADC, FG, FN, GS; validation: FN; visualization: AA (Antonella Angiolillo); supervision: FN, ADC, AG; project administration: ADC, AG, FN. All authors have read and agreed to the published version of the manuscript. FN, ADC and AA conceived the project and designed and interpreted experiments. AG, GS performed most of the experiments. AL, AA, and FG assisted with experiments and analysis.
Funding
This research was funded by PRIN 20222ZB4HK (Italian Ministry of University and Research).
Informed Consent Statement
Informed consent was obtained from all subjects involved in the study.
Data Availability Statement
The original contributions presented in this study are included in the article. Further inquiries can be directed to the corresponding author(s).
Conflicts of Interest
The authors declare no conflicts of interest.
Abbreviations
The following abbreviations are used in this manuscript:
| Abs | Antibodies |
| AD | Alzheimer’s Disease |
| CNS | Central Nervous System |
| BBB | Blood-Brain Barrier |
| CSF | Cerebrospinal fluid |
| GBS | Guillan Barré Syndrome |
| GLS | Ganglioside |
| HS | Healthy Subjects |
| CerMA | Centre for Research and Training in Medicine of Aging |
| NIA-AA | National Institute of Aging and Alzheimer’s Association |
| MMSE | Mini-Mental State Examination |
| CDR | Clinical Dementia Rating |
| PBS | Phosphate-Buffered Saline |
| ELISA | Enzyme Linked Immunosorbent Assay |
| HSA | Human Serum Albumine |
| BMI | Body Mass Index |
| TIA | Transient Ischemic Attack |
References
- Hardy, J.; Selkoe, D.J. The amyloid hypothesis of Alzheimer's disease: progress and problems on the road to therapeutics. Science 2002, 297(5580), 353–356. [Google Scholar] [CrossRef] [PubMed]
- González-Sanmiguel, J.; Schuh, C.M.A.P.; Muñoz-Montesino, C.; Contreras-Kallens, P.; Aguayo, L.G.; Aguayo, S. Complex Interaction between Resident Microbiota and Misfolded Proteins: Role in Neuroinflammation and Neurodegeneration. Cells 2020, 9(11), 2476. [Google Scholar] [CrossRef]
- McGeer, PL.; McGeer, E.G. The amyloid cascade-inflammatory hypothesis of Alzheimer disease: implications for therapy. Acta Neuropathol 2013, 126(4), 479–497. [Google Scholar] [CrossRef]
- Pul, R.; Dodel, R.; Stangel, M. Antibody-based therapy in Alzheimer's disease. Expert Opin Biol Ther 2011, 11(3), 343–357. [Google Scholar] [CrossRef] [PubMed]
- Macher, B.A.; Galili, U. The Galalpha1,3Galbeta1,4GlcNAc-R (alpha-Gal) epitope: a carbohydrate of unique evolution and clinical relevance. Biochim Biophys Acta 2008, 1780(2), 75–88. [Google Scholar] [CrossRef]
- Galili, U. The alpha-gal epitope and the anti-Gal antibody in xenotransplantation and in cancer immunotherapy. Immunol Cell Biol 2005, 83(6), 674–686. [Google Scholar] [CrossRef]
- Galili, U. Acceleration of wound healing by α-gal nanoparticles interacting with the natural anti-Gal antibody. J Immunol Res 2015, 2015, 589648. [Google Scholar] [CrossRef] [PubMed]
- Galili, U.; Anaraki, F.; Thall, A.; Hill-Black, C.; Radic, M. One percent of human circulating B lymphocytes are capable of producing the natural anti-Gal antibody. Blood 1993, 82(8), 2485–2493. [Google Scholar] [CrossRef]
- Jaison, P.L.; Kannan, V.M.; Geetha, M.; Appukuttan, P.S. Epitopes recognized by serum anti-α-galactoside antibody are present on brain glycoproteins in man. J Biosci 1993, 18, 187–193. [Google Scholar] [CrossRef]
- Bernth Jensen, J.M.; Skeldal, S.; Petersen, M.S.; Bjarne, K.M.; Steen, H.; Jens, C.J.; Uffe, B.S.S.; Steffen, T. The human natural anti-αGal antibody targets common pathogens by broad-spectrum polyreactivity. Immunology 2021, 162(4), 434–451. [Google Scholar] [CrossRef]
- Angiolillo, A.; Gandaglia, A.; Arcaro, A.; Carpi, A.; Gentile, F.; Naso, F.; Di Costanzo, A. Altered Blood Levels of Anti-Gal Antibodies in Alzheimer's Disease: A New Clue to Pathogenesis? Life (Basel) 2021, 11(6), 538. [Google Scholar] [CrossRef] [PubMed]
- Usuki, S.; O'Brien, D.; Rivner, M.H.; Yu, R.K. A new approach to ELISA-based anti-glycolipid antibody evaluation of highly adhesive serum samples. J Immunol Methods 2014, 408, 52–63. [Google Scholar] [CrossRef]
- Merrill, A.H. Sphingolipid and glycosphingolipid metabolic pathways in the era of sphingolipidomics. Chem Rev 2011, 111(10), 6387–6422. [Google Scholar] [CrossRef]
- Simons, K.; Gerl, MJ. Revitalizing membrane rafts: new tools and insights. Nat Rev Mol Cell Biol 2010, 11(10), 688–699. [Google Scholar] [CrossRef] [PubMed]
- Mandal, P.K.; Pettegrew, J.W. Alzheimer's disease: NMR studies of asialo (GM1) and trisialo (GT1b) ganglioside interactions with Abeta(1-40) peptide in a membrane mimic environment. Neurochem Res 2004, 29(2), 447–453. [Google Scholar] [CrossRef]
- Sipione, S.; Monyror, J.; Galleguillos, D.; Steinberg, N.; Kadam, V. Gangliosides in the Brain: Physiology, Pathophysiology and Therapeutic Applications. Front Neurosci 2020, 14, 572965. [Google Scholar] [CrossRef] [PubMed]
- McGonigal, R.; Barrie, J.A.; Yao, D.; Black, L.E.; McLaughlin, M.; Willison, H.J. Neuronally expressed a-series gangliosides are sufficient to prevent the lethal age-dependent phenotype in GM3-only expressing mice. J Neurochem 2021, 158(2), 217–232. [Google Scholar] [CrossRef]
- Sarbu, M.; Ica, R.; Zamfir, A.D. Gangliosides as Biomarkers of Human Brain Diseases: Trends in Discovery and Characterization by High-Performance Mass Spectrometry. Int J Mol Sci 2022, 23(2), 693. [Google Scholar] [CrossRef]
- Di Scala, C.; Yahi, N.; Flores, A.; Boutemeur, S.; Kourdougli, N.; Chahinian, H.; Fantini, J. Broad neutralization of calcium-permeable amyloid pore channels with a chimeric Alzheimer/Parkinson peptide targeting brain gangliosides. Biochim Biophys Acta 2016, 1862(2), 213–222. [Google Scholar] [CrossRef]
- Ariga, T.; McDonald, M.P.; Yu, R.K. Role of ganglioside metabolism in the pathogenesis of Alzheimer's disease--a review. J Lipid Res 2008, 49(6), 1157–1175. [Google Scholar] [CrossRef]
- Kracun, I.; Kalanj, S.; Talan-Hranilovic, J.; Cosovic, C. Cortical distribution of gangliosides in Alzheimer's disease. Neurochem Int 1992, 20(3), 433–438. [Google Scholar] [CrossRef] [PubMed]
- Pernber, Z.; Blennow, K.; Bogdanovic, N.; Månsson, J.E.; Blomqvist, M. Altered distribution of the gangliosides GM1 and GM2 in Alzheimer's disease. Dement Geriatr Cogn Disord 2012, 33(2-3), 174-188.
- Chapman, J.; Sela, B.A.; Wertman, E.; Michaelson, D.M. Antibodies to ganglioside GM1 in patients with Alzheimer's disease. Neurosci Lett 1988, 86(2), 235–240. [Google Scholar] [CrossRef]
- Hatzifilippou, E.; Koutsouraki, E.; Banaki, T.; Traka, M.; Costa, V.G.; Baloyannis, S.J. Antibodies against GM1 in demented patients. Am J Alzheimers Dis Other Demen 2008, 23(3), 274–279. [Google Scholar] [CrossRef]
- Lehmann, H.C.; Lopez, P.H.; Zhang, G.; Ngyuen, T.; Zhang, J.; Kieseier, B.C.; Mori, S.; Sheikh, K.A. Passive immunization with anti-ganglioside antibodies directly inhibits axon regeneration in an animal model. J Neurosci 2007, 27(1), 27–34. [Google Scholar] [CrossRef]
- Rodríguez, Y.; Rojas, M.; Pacheco, Y.; Acosta-Ampudia, Y.; Ramírez-Santana, C.; Monsalve, D.M.; Gershwin, E.C.; Anaya, J.M. Guillain-Barré syndrome, transverse myelitis and infectious diseases. Cell Mol Immunol 2018, 15(6), 547–562. [Google Scholar] [CrossRef] [PubMed]
- Yuki, N.; Ariga, T. Antibodies to fucogangliosides in neurological diseases. J Neurol Sci 1997, 150(1), 81–84. [Google Scholar] [CrossRef]
- Galili, U.; Basbaum, C.B.; Shohet, S.B.; Buehler, J.; Macher, B.A. Identification of erythrocyte Gal alpha 1-3Gal glycosphingolipids with a mouse monoclonal antibody, Gal-13. J Biol Chem 1987, 262(10), 4683–4688. [Google Scholar] [CrossRef] [PubMed]
- Iweala, O.; Brennan, P.J.; Commins, S.P. Serum igE specific for alpha-gal sugar moiety can bind glycolipid. J Allergy Clin Immunol 2017, 139(2), AB88. [Google Scholar] [CrossRef]
- Yanagisawa, K.; Odaka, A.; Suzuki, N.; Ihara, Y. GM1 ganglioside-bound amyloid beta-protein (A beta): a possible form of preamyloid in Alzheimer's disease. Nat Med 1995, 1(10), 1062–1066. [Google Scholar] [CrossRef]
- Choo-Smith, L.P.; Garzon-Rodriguez, W.; Glabe, C.G.; Surewicz, W.K. Acceleration of amyloid fibril formation by specific binding of Abeta-(1-40) peptide to ganglioside-containing membrane vesicles. J Biol Chem 1997, 272(37), 22987–22990. [Google Scholar] [CrossRef]
- Matsuzaki, K.; Horikiri, C. Interactions of amyloid beta-peptide (1-40) with ganglioside-containing membranes. Biochemistry 1999, 38(13), 4137–4142. [Google Scholar] [CrossRef]
- Kakio, A.; Nishimoto, S.I.; Yanagisawa, K.; Kozutsumi, Y.; Matsuzaki, K. Cholesterol-dependent formation of GM1 ganglioside-bound amyloid beta-protein, an endogenous seed for Alzheimer amyloid. J Biol Chem 2001, 276(27), 24985–24990. [Google Scholar] [CrossRef] [PubMed]
- Williamson, M.P.; Suzuki, Y.; Bourne, N.T.; Asakura, T. Binding of amyloid beta-peptide to ganglioside micelles is dependent on histidine-13. Biochem J 2006, 397(3), 483–490. [Google Scholar] [CrossRef] [PubMed]
- Matsuzaki, K. Aβ-ganglioside interactions in the pathogenesis of Alzheimer's disease. Biochim Biophys Acta Biomembr 2020, 1862(8), 183233. [Google Scholar] [CrossRef]
- Ariga, T.; Kobayashi, K.; Hasegawa, A.; Kiso, M.; Ishida, H.; Miyatake, T. Characterization of high-affinity binding between gangliosides and amyloid beta-protein. Arch Biochem Biophys 2001, 388(2), 225–230. [Google Scholar] [CrossRef]
- Nishi, K.; Tanegashima, A.; Yamamoto, Y. ; Ushiyama, I:; Ikemoto, K.; Yamasaki, S; Nishimura, A.; Rand, S.; Brinkmann, B. Utilization of lectin-histochemistry in forensic neuropathology: lectin staining provides useful information for postmortem diagnosis in forensic neuropathology. Leg Med (Tokyo) 2003, 5(3), 117-131.
- McKhann, G.M.; Knopman, D.S.; Chertkow, H.; Hyman, B.T.; Clifford, R.J.; Kawas, C.H.; Klunk, W.E.; Koroshetz, W.J.; Manly, J.J.; Mayeux, R.; et al. The diagnosis of dementia due to Alzheimer's disease: recommendations from the National Institute on Aging-Alzheimer's Association workgroups on diagnostic guidelines for Alzheimer's disease. Alzheimers Dement 2011, 7(3), 263–269. [Google Scholar] [CrossRef]
- Burk, C.M.; Beitia, R.; Lund, P.K.; Dellon, E.S. High rate of galactose-alpha-1,3-galactose sensitization in both eosinophilic esophagitis and patients undergoing upper endoscopy. Dis Esophagus 2016, 29(6), 558–562. [Google Scholar] [CrossRef]
- Safaie, P.; Ham, M.; Kuang, P.; Mehta, A.S; Wang, M.; Cheifetz, A.S.; Robson, S.; Lau, D.; Block, T.M.; Moss, A.C. Lectin-reactive anti-α-gal in patients with Crohn's disease: correlation with clinical phenotypes. Inflamm Bowel Dis 2013, 19(13), 2796–2800. [Google Scholar] [CrossRef] [PubMed]
- Chinuki, Y.; Morita, E. Alpha-Gal-containing biologics and anaphylaxis. Allergol Int 2019, 68(3), 296–300. [Google Scholar] [CrossRef]
- Naso, F.; Stefanelli, U.; Buratto, E.; Lazzari, G.; Perota, A. ; Galli, C; Gandaglia, A. Alpha Gal Inactivated Heart Valve Bioprostheses Exhibit an Anti-Calcification Propensity Similar to Knockout Tissues. Tissue Eng Part A 2017, 23(19-20), 1181-1195.
- Wilson, J.M.; Erickson, L.; Levin, M.; Ailsworth, S.M.; Commins, S.P.; Platts-Mills, T.A.E. Tick bites, IgE to galactose-alpha-1,3-galactose and urticarial or anaphylactic reactions to mammalian meat: The alpha-gal syndrome. Allergy 2024, 9(6), 1440–1454. [Google Scholar] [CrossRef]
- Dhana, K.; Beck, T.; Desai, P.; Wilson, R.S.; Evans, D.A.; Rajan, K.B. Prevalence of Alzheimer's disease dementia in the 50 US states and 3142 counties: A population estimate using the 2020 bridged-race postcensal from the National Center for Health Statistics. Alzheimer's Dement 2023, 19(10), 4388-4395.
- Bianchi, J.; Walters, A.; Fitch, Z.W.; Turek, J.W. Alpha-gal syndrome: Implications for cardiovascular disease. Glob. cardiol. Sci 2019, 3. [Google Scholar] [CrossRef]
- Qi, C.; Liu, F.; Zhang, W.; Han, Y.; Zhang, N.; Liu, Q.; Li, H. Alzheimer's disease alters the transcriptomic profile of natural killer cells at single-cell resolution. Front Immunol 2022, 13, 1004885. [Google Scholar] [CrossRef] [PubMed]
Figure 1.
Serological quantification of anti-αGal Abs. Serum level (O.D. 450 nm) of anti-αGal IgG (A), IgM (B), and IgA (C) in HS and AD subjects (both n=30) before and after incubation with different GSLs (GM1, GM2, and GD1b). Box plots show the median (horizontal line in the box), mean (cross inside the box), 25th and 75th percentiles (edges of the box), and maximum and minimum values (whiskers). The black asterisk identifies a statistically significant difference (p<0.05) between the total circulating Abs of specific isoclasses between HS and AD subjects. The dark asterisk identifies a statistically significant difference (p<0.05) between HS and AD regarding a specific antibody isoclass, while the red asterisk identifies a statistically significant difference (p<0.05) between the circulating Abs of specific isoclasses before and after the incubation with a specific GLS (two-sided student’s t-test).
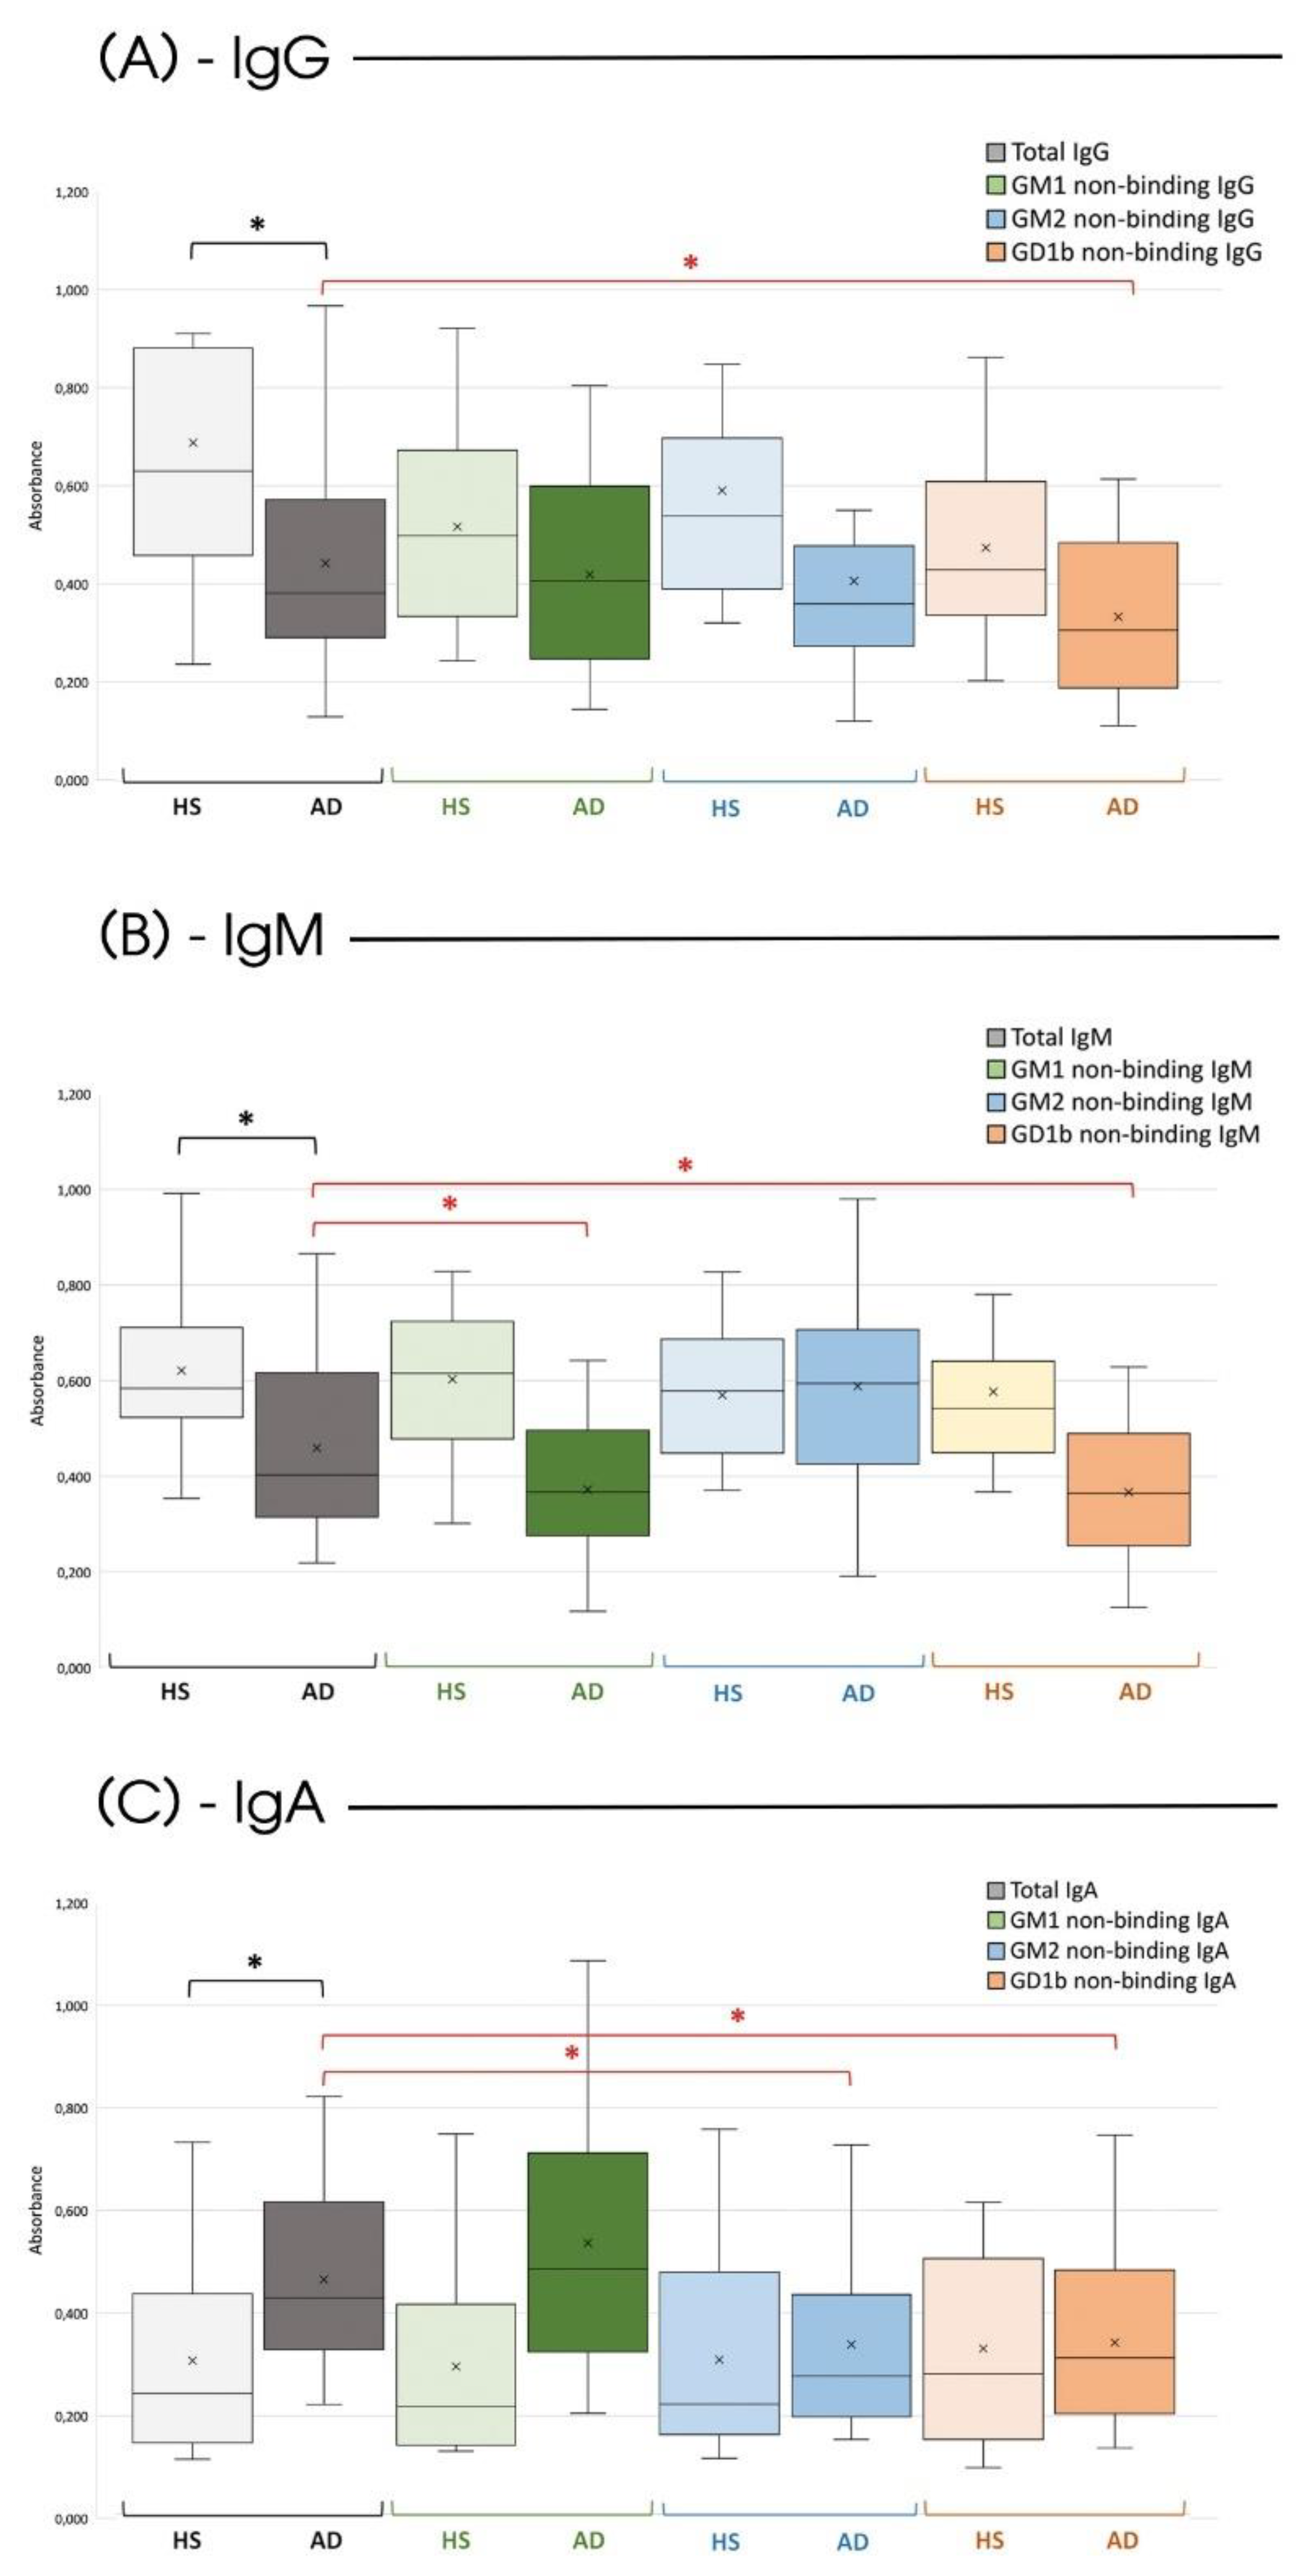
Figure 2.
AD Serum: Abs-GLS Binding. Percentage of binding to various types of GLS calculated concerning the total anti-αGal Abs for each isoclass type in serum from AD patients. Green bars represent binding to GM1 ganglioside, blue bars to GM2 ganglioside and orange to GD1b gangliosides. As per Figure 1, n=30. The white star identifies a non-statistically significant difference (p>0.05, two-sided Student’s t-test).
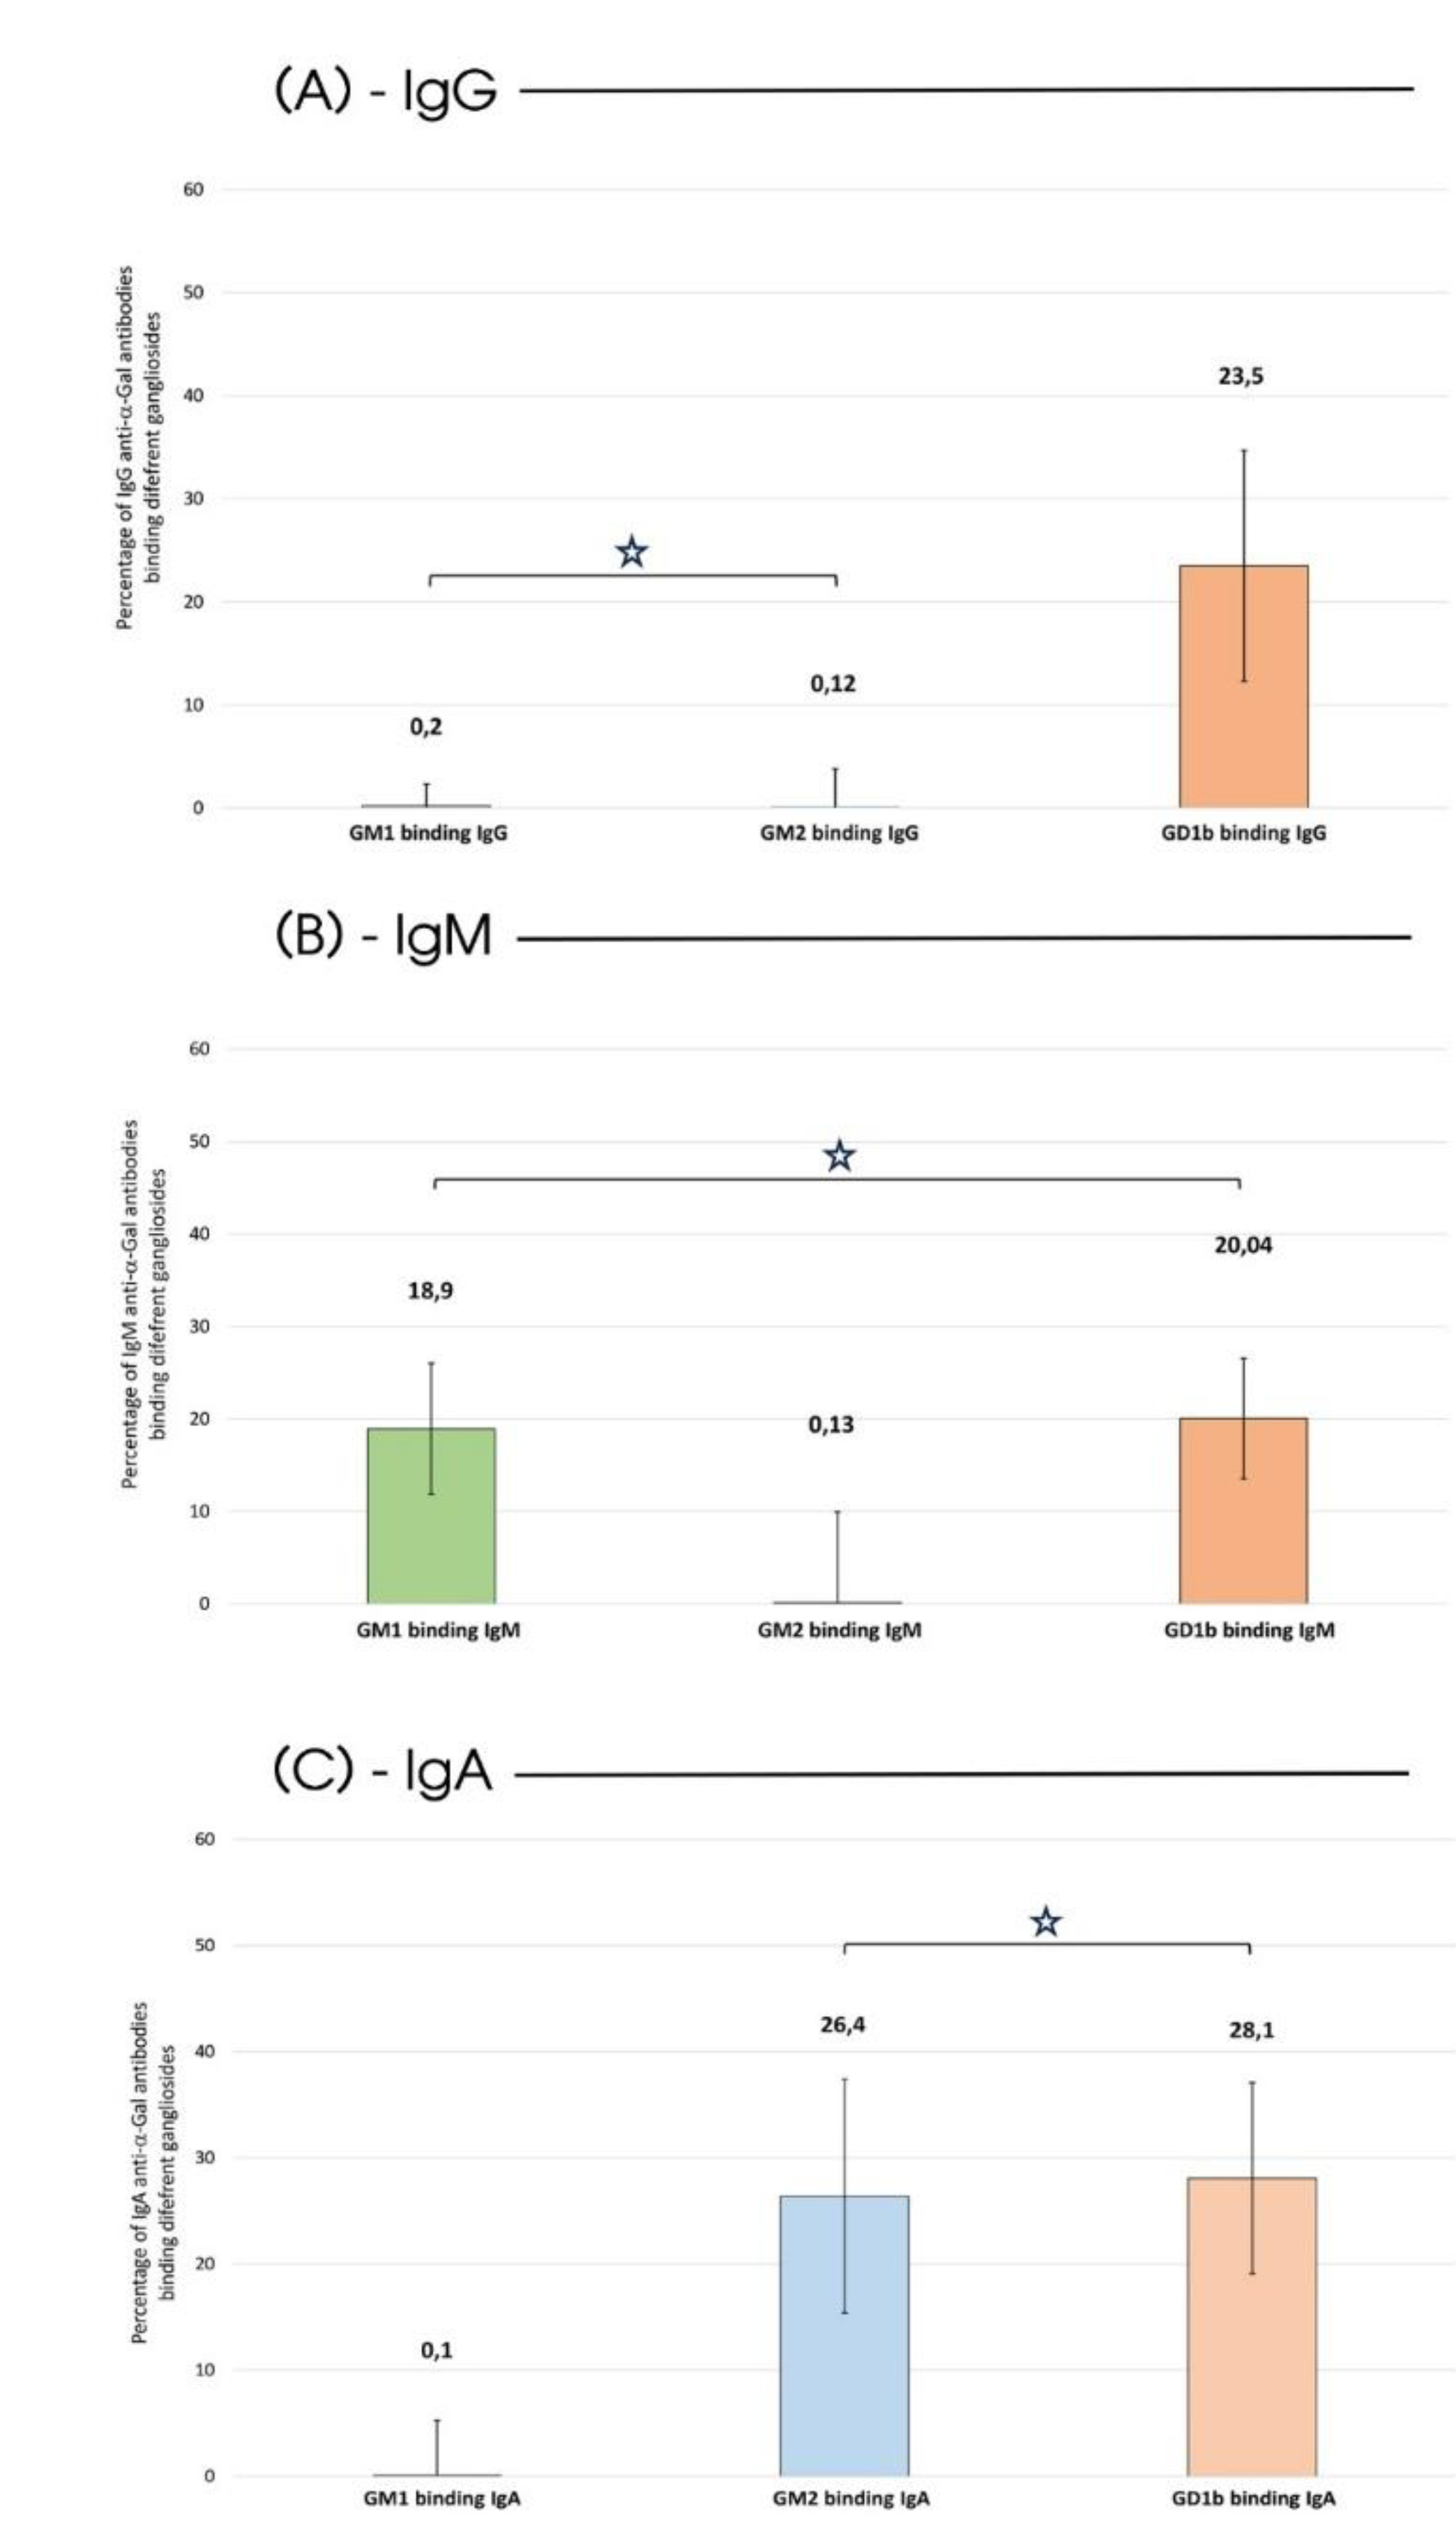
Figure 3.
Structures of neutral glycosphingolipid containing the α1-3Gal epitope, ABO blood group antigens and the main brain gangliosides. The position and anomery of the glycosidic linkages are indicated. A) neutral glycosphingolipids with linear lactosamine structures, bearing non-reducing terminal Gal α1-3Gal epitopes: CPH, ceramide pentahexoside; GB3, globotriaosylceramide (ceramide trihexoside, CD77); iGB3, isoglobotriaosylceramide; B) ABO blood group antigens; C) the main brain gangliosides of the 0-, a- and b-series. Those which were examined in the present study are marked in red. See the internal legend for the symbolization of carbohydrate residues: GalNAc, N-acetylgalactosamine; GlcNAC, N-acetylglucosamine; Neu5Ac, N-acetylneuraminic acid.
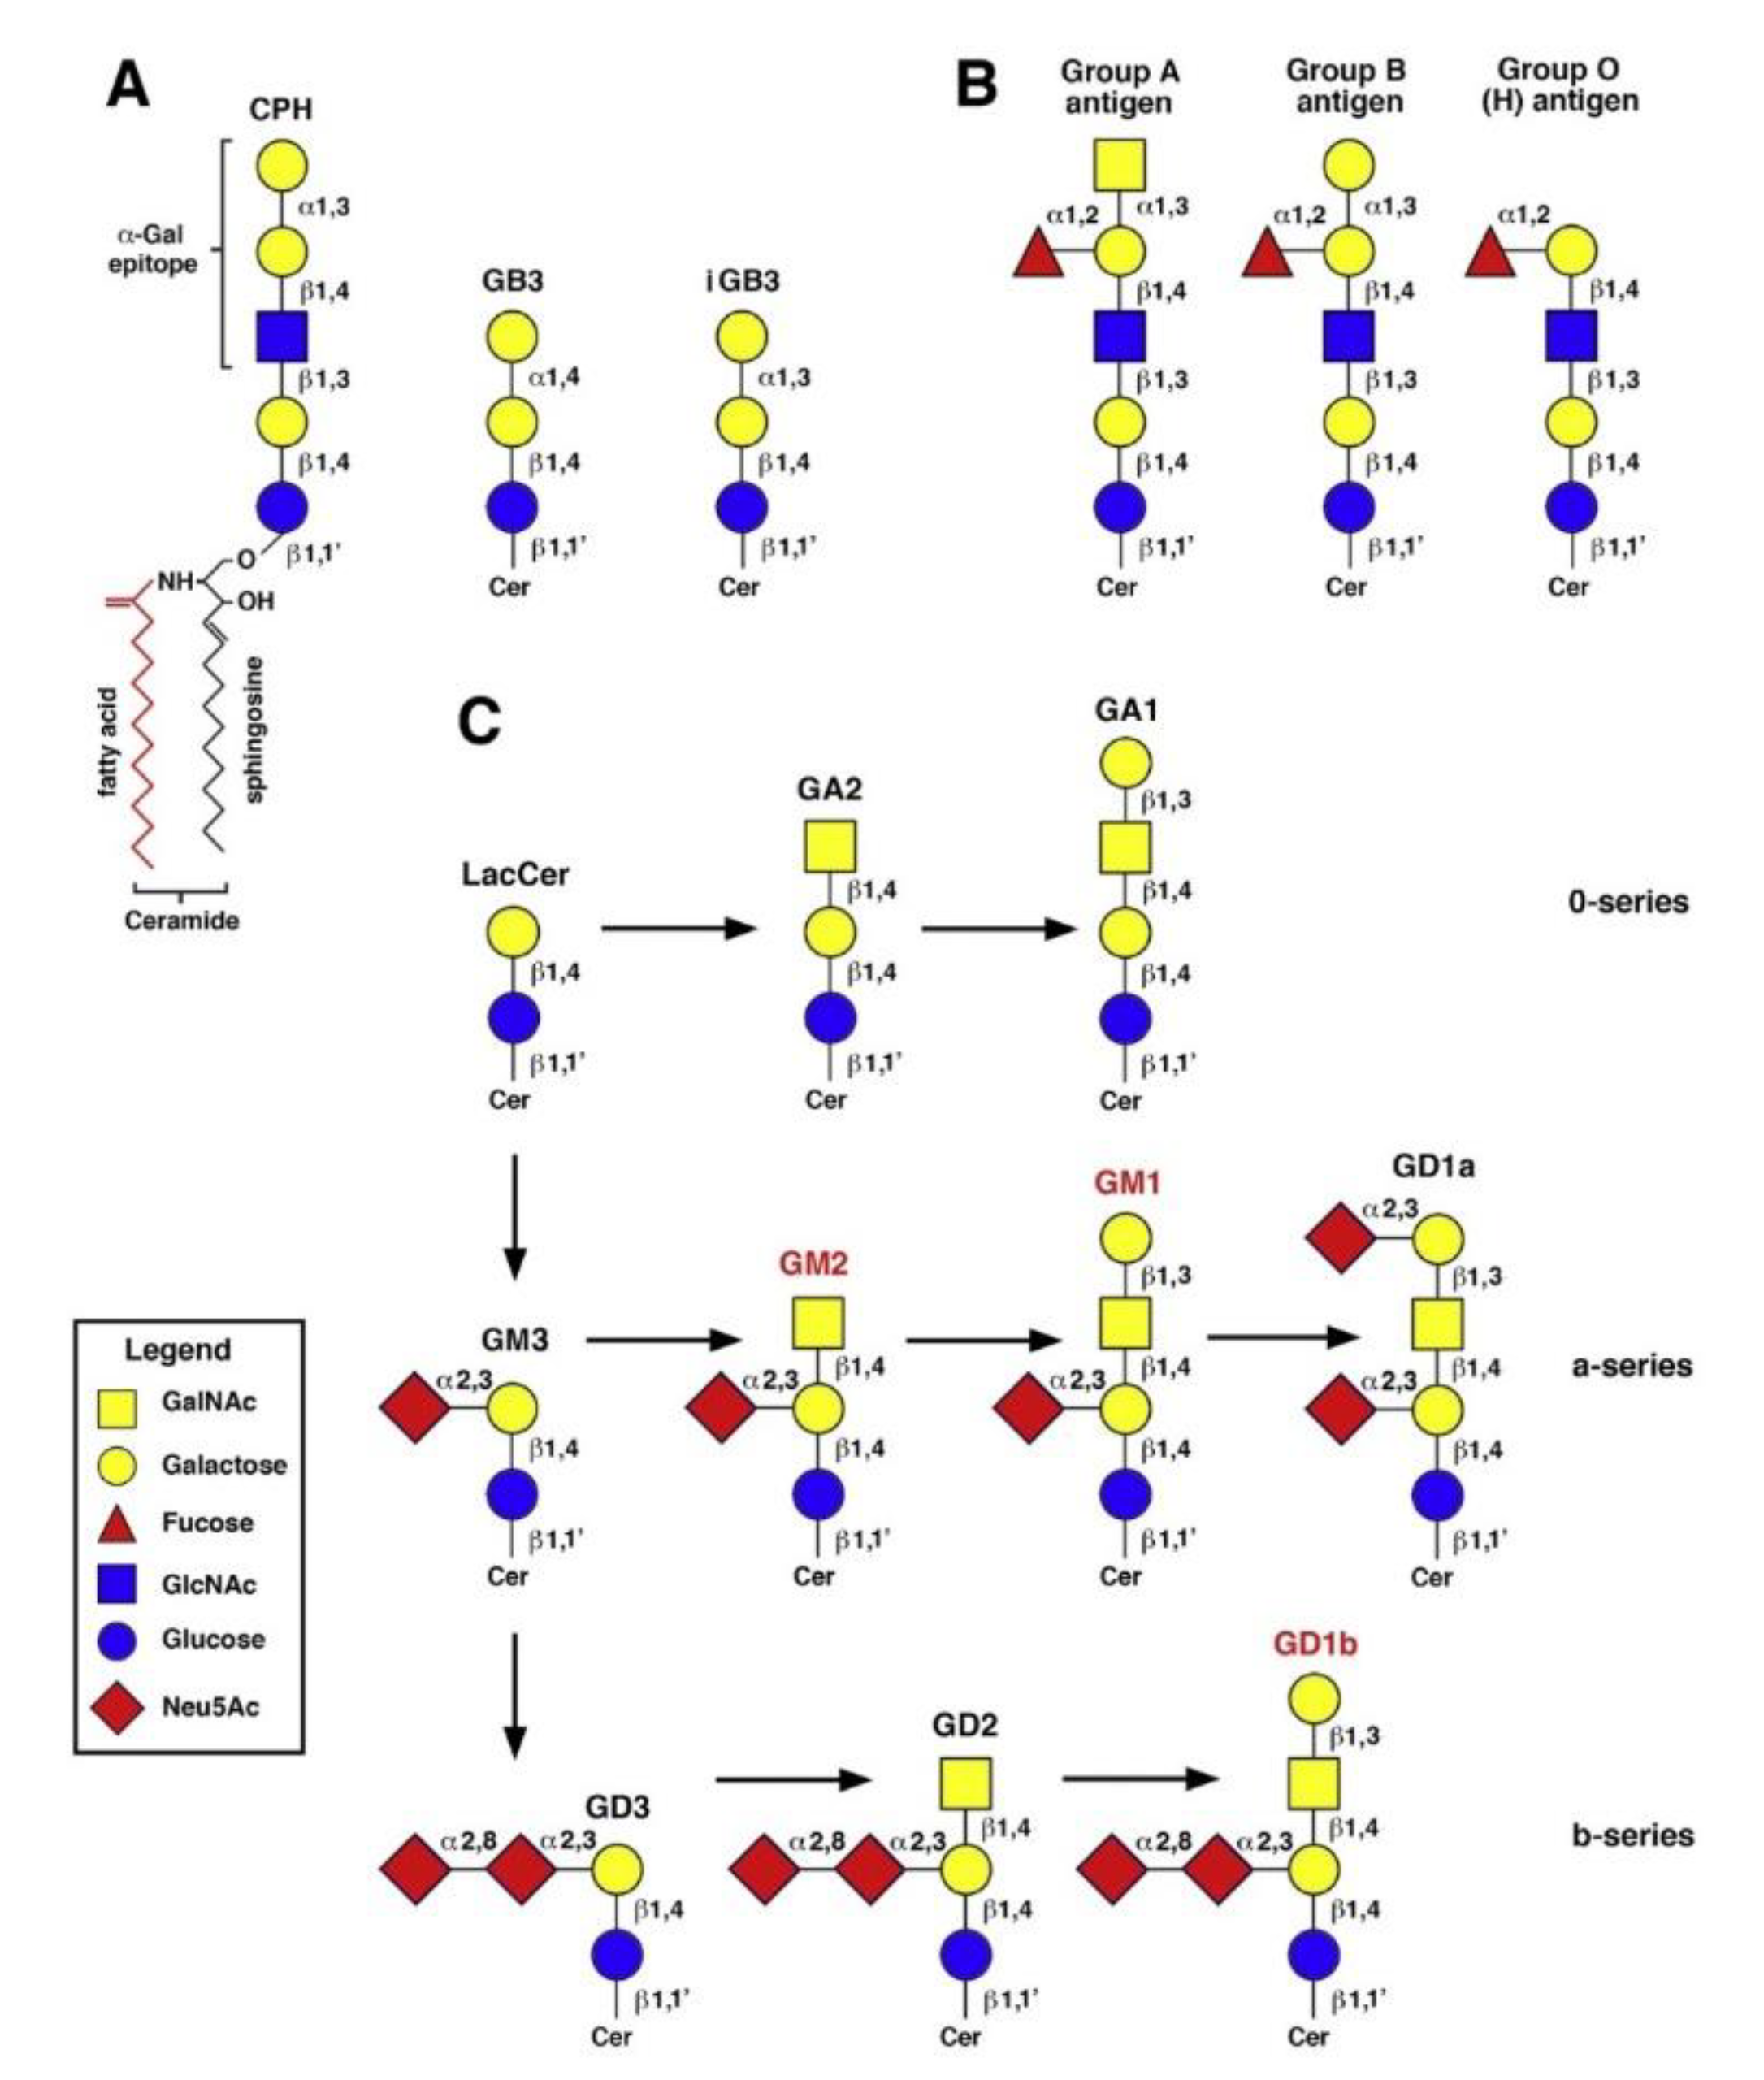

Table 1.
Pattern of reactivity between the different isotypes of anti-Gal antibodies against 3 gangliosides involved in the progression of Alzheimer’s Disease (AD) evaluated in healthy subjects (n=30, HS) and those affected by AD (n=30, AD).
Table 1.
Pattern of reactivity between the different isotypes of anti-Gal antibodies against 3 gangliosides involved in the progression of Alzheimer’s Disease (AD) evaluated in healthy subjects (n=30, HS) and those affected by AD (n=30, AD).
| GM1 | GM2 | GD1b | ||
|---|---|---|---|---|
|
HS |
IgG | - | - | - |
| IgM | - | - | - | |
| IgA | - | - | - | |
|
AD |
IgG | - | - | + |
| IM | + | - | + | |
| IgA | - | + + | + + |
Table 2.
Demographic and clinical characteristics of study groups (* current smoker; AD, Alzheimer's disease; HS, healthy subjects; BMI, Body mass index; MMSE, Mini Mental State Examination; TIA, transient ischemic attack. †, As described in the Methods section, F pertains to the evaluation of age, schooling, BMI, and MMSE, while X2 applies to all other parameters.
| Characteristics | AD (N. 30) |
HS (N. 30) |
F (1,59)/X2 † |
P |
|---|---|---|---|---|
| Females/males (N.) | 19/11 | 15/15 | 1.086 | 0.297 |
| Age (mean ± SD, y) (range, y) |
83.77 ± 5.89 (70-96) |
80.83 ± 6.04 (70-93) |
3.631 | 0.062 |
| Education level (mean + SD, y) | 9.10 ± 5.27 | 11.77 ± 4.19 | 4.708 | 0.034 |
| BMI (mean + SD, kg/m2) | 24.37 ± 4.56 | 26.37±3.70 | 3.475 | 0.067 |
| MMSE (score) | 17.88 ± 6.85 | 30.07±1.31 | 91.632 | <0.001 |
| Blood group (N; %) | ||||
| 0 | 13; 43.3% | 14; 46.6% | 0.067 | 0.795 |
| A | 13; 43.3% | 8; 26.6% | 1.832 | 0.176 |
| B | 3; 10% | 6; 20% | 1.176 | 0.278 |
| AB | 1; 3.3% | 2; 6.6% | 0.351 | 0.554 |
| Medical History (N; %) | ||||
| Smoke* | 3; 10% | 3; 10% | 0.000 | 1.000 |
| Dyslipidemia | 11; 36.6% | 12; 40% | 0.071 | 0.791 |
| Diabetes | 8; 26.6% | 6; 20% | 0.373 | 0.542 |
| Hypertension | 17; 56.6% | 19; 63.3 % | 0.278 | 0.598 |
| Myocardial infarction | 3; 10% | 3; 10% | 0.000 | 1.000 |
| TIA/Stroke | 3; 10% | 1; 3.33% | 1.071 | 0.301 |
| Drugs (N; %) | ||||
| Antihypertensive | 17; 56.6% | 18; 60% | 0.069 | 0.793 |
| Lipid-lowering | 10; 30% | 11; 36.6% | 0.073 | 0.787 |
| Hypoglycemic | 8; 26.6% | 6; 20% | 0.373 | 0.542 |
| Antiacid | 12; 40% | 11; 36.6% | 0.071 | 0.791 |
| Antiplatelet | 13; 43.3% | 12; 40% | 0.069 | 0.793 |
| Anti-inflammatory | 3; 10% | 3; 10% | 0.000 | 1.000 |
Disclaimer/Publisher’s Note: The statements, opinions and data contained in all publications are solely those of the individual author(s) and contributor(s) and not of MDPI and/or the editor(s). MDPI and/or the editor(s) disclaim responsibility for any injury to people or property resulting from any ideas, methods, instructions or products referred to in the content. |
© 2025 by the authors. Licensee MDPI, Basel, Switzerland. This article is an open access article distributed under the terms and conditions of the Creative Commons Attribution (CC BY) license (http://creativecommons.org/licenses/by/4.0/).
Copyright: This open access article is published under a Creative Commons CC BY 4.0 license, which permit the free download, distribution, and reuse, provided that the author and preprint are cited in any reuse.


