Submitted:
06 July 2025
Posted:
08 July 2025
You are already at the latest version
Abstract
In the current early stage of new drug development, due to the limited sample size and tight trial resources, there is an urgent need for a method that can accurately predict the concentration-toxicity response and reasonably derive the dose-safety boundary under the condition of a small population, to accelerate the design of personalized treatment pathways. In this work, we propose an AI-enhanced combined concentration-toxicity model (AI-AugETM), which is extended on basis of the existing pharmacokinetic-toxicity combination model, and integrates deep learning technology and uncertainty inference methods, which is suitable for the modeling and evaluation of new dose pathways. Initially, the model is based on multi-source input data, and uses multi-task time series models to jointly model toxicity probability and time-varying evolution of toxicity grades, and learn the concentration-toxicity response curve under multi-dose pathways. Based on the results of the response curve, Bayesian uncertainty estimation and Shapley value interpretation mechanism are used to derive the effective exposure range and safety upper bound at the individual level, which can be used to assist in formulating the optimal dose range and safe upper dose limit, ensuring efficacy and controlling toxicity risk. The results show that AI-AugETM significantly improves the accuracy of toxicity prediction in pharmacokinetic toxicity combination data, and effectively narrows exposure decision boundary within 95% confidence interval.
Keywords:
Exposure Toxicity Modeling
; AI-Augmented Prediction
; Safety Threshold Derivation
; Pharmacokinetics
I. Introduction
For early-phase clinical trials, particularly phase I trials, the "3+3" dose-escalation design is widely adopted as the standard for establishing the maximum tolerated dose (MTD). There are several limitations to this approach:
(1) the definition of MTD is often based on toxicity, rather than efficacy, which can result in the recommended dose being far higher than the optimal therapeutic dose ( OBD) of the drug;
(2) all the patients at each dose level need to be observed and the safety requirements need to be met before increasing gating dose, the trial time is long, and the number of patients used is low [1]. Moreover, the toxicity of agents, like immunotherapy or targeted therapy, does not increase in proportion to the dose and MTD-based studies are likely to overshot the optimal therapeutic window.
In recent years, the project of Project Optimus, initiated by US Food and Drug administration, has advocated that the way of "toxicity threshold-based" of traditional study is changed to "dose optimization-based" strategy that compliance "exposure-response relationship" [2]. This project encourages the pharmaceutical industry to implement Dose-Efficacy/Toxicity system modeling and analysis at an early stage of drug development cycle and, under recipe of model guidance, to find the optimal biological dose, which will provide a safer, more effective, and more economical path for clinical trial.
Project Optimus forms part of FDA Model-Informed drug development program and is closely related to the latter, which over the last years has been facilitating to a faster validation of dose strategy and reduction of inefficient resources through the use of modelling and simulations in low population exposure settings [3].
As the cornerstone of drug development, PK/PD modeling can simulate the adsorption, distribution, metabolism and excretion (PK) of drugs in vivo, and the kinetic process of the effect of drugs (PD) with respect to time and concentration. Some of the common models are, one-compartment or multi-compartment models, non-linear mixed effect models (NLME), Emax models, etc. These models are built on an explicit mathematical structure and parameter assumptions, have a good physiological interpretation, and could give stable and precise fitting results if the structure is known and the parameters are sufficiently available [4].
However, in practical scenario, especially for newly formulated dosages, new target drugs and modification in mode of administration, traditional PK/PD models are very often unsatisfactory to cover the high-dimensional non-linear interactions among dose-frequency-toxicity. It is difficult to systematically model the differences between different patients. Furthermore, the parameter estimation is unstable and the small sample test set is prone to overfitting or underfitting [5]. Moreover, conventional models are highly sensitive to sparse observations (e.g., periodical blood tests), which hinder the ability to make accurate predictions and may eventually risks conservative or even biased dosing recommendations adversely affecting the intervention efficacy.
Artificial intelligence and deep learning technologies have witnessed rapid advances in the biomedicine filed in recent years, particularly in tough situations. AI-based PK modeling and toxicities prediction methods are now in the early stage of practicing during the drug development itself. Neural networks, for instance, can learn a nonlinear mapping from drug concentration time series and toxicity events, so that toxicity probabilities can be predicted directly [6]. Time-series models like Transformer and LSTM are especially handy in modeling dynamic concentration-reaction process, and have great success to simulate toxicity risks under various dosing frequencies and continuous exposure.
Even though AI-AugETMRI is built on the classical pharmacokinetic-toxicity joint model framework, its real innovation is still in the design of multi-task deep learning architecture and individual-level risk interpretation mechanism, enabling the model to not only stably capture concentration-toxicity evolution law under the case of high-dimensional and small-sample data, but also to use a combination of Bayesian uncertainty consideration and interpretability mechanism to clearly derive the exposure-safety window of each subject. This transition from a population fitting model to a patient individualized decision is a transition from conventional statical modeling to AI-assisted medical decision.
II. Related Work
Chen et al. [7] solved the problem of "creative bottleneck" and "lack of guidance" for young students when using the Scratch platform for visual programming by integrating AI and children's programming education. The system uses structured interactive storyboards and visual cues to reduce "art stuck" and provides real-time programming suggestions in conjunction with the LLM model. Manalad et al. [8] constructed a Monte Carlo trace-structure simulation pipeline for neutron radiation-induced DNA damage clusters, and for the first time, the "indirect action" model was included in the analysis. They found that after the introduction of indirect effects, the frequency of DNA damage clusters and the number of damage within clusters increased significantly, and the structure of complex damage clusters was larger and denser.
For the first time, Juri Di Rocco et al. [9] comprehensively sorted out the typical application scenarios of LLMs in MDE, including model warehouse classification, recommendation system construction, and domain-specific language (DSL)-assisted generation, and discussed in depth the technical points and challenges of seamlessly integrating LLMs such as ChatGPT into the MDE toolchain (such as prompt word setting, hallucination risk control), providing a clear roadmap for the integration of AI and modeling tools in the future.
James Johnson [10] proposed a modern reconstruction of the concept of "catalyzed nuclear war", focusing on the potential catalytic effects of artificial intelligence and autonomous systems on the escalation path of nuclear conflict, pointing out that third-party operators may use AI to disrupt nuclear command and control systems, trigger miscalculations and chain reactions through disinformation or automated decision-making channels, and significantly increase the risk of unintentional nuclear conflict, and emphasize the urgency of explainable mechanisms and prevention and control strategies in the process of AI-accelerated war decision-making
Zhang et al. [11] proposed a human-machine collaborative argument writing assistant that integrates visual programming and rapid draft prototypes, which helps writers build and adjust hierarchical argument structures through synchronous text editing and graphical mind map interfaces, and at the same time automatically generates draft prototypes and argument "stimulus" with the help of LLMs, to improve writing efficiency and persuasiveness.
III. Methodologies
A. Combined Concentration–Toxicity Modeling Module
We define a collection of input variables. For each individual , we consider four types of inputs including time-series drug concentration , key pharmacokinetic parameter , individual variable , and dose path information is. Concentration sequences are indexed by time points, as Equation 1:
where represents the plasma concentration of the subject at time , and is the total duration of observation. This sequence will be used to model the dynamic process of toxicity events in relation to time
On the basis of the concentration sequence, we further extract the vectors of key pharmacokinetic parameters such as Equation 2:
where is the maximum concentration, is the time to peak, and represents the area under the concentration-time curve within hours of administration to and is used to measure overall exposure.
In addition, the individual variable indicates the population attribute characteristics of patients, including gender, age, weight, liver and kidney function, etc.; The dose path variable $ includes the dose and frequency of administration. The goal is to predict the following two outputs: the probability of a toxicity event and the toxicity class distribution in form of Equations 3 and 4:
where indicates that the individual has a severe toxicity event, and is the probability of the predicted grade $g$, satisfying the normalization constraint . To model the above prediction objectives, we construct the following deep network structure: first, the concentration sequence is is input into a bidirectional LSTM network, as shown in Equation 5:
where each is the time-hidden state of the LSTM output, which encodes the concentration change information before that moment; captures both forward and backward dynamics to enhance sequence modeling capabilities.
Subsequently, the multi-head self-attention mechanism in Transformer is introduced to further strengthen the capture ability of the model for nonlinear long-range dependence, as shown in Equation 6:
where is the output of the attention layer, which encodes the weight relationship between concentrations at different time points on the overall toxicity decision. Its modeling performance for high-variation, high-dimensional sequences is better than that of traditional time series networks.
Finally, the attention output is uniformly represented by pooling (e.g., mean pooling), and the final feature is constructed by splicing with , and , such as Equation 7:
This joint representation of is a combination of dynamic concentration, static individual parameters, and dose pathway factors, and is the basis for decision-making for toxicity risk assessment. A multi-task time series model refers to a neural network architecture that jointly models multiple toxicity-related outputs at the same time, which can effectively capture the dynamic dependencies between different targets. Bayesian uncertainty estimation is used to measure the confidence of the prediction results of the model, so as to avoid overconfident judgments in scenarios with sparse or heterogeneous data.
B. Exposure Threshold Derivation and Decision-making
Furthermore, we define is the integral value of the concentration time curve the exposure level corresponding to each dose pathway , the total AUC exposure, as Equation 8:
where is a function of concentration at of the dose path. Through simulation or model rollback, the of any dose strategy can be calculated.
Next, we fit the exposure-toxicity function according to the mapping relationship between the model's predicted toxicity probability and , as shown in Equation 9:
where, can be modeled by methods such as LOESS regression, spline fitting, or Bayesian Gaussian processes as a continuous function for risk assessment.
Defining the maximum toxicity tolerance threshold (e.g. 20% is the probability of acceptable DLT), then the maximum safe exposure limit SUB is determined by the formula as follows in Equation 10:
For the equivalent exposure interval EER, we set the lower limit of effective concentration to ensure the efficacy (e.g., EC50 concentration corresponds to AUC), and then use or ; Limit the upper bound, as in Equation 11:
This interval is the optimal exposure range to maintain efficacy and not exceed the toxicity threshold, and is directly used to recommend a dose-frequency combination strategy. To improve the explanatory nature of the model, we introduce Shapley values to account for the marginal contribution of individual variables , in the toxicity output, as Equation 12:
where is the set of all input features, and represents the average marginal effect of the variable in predicting toxicity, which helps to identify sensitive populations and risk factors.
IV. Experiments
A. Experimental Setup
In this subsection, the dataset Project DataSphere Phase I Dose Escalation Oncology Dataset (PDS-ONC-DE-001) was used from the Project DataSphere data sharing platform (https://www.projectdatasphere.org). Driven by Roundtable on Cancer, CEO of the nonprofit organization, the platform aims to support cancer research and model development by sharing historical clinical trial data. The dataset used was derived from an open-access early phase clinical trial in solid tumors and included patient-level dose path information, blood concentration monitoring results, adverse event records (graded by NCI-CTCAE), and underlying demographic variables.
- Logistic Regression + AUC Feature (Baseline-Logit) fed the AUC of each patient into the logistic regression model as the main exposure variable to fit the probability of occurrence of toxic events.
- Random Forest Classifier + PK Summary Features (RF-PK) has strong nonlinear fitting ability, and the toxicity probability prediction is carried out through tree model ensemble. Although the model can capture the complex relationships between variables to a certain extent, it cannot make use of the complete time series concentration information.
- The Time-Aware LSTM Toxicity Predictor (TA-LSTM) uses a long short-term memory network (LSTM) to directly model a patient's PK concentration time series to predict the risk of toxicity.
- As a sequence modeling method based on self-attention mechanism, DeepTox-Transformer (DT-Transformer) has shown excellent performance in multiple toxicity prediction tasks.
B. Experimental Analysis
In this experiment, we indexed "1–50 to correspond to the specific hyperparameter combinations of five types of models in grid search (10 for Baseline-Logit, 10 for RF-PK, 9 for TA-LSTM, 6 for DT-Transformer, and 15 for AI-AugETM).
Even though AI-AugETMRI is built on the classical pharmacokinetic-toxicity joint model framework, its real innovation is still in the design of multi-task deep learning architecture and individual-level risk interpretation mechanism, enabling the model to not only stably capture concentration-toxicity evolution law under the case of high-dimensional and small-sample data, but also to use a combination of Bayesian uncertainty consideration and interpretability mechanism to clearly derive the exposure-safety window of each subject.
The results in Figure 1 show that AI-AugETM performs best in all configurations (AUC-ROC 0.88–0.95) with minimal fluctuation. DT-Transformer followed (0.82–0.88), TA-LSTM and RF-PK were in the middle range, while Baseline-Logit had the weakest performance (0.60–0.70) and the largest fluctuation, which verified the trend from traditional statistics to depth series. As the proportion of training data increases from 10% to 100%, Figure 2 shows that the MCC of each model has increased significantly, but the differentiation trend is obvious. The MCCs of Baseline-Logit, RF-PK, TA-LSTM, DT-Transformer, and AI-AugETM were about 0.40, 0.45, 0.52, 0.55, and 0.61 when only 10% data was used.
AI-AugETM not only maintains the highest MCC and has the largest increase (Δ≈0.27), but also has the narrowest error band and shows excellent robustness, followed by DT-Transformer, TA-LSTM and RF-PK have the average performance, and Baseline-Logit has the slowest improvement and the largest fluctuation.
As the risk tolerance threshold increased from 5% to 50%, Table 1 shows a steady upward trend in EDRA for all five models. At the most conservative 5% threshold, the EDRA for Baseline-Logit, RF-PK, TA-LSTM, DT-Transformer, and AI-AugETM is about 0.50, 0.55, 0.60, 0.65, and 0.70, respectively, while at the loose 50% threshold, the EDRA increases to 0.75, 0.80, 0.85, 0.90, and 0.95. On the whole, AI-AugETM has always been the leading and has the largest increase, followed by DT-Transformer, TA-LSTM and RF-PK are in the middle, and Baseline-Logit is the weakest.
V. Conclusions
In conclusion, the AI-AugETM framework proposed in this study shows excellent and robust performance under multiple hyperparameter configurations, different training data scales and risk tolerance thresholds by integrating BiLSTM-Transformer multi-task sequence modeling, Bayesian uncertainty inference and Shapley interpretation mechanism, and the experimental results are ahead of the existing methods. Future work can focus on introducing more real-world multi-center clinical data, multimodal physiological and genomic features, and combining online learning and adaptive trial design to further improve model generalization and real-time decision-making capabilities.
References
- Shaer, O., Cooper, A., Mokryn, O., Kun, A. L., & Ben Shoshan, H. (2024). AI-Augmented Brainwriting: Investigating the use of LLMs in group ideation. In Proceedings of the 2024 CHI Conference on Human Factors in Computing Systems (pp. 1-17).
- Jia, C.; Lam, M.S.; Mai, M.C.; Hancock, J.T.; Bernstein, M.S. Embedding Democratic Values into Social Media AIs via Societal Objective Functions. Proc. ACM Human-Computer Interact. 2024, 8, 1–36. [Google Scholar] [CrossRef]
- Currie, G.; Rohren, E.; Hawk, K.E. (2024). The role of artificial intelligence in supporting person-centred care. In Person-Centred Care in Radiology (pp. 343-362).
- Donvir, A. , & Sharma, G. (2025). Ethical Challenges and Frameworks in AI-Driven Software Development and Testing. In 2025 IEEE 15th Annual Computing and Communication Workshop and Conference (CCWC) (pp. 00569-00576). IEEE.
- Zheng, Y.; Chen, Z.; Huang, S.; Zhang, N.; Wang, Y.; Hong, S.; Chan, J.S.K.; Chen, K.-Y.; Xia, Y.; Zhang, Y.; et al. Machine Learning in Cardio-Oncology: New Insights from an Emerging Discipline. Rev. Cardiovasc. Med. 2023, 24, 296. [Google Scholar] [CrossRef] [PubMed]
- Yang, G. , Chen, H., & Yue, J. (2024). Deep learning to optimize radiotherapy decisions for elderly patients with early-stage breast cancer: a novel approach for personalized treatment. American Journal of Cancer Research, 14(12), 5885.
- Chen, L.; Xiao, S.; Chen, Y.; Song, Y.; Wu, R.; Sun, L. ChatScratch: An AI-Augmented System Toward Autonomous Visual Programming Learning for Children Aged 6-12. CHI '24: CHI Conference on Human Factors in Computing Systems. LOCATION OF CONFERENCE, United StatesDATE OF CONFERENCE; pp. 1–19.
- Manalad, J.; Montgomery, L.; Kildea, J. Estimating the impact of indirect action in neutron-induced DNA damage clusters and neutron RBE. Ann. ICRP 2023, 52, 87–194. [Google Scholar] [CrossRef]
- Di Rocco, J. , Di Ruscio, D., Di Sipio, C., Nguyen, P. T., & Rubei, R. (2025). On the use of large language models in model-driven engineering. Software and Systems Modeling, 1-26.
- Johnson, J. ‘Catalytic nuclear war’ in the age of artificial intelligence & autonomy: Emerging military technology and escalation risk between nuclear-armed states. J. Strat. Stud. 2021, 1–41. [Google Scholar] [CrossRef]
- Zhang, Z.; Gao, J.; Dhaliwal, R.S.; Li, T.J.-J. VISAR: A Human-AI Argumentative Writing Assistant with Visual Programming and Rapid Draft Prototyping. UIST '23: The 36th Annual ACM Symposium on User Interface Software and Technology. LOCATION OF CONFERENCE, United StatesDATE OF CONFERENCE; pp. 1–30.
Figure 1.
ROC AUC Comparison Results.
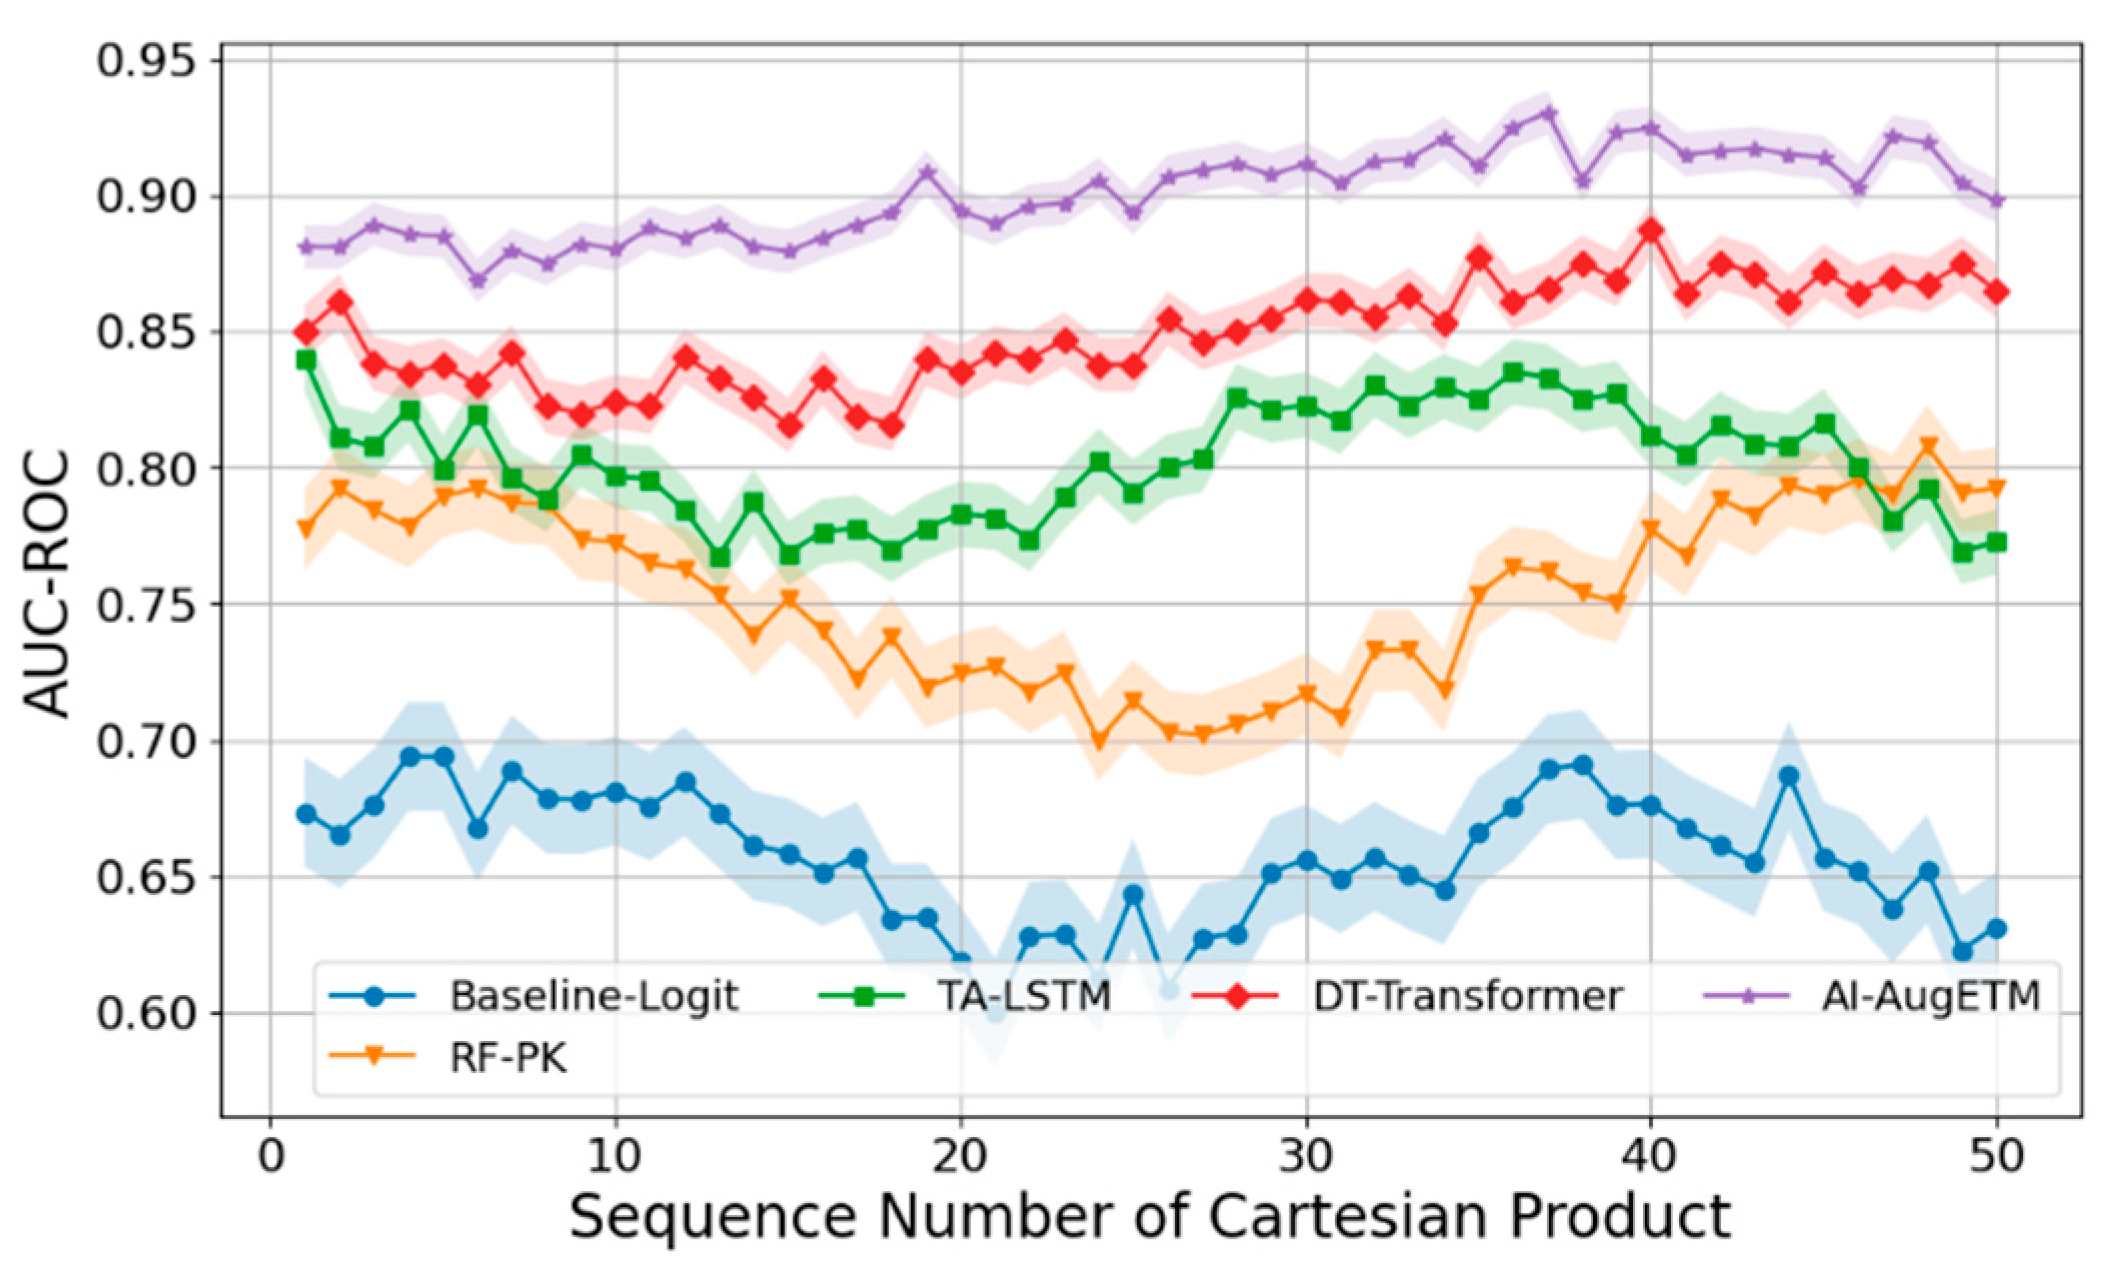
Figure 2.
MCC Comparison Across Training Data Proportions.
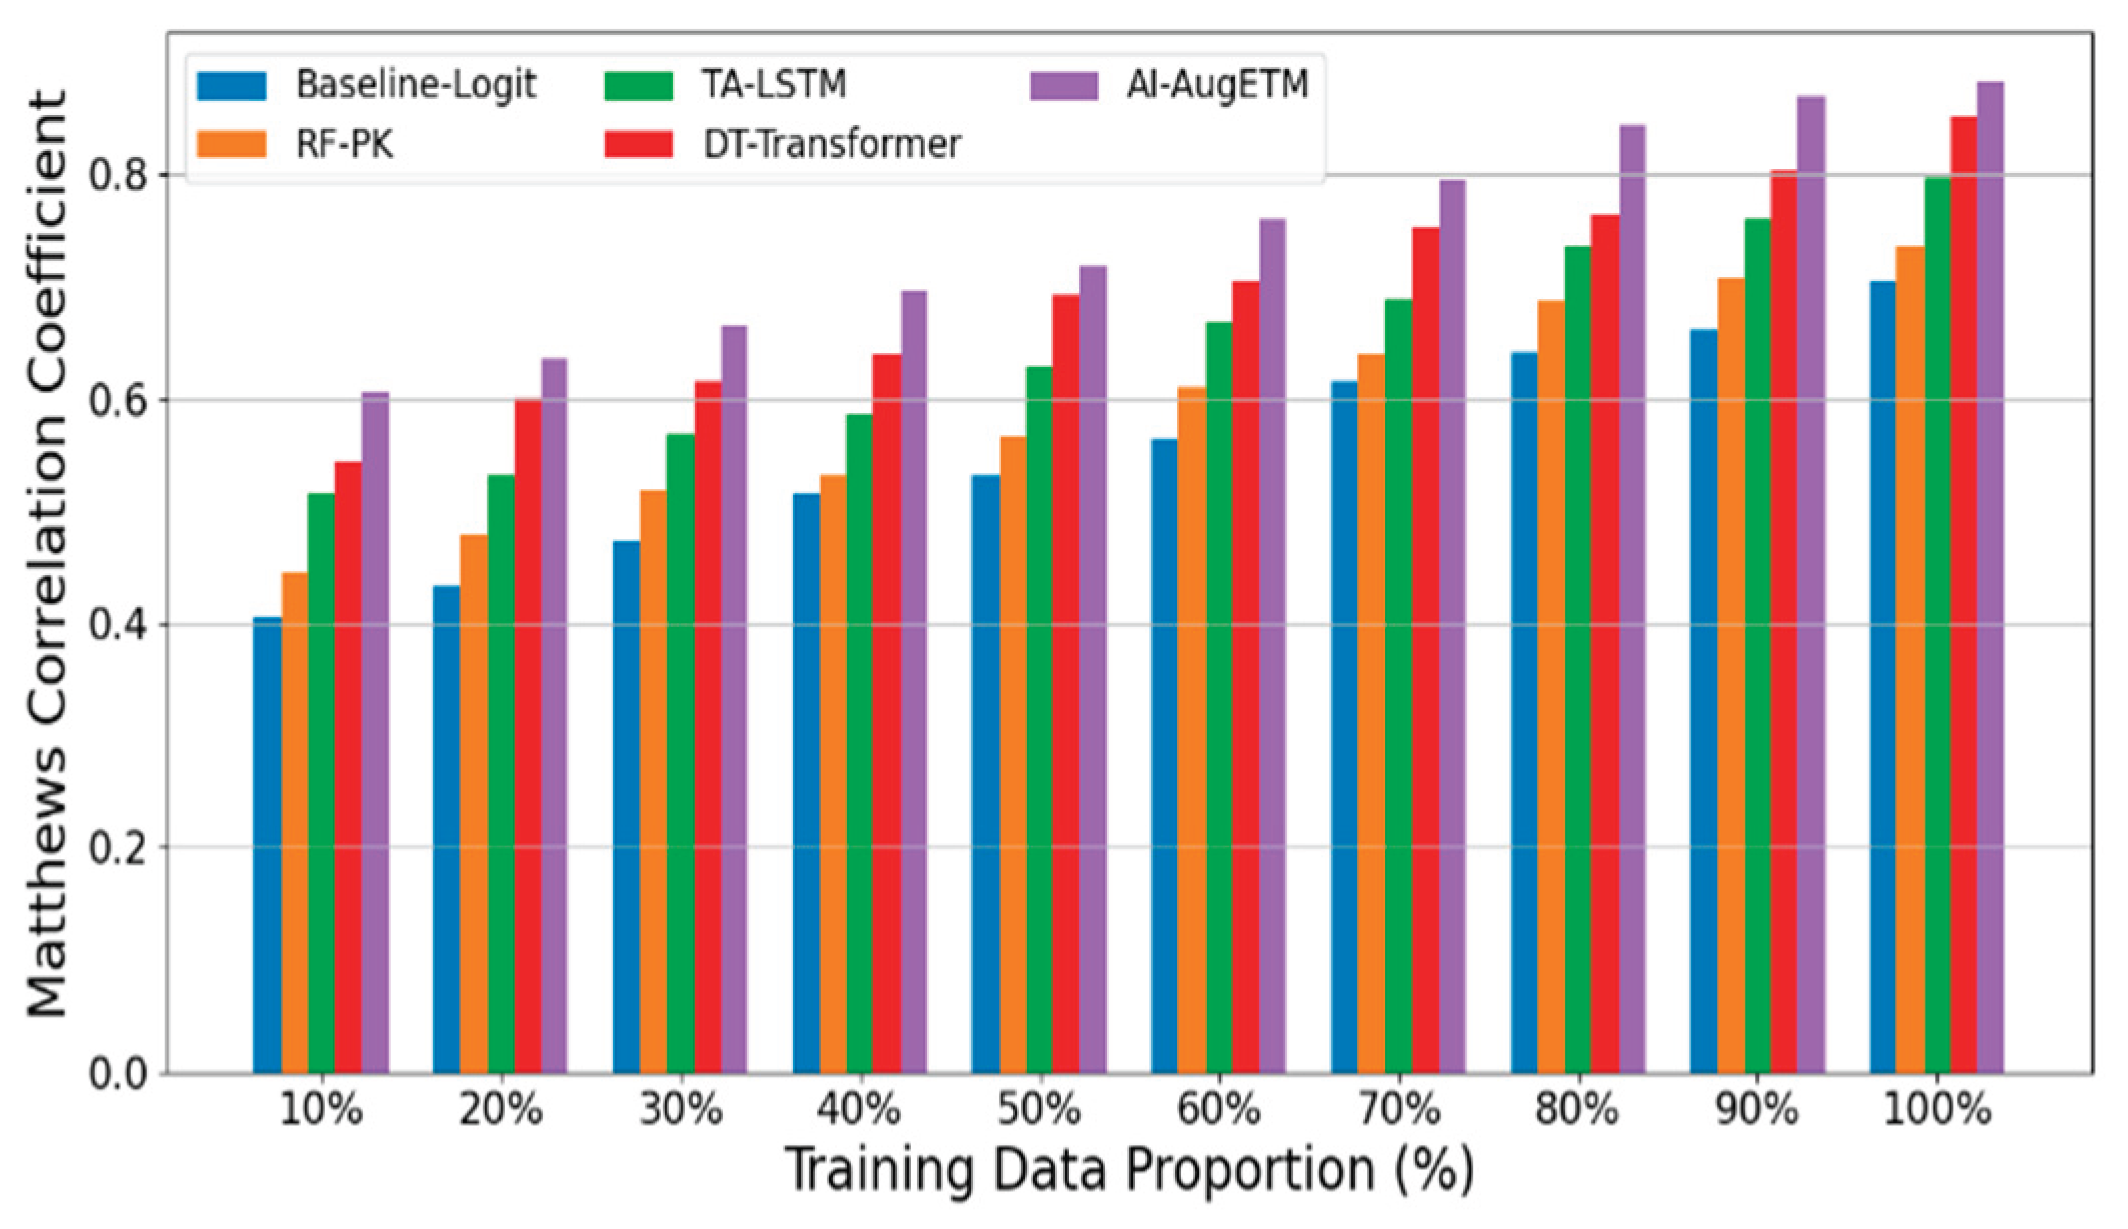

Table 1.
Exposure Decision Range Accuracy Results.
| Risk Tolerance Threshold (%) | Baseline-Logit | RF-PK | TA-LSTM | DT-Transformer | AI-AugETM |
| 5 | 0.504967 | 0.545366 | 0.614656 | 0.643983 | 0.707385 |
| 10 | 0.526395 | 0.57312 | 0.62552 | 0.696301 | 0.729491 |
| 15 | 0.562032 | 0.607975 | 0.656231 | 0.705421 | 0.754399 |
| 20 | 0.598564 | 0.614201 | 0.669086 | 0.722756 | 0.780322 |
| 25 | 0.60877 | 0.643862 | 0.705667 | 0.769337 | 0.796326 |
| 30 | 0.636548 | 0.683266 | 0.739998 | 0.77668 | 0.83169 |
Disclaimer/Publisher’s Note: The statements, opinions and data contained in all publications are solely those of the individual author(s) and contributor(s) and not of MDPI and/or the editor(s). MDPI and/or the editor(s) disclaim responsibility for any injury to people or property resulting from any ideas, methods, instructions or products referred to in the content. |
© 2025 by the author. Licensee MDPI, Basel, Switzerland. This article is an open access article distributed under the terms and conditions of the Creative Commons Attribution (CC BY) license (https://creativecommons.org/licenses/by/4.0/).
Copyright: This open access article is published under a Creative Commons CC BY 4.0 license, which permit the free download, distribution, and reuse, provided that the author and preprint are cited in any reuse.


