
Submitted:
07 July 2025
Posted:
08 July 2025
You are already at the latest version
Abstract
Ensuring an adequate development length is a fundamental requirement for attaining the specified yield strength in concrete structural elements. This study investigates the tensile load response of cast-in-place headed anchor bolts, incorporating pullout strength data into the analysis. To facilitate this, an elasto-plastic concrete model is developed and integrated within the LS-DYNA simulation framework. Initially, the reliability and precision of the proposed model are verified through comparison with existing pullout test results. Subsequently, the framework is employed to assess the tensile performance of headed anchor bolts with varying embedment depth-to-diameter ratios. In this study, the parametric analysis includes several plain concrete slabs with varying compressive concrete strengths, anchor diameters, embedded depths, and yield strengths of steel. Observations reveal a substantial deviation in pullout strength at the conclusion of the monotonic loading steps when compared to the predictions of the Concrete Capacity Design (CCD) method. As the embedment depth-to-anchor dimension ratio decreases and the concrete strength increases, the discrepancy between the observed results and the CCD method predictions becomes significantly more evident. The CCD method underpredicts the concrete breakout capacity of anchor bolts embedded in plain concrete slabs with compressive strengths of 30 MPa and 40 MPa, whereas it overpredicts the capacity for concrete with a compressive strength of 20 MPa. The findings of the numerical investigation, which accounted for concrete strength, steel yield strength, and the embedment depth of cast-in-place headed anchors in unreinforced concrete slabs, led to the recommendation of a coefficient for estimating embedment depth as a function of anchor dimensions.
Keywords:
headed anchor
; pullout
; concrete cone failure
; finite element
; LS-DYNA
1. Introduction
Cast-in-place anchors function as anchorage systems widely utilized in both structural and non-structural components of civil engineering projects to transfer external loads to concrete elements—for example, securing steel structures to concrete foundations or facilitating load transfer in concrete column-beam connections. Headed anchor is one of the types of cast-in-place anchor with a specific geometry that is suitable alternative to hook anchor in order to decrease steel congestion in sections is designed as special type (Bashandy (1996) and Wallace et al. (1998)). Previous theoretical and experimental studies have demonstrated that when a single cast-in-place headed anchor experiences tensile loads, it exhibits two types of failure behavior: ductile and brittle failure. Within the realm of these failure modes, as depicted in Figure 1, In the load–displacement curves, both steel failure and pullout display the greatest displacement under peak loading, reflecting behavior typical of ductile failure. In cases of steel failure, the strength of a headed anchor is primarily governed by the cross-sectional area of the anchor head and the mechanical properties of the steel. Additionally, pullout failure depends on the embedment depth and cross-section. Brittle failure is observed in the cases of concrete cone and concrete splitting. These failure modes demonstrate rapid declines at peak load due to the rapid and unstable propagation of concrete cracks. Cracking in the anchoring zone results from brittle failure, which arises directly from mobilizing the maximum tensile strength of the concrete. In general conditions, one of the parameters to achieve the required yield strength of concrete elements is ensuring an effective development length. Under ideal conditions, a cast-in-place headed anchor subjected to tensile loading is expected to undergo maximum deformation at peak load at the point of failure. However, initially, the anchor should fail before the concrete loses its serviceability (Fuchs et al. (1995) and Nilforoush (2017)). In recent decades, numerous experimental and numerical investigations have been conducted to develop accurate models for estimating the anchorage strength and identifying the failure modes of anchor bolts embedded in concrete structural elements. However, two main reference principles have been assumed for predicting and calculating the failure mechanism mode and strength of headed anchors. The first theoretical model, concrete cone model has been presumed a projected circular area and an inclination of 45-degree angle to concrete surface, which was mentioned into ACI 349 (1985). The second model, known as the Concrete Capacity Design (CCD) approach, was proposed by Fuchs et al. (1995) to evaluate the tensile load-carrying capacity related to concrete cone fracture. The CCD method considers the formation of a concrete failure cone inclined at 35 degrees relative to the surface. This idealized failure region spans an approximate area of 3 × 3 across the concrete face, as illustrated in Figure 2.
To determine the nominal strength associated with concrete cone failure of a cast-in-place single anchor subjected to tensile loading, the CCD method provides a predictive framework based on geometric and material parameters:
In this context, represents the mean nominal concrete cone strength factor, as defined by Fuchs et al. (1995), used to estimate the average breakout capacity of a headed anchor embedded in uncracked concrete, with a value of 16.8. The term denotes the effective embedment depth of the anchor, measured in millimeters. According to ACI 318-19, the coefficient k used in calculating the ultimate tensile strength of a cast-in-place single anchor is 10, whereas for a post-installed anchor, it is 7. Equation (2) presents the expression for calculating for a cast-in-place anchor.
Considering the ‘shallow’ and ‘deep’ embedment depths of the anchor, which are determined by the relationship between embedment depth and the distance to the nearest concrete surface, tests have shown that the shallow embedment depth is characterized by cone failure, while the deep embedment depth is associated with side-blow out failure (DeVries (1996)). According to Eligehausen et al. (2006), an increase in embedment depth leads to a steeper crack inclination within the failure cone. Moreover, the anchorage capacity of a headed anchor is enhanced when the surrounding concrete section is confined by parallel reinforcement. In contrast, longitudinal reinforcement has been shown to have no significant impact on anchorage capacity (Choie, 2002). Observations regarding the effects of anchor head size and member thickness indicate that the ultimate tensile strength of the concrete cone increases with larger anchor head dimensions and greater concrete member thickness (Nilforoush, 2017). The CCD method has been observed to yield unconservative predictions of tensile breakout capacity for short-headed anchors (≤ 100 mm). Conversely, for deep anchors (> 200 mm), it provides overly conservative estimates (Nilforoush, 2017). Investigations into the effects of concrete compressive strength and anchor embedment depth within the CCD framework have further revealed that seismic tensile strength is lower than the nominal values prescribed by current design codes. As a result, a revised k-value has been proposed to improve the accuracy of seismic strength predictions (Shafei, 2021). Finally, the anchorage strength provisions for headed anchors outlined in Chapter 17 of ACI 318-14 were found to be excessively conservative so new provisions were recommended and proposed to ACI 318-19 and 25 (Darwin et.al (2018, 2019 and 2023)).
Recent investigations have confirmed the predictive accuracy of the CCD method in estimating the ultimate tensile capacity of cast-in-place anchors embedded in unreinforced concrete, thereby reinforcing its validity for design applications. The primary contribution of this study is the development of a pullout model for cast-in-place headed anchors, grounded in the CCD methodology, to evaluate the ultimate tensile strength of anchor bolts embedded in unreinforced concrete. The accuracy of the proposed model is critically examined, and its applicability is assessed through a series of tensile pullout analyses. Three parameters, namely compressive strength of concrete, embedded depth, and yield stress of steel, have been selected as key factors to measure the tensile anchorage strength. Section 2 outlines the key parameters affecting the anchorage behavior of headed anchors. Section 3 details the validation process of both the experimental pullout tests and the numerical model. In Section 4, the pullout behavior of cast-in-place headed anchors is examined, including the evaluation of ultimate anchor strength and the prediction of effective embedment depth. Finally, Section 5 provides a summary of the key findings derived from the study.
2. Factors Affecting the Anchorage Performance of Headed Anchors
2.1. Anchor Head Geometry and Bearing Capacity Ratio
The headed anchor is recognized due to the unique geometry of its head section. The head geometry is accountable for transferring the tension load from the steel anchor to the concrete located beneath the anchor’s head, so the head section plays a significant role in the anchorage mechanism. The concept of net bearing area is of critical importance in the assessment of anchorage strength. The area is recommended in ACI 318-19 to be at least 4 times the area of the bar. Totally, the bond capacity of headed anchors depends on length, dimensions, shape, and head geometry. The load–displacement curve for unreinforced concrete shows that increasing the anchor head size substantially enhances the ultimate load while significantly reducing the displacement at peak load. Despite this, post-peak observations reveal that anchors with larger heads tend to fail in a brittle manner, whereas those with smaller heads exhibit more ductile behavior (Nilforoush, 2017). Among the different shapes of head anchors (circular, square, elliptical, rectangular,), the circular anchor shape is considered the most efficient (kawale. A 2016). In this study, the head section has been chosen according to ACI 318-19, which is mentioned in chapter 25.
2.2. Compressive Strength of Concrete
To examine the influence of concrete strength on anchor capacity, Rao and Sundeep (2013) conducted an experimental study and reported that anchorage strength increases with higher concrete compressive strength. Similarly, Vella et al. (2018), through tensile and flexural testing, observed a comparable trend in the performance of headed anchors
2.3. Embedment Depth
An adequate embedment length of a headed anchor is essential to ensure the effective performance of reinforced concrete elements under applied loads. The embedment length () is defined as the distance from the surface of the anchor head to the surface of the concrete, as illustrated in Figure 3. As the embedment depth increases, anchorage capacity correspondingly improves, contributing to a reduction in slip at the anchor head. Moreover, embedment depth significantly influences the failure mode. Shallow embedment typically leads to concrete cone failure, characterized by brittle behavior, whereas deep embedment often results in steel failure, exhibiting ductile behavior. Additionally, the size and surface area of the failure cone are largely dependent on the embedment depth (Bakir et al., 2002; Lee et al., 2007; Kawale et al., 2016; DeVries, 1996; Nilforoush, 2017; Delhomme et al., 2016; Bujnak, 2012).
3. Validation of Pullout Test
This section focuses on modeling the pullout behavior of cast-in-place headed anchors using LS-DYNA, with validation performed through comparison of simulation results against experimental data. For this purpose, a laboratory specimen from the study by Nilforoush et al. (2017) was modeled for verification.
The experimental setup referenced in this study, illustrated in Figure 3, comprises a plain concrete box measuring 1300 × 1300 × H mm, into which a single cast-in-place headed anchor is embedded. The steel headed anchor bolt is centrally located and features an effective embedment depth of = 220 mm. The anchor type used is an M36 standard threaded rod, with a shaft diameter of 36 mm, a head diameter of 55 mm, and a head thickness of 30 mm. Due to the thin plastic coating on the anchor, there is a complete absence of friction and adhesion between the rod and the concrete substrate. The yield strength (fy) of the steel headed anchor, which is used for the rod and head sections, are 900 and 1000 MPa, respectively. The selected model for validation in Nilforoush tests is mentioned as NPC330. The input data and models are reported in Table 1. The test setup includes a steel support ring with an inner diameter of 880 mm, on which the concrete slab is placed. The load is applied to the anchor shaft using a hydraulically operated actuator with displacement control.
3.1. MAT-159 (Mat-CSCM-Concrete)
One of the important aspects of the present study is to choose a suitable concrete material that performs well under tensile load and demonstrates the algorithm of cracking in tension. However, among the various finite element software options available for simulation, LS-DYNA stands out for its good accuracy, comprehensive library of concrete materials and numerous interactions between concrete and steel anchors. A review of the concrete material models available in LS-DYNA identifies four primary plasticity-based formulations: MAT_273 (Concrete Damage Plasticity Model), MAT_84 (Winfrith Concrete), MAT_72 (Concrete Damage), and MAT_159 (Continuous Surface Cap Model – CSCM Concrete). Among these, MAT_159 was selected for detailed analysis in the present study.
The CSCM concrete model, initially developed for roadside safety applications, represents a comprehensive material model for concrete within a finite element code, particularly in scenarios involving tensile loads. It includes an option for implementing peak strength through cap retraction. Figure 4 illustrates the characteristic shape of the CSCM yield surface. This model utilizes a multiplicative formulation that integrates the shear failure surface with a pressure-dependent hardening cap. As a cap-type plasticity model, CSCM ensures a smooth and continuous intersection between the failure envelope and the hardening cap. After an initial elastic phase, the concrete may undergo yielding and potential failure depending on the stress conditions. Yield behavior is governed by a three-dimensional yield surface, defined in terms of three stress invariants: the first invariant of the stress tensor (J1), and the second and third invariants of the deviatoric stress tensor (J′2 and J′3) (Murray, 2009). These invariants are derived from the deviatoric stress tensor components (Sij) and the hydrostatic pressure (P).
The yield criterion based on three stress invariants is derived from Equation (6) and is governed by the compaction-related hardening parameter k.
Here, Ff represents the shear failure surface, Fc denotes the hardening cap, and R represents the Rubin three-invariant reduction factor. The cap hardening parameter, κ, corresponds to the value of the pressure invariant at the intersection of the cap and shear surfaces. Concrete strength is represented by two distinct surface models: the shear failure surface and the cap surface. The shear surface model is primarily applicable under tensile stress conditions and low confining pressure, as described by equation (7):
In this formulation, the parameters α, β, λ, θ are calibrated by correlating the model response with experimental strength data obtained from tests on unreinforced concrete cylinders. The integrated application of the shear and cap surface models addresses the behavior of concrete across low to high confining pressure regimes, as expressed in equation (8):
L(κ) is defined:
The function Fc assumes a value of unity when J1≤L(κ). However, concrete demonstrates softening behavior in tensile and low to moderate compressive stress regimes. This softening is captured through the transformation of viscoplastic stress into damaged stress, as described by equation (10):
The scalar damage parameter, denoted as d, induces a transformation of the viscoplastic stress tensor represented as σvp, into the damaged stress tensor, denoted as σd.
3.2. Pullout Model
In this section the numerical model is developed. In the same direction a Plastic-Kinematic material (MAT_003) has been selected to simulate the cast-in-place steel headed anchor. In this case, the anchor is modeled as a solid type and is subjected to a tensile load, which is adapted using the features of MAT_003. The MAT_003 material model in LS-DYNA is specifically designed to accurately represent the behavior of materials undergoing isotropic and kinematic hardening plasticity, while also providing the flexibility to incorporate rate effects. During the present study, isotropic hardening was considered and implemented in LS-DYNA by selecting β=1, as shown in Figure 7.
LS-DYNA offers a broad range of contact interaction definitions applicable to finite element models. When specifying contact between two solid element surfaces, the software provides two primary approaches: automatic and non-automatic. For explicit analyses, the automatic contact method is typically used, while non-automatic contacts are more common in implicit analyses (LSTC, 2014). In the present study, the interaction between the cast-in-place headed anchor and the surrounding concrete box is modeled using the CONTACT_AUTOMATIC_SURFACE_TO_SURFACE formulation. This contact definition establishes a bonded interaction between the anchor and concrete surfaces, utilizing the Slave and Master part assignment to monitor nodal positions and prevent interpenetration. According to the experimental setup, a round steel support featuring an inner diameter of 2 and an outer diameter of 2 + /2 (880 mm and 1100 mm, respectively) was placed directly on the concrete surface, as illustrated in Figure 5. The support was deliberately designed with sufficient dimensions to allow for the unrestricted formation of a concrete breakout cone, consistent with the CCD method. In the numerical simulation, this support is used to restrain vertical movement, and it is constrained in the X, Y, and Z directions as part of the boundary conditions. To simulate tensile loading on the headed anchor in LS-DYNA, the PRESCRIBED_MOTION_SET function is utilized. This function defines motion in the Z-direction at the top nodes of the headed anchor to apply the tensile load. The type of loading is specified as displacement-controlled. A mesh overview of the model is presented in Figure 6.
Based on the geometric configuration and mesh of the numerical model, the computed pullout strength is 345.2 kN, whereas the experimentally measured pullout strength is 319 kN, as reported in Table 2.
A comparison of force–displacement responses between the numerical and experimental results is presented in Figure 9 and Figure 10. The calculated error in pullout strength is approximately 8% at the displacement corresponding to failure (4.73 mm). Both the experimental and numerical curves exhibit a generally smooth profile. As shown in the crack patterns in Figure 9, fracture initiation is observed to occur sharply in both simulations. However, the post-collapse slope of the experimental curve, associated with energy dissipation, is noticeably steeper than that of the numerical counterpart. The formation of cone-shaped cracks between the anchor head and the concrete surface is responsible for the ultimate loss of load-carrying capacity. A quasi-static analysis was performed using an explicit solver, with the pullout duration extended to approximately ten times the model’s natural period (Figure 8) to ensure dynamic effects were minimized. Observations from Figure 9 indicate that the cracks originating at the anchor head propagate at an inclination angle of approximately 35 degrees. Overall, the developed numerical models demonstrate strong agreement with the experimental data in terms of ultimate load capacity and pullout behavior.
4. Parametric Study
Accurately defining the true load-carrying capacity and ensuring adequate ductility of a cast-in-place headed anchor under tensile loading are critical for achieving optimal structural performance. Additionally, the ACI 318-19 standard mentioned regulations to control the effective length and ultimate strength of anchorage, as well as the necessary protocols during implementation. The loading protocol adopted in this study was executed in phases using a monotonic displacement-controlled approach, continuing up to the point of failure displacement, as illustrated in Figure 8. This displacement-control approach was based on a motion set in the z-direction in LS-DYNA.
The parameters considered in this study for the analysis are presented in Table 3, consist of various anchor diameters (db), compressive concrete strength for the plain slab (), embedded depth (), and yield strength of the steel (fy). The interior and exterior diameter of the ring support (L) depend on the embedded depth of each model. The height of the plain slab (H) has been chosen to be twice the embedded depth. Additionally, the nominal strength, calculated using Equation (1), is reported to support subsequent discussions. Cross-sectional dimensions of the headed anchor, as selected by Chapter 25 of ACI 318-19, states that it should be four times the anchor diameter.
4.1. Strength Measure
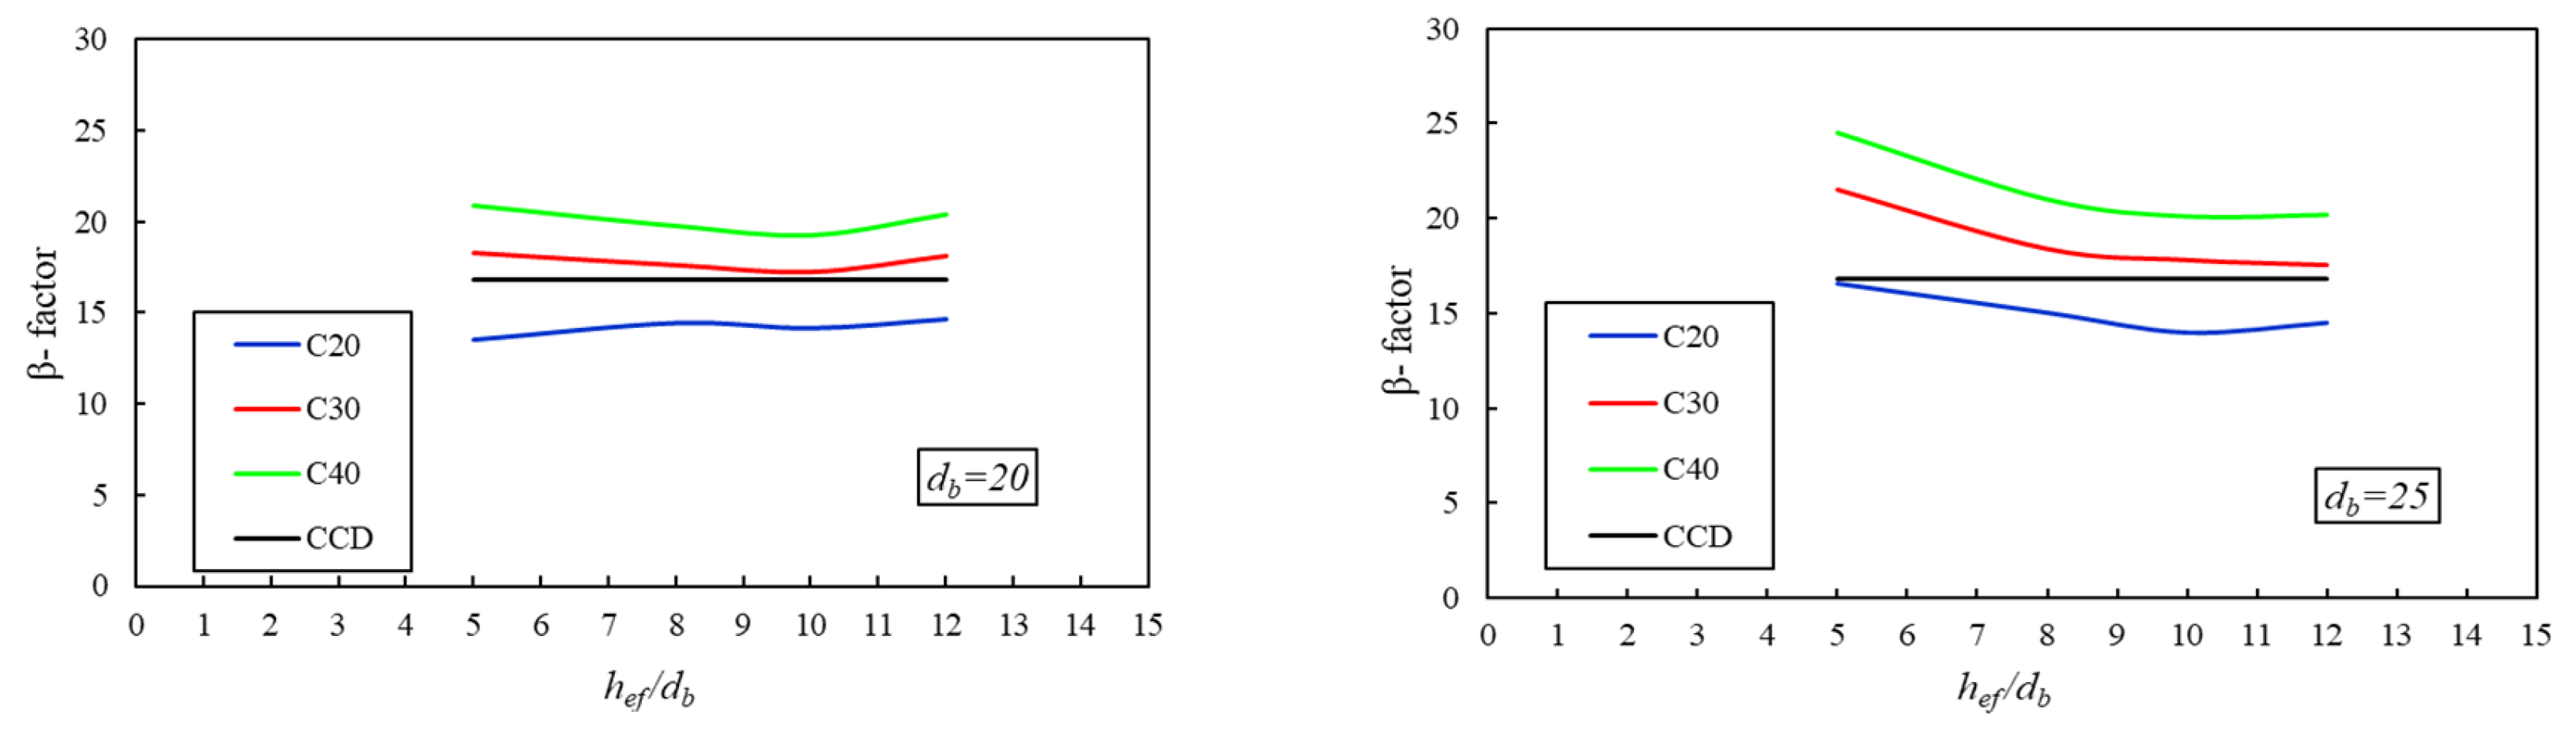
The concrete cone strength calculated using the ACI method from Eq. (2) (NACI), the concrete cone strength from the CCD method using Eq. (1) (NCCD), the β-factor which resulted from the numerical analysis and the LS-DYNA results (NFEM) are presented in Table 4. Additionally, Figure 11,12 and 13 illustrates the strength versus displacement curves from the pullout analyses conducted within the defined parametric space. As well, Figure 15 shows the variation of the estimated a new k factor as β versus hef /db. The factor β is a new variable that can be compared with the nominal k-value of 16.8 to evaluate the results. The cracking patterns observed in the modeled cast-in-place anchor bolts embedded within plain concrete slabs are illustrated in Figure 14. According to the observations, the cracking process initiates at the anchor head region and subsequently progresses toward the concrete surface at an inclination angle of 30∘≤ α ≤40∘. The failure rate of the concrete and the associated failure pattern, as the effective depth increases, have been effectively controlled, and a ductile behavior has been noted. Furthermore, the observed failure pattern correlates with the pattern derived from the CCD method. Upon reviewing the observations, the Concrete Capacity Design (CCD) method (Eq. 1) underestimates the concrete breakout capacity of anchor bolts embedded in plain concrete slabs with compressive strengths of 30 MPa and 40 MPa, while it overestimates the capacity for concrete slab with a compressive strength of 20 MPa. According to the results for headed anchors, which demonstrate both overestimation and underestimation, there is no consistent trend observed in comparison to the CCD (Concrete Capacity Design) method. For headed anchor bolts embedded in plain concrete slabs with low embedment depth, a trend exists where the pullout strength increased significantly as the embedment depth decreased in concrete slabs with 30 MPa and 40 MPa concrete strength. Remarkably, the anchor bolts with a size of 30 mm exhibit the most substantial difference. Actually, the manner of change and accuracy of convergence vary for each anchor size, according to the assumed parameters. Regarding the trend of the k-value, as the value of an increases for the 20 mm size anchor (the smaller anchor), the k-value initially shows greater convergence with the CCD method up to an embedment depth of = 10db. However, for deeper embedment depths, the k-value trend becomes upward. Additionally, the smallest disparity between the results obtained from the Concrete Capacity Design (CCD) method and the LS-DYNA results is observed when the = 10db and the concrete compressive strength is 30 MPa. In the case of cast-in-place headed anchors with large size and concrete slabs with low strength (anchor size of 30 mm and =20 MPa) under tensile loads, both overestimation and underestimation situations prevail, which needs review and more experimental studies for determine the final anchorage strength capacity. However, the headed anchor size of 25 mm with a concrete compressive strength of 30 MPa has the highest convergence to all assumed modes. The new k-factor is calculated using the relation. The gradient of the -factor trend line, as shown in Figure 16a,b, plotted against the compressive strength of concrete, represents the average of the -values calculated for each compressive of strength concrete and presented in Table 4 is equal to = 3.3652 . Based on three different concrete compressive strength values, namely 20 MPa, 30 MPa, and 40 MPa, an average value of the β-factor is proposed for practical use, with ≈ 15.25, ≈ 18.9, and ≈ 21.6, respectively. The results confirm a notable loss and gain in strength, so in this way, three standardized k-factors are recommended in design codes governing the tensile capacity of cast-in-place headed anchor bolts.

Table 4.
The parametric investigation explores the pullout resistance of cast-in-place anchor bolts under tensile loading.
Table 4.
The parametric investigation explores the pullout resistance of cast-in-place anchor bolts under tensile loading.
|
(mm) |
Case |
(mm) |
(Mpa) |
NACI (KN) | NCCD (KN) | NFEM (KN) | NFEM/NCCD | β | |
| 20 | C20-D20-H5 | 5 | 100 | 20 | 44.72 | 75.1 | 60.3 | 0.80 | 13.48 |
| C30-D20-H5 | 30 | 54.8 | 92.0 | 100.2 | 1.09 | 18.30 | |||
| C40-D20-H5 | 40 | 63.2 | 106.3 | 132.2 | 1.24 | 20.90 | |||
| C20-D20-H8 | 8 | 160 | 20 | 90.5 | 152.1 | 130.8 | 0.86 | 14.45 | |
| C30-D20-H8 | 30 | 110.9 | 186.2 | 195.4 | 1.05 | 17.62 | |||
| C40-D20-H8 | 40 | 128 | 215.04 | 253.2 | 1.18 | 19.78 | |||
| C20-D20-H10 | 10 | 200 | 20 | 126.5 | 212.5 | 179.0 | 0.84 | 14.15 | |
| C30-D20-H10 | 30 | 154.9 | 260.3 | 267.2 | 1.03 | 17.25 | |||
| C40-D20-H10 | 40 | 178.9 | 300.53 | 344.8 | 1.15 | 19.27 | |||
| C20-D20-H12 | 12 | 240 | 20 | 166.3 | 279.3 | 244.0 | 0.87 | 14.67 | |
| C30-D20-H12 | 30 | 203.6 | 342.1 | 369.2 | 1.08 | 18.13 | |||
| C40-D20-H12 | 40 | 235.15 | 395.05 | 480.0 | 1.22 | 20.41 | |||
| 25 | C20-D25-H5 | 5 | 125 | 20 | 62.50 | 105.00 | 103.49 | 0.99 | 16.56 |
| C30-D25-H5 | 30 | 76.55 | 128.60 | 164.82 | 1.28 | 21.53 | |||
| C40-D25-H5 | 40 | 88.39 | 148.49 | 216.30 | 1.46 | 24.47 | |||
| C20-D25-H8 | 8 | 200 | 20 | 126.49 | 212.51 | 190.00 | 0.89 | 15.02 | |
| C30-D25-H8 | 30 | 154.92 | 260.26 | 284.88 | 1.09 | 18.39 | |||
| C40-D25-H8 | 40 | 178.89 | 300.53 | 375.30 | 1.25 | 20.98 | |||
| C20-D25-H10 | 10 | 250 | 20 | 176.78 | 296.98 | 247.00 | 0.83 | 13.97 | |
| C30-D25-H10 | 30 | 216.51 | 363.73 | 385.30 | 1.06 | 17.80 | |||
| C40-D25-H10 | 40 | 250.00 | 412.88 | 502.20 | 1.22 | 20.09 | |||
| C20-D25-H12 | 12 | 300 | 20 | 232.38 | 390.40 | 336.70 | 0.86 | 14.49 | |
| C30-D25-H12 | 30 | 284.60 | 478.14 | 498.90 | 1.04 | 17.53 | |||
| C40-D25-H12 | 40 | 328.63 | 559.49 | 662.80 | 1.18 | 20.17 | |||
| 30 | C20-D30-H5 | 5 | 150 | 20 | 82.16 | 138.03 | 133.79 | 0.97 | 16.28 |
| C30-D30-H5 | 30 | 100.62 | 169.05 | 210.66 | 1.25 | 20.94 | |||
| C40-D30-H5 | 40 | 116.19 | 195.20 | 291.80 | 1.49 | 25.11 | |||
| C20-D30-H8 | 8 | 240 | 20 | 166.28 | 279.35 | 294.40 | 1.05 | 17.71 | |
| C30-D30-H8 | 30 | 203.65 | 342.13 | 428.29 | 1.25 | 21.03 | |||
| C40-D30-H8 | 40 | 235.15 | 395.05 | 583.30 | 1.48 | 24.81 | |||
| C20-D30-H10 | 10 | 300 | 20 | 377.12 | 390.00 | 372.00 | 0.95 | 16.02 | |
| C30-D30-H10 | 30 | 232.38 | 478.20 | 545.40 | 1.14 | 19.16 | |||
| C40-D30-H10 | 40 | 284.60 | 552.10 | 715.00 | 1.30 | 21.75 | |||
| C20-D30-H12 | 12 | 360 | 20 | 305.47 | 513.19 | 493.61 | 0.96 | 16.16 | |
| C30-D30-H12 | 30 | 374.12 | 628.53 | 720.73 | 1.15 | 19.26 | |||
| C40-D30-H12 | 40 | 432.00 | 725.76 | 928.70 | 1.28 | 21.50 |
Figure 13.
Pullout response of the cast-in-place headed anchor with a diameter of 30 mm.
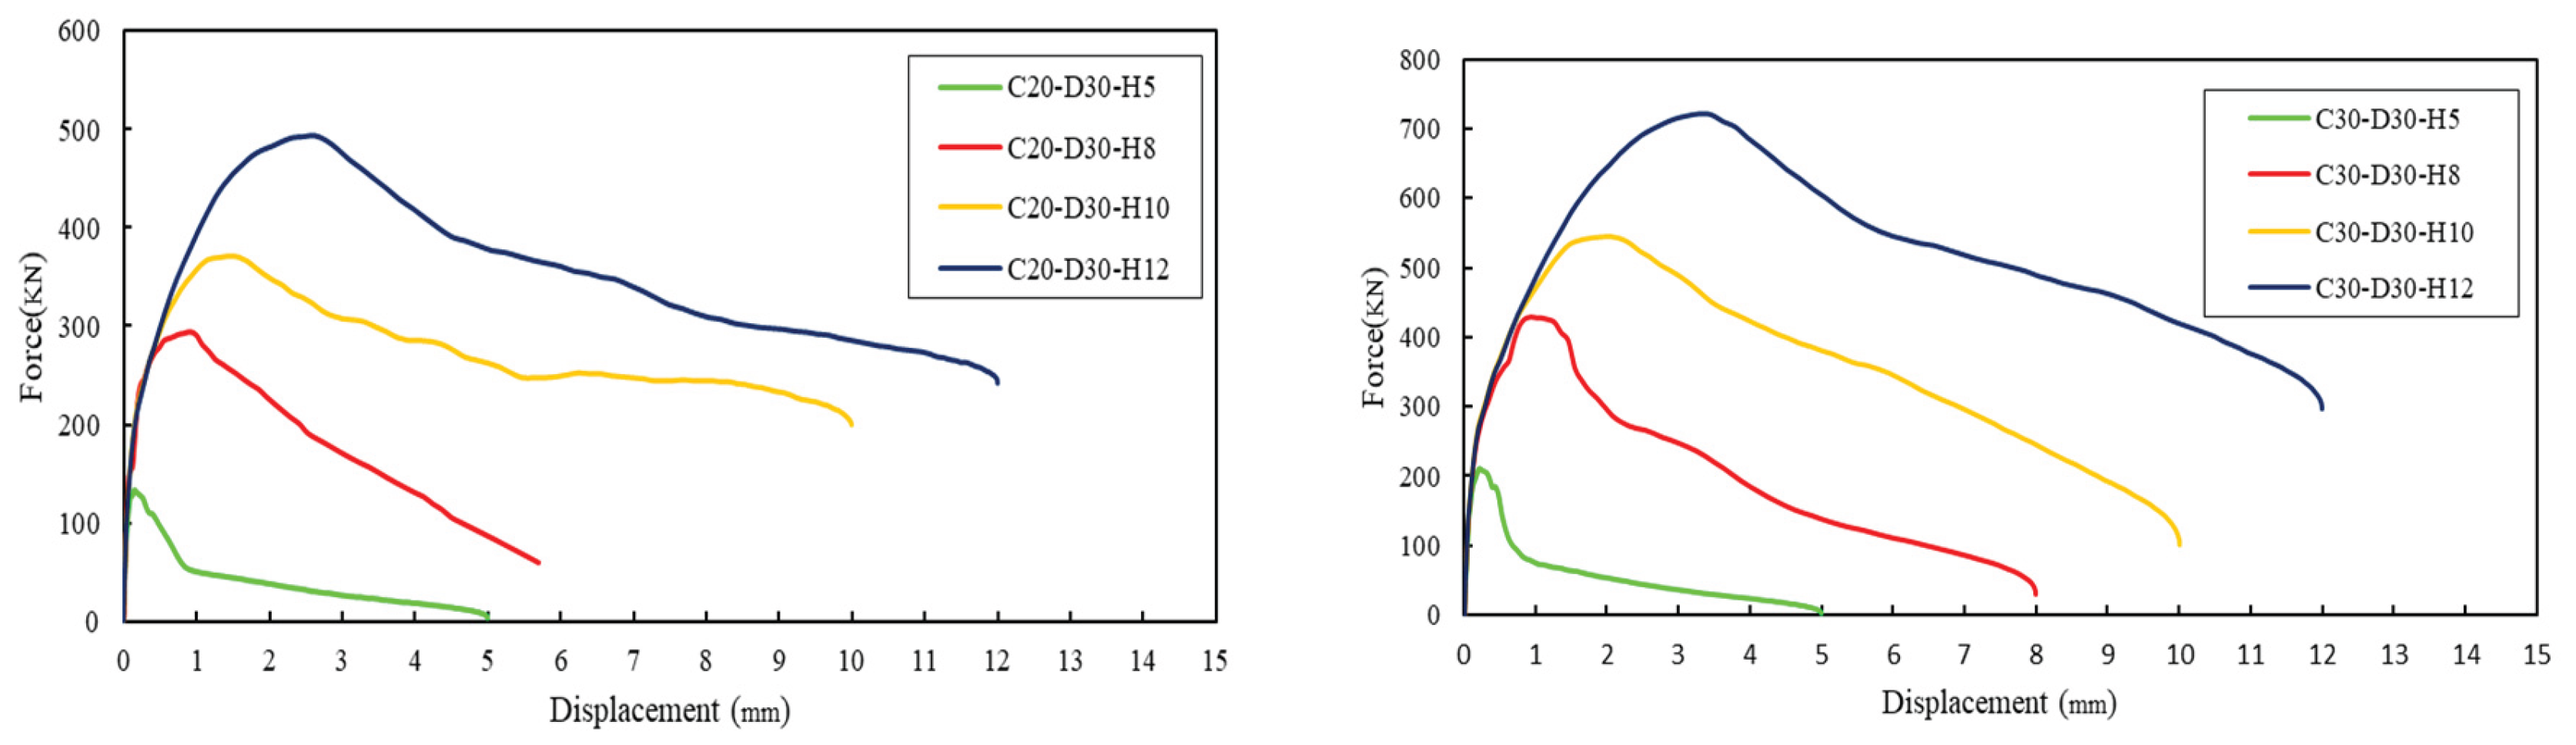
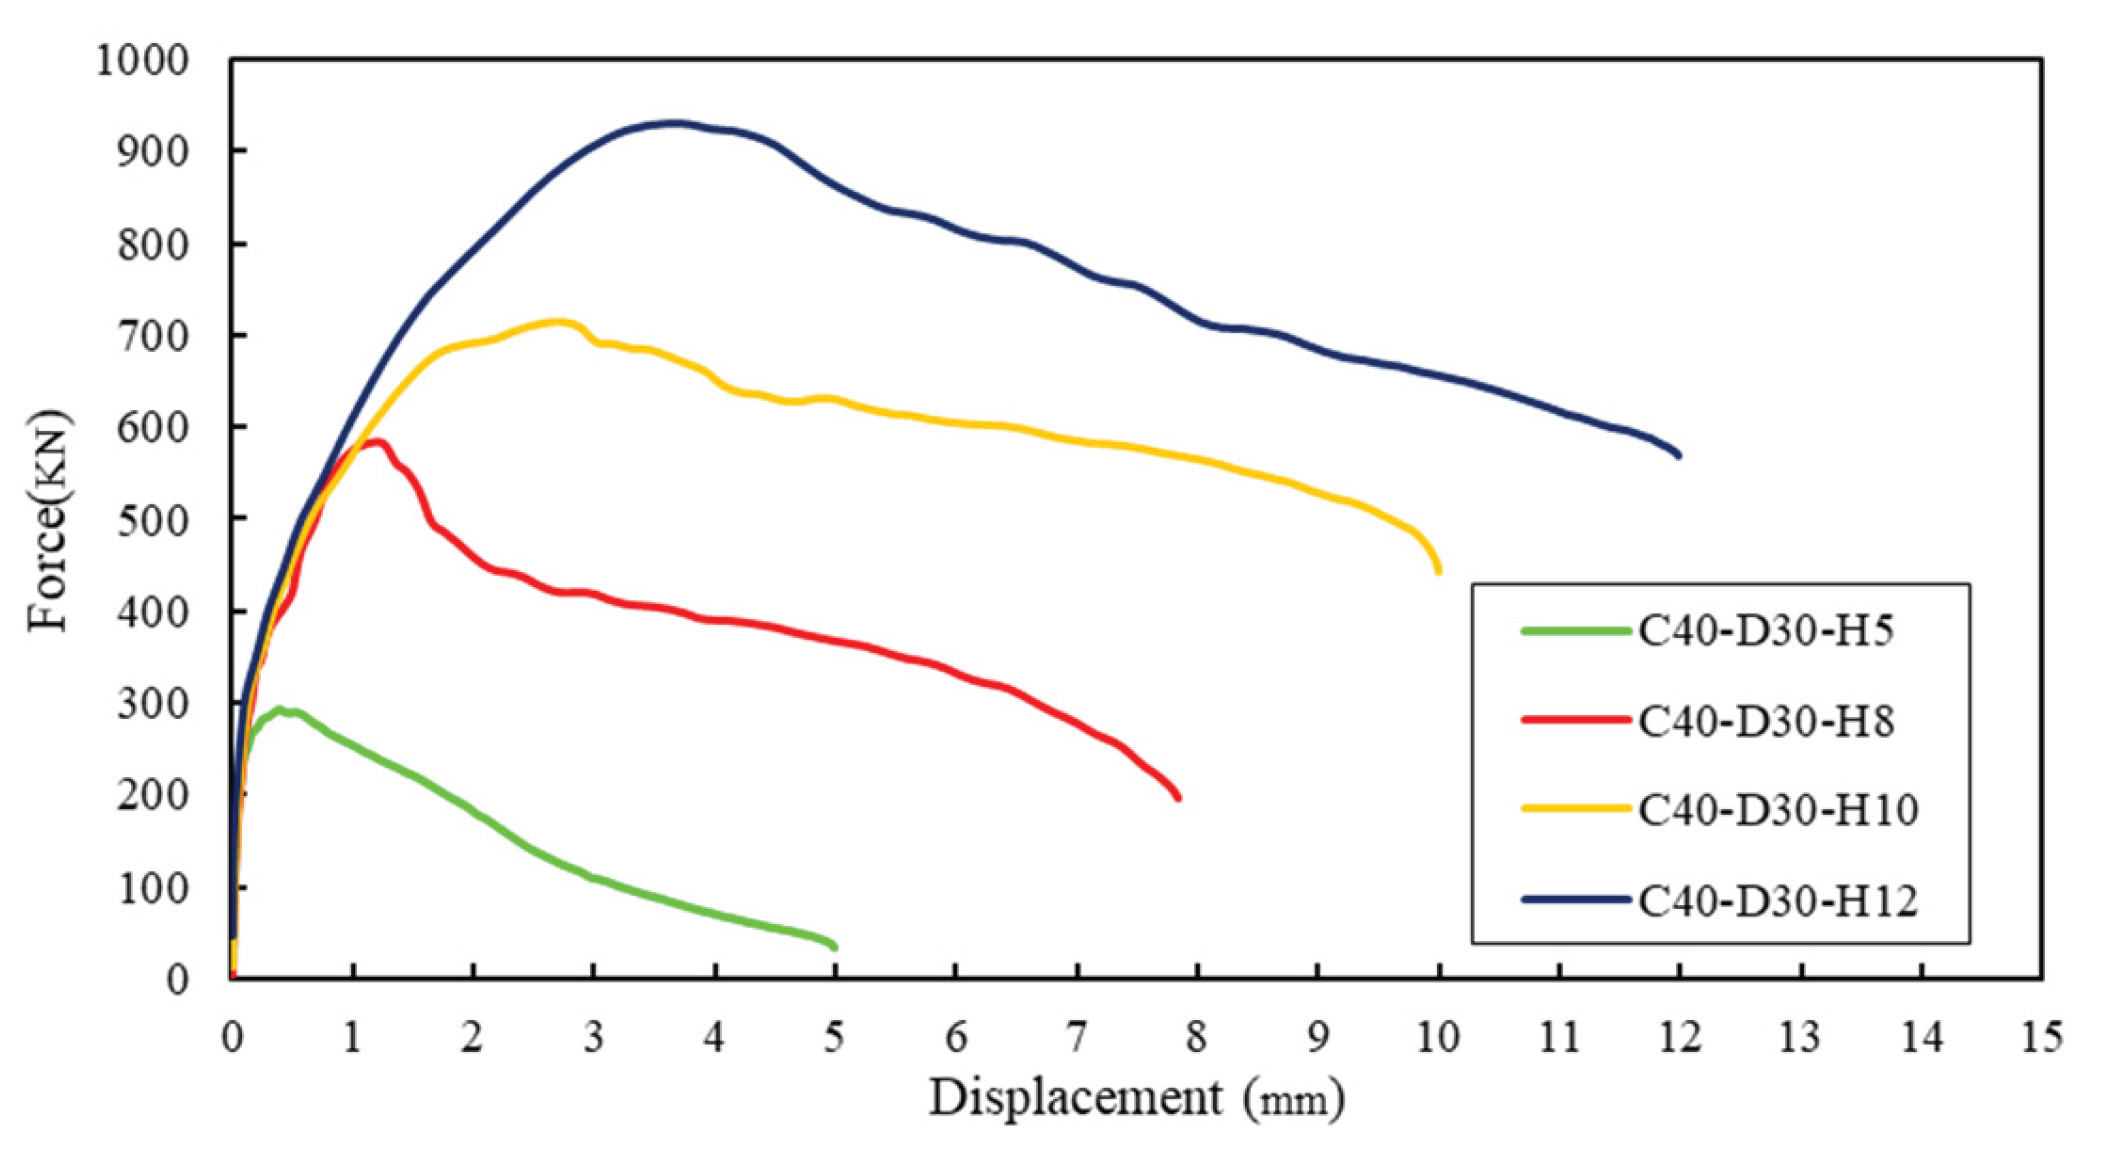
Figure 14.
Crack patterns of the selected cast-in-place anchor bolt models.
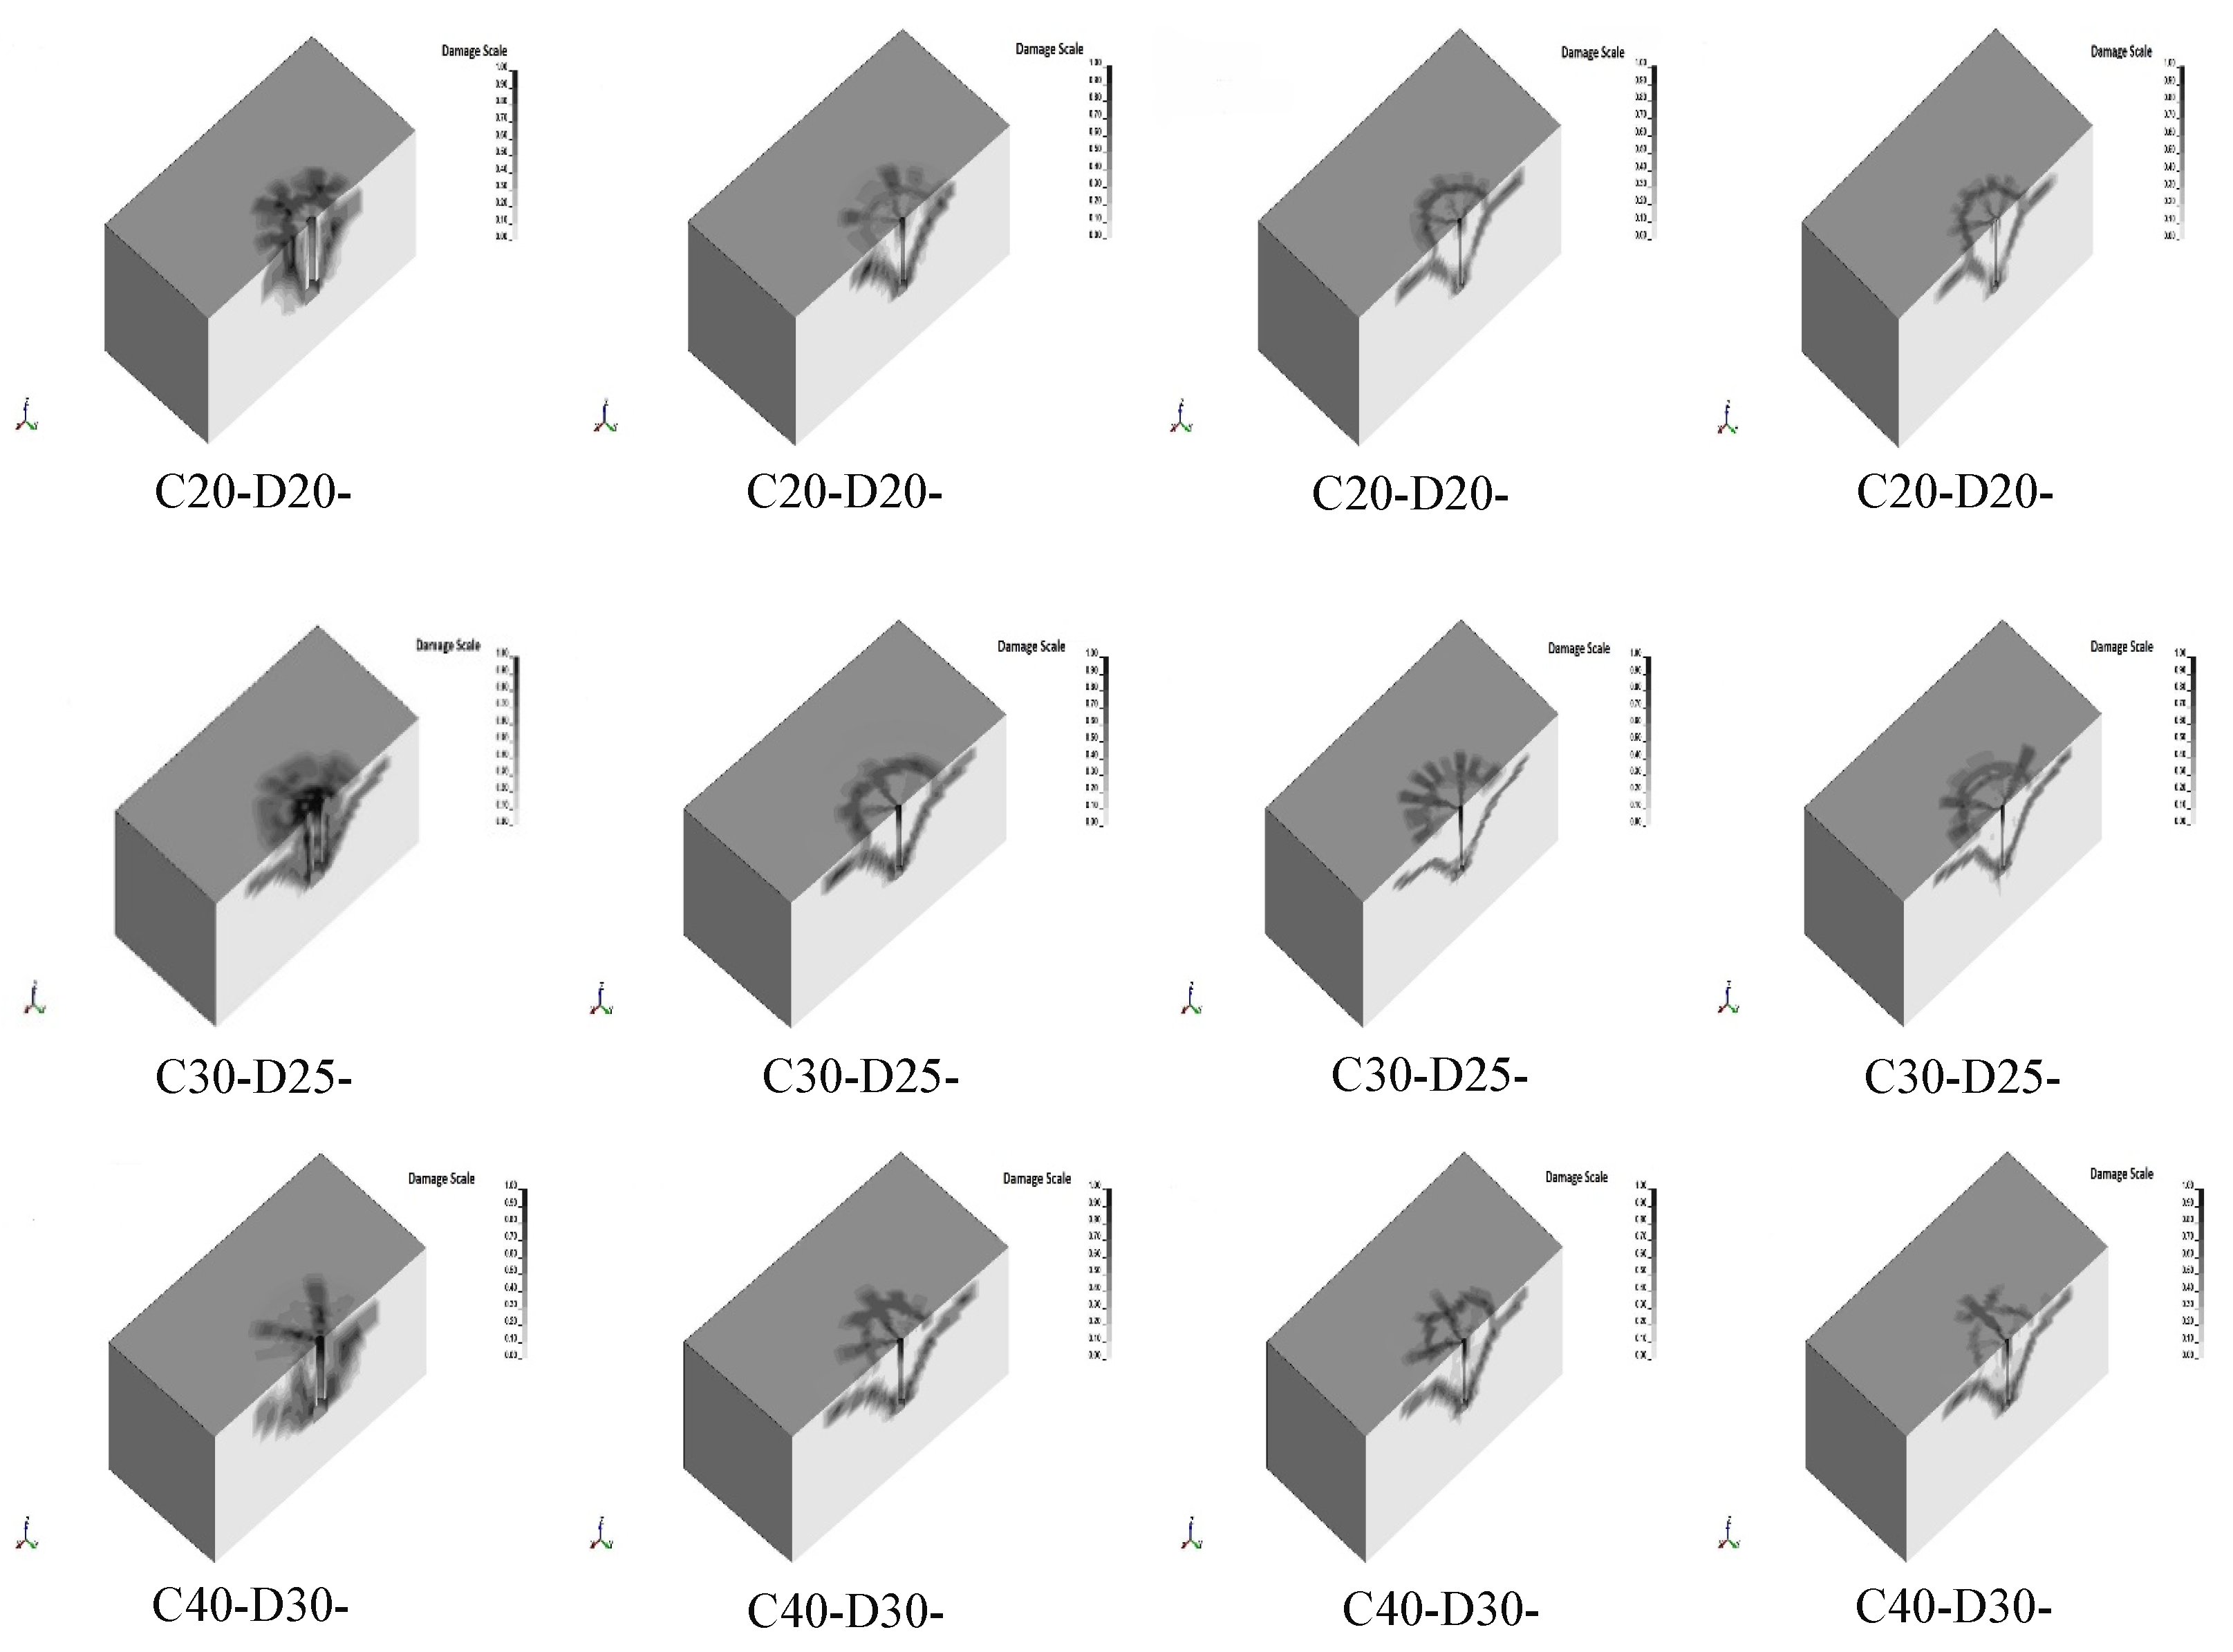
Figure 16.
Results of the β-factor (FEM) of the modeled cast-in-place anchor bolts.
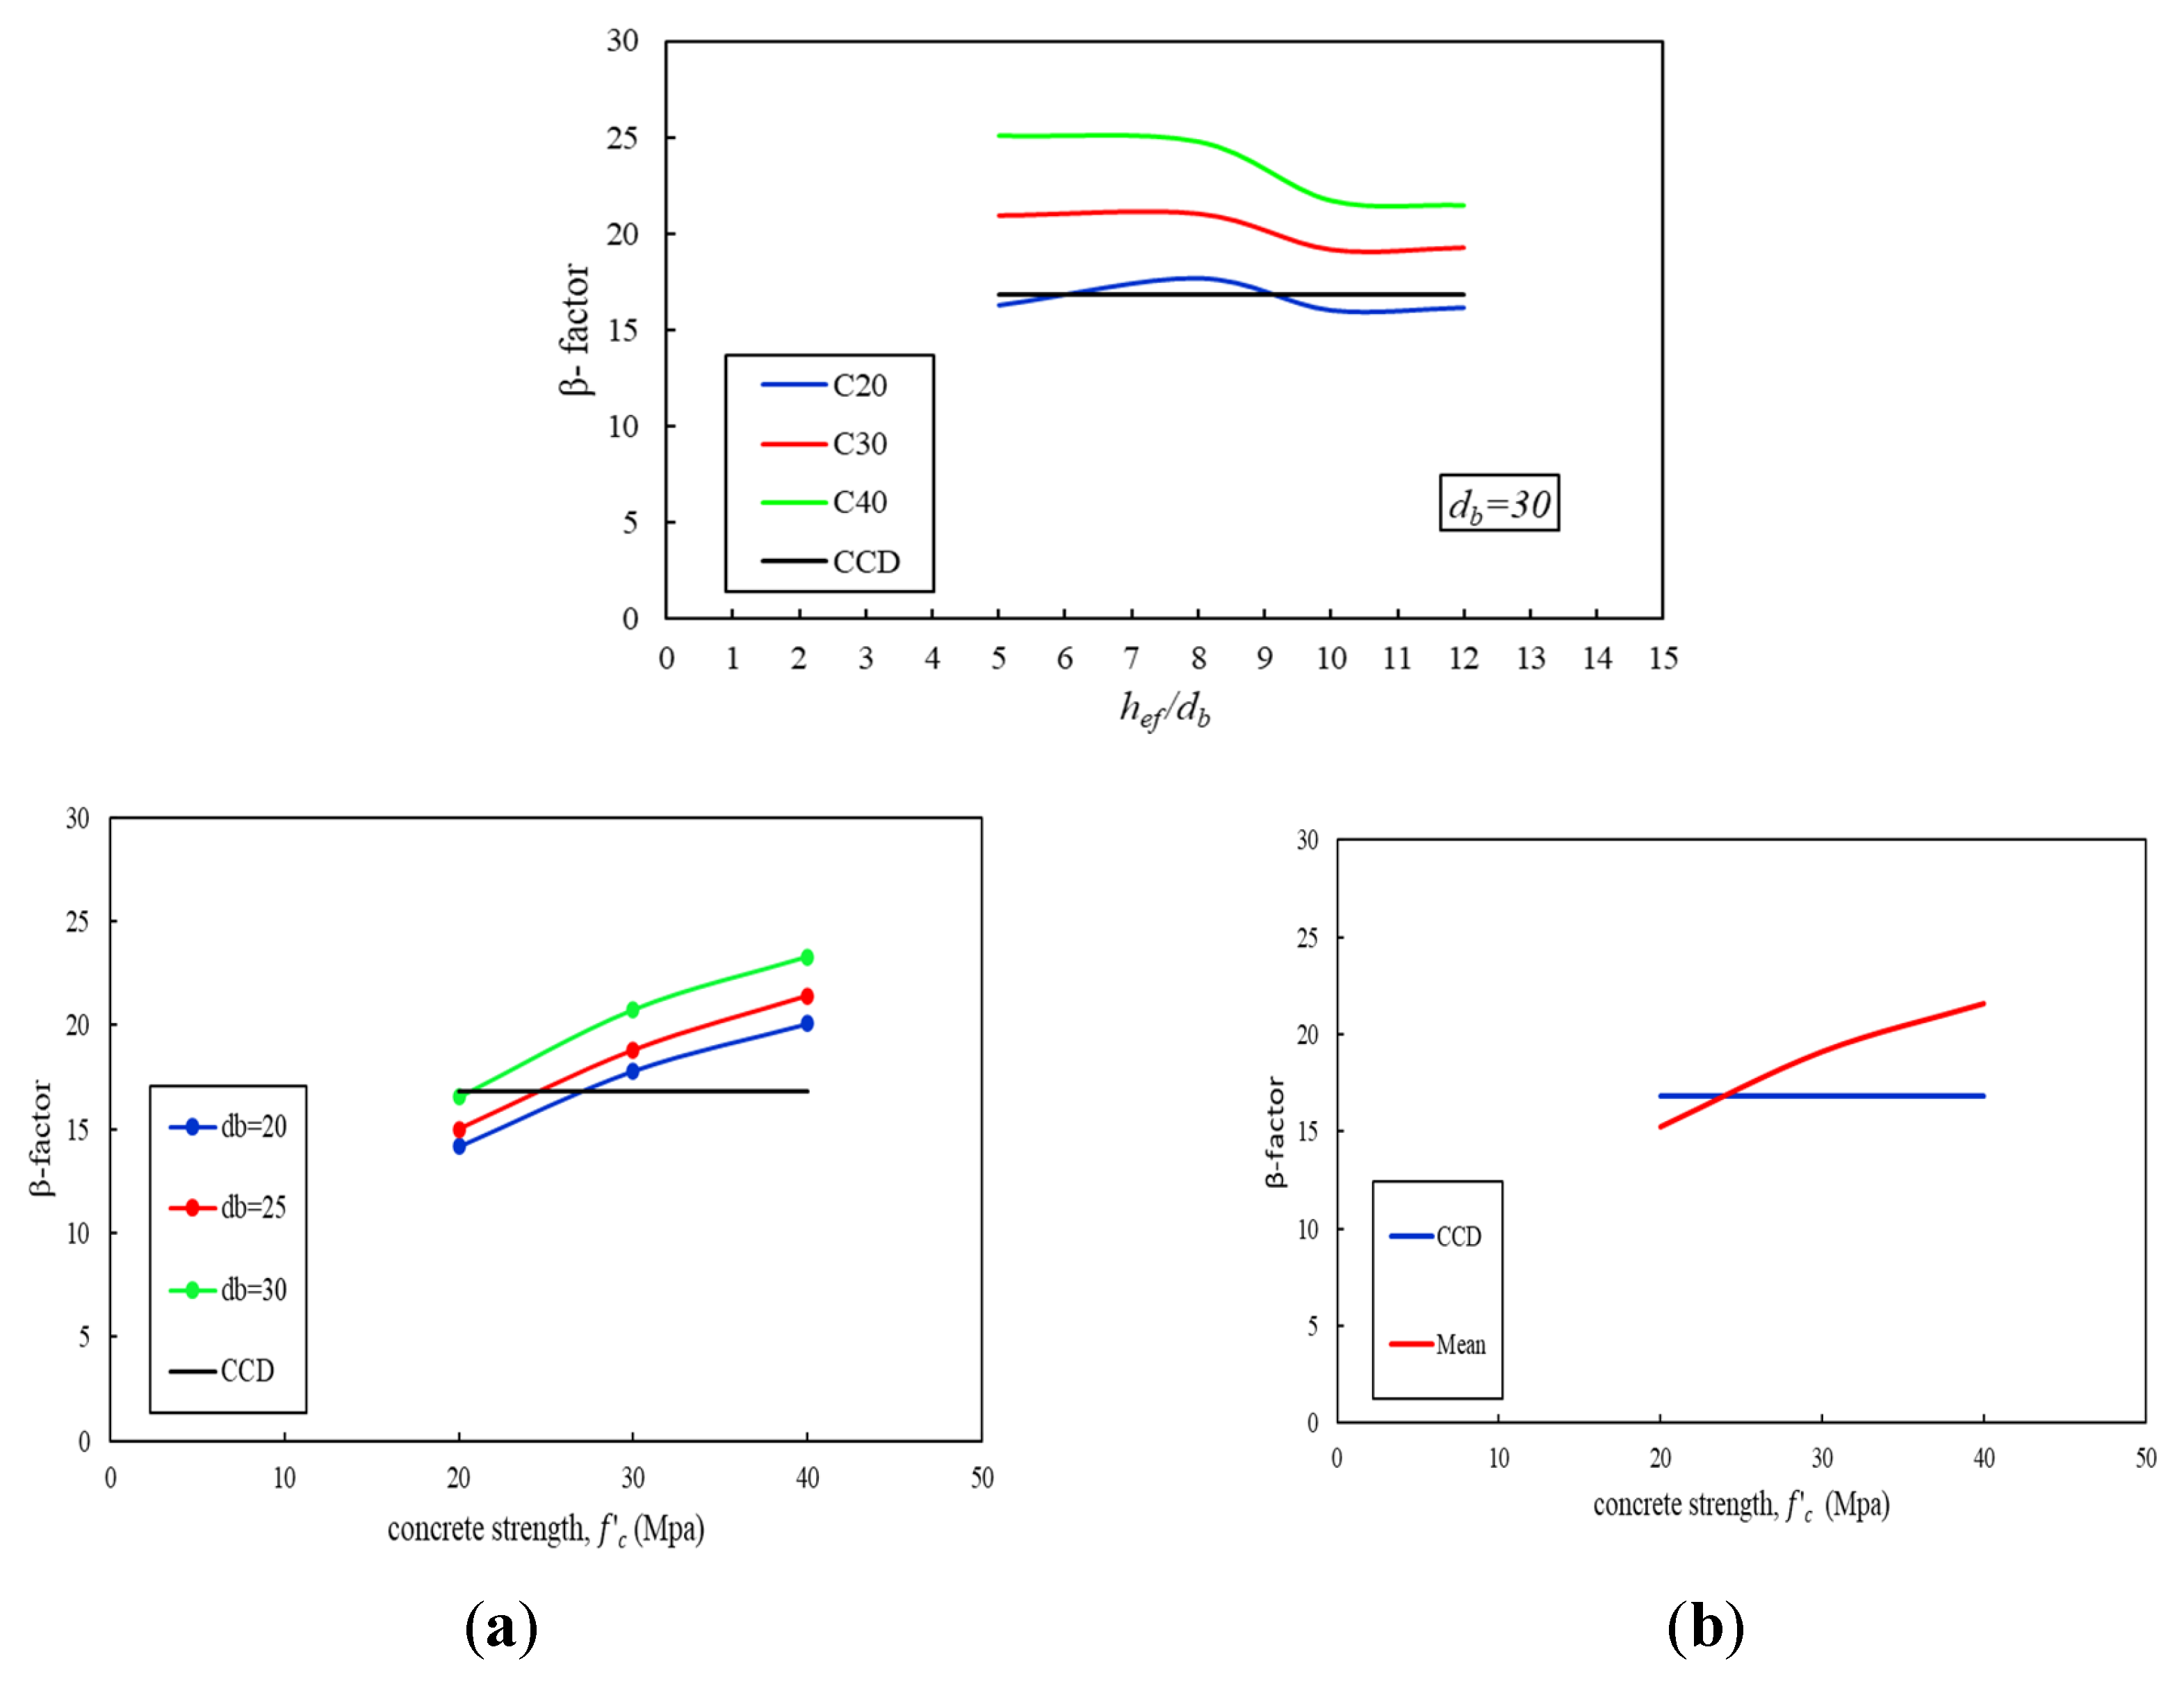
4.2. Prediction of Embedment Depth
Predicted embedment depths () for headed anchors with diameters of 20, 25, and 30 mm, considering various concrete compressive strengths (f’c) and steel yield strengths (fy), were derived from the analysis data and are presented in Table 4. Table 5 provides the corresponding coefficients for estimating the embedment depth of cast-in-place headed anchors. Based on observation for each compressive strength of headed size there is a coefficient ( with specific yield strength of steel. The coefficient is calculated as . By evaluating the coefficients corresponding to each level of concrete strength and steel tensile capacity, the optimal embedment depth for headed anchors can be determined as a function of anchor diameter. This ideal embedment depth, as shown in Figure 1, will provide the maximum strength at and greatest displacement at peak load for the headed anchor subjected to tensile load. Moreover, the embedment depth for cast-in-place headed anchors in unreinforced concrete slabs can be calculated using the expression ℎef= θdb, where db is the anchor diameter and θ is the embedment coefficient. According to the findings, a coefficient of the anchor diameter is proposed for the embedment depth (), considering both concrete strength and steel yield strength. Therefore, Figure 17 shows for a concrete slab with 20 MPa concrete slab with 20 MPa concrete strength which has a headed anchor embedded in it with 300 MPa, 400 MPa and 500 MPa yield strengths the θ values are 7, 8.2 and 9.1 respectively. For 30 MPa concrete strength and the yield strength of mentioned steels the θ values are 5.7, 6.6 and 7.4 respectively. Finally, for 40 MPa concrete strength and the yield strength of mentioned steels, the θ values are 5, 5.8 and 6.5 respectively, summarized in Table 6. Therefore, it is recommended to incorporate the steel yield strength as a defining parameter in determining the embedment depth, to more accurately estimate the tensile load-bearing capacity of cast-in-place headed anchors.
5. Conclusions
A numerical model based on the Concrete Capacity Design (CCD) approach was established to assess the tensile pullout behavior of cast-in-place headed anchors. The accuracy and validity of the developed model are confirmed through comparison with existing studies, demonstrating results within an acceptable range. A monotonic displacement-control stage as loading protocol is utilized. A monotonic displacement-control stage as loading protocol is utilized. Parametric studies were carried out on multiple unreinforced concrete slabs, considering variations in concrete strength, anchor dimensions, and steel yield strength. Additionally, the overall geometry of the concrete specimens was assumed to be proportional to the embedment depth of the headed anchors. The findings obtained from the analyses are summarized as follows:
- A notable discrepancy in pullout strength emerges at the final stage of monotonic loading when compared to predictions made by the CCD method. As the ratio of embedment depth to anchor diameter decreases and concrete compressive strength increases, the divergence between the observed results and CCD estimates becomes increasingly evident. Specifically, the CCD method tends to underestimate the breakout capacity of anchor bolts embedded in unreinforced concrete members with compressive strengths of 30 MPa and 40 MPa, while it overestimates the capacity for members with a compressive strength of 20 MPa. These inconsistencies highlight the need for a revision of the current design assumptions.
- Given the observed overestimation and underestimation of pullout strength by the CCD method across varying concrete strengths, a revision of the k-factor within the CCD design model is recommended to improve predictive accuracy. The analysis results suggest average k-factor values of 15.24 for 20 MPa concrete, 18.9 for 30 MPa concrete, and 21.6 for 40 MPa concrete. Due to the embedded depth-to-diameter ratio, the CCD k-factor needs some modifications to consider the effect concrete strength parameter.
- The ratio of embedment depth to anchor diameter significantly influences the degree of convergence between the numerical results and the CCD method across different concrete strengths. Anchors with deeper embedment depths demonstrate greater alignment with CCD predictions compared to those with shallow embedment. The highest level of convergence was observed for an embedment depth of =10db in 30 MPa concrete, particularly for cast-in-place headed anchors measuring 20 mm in size.
- Findings from the numerical analysis, which incorporated variations in concrete strength, steel yield strength, and embedment depth of cast-in-place headed anchors in unreinforced concrete slabs, led to the recommendation of a coefficient for predicting embedment depth based on anchor dimensions. The force–displacement response indicated that the revised embedment depth resulted in the highest displacement at peak load. Therefore, a revision to the design criteria is necessary to establish appropriate limits based on the yield strength of the steel.
References
- Abhijit kawale 1, Yogesh D. Patil., 2016 ,”Pullout Capacity and Bond Behaviour of Headed Reinforcement in concrete” International Journal of Innovative Research in Science, Engineering and Technology. Vol. 5, Issue 7, July 2016. [CrossRef]
- ACI Committee 349, “Code Requirements for Nuclear Safety Related Structures (ACI 349-01),” American Concrete Institute, Farmington Hills, MI, 2001, 134 pp.
- ACI Committee 318, 2019. “Building Code Requirements for Structural Concrete (ACI 318-14) and Commentary,” (ACI 318R-14), American Concrete Institute, Farmington Hills, Michigan,620 pp.
- ACI Committee 349 (2006). Code Requirements for Nuclear Safety Related Concrete Structures (ACI 349- 06), American Concrete Institute, Farmington Hills, MI, 134 pp.
- Ali Nazzal, L., Darwin, D. and O’Reilly, M. 2023. Anchorage of high-strength reinforcing bars in concrete. Structural Engineering and Engineering Materials SM Report No. 150.
- Bashandy, T.R, 1996, “ Application of Headed Bars in Concrete Members,” Ph.D. dissertation, The University of Texas at Austin, Austin, TX, Dec, 303 pp.
- Bujnak J, Robriquet B. On the behavior of headed fastenings between steel and concrete. Procedia Eng 2012;40:62–7.
- Bakir PG, Boduroglu MH. The ultimate load carrying capacity of concrete members with headed bars. 27th Conference on Our World in Concrete & Structures. 2002. p.163–7.
- Choi, D.-U., Hong, S.-G., and Lee, C.-Y., 2002, “Test of Headed Reinforcement in Pullout,” KCI Concrete Journal, Vol. 14, No. 3, Sep., pp. 102-110.
- DeVries, R. A., Jirsa, J. O., and Bashandy, T., 1999, “Anchorage Capacity in Concrete of Headed Reinforcement with Shallow Embedments,” ACI Structural Journal, Vol. 96, No. 5, Sep.-Oct., pp.728-736.
- Delhomme F, Roure T, Arrieta B, Limam A. Pullout behavior of cast-in-place headed and bonded anchors with different embedment depths. Mater Struct 2016;49(5):1843–59.
- Eligehausen, R., Mallée, R., & Silva, J. F. (2006a). Anchorage in Concrete Construction, Ernst & Sohn, Berlin, Germany, 378 pp.
- Fuchs, W., Eligehausen, R., & Breen, J. E. (1995). “Concrete Capacity Design (CCD) Approach for Fastening to Concrete,” ACI Structural Journal, 92(1), pp. 73–94.
- Ghimire, K.P., Darwin, D. and O’Reilly, M. 2018. Anchorage of Headed Reinforcing Bars in 385 Concrete. University of Kansas Center for Research, Lawrence, Report No. 127, p. 278. 386.
- Ghimire, K.P., Shao, Y., Darwin, D. and O’Reilly, M. 2019a. Conventional and High-Strength 387 Headed Bars-Part 1: Anchorage Test. ACI Structural Journal, 116: 257-266. 388.
- Ghimire, K.P., Shao, Y., Darwin, D. and O’Reilly, M. 2019b. Conventional and High-Strength 389 Headed Bars – Part 2: Data Analysis. ACI Structural Journal, 116: 265-272.
- Lee NH, Kim KS, Chang JB, Park KR. Tensile headed anchors with large diameter and deep embedment in concrete. ACI Struct J 2007;104(4):479–86.
- LSTC, Livermore Software Technology Corporation. (2014a). LS-DYNA Keyword User’s Manual Volume II Material Models. Livermore California (Vol. II).
- Murray YD. Users manual for LS-DYNA concrete material model 159, United States. Federal Highway Administration. Office of Research 2007.
- Nilforoush R, Nilsson M, Elfgren L, Oˇzbolt J, Hofmann J, Eligehausen R. “Tensile capacity of anchor bolts in uncracked concrete: Influence of member thickness and anchor’s head size”. ACI Struct J 2017;114(6):1519–30.
- Rao GA, Sundeep B. Strength of bonded anchors in concrete in direct tension. Chennai: Indian Institute of Technology Madras; 2013.
- Shafei, E,. Tarverdilo, S., 2021, “Seismic pullout behavior of cast-in-place anchor bolts embedded in plain concrete: Damage plasticity based analysis” Structures 34 (2021) 479–486 . [CrossRef]
- Shao, Y., Darwin, D., O’Reilly, M., Lequesne, R. D., Ghimire, K., and Hano, M., 2016, “Anchorage of Conventional and High-Strength Headed Reinforcing Bars,” SM Report No. 117, University of Kansas Center for Research, Inc., Lawrence, KS, Aug., 234 pp.
- Wallace, J. W., McConnell, S. W., Gupta, P., and Cote, P. A., 1998, “Use of Headed Reinforcement in Beam- Column Joints Subjected to Earthquake Loads,” ACI Structural Journal, Vol. 95, No. 5, Sep.-Oct., pp. 590.
- Vella JP, Vollum RL, Kotecha R. Headed Bar Connections Between Precast Concrete Elements: Design Recommendations and Practical Applications. Structures 2018;15:162–73.
Figure 1.
Load–displacement responses of tension-loaded headed anchors demonstrating different failure mechanisms (2006 elig).
Figure 1.
Load–displacement responses of tension-loaded headed anchors demonstrating different failure mechanisms (2006 elig).
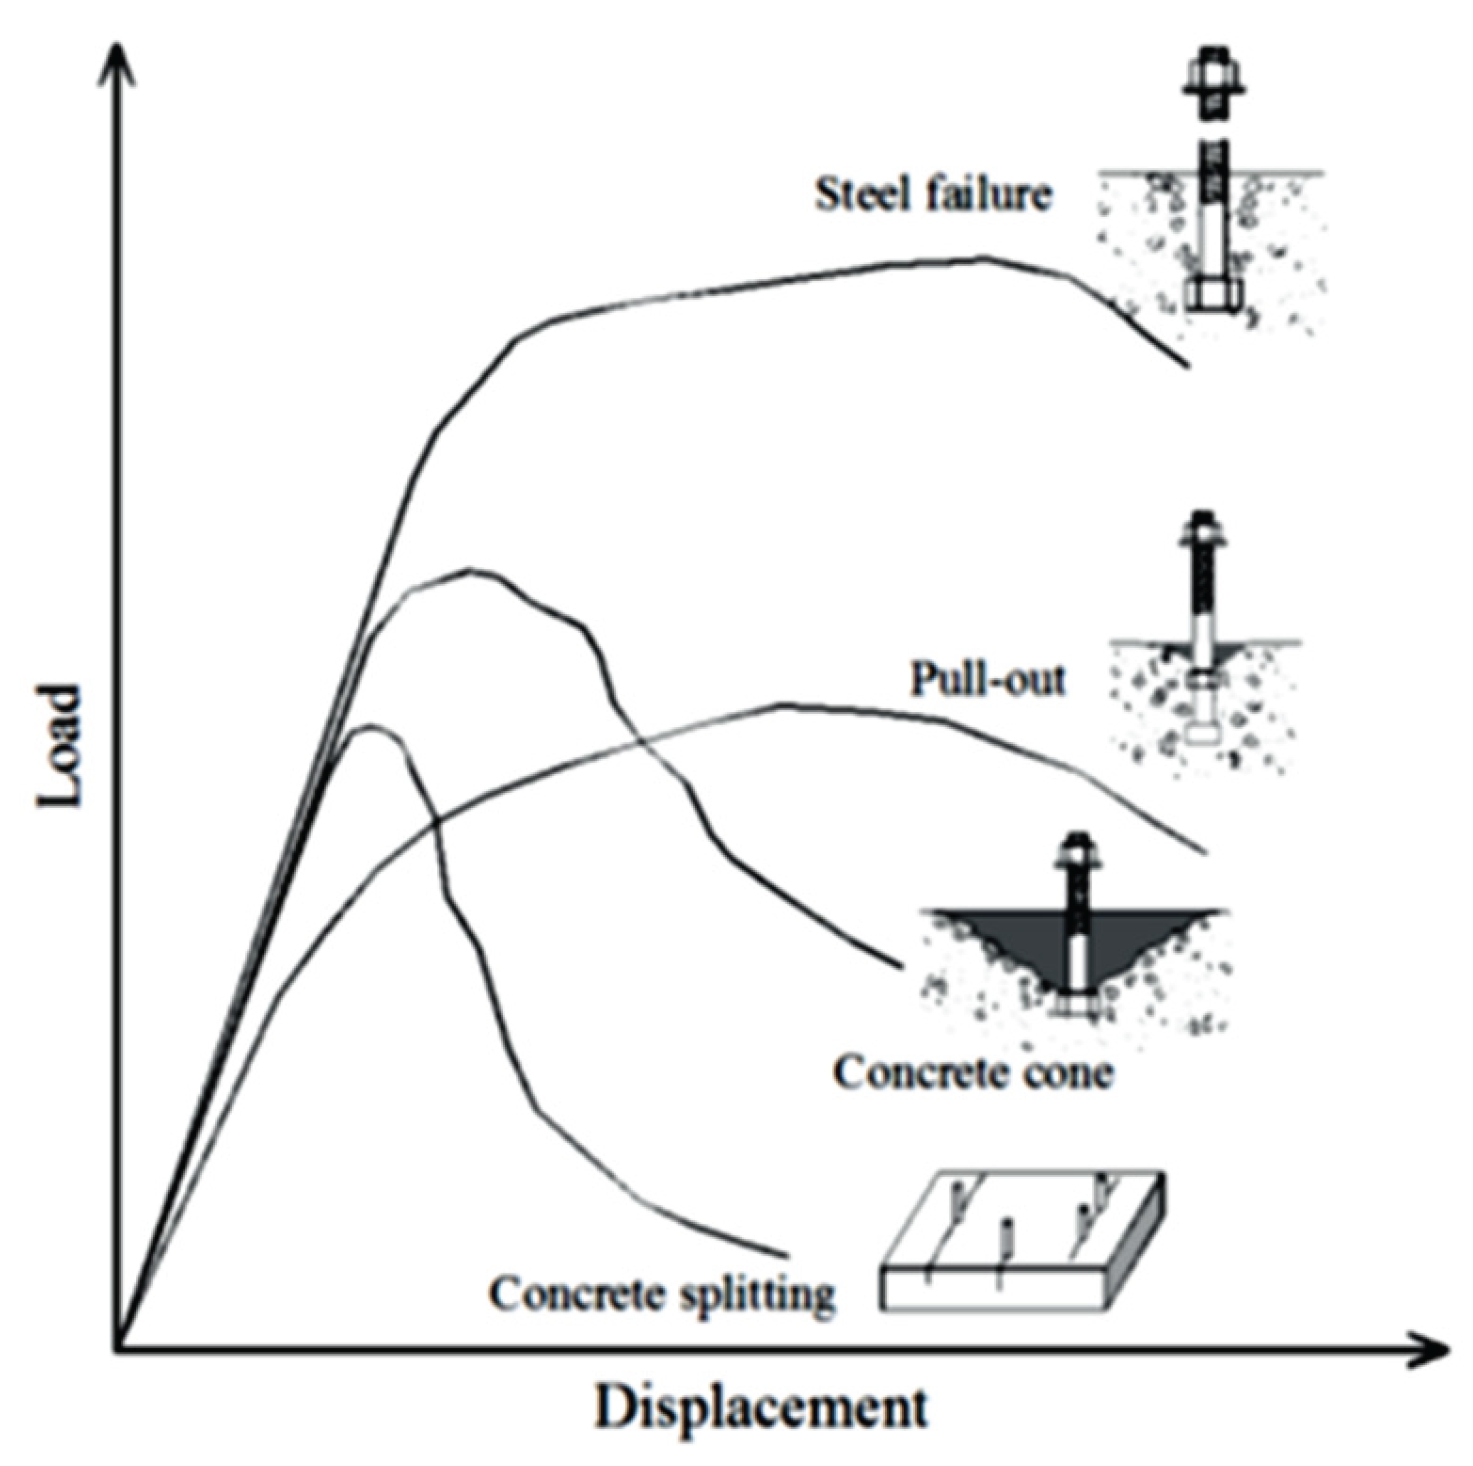
Figure 2.
Configuration and idealized projected area of the concrete cone according to the CCD method (adapted from Fuchs et al.,1995).
Figure 2.
Configuration and idealized projected area of the concrete cone according to the CCD method (adapted from Fuchs et al.,1995).

Figure 3.
The definition of effective depth ().
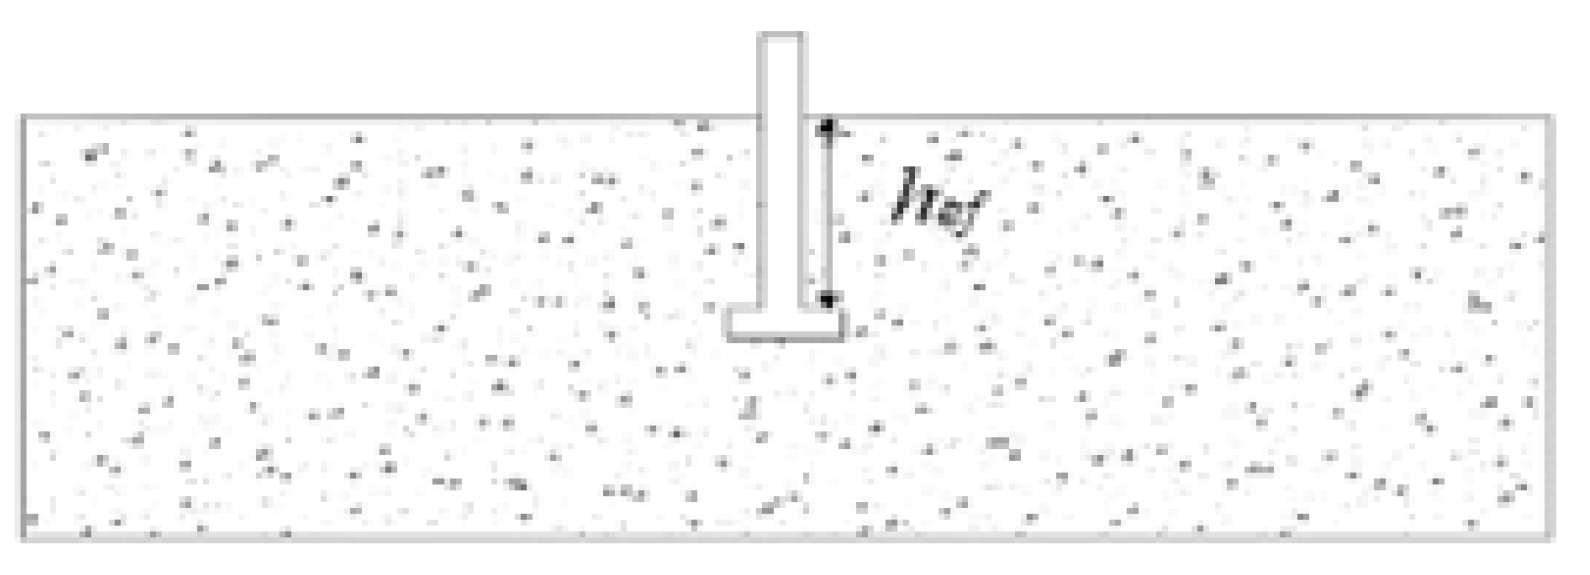
Figure 4.
Schematic of multiplicative formulation of the shear and cap surfaces.
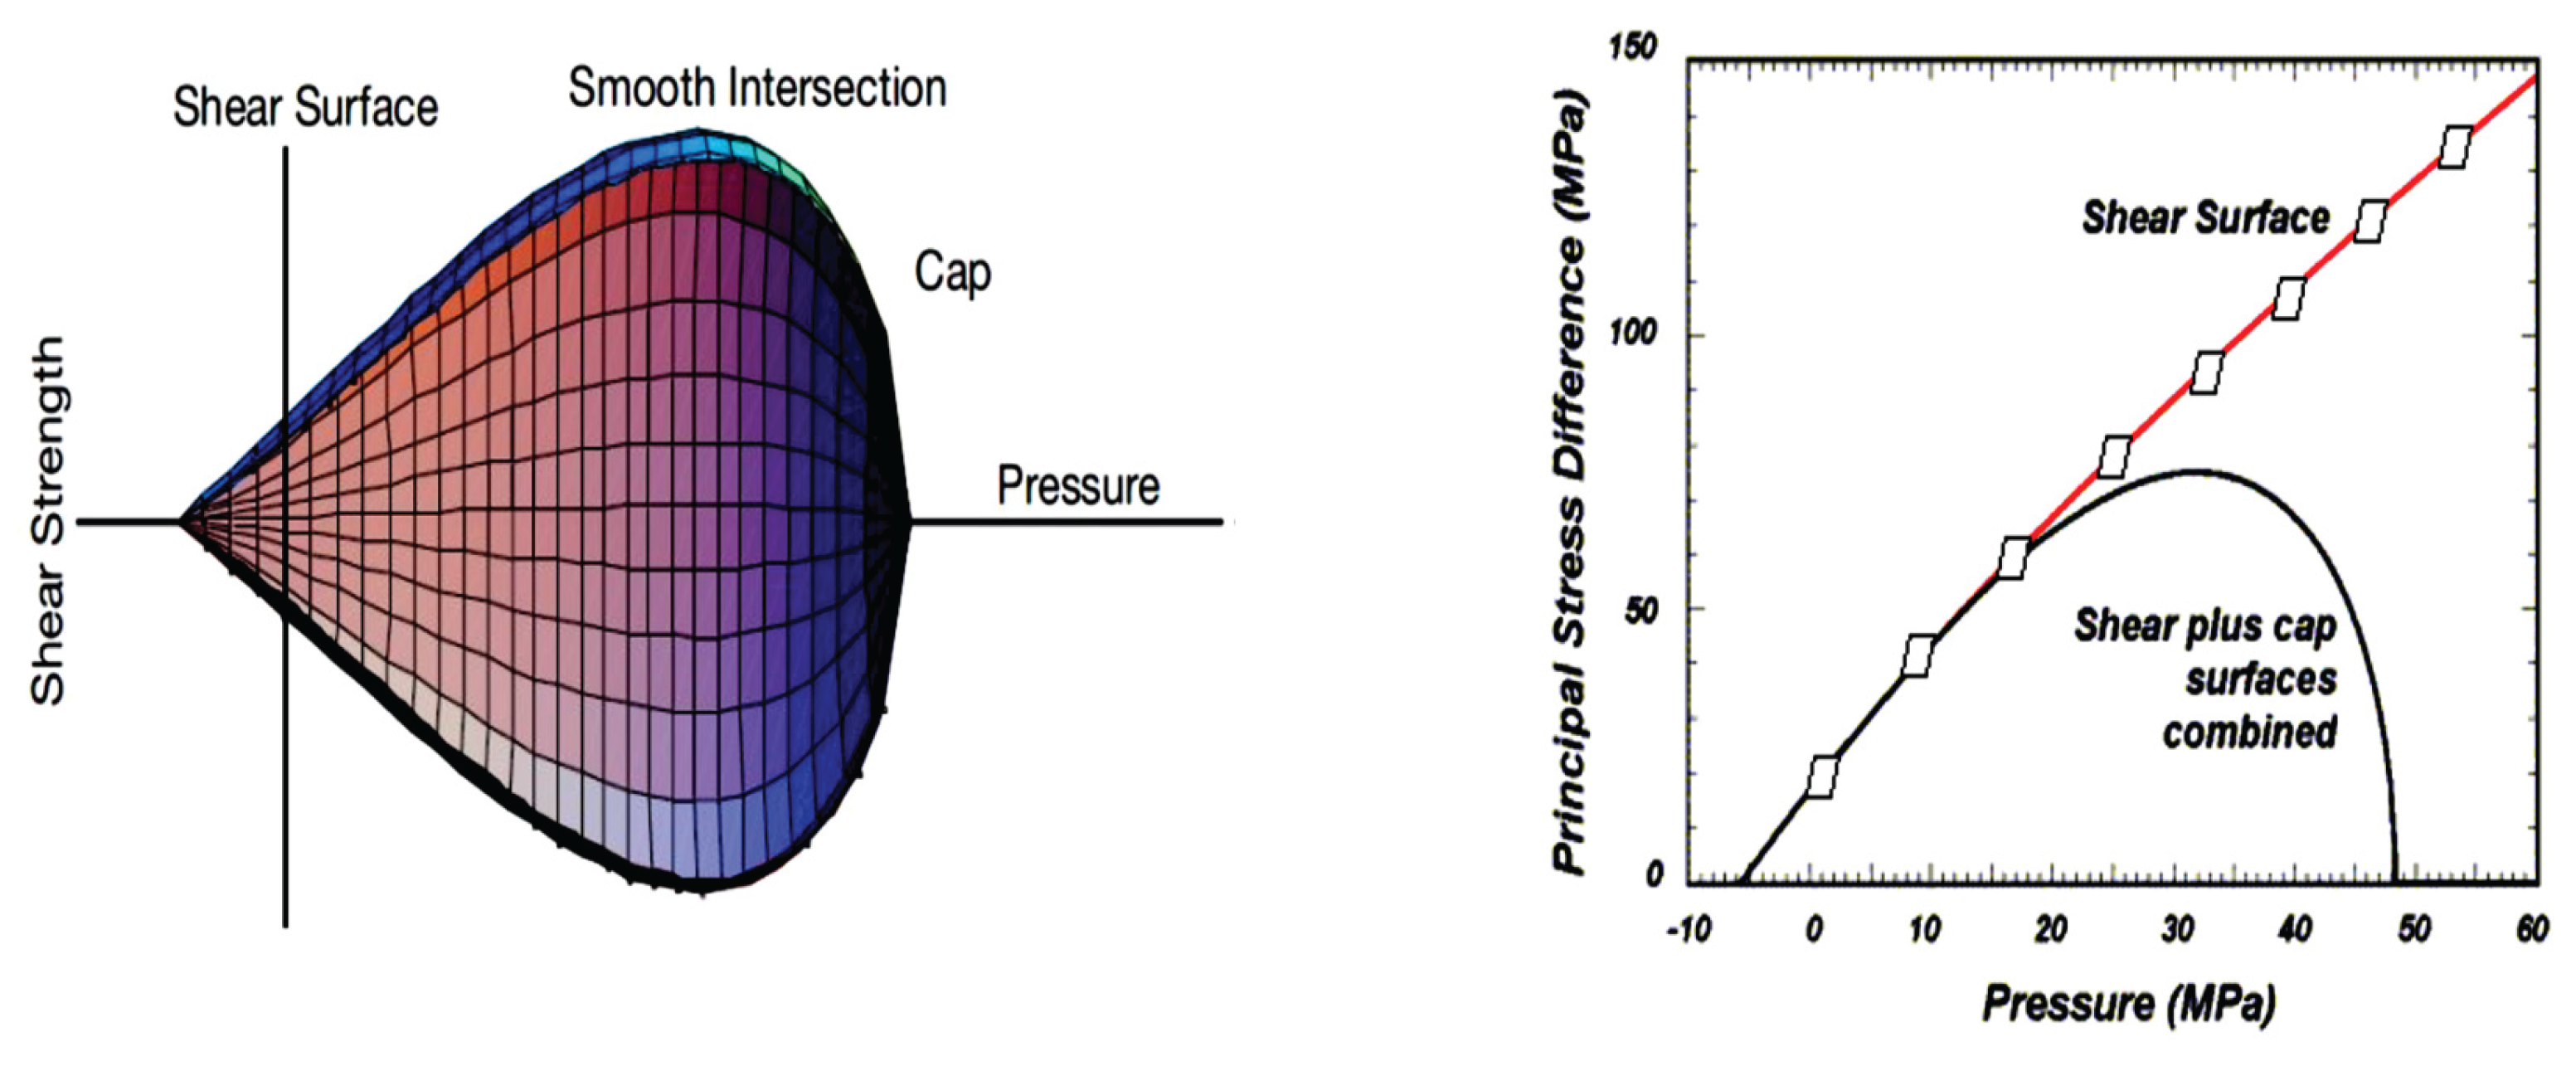
Figure 5.
Top view and the geometric dimensions of verify test.
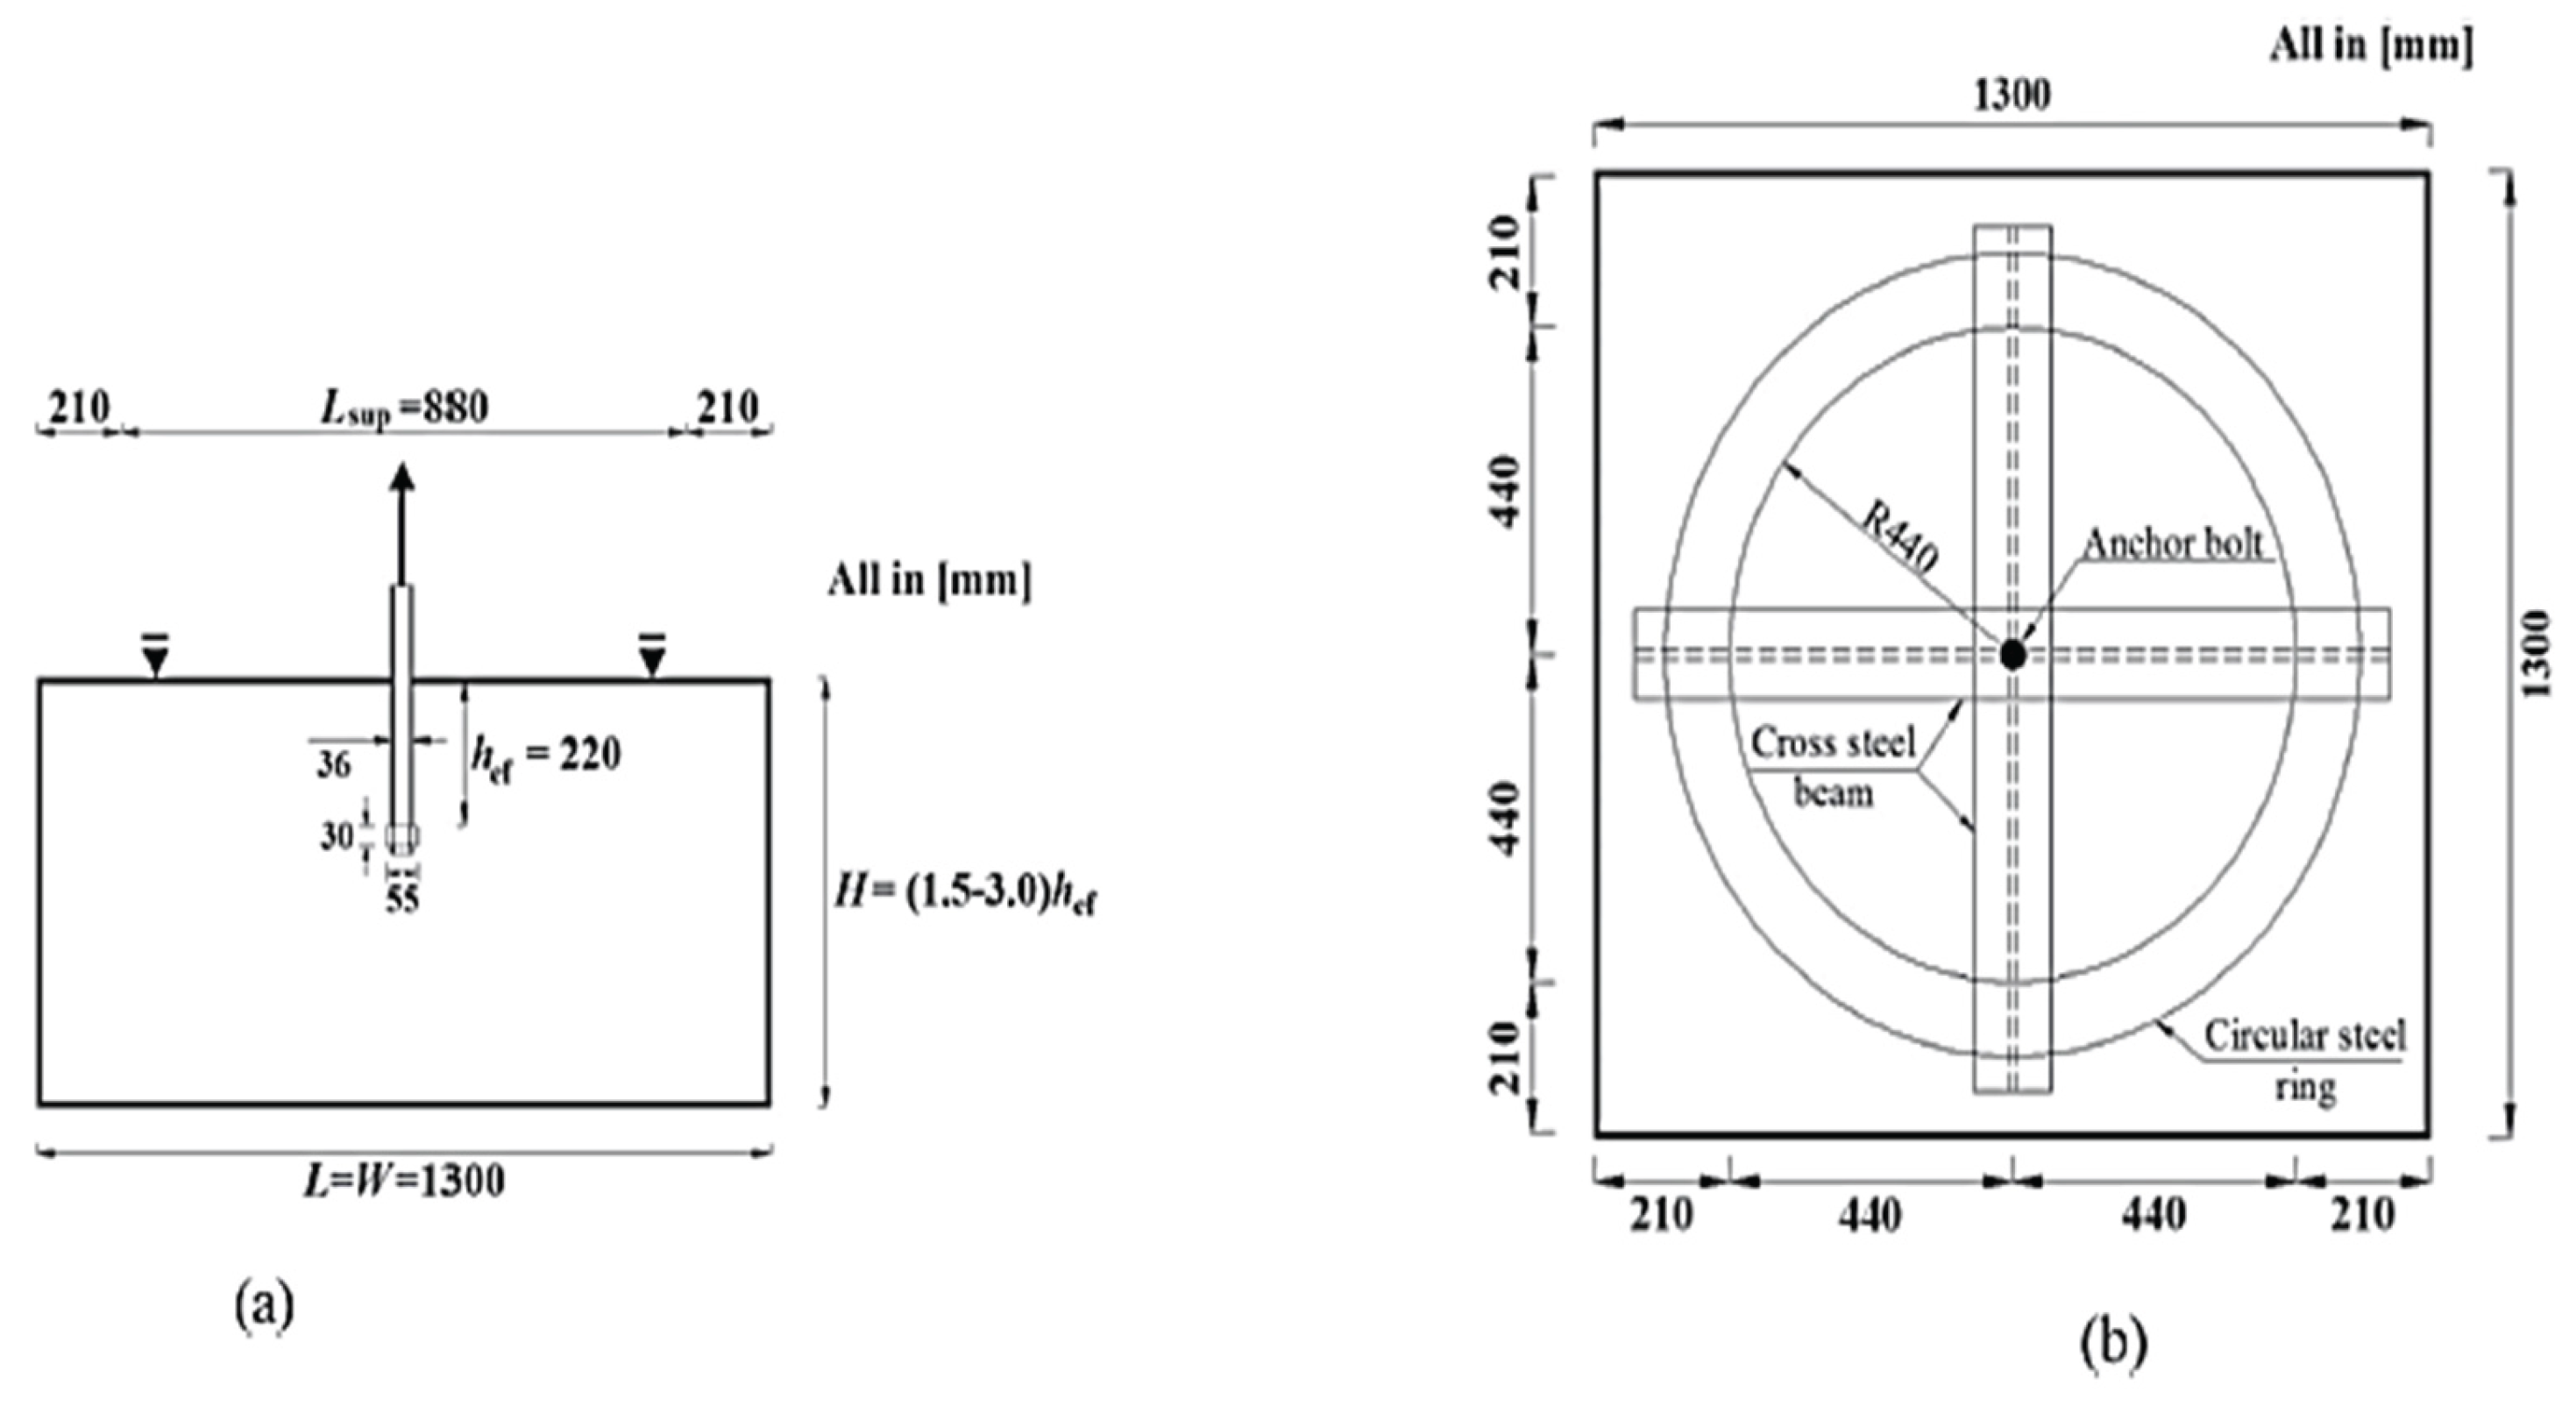
Figure 6.
The anchor-contact and mesh view.
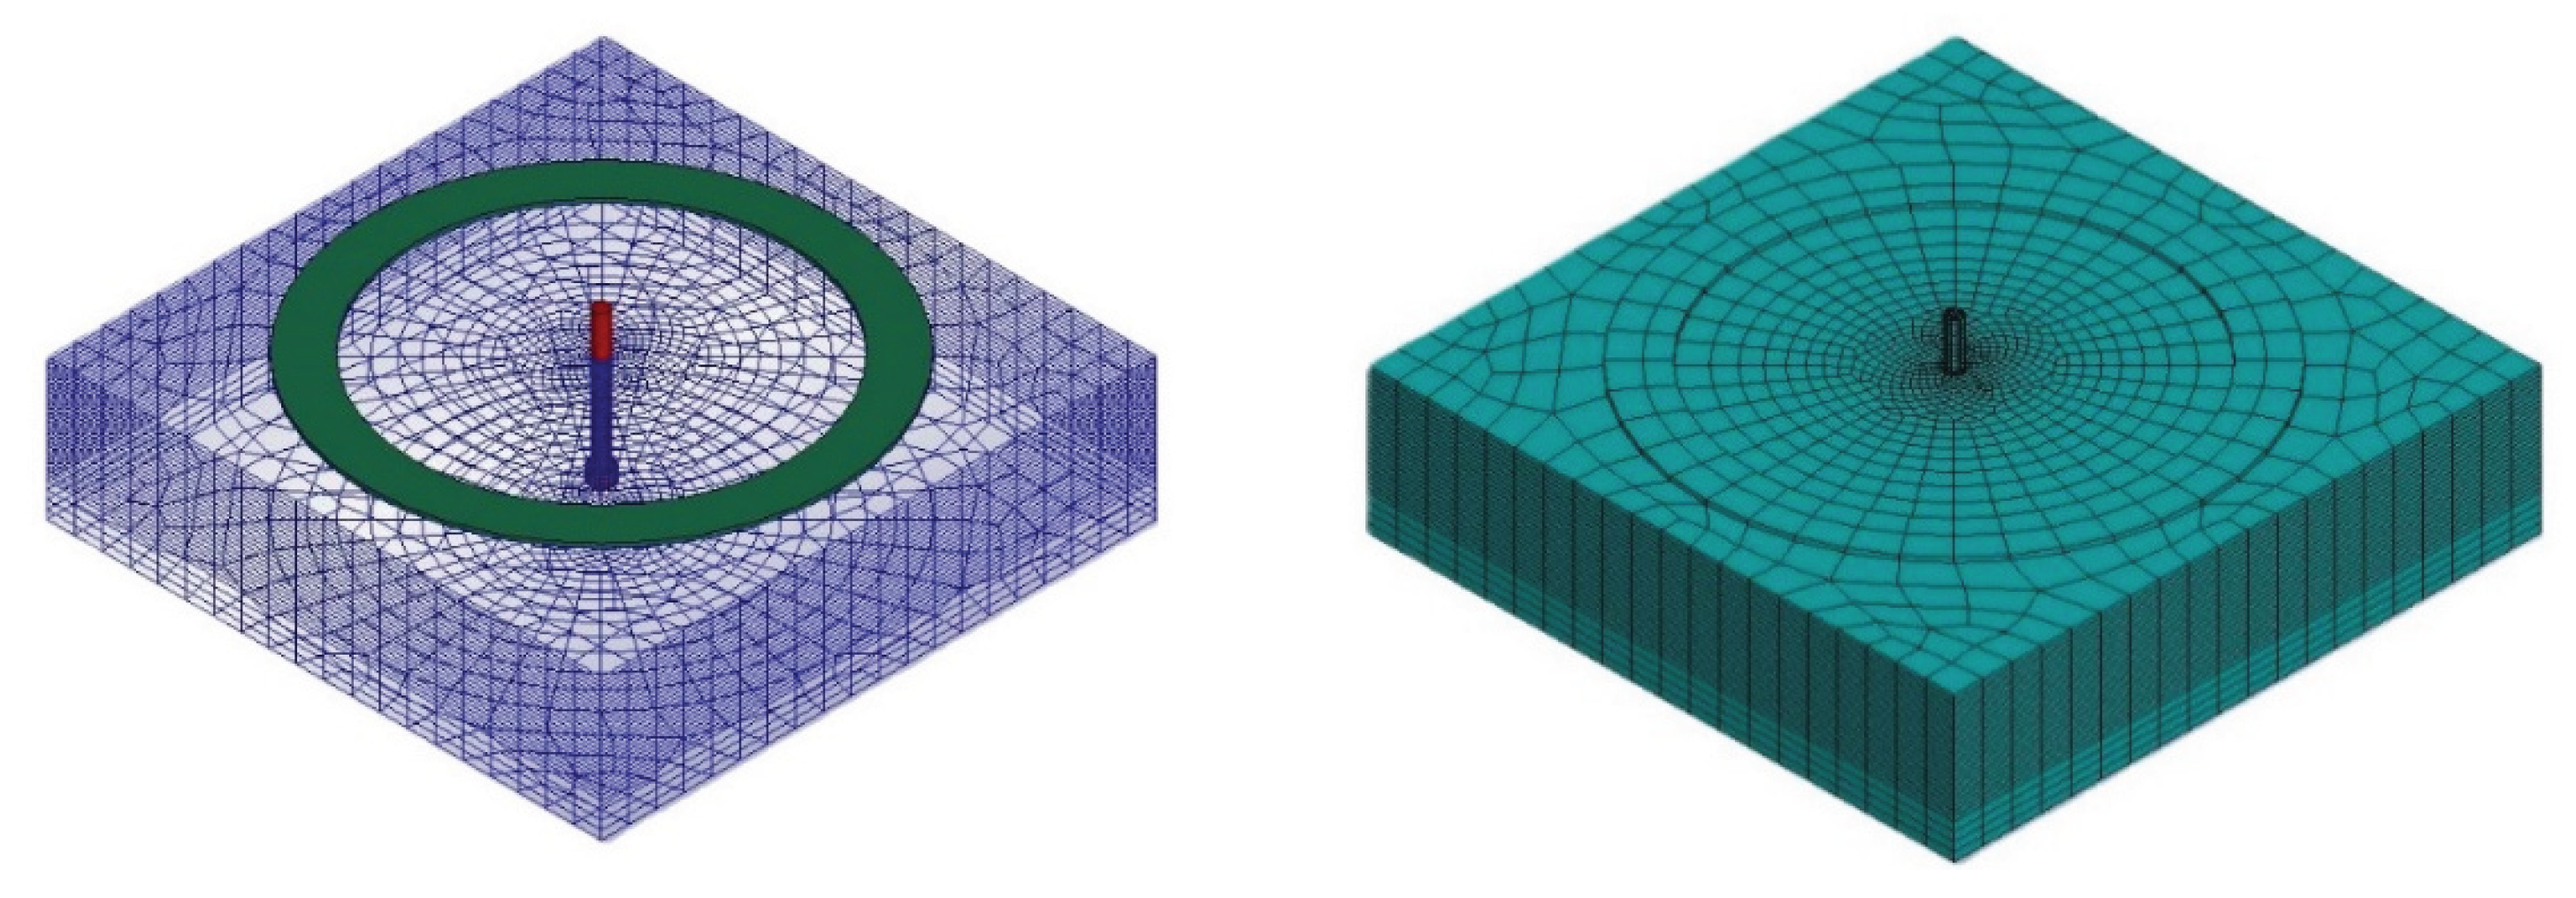
Figure 7.
Elastic-plastic behavior with kinematic and isotropic hardening.
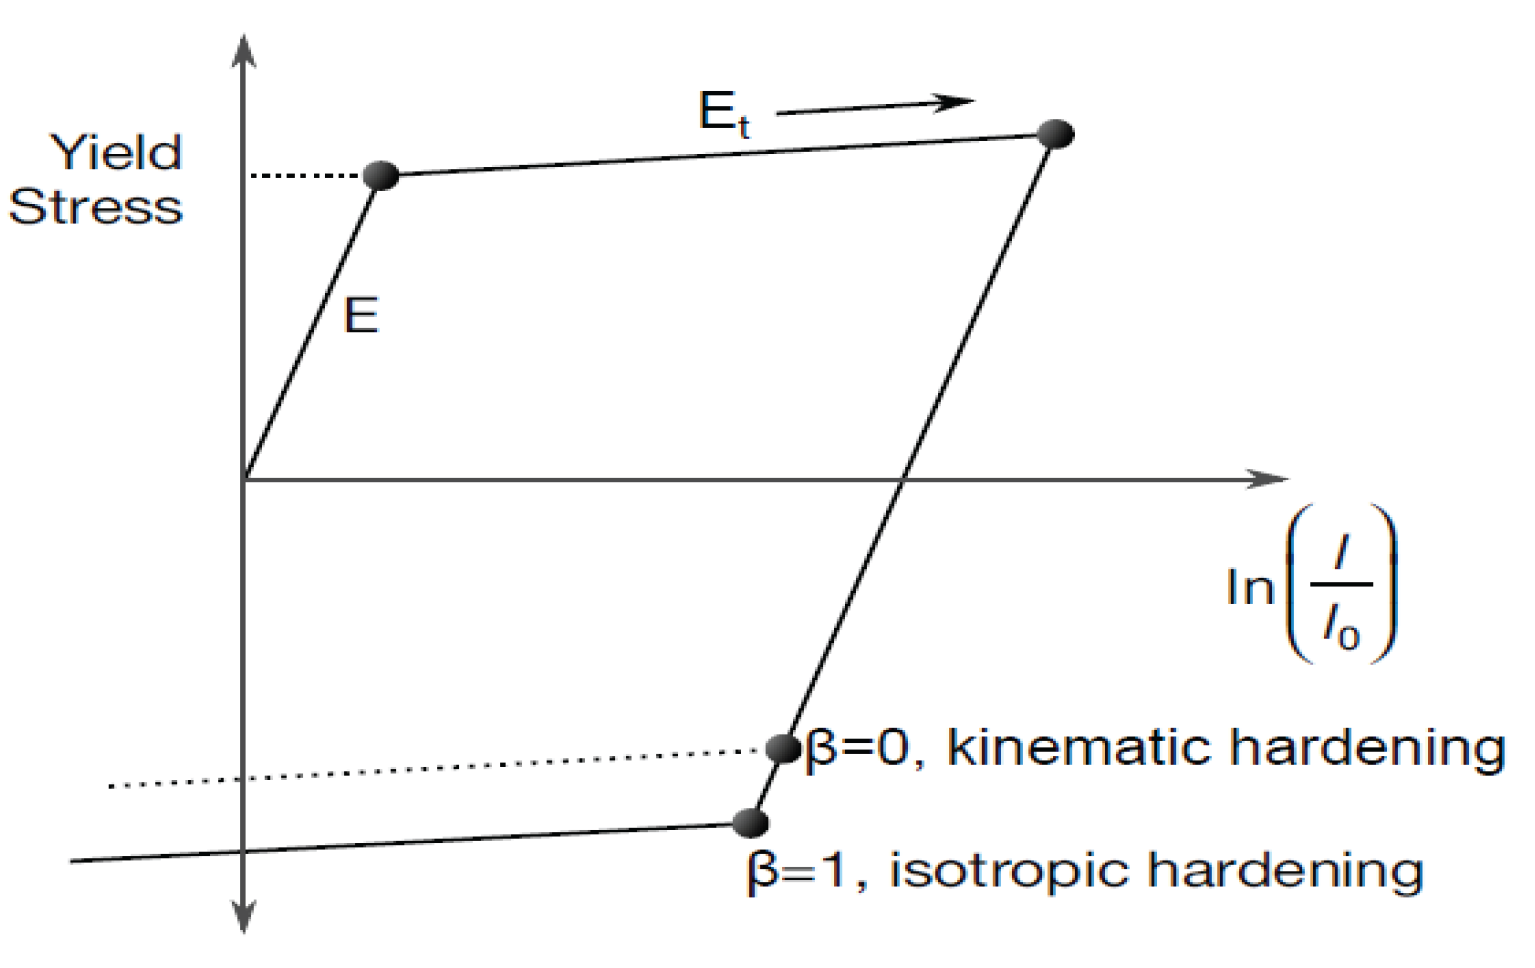
Figure 8.
Displacement-control monotonic.
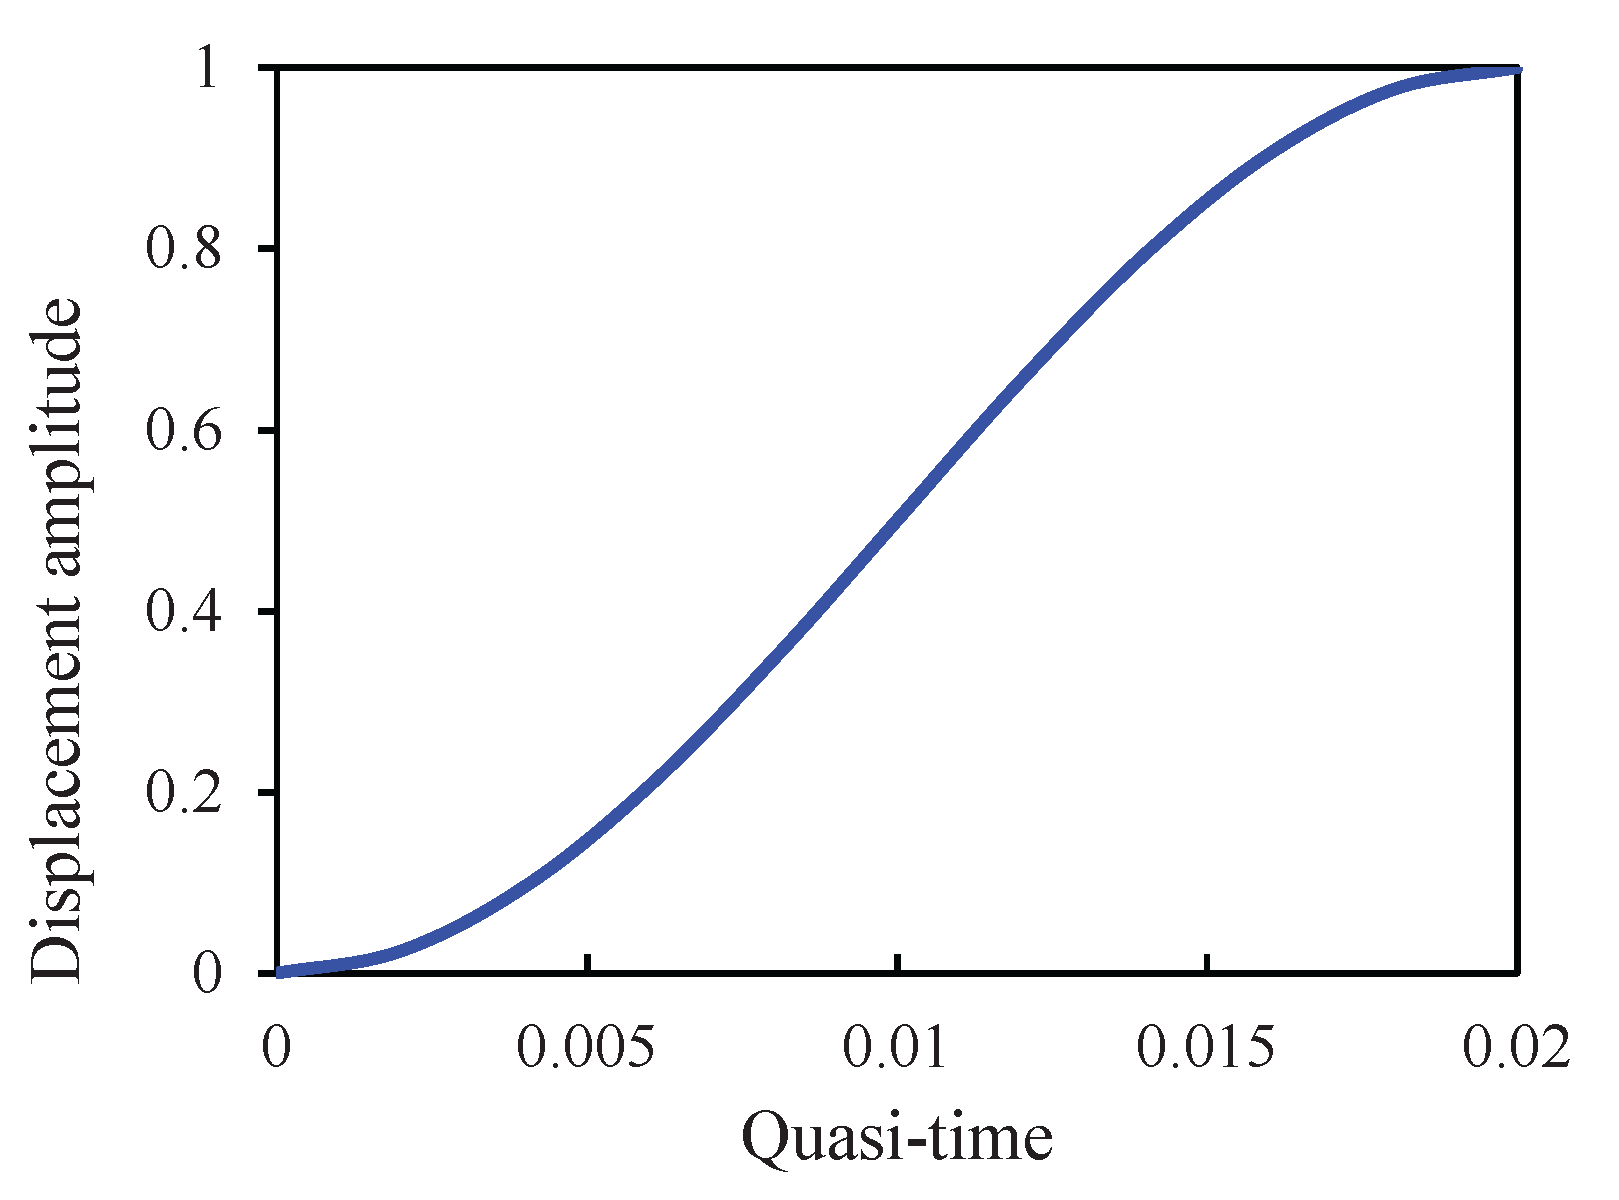
Figure 9.
The crack pattern and angle of occurring.
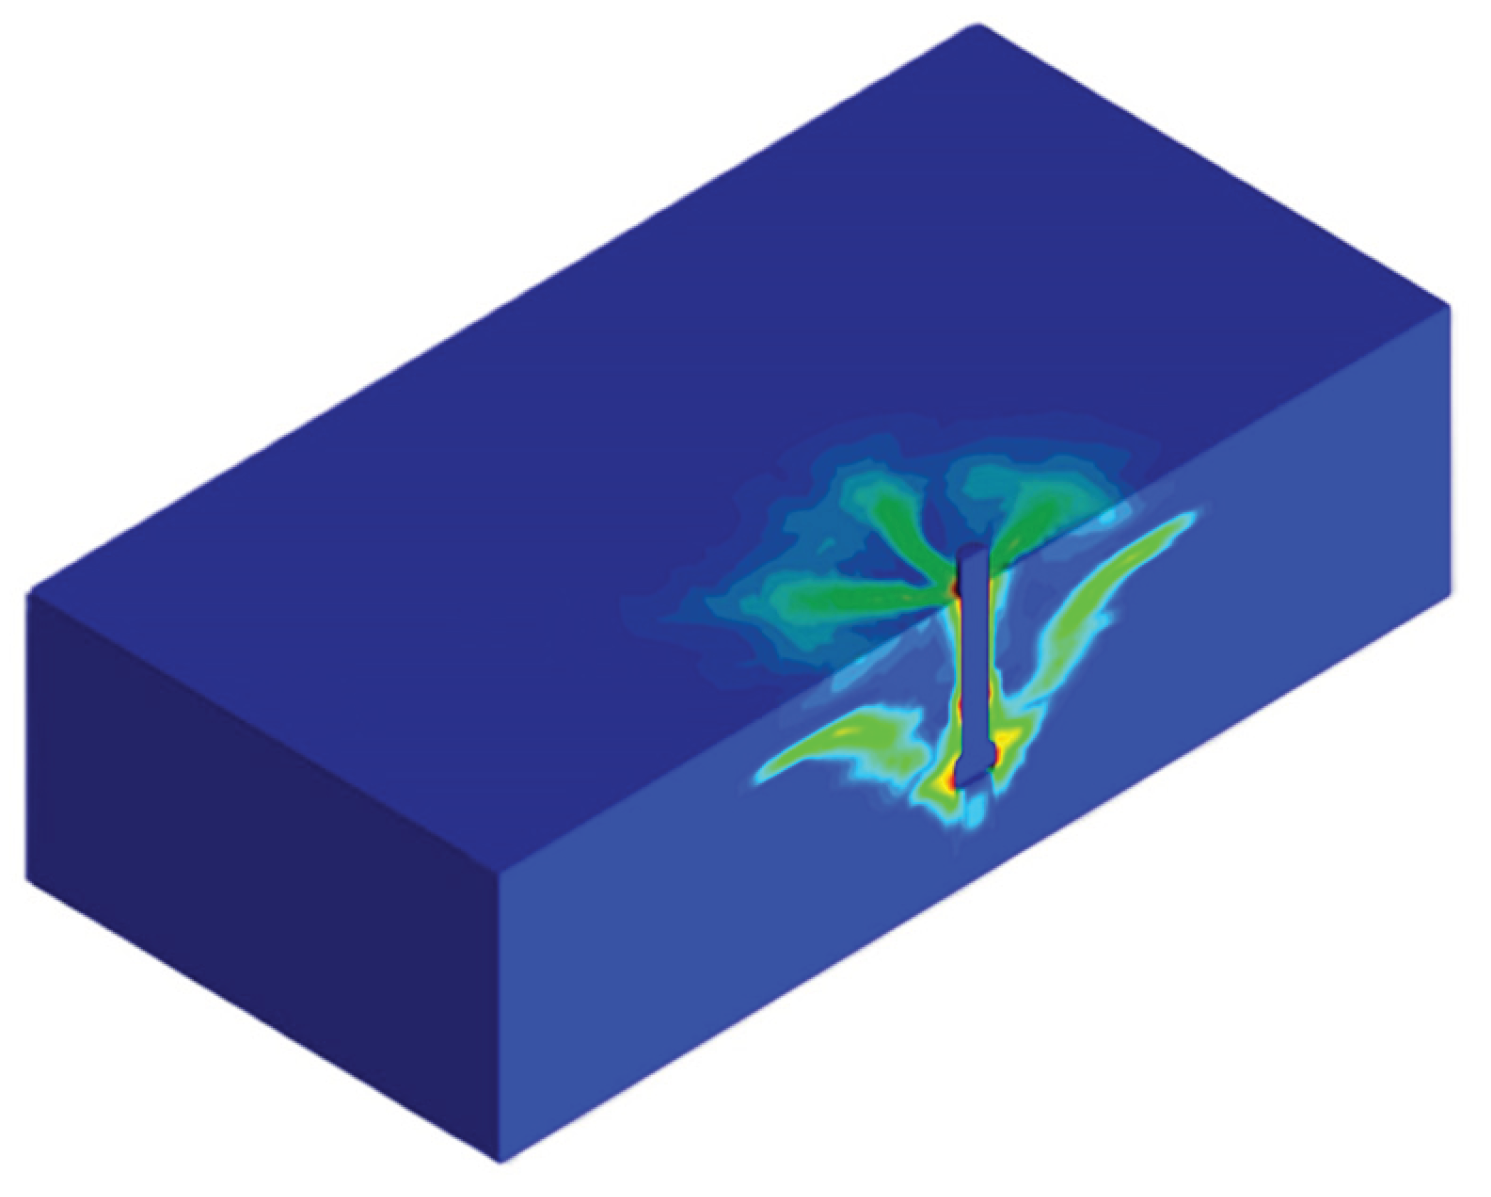
Figure 10.
Comparison of experimental and numerical model.
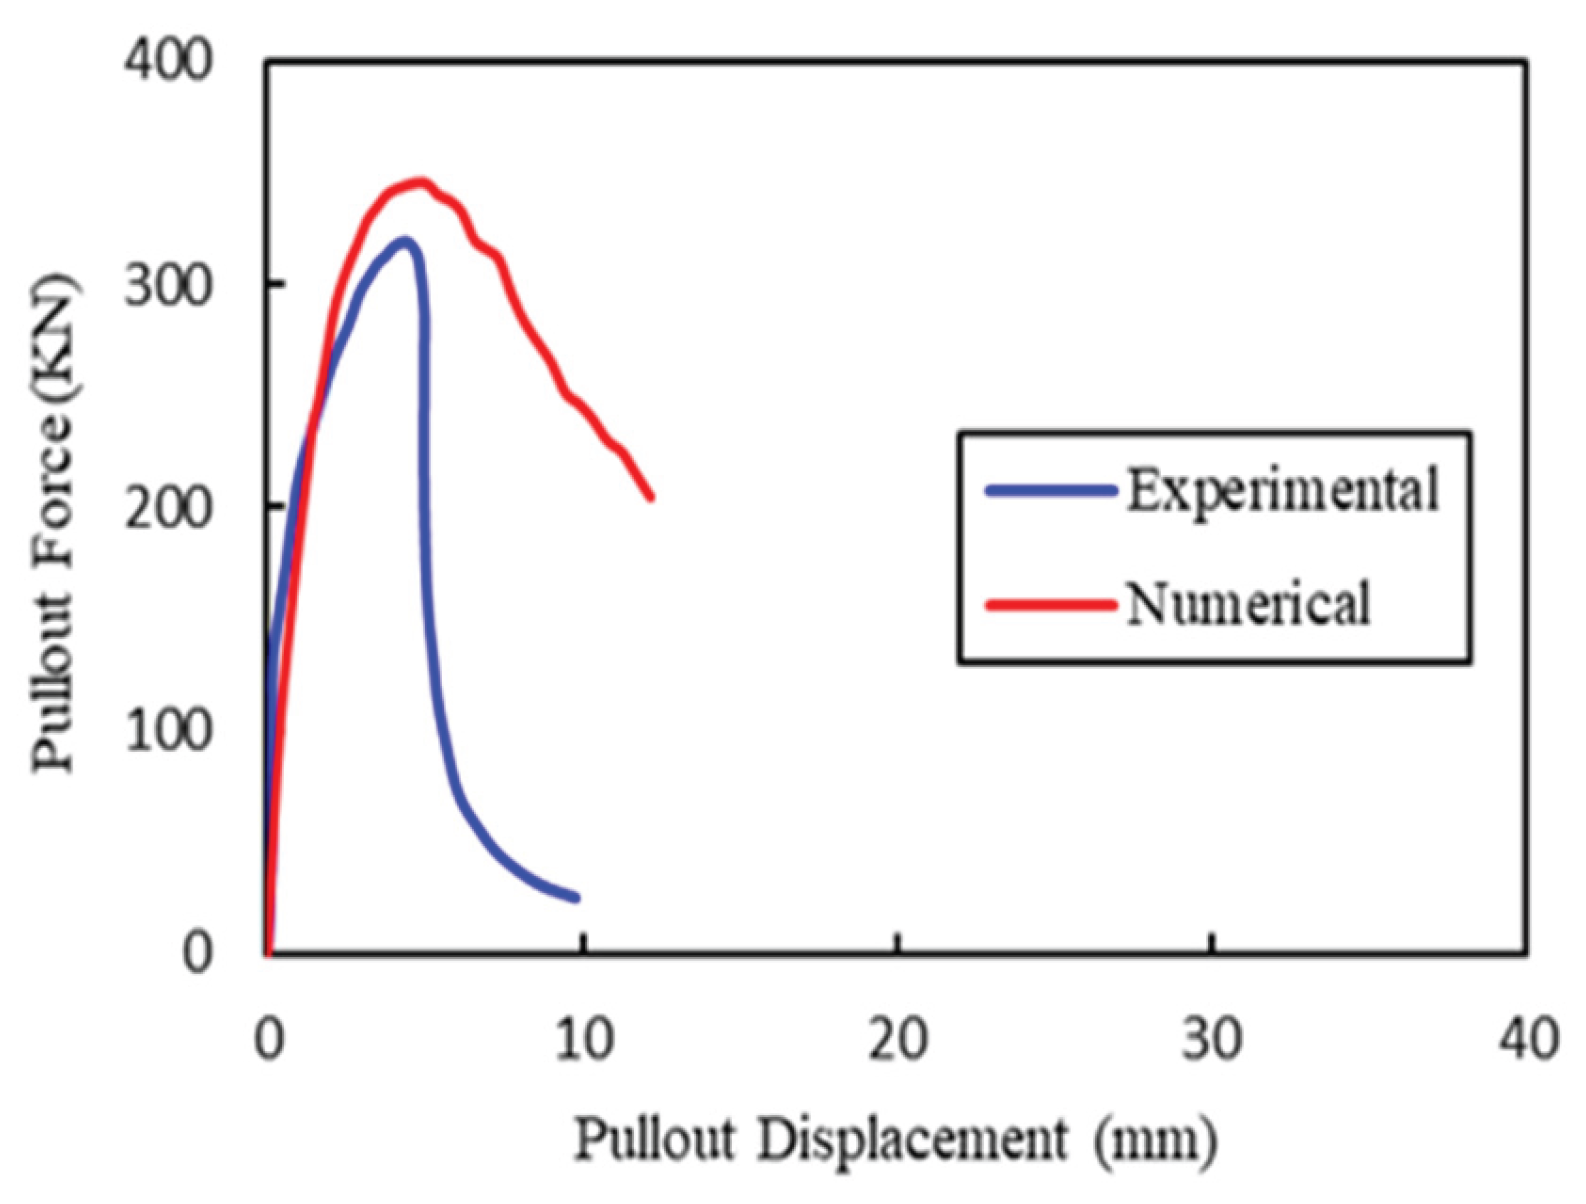
Figure 11.
Pullout response of the cast-in-place headed anchor with a diameter of 20 mm.
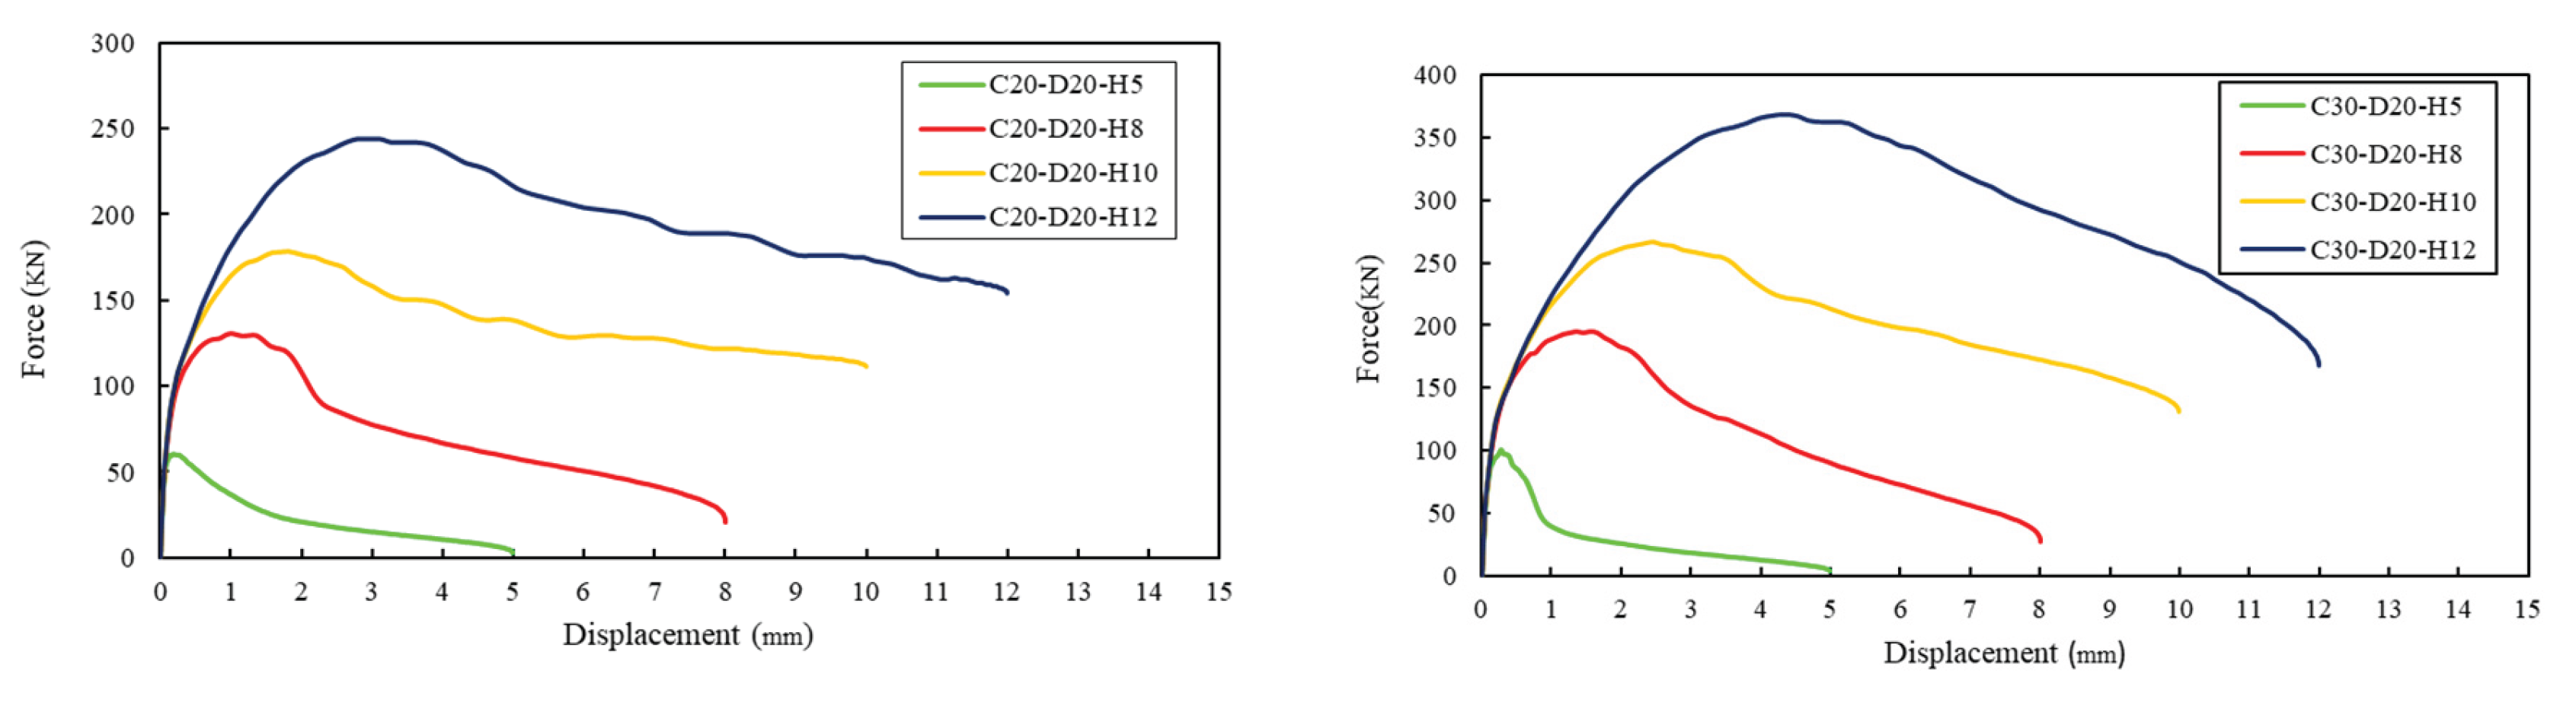
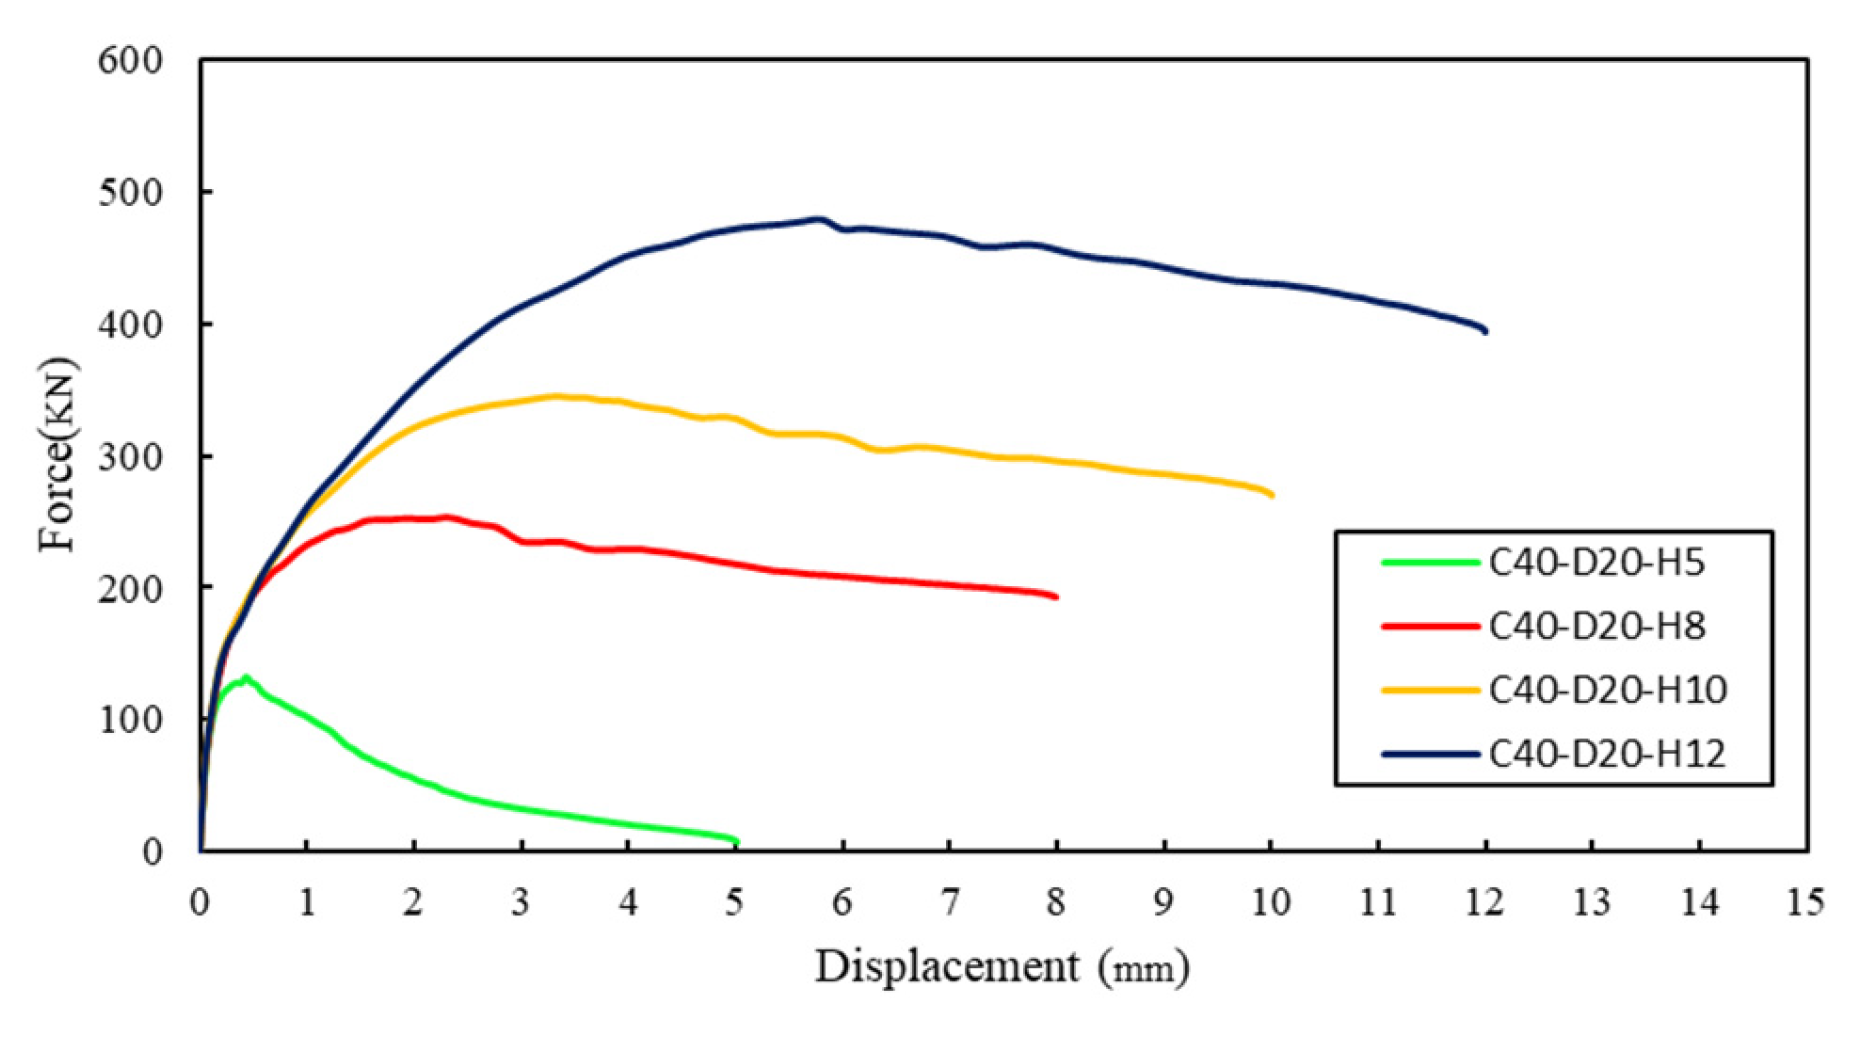
Figure 12.
Pullout response of the cast-in-place headed anchor with a diameter of 25 mm.
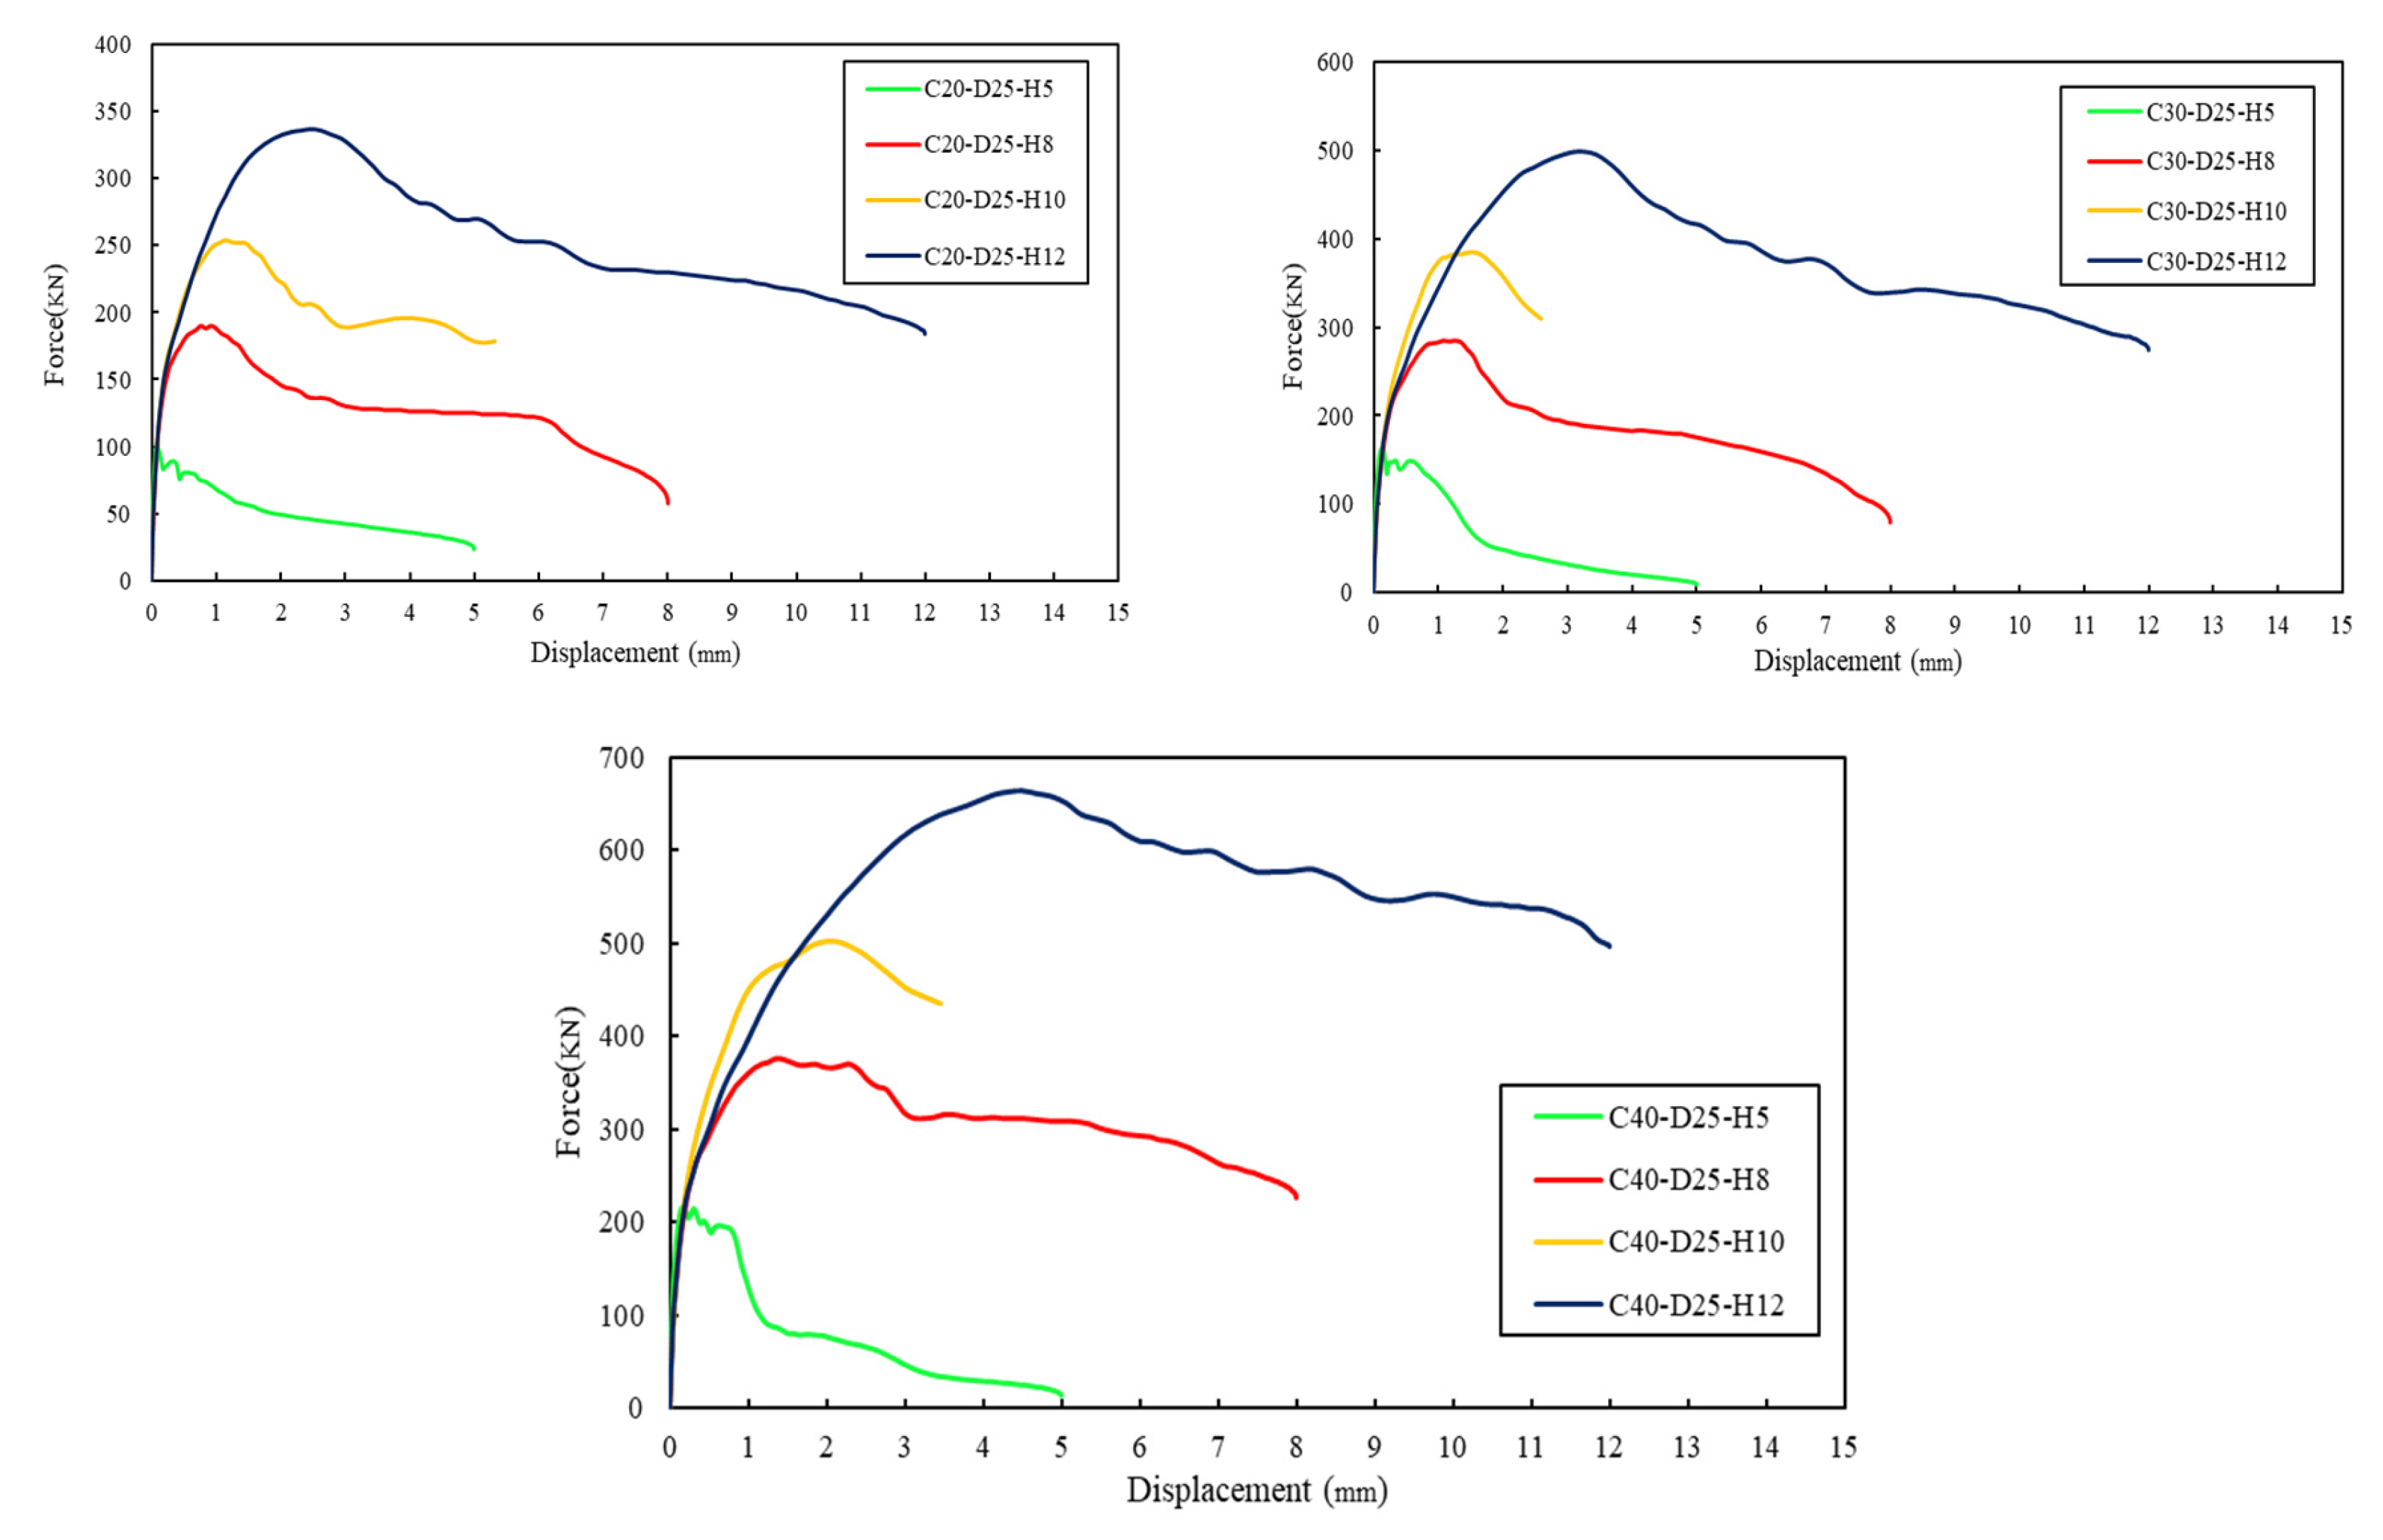
Figure 17.
Prediction of embedment depth of cast-in-place headed anchor.
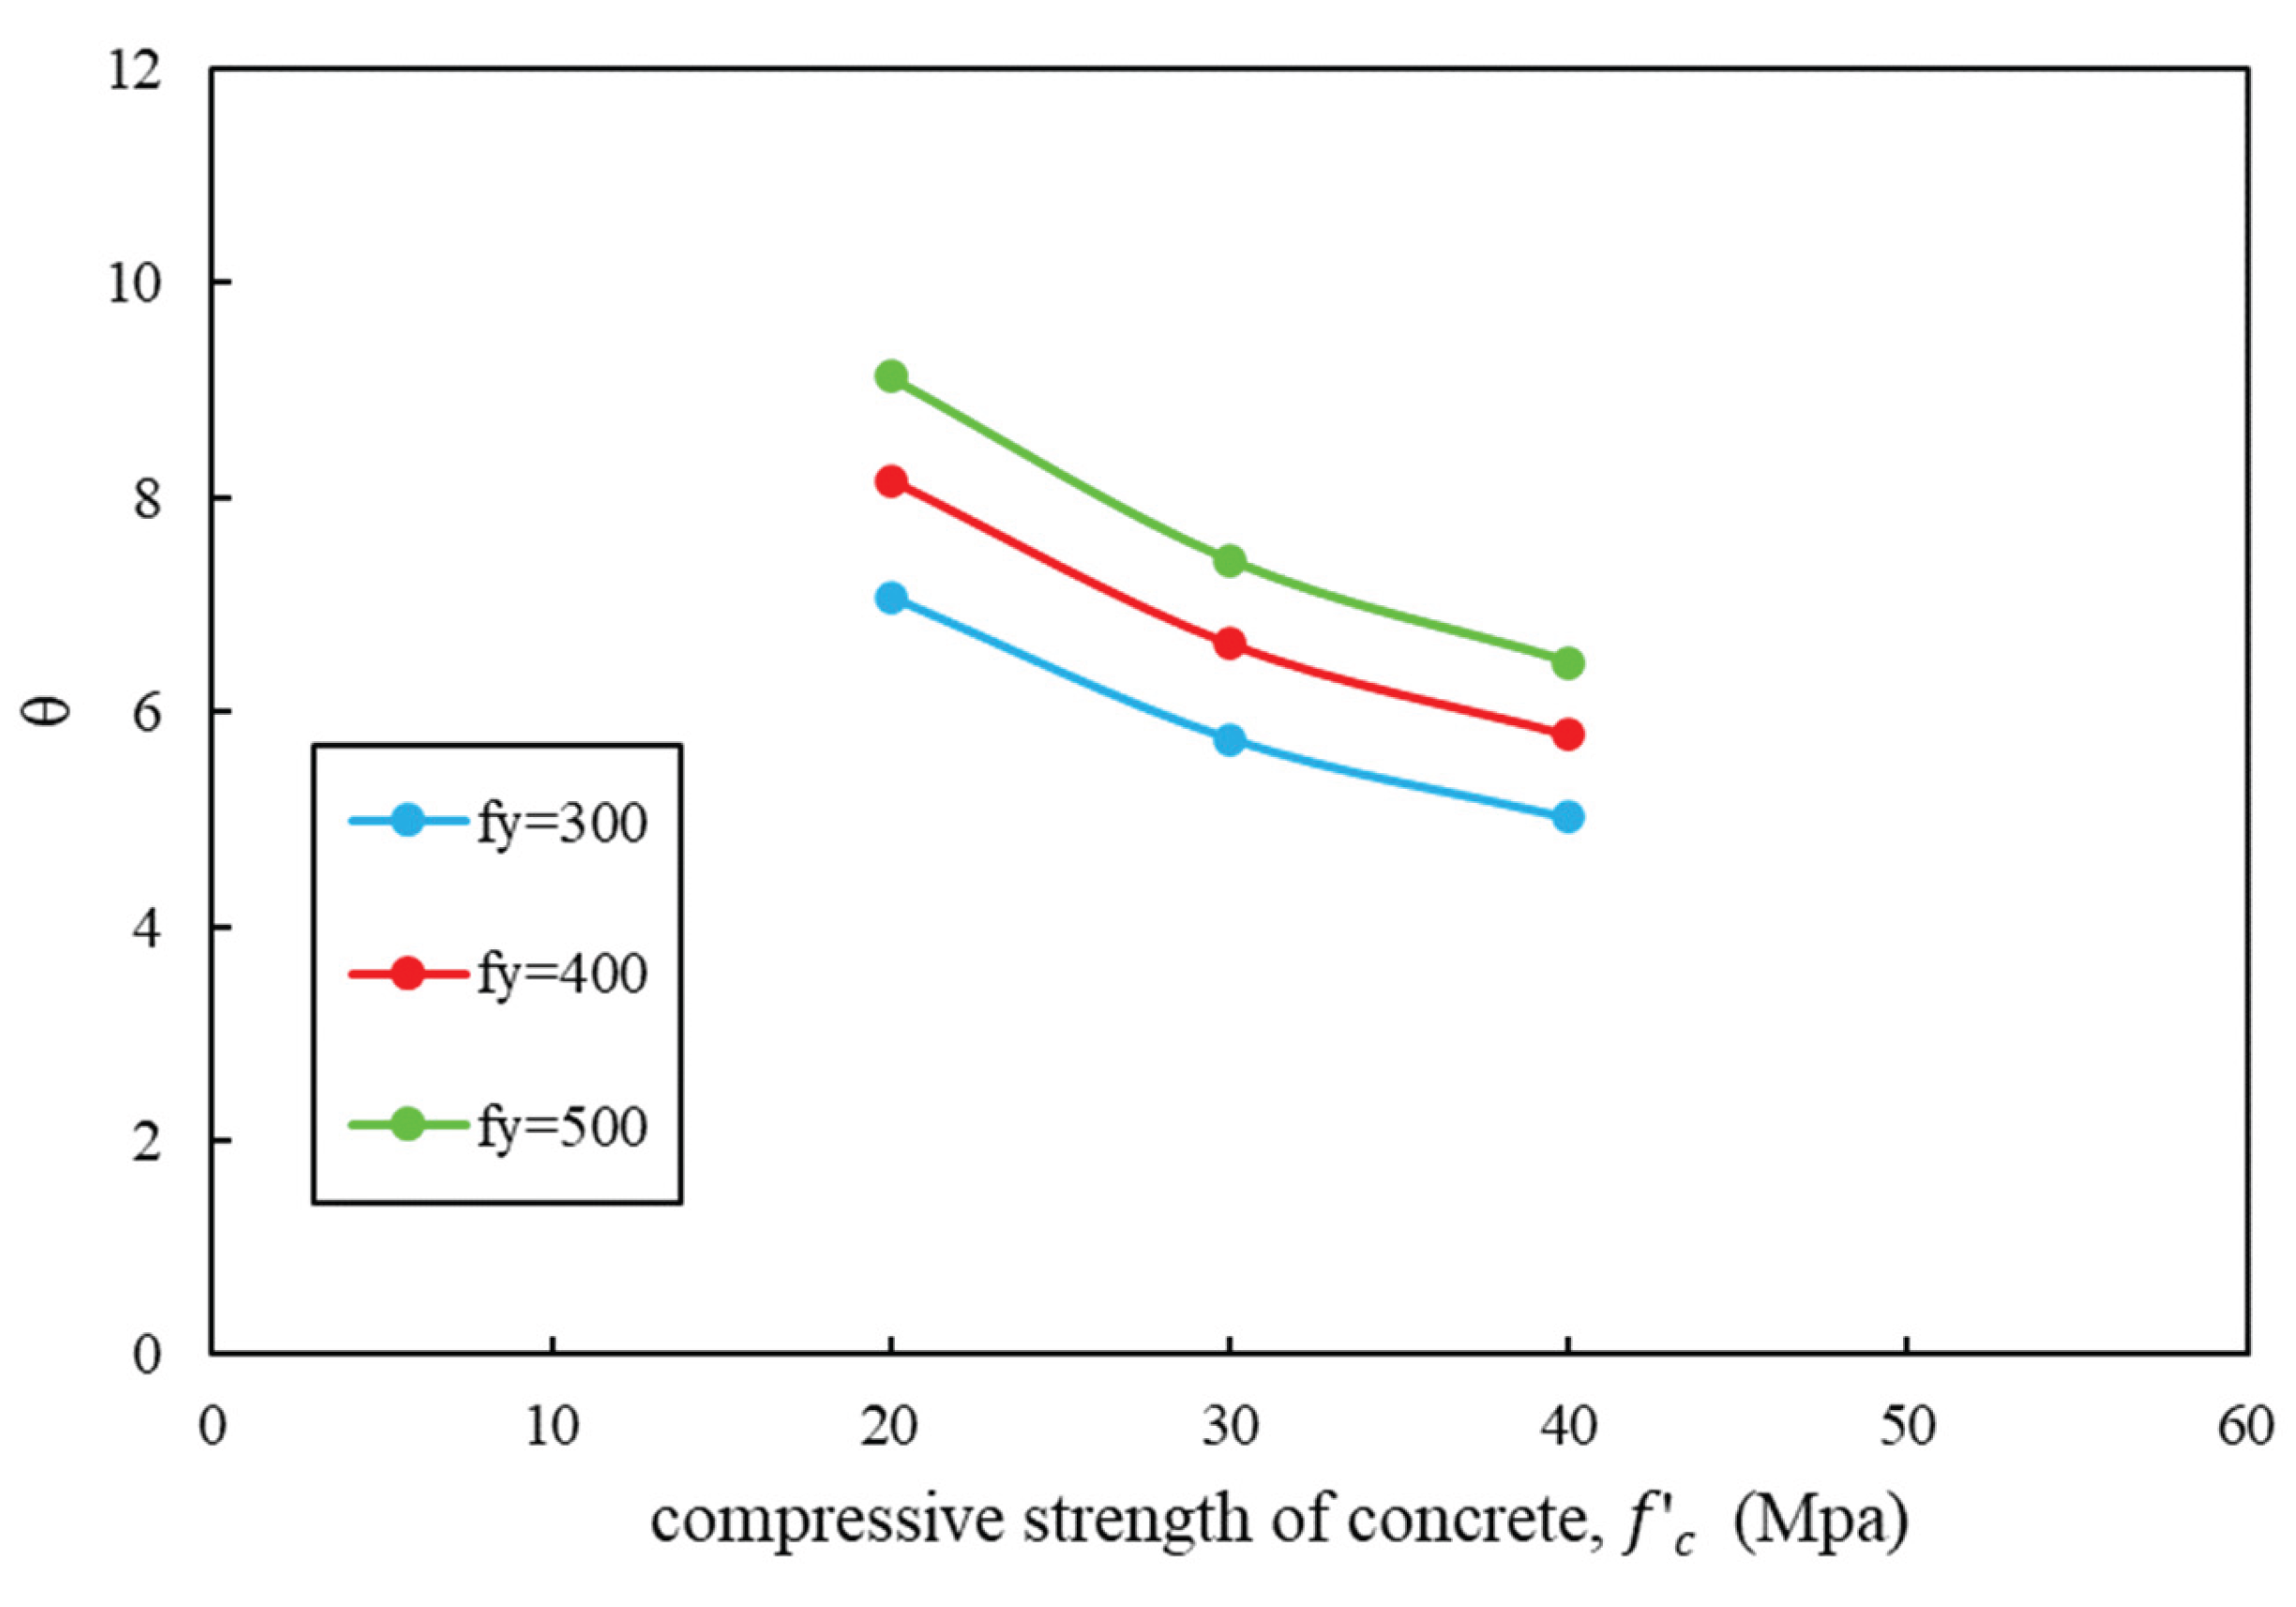
Table 1.
The detail of experimental models.
| Model Name | Anchor | |||
|---|---|---|---|---|
| (Mpa) | (mm) | (mm) | (mm) | |
| NPC-330 | 41.03 | 220 | 330 | 36-(55×30) |
Table 2.
Results from analysis of validated samples.
| Model Name | Ultimate Load | ||||
| EXP | FEM. | ||||
| (Mpa) | (mm) | (mm) | (KN) | (KN) | |
| NPC-330 | 41.03 | 220 | 330 | 319.4 | 345.2 |
Table 3.
The parametric study investigates the tensile extraction performance of embedded cast-in-place anchor bolts.
Table 3.
The parametric study investigates the tensile extraction performance of embedded cast-in-place anchor bolts.
|
(mm) |
Case |
(mm) |
(MPa) |
(mm) |
ring (mm) |
|
| C20-D20-H5 |
5 |
100 | 20 | 200 | 600 | |
| C30-D20-H5 | 100 | 30 | 200 | 600 | ||
| C40-D20-H5 | 100 | 40 | 200 | 600 | ||
| C20-D20-H8 |
8 |
160 | 20 | 320 | 960 | |
| C30-D20-H8 | 160 | 30 | 320 | 960 | ||
| 20 | C40-D20-H8 | 160 | 40 | 320 | 960 | |
| C20-D20-H10 |
10 |
200 | 20 | 400 | 1200 | |
| C30-D20-H10 | 200 | 30 | 400 | 1200 | ||
| C40-D20-H10 | 200 | 40 | 400 | 1200 | ||
| C20-D20-H12 |
12 |
240 | 20 | 480 | 1440 | |
| C30-D20-H12 | 240 | 30 | 480 | 1440 | ||
| C40-D20-H12 | 240 | 40 | 480 | 1440 | ||
| C20-D25-H5 |
5 |
125 | 20 | 250 | 750 | |
| C30-D25-H5 | 125 | 30 | 250 | 750 | ||
| C40-D25-H5 | 125 | 40 | 250 | 750 | ||
| C20-D25-H8 |
8 |
200 | 20 | 400 | 1200 | |
| C30-D25-H8 | 200 | 30 | 400 | 1200 | ||
| 25 | C40-D25-H8 | 200 | 40 | 400 | 1200 | |
| C20-D25-H10 |
10 |
250 | 20 | 500 | 1500 | |
| C30-D25-H10 | 250 | 30 | 500 | 1500 | ||
| C40-D25-H10 | 250 | 40 | 500 | 1500 | ||
| C20-D25-H12 |
12 |
300 | 20 | 600 | 1800 | |
| C30-D25-H12 | 300 | 30 | 600 | 1800 | ||
| C40-D25-H12 | 300 | 40 | 600 | 1800 | ||
| C20-D30-H5 |
5 |
150 | 20 | 300 | 900 | |
| C30-D30-H5 | 150 | 30 | 300 | 900 | ||
| C40-D30-H5 | 150 | 40 | 300 | 900 | ||
| C20-D30-H8 |
8 |
240 | 20 | 480 | 1440 | |
| C30-D30-H8 | 240 | 30 | 480 | 1440 | ||
| 30 | C40-D30-H8 | 240 | 40 | 480 | 1440 | |
| C20-D30-H10 |
10 |
300 | 20 | 600 | 1800 | |
| C30-D30-H10 | 300 | 30 | 600 | 1800 | ||
| C40-D30-H10 | 300 | 40 | 600 | 1800 | ||
| C20-D30-H12 |
12 |
360 | 20 | 720 | 2160 | |
| C30-D30-H12 | 360 | 30 | 720 | 2160 | ||
| C40-D30-H12 | 360 | 40 | 720 | 2160 |
Table 5.
Results of θ for cast-in-place headed anchor.
| fy | ||||
| 300 | 400 | 500 | ||
| (mm) | (Mpa) | (Mpa) | (Mpa) | (Mpa) |
| θ | ||||
| 20 | 20 | 6.94 | 8.01 | 8.96 |
| 30 | 5.60 | 6.47 | 7.23 | |
| 40 | 4.91 | 5.67 | 6.34 | |
| 25 | 20 | 7.14 | 8.24 | 9.22 |
| 30 | 5.79 | 6.69 | 7.48 | |
| 40 | 5.05 | 5.83 | 6.52 | |
| 30 | 20 | 7.12 | 8.23 | 9.20 |
| 30 | 5.85 | 6.75 | 7.55 | |
| 40 | 5.07 | 5.85 | 6.54 | |
Table 6.
Results of average θ for cast-in-place headed anchor.
| (Mpa) | Concrete Strength, (Mpa) | ||
| 20 | 30 | 40 | |
| θ | |||
| 300 | 7.0 | 5.7 | 5.0 |
| 400 | 8.2 | 6.6 | 5.8 |
| 500 | 9.1 | 7.4 | 6.5 |
Disclaimer/Publisher’s Note: The statements, opinions and data contained in all publications are solely those of the individual author(s) and contributor(s) and not of MDPI and/or the editor(s). MDPI and/or the editor(s) disclaim responsibility for any injury to people or property resulting from any ideas, methods, instructions or products referred to in the content. |
© 2025 by the authors. Licensee MDPI, Basel, Switzerland. This article is an open access article distributed under the terms and conditions of the Creative Commons Attribution (CC BY) license (http://creativecommons.org/licenses/by/4.0/).
Copyright: This open access article is published under a Creative Commons CC BY 4.0 license, which permit the free download, distribution, and reuse, provided that the author and preprint are cited in any reuse.


