

Submitted:
29 September 2025
Posted:
29 September 2025
You are already at the latest version
Abstract
Understanding the sediment grain size distribution in riverbeds is important prior to analyzing sediment transport, riverbed morphology, and ecological habitats. Previous studies have demonstrated the potential of grain size estimation by riverbed surface roughness through the linear relation between local grain size by manual sampling and corresponding percentile roughness by point cloud analysis of optical imagery. However, the applicability of linear relations is inherently limited, as they are typically derived from datasets that cover a relatively narrow range of local grain sizes. This study aims to develop an integrated grain size-roughness relation applicable across a broader spectrum of grain sizes. Investigations were conducted in four mountainous river reaches (R1, R2, R3, and R4) characterized by coarse grains and a broad grain size distribution (D16–D84: 2.3–525 mm) in Taiwan. High-precision 3D point cloud data were generated using UAV-SfM (Unmanned Aerial Vehicle-Structure-from-Motion) techniques for roughness metric calculation. First, the reach-scale linear correlation analysis was conducted between the grain sizes (Di, where i = 16, 25, 50, 75, and 84, respectively) and their corresponding percentile roughness (RHi) based on the data of Reach R1. Subsequently, all paired Di-RHi data on Reach R1 were used to derive an integrated power-law D-RH relation. Moderate to strong correlations (R2 = 0.60–0.94) were observed in linear Di-RHi relations. The integrated D-RH relation provides a reach-scale single, continuous relation, capturing the average tendency of the grain size-roughness correlations in Reach R1. Applicability tests at additional sites showed that it has better accuracy for coarser grains (D50–D84) than for finer grains. Future studies could extend this approach to a broader range of river segments to better delineate its applicability limits.
Keywords:
gravel-bed river
; UAV-SfM
; grain size distribution
; roughness height
; integrated power-law relation
1. Introduction
The distribution of sediment grain sizes in riverbeds is an important characteristic for analyzing sediment transport, riverbed morphology, and ecological habitats [1,2]. The comprehension of grain size distribution and its variations is essential for fluvial dynamics analysis and riverbed erosion and deposition estimation [3,4]. Grain size distribution is also a crucial parameter in hydraulic modelling and sediment transport simulations [5]. Conventional field-based surface sampling methods for riverbed grain size investigation, including pebble counts, grid counts, and areal samplings, though reliable, are labor-intensive and time-consuming, especially for the rivers in steep mountainous regions [6,7].
Researchers have focused on developing various methods to measure or estimate grain size to enhance the efficiency and scope of grain size surveys. These methods can be broadly categorized into two categories: those based on image analysis and those based on topographic data analysis [8]. Image-based approaches, such as the widely used photosieving method, utilize image analysis for segmentation and sizing of the resolvable grains [7,9,10]. In addition to photosieving, recent studies have employed image entropy, a texture-based metric derived from grayscale images, to estimate grain size [11,12]. However, image resolution, lighting conditions (particularly shadows), and grain texture may influence the results on image-based approaches [13].
Parallel developments for the estimation of grain sizes were conducted by topographic data analysis. Researchers had established the reach-scale correlation between local grain sizes (such as D50 and D84, the size at which 50% or 84% of measured b-axes are finer, b-axes represent an intermediate dimension of a grain, see Figure 1) obtained through manual sampling and the roughness metrics derived from topographic data [14,15,16,17] (as shown in Table 1). This method offers the advantage of spatially continuous characterization of grain size, benefiting from the continuous nature of topographic data [17]. In previous times, acquiring high-quality terrain data necessitated using expensive Terrestrial Laser Scanning (TLS) technology. Recent advances in UAV (Unmanned Aerial Vehicle)-based Structure-from-Motion (SfM) photogrammetry [18] have made it feasible to acquire high-resolution 3D terrain data at greater accessibility, flexibility, and cost-efficiency compared to the TLS method, and this has made a significant contribution to the development of the method using topographic data to estimate surface roughness [12,17,19].
Comparisons of the grain size and roughness relations established by previous researchers discovered that the linear coefficients of the relations vary for the results obtained by different researchers from different river reaches, as shown in Table 1. These variations could be ascribed to multiple factors affecting the grain size-roughness relations, including the difference between sampling methods (pebble counts or areal sample, [6]), grains (size, composition, stacking structure, [16]), and roughness metrics (method and grid size, [16,17]). Pearson et al. [16] conducted experiments and demonstrated that the estimated surface roughness was mainly influenced by vertical height differences between gravel (for example, spherical grains exhibit higher roughness values than flat grains of the same size). They also observed a low correlation between grain size and roughness in poor sorting composition, where finer particles may be shielded by coarser grains, reducing their expression in surface roughness. Vázquez-Tarrío et al. [17] revealed that the correlations in larger grain (D50 and D84) and their corresponding percentile roughness were higher than those of finer grain (D16). Wong [12] emphasized that when grains on the riverbed were smaller or flatter in shape, the variability of surface roughness of the riverbed decreased, resulting in a less pronounced correlation between grain size and roughness. These findings revealed the significant impact of grain size and composition within individual river channels on the grain size-roughness relations.
Previous studies also showed that most existing correlations between grain size and roughness were developed in gravel-bed rivers with D84 typically below 160 mm (Table 1). The grain size–roughness relations for riverbeds containing larger boulders and exhibiting broad, highly heterogeneous grain size distributions remain understudied. Additionally, previous research mainly focused on exploring the linear relationship between local grain size and corresponding roughness. However, the applicability of linear relations is inherently limited, as they are typically derived from datasets that cover a relatively narrow range of local grain sizes. Consequently, they cannot effectively or simultaneously estimate grain sizes across a broad range within wide-grained riverbeds, often necessitating fragmented solutions for different size fractions.
To address this gap, we conducted manual samplings in four mountainous reaches (R1, R2, R3, and R4) across two watersheds in Taiwan, where riverbeds are characterized by coarse grains, poorly sorted (highly heterogeneous) composition, and a broad grain size distribution that includes boulders (> 256 mm). High-precision 3D point cloud data were generated using UAV-SfM techniques for roughness metric calculation. First, we tested different kernel radii to determine an appropriate roughness height (RH) calculation size. Next, the reach-scale correlations of the Di-RHi (i = 16, 25, 50, 75, and 84, respectively) relations were established by comparing manually sampled grain sizes (Di) with their corresponding percentile roughness (RHi) at eight sites in Reach R1. Then, all paired Di-RHi data were applied to derive an integrated power-law relation, thereby providing a single, continuous relation capable of characterizing a wider range of grain sizes. Finally, the applicability of the integrated relation was tested using the data taken from Reaches R2–R4.
2. Materials and Methods
2.1. Study Area
This study was conducted in four river reaches (R1, R2, R3, and R4) within two mountainous watersheds in Taiwan: The Heshe River watershed in central Taiwan and the Laishe River watershed in southern Taiwan (Figure 2). The Heshe River drains a 92.3 km² catchment, ranging in elevation from 758 to 2,859 m a.s.l. (above sea level), while the Laishe River drains a 44.2 km² catchment with elevations between 125 and 2,286 m a.s.l. The mean basin slopes are 34.6° and 36.2°, respectively. Both watersheds are located in a subtropical monsoon climate, with average annual rainfall of 3,100 mm in the Heshe watershed (Shemu Village gauge) and 3,600 mm in the Laishe watershed (Xinlaiyi gauge). Approximately 75% of annual rainfall occurs between May and September, primarily during typhoons and frontal rainstorms, resulting in pronounced seasonal variations in streamflow. The geological distribution in the Heshe River watershed is primarily dominated by the Nanjuang Formation, characterized by interbedded sandstone and shale. The Laishe River watershed is mainly composed of the Chaozhou Formation, featuring predominantly hard shale or slate [21].
The studied Reach R1 and Reach R2 are located in the middle section of the Heshe River watershed. Reach R1 is situated downstream of the confluence of three upstream tributaries and is characterized by a relatively straight, single-thread channel with lateral sediment bars. The channel width is approximately 100 meters with a mean channel slope of approximately 0.075. Reach R2 is located approximately 2 km downstream of Reach R1 and displays a braided channel morphology, with multiple flow paths and mid-channel bars. Its channel width is approximately 150 meters, and its channel slope is about 0.053.
The studied Reach R3 and Reach R4 are located in the mid-lower section of the Laishe River watershed, immediately upstream of the confluence between the main stream and a major tributary. Reach R3 lies on the tributary side and exhibits a relatively narrow, single-thread channel with a slope of approximately 0.054 and a width of about 80 m. In contrast, Reach R4 lies along the main stream, with a wider channel of about 150 m and a gentler slope of 0.033.
Landslides and debris flow have introduced coarse grains into the study reaches [22,23]. Consequently, boulders (>256 mm) are commonly scattered across the riverbed, producing a wide grain size distribution. The exposed bed surfaces are heterogeneous and dominated by coarse grains. Sediments are mainly composed of irregularly shaped gravels and cobbles, which are generally arranged in a random packing state, with interstitial spaces partly filled by discontinuous patches of sand and fine gravel.
2.2. Field Surveys
Seven field surveys (Table 2), including the utilization of UAV for topographic data collection and Wolman pebble counts samplings, were conducted in this study. To ensure smooth progress in field investigations, all activities were conducted on sunny days to obtain high-quality UAV images and reliable grain-size samples. Each survey was conducted within 1 to 2 days. The subsequent section delineates the implementation approach of the field surveys.
2.2.1. UAV Photography and Point Cloud Data
This study employed a DJI Phantom 4 Pro quadrotor UAV equipped with a 20-megapixel camera to conduct aerial surveys over mountain river channels. The vertical takeoff and landing capability of the quadrotor UAV provided operational flexibility in terrains with significant elevation changes. Prior to each flight, several ground control points (GCPs) were strategically deployed throughout the survey area. The coordinates of these GCPs were obtained using real-time kinematic (RTK) Global Navigation Satellite System (GNSS) devices to ensure georeferencing accuracy.
The UAV was flown along pre-planned flight paths to ensure full coverage of the study area. High image overlaps were adopted to enhance image quality and reconstruction reliability [24], with front and side overlaps set to 85% and 75%, respectively. The flights were conducted at 20 m above ground level, providing a relatively high spatial resolution while balancing coverage and flight efficiency. The flight speed was maintained at approximately 10 m/s. Aerial images and GCP data were subsequently processed using Pix4Dmapper software, applying the Structure from Motion (SfM) algorithm to generate dense 3D point clouds of the study reaches. Detailed survey information was summarized in Table 2, including survey dates, reaches, point cloud density, ground sampling distances (GSD), and georeferencing errors. Point cloud densities across the seven UAV campaigns ranged from approximately 8,500 to 22,800 points/m³. GSD ranged from 4.7 mm/px to 7.2 mm/px. The root-mean-square georeferencing errors for the SfM outputs ranged between 0.8 cm and 3.2 cm, comparable to those reported in previous studies, such as ±5.3 cm in [17] and 1.0–5.0 cm in [12].
2.2.2. Wolman Pebble Counts Sampling Method
This study employed the Wolman pebble counts sampling method [25] to investigate riverbed grain size distribution. The sampling area was set in 10m × 10m (100 m2 in area) square grids, designated as sampling patches. A rope, tapped with markings at 1-meter intervals, was stationed, and the b-axis of grains was measured along the rope at these specified intervals [26]. For each patch, a total of 121 grains (11 samples per row) were sampled and measured for size, following the non-repetitive sampling principle [6]. The sampling templates used in this study had different opening sizes, including 8 mm, 16 mm, 32 mm, 45.3 mm, 64 mm, 90.5 mm, 128 mm, 181 mm, 256 mm, and 512 mm. The grains having sizes larger than 512 mm within the sampling area were measured using a caliper. In subsequent analyses, grains with a b-axis smaller than 8 mm will be treated as 4 mm in the analysis of grain size distribution.
Following the recommendation of [17], 8 to 10 Wolman samples would be sufficient to obtain reliable reach-scale grain size-roughness relations. Accordingly, we conducted eight field samples in Reach R1 to develop the relations. To evaluate the broader applicability of the approach, we further carried out two field samplings at each of three other reaches (Reach R2, R3, and R4). Therefore, a total of 14 manual grain size samplings were performed throughout the study area (Figure 2). The D50 of the 8 sampling sites in the Reach R1 ranged from approximately 33.8 to 175.8 mm, with an average size of 102.8 mm. The coefficient of uniformityand sorting coefficient for the grain size distribution, as defined in Equation (1) and Equation (2), varied from 5.2 to 43.6, and 1.8 to 6.1 respectively for the eight sampling sites in the Reach R1. The D50, and of the 6 sampling sites distributed in Reach R2, R3, and R4 ranged from 45.8 to 97.0 mm, from 6.3 to 63.2, and from 1.9 to 5.0, respectively. The proportion of boulders (>256 mm) at each sampling site varied between 7.0% and 35%. These results indicate that the riverbed exhibited a wide range of grain sizes distribution in the studied reaches.
2.3. Roughness Metric
2.3.1. Concept of Roughness Height
Roughness metric describes the degree of surface undulation represented in point cloud data [14]. Various roughness metrics have been adopted for grain size estimation, including roughness height (RH), standard deviation (σ), and detrended standard deviation (σd) (Table 1). Among them, RH has been widely applied in recent years [12,17,19] and was shown by [17] to yield stronger correlations with grain size than other metrics. Therefore, RH was selected for analysis in this study. Unlike the conventional hydraulic roughness height (i.e., the equivalent sand roughness ks) used in flow resistance and sediment transport formulations [27,28,29], where roughness height is typically defined as a representative grain size (such as αD₈₄, α=1.0–3.5), RH here is a statistical measure of local surface variability derived from UAV-SfM point cloud data. It is calculated as the distance between this point and the best-fitting plane computed on its nearest neighbors within a specific kernel radius [30]. As such, RH provides a remote sensing–based proxy for bed-surface texture that can be related to characteristic grain sizes, as shown in Table 1.
We utilized CloudCompare (version 2.14), an open-source point cloud processing software, to compute RH. The roughness value for each point was calculated using a fixed kernel radius (described in 2.3.2), which defines the neighborhood size for the local plane fitting. This process yields a spatially distributed roughness field across the study area ([30] & Figure 3).
To enable comparison with grain size sampling data, we first computed the median roughness value within each 1 m 1 m area, which corresponds to the manual sampling interval, and used it as the representative roughness value for that cell. Then, the representative roughness value within the area corresponding to the sampling site were extracted and sorted in ascending order. From these values, the 16th, 25th, 50th, 75th, and 84th percentiles were determined and designated as the RH16, RH25, RH50, RH75, and RH84, respectively. These percentile roughness values were then paired with the corresponding local grain sizes (D16, D25, D50, D75, and D84) to perform correlation analyses (described in 2.3.3).
2.3.2. Grid Size for Computing Roughness Metrics
The selection of grid size (or kernel radius in RH) is a critical factor in computing roughness metrics, as it defines the neighborhood of point-cloud data used for calculation [30]. A larger kernel radius produces a smoother fitting plane and thus larger RH values. This effect is illustrated in Figure 4, where three RH distributions were evaluated by three different kernel radii for the same sampling site. Such variations in RH with kernel size can, in turn, influence the correlation between grain size and roughness [11,12].
To determine a suitable kernel radius, we tested eight kernel radii (0.03125, 0.0625, 0.1, 0.125, 0.25, 0.5, 0.75, and 1 meters) in Reach R1. For each radius, we computed the corresponding roughness heights and evaluated the linear correlation between D50 and RH50 by its coefficient of determination (R²). A suitable kernel radius was chosen for subsequent investigations by identifying a value that produced a high R², without necessarily being the highest R².
Since grain-size characteristics varied across study sites in different studies, we also introduced a dimensionless grid size (S) to facilitate cross-study comparisons. S is defined as the grid size divided by the average D50 of the datasets, as illustrated in Equation (3).
2.3.3. Correlation Analysis of Grain Size-Roughness Relationship
The reach-scale correlations between grain size and roughness were established based on eight sampling patches in the R1 reach, following the recommendation of [17]. Due to the time-consuming nature of fieldwork, data collection was carried out at different times, but always under sunny conditions to secure reliable grain-size sampling and high-quality UAV imagery. As long as data quality is maintained, temporal differences in sampling generally have little effect on grain-size and roughness correlations, as noted by [17]. Therefore, the datasets obtained at different time were jointly for establishing the grain size–roughness relations.
The correlation analyses were conducted between the grain size (Di, where i = 16, 25, 50, 75, and 84, respectively) and the corresponding percentile roughness (RHi), and their differences were compared. Subsequently, all paired Di-RHi data in Reach R1 were pooled together for integrated analysis. A power-law regression was then applied using the MATLAB Regression Learner App (R2022b) to establish an integrated relation between grain size and roughness.
To evaluate estimation accuracy, we first examined the integrated grain size–roughness relations using the original eight sampling sites in Reach R1. Its applicability was further tested with six additional sites in Reach R2-R4. The relative errors (RE) of local grain sizes () were calculated following Equation (4):
where (mm) denotes the grain sizes obtained from manual samplings, (mm): denotes the grain sizes estimated from the integrated D-RH relation or individual linear Di-RHi relations based on roughness data. Figure 5 depicts the research workflow and the software utilized at each stage.
3. Results
3.1. Grid Size for Computing Roughness Metrics
The grid size (or kernel radius) used for computing the roughness metrics would affect the resulting roughness values and subsequently influence the correlation between grain size and roughness. In this study, eight dimensionless grid sizes (, ranged from 0.6 to 19.5) were used to compute corresponding roughness heights in Reach R1, and the R2 of D50-RH50 relation in various kernel radii were presented in Figure 6. When was less than 2.0, the correlation between D50 and RH50 was week, with R2 less than 0.7. As the increased, the D50-RH50 correlation improved steadily, and their R2 exceeded 0.88 for S ranging from 2.4 to 14.6, reaching a peak value of 0.945 at S = 14.6. The R2 dropped to 0.81 when = 19.5. Although the highest R2 of the D50-RH50 relation occurred at a kernel radius of 0.75m ( = 14.6), we selected a kernel radius of 0.5 m ( = 9.5) for subsequent roughness computations because it achieved a similarly high R² (0.936, a difference of only 0.009 with R2 at kernel radius of 0.75m) while matching the 1.0 m interval used in our manual field sampling and is also consistent with the kernel radius used by [17].
3.2. Correlation Between Grain Size and Roughness Height
The reach-scale Di-RHi (where i = 16, 25, 50, 75, and 84, respectively) correlations at 8 sites in Reach R1 were displayed in Figure 7 a–e. The local relation between grain size and percentile roughness can be expressed as a linear relation (Equation (5), and in mm). The regression formulas and their coefficients of determination (R2), slope (), and intercept () were summarized in Table 3.
The results displayed moderate to strong correlations (R2 = 0.60–0.94, Table 3) between grain size and roughness in variations of sizes in Reach R1. The D50-RH50 relation (Figure 7c) exhibited the highest correlation (R2 = 0.94), with D50 ranging from 33.8 mm to 175.8 mm and RH50 ranging from 31.0 mm to 55.5mm. The correlation weakened as the grain size deviated from D50, with R2 equal to 0.79, 0.92, 0.70, and 0.60 in D16-RH16, D25-RH25, D75-RH75, and D84-RH84 relations, respectively.
Figure 8 illustrates the variation of the regression slope () and intercept () with respect to different Di-RHi relations. As the grain size increases from D16 to D84, the value of increased consistently: 2.32 (D16-RH16), 3.41 (D25-RH25), 5.71 (D50-RH50), 9.45 (D75-RH75), and 15.99 (D84-RH84), while the value of became increasingly negative: -46.67 (D16-RH16), -73.9 (D25-RH25), -142.58 (D50-RH50), -265.02 (D75-RH75), and -605.11 (D84-RH84). The result suggests that for coarser grains, the fitted linear regression has a steeper slope and a larger (more negative) intercept.
3.3. Integrated Di-RHi Relations by a Power Law
According to the findings presented in Section 3.2., the relations between grain size and corresponding roughness vary with grain size. Applying a single linear regression to a riverbed with highly heterogeneous and wide-ranging grain sizes would result in limited accuracy, as it can only reliably predict grain sizes within a specific range, rather than across the full distribution. Moreover, the analysis revealed that the slope () of the grain size–roughness relations tend to increase with grain size, indicating a steeper correlation for coarser grains. To address this variability, we compiled all paired Di-RHi data (where i = 16, 25, 50, 75, and 84, respectively) in Reach R1 for an integrated analysis. A power-law regression was then proposed to establish an integrated relation between grain size and surface roughness, as shown in Equation (6) and Figure 9 ( and in mm), with a coefficient of determination (R2) of 0.89.
The integrated relation represents the average tendency across the grain size–roughness correlation in Reach R1. It provides a single, continuous relation capable of estimating grain size distributions ranging over a broad range, from 8 mm—the smallest sampling sieve size—to approximately 500 mm, provided that RH is known. According to Equation (6), a greater surface roughness is typically associated with a larger grain size. Furthermore, differentiating Equation (6) with respect to D yields Equation (7), which illustrates the sensitivity of roughness to changes in grain size.
Equation (7) shows that a unit change in D for smaller grain sizes leads to a relatively larger change in RH, indicating that the variation of surface roughness is more sensitive to fine grains. For instance, is approximately 0.186 for D = 50 mm (RH ≈ 36.9 mm) but only about 0.033 for D = 500 mm (RH ≈ 66.0 mm), a difference of about 5.6 times. This indicates that sensitivity decreases progressively with coarser grains.
3.4. Examination of the Integrated Grain Size-Roughness Relation
We examined the integrated grain size–roughness relation using the data of the original eight sampling sites in Reach R1, where the relations were established. Relative errors (RE, Equation (4)) were computed by comparing grain sizes from manual sampling with those estimated from the relation, and the results were summarized in Table 4. For D16, REs ranged from 15.0% (H02) to 362.0% (H07), with a mean relative error (MRE) of 91.9%. For D25, REs ranged from 4.2% (H03) to 72.1% (H08), with an MRE of 35.6%. For D50, REs ranged from 2.1% (H07) to 45.0% (H06), with an MRE of 23.7%. For D75, REs ranged from 0.1% (H02) to 31.4% (H01), with an MRE of 15.4%. For D84, REs ranged from 6.5% (H04) to 32.3% (H02), with an MRE of 19.3%. As the integrated relation reflects an average grain size–roughness correlation tendency in Reach R1, the RE of local grain sizes may be varied in individual sites. Overall, the results indicated that the integrated relation yielded better consistency for coarser grains (D50–D84) than for finer grains (D16 and D25).
3.5. Applicability of the Integrated Grain Size-Roughness Relation
We applied the integrated grain size-roughness relation to six additional sampling sites to examine its applicability. These included two sites in Reach R2, located about 2 km downstream of Reach R1 within the same watershed, and four sites in Reaches R3 and R4, situated in a different watershed. Their RH values were derived from their topographic data. The grain-size distributions estimated from the integrated relation were first compared with those obtained from manual sampling (Figure 10a–f). The comparisons showed that the estimated grain size distribution had better agreement at sites H09 and H10 in Reach R2 and at sites N01 and N02 in Reach R3, compared to that at sites L01 and L02 in Reach R4.
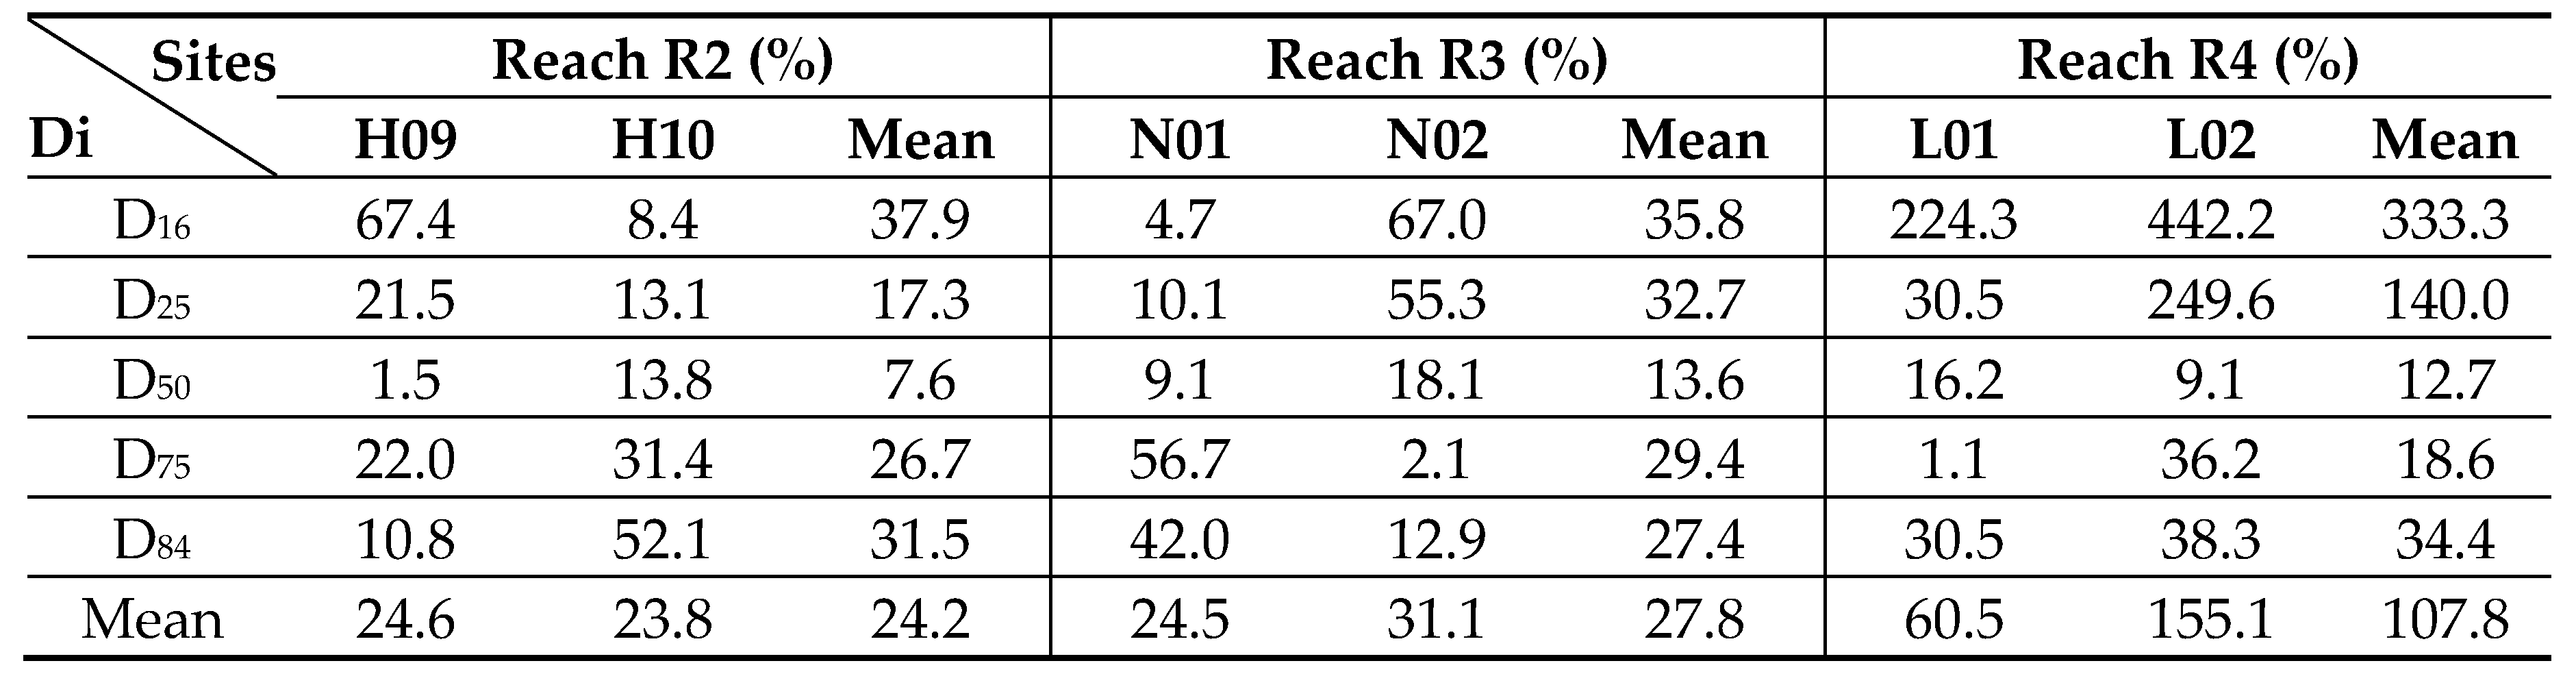
We further compared the relative errors of local grain sizes from manual samplings with those estimated from the integrated R-D relation (Table 5) and individual linear Di–RHi relations (i=16,25,50,75, and 84; Table 3), with the results of the latter summarized in Table 6. In Reach R2, the MREs from the integrated relation ranged from 4.7% (D75) to 27.3% (D16), with an average of 18.6%. By comparison, the individual linear relations produced MREs ranging from 7.6% (D50) to 37.9% (D16), with an average of 24.2%. In Reach R3, the MREs from the integrated relation varied between 8.7% (D50) to 54.5% (D16), with an average of 27.2%, whereas those from the linear relations ranged from 13.6% (D50) and 35.8% (D16), with an average of 27.8%. Substantially larger errors were observed in Reach R4, where the integrated relation yielded MREs from 34.4% (D50) to 300.7% (D16), with an average of 99.4%, while the linear relations produced errors from 12.7% (D50) to 333.3% (D16), with an average of 107.8%. Overall, these results indicate that the integrated relation performs comparably to individual linear regressions across Reaches R2–R4, while offering the practical advantage of a single equation applicable to multiple grain-size percentiles.
Consistent with the examination results, the integrated relation demonstrated higher accuracy for coarser grains (D50–D84) than for finer grains such as D16 in the applicability tests. In Reaches R2 and R3, estimation errors were generally within acceptable ranges and comparable to those in the examination stage (Section 3.4.). In Reach R4, estimations of D50, D75, and D84 remained within acceptable error ranges, but those of D16 and D25 exhibited substantially larger discrepancies, with relative errors exceeding 60%. Notably, the linear relations also produced large errors for D16 and D25. The common features among sites L01 and L02 were their relatively high proportion of fine grains (<8 mm: 19.8% in L01, and 23.1% in L02) and high coefficients of uniformity ( = 53.5 and 63.2). To further illustrate this effect, Figure 11 compared orthophotos of two representative sampling sites. Site H10, characterized by smaller estimated errors, featured a well-sorted surface dominated by relatively closely packed pebbles and cobbles, creating a uniform texture. Conversely, site L02, with the largest errors, displayed a poorly sorted surface where the bed is interspersed with distinct patches of sand and fine gravel.
4. Discussion
4.1. Grid Size Effect on Roughness Evaluation
The selection of grid size (or kernel radius) for computing roughness metrics directly influences the resulting roughness values and consequently affects the correlation with grain size [11,12]. As illustrated in Figure 6, Woodget et al. [11] tested S ranging from 6.3 to 11.3 (kernel radius from 0.1m to 0.5m) and reported the highest correlation (R2 = 0.31 for D84-RH84) at ≈ 8.8. Wong [12] evaluated the S between 4.3 to 7.1 (kernel radius between 0.01 to 0.06 m) and found the highest correlation (R2 = 0.49 for D84-RH84) at ≈ 5.7. In the present study, S ranging from 0.6 to 19.5 (kernel radius between 0.03125 to 1.0 m), and the highest correlation (R2 = 0.945 for D50–RH50) was observed at S = 14.6. Although the optimal S varies among studies, the variation of R2 with changes of S revealed a consistent pattern in Figure 6: correlation strength generally increased with S, peaked at intermediate specific values, and then gradually declined as S became larger. Notably, our results showed relatively high correlations (R2 > 0.88 for D50–RH50) across a broader interval of S = 2.4–14.6 compared to previous studies [11,12]. It suggested some degree of flexibility in kernel radius used in the riverbed with coarse grains and a broad grain size distribution (D16–D84: 2.3–525 mm in our study).
4.2. Correlation Between Grain Size and Roughness Height
The linear D50–RH50 relation derived from mountainous rivers in our study was compared with those reported in previous studies using the RH metric (Table 1; Figure 12). The ranges of the correlations were plotted based on the extent of data provided in each study. The slope () of these relations ranges from 0.89 to 5.71, and the intercept () ranges from -142.58 to 22.0 (unit of the relation in mm). Such considerable variability in coefficients likely reflects differences in the grain-size characteristics and the kernel radius used in roughness calculations across studies (Table 1). For instance, although both [17] and the present study adopted the same kernel radius of 0.5 m, their D50 ranges differed (28–65 mm in [17] vs. 34–176 mm in this study), resulting in an value in this study that is approximately 6.4 times larger. Regarding kernel radius, Wong [12] used 0.04 m, Pearson et al. [16] applied 0.2 m, while [17] and this study adopted 0.5 m. As shown in Figure 12, larger kernel radii consistently yielded higher roughness values, underscoring the strong influence of scale on roughness metrics.
These comparisons point to an important implication: no single, universal linear relation exists between grain size and surface roughness, as also noted by [16,17]. Differences in dataset grain-size ranges and the grid size used in roughness calculations appear to exert a strong influence, making direct cross-study comparisons and applications challenging. In this context, the integrated relation proposed in this study offers a practical alternative. Rather than being tied to a narrow dataset or a specific Di–RHi relation, it provides a single, continuous D–RH correlation applicable across a broader grain-size spectrum (≈8–500 mm).
4.3. Integrated Grain Size–Roughness Relation
This study established a reach-scale integrated power-law grain size-roughness relation derived from multiple sets of grain sizes and their corresponding percentile roughness in Reach R1. This relation captures the average tendency of grain size-roughness correlations within Reach R1. It provides a single, continuous relation capable of estimating grain sizes between 8 and 500 mm in heterogeneous, gravel-bed mountain rivers. Both the examination and applicability results consistently showed that the integrated relation achieved better accuracy for coarser grains (D50–D84) than for finer grains such as D16.
Both individual linear and integrated relations yielded relatively large MREs for D16. The reduced performance for finer grains may be explained by the higher sensitivity of small roughness values to topographic resolution and georeferencing errors, which amplify estimation uncertainty. This pattern is consistent with [17], who also reported weaker correlations for finer grains. The relatively large errors in D16 at sites H07, N02, L01, and L02 may have been further amplified by their relatively high proportions (15.0%–23.1%) of fine grains (<8 mm). These observations suggest that the integrated relation may have limited applicability at sites with substantial fine-grain content, reinforcing that the use of surface roughness as a proxy for finer grains remains constrained and requires further investigation.
Performance also varied across different reaches. The integrated relation performed relatively well at Reach R2, located 2 km downstream of Reach R1, and at Reach R3 in another watershed, while higher biases were observed at Reach R4. Geomorphic settings appear to influence these outcomes, partly through their effect on bed material composition (Figure 11). For example, reach-scale slope is often linked to sediment composition [31]. Reaches R2 and R3, with slopes of 0.053 and 0.054, were more comparable to Reach R1 (0.075) and showed better agreement, whereas the gentler slope of Reach R4 (0.033) coincided with poorer performance. Although these interpretations remain tentative, given the limited number of sites, the observed trend suggests that geomorphic similarity, such as slope, may help indicate where the integrated relation is more applicable.
In summary, the integrated relation developed here provides a practical tool for characterizing grain-size distributions in steep, coarse-grained mountain rivers. It shows strong potential for coarser grains (D50–D84) but limited applicability for finer grains. Future studies could further investigate the performance of the integrated relation across diverse river segments to better delineate its applicability limits.
5. Conclusions
This study investigated the reach-scale relations between grain size from manual samplings and surface roughness derived from high-resolution UAV-SfM point clouds in mountainous river reaches characterized by coarse grains and a broad grain size distribution. Moderate to strong correlations (R2 = 0.60–0.94) were observed for linear Di-RHi (i = 16, 25, 50, 75, and 84, respectively) relations in Reach R1. An integrated power-law grain size and roughness relation (R2 = 0.89) was then developed using all paired Di–RHi data on Reach R1. This relation provides a single, continuous relation capable of estimating grain sizes between 8 and 500 mm in heterogeneous, gravel-bed mountain rivers. It captured the average tendency of the D-RH correlations in Reach R1, with mean relative errors equal to 91.9%, 35.6%, 23.7%, 15.4%, and 19.3% for D16, D25, D50, D75, and D84, respectively. The applicability tests at six additional sites in Reach R2-R4 showed that the integrated relation produced more accurate estimates for coarser grains (D50–D84) than for finer grains such as D16.
The results demonstrate that surface roughness computed from UAV-SfM point clouds can serve as a proxy for estimating grain sizes in exposed riverbeds. The integrated relation developed here offers a practical empirical tool for characterizing surface grain-size distributions over a broad spectrum of sizes in gravel-bed mountain rivers. However, its performance varied among different reaches, with weaker accuracy observed in lower-slope reaches (Reach R4) that contained relatively large proportions of fine grains (<8 mm; 19.8%–23.1%). Future studies could extend this approach to a wider range of river segments to better delineate its applicability limits.
Author Contributions
Conceptualization, Chyan-Deng Jan, Tung-Yang Lai and Kuan-Chung Lai; Formal analysis, Tung-Yang Lai and Kuan-Chung Lai; Investigation, Tung-Yang Lai and Kuan-Chung Lai; Supervision, Chyan-Deng Jan; Writing—original draft, Tung-Yang Lai; Writing—review & editing, Chyan-Deng Jan.
Data Availability Statement
The original contributions presented in this study are included in the article material. Further inquiries can be directed to the corresponding author(s).
Acknowledgments
The authors are grateful to the financial support from The National Science and Technology Council in Taiwan, under grant number NSTC 113-2625-M006-013. The authors also appreciate Dr. Yu-Chao Hsu for his help during field surveys.
Conflicts of Interest
The authors declare no conflicts of interest.
Appendix A

Table A1.
The results of local grain sizes by manual sampling at 14 sites in this study.
| Site | D10 | D16 | D25 | D30 | D50 | D60 | D75 | D84 | D90 | Dmax | |||
| H01 | 3.3 | 14.7 | 31.5 | 40.9 | 84.3 | 104.4 | 167.6 | 205.5 | 303.3 | 1050.0 | 31.6 | 2.3 | 3.7 |
| H02 | 1.4 | 2.3 | 4.5 | 5.8 | 33.8 | 62.4 | 167.8 | 231.0 | 265.8 | 1350.0 | 43.6 | 6.1 | 10.0 |
| H03 | 2.9 | 9.3 | 22.7 | 30.1 | 78.9 | 104.5 | 193.0 | 246.1 | 356.9 | 1470.0 | 36.6 | 2.9 | 5.1 |
| H04 | 4.0 | 31.3 | 73.9 | 97.5 | 175.8 | 206.3 | 315.5 | 525.3 | 1134.6 | 2150.0 | 51.6 | 2.5 | 4.4 |
| H05 | 3.6 | 7.6 | 19.0 | 25.3 | 74.5 | 97.5 | 193.8 | 251.6 | 327.3 | 860.0 | 26.8 | 3.2 | 5.7 |
| H06 | 39.0 | 71.0 | 94.7 | 107.8 | 174.6 | 203.3 | 310.4 | 374.6 | 471.2 | 850.0 | 5.2 | 1.8 | 2.3 |
| H07 | 4.0 | 5.8 | 27.4 | 39.5 | 120.6 | 161.0 | 298.0 | 380.3 | 825.0 | 1750.0 | 40.3 | 3.3 | 8.1 |
| H08 | 4.0 | 6.3 | 9.8 | 11.7 | 79.5 | 124.3 | 247.1 | 320.8 | 467.2 | 800.0 | 31.1 | 5.0 | 7.1 |
| H09 | 6.9 | 11.3 | 17.3 | 20.7 | 45.8 | 76.7 | 144.0 | 184.4 | 211.0 | 930.0 | 11.1 | 2.9 | 4.0 |
| H10 | 16.7 | 28.3 | 46.3 | 55.1 | 85.6 | 104.1 | 164.9 | 205.9 | 284.0 | 520.0 | 6.3 | 1.9 | 2.7 |
| N01 | 13.7 | 24.6 | 43.2 | 55.4 | 97.0 | 112.2 | 157.6 | 217.0 | 265.7 | 960.0 | 8.2 | 1.9 | 3.0 |
| N02 | 2.3 | 3.6 | 12.8 | 18.7 | 49.5 | 68.9 | 166.5 | 227.8 | 265.8 | 1030.0 | 30.4 | 3.6 | 7.9 |
| L01 | 2.0 | 3.2 | 14.5 | 25.7 | 63.7 | 108.0 | 170.5 | 273.4 | 312.0 | 950.0 | 53.5 | 3.4 | 9.2 |
| L02 | 1.7 | 2.8 | 8.5 | 17.7 | 93.4 | 109.3 | 212.3 | 307.1 | 343.5 | 1000.0 | 63.2 | 5.0 | 10.5 |
The unit of local grain sizes: mm; The symbols: , ,
Table A2.
The results of percentile roughness at 14 sites in this study.
| Site | RH10 | RH16 | RH25 | RH30 | RH50 | RH60 | RH75 | RH84 | RH90 | RHmax |
| H01 | 22.5 | 25.2 | 27.5 | 29.3 | 37.9 | 40.9 | 45.5 | 49.6 | 53.6 | 71.2 |
| H02 | 14.5 | 16.6 | 20.4 | 23.5 | 31.0 | 37.9 | 49.6 | 58.4 | 61.8 | 70.3 |
| H03 | 22.0 | 24.4 | 28.6 | 32.4 | 42.0 | 47.3 | 49.9 | 54.7 | 61.5 | 71.7 |
| H04 | 36.1 | 38.6 | 42.7 | 46.0 | 54.0 | 58.9 | 60.9 | 65.0 | 70.6 | 82.1 |
| H05 | 24.0 | 26.0 | 31.0 | 31.9 | 41.1 | 47.7 | 53.7 | 57.3 | 64.8 | 82.8 |
| H06 | 41.1 | 43.5 | 47.3 | 49.2 | 55.5 | 57.7 | 61.2 | 64.5 | 68.9 | 84.4 |
| H07 | 26.4 | 28.5 | 33.4 | 37.7 | 46.1 | 49.0 | 54.6 | 57.8 | 63.7 | 88.6 |
| H08 | 20.2 | 21.8 | 25.6 | 28.8 | 36.0 | 42.8 | 49.0 | 54.2 | 66.3 | 88.6 |
| H09 | 18.9 | 21.7 | 25.7 | 27.4 | 32.9 | 39.6 | 47.6 | 51.3 | 54.8 | 70.2 |
| H10 | 28.4 | 31.3 | 33.5 | 35.4 | 42.0 | 45.1 | 50.4 | 56.9 | 62.1 | 77.8 |
| N01 | 24.9 | 30.2 | 33.0 | 36.2 | 43.5 | 46.2 | 52.5 | 56.6 | 60.5 | 71.0 |
| N02 | 20.4 | 22.7 | 27.5 | 29.0 | 35.2 | 40.7 | 46.7 | 51.0 | 57.7 | 76.9 |
| L01 | 21.8 | 24.6 | 27.2 | 28.2 | 34.3 | 38.0 | 47.4 | 50.6 | 58.8 | 78.5 |
| L02 | 25.5 | 26.6 | 30.4 | 32.5 | 39.8 | 42.3 | 44.8 | 50.5 | 57.0 | 84.6 |
The unit of RH: mm.
References
- Leopold, L.B.; Wolman, M.G.; Miller, J.P. Fluvial processes in geomorphology; Courier Dover Publications: New York, United States of America, 1964.
- Rosgen, D.L. A Classification of Natural Rivers. Catena 1994, 22, 169-199, doi:Doi 10.1016/0341-8162(94)90001-9.
- Tullos, D.; Wang, H.W. Morphological responses and sediment processes following a typhoon-induced dam failure, Dahan River, Taiwan. Earth Surface Processes and Landforms 2014, 39, 245-258, doi:10.1002/esp.3446.
- Hajdukiewicz, H.; Wyzga, B.; Mikus, P.; Zawiejska, J.; Radecki-Pawlik, A. Impact of a large flood on mountain river habitats, channel morphology, and valley infrastructure. Geomorphology 2016, 272, 55-67, doi:10.1016/j.geomorph.2015.09.003.
- Duan, J.G.; Wang, S.S.Y.; Jia, Y.F. The applications of the enhanced CCHE2D model to study the alluvial channel migration processes. Journal of Hydraulic Research 2001, 39, 469-480, doi:Doi 10.1080/00221686.2001.9628272.
- Bunte, K.; R.Abt, S. Sampling surface and subsurface particle-size distributions in wadable gravel-and cobble-bed streams for analyses in sediment transport, hydraulics, and streambed monitoring; US Department of Agriculture, Forest Service, Rocky Mountain Research Station: 2001.
- Graham, D.J.; Rice, S.P.; Reid, I. A transferable method for the automated grain sizing of river gravels. Water Resources Research 2005, 41, doi:Artn W0702010.1029/2004wr003868.
- Wu, F.C.; Wang, C.K.; Lo, H.P. FKgrain: A topography-based software tool for grain segmentation and sizing using factorial kriging. Earth Science Informatics 2021, 14, 2411-2421, doi:10.1007/s12145-021-00660-z.
- Chen., C. H.; Shao., Y. C.; Wang., C. K.; Wu., F. C. Analysis of Bed Material Grain Size Distribution Using Digital Photosieving. Journal of Taiwan Agricultural Engineering 2008, 54(4), 16-32. doi:10.29974/JTAE.200812.0002 (in Chinese).
- Detert, M.; Weitbrecht, V. Automatic object detection to analyze the geometry of gravel grains–a free stand-alone tool. In Proceedings of the River flow, 2012; pp. 595-600.
- Woodget, A.; Fyffe, C.; Carbonneau, P. From manned to unmanned aircraft: Adapting airborne particle size mapping methodologies to the characteristics of sUAS and SfM. Earth Surface Processes and Landforms 2018, 43, 857-870, doi: 10.1002/esp.4285.
- Wong, T. Estimation of grain sizes in a river through UAV-based SfM photogrammetry. Degree Master of Science, The Ohio State University, Columbus, Ohio, 2022.
- Graham, D.J.; Rollet, A.J.; Piegay, H.; Rice, S.P. Maximizing the accuracy of image-based surface sediment sampling techniques. Water Resources Research 2010, 46, doi:Artn W0250810.1029/2008wr006940.
- Brasington, J.; Vericat, D.; Rychkov, I. Modeling river bed morphology, roughness, and surface sedimentology using high resolution terrestrial laser scanning. Water Resources Research 2012, 48, doi:Artn W1151910.1029/2012wr012223.
- Heritage, G.L.; Milan, D.J. Terrestrial laser scanning of grain roughness in a gravel-bed river. Geomorphology 2009, 113, 4-11.
- Pearson, E.; Smith, M.; Klaar, M.; Brown, L. Can high resolution 3D topographic surveys provide reliable grain size estimates in gravel bed rivers? Geomorphology 2017, 293, 143-155, doi:10.1016/j.geomorph.2017.05.015.
- Vázquez-Tarrío, D.; Borgniet, L.; Liébault, F.; Recking, A. Using UAS optical imagery and SfM photogrammetry to characterize the surface grain size of gravel bars in a braided river (Vénéon River, French Alps). Geomorphology 2017, 285, 94-105, doi:10.1016/j.geomorph.2017.01.039.
- Westoby, M.J.; Brasington, J.; Glasser, N.F.; Hambrey, M.J.; Reynolds, J.M. Structure-from-Motion’ photogrammetry: A low-cost, effective tool for geoscience applications. Geomorphology 2012, 179, 300-314, doi:10.1016/j.geomorph.2012.08.021.
- Woodget, A.S.; Austrums, R. Subaerial gravel size measurement using topographic data derived from a UAV-SfM approach. Earth Surface Processes and Landforms 2017, 42, 1434-1443, doi:10.1002/esp.4139.
- Hodge, R.; Brasington, J.; Richards, K. Analysing laser-scanned digital terrain models of gravel bed surfaces: linking morphology to sediment transport processes and hydraulics. Sedimentology 2009, 56, 2024-2043, doi:10.1111/j.1365-3091.2009.01068.x.
- National Geological Data Warehouse (Geological Survey and Mining Management Agency in Taiwan). Available online: https://geomap.gsmma.gov.tw/gwh/gsb97-1/sys8a/t3/index1.cfm (accessed on 03 07 2025).
- Chen, S.C.; Wu, C.H.; Chao, Y.C.; Shih, P.Y. Long-term impact of extra sediment on notches and incised meanders in the Hoshe River, Taiwan. J Mt Sci-Engl 2013, 10, 716-723, doi:10.1007/s11629-013-2620-x.
- Chang, K. J., Tseng, C. W., Tseng, C. M., Liao, T. C., & Yang, C. J. Application of unmanned aerial vehicle (UAV)-acquired topography for quantifying typhoon-driven landslide volume and its potential topographic impact on rivers in mountainous catchments.Applied Sciences 2020, 10(17), 6102 , doi:10.3390/app10176102.
- Eltner, A., Kaiser, A., Castillo, C., Rock, G., Neugirg, F., & Abellán, A. Image-based surface reconstruction in geomorphometry–merits, limits and developments. Earth Surface Dynamics 2016, 4(2), 359-389, doi:10.5194/esurf-4-359-2016.
- Wolman, M.G. A method of sampling coarse river-bed material. EOS, Transactions American Geophysical Union 1954, 35, 951-956, doi:10.1029/TR035i006p00951.
- Dahal, S., Imaizumi, F., & Takayama, S. (2025). Spatio-temporal distribution of boulders along a debris-flow torrent assessed by UAV photogrammetry. Geomorphology 2025, 480, 109757, doi:10.1016/j.geomorph.2025.109757.
- 27 Bathurst, J. C. Flow resistance estimation in mountain rivers. Journal of Hydraulic Engineering, ASCE 1985, 111(4), 625–643, doi.org:10.1061/(ASCE)0733-9429(1985)111:4(625).
- 28 Aberle, J. and Smart, G.M. The influence of roughness structure on flow resistance on steep slopes. Journal of Hydraulic Research 2003, Vol. 41(3), 259-269, doi.org:10.1080/00221680309499971.
- Lamb, M. P., Brun, F., & Fuller, B. M. Hydrodynamics of steep streams with planar coarse-grained beds: Turbulence, flow resistance, and implications for sediment transport. Water Resources Research 2017, 53(3), 2240-2263, doi:10.1002/2016WR019579.
- CloudCompare (version 2.14) [GPL software]. Available online: http://www.cloudcompare.org/ (accessed on 03 07 2025).
- Schneider, J.M.; Rickenmann, D.; Turowski, J.M.; Kirchner, J.W. Self-adjustment of stream bed roughness and flow velocity in a steep mountain channel. Water Resources Research 2015, 51, 7838-7859, doi:10.1002/2015wr016934.
Figure 1.
Definition of particle axes (a-axis: longest dimension; b-axis: intermediate dimension; c-axis: shortest dimension).
Figure 1.
Definition of particle axes (a-axis: longest dimension; b-axis: intermediate dimension; c-axis: shortest dimension).
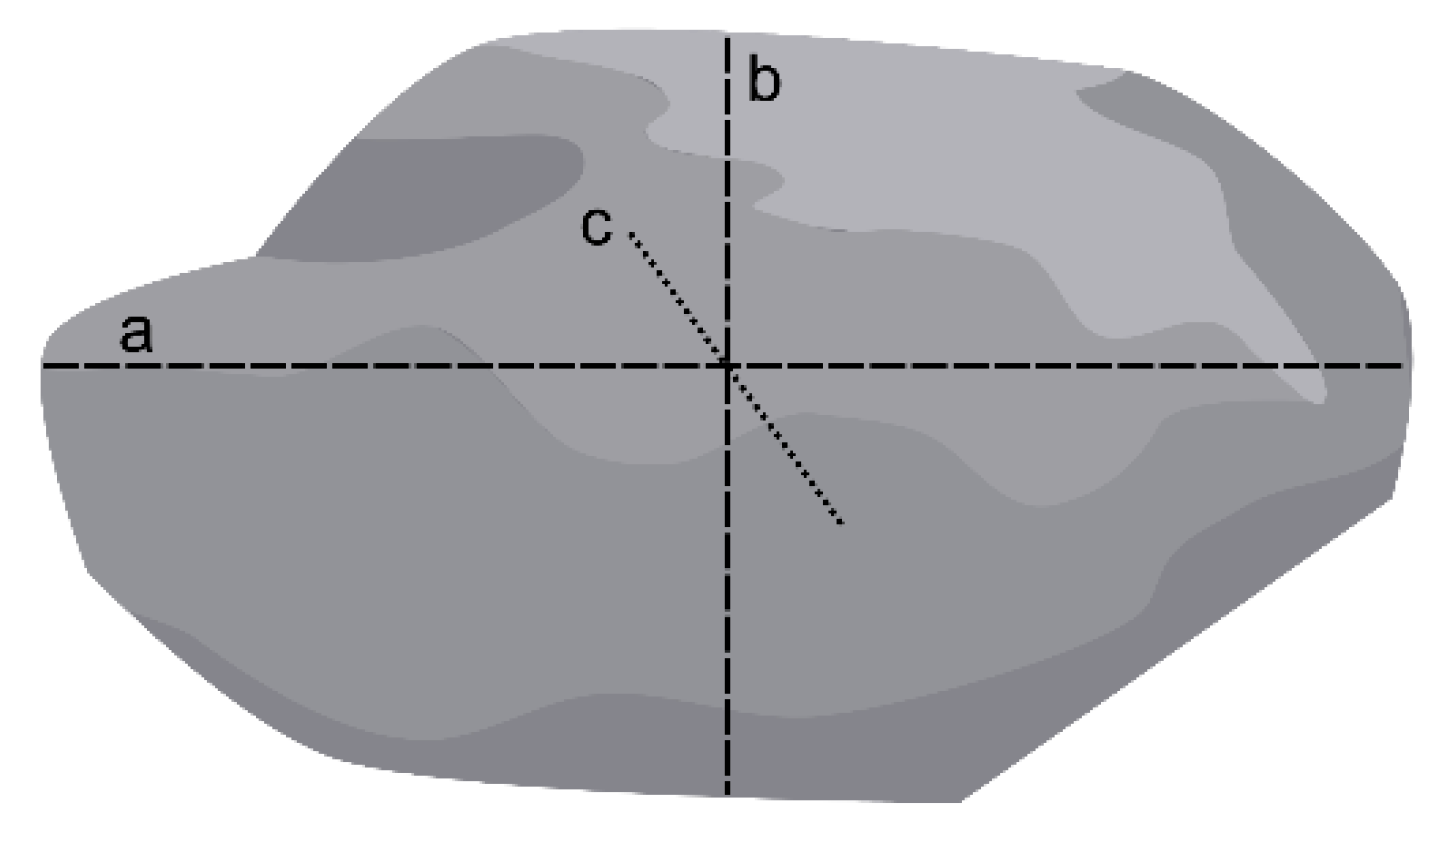
Figure 2.
Figure 2. (a) Locations and boundaries of the Heshe River and Laishe River watershed. (b) Sites of grain size sampling (H01-H08) within Reach R1 and (H09 and H10) within Reach R2 in the Heshe River. (c) Sites of grain size sampling (N01 and N02) within Reach R3 and (L01 and L02) within Reach R4 in the Laishe River.
Figure 2.
Figure 2. (a) Locations and boundaries of the Heshe River and Laishe River watershed. (b) Sites of grain size sampling (H01-H08) within Reach R1 and (H09 and H10) within Reach R2 in the Heshe River. (c) Sites of grain size sampling (N01 and N02) within Reach R3 and (L01 and L02) within Reach R4 in the Laishe River.
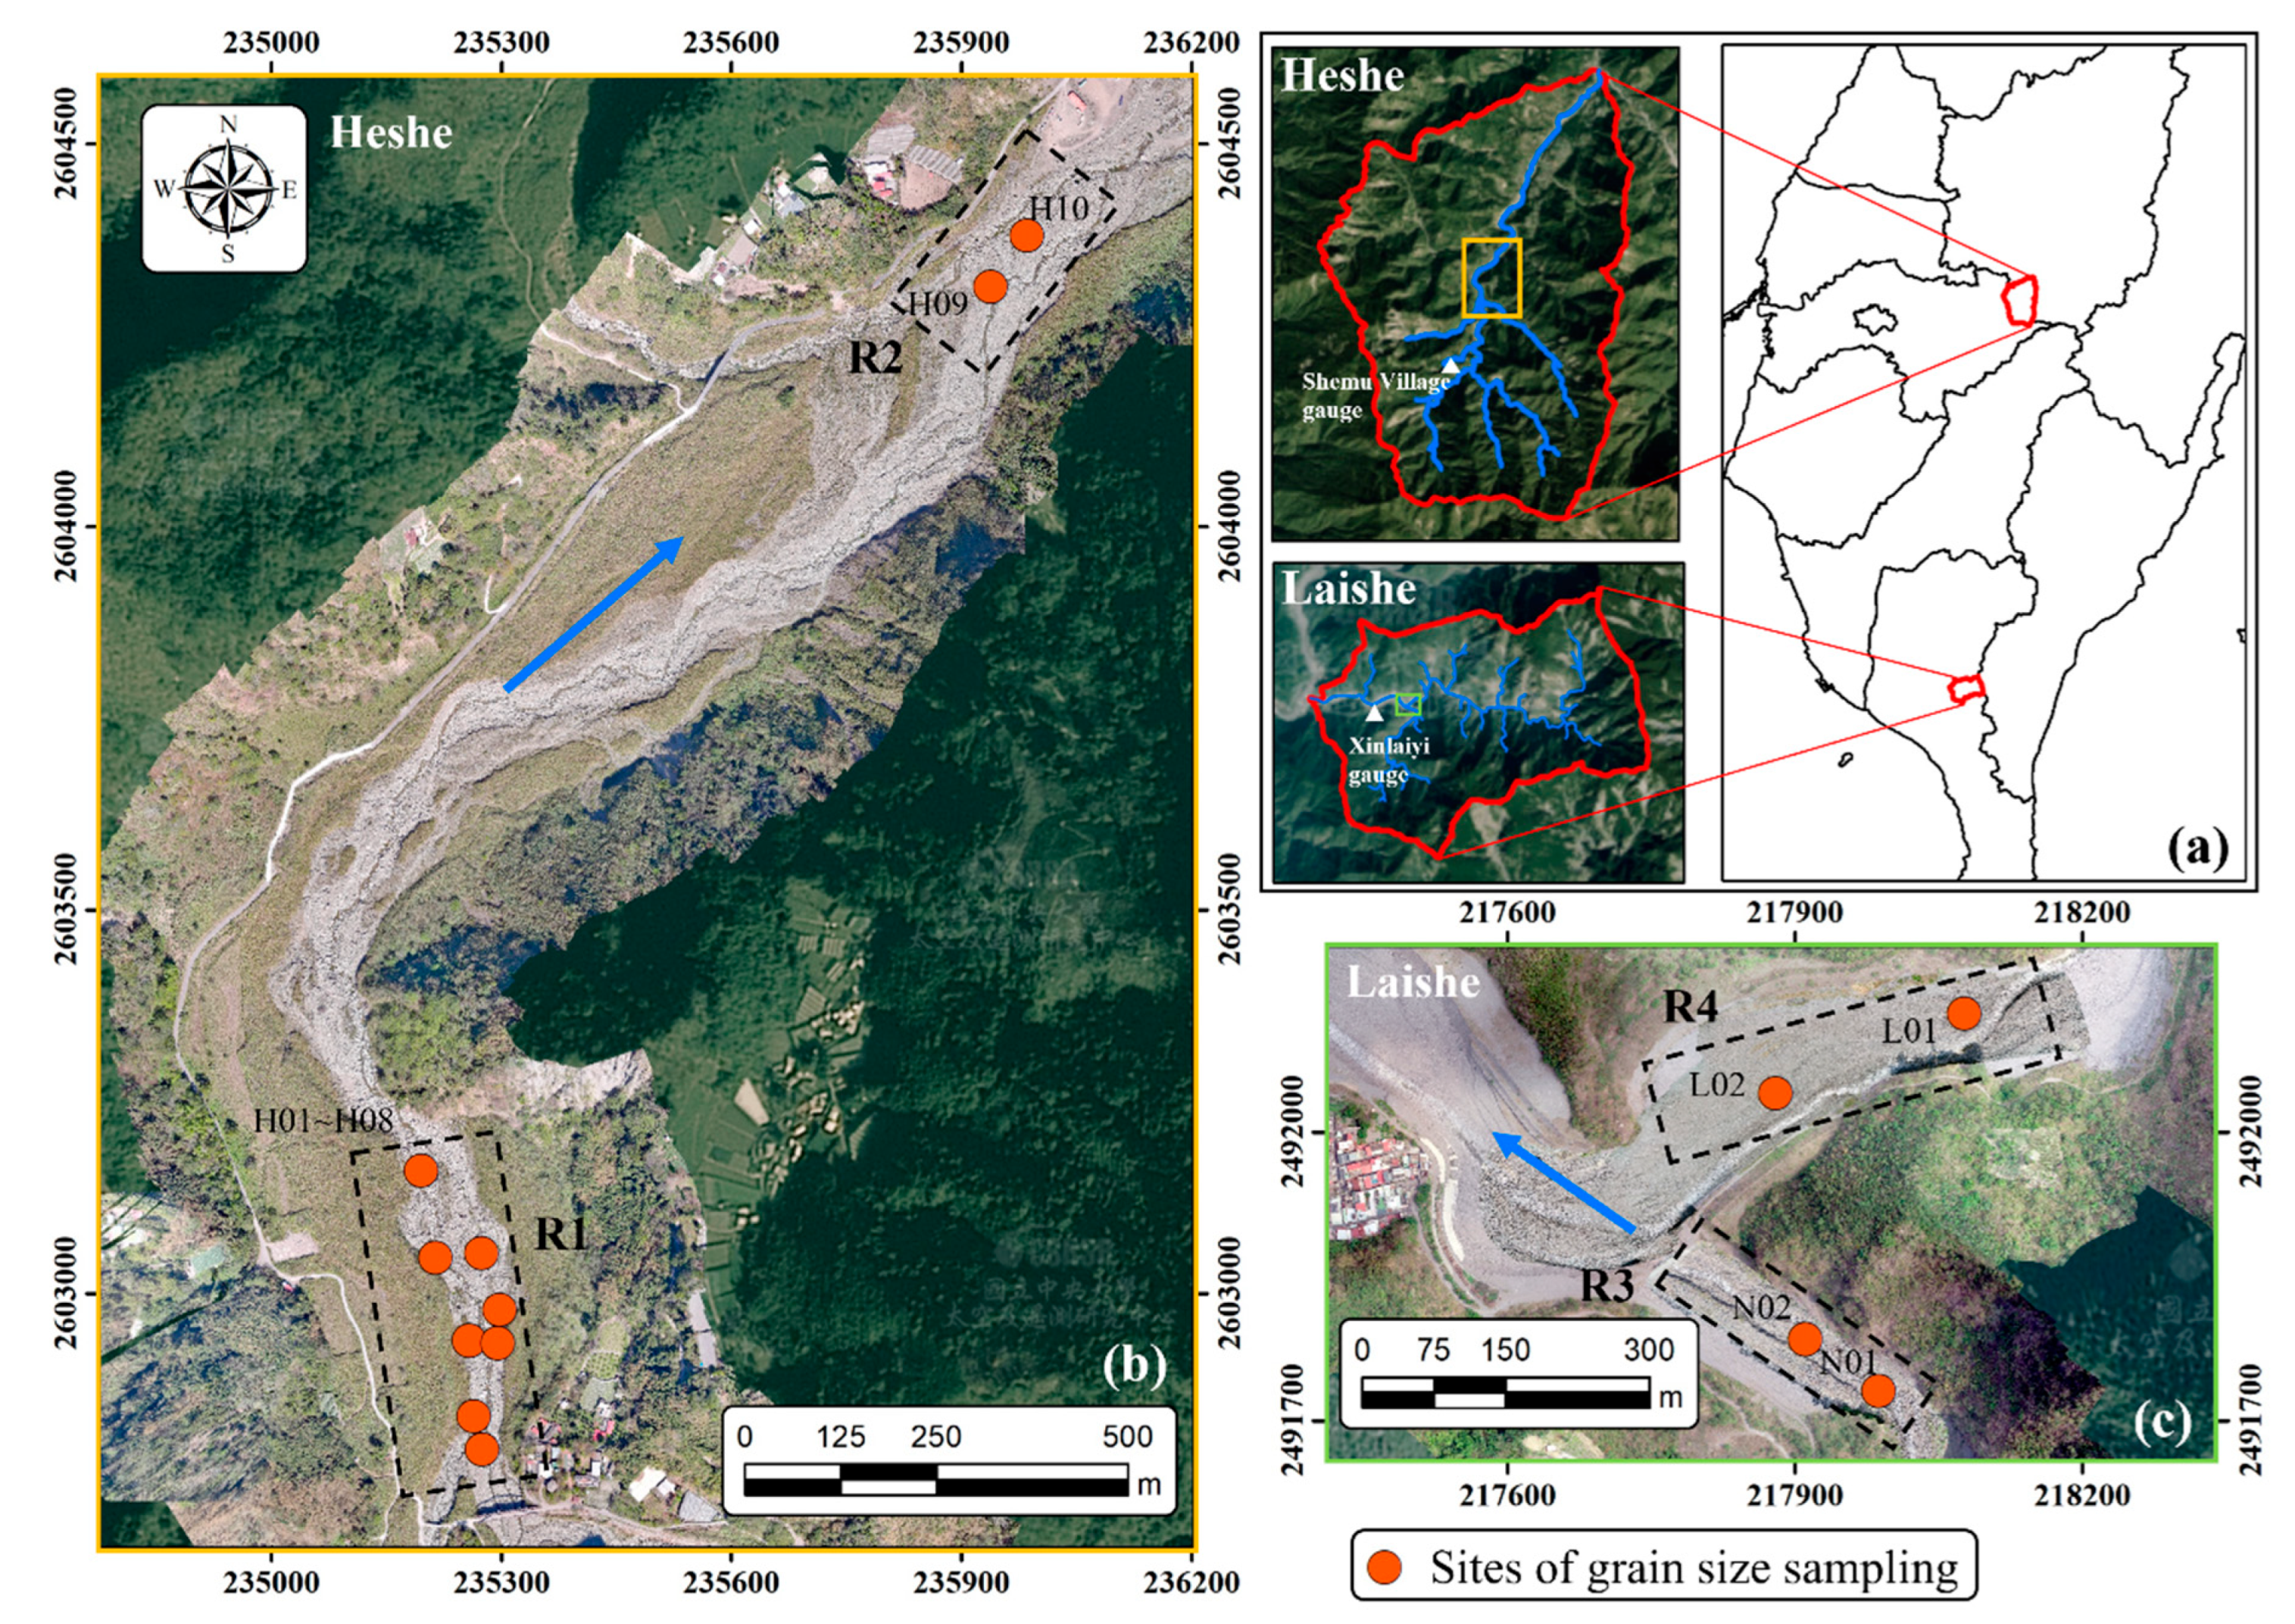
Figure 3.
The schematic diagram for evaluating the roughness height.
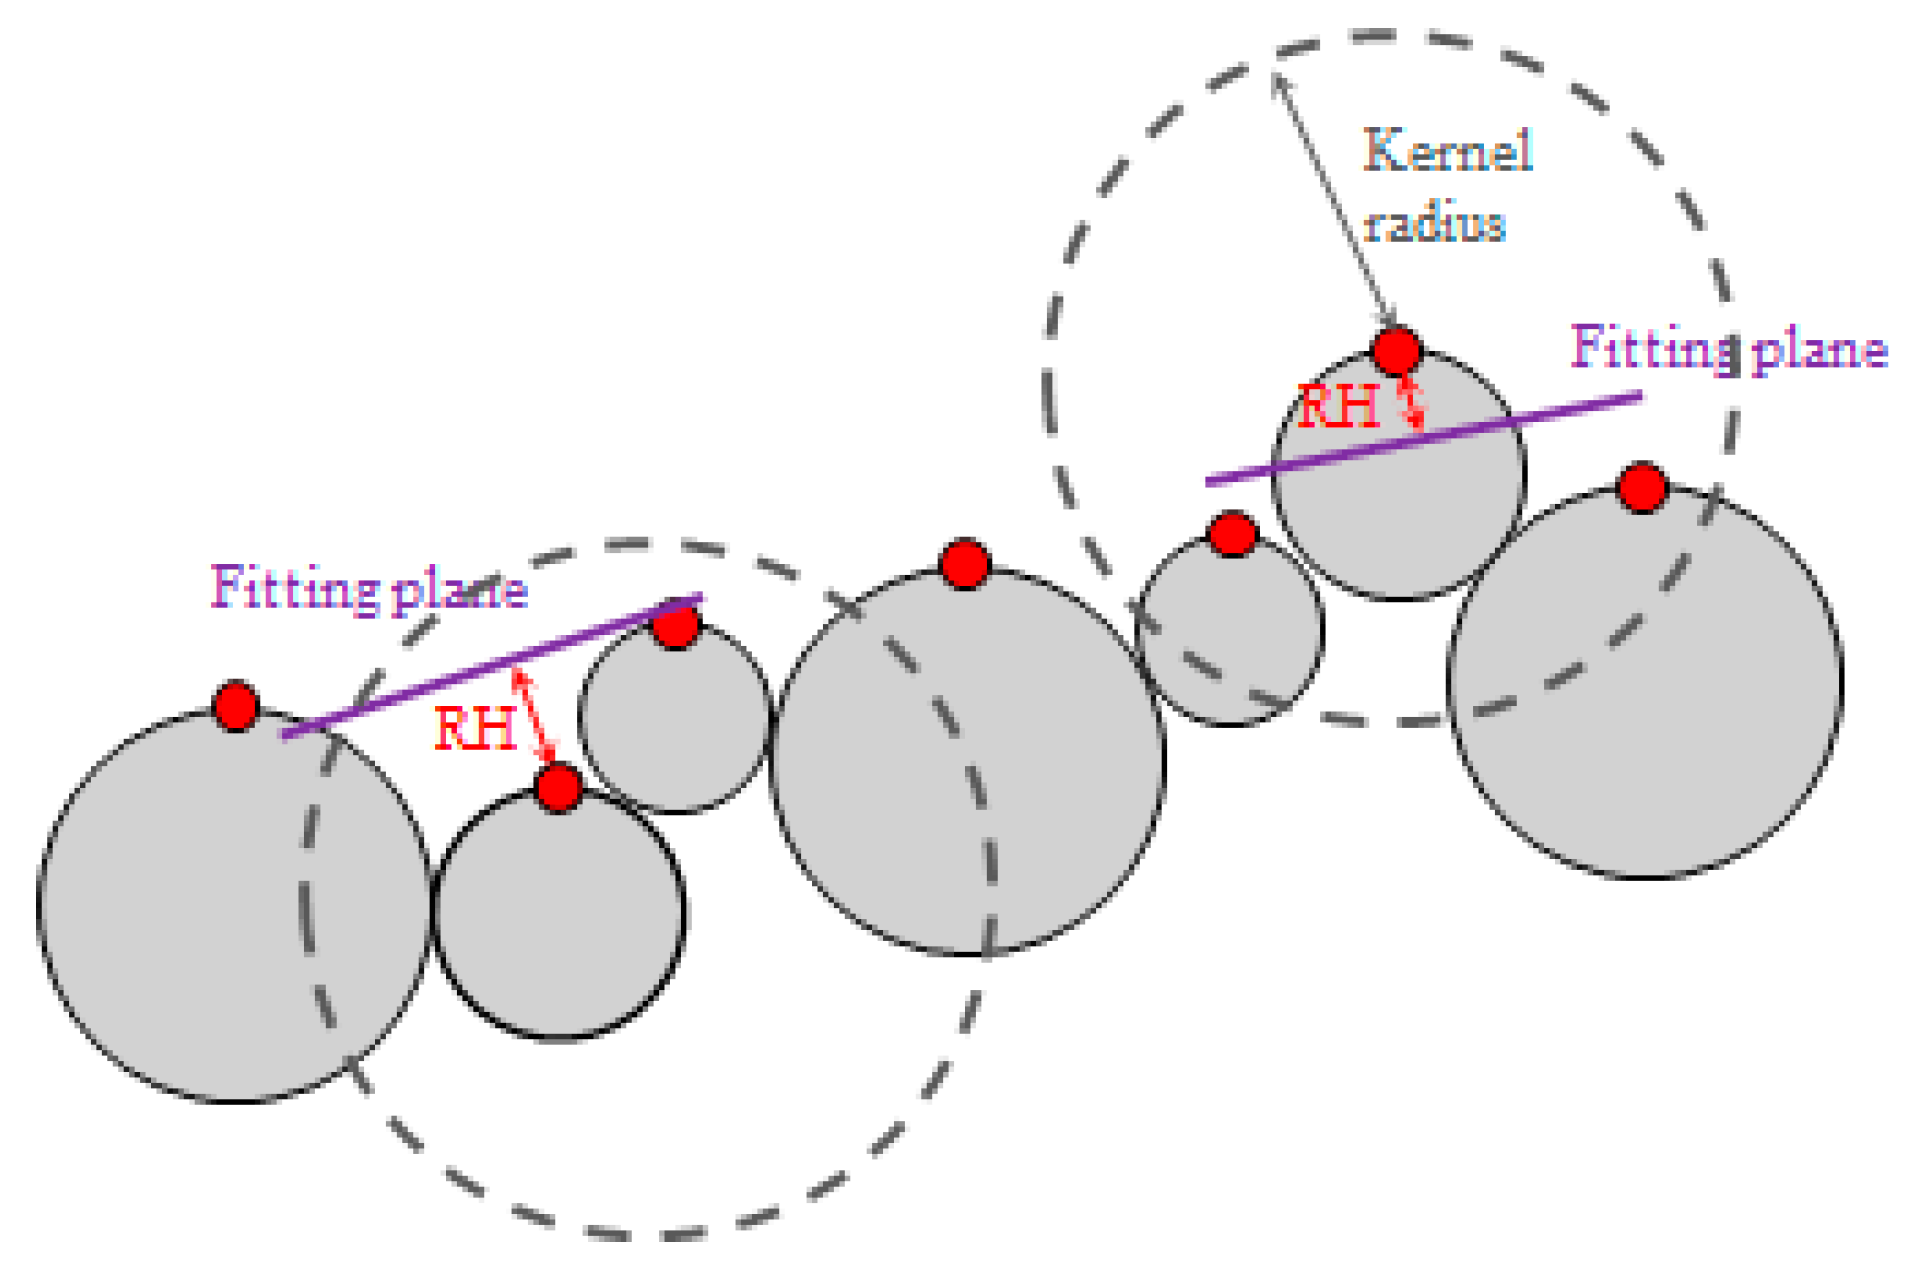
Figure 4.
Three roughness distributions by three kernel radii and their comparison with grain size distribution by manual sampling.
Figure 4.
Three roughness distributions by three kernel radii and their comparison with grain size distribution by manual sampling.
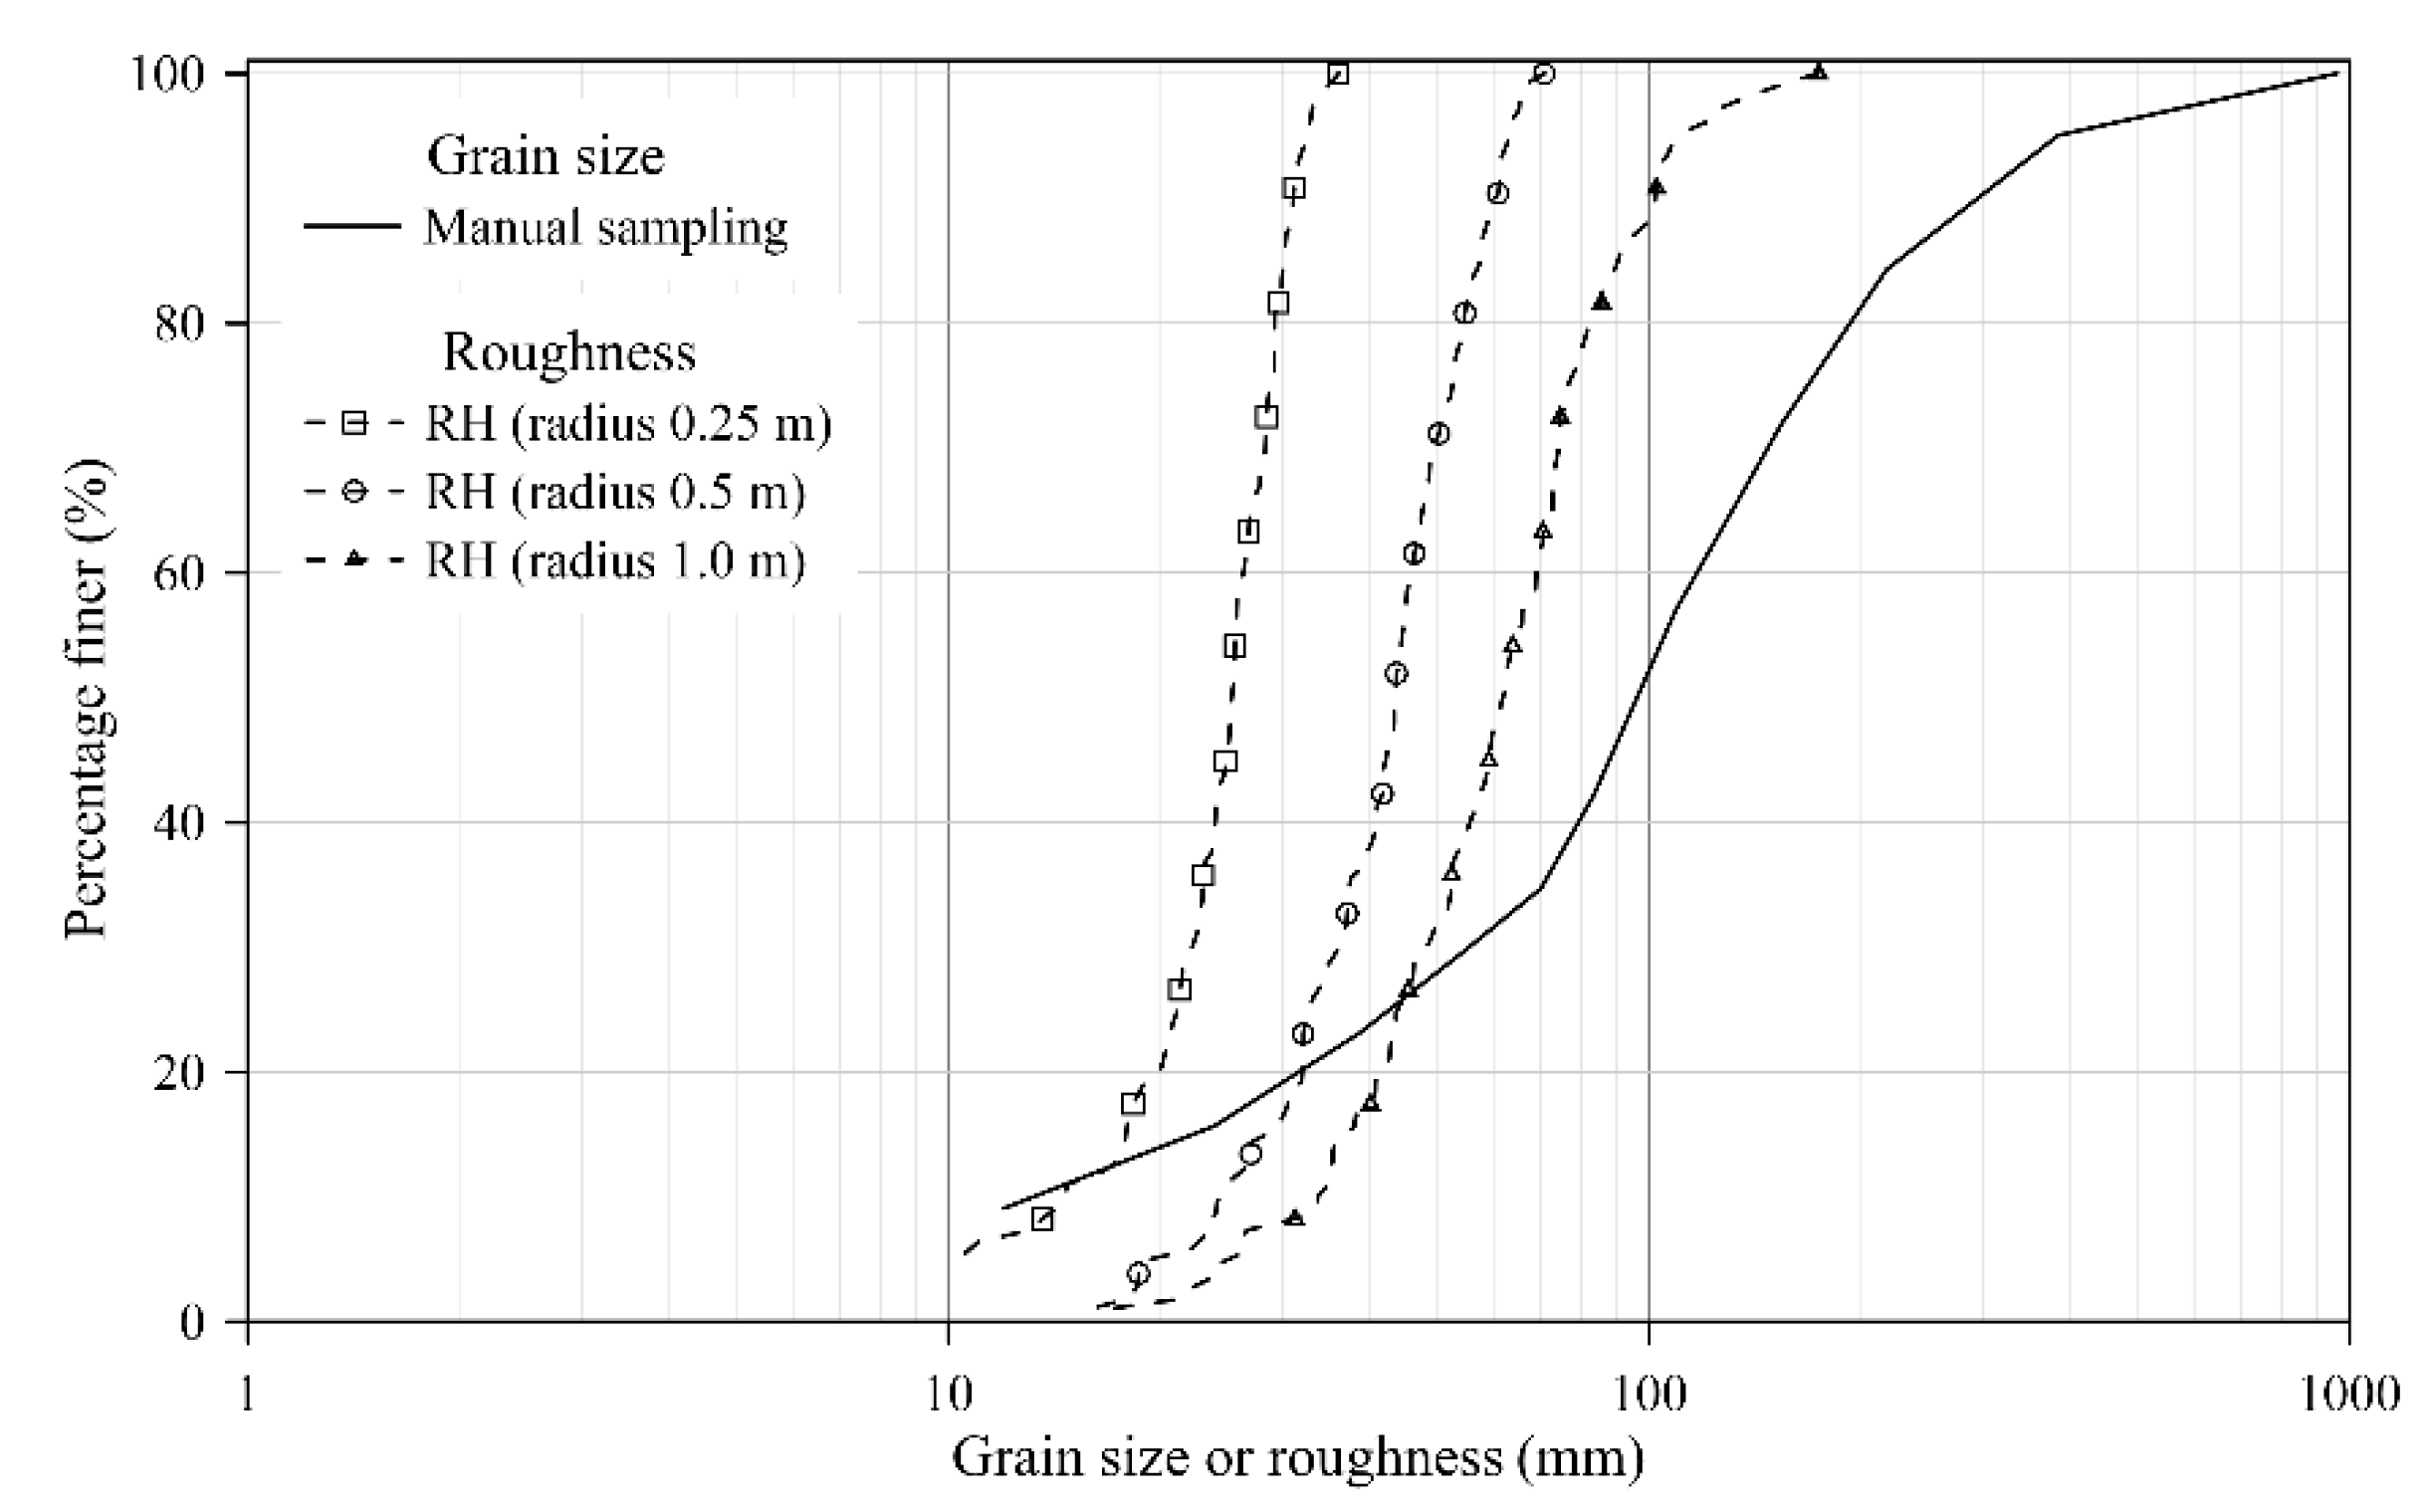
Figure 5.
The research flow chart for present study.
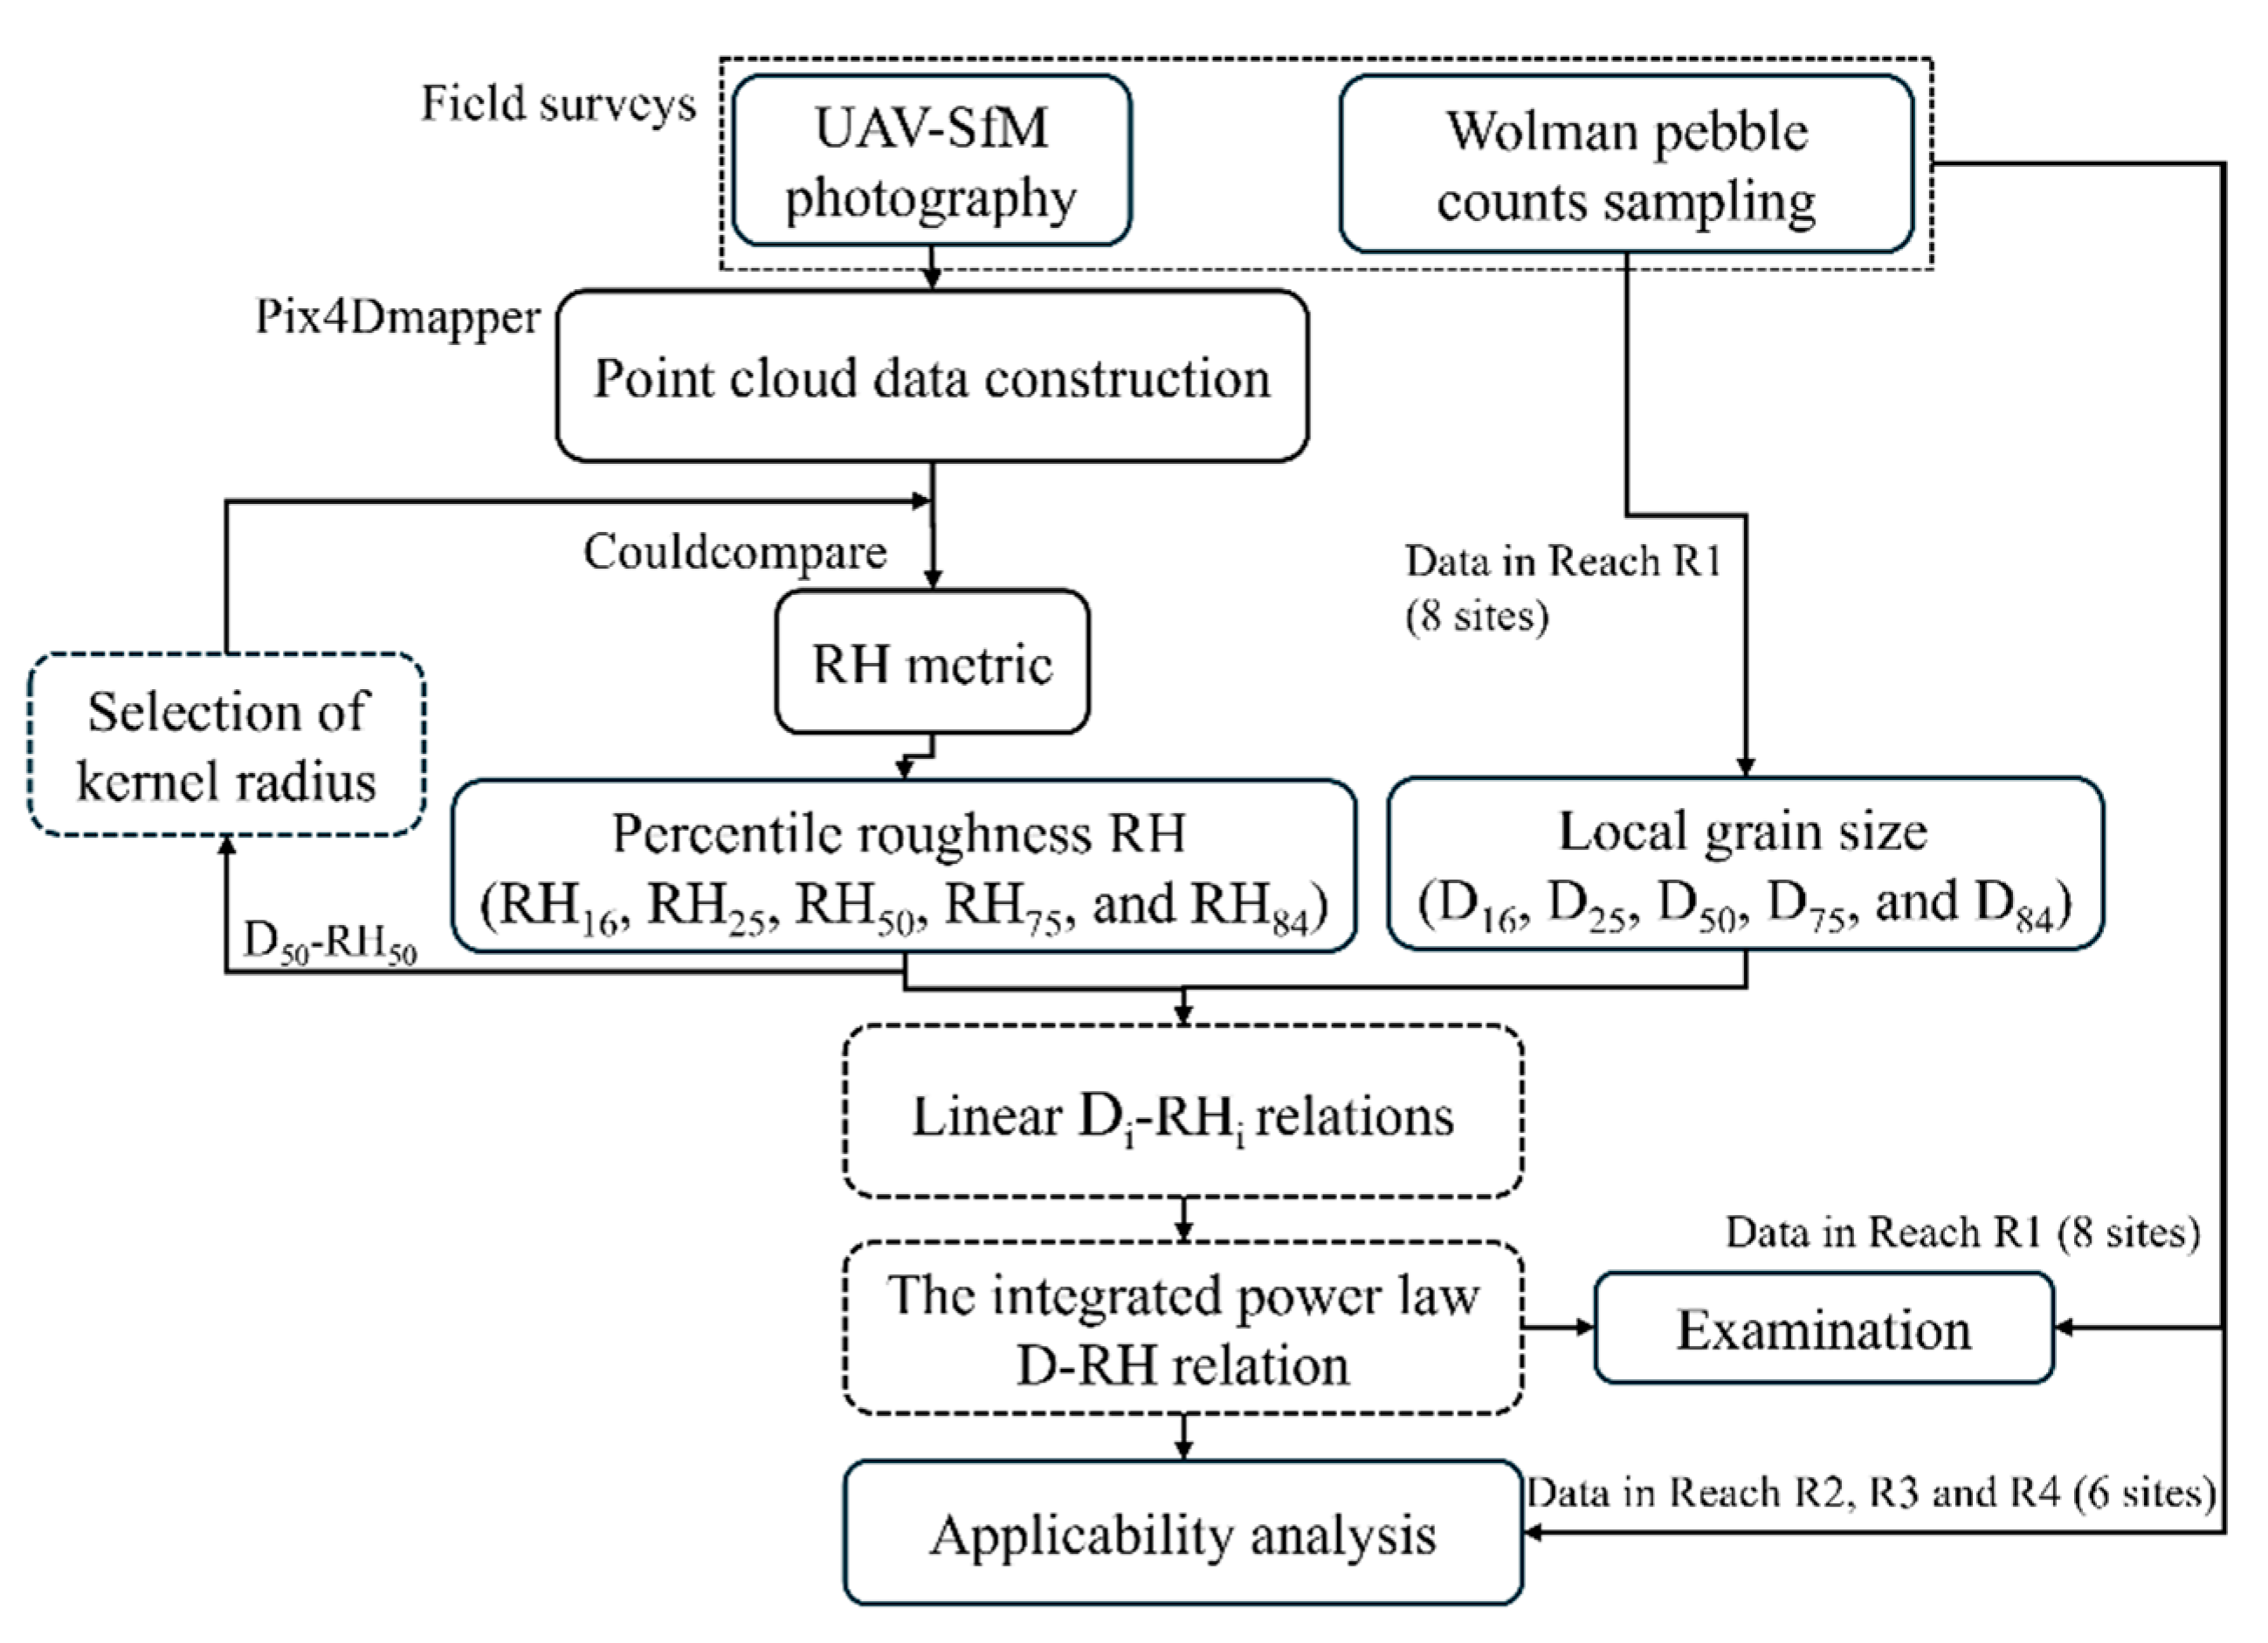
Figure 6.
The variation of R2 in Di-RHi under different dimensionless grid sizes.
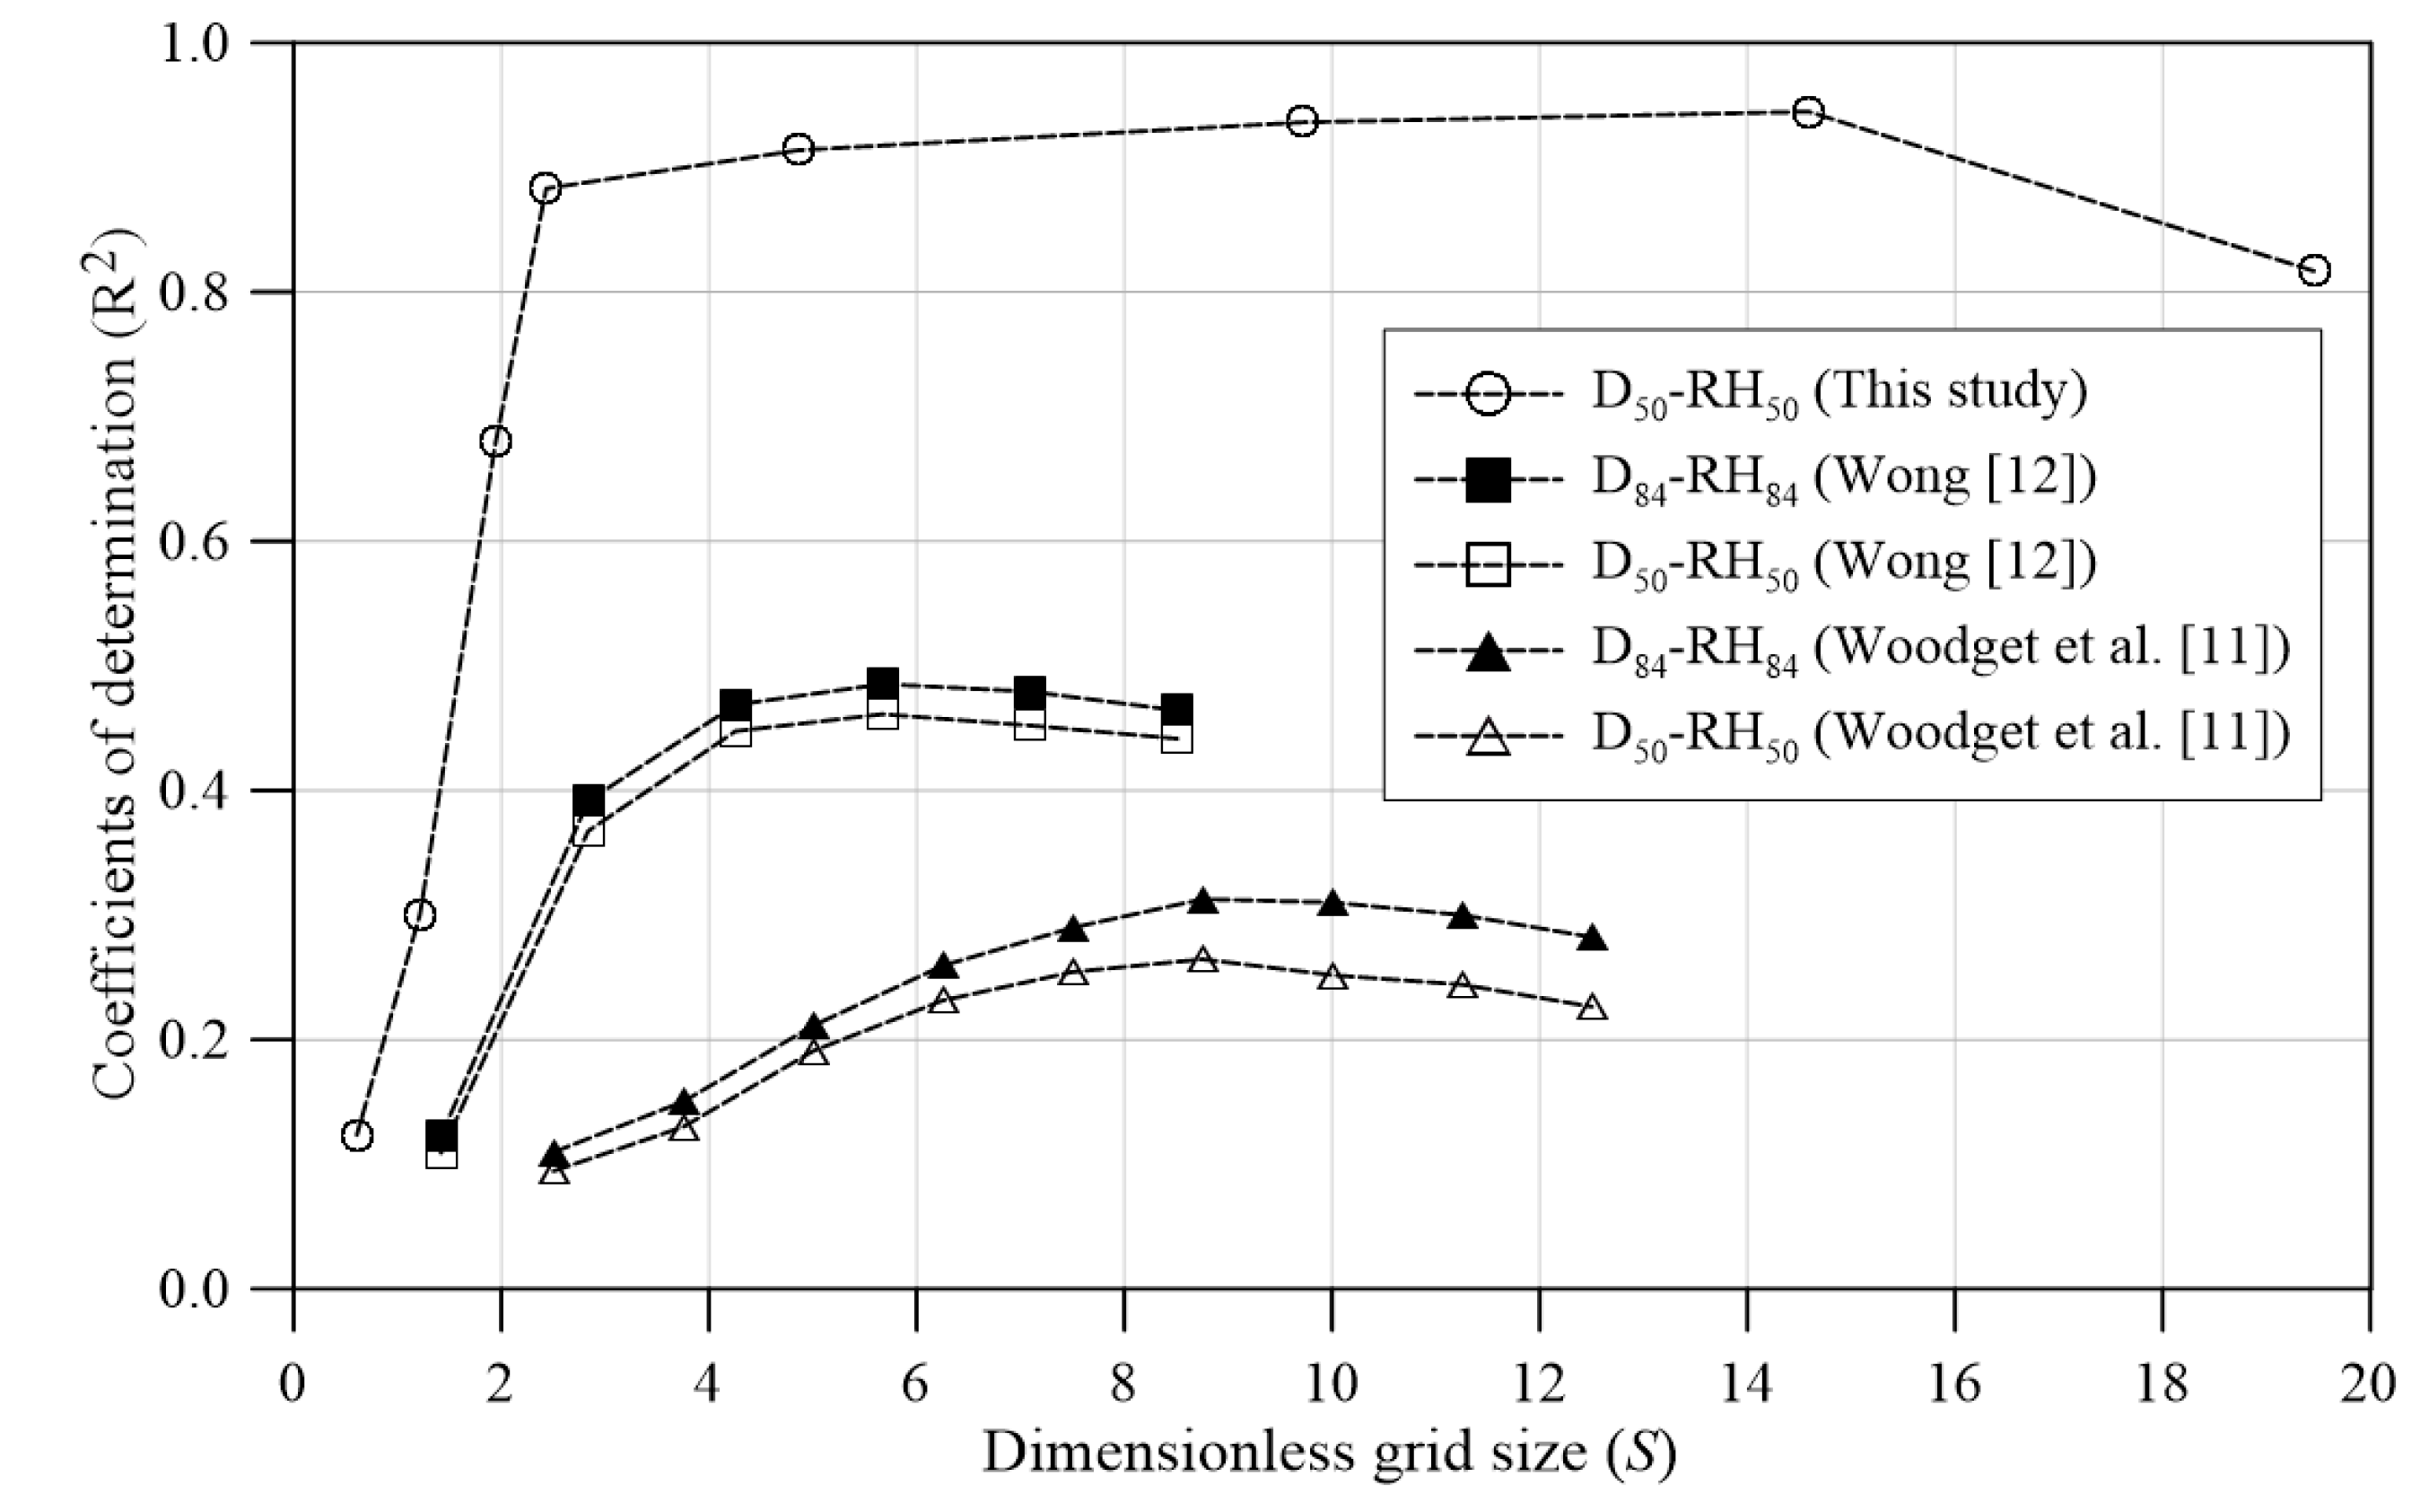
Figure 7.
The relations of Di and RHi and their linear fitting lines. (a) D16 vs. RH16; (b) D25 vs. RH25; (c) D50 vs. RH50; (d) D75 vs. RH75; (e) D84 vs. RH84.
Figure 7.
The relations of Di and RHi and their linear fitting lines. (a) D16 vs. RH16; (b) D25 vs. RH25; (c) D50 vs. RH50; (d) D75 vs. RH75; (e) D84 vs. RH84.
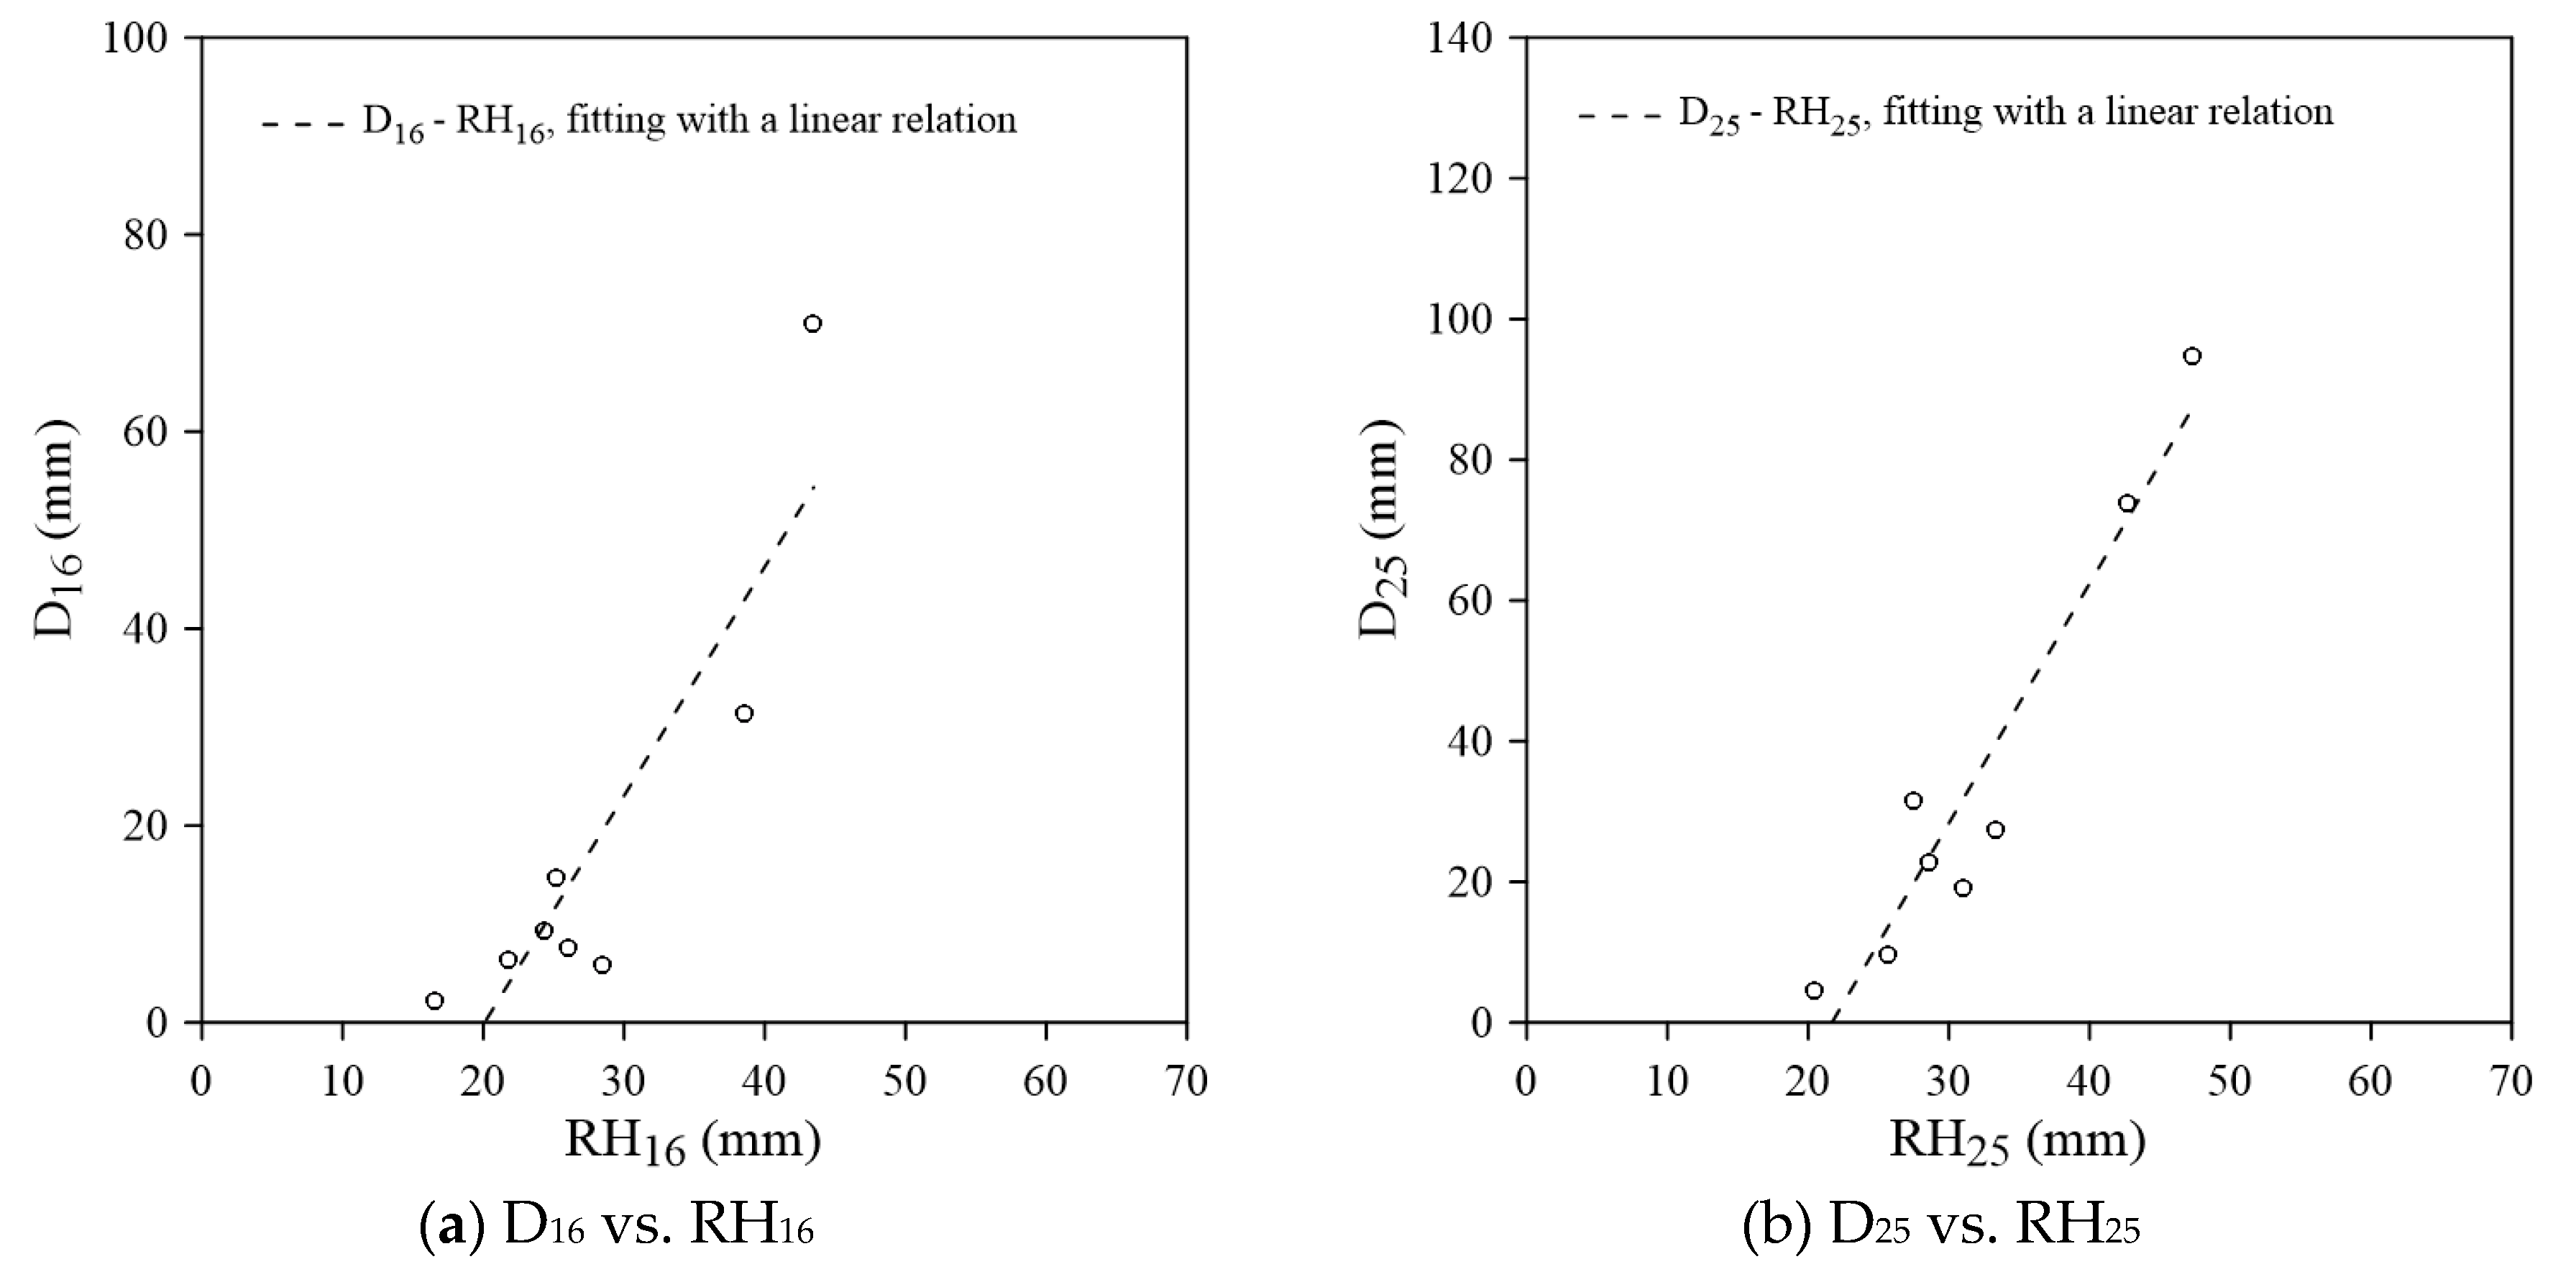
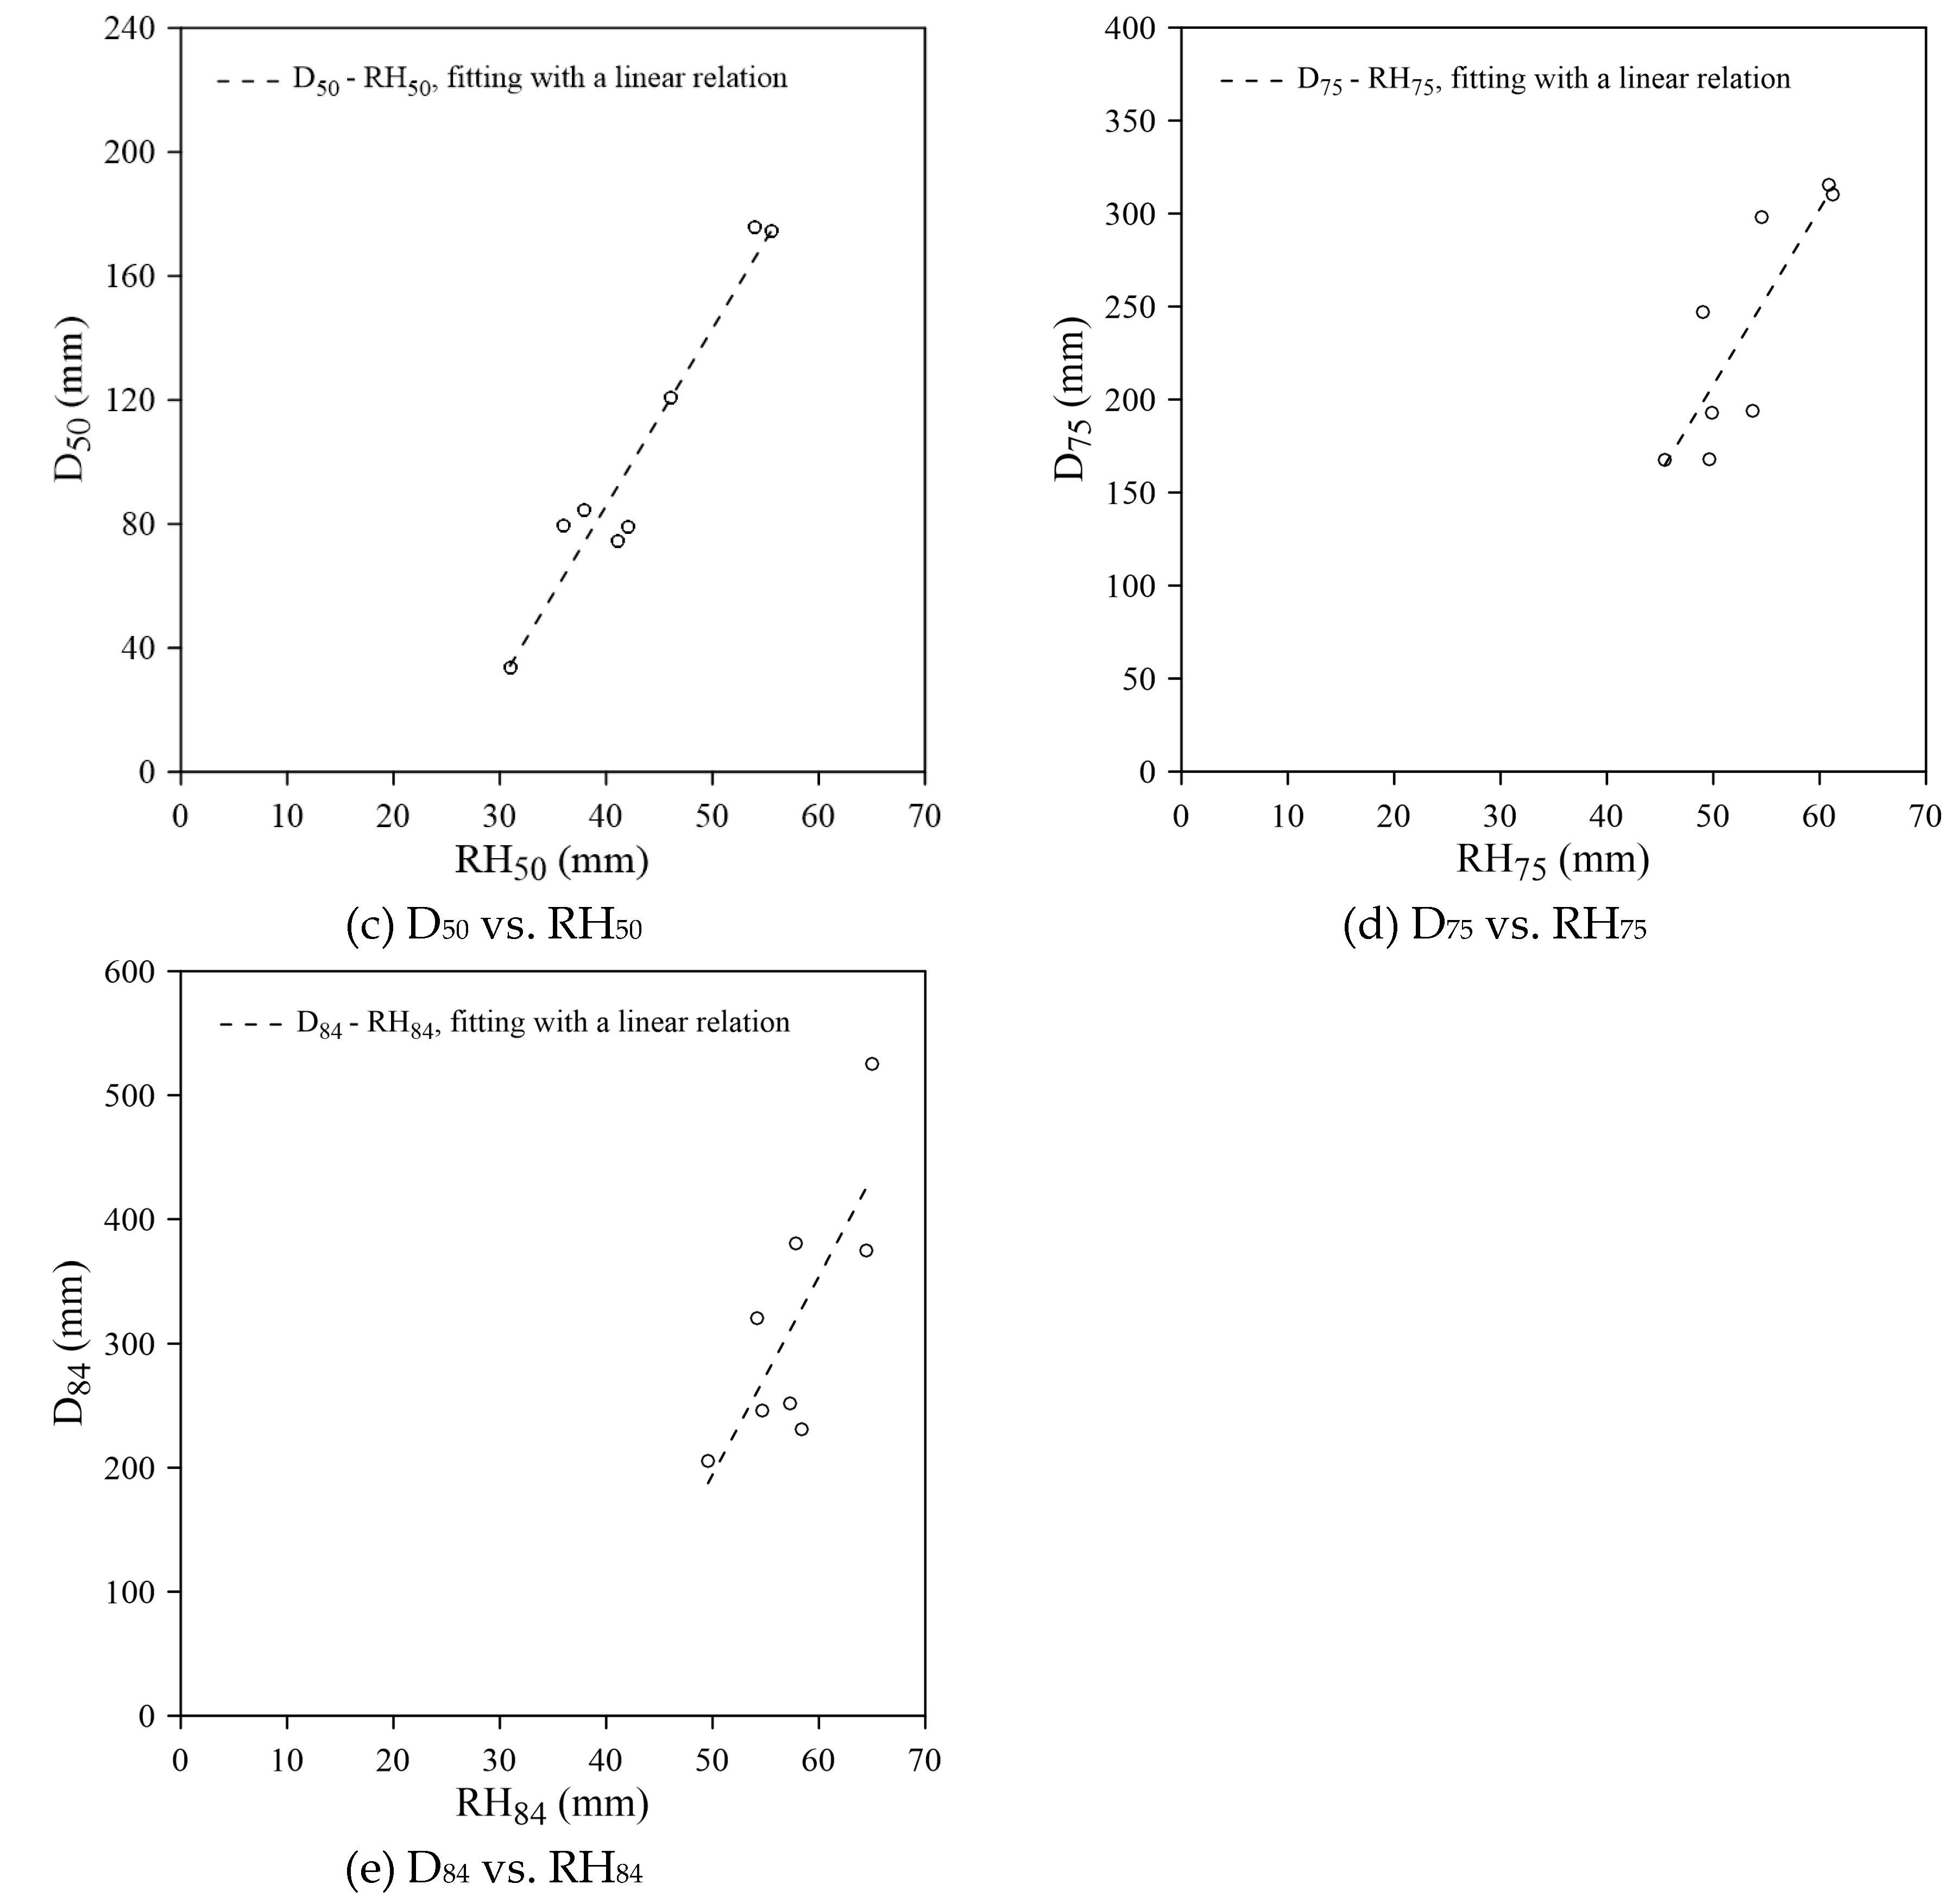
Figure 8.
The regression slopes (), and intercepts () of different Di-RHi relations for Reach R1.
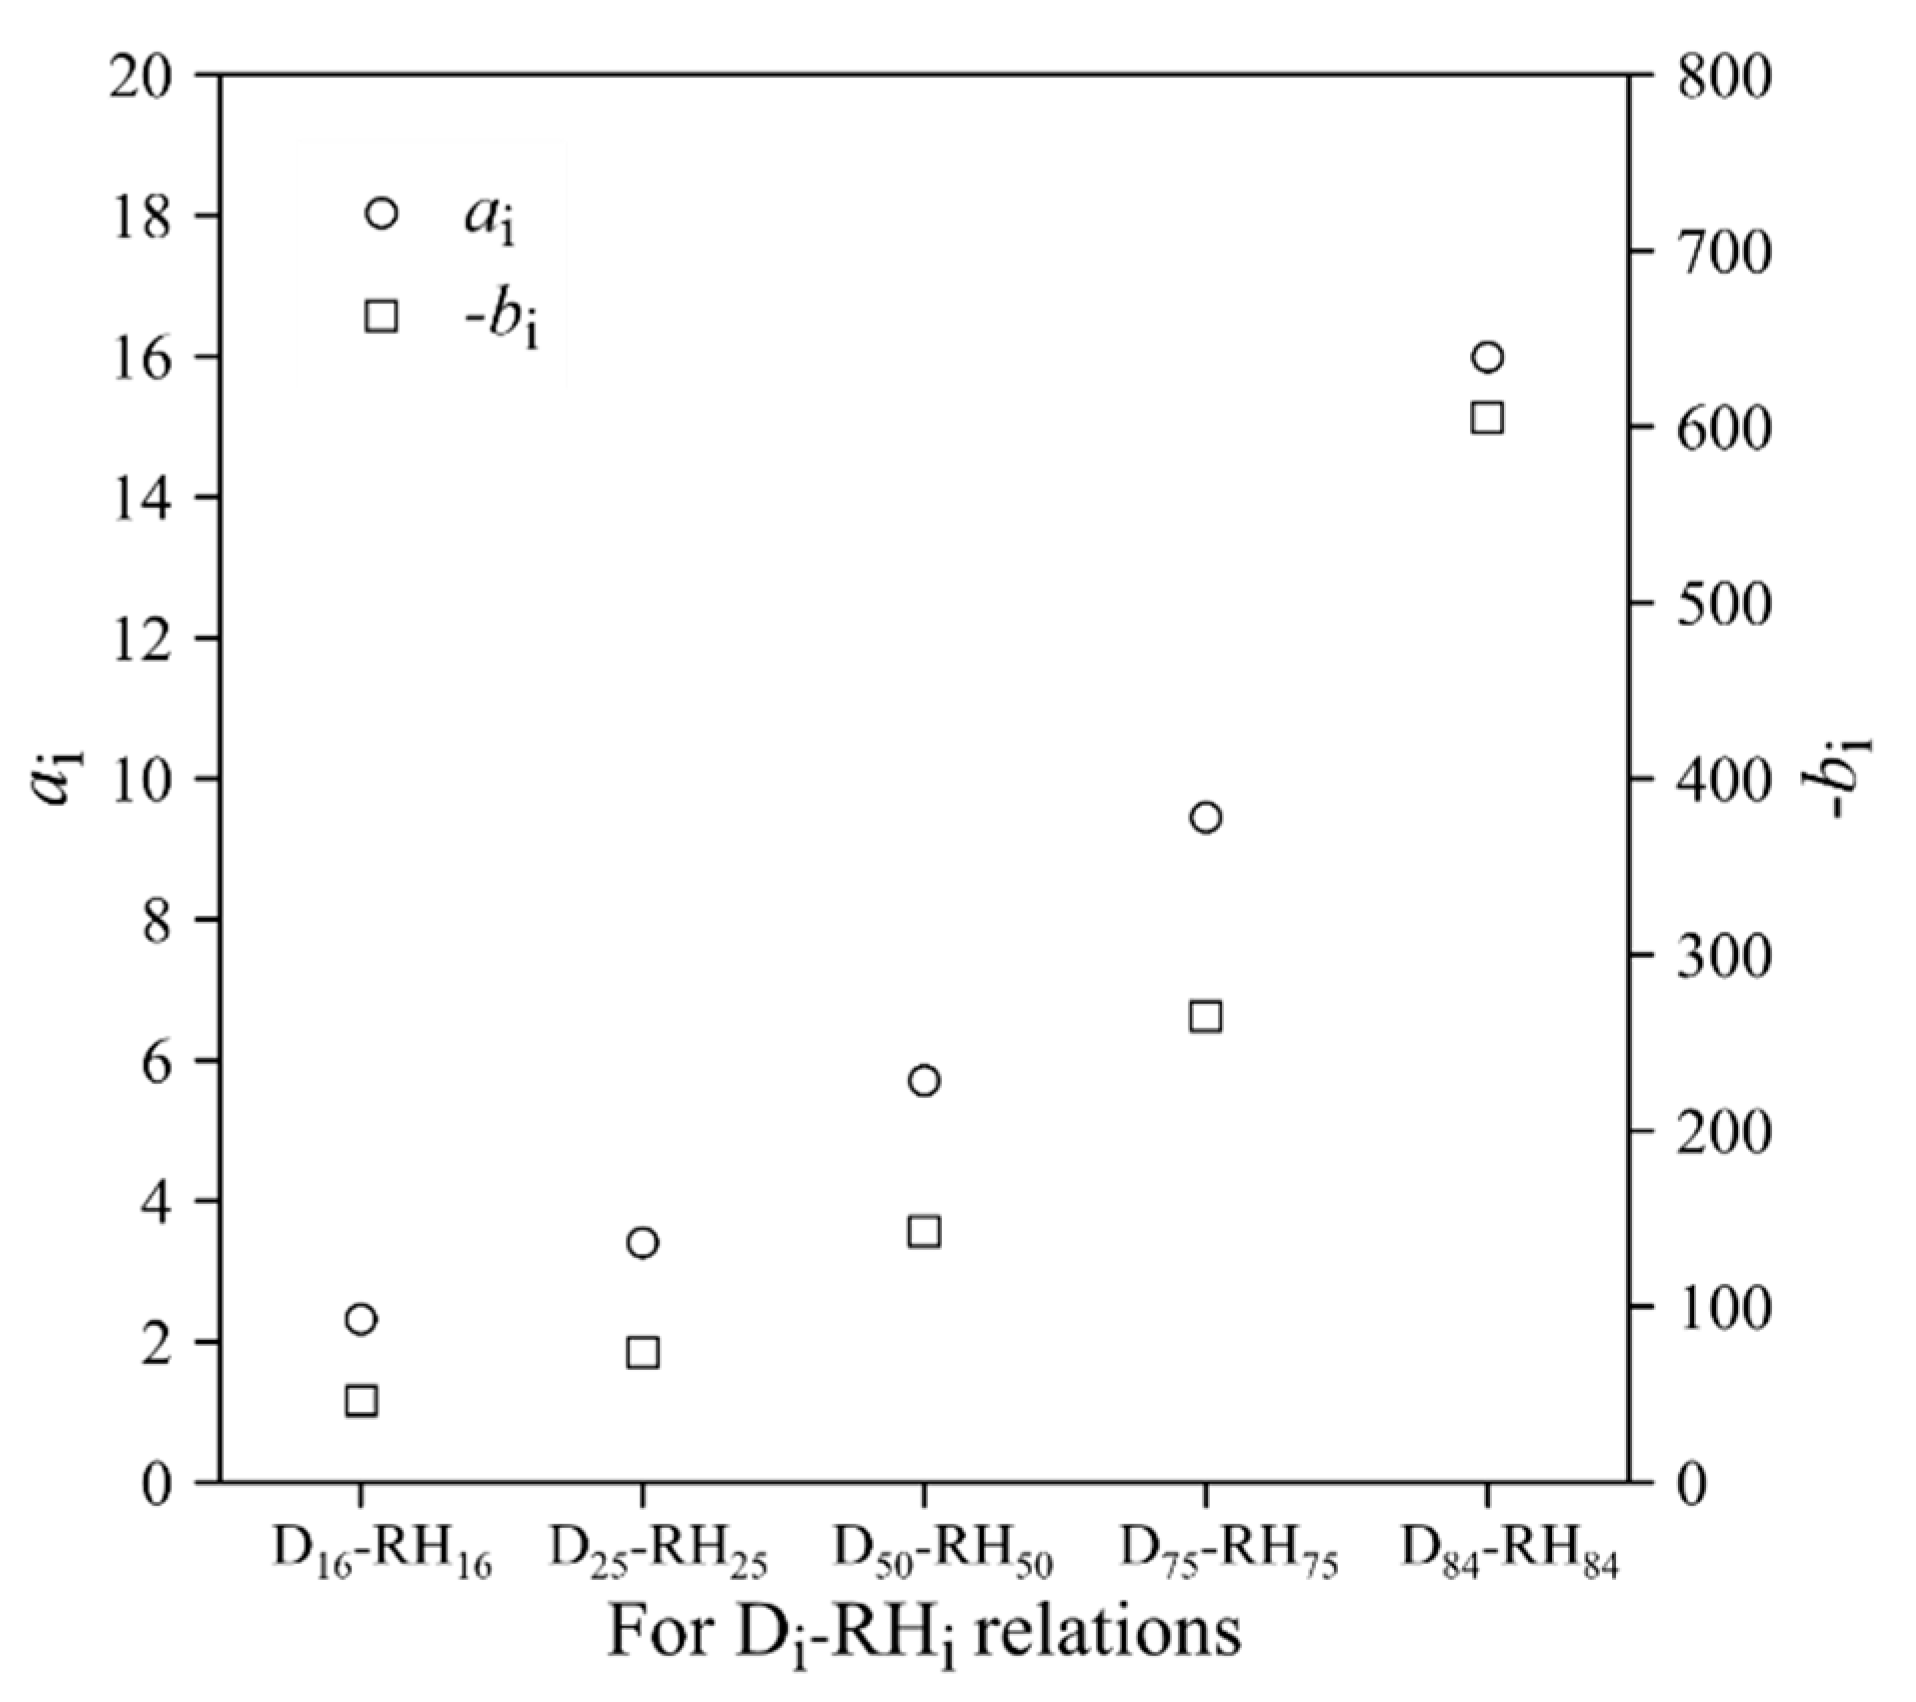
Figure 9.
The log-log plot of grain size-roughness relations in Reach R1.
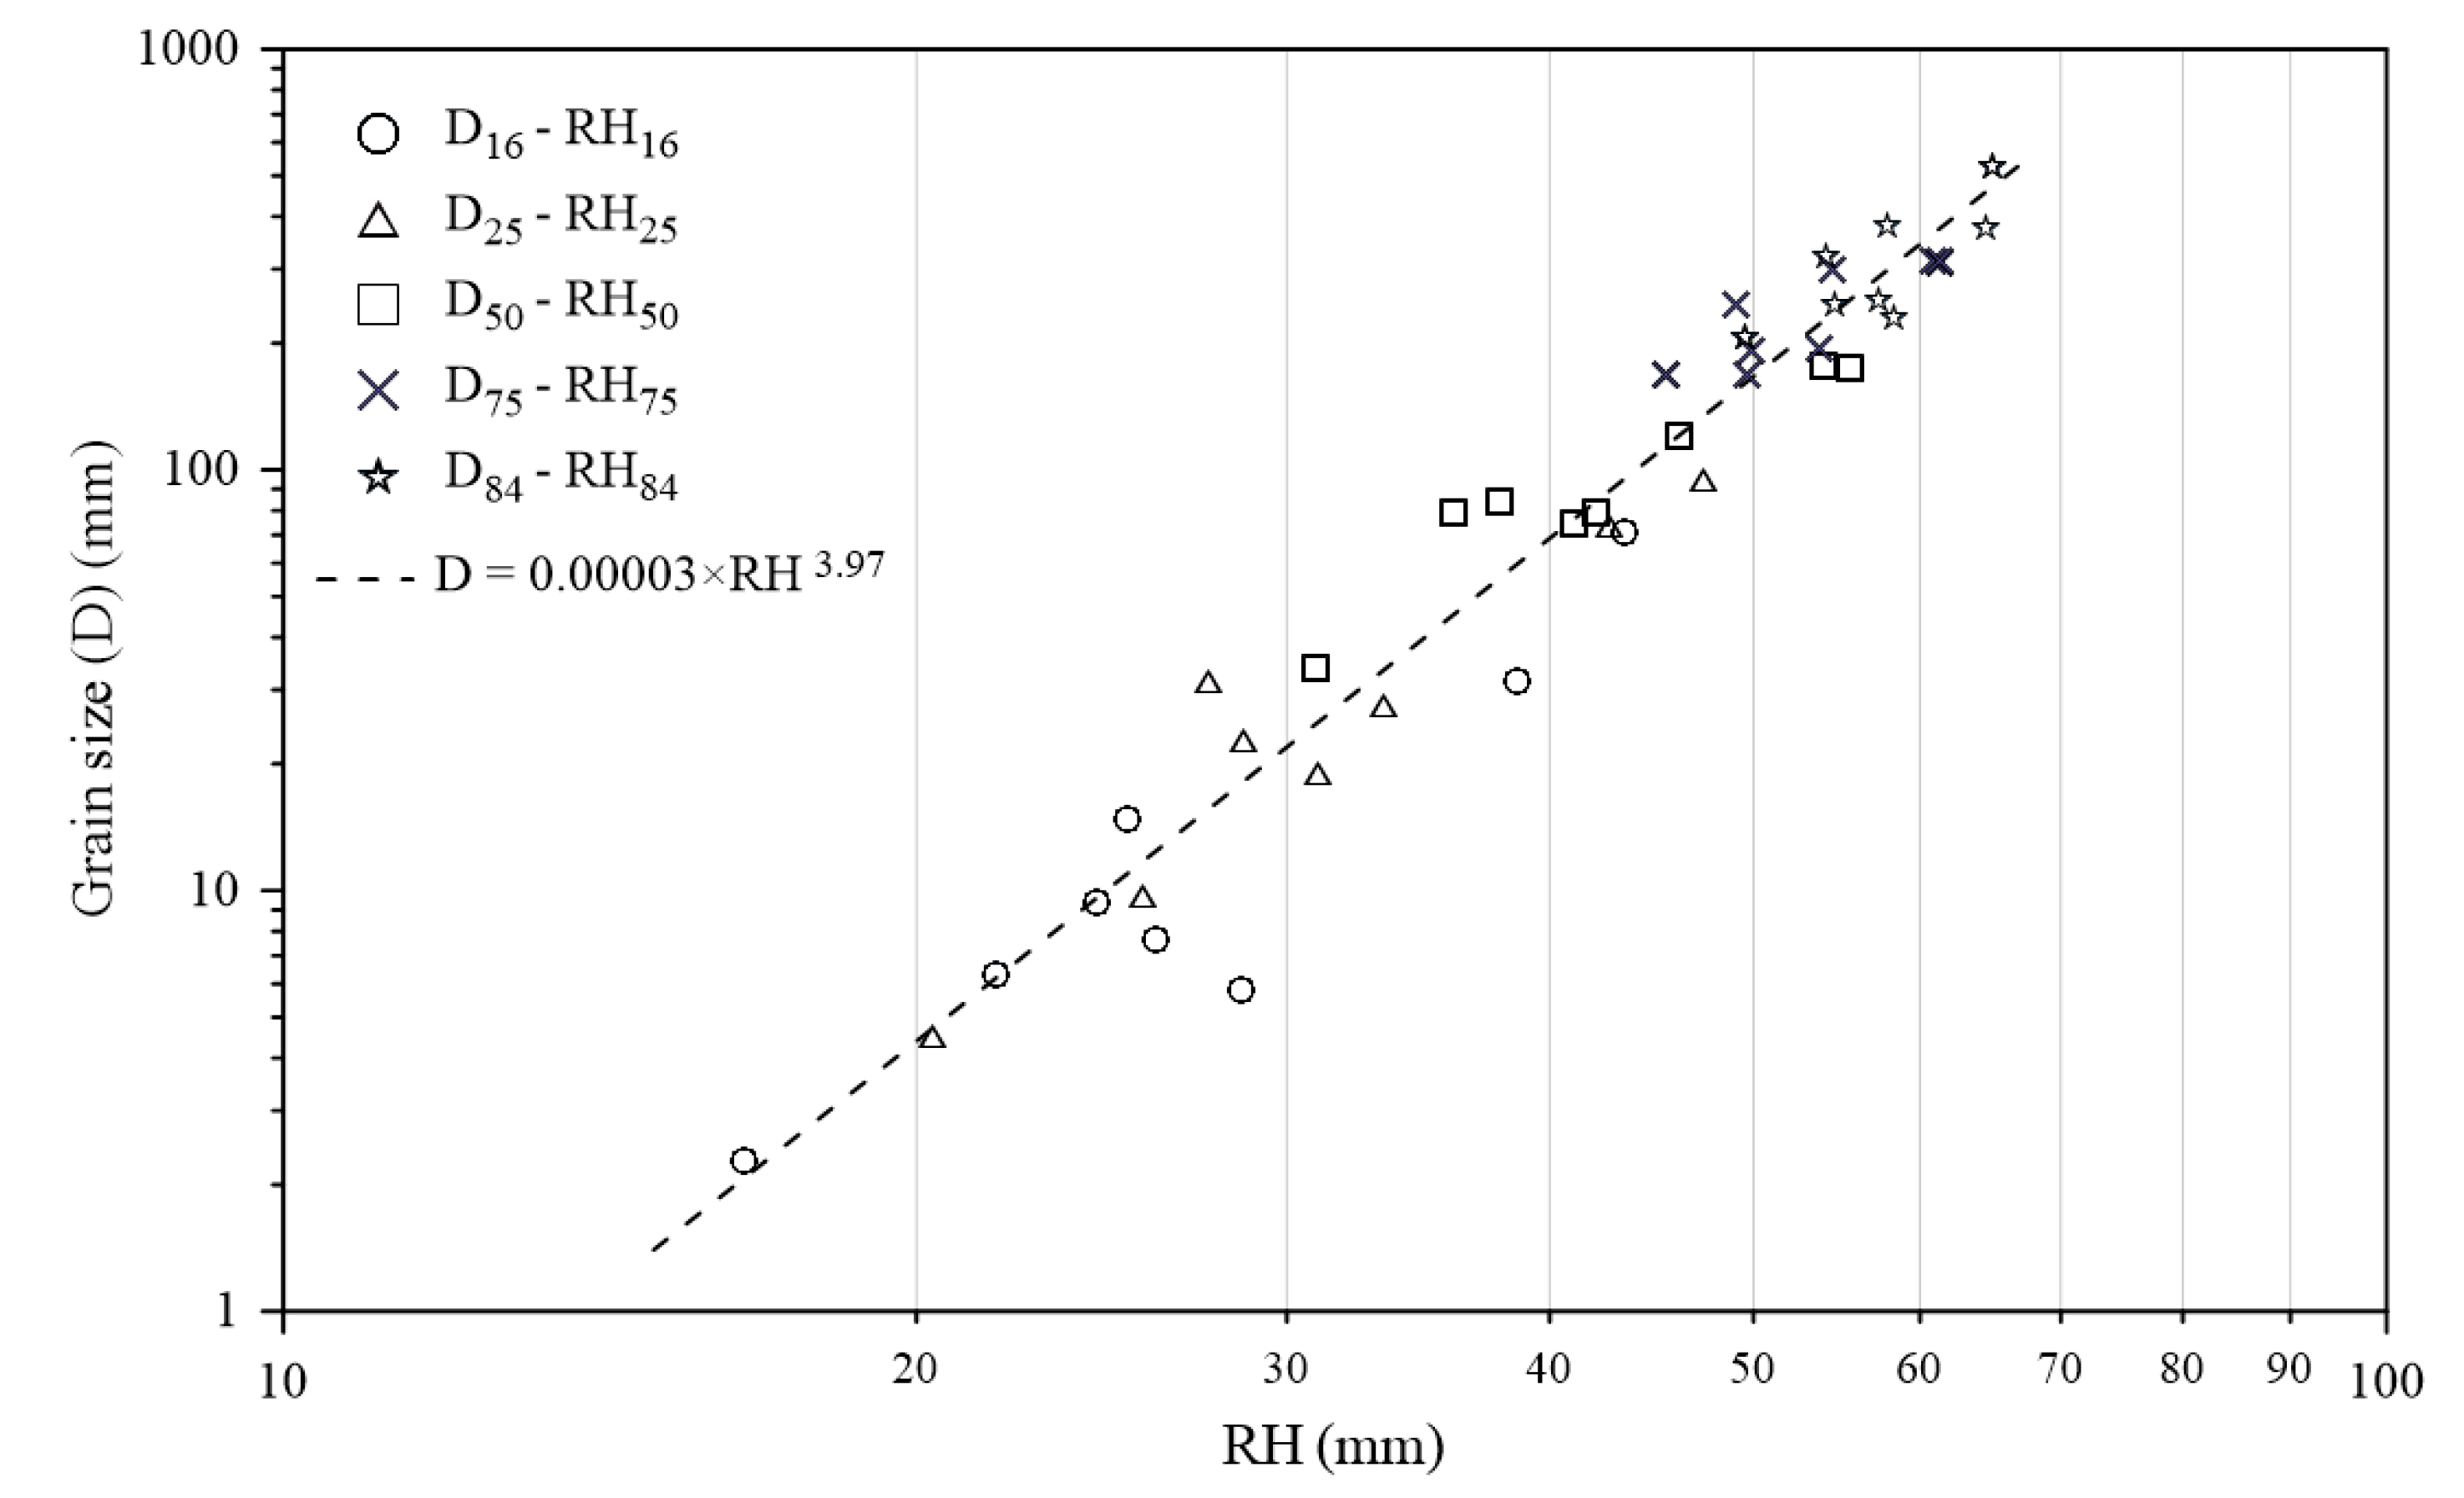
Figure 10.
The comparisons of grain size distribution estimated from the integrated grain size-roughness relation with those by manual sampling for six different sites. (a) at site H09; (b) at site H10; (c) at site N01; (d) at site N02; (e) at site L01; (f) at site L02.
Figure 10.
The comparisons of grain size distribution estimated from the integrated grain size-roughness relation with those by manual sampling for six different sites. (a) at site H09; (b) at site H10; (c) at site N01; (d) at site N02; (e) at site L01; (f) at site L02.
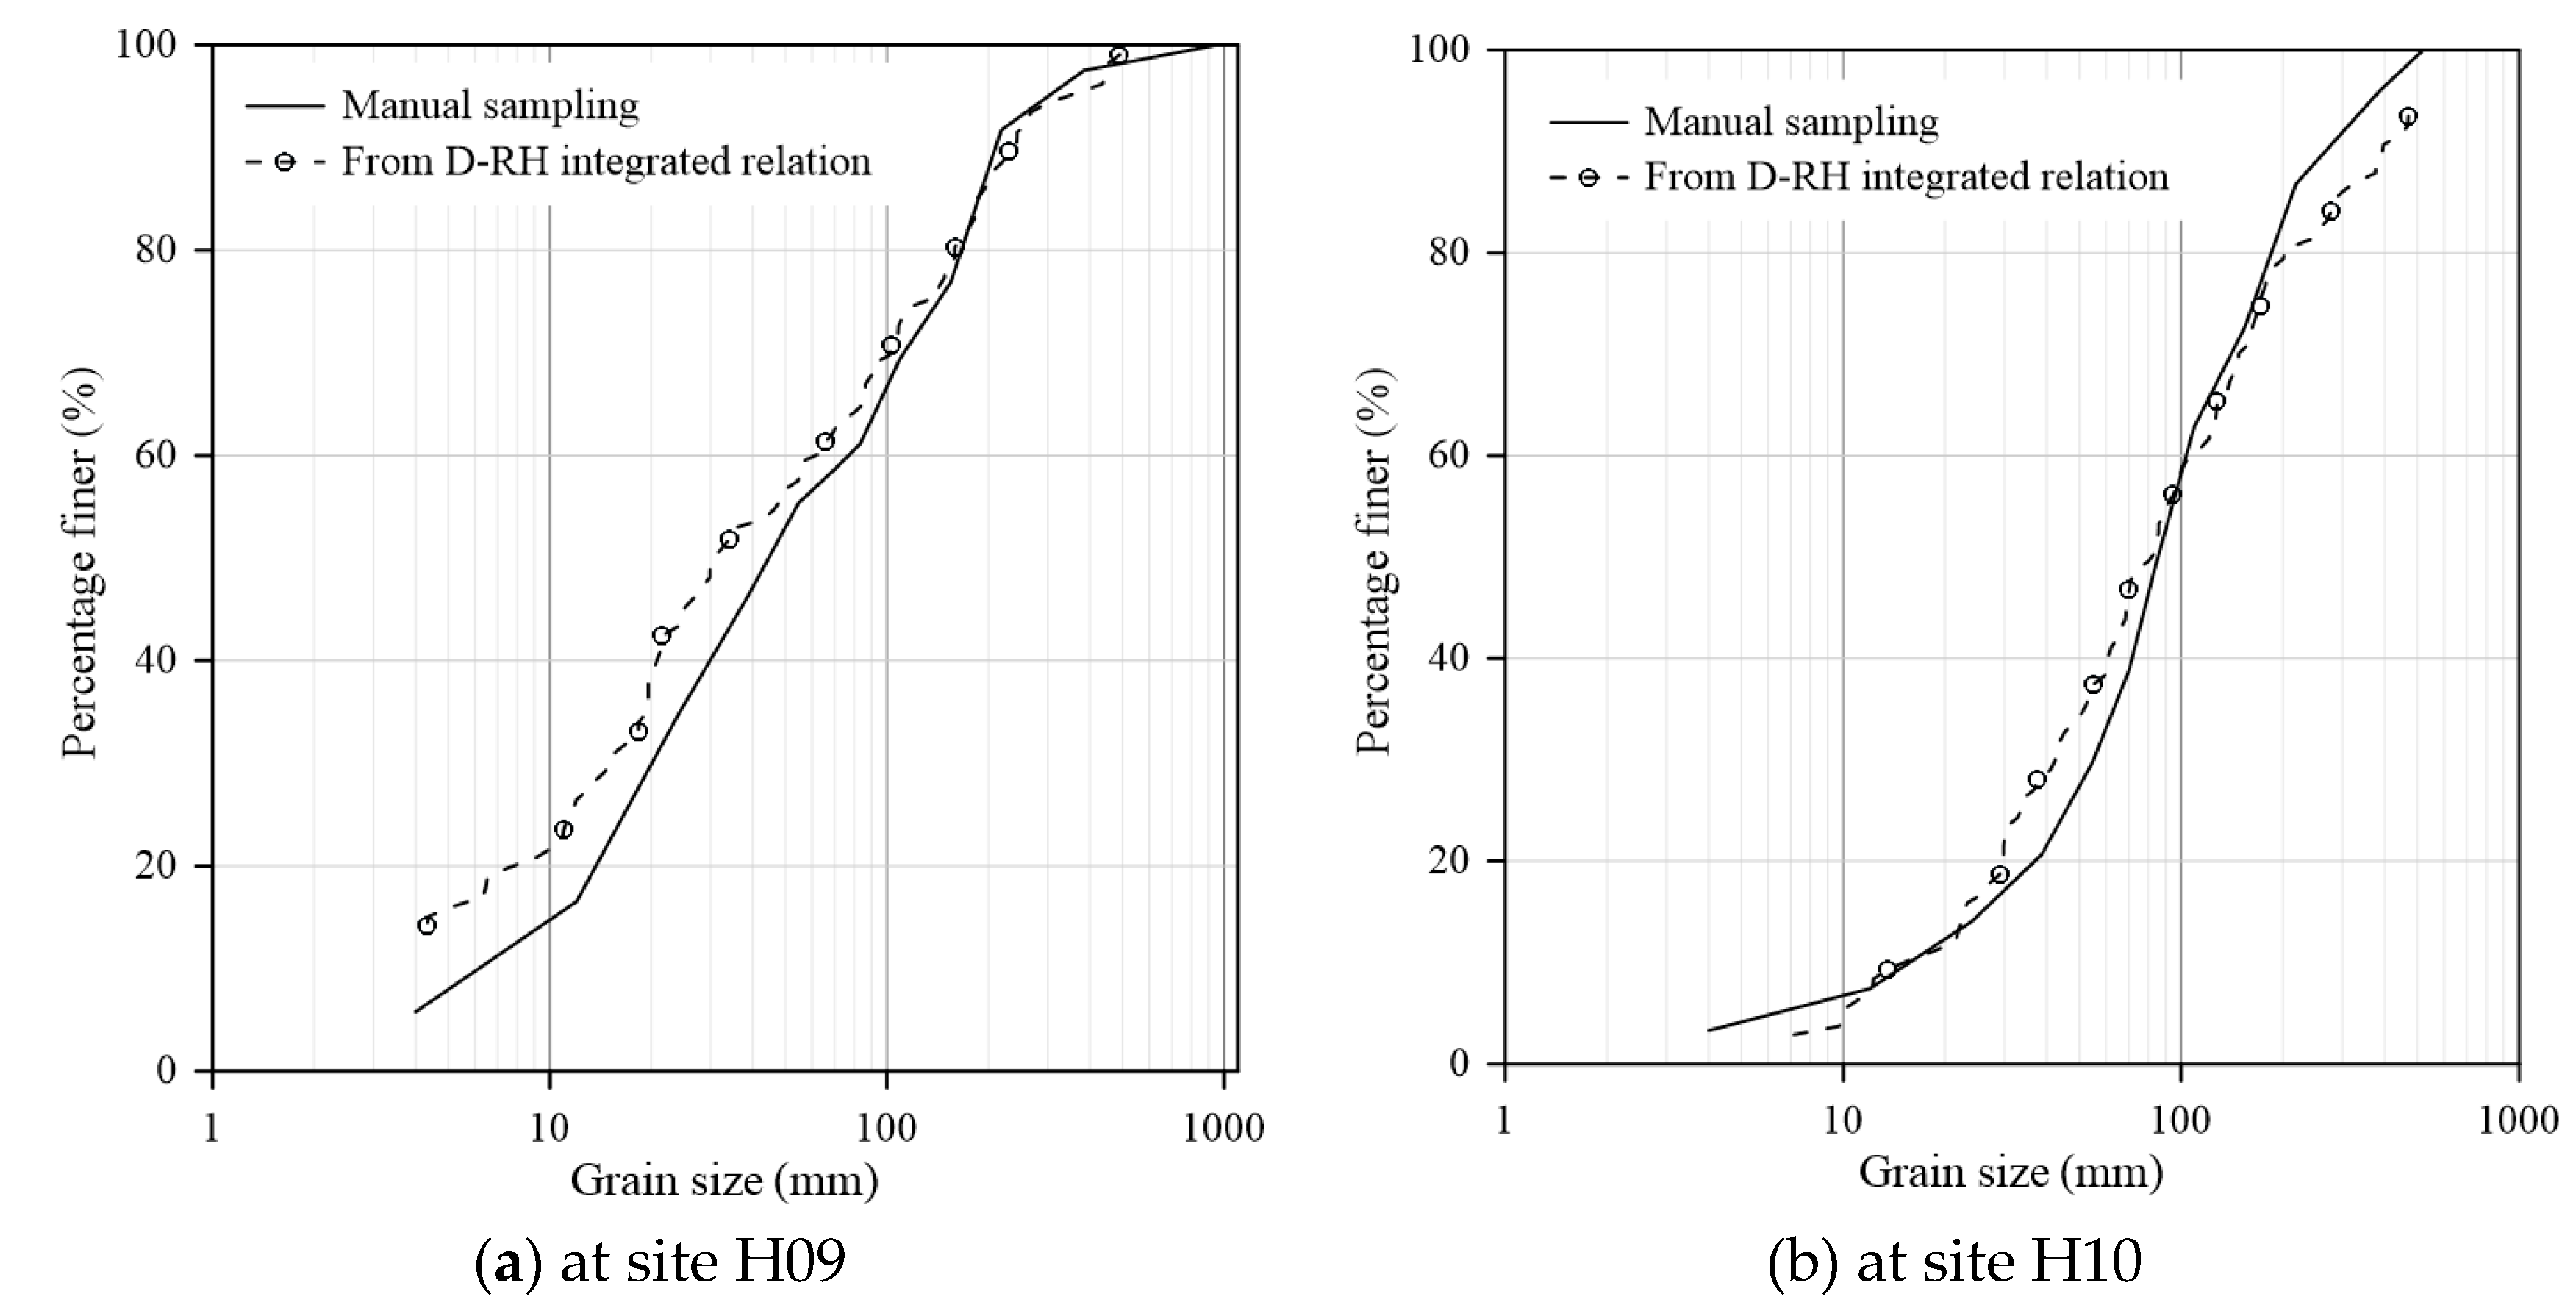
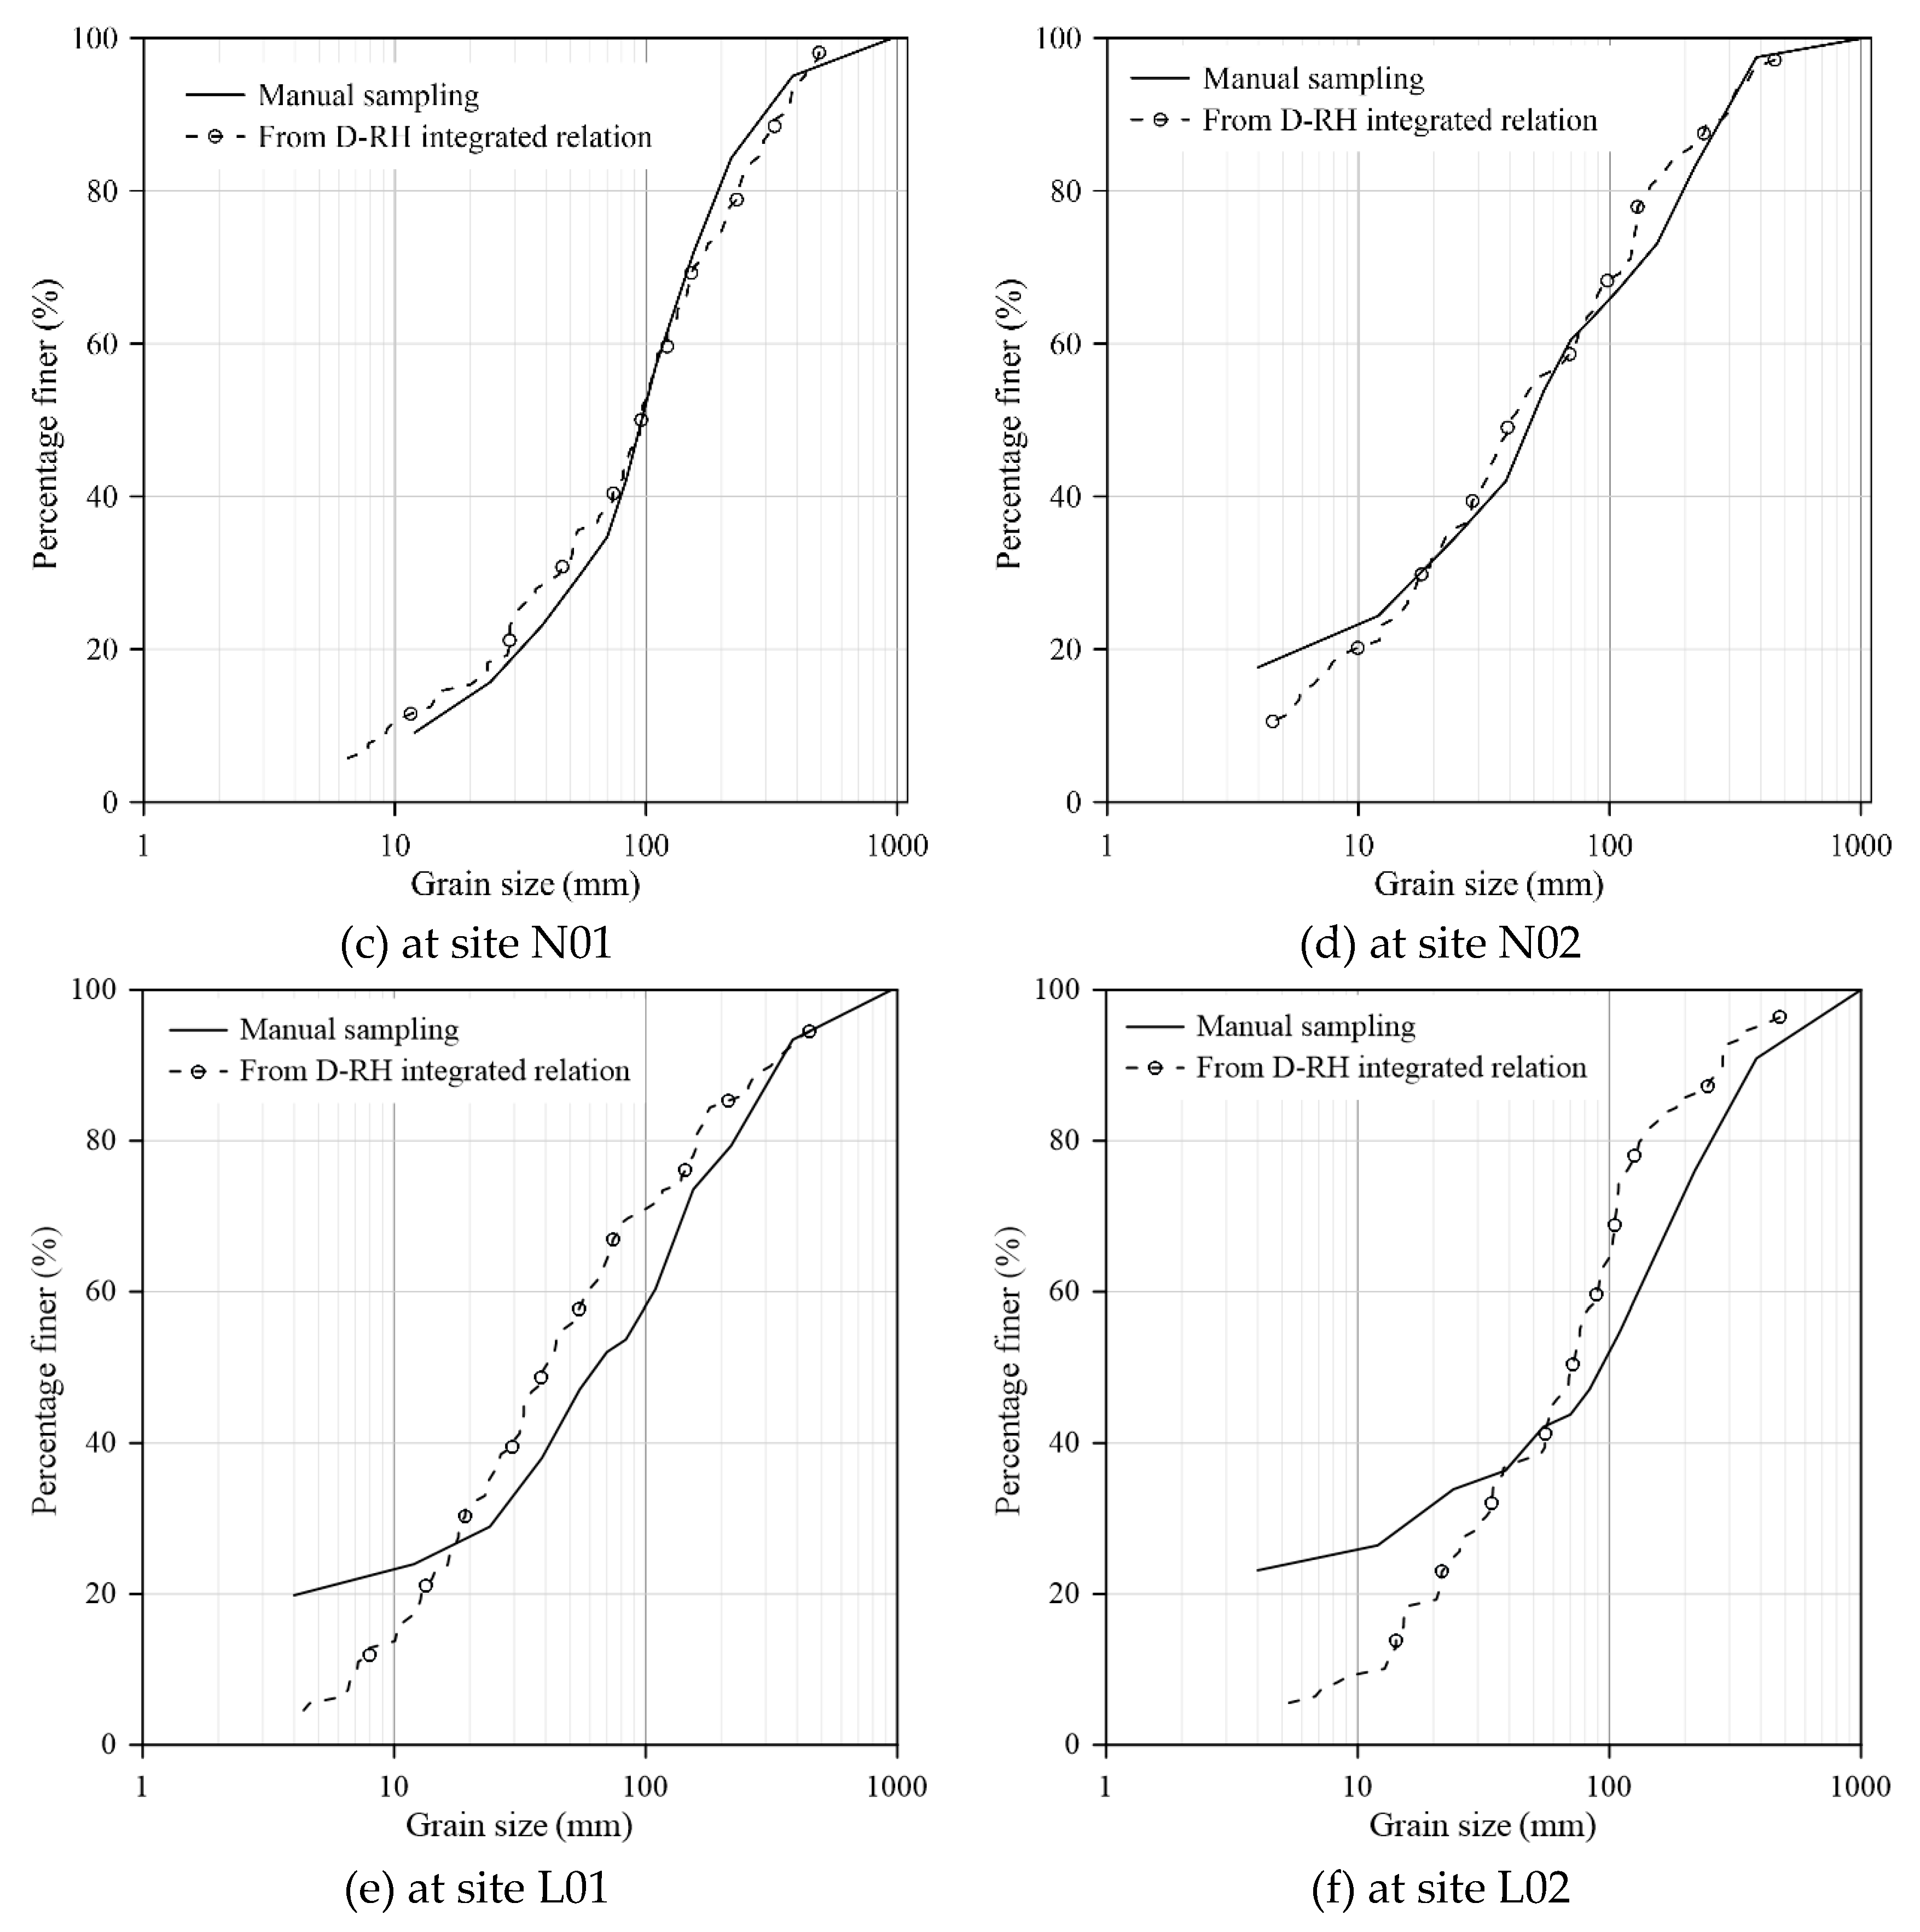
Figure 11.
Orthophotos of the sampling areas. The black outline indicates the 10 m × 10 m boundary in each sampling site. (a) Site H10 in Reach R2, characterized by a well-sorted surface of relatively closely packed pebbles and cobbles. (b) Site L02 in Reach R4, where the bed is interspersed with distinct patches of sand and fine gravel.
Figure 11.
Orthophotos of the sampling areas. The black outline indicates the 10 m × 10 m boundary in each sampling site. (a) Site H10 in Reach R2, characterized by a well-sorted surface of relatively closely packed pebbles and cobbles. (b) Site L02 in Reach R4, where the bed is interspersed with distinct patches of sand and fine gravel.
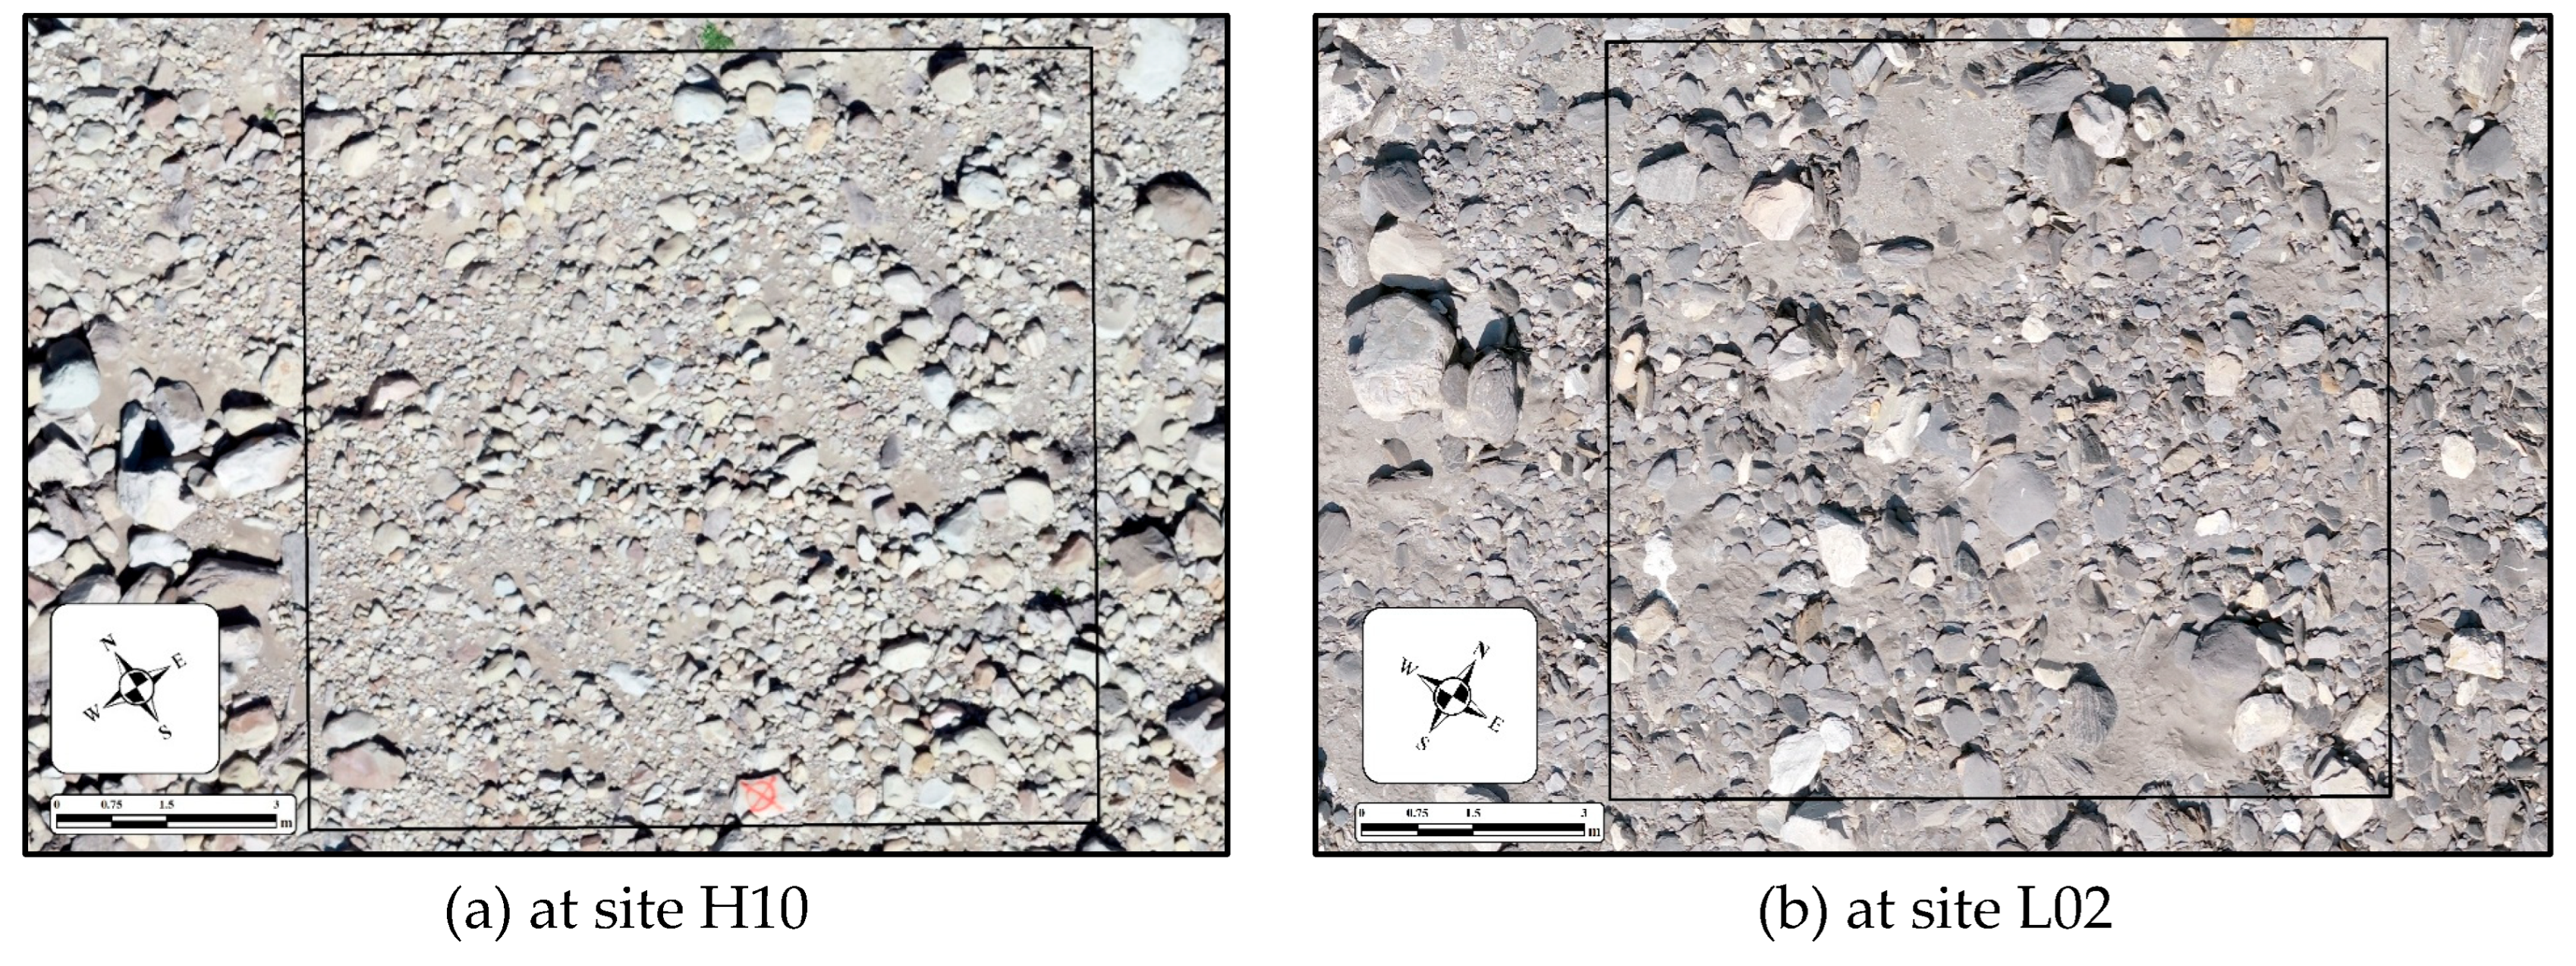
Figure 12.
Comparison of the grain size-roughness relations from the previous study. The inset provides a magnified view for data in [12].
Figure 12.
Comparison of the grain size-roughness relations from the previous study. The inset provides a magnified view for data in [12].
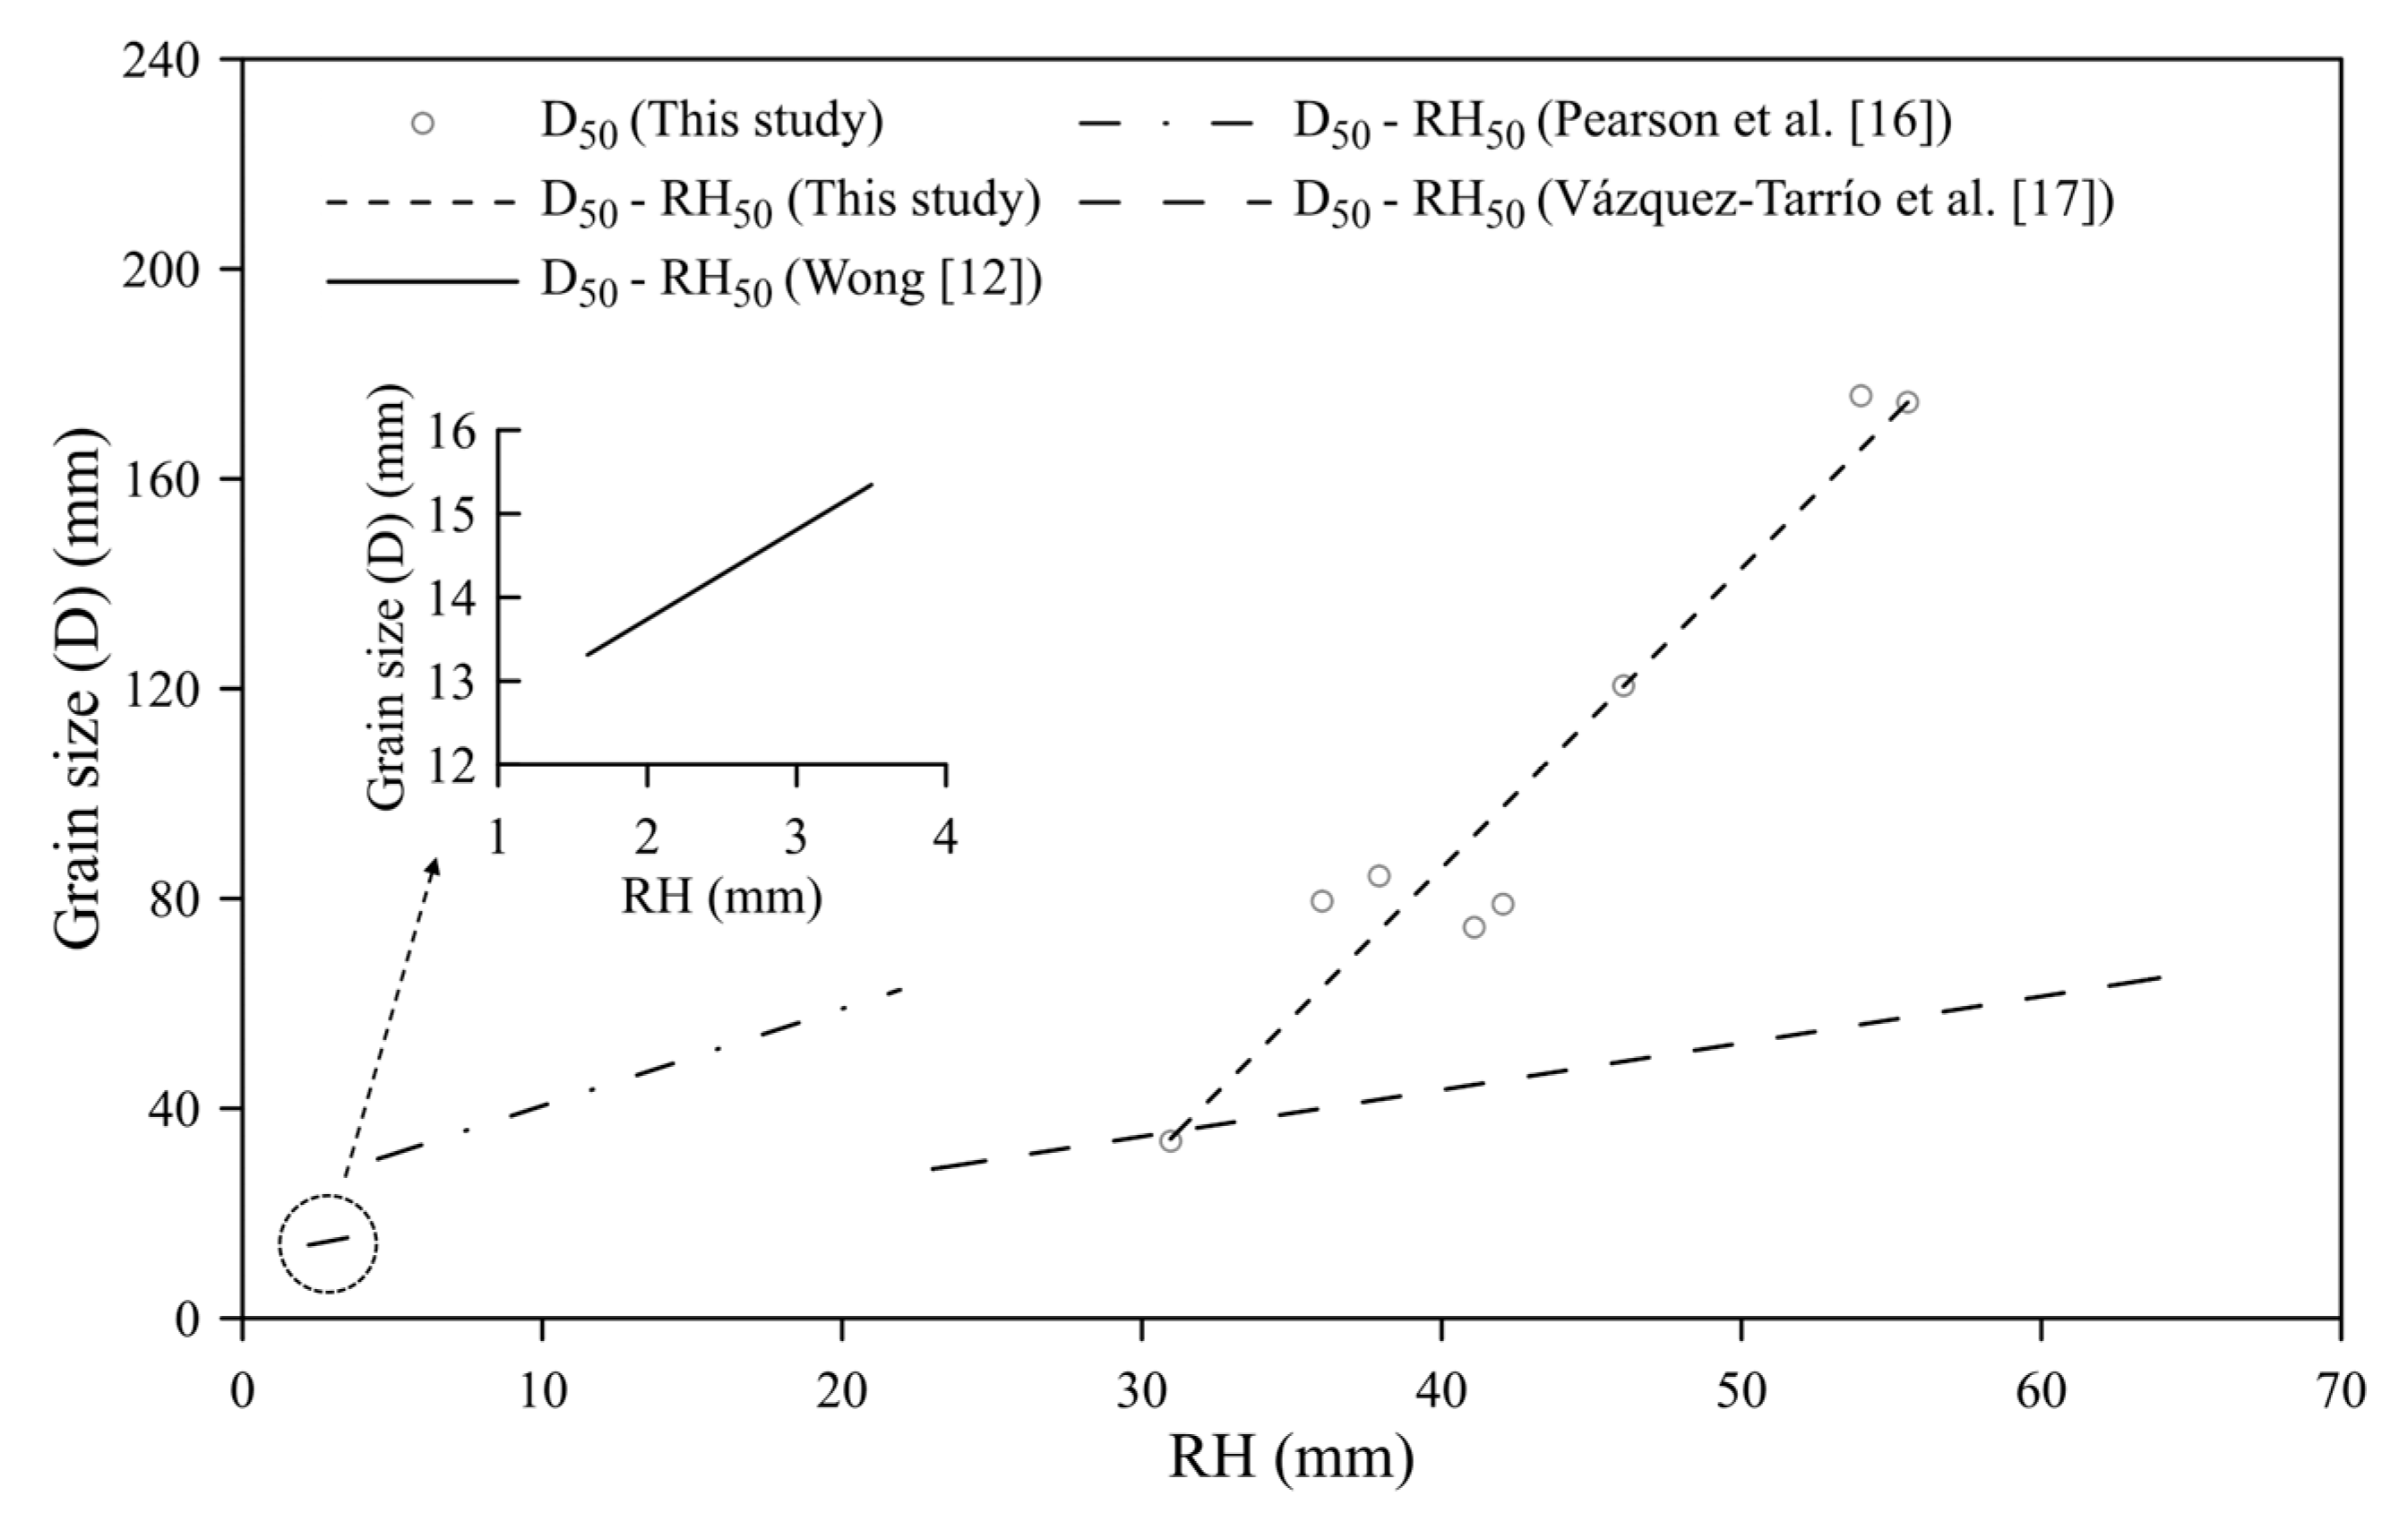
Table 1.
Summary of grain size-roughness relations obtained by previous researchers (modified from [16]).
Table 1.
Summary of grain size-roughness relations obtained by previous researchers (modified from [16]).
| Researchers |
Sediment description (grain size range) |
Grain size sampling | Data | Roughness metric* (grid size) | Grain size-Roughness relation (in mm) | R2 |
| Heritage and Milan [15] | Gravel-bed river with discs dominating (D50 = 30–95mm) | Pebble counts | TLS | 2σ (0.05m) | D50 = 0.73(2σ50) + 37.0 | 0.37 |
| Hodge et al. [20] | Tabular form and rounded edges (D50 = 18–63mm) | Pebble counts | TLS | σd (1.0m) | D50 = 1.42σd50 + 8.51 | 0.65 |
| Brasington et al. [14] | Schistose, cobble-sized grains (D50 = 30–117 mm) |
Pebble counts | TLS | σd (1-2 m) | D50 = 2.59σd50 + 11.9 | 0.92 |
| Woodget and Austrums [19] | Cobbles and boulders (D84 = 10–160 mm) |
Areal sample & Photosieving | SfM | RH (0.4m) | D84 = 12.35RH50–2.90 | 0.80 |
| Vázquez-Tarrío et al. [17] | Well-rounded and subspherical grains (D50 = 28–65 mm) | Pebble counts | SfM | RH (1.0m), 2σ (1.0m) & σd (1.0m) | D16 = 0.73RH16 +7.26 | 0.64 |
| D50 = 0.89RH50+7.95 | 0.89 | |||||
| D84 = 0.78RH84 + 18.9 | 0.83 | |||||
| Pearson et al. [16] | Oblate (53%), prolate (24%), and sphere (23%) shaped particles. (D50 = 13–72mm) |
Areal sample | SfM | σ (0.2m) & RH (0.5m) | Poor sorting D50 = –0.29RH50 + 50.0 |
0.02 |
| Moderately well-sorted D50 = 1.85 RH50 + 22.0 |
0.69 | |||||
| Wong [12] | Sands, gravels, and cobbles (D50 = 13–16 mm) |
Photosieving | SfM | σ (0.03m) RH (0.08m) |
D50 = 1.07RH50 + 11.6 | 0.46 |
| D84= 3.87RH50 + 13.7 | 0.48 |
*σ: Standard deviation, σd: Detrended standard deviation, RH: Roughness height.
Table 2.
Seven field surveys in the studied reaches for UAV photography and grain size samplings.
| Set | Date | Reach | Point cloud density (pts/m3) |
GSD (mm/px) |
Georeferencing errors (cm) |
Sampling sites |
| 1 | 2021/12/15 | R1 | 15564.2 | 5.8 | 0.8 | H01 |
| 2 | 2022/10/24 | R1 | 8502.6 | 7.2 | 1.8 | H02, H03, H04, & H05 |
| 3 | 2023/01/05 | R2 | 22833.7 | 4.7 | 2.1 | H09 |
| 4 | 2023/07/06 | R1 | 8761.0 | 7.2 | 2.0 | H06, H7, &H 08 |
| 5 | 2023/11/24 | R3 | 13583.9 | 6.3 | 3.2 | N01 & N02 |
| 6 | 2024/01/18 | R4 | 15393.9 | 6.5 | 2.4 | L01 & L02 |
| 7 | 2024/02/21 | R2 | 10688.3 | 7.1 | 1.6 | H10 |
Table 3.
The linear Di-RHi relations and their coefficients of determination (R2), slope (
| Di-RHi | R2 | ||
| D16-RH16 | 0.79 | 2.32 | -46.67 |
| D25-RH25 | 0.92 | 3.41 | -73.90 |
| D50-RH50 | 0.94 | 5.71 | -142.58 |
| D75-RH75 | 0.70 | 9.45 | -265.02 |
| D84-RH84 | 0.60 | 15.99 | -605.11 |
Table 4.
The relative errors of local grain sizes estimated from the integrated grain size-roughness relation with those from manual samplings at 8 sites in R1 reach (unit: %).
Table 4.
The relative errors of local grain sizes estimated from the integrated grain size-roughness relation with those from manual samplings at 8 sites in R1 reach (unit: %).
|
Sites Di |
Reach R1 (%) |
Mean (%) |
|||||||
| H01 | H02 | H03 | H04 | H05 | H06 | H07 | H08 | ||
| D16 | 21.2 | 15.0 | 20.8 | 115.0 | 85.5 | 36.0 | 362.0 | 79.6 | 91.9 |
| D25 | 50.0 | 7.6 | 4.2 | 26.1 | 32.8 | 39.1 | 52.4 | 72.1 | 35.6 |
| D50 | 32.9 | 26.4 | 11.8 | 30.2 | 13.6 | 45.0 | 2.1 | 27.9 | 23.7 |
| D75 | 31.4 | 0.1 | 0.6 | 20.2 | 27.8 | 22.9 | 16.2 | 4.2 | 15.4 |
| D84 | 20.6 | 32.3 | 8.0 | 6.5 | 30.7 | 25.9 | 17.5 | 12.7 | 19.3 |
| Mean | 31.2 | 16.3 | 9.1 | 39.6 | 38.1 | 33.8 | 90.0 | 39.3 | 37.2 |
Table 5.
The relative errors of local grain sizes estimated from the integrated grain size-roughness relation with those from manual samplings at 6 sites in Reach R2-R4 (unit: %).
Table 5.
The relative errors of local grain sizes estimated from the integrated grain size-roughness relation with those from manual samplings at 6 sites in Reach R2-R4 (unit: %).
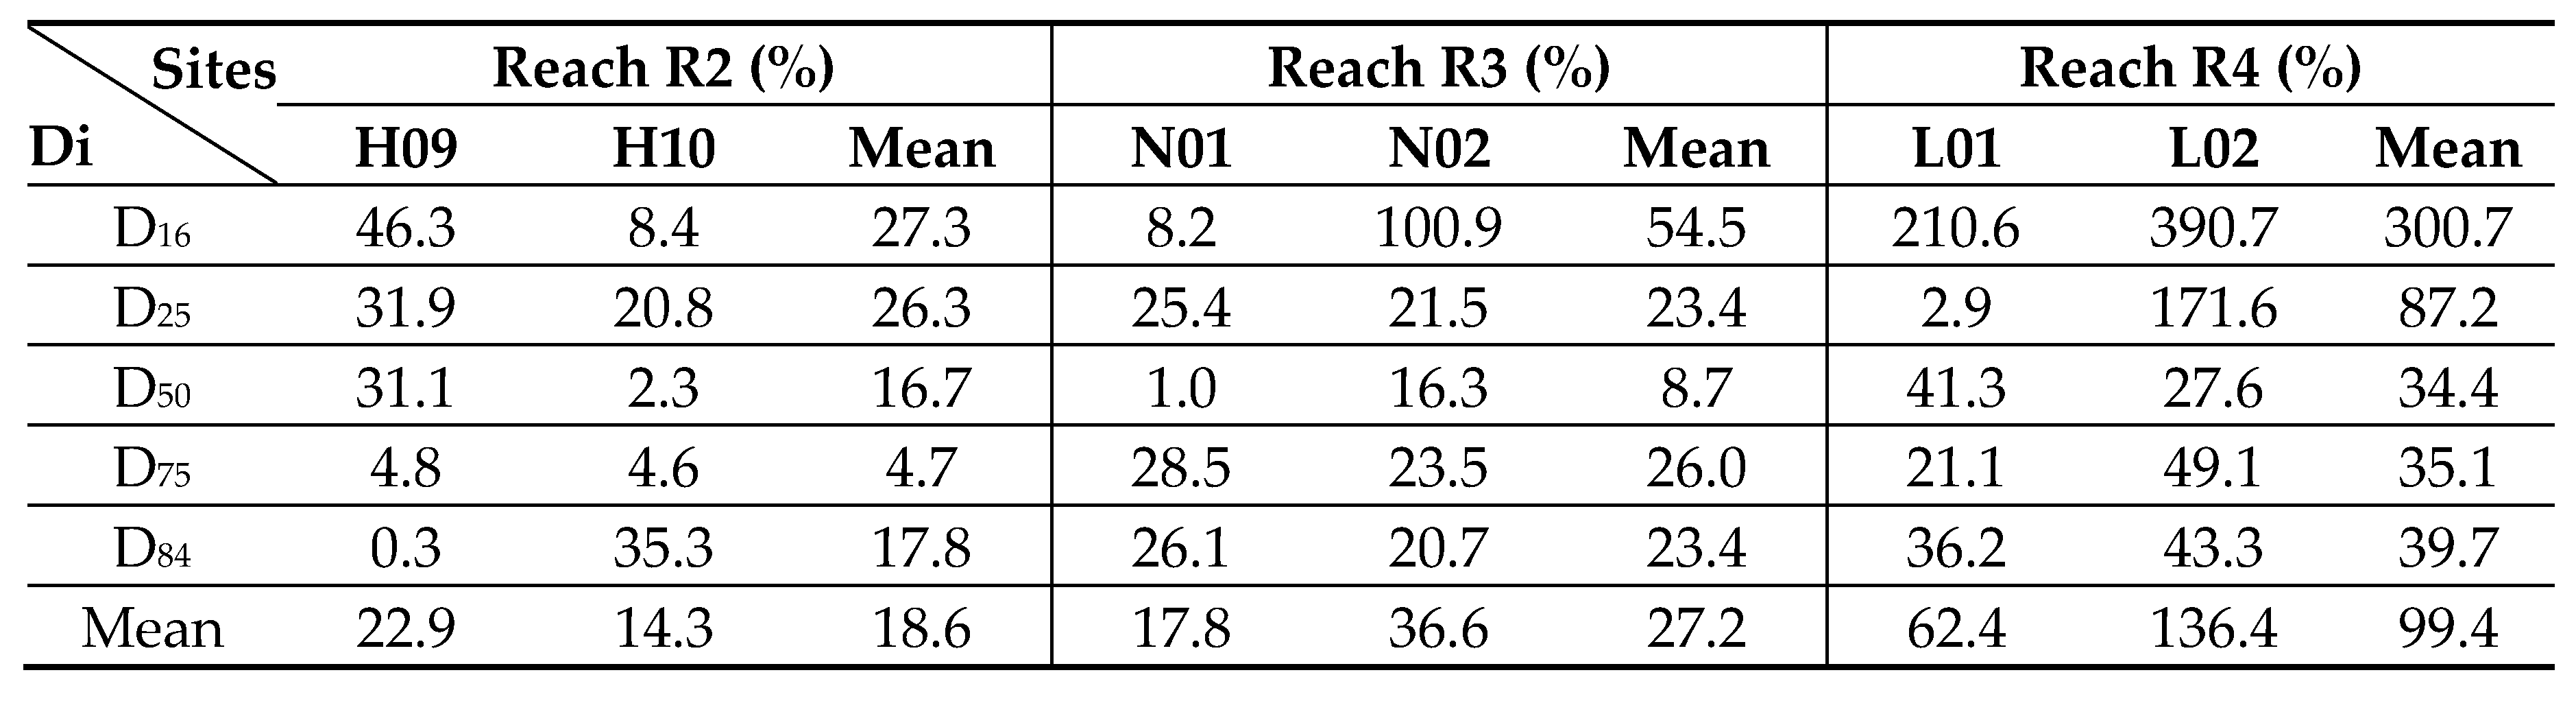
Table 6.
The relative errors of local grain sizes estimated from the individual linear grain size-roughness relations with those from manual samplings at 6 sites in Reach R2-R4 (unit: %).
Table 6.
The relative errors of local grain sizes estimated from the individual linear grain size-roughness relations with those from manual samplings at 6 sites in Reach R2-R4 (unit: %).
Disclaimer/Publisher’s Note: The statements, opinions and data contained in all publications are solely those of the individual author(s) and contributor(s) and not of MDPI and/or the editor(s). MDPI and/or the editor(s) disclaim responsibility for any injury to people or property resulting from any ideas, methods, instructions or products referred to in the content. |
© 2025 by the authors. Licensee MDPI, Basel, Switzerland. This article is an open access article distributed under the terms and conditions of the Creative Commons Attribution (CC BY) license (http://creativecommons.org/licenses/by/4.0/).
Copyright: This open access article is published under a Creative Commons CC BY 4.0 license, which permit the free download, distribution, and reuse, provided that the author and preprint are cited in any reuse.


