Submitted:
05 July 2025
Posted:
07 July 2025
Read the latest preprint version here
Abstract
Starch is a widely used excipient in tablet formulations, particularly as a binder. However, its binding capacity often requires enhancement through physical or chemical modification. This study aimed to develop and optimize paracetamol tablet formulations using phosphate-pregelatinized starch derived from Zea mays L. as a binder. Starch was modified using sodium hydrogen phosphate (Na₂HPO₄) at concentrations of 0.25%, 0.30%, and 0.35%, and subsequently characterized. Five tablet formulations were prepared via wet granulation using 0.3% phosphate-pregelatinized starch at varying concentrations (3%–7%). The modified starch met pharmacopeial specifications, with the highest viscosity observed at 0.30% Na₂HPO₄. The formulation containing 7% phosphate-pregelatinized starch exhibited optimal tablet characteristics: diameter 13 mm, thickness 0.5 mm, hardness 5.8 kg, disintegration time 1.36 minutes, friability 0.5%, drug content 101.86%, weight uniformity 711.5 mg, and dissolution rate 99.28%. These findings demonstrate that Zea mays starch can be effectively modified into phosphate-pregelatinized form and used as a functional binder in tablet formulations. Moreover, the enhanced solubility of the modified starch may improve the dissolution of paracetamol as a model drug.
Keywords:
Zea mays
; starch
; phosphate pregelatinized
; binder
; dissolution
; paracetamol tablets
1. Introduction
The dependence on raw materials for the Indonesian pharmaceutical industry is still high. The Ministry of Industry of the Republic of Indonesia projects that the problem of imports of raw materials for medicines for the national pharmaceutical industry will decrease significantly in 2024. Data from the Ministry of Industry shows that import dependence in 2020 decreased by 2.72% to 92%. Therefore, the government supports efforts to achieve independence in raw materials for both active ingredients/excipients.[1]
Tablets are the most commonly prescribed dosage form as a convenient form of drug administration that provides dosage uniformity from tablet to tablet, are stable over extended and diverse storage conditions, and can result in high-speed compression, labeling, and packaging equipment. Advancements in technology and modifications in the standard compressed tablet aim to achieve better acceptability and bioavailability.[2]
Starch is a natural ingredient, a tablet excipient, widely used, inexpensive, but insoluble in water.[3] Starch is a polysaccharide that typically forms granules within most plant cells. These granules consist of highly ordered crystalline regions and more irregular amorphous regions. When starch exists in this granular form, it is known as "natural starch." Starches from various plant sources differ significantly in structure and composition, but each granule comprises two polysaccharides: amylose (generally 20-30%) and amylopectin (usually 70-80%). Both are polymers of α-D-glucose. Despite its usefulness, starch has certain limitations, making it unsuitable for some applications. Hence, chemical and physical modification methods are applied to transform these undesirable characteristics into advantageous ones.[4] Starch consists of natural and modified starch. Natural starch has some weaknesses, like low compressibility, low flow rate, and the fact that it is undissolved in cold water.[5]
Modified or pregelatinized starch is modified using thermal, chemical, or mechanical processes. The choice of method influences the physical properties of the pregelatinized starch, such as wettability, dispersibility, and peak viscosity in cold water. Heat treatment is employed as it transforms crystalline areas into amorphous ones, aiding in water absorption and granule expansion. Common heat treatments that induce gelatinization include spray drying, roll drying, drum drying, extrusion, and other heating or drying techniques. Pregelatinized and phosphate-pregelatinized starches are cooked first and dried using a drum or spray dryer. It is free-flowing, has low moisture content, and is easily soluble in cold water.[6] However, pregelatinized starch can experience retrogradation, which causes syneresis, and a chemical modification of pregelatinized starch using sodium tripolyphosphate at a basic pH.[5]
Paracetamol consumption in Indonesia is high, with a demand of 9 tons yearly.[7] At room temperature, paracetamol's solubility in water is limited. However, this improves considerably with boiling water. Additionally, it can dissolve more effectively in polar solvents or materials.[8] In this study, paracetamol is the active ingredient model.
2. Materials and Methods
2.1. Materials
Materials are from Cornstarch (Cerestar, Indonesia); paracetamol (China); Na2HPO4, NaOH, HCl, and KH2PO4 (Merck, Germany); Primogel (Blanver, Brazil); talcum (Takehara Kagaku Kogyo, Japan); magnesium stearate (FACI Asia Pacific, Singapore); lactose (Hilmar Ingredients, USA); and purified water (Brataco, Indonesia).
2.2. Methods
2.2.1. Preparation of Pregelatinized Cornstarch [9]
A certain amount of cornstarch is added with purified water of 42% (w/v) of the weight of dry cornstarch, heated in a water bath at 62-72 oC, and then dried in a double drum dryer at 80+5 oC. The resulting thin flakes are collected, powdered with a disc mill, and then sieved with a mesh 100.
2.2.2. Preparation of Phosphate Pregelatinized Cornstarch [10]
The pregelatinized cornstarch was gradually added to water as much as 80% of the total mass weight while stirring until evenly distributed. The starch dispersion was alkalized to pH 9-10 with 5N NaOH. After the pH 9-10, added Na2HPO4 as much as 0.25, 0.30, and 0.35% of the dry starch weight. Let stand for 120 minutes. Neutralized the pH with 1N HCl to pH 6. Let it be again for 24 hours. Dried the material with a double drum dryer at 80 oC, sieved with a disc mill, and then re-sieved with a mesh 100.
2.2.3. Characterizations of Phosphate Pregelatinized Cornstarch
Characterization of phosphate pregelatinized cornstarch (PPC) included:
1) Microscopic form: The microscopic observation of PPC used an ocular microscope with 100x magnification at room temperature.[11]
2) Flow rate: The flow rate of PPC was determined using the funnel method, and the resulting unit was in g/second.[12]
3) Compressibility: The determination of PPC's compressibility used a volumenometer, and the resulting unit was in percentage %.[12]
4) Viscosity: The USP (United States Pharmacopoeia) chapter <911> Viscosity provided guidelines and methods for determining the viscosity of pharmaceutical products and other fluids. This method used a Brookfield viscometer, a sample of 5% w/v, a beaker glass of 1000 mL, a #1 spindle, and an rpm of 100.[13]
5) Loss on drying: United States Pharmacopeia (USP) 43 of General Chapter <731> provided the method for loss on drying using 2 grams of the sample to the sample port. The moisture balance was on for 10 minutes, with a 2 g sample positioned on the sample port.[14]
6) Whiteness degree: The measurement of whiteness degree (level) used a whiteness meter calibrated using the white color of BaSO4.[15]
7) pH: Acidity measurement was per USP <791> using a pH meter.[16]
2.2.4. Paracetamol Characterizations
1) Organoleptic: The method is as Zuhdi and Khairi's publication with a slight modification.[17]
2) Solubility: Paracetamol is soluble in hot water, ethanol, and NaOH 1N.[18]
3) Flow rate: Flow rate: The flow rate of paracetamol was determined using the funnel method, and the resulting unit was in g/second.[12]
4) Angle repose: The USP (United States Pharmacopoeia) chapter <1174> on powder flow provides guidelines and methods for determining the flow rate of pharmaceuticals.[12]
5) Compressibility: Paracetamol compressibility was determined using a volumenometer, and the resulting unit was a percentage %.[12]
2.2.5. Tablet Formulation and Characterization
Tablet formulation used the wet granulation method with slight modification.[20] Paracetamol, phosphate-pregelatinized cornstarch, and lactose were homogenized thoroughly in a mixer for 15 minutes (Mass I). Amylum paste preparation was done by mixing pregelatinized cornstarch with seven parts water and phosphate-pregelatinized cornstarch with 4.5 parts water in a Baker's glass (Mass II). Mass I and II were homogenized for 25 minutes and then screened using a mesh of #8. Put the screened mass on an oven tray to dry at 50oC for 8 hours. The dry mass was ground using a mesh of #18 and then weighed. The primogel, magnesium stearate, and talcum must be in a ratio to accommodate the resulting dry mass, then mixed for 15 minutes and ready for tableting.

Table 1.
Formulations of paracetamol tablets.
| Materials | F0 | F1 | F2 | F3 | F4 | F5 |
| Paracetamol (mg) | 500 | 500 | 500 | 500 | 500 | 500 |
| Corn starch (%) | 10 | 10 | 10 | 10 | 10 | 10 |
| Pregelatinized corn starch (%) | 7 | - | - | - | - | - |
| Phosphate pregelatinized corn starch (%) | - | 3 | 4 | 5 | 6 | 7 |
| Primogel (%) | 3 | 3 | 3 | 3 | 3 | 3 |
| Magnesium strearate (%) | 0.25 | 0.25 | 0.25 | 0.25 | 0.25 | 0.25 |
| Talc (%) | 2 | 2 | 2 | 2 | 2 | 2 |
| Lactose (added to a final weight of 700 mg) | 700 | 700 | 700 | 700 | 700 | 700 |
Before tableting, the tablet mass was determined for loss on drying [14], flow rate [12], angle of repose [12], compressibility [12], particle size distribution [21], granule friability [21], and content uniformity of granules [19]. During the tableting process, the evaluation for physical items such as tablet appearance and organoleptic [17], thickness and diameter [22], hardness [23], friability [24], disintegration time [25], weight variation [26], and chemical items such as paracetamol content [19], content variation [26], dissolution, and dissolution efficiency [27,28].
3. Results and Discussion
3.1. Characterization of Cornstarch, Pregelatinized Cornstarch, and Phosphate Pregelatinized Cornstarch
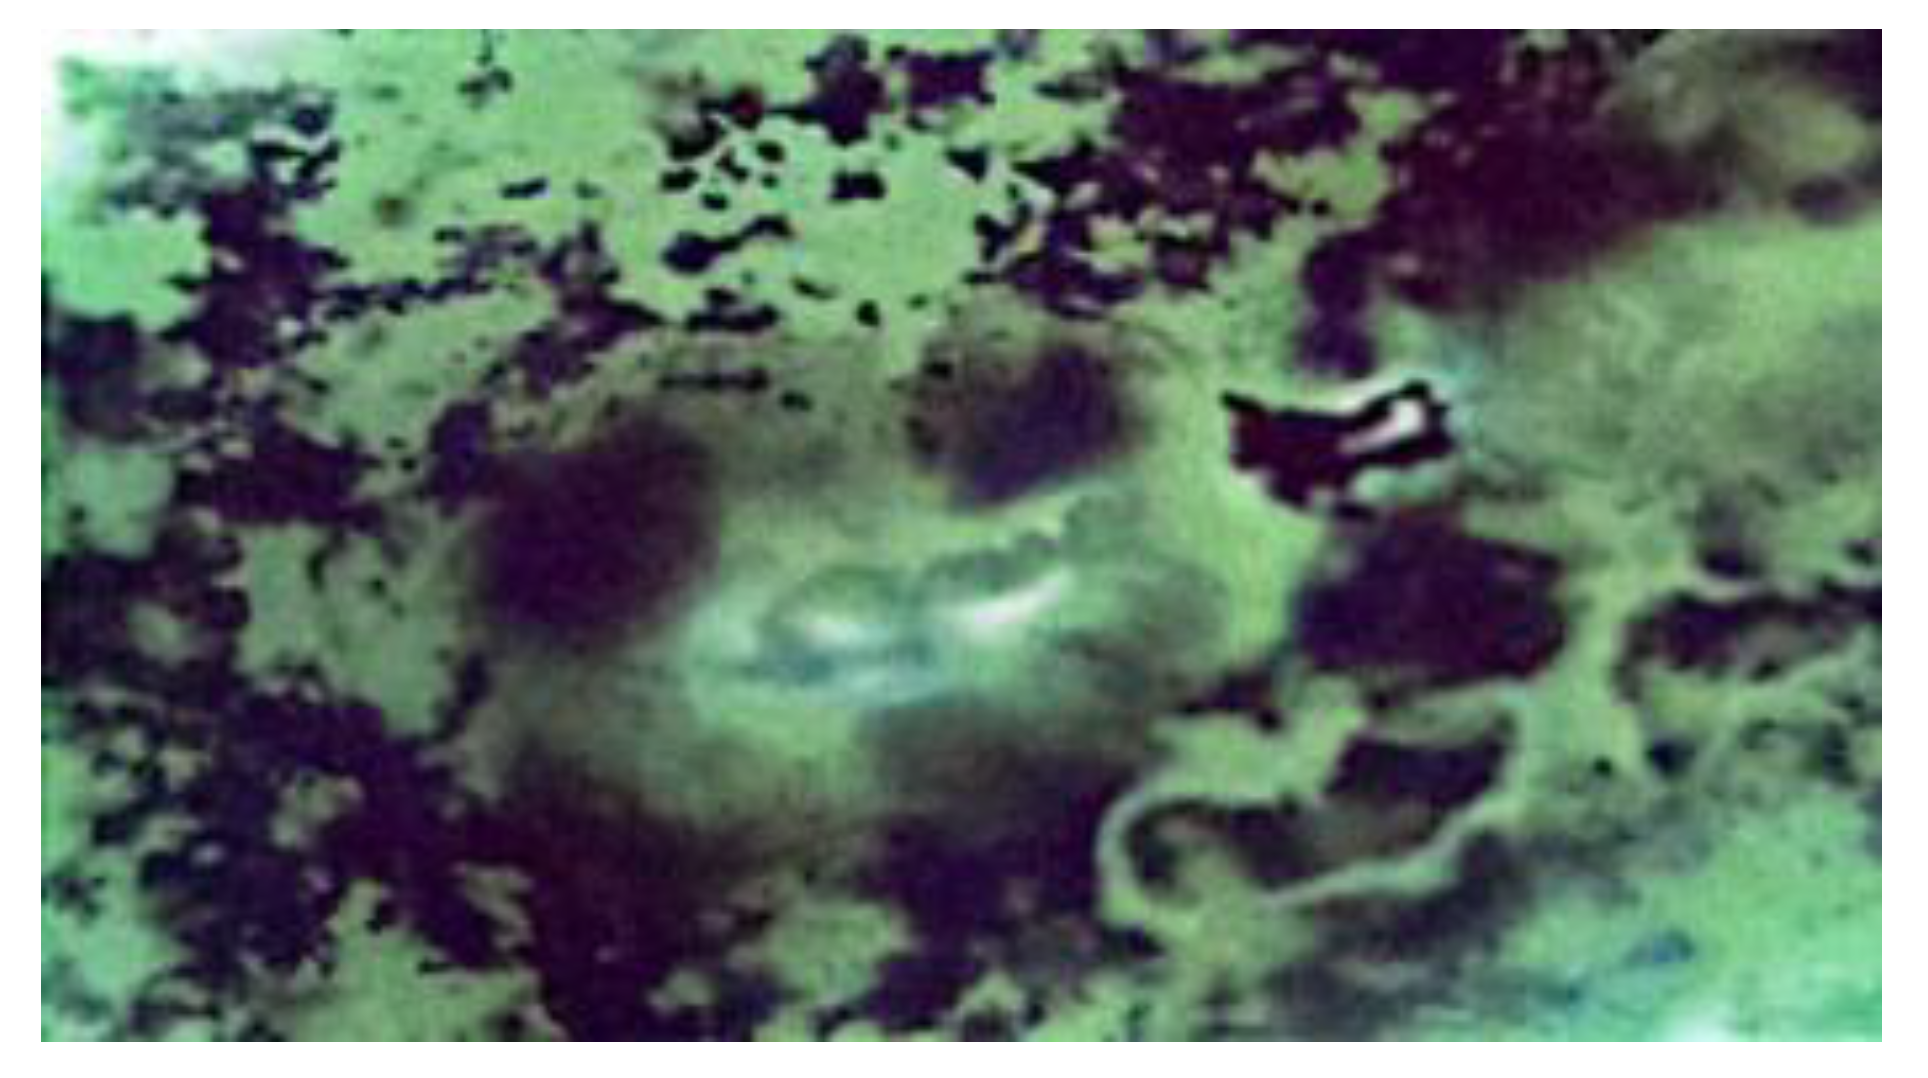
Microscopic forms of cornstarch and its pregelatinized without and with phosphate are presented in Figure 1, Figure 2, Figure 3, Figure 4 and Figure 5.
Characterization of phosphate pregelatinized cornstarch using 0.3% of Na2HPO4 provided the best results, especially in term of its viscosity. (Table 1)
Table 1.
Characterization of cornstarch, pregelatinized cornstarch, and phosphate pregelatinized cornstarch.
Table 1.
Characterization of cornstarch, pregelatinized cornstarch, and phosphate pregelatinized cornstarch.
| Parameters | Corn starch |
Pregelatinized Corn starch |
Phosphate pregelatinized corn starch | ||
| 0.25%* | 0.30% | 0.35% | |||
| Viscosity (cP) | - | 72.9+0.45 | 37.7+0.75 | 45.5+0.30 | 34.3+0.55 |
| pH | 6.3+0.05 | 6.7+0.05 | 6.9+0.01 | 7.1+0.07 | 7.2+0.1 |
| Whiteness level (%) | 97.27 | 89.36 | 98.82 | 99.05 | 99.75 |
| Identification color | Purple | Dark blue | Dark blue | Dark blue | Dark blue |
| Loss on drying (%) | 10.56+0.06 | 5.59+0.30 | 6.19+0.05 | 6.16+0.06 | 6.19+0.01 |
| Flow rate (g/s) | 0.51+0.04 | 0.85+0.04 | 1.04+0.03 | 1.25+0.10 | 1.41+0.11 |
| Repose angle (o) | 37.75+0.45 | 24.94+0.42 | 23.37+0.59 | 21.70+0.10 | 20.89+0.72 |
| Compressibility (%) | 20.32+0.32 | 15.41+0.55 | 13.93+0.24 | 12.93+0.27 | 11.33+1.02 |
*as Na2HPO4 concentration of dry amylum.
3.2. Characterization of Paracetamol
Table 2.
Characterization of paracetamol.
| Parameters | Results |
| Flow rate (g/s) | - |
| Repose angle (o) | - |
| Absorbance peak (nm) | NaOH 0.1N at 257.20 nm Phosphate buffer at pH 5.8 at 243.60 nm |
| Organoleptic | White powder, with no odor and bitter taste |
| Compressibility (%) | 23.59+0.42 |
| Solubility | Soluble in boil water, NaOH 1N, and ethanol |
3.3. Characterization of Tablet Mass Before Compression
Table 3.
Characterization of tablet mass before compression.
| Parameters | F0 | F1 | F2 | F3 | F4 | F5 | |
| LOD (%) | 3.52+0.02 | 3.56+0.02 | 3.55+0.02 | 3.61+0.01 | 3.54+0.01 | 3.52+0.01 | |
| F. rate (g/s) | 28.74+0.30 | 22.73+0.72 | 24.21+0.08 | 26.18+0.93 | 25.32+0.32 | 25.84+0.73 | |
| R. angle (o) | 22.56+0.24 | 25.54+1.51 | 24.49+0.36 | 23.99+0.29 | 23.68+0.13 | 23.15+0.28 | |
| Compress. (%) | 8.70+0.30 | 15.68+0.08 | 14.34+0.34 | 12.70+0.30 | 11.60+0.40 | 10.70+0.30 | |
| Con. hom. (%) | 99.47+0.21 | 101.98+0.52 | 99.18+0.08 | 99.05+0.039 | 101.92+0.08 | 101.14+0.17 | |
LOD: Loss on drying; F. rate: Flow rate; R. angle: Repose angle; Compress.: Compressibility; Con. hom.: Content homogeneity .
3.4. Particle Size Distribution (%)
Table 4.
Particle size distribution (%) of tablet mass before compression.
| Mesh# | F0 | F1 | F2 | F3 | F4 | F5 | |
| 14 | 0 | 0 | 0 | 0 | 0 | 0 | |
| 16 | 0 | 0 | 0 | 0 | 0 | 0 | |
| 20 | 0.97+0.03 | 0.95+0.01 | 0.97+0.01 | 0.85+0.04 | 1.58+0.02 | 0.90+0.02 | |
| 30 | 59.29+0.31 | 37.07+0.28 | 36.36+0.46 | 27.90+0.40 | 65.05+0.32 | 22.51+0.31 | |
| 40 | 26.31+0.50 | 36.81+1.01 | 51.01+0.38 | 55.29+0.30 | 14.36+0.16 | 56.83+0.10 | |
| 50 | 10.97+0.69 | 20.90+0.09 | 6.11+2.03 | 12.17+0.44 | 15.04+0.35 | 17.12+0.71 | |
| Pan | 2.46+0.08 | 4.26+0.61 | 3.85+0.23 | 3.78+0.29 | 3.58+0.17 | 2.72+0.17 | |
3.5. Granule Friability (%)
Table 5.
Granule friability (%) of tablet mass before compression.
| Mesh# | F0 | F1 | F2 | F3 | F4 | F5 | |
| 14 | 0 | 0 | 0 | 0 | 0 | 0 | |
| 16 | 0 | 0 | 0 | 0 | 0 | 0 | |
| 20 | 0.88+0.01 | 0.28+0.02 | 0.49+0.62 | 0.65+0.04 | 1.33+0.10 | 0.80+0.89 | |
| 30 | 58.48+0.44 | 12.38+1.07 | 21.80+0.80 | 27.90+0.40 | 65.05+0.32 | 22.51+0.31 | |
| 40 | 25.85+0.53 | 68.851+0.48 | 64.96+0.86 | 54.05+0.05 | 16.59+0.35 | 56.44+0.30 | |
| 50 | 12.56+0.90 | 18.58+0.34 | 7.67+0.24 | 15.13+0.50 | 14.68+0.40 | 17.99+0.76 | |
| Pan | 2.36+0.02 | 5.42+0.55 | 5.07+0.25 | 4.29+0.28 | 3.23+0.18 | 2.55+0.24 | |
3.6. Physical Data of Paracetamol Tablet Formulations
Table 6.
Physical data of paracetamol tablet formulations.
| Test type | F0 | F1 | F2 | F3 | F4 | F5 | |
| Organoleptic | White, no odor, Uhamka logo | White, no odor, Uhamka logo | White, no odor, Uhamka logo | White, no odor, Uhamka logo | White, no odor, Uhamka logo | White, no odor, Uhamka logo | |
| Diameter (cm) | 1.32+0.00 | 1.32+0.00 | 1.32+0.00 | 1.32+0.00 | 1.32+0.00 | 1.32+0.00 | |
| Thicknss (cm) | 0.50+0.01 | 0.50+0.00 | 0.50+0.00 | 0.50+0.00 | 0.50+0.00 | 0.50+0.00 | |
| Hardness (kg) | 5.57+0.08 | 5.05+0.03 | 5.28+0.04 | 5.60+0.06 | 5.64+0.02 | 5.80+0.06 | |
| Friability (%) | 0.34+0.05 | 1.61+0.03 | 1.31+0.07 | 0.97+0.02 | 0.75+0.06 | 0.50+0.03 | |
| Disint. time (s) | 79+0.01 | 72+0.03 | 76+0.01 | 63+0.03 | 74+0.04 | 82+0.01 | |
| W. vari.(mg) | 710.26+2.53 | 710.85+4.90 | 710.56+4.22 | 709.49+2.68 | 711.44+2.79 | 711.60+2.33 | |
| W. dev. (%) | 0.30+0.27 | 0.58+0.41 | 0.52+0.31 | 0.29+0.25 | 0.32+0.25 | 0.28+0.18 | |
Disint. time: Disintegration time; s: second; W. vari.: Weight variation; W. dev.: Weight deviation; Thicknss: Thickness.
3.7. Chemical Data of Paracetamol Tablet Formulations
Table 7.
Chemical data of paracetamol tablet formulations.
| Test type | F0 | F1 | F2 | F3 | F4 | F5 | |
| Par. contn (%) | 99.85+0.14 | 102.92+0.06 | 98.84+0.28 | 99.27+0.17 | 101.71+0.19 | 101.86+0.08 | |
| C. hom. (%) | 99.88+0.12 | 102.91+0.13 | 98.84+0.04 | 99.27+0.10 | 101.75+0.11 | 101.80+0.03 | |
Par. contn: Paracetamol content; C. hom: Content homogeneity.
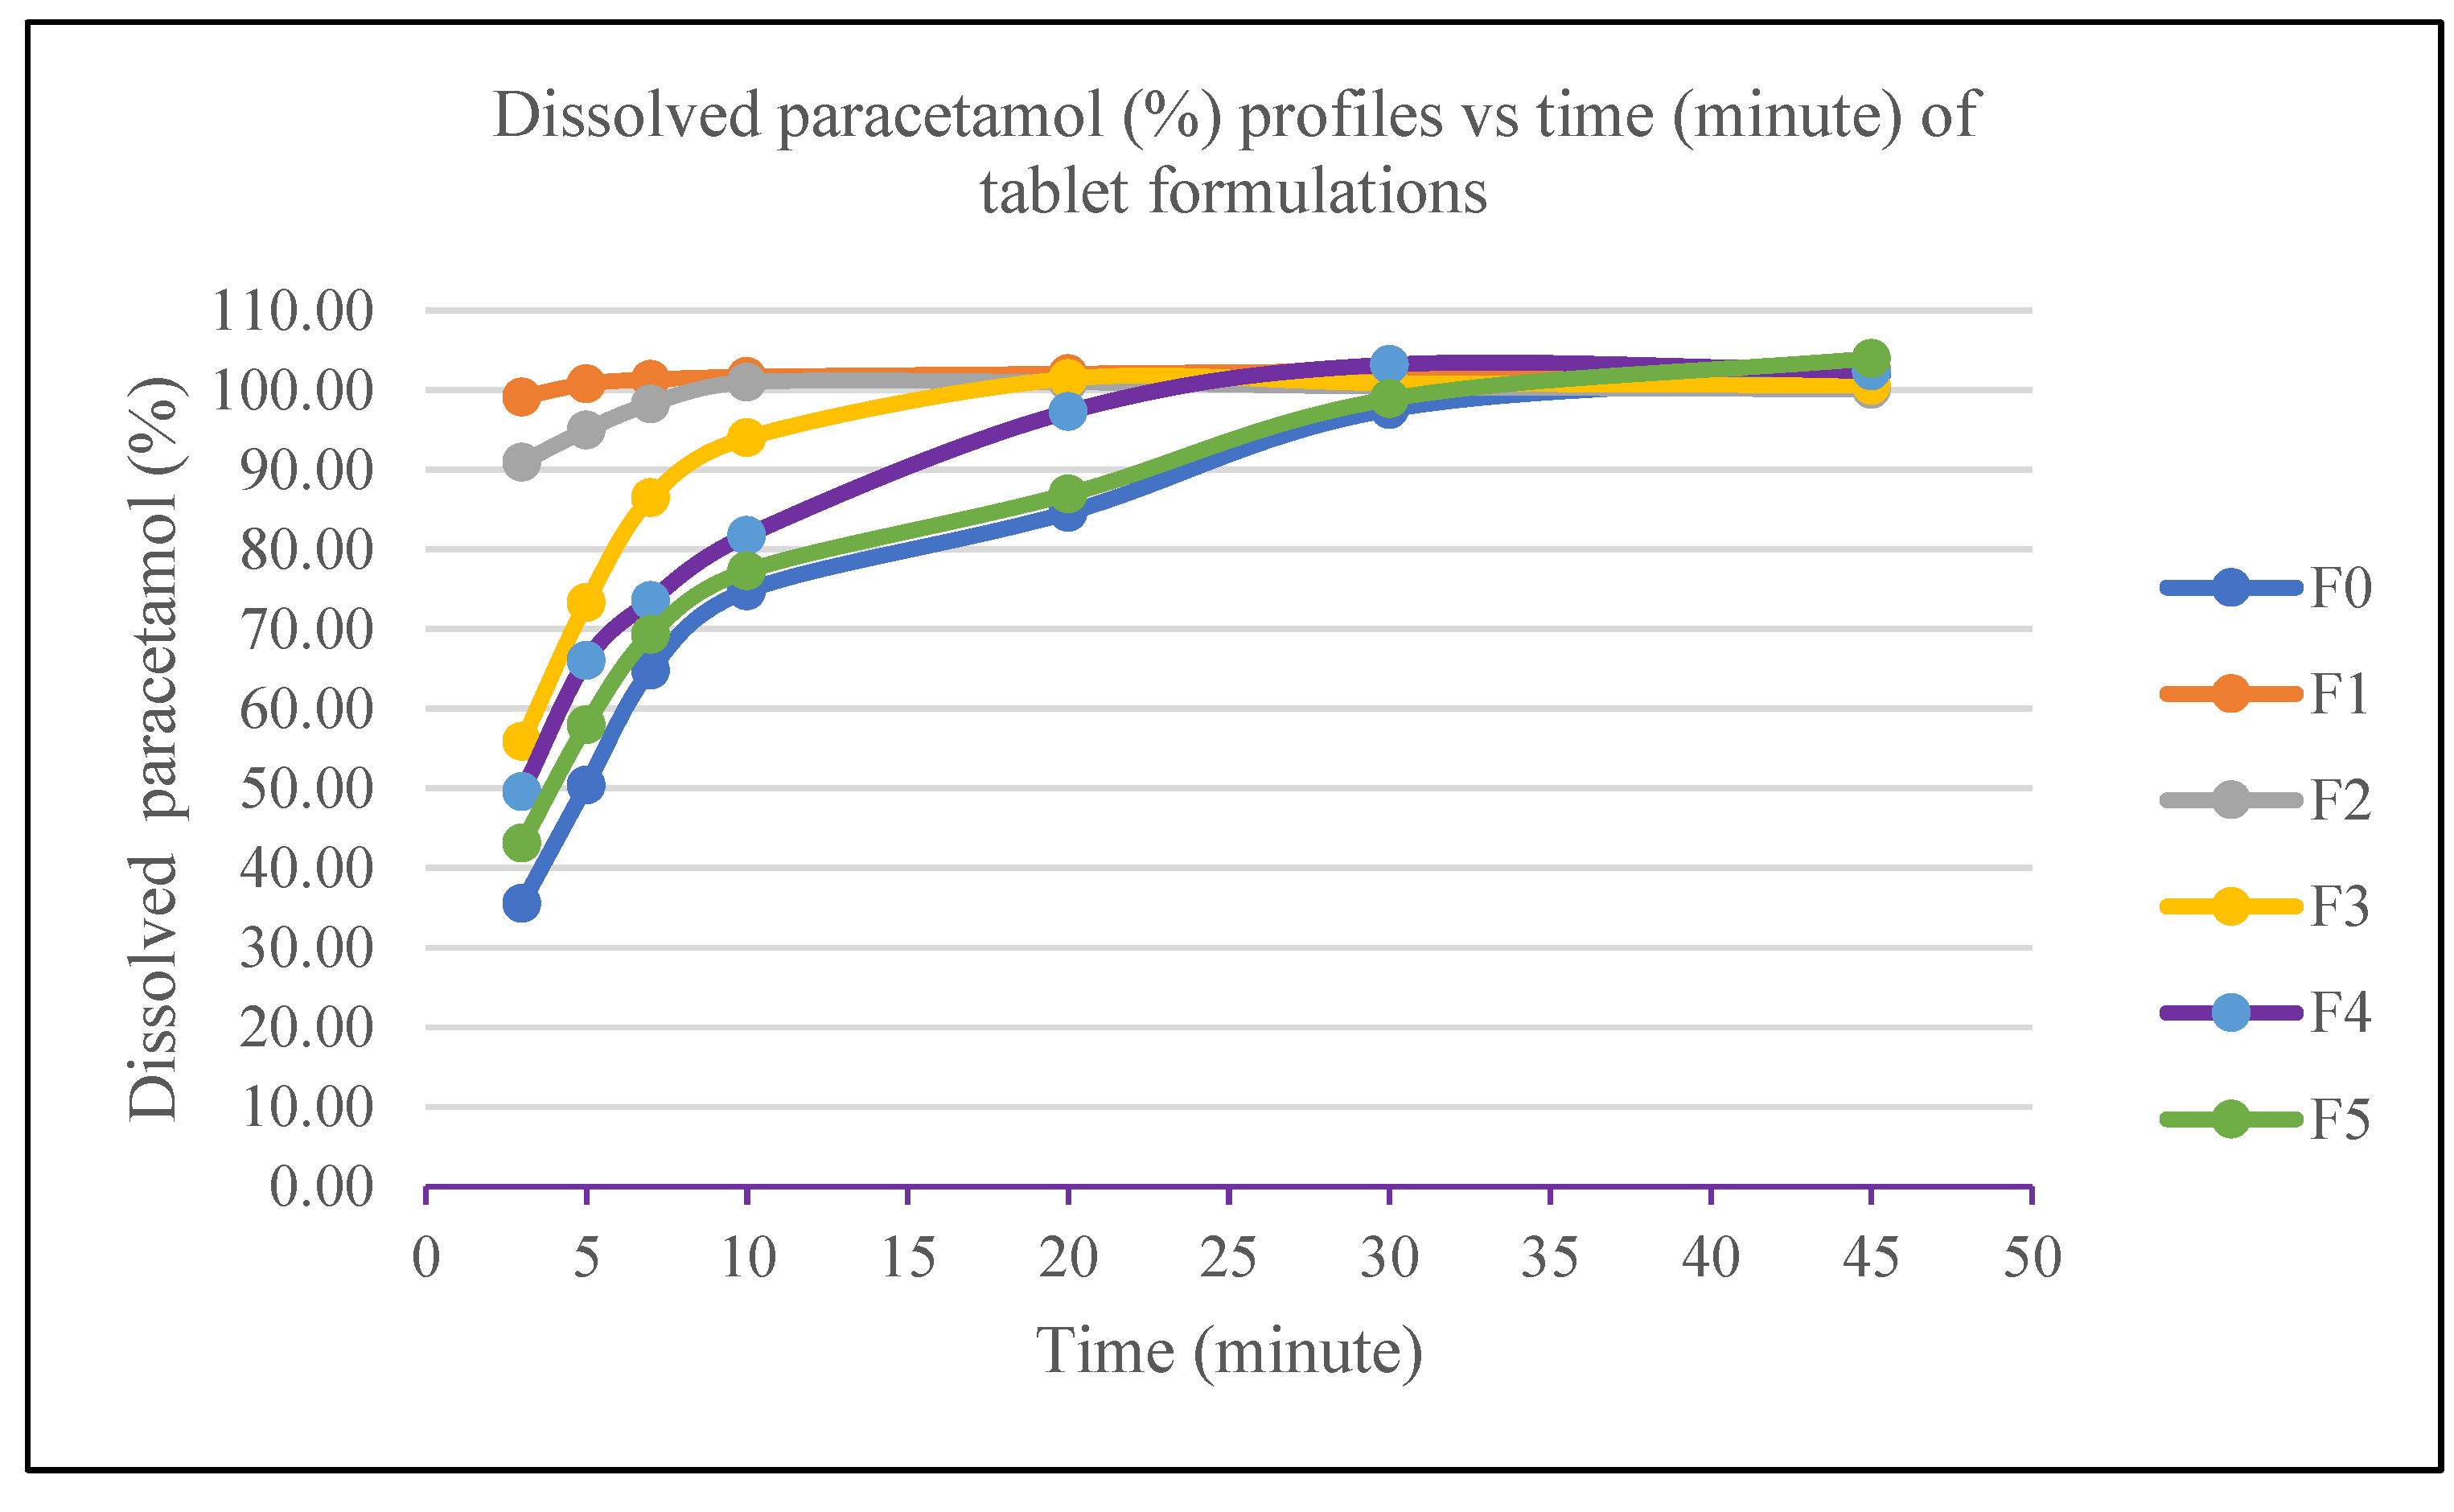
3.8. Dissolution Data of Paracetamol Tablet Formulations
Table 8.
Dissolution data of paracetamol tablet formulations.
| Time | Minute-3 | Minute-5 | Minute-7 | Minute-10 | Minute-20 | Minute-30 | Minute-45 |
|
Disso-lusion (%) |
F0 | ||||||
| 35.56+1.80 | 50.40+2.17 | 64.85+2.08 | 74.80+1.95 | 84.63+2.12 | 97.55+4,65 | 101.87+0.9 | |
| F1 | |||||||
| 99.13+0.84 | 100.80+0.69 | 101.34+0.78 | 101.68+0.82 | 102.06+0.79 | 102.41+0.83 | 102.79+0.9 | |
| F2 | |||||||
| 90.95+2.95 | 95.00+2.35 | 98.25+1.79 | 100.99+0.70 | 100.99+0.81 | 100.43+1.12 | 100.07+1.3 | |
| F3 | |||||||
| 55.90+6.14 | 73.32+4.99 | 86.48+4.00 | 94.02+2.19 | 101.43+0.83 | 100.89+0.95 | 100.58+1.2 | |
| F4 | |||||||
| 49.57+1.37 | 66.06+1.63 | 73.57+1.99 | 81.76+1.85 | 97.29+2.44 | 103.20+0.59 | 102.41+1.0 | |
| F5 | |||||||
| 43.10+2.74 | 57.98+5.83 | 69.34+2.83 | 77.29+4.88 | 86.95+2.74 | 98.90+2.47 | 103.99+0.6 | |
Dissol.: Dissolusion.
Figure 13.
Dissolved paracetamol (%) profiles vs time (minute) of tablet formulations.
3.9. Dissolusion Efficiency (%)
Table 9.
Dissolution efficiencies of paracetamol tablets.
| Parameters | Dissolusion efficiency (%) | ||||||
| F0 | F1 | F2 | F3 | F4 | F5 | ||
| Sample size | 18 | 18 | 18 | 18 | 18 | 18 | |
| Average | 78.79 | 95.88 | 95.01 | 90.53 | 86.09 | 80.89 | |
| SD | 0.67 | 0.19 | 0.47 | 0.79 | 0.70 | 1.26 | |
| RSD | 0.85 | 0.20 | 0.49 | 0.87 | 0.81 | 1.55 | |
3.10. Discussion
3.10.1. Preparation of Phosphate Pregelatinized Cornstarch
To prepare phosphate pregelatinized cornstarch, cornstarch must first be modified into pregelatinized cornstarch. This method involves making a cornstarch paste at 72 °C and drying it with a double drum dryer at a temperature above the gelatinization point of cornstarch, which is 80 °C. During paste formation, the starch granules swell. When the paste passes through the double drum dryer, the swollen granules break down, releasing amylose and amylopectin. This breakdown damages the granule structure and disrupts hydrogen bonds, making it easier for water and phosphate molecules to penetrate the starch.[29,30]
In this study, the addition of phosphate reagents led to the formation of starch diester phosphate. After the pregelatinization process, the addition of disodium hydrogen phosphate (Na₂HPO₄) allows it to penetrate the starch molecules and form intramolecular bridges that connect them. These bonds are more durable than the hydrogen bonds between the hydroxyl groups in starch.
The reaction's pH is crucial, as each reagent requires a specific pH to produce the desired product. Diester and triester phosphates generally form within a pH range of 8 to 12. Meanwhile, this study utilized Na₂HPO₄, which has a pH of 9. Therefore, before adding Na₂HPO₄ during the preparation of phosphate pregelatinized cornstarch, the starch paste was first adjusted to pH 9 using NaOH to optimize the reaction.[9,31]
3.10.2. Characterization of Phosphate Pregelatinized Cornstarch
This study began with an examination of the microscopic form of cornstarch according to that contained in the Indonesian Pharmacopoeia edition IV, namely in the form of polygonal, angular, or round grains which, when viewed under polarized light, appear black cross-shaped, cutting at the hilus.[11,32]
In the pregelatinization process, the starch granules interact with water and heat, which causes the granules to swell and break so that amylose and amylopectin come out of the granules. Initially, the starch granules have the property of reflecting polarized light so that under the microscope, they look like black and white crystals, and this property is called birefringence. When the granules break, this birefringent property will disappear. Figure 1 and 2 proves that the pregelatinized cornstarch has changed its structure with the pregelatinization process.[33,34]
Figure 3, Figure 4 and Figure 5 show the microscopic shapes of the phosphate pregelatinized cornstarch, which looks grouped and irregular. This shape occurs due to the rebinding of amylose and amylopectin molecules, previously broken down by the pregelatinization process involving the phosphate group. As a result, the formation of a phosphate diester bond, or the molecules undergo cross-linking.[31]
The results of the viscosity examination show that the cornstarch dispersion has very low viscosity, so the viscosity is close to water. Cornstarch is practically insoluble in water and has few hydroxyl groups that can bind to water, so its viscosity value is small or undetectable. Pregelatinized cornstarch has a higher viscosity value than phosphate pregelatinized cornstarch because it contains more hydroxyl groups, allowing it to bind with water through hydrogen bonding, which increases viscosity. Meanwhile, phosphate pregelatinized cornstarch has a lower viscosity value than pregelatinized cornstarch because the hydroxyl group in phosphate pregelatinized cornstarch links to the phosphate group. Although the viscosity is lower, the bond of the starch diester phosphate is more durable, has a more stable viscosity, and when used in making granules, will produce strong granules, but is easily dispersed in water. Phosphate pregelatinized cornstarch with a concentration of Na2HPO4 of 0.3% was used as a binder because it has a higher viscosity value than Na2HPO4 concentrations of 0.25 and 0.35%. High viscosity will produce strong granules because they have a strong bond between the particles that form the granules. Table 1 showed the results.[35]
The chemical identification test confirmed that the white powder used was starch (Table 1). The test used the iodine reagent and produced a light purple color. In contrast, pregelatinized cornstarch phosphate reacted to form a blue color. The difference in color results from variations in the length of the amylose chains present in different starches—the longer the amylose chain, the darker the resulting color.[36]
The acidity level examination showed that cornstarch, pregelatinized cornstarch, and phosphate pregelatinized cornstarch met the requirements, ranging from 4.5 to 7.0 (Table 1). The pH increases in pregelatinized corn starch phosphate due to the neutralization process (addition of acid reagents in the manufacture).[35]
The results of the whiteness examination showed that phosphate pregelatinized cornstarch had a better whiteness percentage than cornstarch and pregelatinized cornstarch (Table 1). The more phosphate reagents used, the whiter the starch obtained. This improved color is due to PO4-3 ions, which block the reducing sugar group, inhibiting the reaction with free amino acids, which can produce brown pigments.[37]
The results of the loss on drying (LOD) examination of cornstarch, pregelatinized cornstarch, and phosphate pregelatinized cornstarch are within the requirements, namely, not more than 15% (Table 1). The LOD test aims to determine the starch water content. The variation in LOD values among different starches is because of the rotation speed of the double drum dryer during the drying process. Rotation that is too fast results in uneven starch breakdown and the formation of thin sheets like wood shavings, but if the rotation decreases, it will produce fine powder.[38]
3.10.3. Examination of Paracetamol Raw Materials
The paracetamol sample exhibited organoleptic properties characterized by a white crystalline powder, an odorless nature, and a slightly bitter taste. The sample is soluble in boiling water and 1N sodium hydroxide and is easily soluble in ethanol (Table 2).[8]
The wavelength determination used the range of 200-400 nm (Table 2). The results obtained were a maximum absorption wavelength of 257.2 nm with 0.1N NaOH solvent and a maximum absorption wavelength of 243 nm with phosphate buffer solvent. This result complies with Clarke (1986), who stated that paracetamol has a wavelength of 257 nm in alkaline solvents, and the Indonesian Pharmacopoeia edition IV, which states that paracetamol is dissolved in a phosphate buffer medium of pH 5.8 and measured at a wavelength of 243 nm. This result proves that the sample tested is paracetamol.[32,39] No interferences from solvent and excipient absorptions on selectivity tests (Figure 6, Figure 7, Figure 8, Figure 9 and Figure 10).
Figure 6.
UV-spectra (0-400 nm) of paracetamol in NaOH 0.1N with the peak at 257 nm.
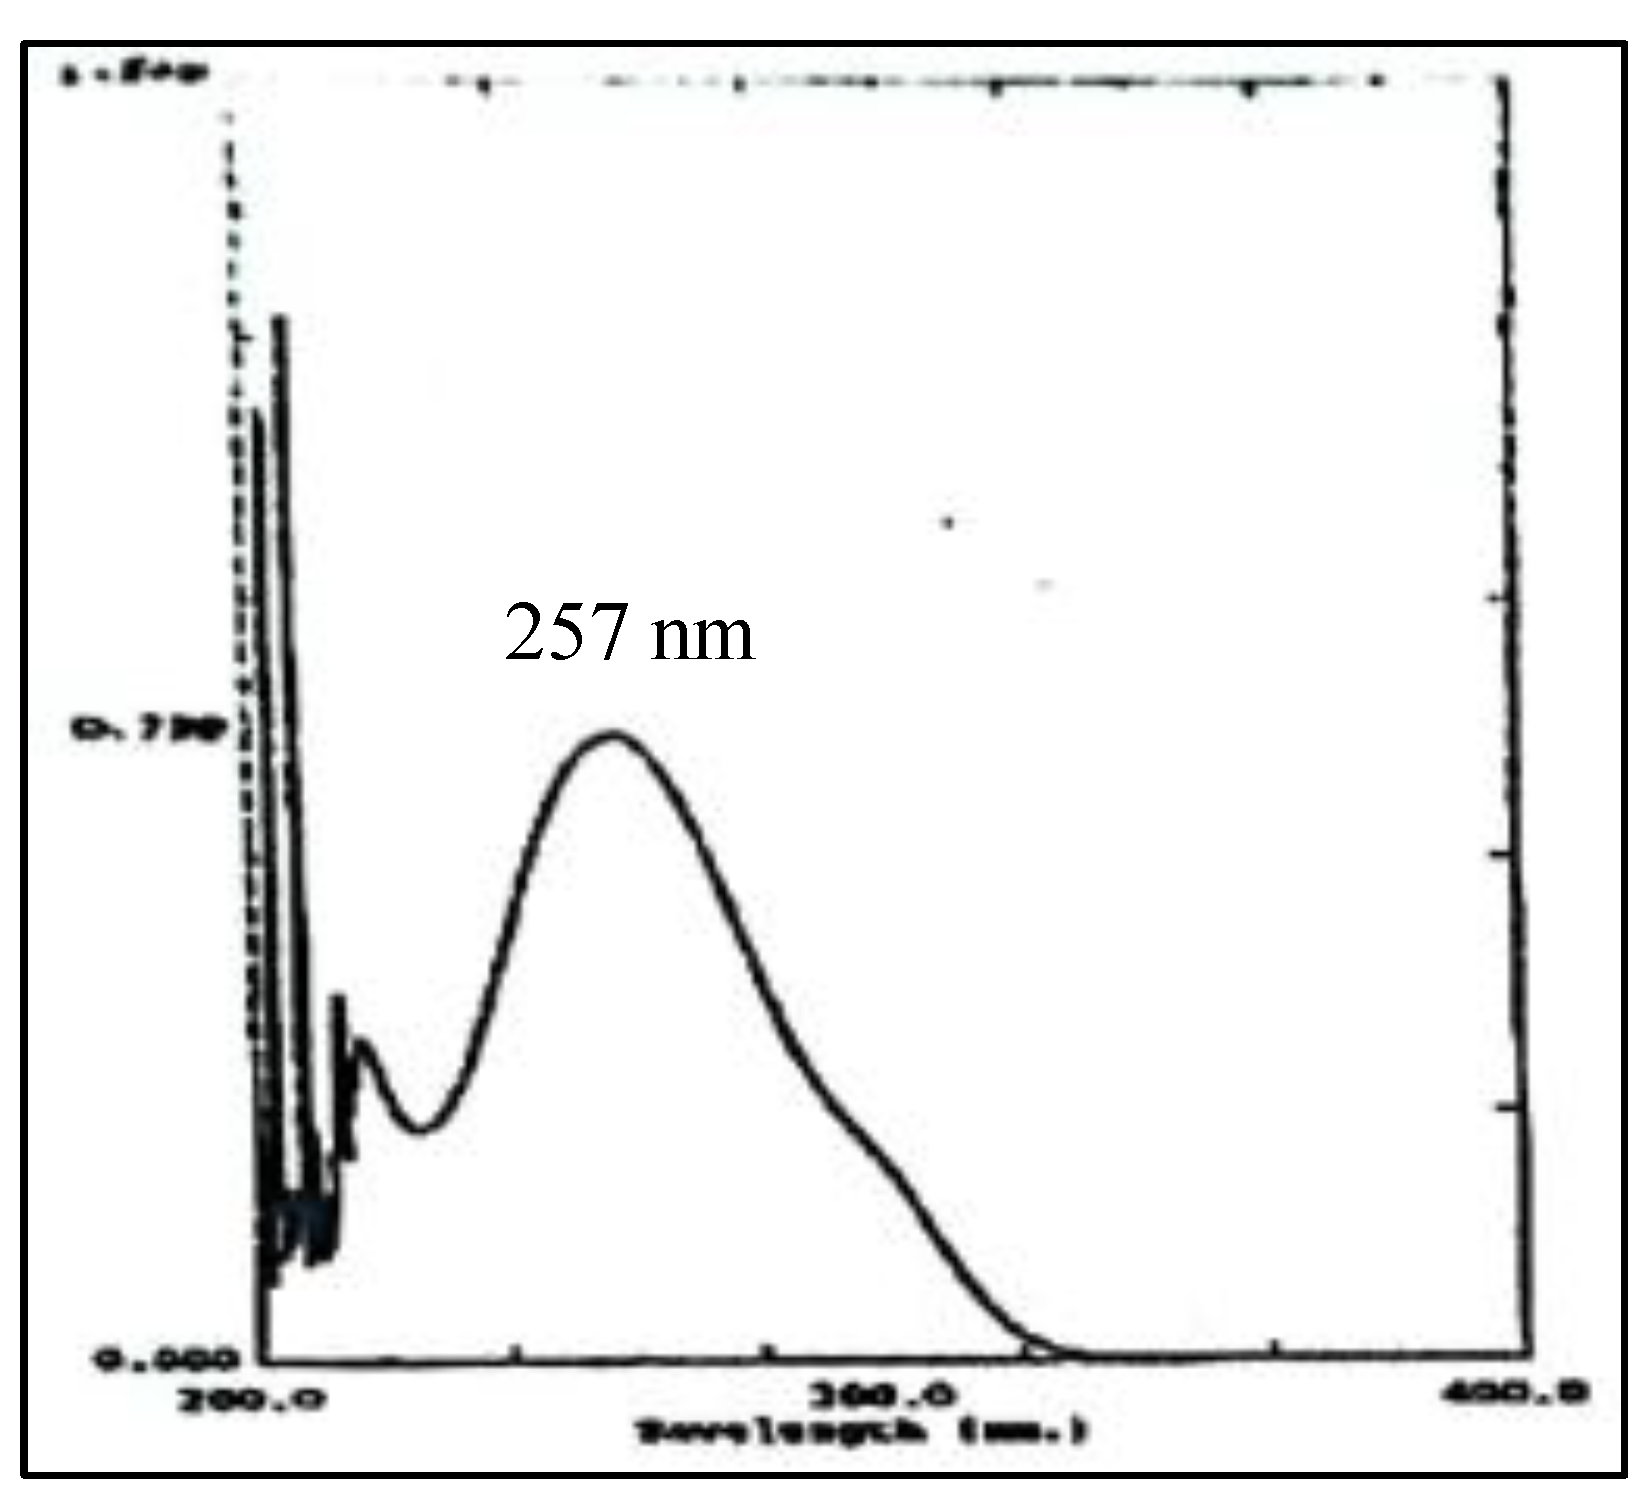
Figure 7.
UV-spectra (0-400 nm) of paracetamol in phosphate buffer pH 5.8 with the peak at 243 nm.
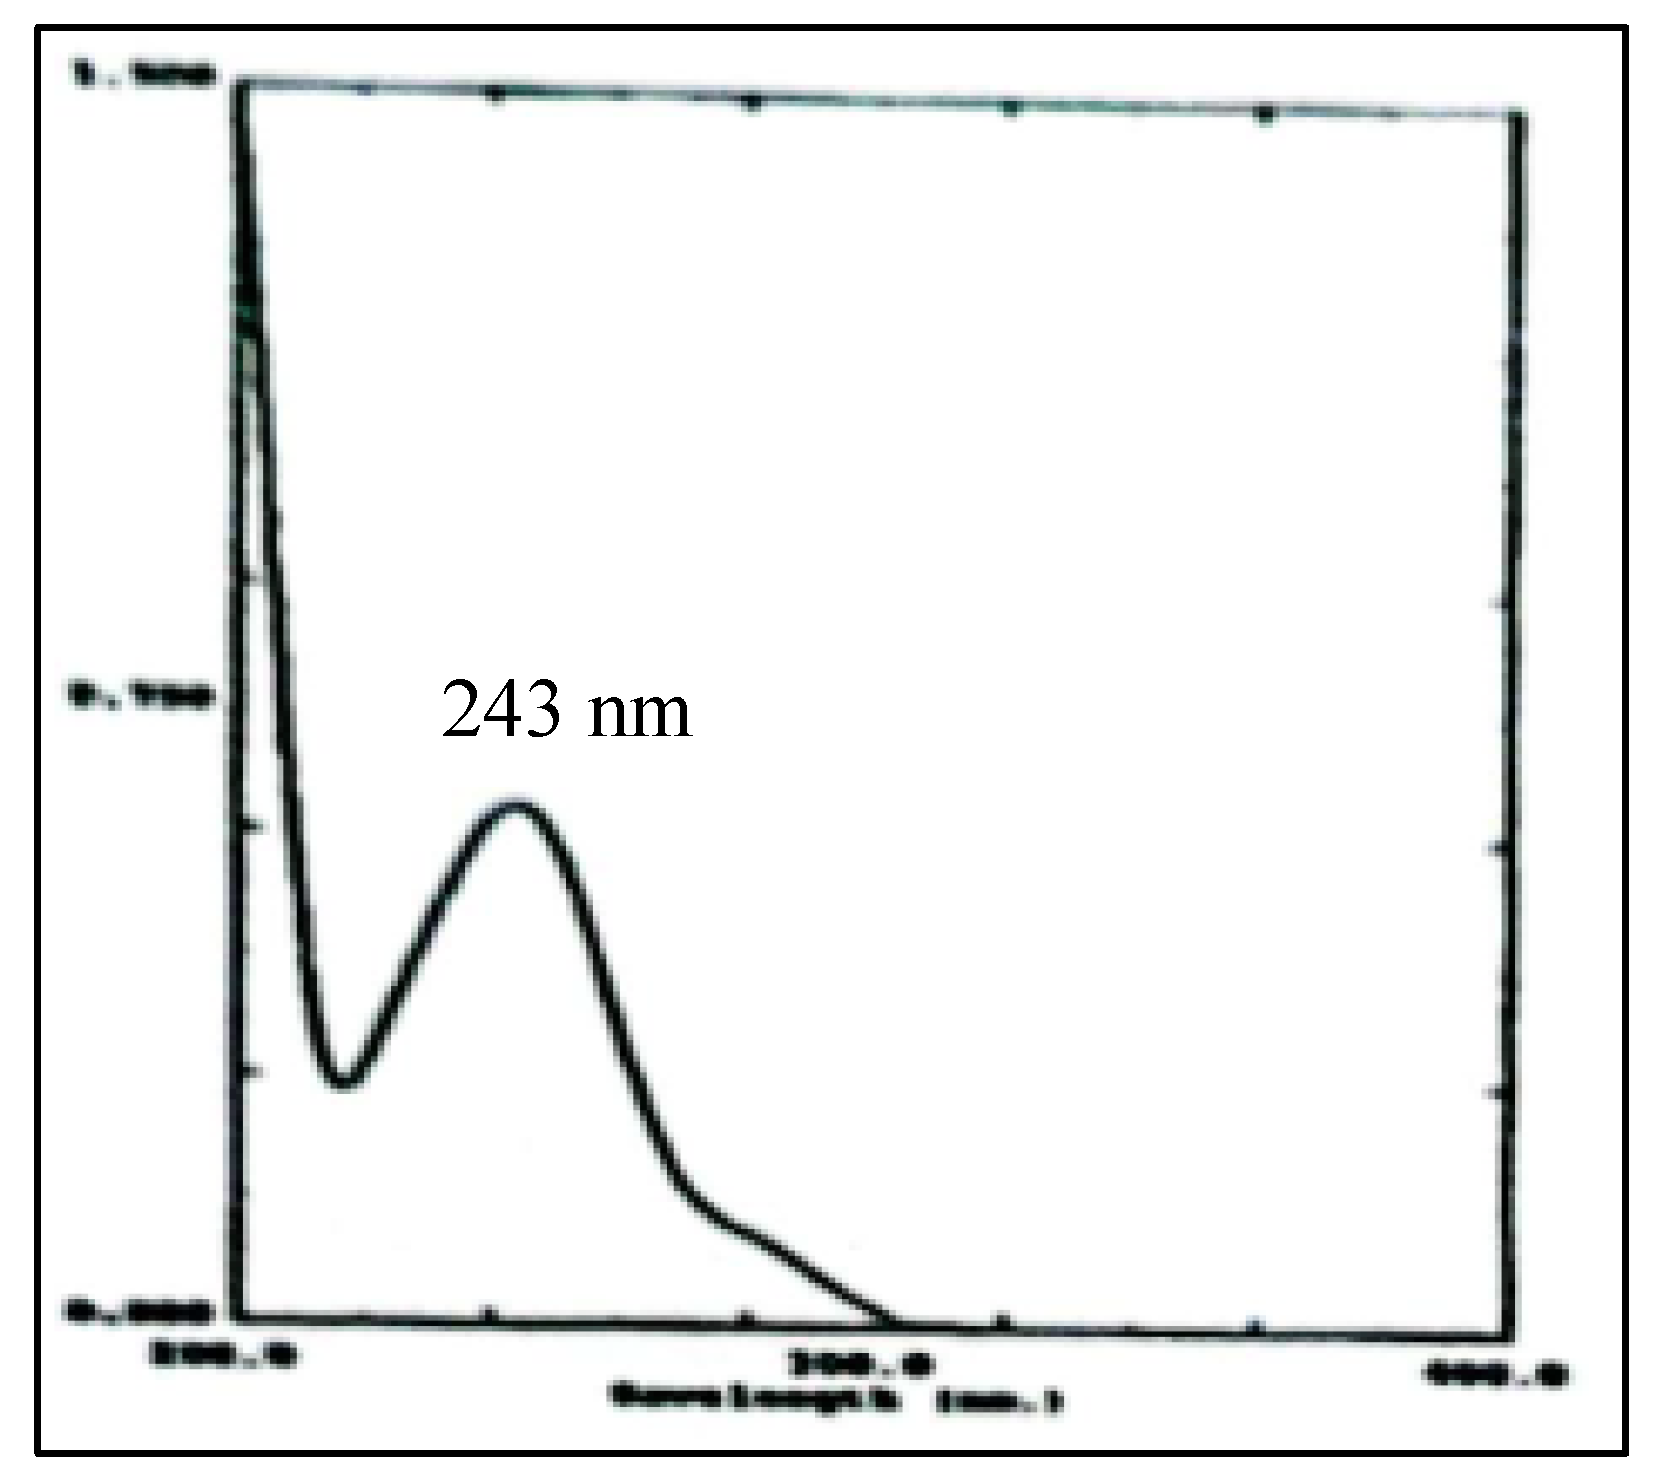
Figure 8.
UV-spectra (0-400 nm) of specificity test of NaOH 0.1N.
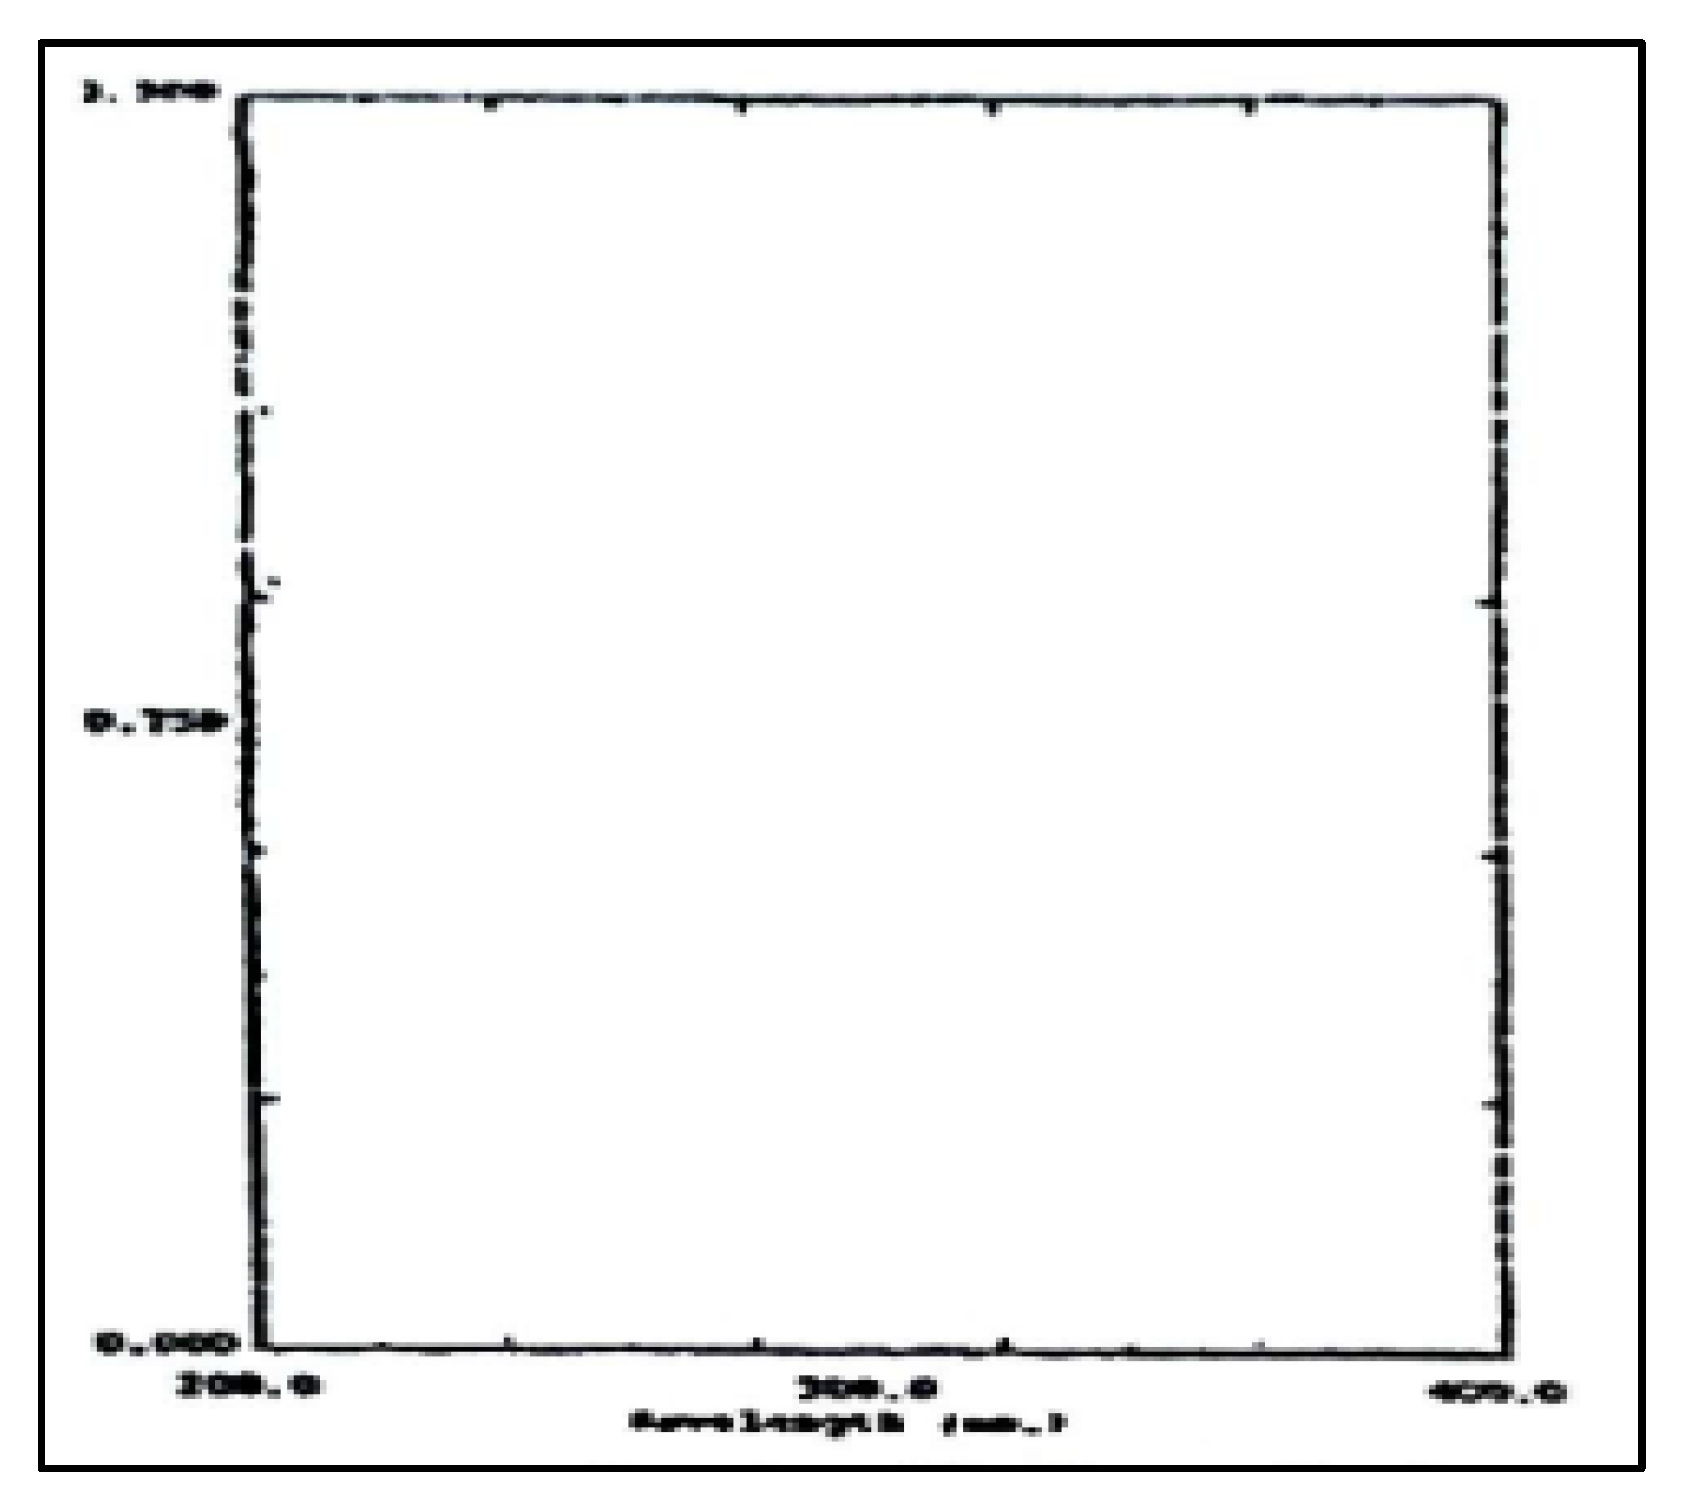
Figure 9.
UV-spectra (0-400 nm) of specificity test of excipient in NaOH 0.1N.
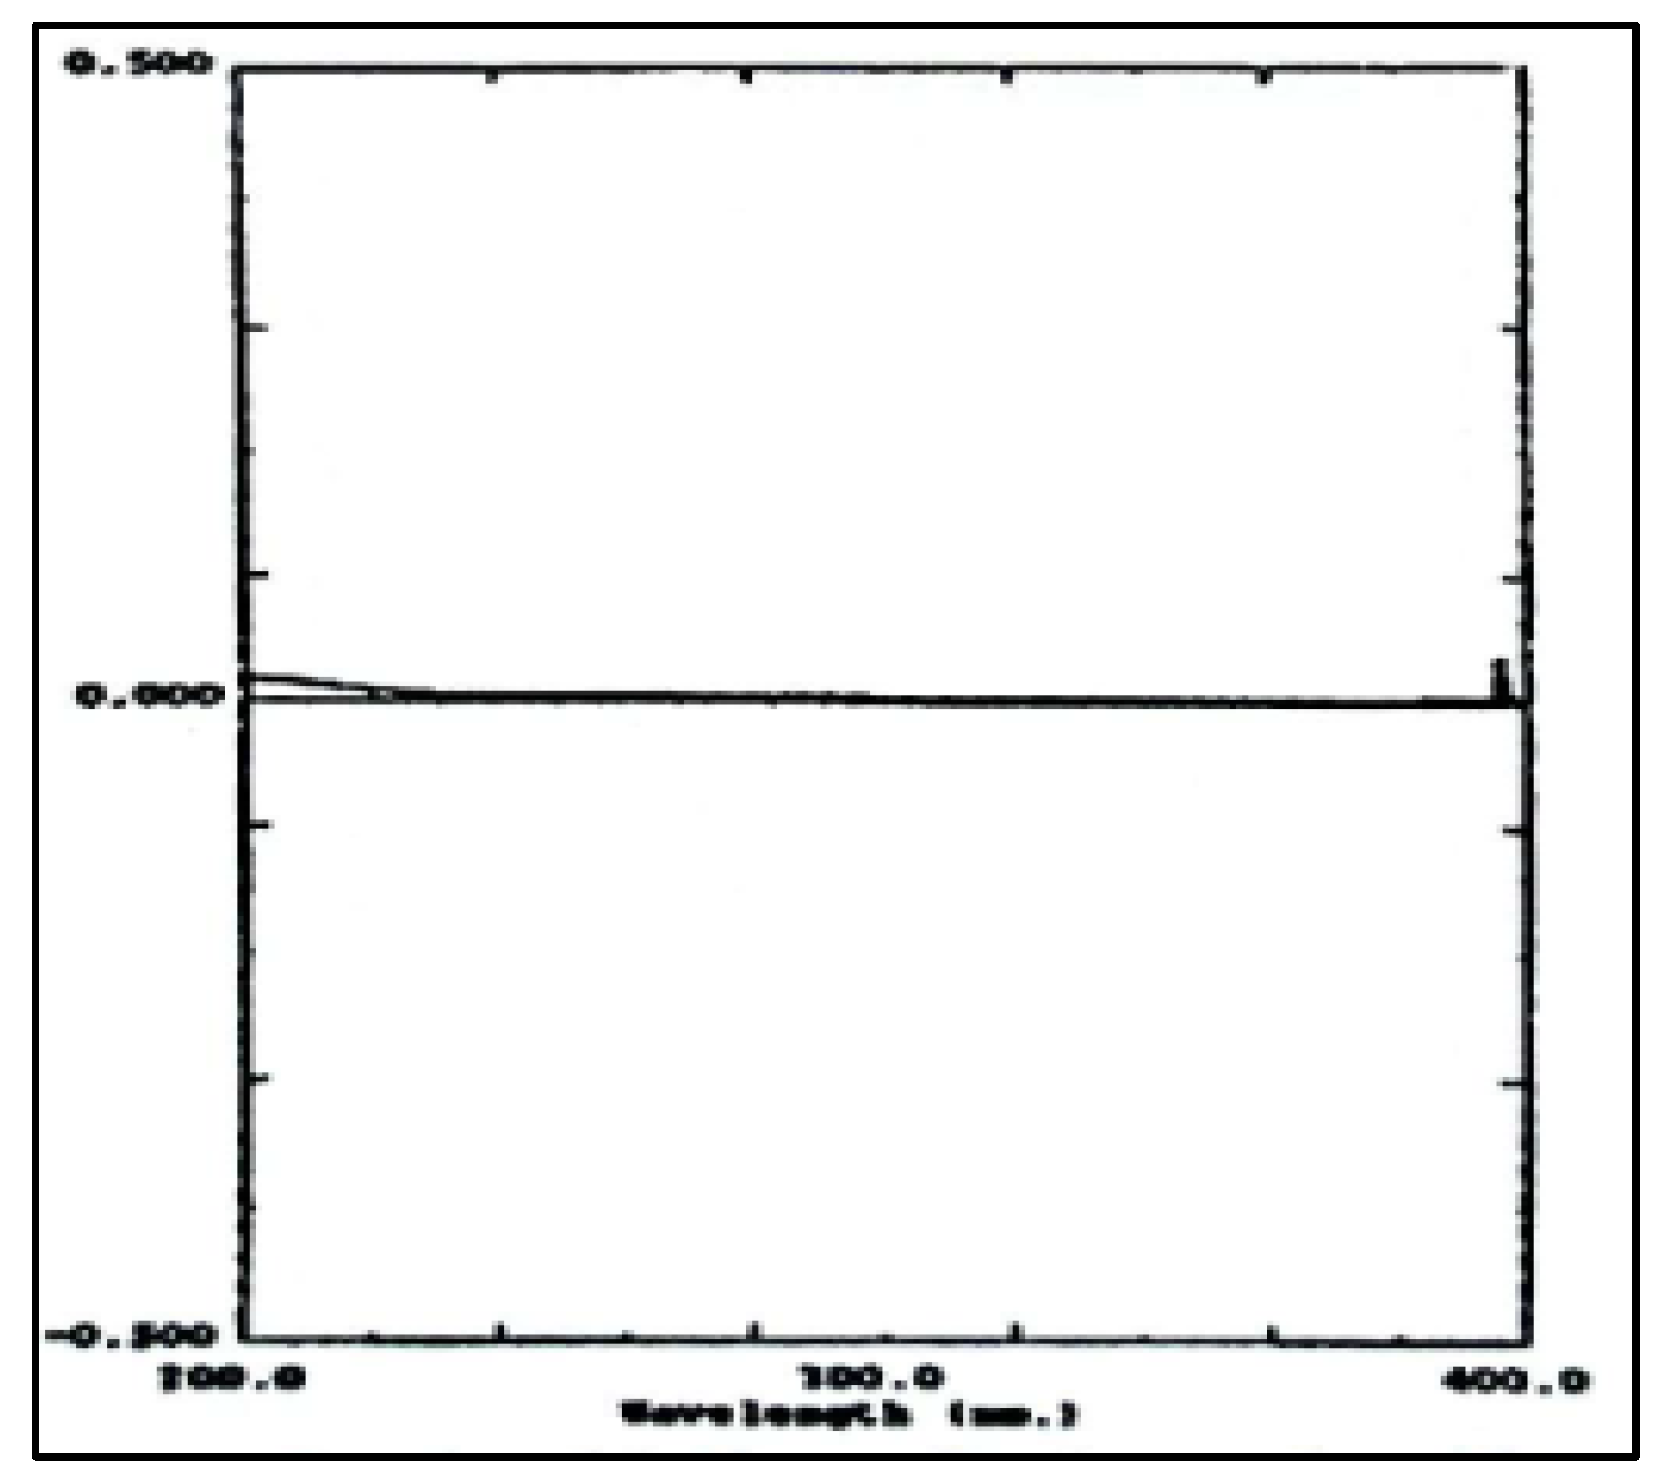
Figure 10.
UV-spectra (0-400 nm) of specificity test of paracetamol and excipient in NaOH 0.1N.
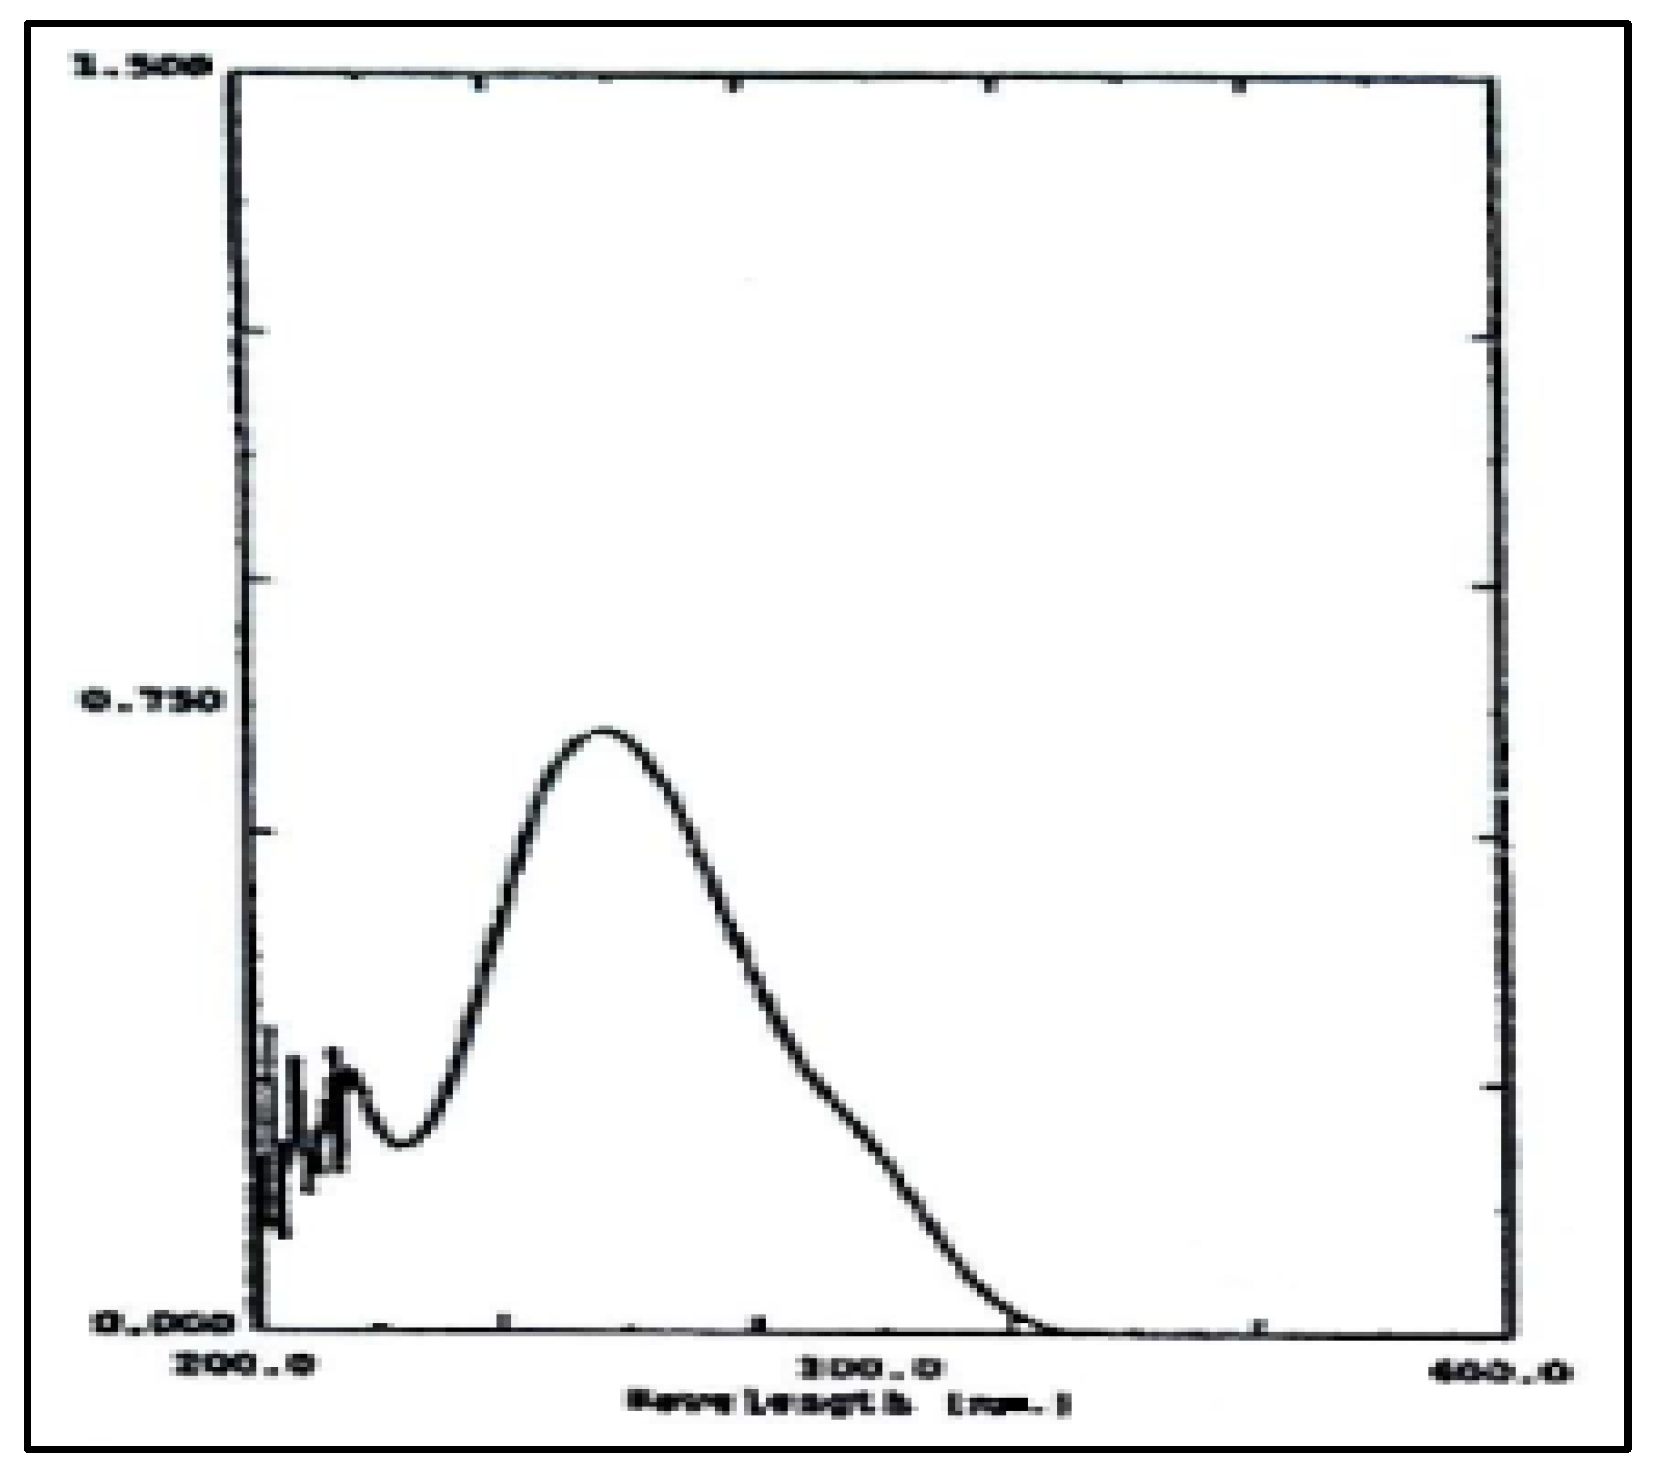
Figure 11.
UV-spectra (0-400 nm) of specificity test of paracetamol in NaOH 0.1N.
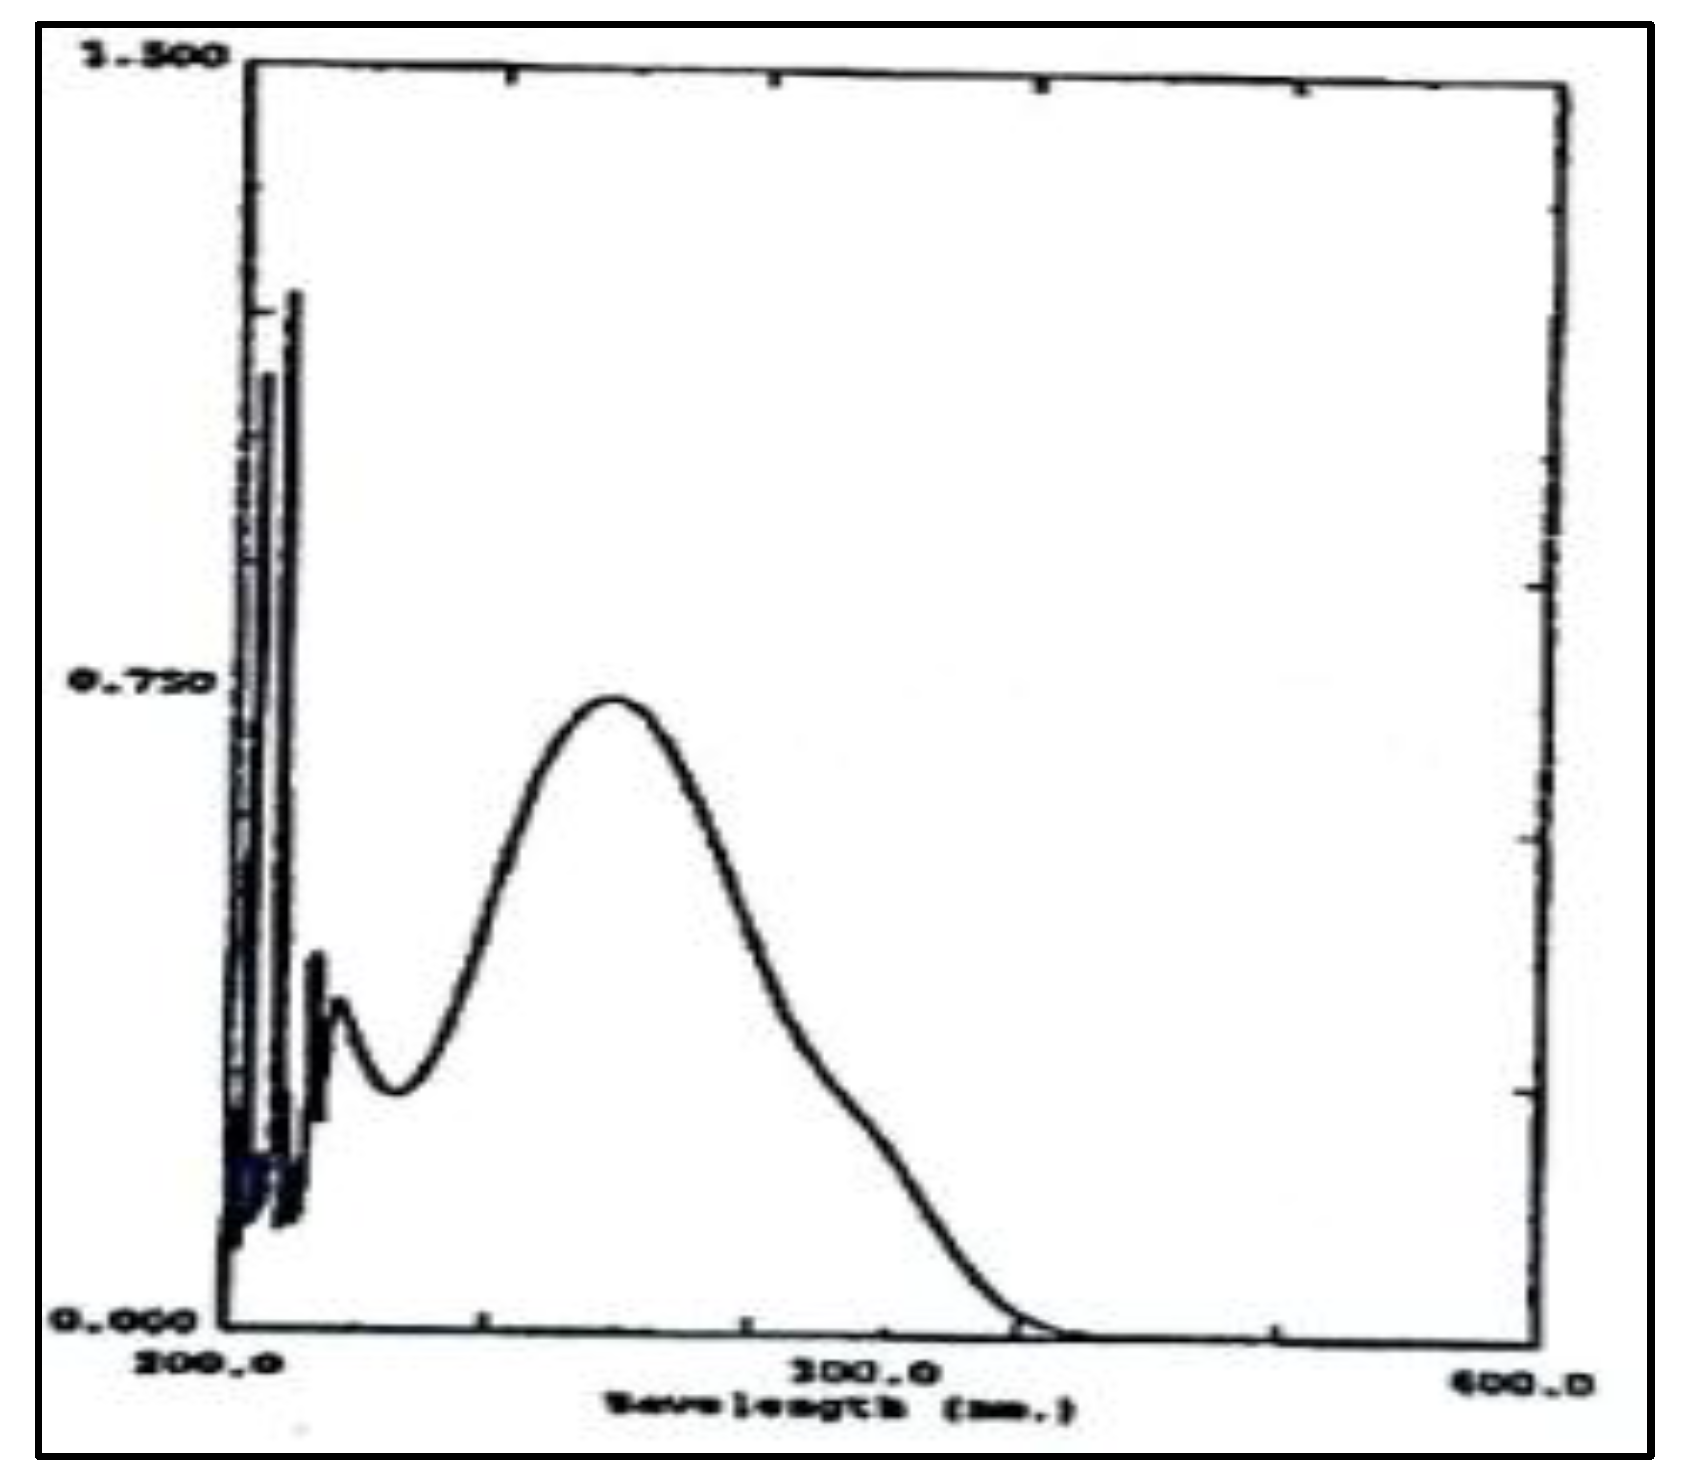
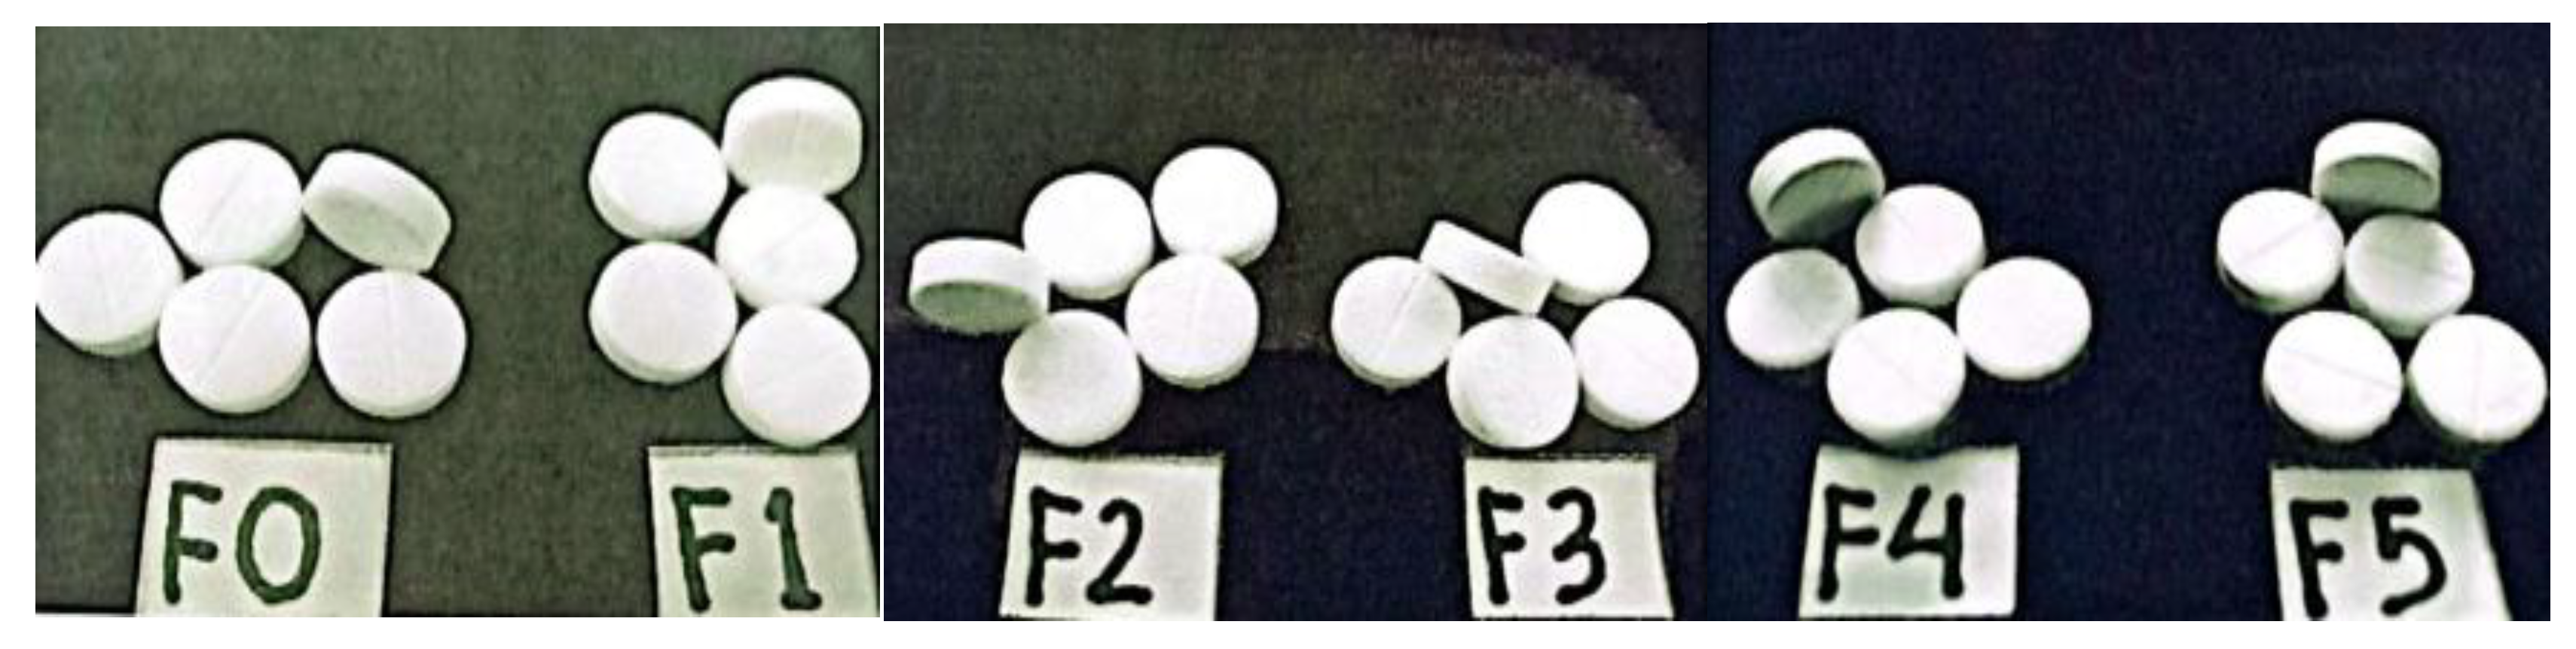
Figure 12.
Tablet samples of formulations F0, F1, F2, F3, F4, and F5.
Paracetamol does not have a flow rate and angle of repose because the powder is sticky, so it cannot flow freely in the test funnel. Compressibility tests evaluate how effectively a material can be compacted into tablets. The best compressibility ranges from 5-15%. The compressibility of paracetamol ranges from 23.59%, which shows that paracetamol has a poor compressibility percentage value, so it requires excellent adjuvants to improve the compressibility percentage (Table 2).[40]
3.10.4. Tablet Preparations
Based on the literature, the concentration of cornstarch as a binder is 5-25%, and for pregelatinized cornstarch, 5-10%. Previous studies utilizing various types of phosphate pregelatinized cornstarch employed concentrations ranging from 1-5%.[41]
After testing phosphate pregelatinized cornstarch at a 3% concentration, the tablets produced did not exhibit sufficient strength due to their high fragility, although they did meet dissolution requirements. To enhance tablet integrity, a higher concentration was necessary. Thus, this study used phosphate pregelatinized cornstarch as a binder at concentrations ranging from 3 to 7%, with the 7% concentration as the comparative formula (Table 1).
The preparation process of paracetamol tablets begins by weighing all the ingredients. Then, mix paracetamol, lactose, and cornstarch until homogeneous (Mass I). In another container, the modified cornstarch is dissolved in cold water until it forms a paste. Pregelatinized cornstarch requires 7 times the weight of the starch, while phosphate pregelatinized cornstarch requires 4.5 times the weight of the starch.
If the water exceeds the limit, the mass will become soft and cannot be sieved. The paste is mixed in Mass I and stirred until homogeneous. The moist mass is sieved with an 8-mesh sieve, then dried in an oven at 50 °C for 8 hours. The dry granules are sieved again with an 18-mesh sieve. In a different container, primogel, talcum, and magnesium stearate are mixed, then reweighed according to the weight of the dry granule mass. The external phase is mixed into the dry granule mass and stirred until homogeneous. The mass is ready to compress.[42]
3.10.5. Granule Evaluation
Testing begins with checking the water content. Quality granules have a residual moisture content of 3-5%. If the moisture content of the granules is more than 5%, the granules will become a place for microorganisms to grow, while if the moisture content of the granules is below 3%, the granules will become brittle and the strength of the binding material will decrease so that the granules can turn into powder. From the test results obtained, all formulas meet the requirements. Table 3 shows the water content of granules.[43]
The purpose of checking the water content is to measure the remaining water in the sample, whereas the loss on drying (LOD) test determines both the water content and the presence of volatile substances (Table 3). Therefore, the loss on drying test can be considered equivalent to the water content test.[44]
Before being compressed into tablets, granules must first undergo a flow rate test. This test determines the time required for 100 g of granules to pass through an aluminum funnel, which correlates with their ability to flow from the hopper to the die during tablet compression. The data in Table 3 indicates a decrease in flow time from F1 to F5, attributed to the granules' increasing compressibility, resulting in shorter flow times. The repose angle tests show that all formulas except F1 have perfect repose angle values. The data on repose angle is presented in Table 3.[45]
Granules are fragile if their brittleness value is more than 20%. The results showed that F1, F2, and F3 have fragile granules. These are due to the use of insufficient binders (Table 5).[46] Granule friability can be influenced by particle size distribution (PSD). For example, granules with a broader PSD or smaller particles may be more prone to breaking or crumbling under stress. Understanding the relationship between PSD and friability is crucial for optimizing granule production and ensuring the quality of the final product.[47]
3.10.6. Tablet Evaluation
Tablet evaluation includes physical and chemical tests. Physical evaluation includes tablet appearance, size uniformity, hardness, friability, disintegration, organoleptic, and weight uniformity. Determination of chemical content, weight variation, and dissolution is part of the chemical evaluation.[50]
a. Physical evaluation of tablets
The evaluation begins with the general appearance and organoleptic properties of each formula. The results showed that the tablets were white in color, odorless, had a smooth and shiny surface, a slightly bitter taste, and had the UHAMKA logo.[51,52]
The diameter of all tablet formulas remains constant because the same tableting machine is used, with the tablet's diameter determined by the punch and die size. However, tablet thickness varies due to compression pressure, granule particle size, and the quantity of granules entering the die. All tablet formulas meet the standards outlined in the Indonesian Pharmacopoeia Edition III, which specifies that the diameter should not exceed three times the thickness and should be at least 4/3 times the thickness of the tablet (Table 6).[51,52]
Tablet friability is a parameter that shows the strength of the tablet; namely, the tablet can erode or flake, especially the resistance of the tablet to shocks, friction, packaging, and distribution. Friability testing on F1 and F2 did not meet the requirements because they exceeded the specified percentage. While F0, F3, F4, and F5 have friability that meets the requirements. This difference is due to the amount of binder lacking in F1 and F2, so the compactness decreases. A good tablet has a percentage of friability below 1% (Table 6).[51,52]
Tablet disintegration time is another parameter to test the physical durability of the tablet. This test is a parameter to see the ability of the tablet to disintegrate into fine particles so that it is ready to dissolve and be absorbed in the body. According to the Indonesian Pharmacopoeia edition IV, uncoated tablets must have a disintegration time of less than 15 minutes. The test results show that all formulas had a disintegration time of less than 15 minutes. The values obtained from each formula indicate no significant correlation between the increase in binder concentration and the tablet disintegration time (Table 6).[51,52]
The results of the tablet hardness test indicate that each formula meets the requirements. A good tablet has a hardness of 4-8 kg. Tablet hardness is a parameter of tablets in withstanding physical shocks that cause the tablet to break. The values obtained from each formula show that the tablet hardness increases, although the difference is not too significant with the addition of the concentration of the binder. These are due to the relationship between the contents of the die and the pressure that determines the hardness of the tablet (Table 6).[51,52]
The tablet weight variation test showed that all formulas met the test requirements because the weight deviation percentage was less than 5% (Table 6).[51,52]
b. Tablet chemical evaluation
The test begins with a content examination using a UV-Vis spectrophotometer. The content determination test is to know whether the tablets made meet the requirements specified by the Indonesian Pharmacopoeia IV. The general requirements for levels in paracetamol tablets are not less than 90.0% and not more than 110.0% of the amount stated on the label. The use of 0.1N NaOH medium in determining the content of paracetamol tablets is by the requirements stated in the British Pharmacopoeia volume II, while the use of a wavelength of 257 nm is by the results of the examination of paracetamol raw materials and by the wavelength listed in Clarke's book (1986). All tablet tests showed that all formulas met the requirements for determining the content (Table 7).[31,39,53]
The test results of the weight variation concluded that all formulas meet the requirements set before. According to the Indonesian Pharmacopoeia IV, weight variation is used for soft capsule products containing liquids or in products containing 50 mg or more of active ingredients, which is 50% or more of the weight of the preparation unit calculated from the determination of content with the assumption that the active ingredient is homogeneous (Table 7).[31]
Dissolution testing determines the amount of active ingredients that dissolve within a specific time according to the requirements. Dissolution test of paracetamol tablets using type 2 alt with phosphate buffer medium pH 5.8, as much as 900 mL, speed 50 rpm, at 37 °C for 45 minutes. The tolerance (Q) set for C8H9NO2 at 3 minutes is 80% of the amount stated on the label. The dissolution results at a specific time were used to create a dissolution profile curve between the percent dissolved substances and time (minutes), the result of which was that all formulas at 30 minutes had met the requirements, namely, not less than Q + 5% (Table 8).[31]
The dissolution efficiency percentage was obtained from the percentage data after correction in advance. Calculation with a correction factor will provide the actual percentage of dissolution levels because it does not depend on the experimental conditions, including taking the test solution from the chamber and adding new medium. The average of dissolution efficiency was not too different between F1 and F2. Although both have different dissolution profiles, it turns out that the area under the curve is not much different. The binding power of the two tablets is insufficient due to the concentration of phosphate pregelatinized cornstarch at 3% and 4%, respectively (Table 9). This concentration is considered less effective at binding the active substance in the granules, causing the substance to be released and dissolve immediately in the medium.[54]
There is a difference in the percentage of dissolution efficiency between F5 (using phosphate pregelatinized cornstarch) and F0 (using pregelatinized corn starch) as a binder with the same concentration of 7%. Therefore, phosphate pregelatinized cornstarch has properties that are easier to bind with water, forming a gel, and the dissolution test treatment, such as stirring and increasing the temperature, the gel bond weakens and releases the active substance faster, so that paracetamol can dissolve in the medium (Table 9).[55].
3.10.7. Statistical Analysis
Statistical analysis using the SPSS (Statistical Product and Service Solution) program starts with the Kolmogorov-Smirnov, Kruskal-Wallis non-parametric, and Daniel multiple tests.[56]
The Kolmogorov-Smirnov test assesses whether the data follows a normal distribution. Based on the asymptotic significance column, each formula has a significance value greater than 0.05 (α= previously predetermined), indicating that the dissolution efficiency data has a normal distribution.
The homogeneity of variance test aims to see whether the five formulas have the same variance. Judging from the significant value (0.000) < α (0.05), it shows that the population of dissolution efficiency data does not have the same variance (not homogeneous). The data was processed using the equation log √(x), but the data variance is still not homogeneous with a significant value (0.000) < α (0.05). The homogeneity results indicate that the data do not meet the requirements for parametric testing, so the analysis continued uses the Kruskal-Wallis non-parametric test.
Statistical analysis with the Kruskal-Wallis test showed that there were differences in dissolution efficiency among the formulas as indicated by a significant value (0.000) < α (0.05). Statistical analysis was continued with Daniel's multiple tests to see which formula is different. Daniel's multiple test results showed that all formulas had significantly different dissolution percentages from one another.
4. Conclusion
The result shows that the characteristics of the phosphate-pregelatinized starch of Zea mays met specifications with the highest viscosity at 0.30%. The tablet formulation containing 7% phosphate-pregelatinized provides the best results with a diameter of 13 mm, thickness of 0.5 mm, hardness of 5.8 kg, disintegration time of 1.36 min, friability of 0.5%, active content of 101.86%, weight uniformity of 711.5, and dissolution rate of 99.28%.
This study concludes that Zea mays starch can be modified to pregelatinized and then phosphate-pregelatinized for further use as a binder in paracetamol tablet formulations. Also, the solubility of the phosphate-pregelatinized is much better than that of the starch and pregelatinized cornstarch. The solubility increase of starch can increase the solubility of paracetamol as the active model.
Disclaimer (Artificial Intelligence)
Authors hereby declare that no generative AI technologies such as Large Language Models (ChatGPT, COPILOT, etc) and text-to-image generators have been used during writing or editing of manuscripts.
Consent and Ethical Approval: It is not applicable.
Acknowledgements
Authors thank the Faculty of Pharmacy Faculty, Universitas Pancasila and the Faculty of Pharmacy and Science, Universitas Muhammadiyah Dr. Hamka for permitting the use of the Lab Facility in both universities.
Competing Interests
Authors have declared that no competing interests exist.
References
- M. Arief. (2020, October 25). Kemenperin: Impor bahan baku obat terus berkurang hingga 2024 [Internet]. Available: https://ekonomi.bisnis.com/read/20201025/257/1309563/kemenperin-impor-bahan-baku-obat-terus berkurang-hingga-2024.
- M. S. Arshad, et al., “A review of emerging technologies enabling improved solid oral dosage form manufacturing and processing.” Advanced Drug Delivery Reviews, vol. 178, pp. 113840, 2021. PMID: 34147533. [CrossRef]
- T. N. S. Sulaiman, Wahyono, A. N. Bestari, and F. N. Aziza, “Preparation and characterization of pregelatinized Sago starch (PSS) from native Sago starch (NSS) (Metroxylon sp.) and its evaluation as tablet disintegrant and filler-binder on direct compression tablet.” Indonesian Journal of Pharmacy, vol. 33, no. 2, pp. 251–260, 2022. [CrossRef]
- B. M. J. Martens, W. J. J. Gerrits, and E. M. A. M. Bruininx, et al., “Amylopectin structure and crystallinity explains variation in digestion kinetics of starches across botanic sources in an in vitro pig model.” Journal of Animal Science and Biotechnology, vol. 9, no. 91, pp. 1-13, 2018. [CrossRef]
- M. El Farkhani, et al., “A review of the chemical modification and applications of starch.” Bio Web Conference, vol. 109, pp. 01020, 2024. [CrossRef]
- J. Compart, A. Singh, J. Fettke, and A. Apriyanto, “Customizing starch properties: A review of starch modifications and their applications.” Polymers (Basel), vol. 15, no. 16, pp. 3491, 2023. PMID: 37631548; PMCID: PMC10459083. [CrossRef]
- E. Sophia. Yuk Mengenal Parasetamol [Internet]. Jakarta: Ditjen Keslan; 2023 [cited 2025 January 5].
- IARC Working Group on the Evaluation of Carcinogenic Risks to Humans. Pharmaceutical Drugs. Lyon (FR): International Agency for Research on Cancer; 1990. (IARC Monographs on the Evaluation of the Carcinogenic Risks to Humans, No. 50.) Paracetamol (Acetaminophen) Available from: https://www.ncbi.nlm.nih.gov/books/NBK526213/.
- R. Klingler, and K-G Busch. “Pregelatinized starches and processes for their production.” US Patent 7045003B2. 2023-06-17.
- M. Wu, et al., “Preparation and structural properties of starch phosphate modified by alkaline phosphatase.” Carbohydrate Polymer, vol. 276, pp. 118803, 2021. [CrossRef]
- R. Berdan, “The microscopic structure of starch grains food microscopy.” Motic America. 2022; March 15. https://moticmicroscopes.com/blogs/articles/food-microscopy-starch-grains#.
- USP 2024 (United State Pharmacopeia 47 - NF 42): General chapters, <1174> Powder flow. [CrossRef]
- USP 2024 (United State Pharmacopeia 47 - NF 42): General chapter, <912> Viscosity-Rotational methods. [CrossRef]
- USP 2024 (United State Pharmacopeia 47 - NF 42): General chapter, <731> Loss on drying. [CrossRef]
- UV calibration and whiteness FAQs. Datacolor. https://www.datacolor.com/wp-content/ uploads/2022/03/UV-Calibration-and-Whiteness-FAQs.pdf.
- USP 2024 (United State Pharmacopeia 47 - NF 42): General chapter, <791> pH. [CrossRef]
- M. Zuhdi, and A.N. Khairi, “Analysis of organoleptic properties and consumer acceptance of frozen noodle products.” Journal of Halal Science and Research, vol. 3, no. 1, pp. 15-19, 2022. [CrossRef]
- USP 2024 (United State Pharmacopeia 47-NF 42): Acetaminophen. https://doi.org/10.31003/USPNF_M150_05_01.
- N.P. Ashok, and G.J. Khan, “A simple UV-Vis spectrophotometric assay study on different brand of paracetamol.” WJPLS, vol. 8, no. 9, pp, 186-193, 2022. https://www.wjpls.org/home/article_abstract/2751.
- A. Sucipto, F. Iskandar, Hanifah, W. Rahmawati, and S.A. Fiqrotinnisa, “The application of Amylum manihot as disintegrant in the formulation of paracetamol tablets by wet granulation method.” Journal of Scince and Technology Research for Pharmacy, vol. 1, no. 2, pp. 26-30, 2022. [CrossRef]
- USP 2024 (United State Pharmacopeia 47 - NF 42): General chapter, <786> Particle Size Distribution Estimation by Analytical Sieving. [CrossRef]
- S. Ahmad, “Thickness test for tablets” [Internet]. Pharmainfo; 2022 [cited 2025 January 10]. https://www.pharmainform.com/2022/07/thickness-test-for-tablets.html.
- USP 2024 (United State Pharmacopeia 47 - NF 42): General chapter <1217> Tablet breaking force. [CrossRef]
- USP 2024 (United State Pharmacopeia 47 - NF 42): General chapter <1216> Tablet friability. [CrossRef]
- USP 2024 (United State Pharmacopeia 47 - NF 42): General chapter, <701> Disintegration. [CrossRef]
- USP 2024 (United State Pharmacopeia 47 - NF 42): General chapter, <905> Uniformity of dosage units. [CrossRef]
- G. Marisa, J. Kapala, T. Mafuru, R. Matinde, E. Kimaro, and E. Kaale, “Quality evaluation of locally manufactured paracetamol tablets in East Africa.” BioMed Research International, pp. 9437835, 2024 Sep 14. PMID: 39310289; PMCID: PMC11416170. [CrossRef]
- USP 2024 (United State Pharmacopeia 47 - NF 42): General chapter, <711> Dissolution. [CrossRef]
- Y. Hong, and X. Liu, “Pre-gelatinized Modification of Starch.” In: Z. Sui, and X. Kong, (eds), “Physical Modifications of Starch.” Springer: Singapore, 2018. https://link.springer.com/chapter/10.1007/978-981-13-0725-6_4.
- N.G. Marotta, and H. Bell, “Method of preparing pregelatinized starch compositions.” US3464857A (Patent) 1967.
- D. Anggraini, A. Lukman, and H.Y. Teruna, “Physicochemical properties of phosphate pregelatinized Musa balbisiana starch as pharmaceutical excipient.” Pharmacology and Clinical Pharmacy Research, vol. 1, no. 3, pp. 90-96, 2016. [CrossRef]
- Depkes RI, “Farmakope Indonesia, edisi 4.” Jakarta: Depkes RI; 1995.
- N. Fadjria, A. Arfiandia, N.D. Auliyah, “Analysis of amylose content in sweet corn starch (Zea Mays L. Var. Saccharata) by UV-Vis spectrophotometry.” Journal of Pharmaceutical and Sciences, vol. 7, no. 2, pp. 152-158, 2024. [CrossRef]
- E. Bertoft, “Understanding starch structure: Recent progress.” Agronomy, vol. 7, no. 3, pp. 56, 2017. [CrossRef]
- E.I. Yousif, M.G.E. Gadallah, and A.M. Sorour, “Physico-chemical and rheological properties of modified corn starches and its effect on noodle quality.” Annals of Agricultural Sciences, vol. 57, no. 1, pp. 19-27, 2012. [CrossRef]
- C. Ophardt, “Starch and iodine” [internet]. California: LibreTexts. https://chem.libretexts.org/Bookshelves/ Biological_Chemistry/Supplemental_Modules.
- N. Aini, and P. Hariyadi, “Utilization of modified white corn starch in producing marshmallow cream.” IJFAC, vol. 3, no. 2, pp. 40-46, 2018. [CrossRef]
- P.M. Lestari, A. Widayanti, and H. Afifah, “The effect of pregelatinized taro starch (Colocasia esculenta (L.) Schott) on temperature as filler on thiamine hidrochloride tablet. Open Access Macedonian Journal of Medical Sciences, vol. 7, no. 22, pp. 3827-3832, 2019. PMID: 32127985; PMCID: PMC7048343. [CrossRef]
- E.G.C. Clarke, and A.C. Moffat, eds. “Clarke's Isolation and Identification of Drugs in Pharmaceuticals, Body Fluids, and Post-mortem Material, 2nd ed. 2.” Michigan: Pharmaceutical Press; 1986.
- B. Setyono, and F.A. Purnawiranita, “Analysis of flow characteristics and paracetamol tablet hardness using 2D double mixer of design drum type with rotation and mixing time variations.” Journal of Mechanical Engineering, Science, and Innovation, vol. 1, no. 2, pp. 38-48, 2021. [CrossRef]
- B. Hartesi, Sriwidodo, M. Abdassah, and A.Y. Chaerunisa, “Starch as pharmaceutical excipient.” International Journal of Pharmaceutical Sciences Review and Research, vol. 41, no. 2, 59-64, 2016. https://globalresearchonline.net/journalcontents/v41-2/14.
- P. Hiremath, K. Nuguru, and V. Agrahari, “Chapter 8 - Material Attributes and Their Impact on Wet Granulation Process Performance,” Editor(s): A.S. Narang, and S.I.F. Badawy, “Handbook of Pharmaceutical Wet Granulation.” Academic Press, pp. 263-315, 2019, ISBN 9780128104606. [CrossRef]
- P. Thapa, A.R. Lee, D.H. Choi, and S.H. Jeong, “Effects of moisture content and compression pressure of various deforming granules on the physical properties of tablets.” Powder Technology, vo. 310, pp. 92-102, 2017. [CrossRef]
- A. Patel, C. Jin, B. Handzo, and R. Kalyanaraman, “Measurement of moisture content in pharmaceutical tablets by handheld near-infrared spectrometer: Adopting quality by design approach to analytical method lifecycle management.” Journal of Pharmaceutical and Biomedical Analysis, vol 229, pp. 115381, 2023. [CrossRef]
- D.S. Shah, K.K. Moravkar, D.K. Jha, V. Lonkar, P.D. Amin, S.S. Chalikwar, “A concise summary of powder processing methodologies for flow enhancement.” Heliyon, vol. 9, no. 6, pp. e16498, 2023 May 24. PMID: 37292344; PMCID: PMC10245010. [CrossRef]
- Utsumi R. An attrition test with a sieve shaker for evaluating granule strength. Powder Technology, vol. 122, no. 2, pp. 199-204, 2001. [CrossRef]
- A.L. Skelbæk-Pedersen, T.K. Vilhelmsen, J. Rantanen, and P. Kleinebudde, “The relevance of granule fragmentation on reduced tabletability of granules from ductile or brittle materials produced by roll compaction/dry granulation.” International Journal of Pharmaceutics, vol. 592, pp. 120035, 2021. [CrossRef]
- H. Leuenberger, “The compressibility and compactibility of powder systems.” International Journal of Pharmaceutics, vol. 12, no. 1, pp. 41-55, 1982. [CrossRef]
- O. Macho, et al., “Systematic study of paracetamol powder mixtures and granules tabletability: Key role of rheological properties and dynamic image analysis.” International Journal of Pharmaceutics, vol. 608, pp. 121110, 2021. [CrossRef]
- Azimuddin, M.F. Roslan, and R.T. Widodo, “Formulation and in vitro evaluations of paracetamol orally disintegrating tablets.” Journal of Food and Pharmaceutical Sciences, vol. 11, no. 1, pp. 780-787, 2023. [CrossRef]
- R. Kamour, I. El-Sharaa, and A. Eswayah, “Physical and chemical evaluation of different brands of paracetamol tablet.” AlQalam Journal of Medical and Applied Sciences, vol. 7, no. 2, pp. 257-260, 2024. [CrossRef]
- Y.L. Achille, et al., “Quality control of paracetamol generic tablets marketed in Benin and search of its two impurities p-aminophenol and p-nitrophenol by HPLC-UV/Visible.” American Journal of Analytical Chemistry, vol. 13, no. 11, pp. 449-460, 2022. [CrossRef]
- British Pharmacopoeia Commission. “British Pharmacopoeia. 2nd ed.” London: The Stationery Office, 2007.
- C.H.R. Serra, K.H. Chang, T.M. Dezani, V. Porta, and S. Storpirtis, “Dissolution efficiency and bioequivalence study using urine data from healthy volunteers: a comparison between two tablet formulations of cephalexin.” Brazilian Journal of Pharmaceutical Sciences, vol. 51, no. 2, pp. 383-392, 2015. [CrossRef]
- Jubril, J. Muazu, and G.T. Mohammed, “Effects of phosphate modified and pregelatinized sweet potato starches on disintegrant property of paracetamol tablet formulations.” Journal of Applied Pharmaceutical Science, vol. 2, no. 2, pp. 32-36, 2012. https://www.researchgate.net/publication/265219787.
- IBM SPSS Statistics, “Analyze data with ease, forecast trends accurately, and drive key outcomes using IBM SPSS Statistics.” Available from: https://www.ibm.com/products/spss-statistics (accessed April 1, 2025).
Figure 1.
Microscopic form of cornstarch with magnificent 100 times.
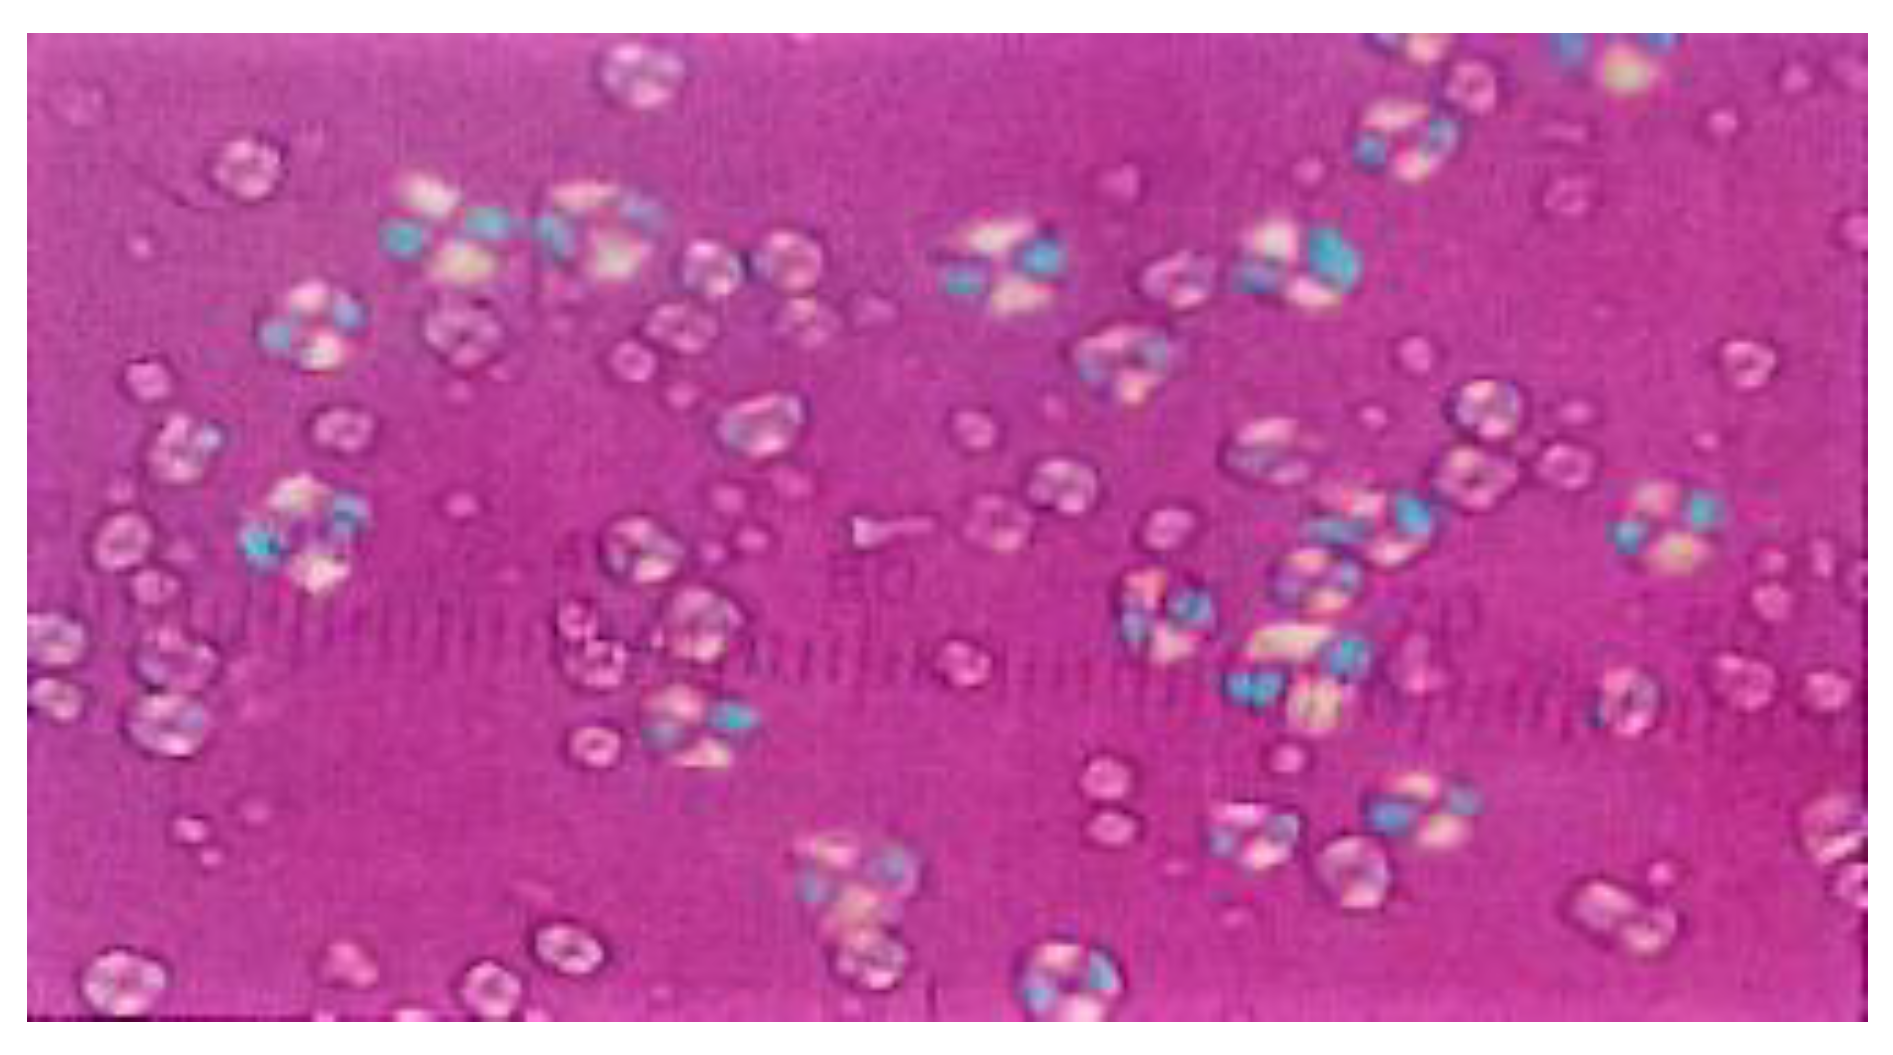
Figure 2.
Microscopic form of pregelatinized cornstarch with magnificent 100 times.
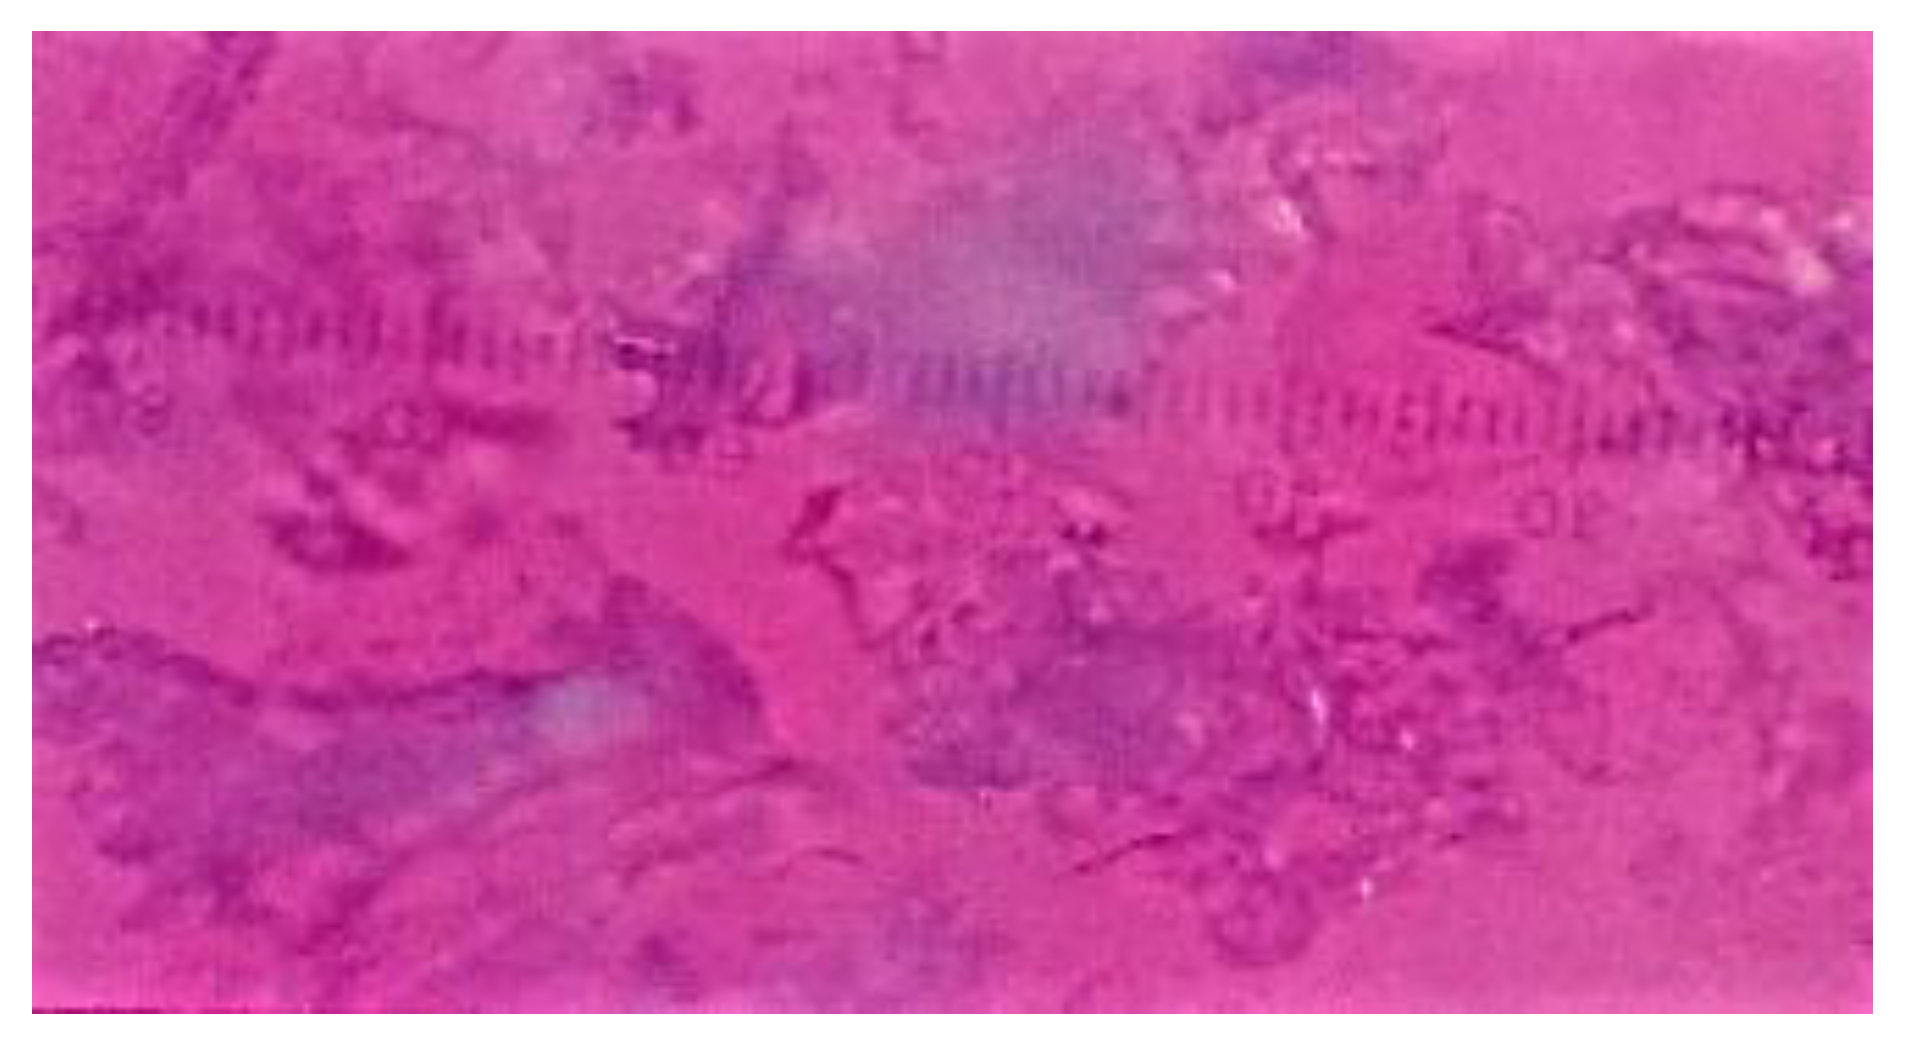
Figure 3.
Microscopic form of 0.25% phosphate-pregelatinized cornstarch with magnificent 100 times.
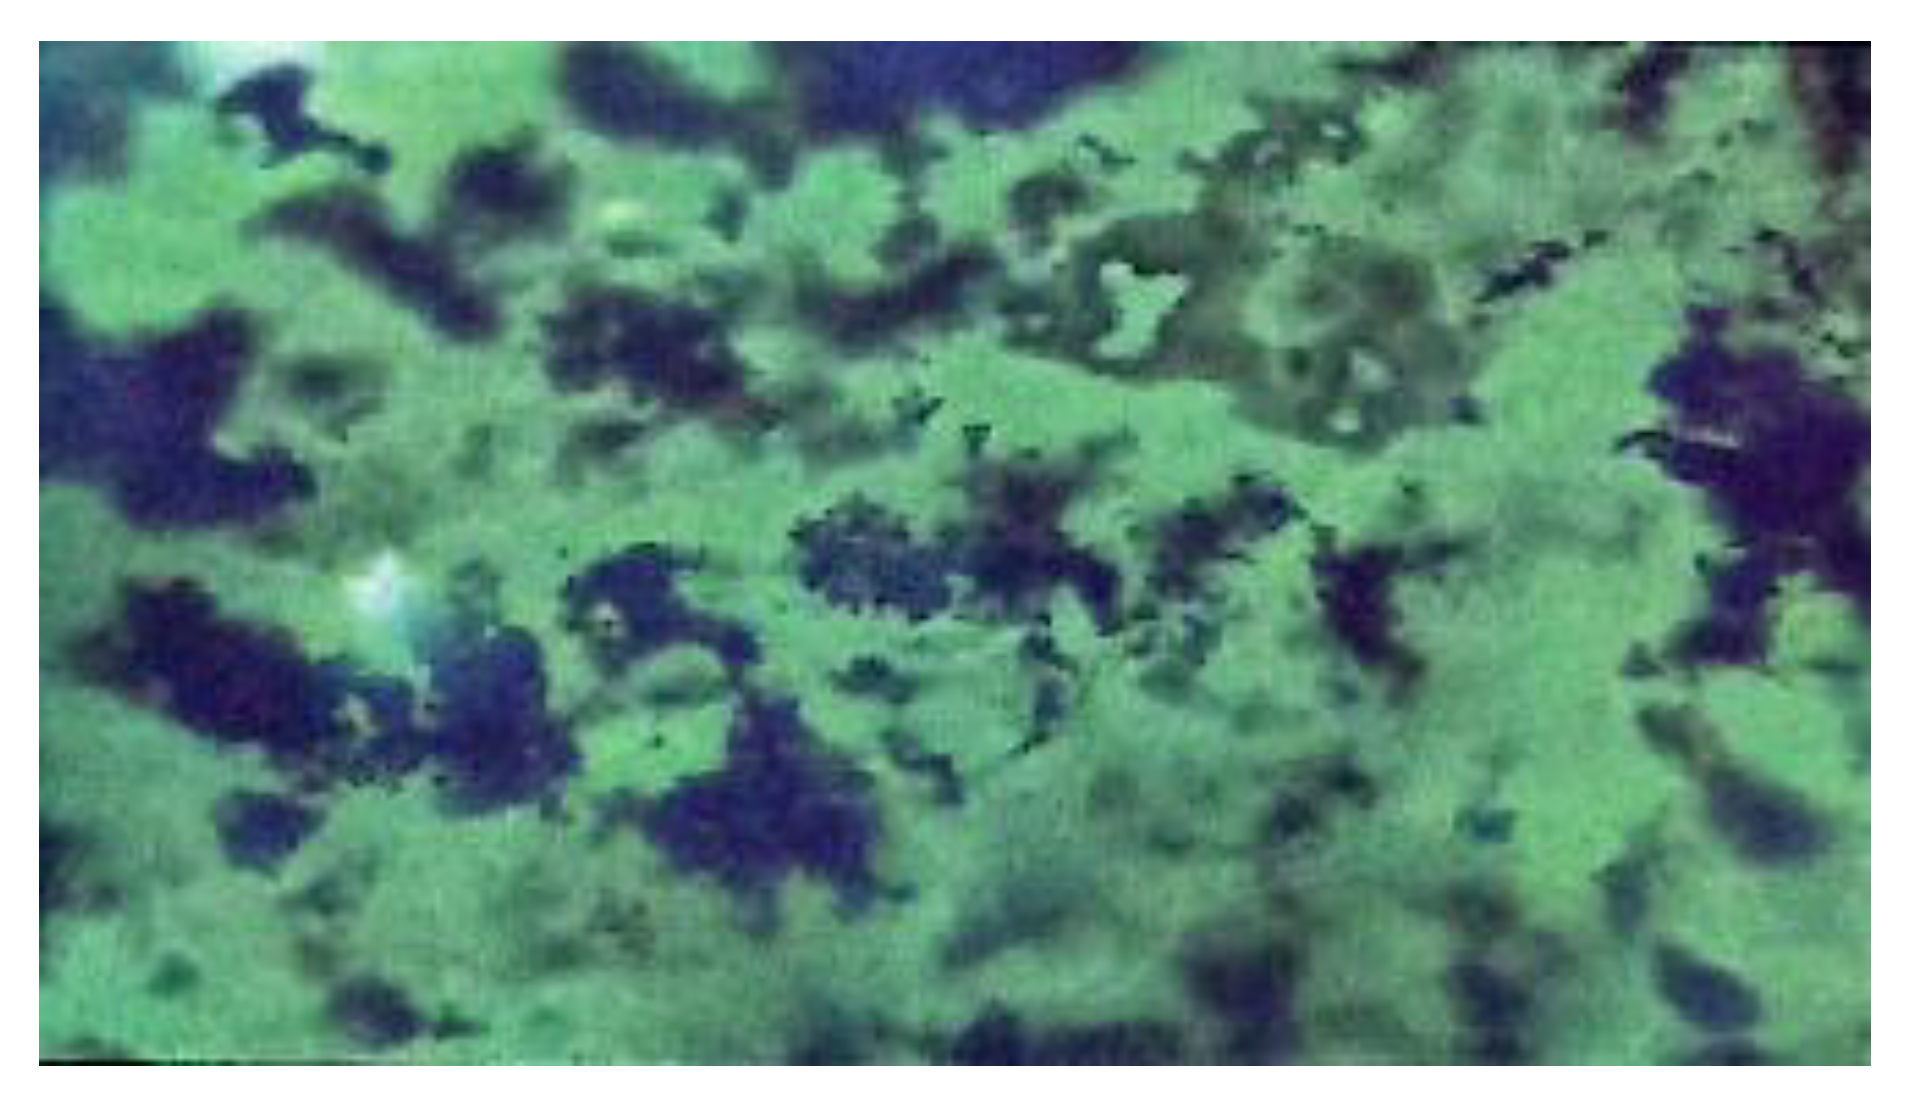
Figure 4.
Microscopic form of 0.30% phosphate-pregelatinized cornstarch with magnificent 100 times.
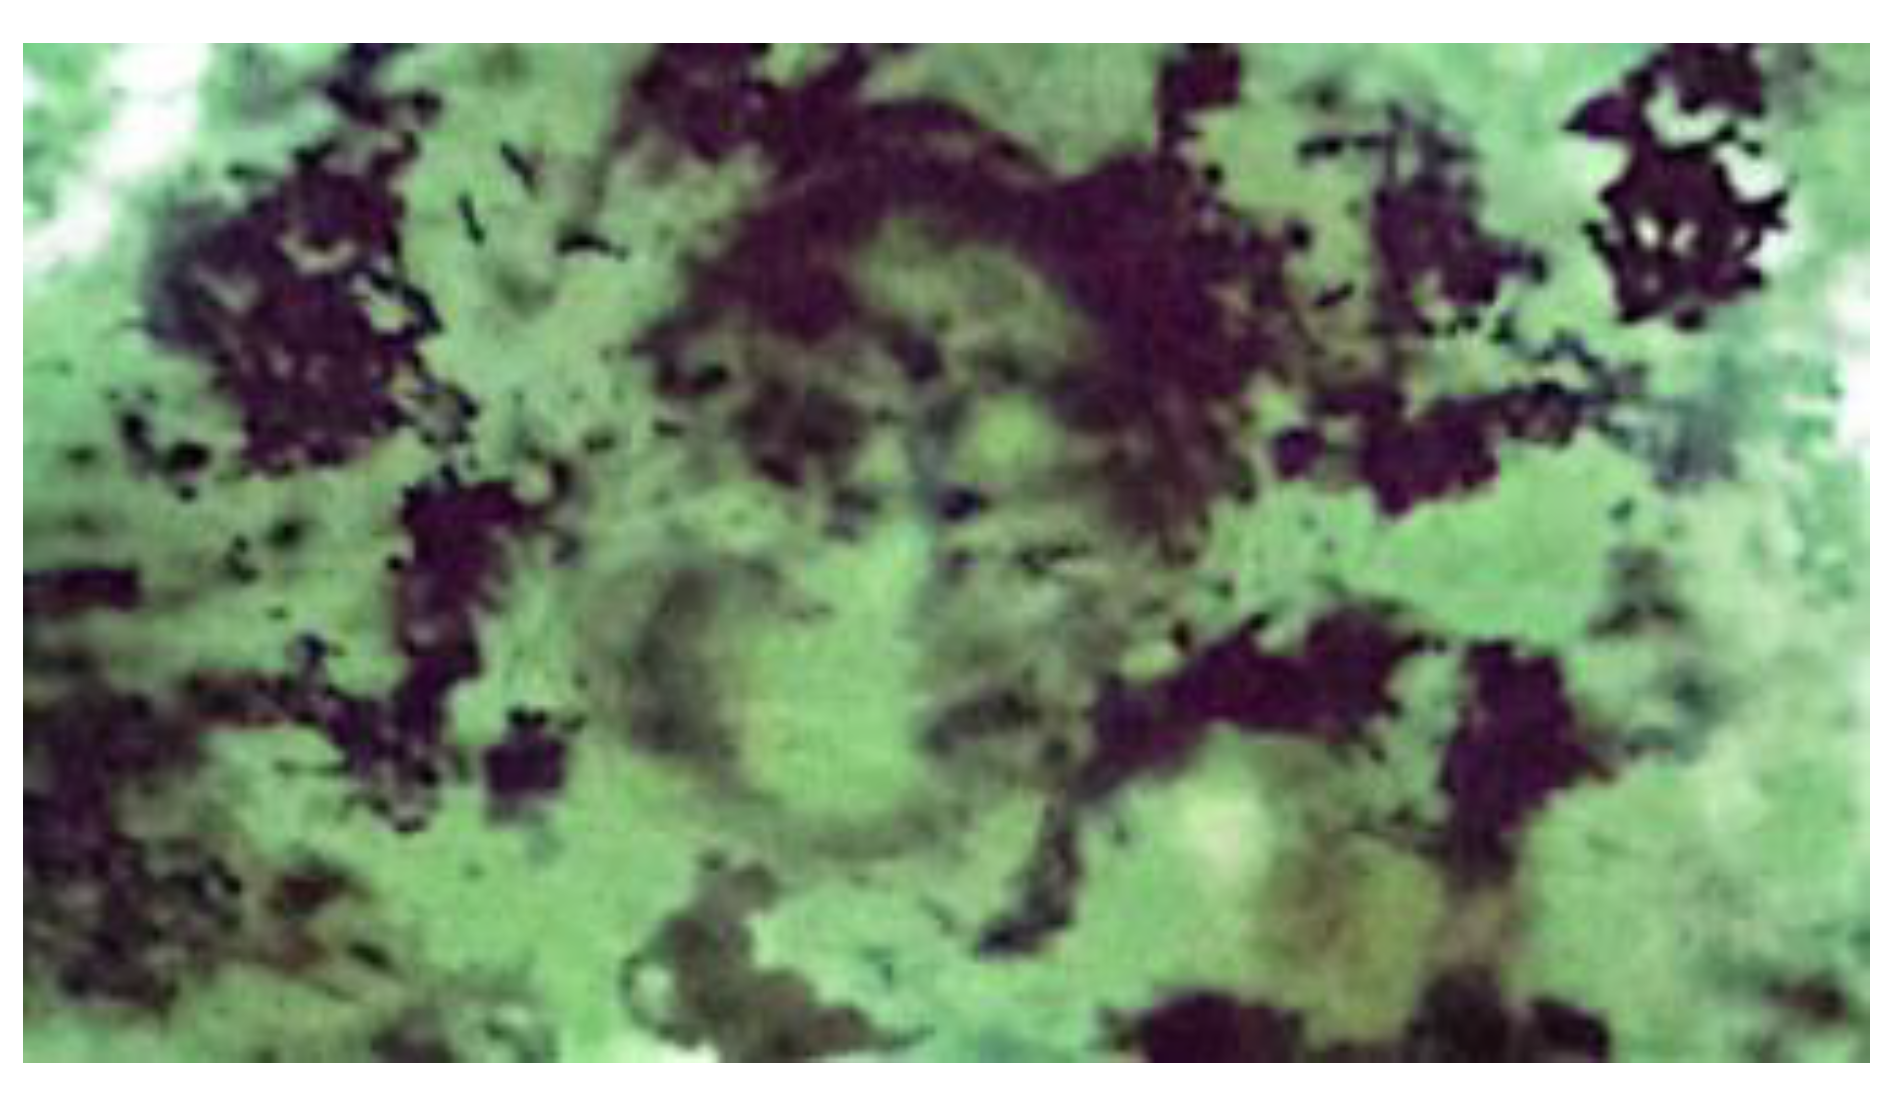
Figure 5.
Microscopic form of 0.35% phosphate-pregelatinized cornstarch with magnificent 100 times.
Disclaimer/Publisher’s Note: The statements, opinions and data contained in all publications are solely those of the individual author(s) and contributor(s) and not of MDPI and/or the editor(s). MDPI and/or the editor(s) disclaim responsibility for any injury to people or property resulting from any ideas, methods, instructions or products referred to in the content. |
© 2025 by the authors. Licensee MDPI, Basel, Switzerland. This article is an open access article distributed under the terms and conditions of the Creative Commons Attribution (CC BY) license (http://creativecommons.org/licenses/by/4.0/).
Copyright: This open access article is published under a Creative Commons CC BY 4.0 license, which permit the free download, distribution, and reuse, provided that the author and preprint are cited in any reuse.


