
Submitted:
03 July 2025
Posted:
04 July 2025
You are already at the latest version
Abstract
The fatty acid content plays a crucial role in the quality traits of soybeans. However, its content is easily affected by environmental and genetic factors. Therefore, conducting QTL mapping research on the fatty acid content in soybeans is of great significance for mining genes related to the regulation of soybean fatty acid content. In this study, a high-density genetic linkage map containing 761 SSR and InDel marker loci was constructed. The map length was 1475.7 cM, and the average distance between markers was 1.94 cM. In this study, the multiple QTL model (MQM) mapping method was used, and a total of 49 QTLs related to fatty acid content that existed in two or more environments were detected. By comparing with the QTL mapping results reported by previous studies, this study found that 9 QTLs overlapped with the previous research results. A total of 4 QTLs that could be stably inherited in 4 environments were detected. Analysis of these four QTL intervals finally screened out 5 candidate genes related to soybean fatty acid content. The results of this study provide new ideas for marker-assisted selection breeding and point out the direction for improving the quality traits of soybeans.
Keywords:
soybean
; fatty acid content
; high density genetic map
; quantitative trait loci
; quality traits
1. Introduction
Soybean [Glycine max (L.) Merr.]is an important oilseed crop, accounting for 60% of the global oilseed production[1]. The average fat content of soybeans is between 20%-25%[2]. As one of the main edible oils, soybean oil mainly consists of five fatty acids[3], with the ratio of saturated fatty acids to unsaturated fatty acids being approximately 1:4[4]. Soybeans are rich in unsaturated fatty acids that the human body cannot synthesize on its own and must obtain from food. Therefore, the fatty acid content of soybeans directly affects its quality traits[5]. For human health, excessive intake of saturated fatty acids such as palmitic acid (16:0) and stearic acid (18:0) is more likely to cause cardiovascular diseases[6], while the unsaturated fatty acids in soybeans, such as oleic acid (18:1), linoleic acid (18:2), and linolenic acid (18:3), are beneficial to human health[7]. However, an excessively high content of polyunsaturated fatty acids such as linoleic acid and linolenic acid in soybeans often leads to the oxidative deterioration of soybean oil during storage and transportation, reducing the quality of soybean oil and may even produce trans-fatty acids, thereby threatening human health[8-10]. Therefore, analyzing the genetic basis of soybean fatty acid content and mining QTLs related to fatty acid content are of great significance for improving the fatty acid content components of soybeans, breeding soybean varieties with ideal edible fatty acid ratios, and enhancing the quality traits of soybeans.
Soybean fatty acid metabolism, as a typical quantitative trait controlled by multiple genes, its expression regulation network is jointly affected by the interaction between genetic background and environmental factors[11]. With the iterative development of molecular marker technology, researchers have gradually revealed the genetic regulation mechanism of fatty acid components and screened some QTLs related to soybean fatty acid components by constructing different types of genetic populations. As early as 1992, Diers et al. constructed an F2 population and designed RFLP markers, and finally mapping 23 QTLs related to fatty acid components[12]. In 2002, Z. Li et al. used SNP markers in a recombinant inbred line (RIL) population to screen 16 QTLs related to five major fatty acids[13]. In 2011, Li Hai wang et al. analyzed the relative importance of quantitative trait loci (QTLs) for various fatty acid components in soybean seeds through an RIL population[14]. In 2012, Xie Dong wei et al. identified 6 QTLs related to linolenic acid content, 4 QTLs related to linoleic acid content, 4 QTLs related to oleic acid content, 4 QTLs related to palmitic acid content, and 1 QTL related to stearic acid content by identifying the differences in fatty acid content of 125 recombinant inbred line populations in 6 environments[15]. In 2015, Zhou Zhengkui et al. conducted a GWAS analysis on 302 soybean germplasm resources and identified 21 fatty acid biosynthesis genes[16]. In 2024, Zhong Yiwang et al. identified 54 quantitative trait loci for fatty acid components through a high-density genetic map of a recombinant inbred line population (Guizao 1×Brazil 13) with significant differences in fatty acid-related traits[17].
Although previous studies have been conducted on the genetic mechanism of soybean fatty acid content, the fatty acid content and components of soybeans are very complex quantitative traits[18]. Currently, on Soybase (http://www.soybase.org), there are 41, 34, 43, 44, and 68 QTLs related to soybean palmitic acid, stearic acid, oleic acid, linoleic acid, and linolenic acid respectively. The number of QTL mapping studies related to fatty acid content is far lower than that of other traits. For example, there are 241 and 315 QTLs for seed protein and seed fat respectively. Therefore, screening QTLs related to soybean fatty acid content is the basis and prerequisite for breeding soybeans with suitable fatty acid content, which is helpful for improving the quality traits of soybeans. In this study, based on the hybrid progeny population of CJC2 and JY166, a high-density genetic map was constructed. Combined with the differences in fatty acid content of the hybrid progeny population in 6 environments, some QTLs affecting fatty acid content were screened. The research results provide a theoretical basis for breeding soybean varieties with ideal fatty acid ratios.
2. Results
2.1. Trait Phenotype Analysis
From the table, we can see that there are significant differences in fatty acid composition between the two parents, CJC2 and JY166. Specifically, the contents of palmitic acid (C16:0), oleic acid (C18:1), and linolenic acid (C18:3) in CJC2 are all significantly higher than those in JY166. In the hybrid offspring population, the differences between the maximum and minimum values of various fatty acid contents are obvious, indicating a large degree of segregation in the offspring and the presence of transgressive inheritance. The coefficient of variation ranges from 0.02% to 0.24%. Considering the contents of each component under different environments, the contents of each fatty acid component show a continuous distribution and are close to a normal distribution, suggesting that the contents of each fatty acid component are quantitative traits controlled by multiple genes, which are suitable for QTL mapping analysis. Table 1, Figure 1
2.2. Correlation Analysis of Five Fatty Acids in Seeds
According to the correlation analysis of fatty acid contents in the hybrid population under six environments, the results showed that linoleic acid had a significant negative correlation with linolenic acid, palmitic acid, stearic acid, and oleic acid; linolenic acid had a significant negative correlation with oleic acid and a significant positive correlation with palmitic acid; palmitic acid had a significant positive correlation with stearic acid. The correlations between traits are reliable, which can provide a reference for breeding varieties with reasonable ratios of different quality trait contents in breeding work. Figure 2
2.3. High Density Genetic Map Construction
On the basis of the genetic linkage map previously constructed in our laboratory[19], Using the F2 generation of the hybrid offspring of CJC2 and JY166 as the mapping population, a high-density genetic linkage map containing 761 marker loci was constructed with SSR and InDel markers, which were located on the 20 chromosomes of soybean. The length of this genetic linkage map is 1475.7 cM, and the average distance between markers is 1.94 cM. The overall marker density is relatively high, making it suitable for fine genetic analysis. Chromosome 19 has the largest number of markers, with 63, while chromosome 11 has the smallest number, with 21. Chromosome 17 has the lowest average distance between markers, only 0.90 cM, and chromosome 20 has the highest average distance between markers, reaching 4.38 cM. Table 2, Figure 3
2.4. QTL Mapping for Five Fatty Acids in Seeds
Based on the high-density genetic linkage map constructed in the previous stage, combined with the phenotypic data differences of fatty acid content in the hybrid offspring population under six environments, QTL analysis of fatty acid content traits was carried out for each environment respectively. A total of 49 QTLs related to each fatty acid component were detected in at least two environments under the six environments, which were mainly distributed on 18 chromosomes.
QTL mapping analysis of palmitic acid content in soybean seeds: The largest number of QTLs was detected, with a total of 13 QTLs distributed on 10 chromosomes. The phenotypic variance ranged from 7.3% to 19.8%. Stable QTLs that could be detected in three environments were: qPA01.1, qPA03.1, qPA03.2, qPA20.1. The phenotypic variance ranged from 7.7% to 16.4%. qPA02.1 and qPA19.1 could be detected in four environments, with a phenotypic variance of 7.3%-19.8%, which may be major QTLs. In addition, the favorable alleles of 8 QTLs were from CJC2.
QTL mapping analysis of stearic acid content in soybean seeds: A total of 6 QTLs were detected, which were distributed on 6 chromosomes. The phenotypic explanation rates ranged from 6.8% to 23.2%. Three QTLs could be detected in three environments: qSA05.1, qSA14.1 and qSA18.1 were considered as stable QTLs, and their phenotypic variances ranged from 6.8% to 18.7%. qSA14.1 could be detected in four environments, and its phenotypic variance was 10.4%-23.2%, which might be a major-effect QTL. In addition, all the favorable alleles of all QTLs related to seed stearic acid content were from JY166.
QTL mapping analysis of oleic acid content in soybean seeds: A total of 10 QTLs were distributed on 7 chromosomes, and their phenotypic variances were between 8.40% and 17.90%. qOA07.1 could be detected in three environments, and its phenotypic variance ranged from 8.70% to 12.3%. In addition, the favorable alleles of 5 QTLs were from CJC2.
QTL mapping analysis of linoleic acid content in soybean seeds: A total of 11 QTLs were distributed on multiple chromosomes, and the phenotypic variances ranged from 6.8% to 16.4%. Stable QTLs qLA03.1 and qLA07.1 could be detected in three environments, and their phenotypic variances ranged from 7.6% to 13.4%. In addition, the favorable alleles of 1 QTL were from CJC2, and the favorable alleles of 2 QTLs were from JY166.
QTL mapping analysis of linolenic acid content in soybean seeds: A total of 9 QTLs were distributed on 9 chromosomes, and the phenotypic variances ranged from 8.3% to 20.8%. Stable QTLs qLNA11.1 and qLNA18.1 could be detected in three environments, and their phenotypic variances ranged from 8.3% to 20.8%. The possible major-effect QTL qLNA02.1 had a phenotypic variance of 9.7%-20.8%. In addition, the favorable alleles of 2 QTLs were from CJC2, and the favorable alleles of 6 QTLs were from JY166. Figure 4, Table 3
2.5. Candidate Gene Prediction
This study mainly analyzed the stable QTLs detected in all four environments. qPA02.1 and qPA19.1 are stable QTLs associated with palmitic acid content, qSA14.1 is a stable QTL associated with oleic acid content, and qLNA02.1 is a stable QTL associated with linolenic acid content. GO enrichment analysis was performed on the genes within the intervals to screen out genes related to the fatty acid metabolic pathway, and gene function annotation was carried out on them. Finally, 5 QTLs related to soybean fatty acid content were screened out, including 2 genes related to palmitic acid content, 1 gene related to oleic acid content, and 2 genes related to linolenic acid content. Figure 5, Table 4
3. Discussion
The content and composition ratio of saturated and unsaturated fatty acids in soybean oil directly affect the quality and application of soybean oil[20]. Soybeans are rich in unsaturated fatty acids that the human body cannot synthesize, which are beneficial to human health. However, an increase in the content of polyunsaturated fatty acids will shorten the shelf-life of edible oil and affect its flavor[21]. In soybean oil products, both the shelf-life and quality traits are indispensable and need to be balanced[22]. Increasing the content of monounsaturated fatty acids and reducing the content of saturated and polyunsaturated fatty acids in soybeans is a very safe and effective method to improve the quality traits of soybeans[23]. Therefore, increasing the content of oleic acid and reducing the content of linoleic acid and linolenic acid in soybean fatty acids is one of the goals of soybean quality breeding.
In recent years, researchers have developed more and more genetic linkage maps under different genetic backgrounds. Most of these maps have the common problem of having fewer markers. On the one hand, this reduces the accuracy of QTL mapping, and on the other hand, it limits the long-term application of the maps[24]. The high-density genetic map constructed in this study contains 761 SSR and InDel marker loci distributed on 20 soybean chromosomes. The length of this genetic linkage map is 1475.7 cM, and the average distance between markers is 1.94 cM. The marker density is relatively high, which can improve the accuracy of subsequent QTL mapping and lay a foundation for mining favorable alleles.
In this study, when analyzing the correlations among the five components of soybean fatty acids, we found that the linoleic acid content was significantly negatively correlated with the content of the other four fatty acids; the linolenic acid content was significantly negatively correlated with the oleic acid content; the linolenic acid content was significantly positively correlated with the palmitic acid content; and the palmitic acid content was significantly positively correlated with the stearic acid content, which is basically consistent with previous studies[25]. There are various significant correlations among the five fatty acid components, which indicates that there may be an inter-related synthetic molecular mechanism among them. Therefore, attention should be paid to the existence of co-localized QTLs[26]. In this study, there are multiple intervals where QTLs of different fatty acid components overlap or are included. QTLs related to the content of linoleic acid, oleic acid, and palmitic acid were mapped on the third chromosome of soybeans: qLA03.1 and qOA03.2 are co-localized, and qOA03.1 and qPA03.2 are co-localized. Three different QTLs, qLA06.1, qOA06.1, and qPA06.1, are simultaneously mapped in a part of the sixth chromosome. There is also a co-localization interval between qLA08.1 and qOA08.1. The additive effects of qLNA18.1 and qPA18.1 co-localized on the 18th chromosome both come from CJC2, while the additive effects of qLA20.1 and qSA20.1 co-localized on the 20th chromosome both come from JY166. There are indeed correlations between different fatty acids, and there is a process of mutual transformation[27]. Therefore, these co-localized QTLs are good research directions for improving the composition of soybean fatty acids.
In this study, a total of 49 QTLs related to soybean fatty acid content were mapped in six environments. By comparing with some previously reported QTLs[15,28-32], this study found that there were QTLs overlapping with previous research results in all five soybean fatty acid components: qPA20.1, qSA14.1, qOA03.1, qOA10.1, qOA13.2, qLA09.1, qLNA03.1, qLNA10.1, and qLNA11.1. These results further verified the reliability of the results of this study and the stability of the genetic effects in these regions, which is of great significance for improving fatty acid content. At the same time, there were also some new QTL loci that had not been reported, possibly due to the differences in the mapping populations, planting environments, and mapping methods used in previous studies[33,34], or they might be QTLs specific to this population and could be further studied. In this study, QTLs that could be repeatedly detected in three or more environments were considered stable QTLs. Among them, a total of 4 QTLs were detected in 4 environments. The QTLs related to soybean palmitic acid content, qPA02.1 and qPA19.1, with a phenotypic variance of 7.3%-19.8%, were considered possible major-effect QTLs. The QTL related to soybean stearic acid content, qSA14.1, had a phenotypic variance of 10.4%-23.2%, all exceeding 10%, indicating that qSA14.1 is the major-effect QTL with the highest contribution rate and stable heredity affecting soybean stearic acid content. The QTL related to soybean linolenic acid content, qLNA02.1, had a phenotypic variance of 9.7%-20.8%, and its favorable alleles all came from JY166. These results have further implications for molecular marker-assisted breeding of fatty acid content.
Analysis was conducted on the stable QTLs detected in all four environments. A total of five genes related to soybean fatty acid content were identified. The candidate genes affecting soybean palmitic acid content are Glyma.02G273300 (GmDETg) and Glyma.19G170100 (ADH). In soybeans, GmDETa and GmDETb in this gene family function as steroid reductases, influencing the synthesis of BR[35]. In Arabidopsis, the homologous gene of GmDETg is AT3G55360, which catalyzes the last step of very-long-chain fatty acid synthesis to produce fully saturated very-long-chain fatty acids[36]. These results imply that GmDETg may have a function in influencing palmitic acid synthesis. AT5G43940 is the homologous gene of Glyma.19G170100 in Arabidopsis, which may affect fat biosynthesis through interaction with the WRI1 (WRINKLED1) protein[37]. Glyma.14G173500 (LOX) is a candidate gene affecting soybean oleic acid content. In maize, the homologous gene GRMZM2G156861 encodes lipoxygenase protein 1 (LOX1), which promotes fatty acid oxidation and alters lipid metabolism[38]. The candidate genes related to soybean linolenic acid content are Glyma.02g203300 and Glyma.02G227200 (GmFAD3). According to relevant reports, LOC547807 (Glyma.02g203300) is an Omega-6 fatty acid desaturase that uses ferredoxin as an electron donor to catalyze the introduction of double bonds in the biosynthesis of 16:3 and 18:3 fatty acids[39]. In the Arabidopsis fad6 mutant, the ratio of linoleic acid to linolenic acid changed[40]. It has been reported that GmFAD3 (Glyma.02G227200) is related to soybean linolenic acid content[41]. In summary, excluding the previously reported gene GmFAD3 (Glyma.02G227200), a total of four candidate genes affecting soybean fatty acid content were identified in this study。
In addition, when conducting QTL analysis, this study found that the additive and dominant effects of the same QTL might vary under different environments, which might be caused by factors such as strong environmental influence, the influence of undetected QTLs, and statistical errors[42,43]. But generally speaking, the results of this study provide a new perspective for analyzing the genetic basis of these traits, lay a foundation for the mining, cloning, and functional analysis of candidate genes, and provide a theoretical basis for improving soybean fatty acid content and enhancing soybean quality traits.
4. Materials and methods
4.1. Plant Materials
In this study, an F2 population of 186 plants obtained from the cross between Changjiangchun 2(High-protein varieties approved by Chongqing Municipality) and Jiyu 166(High-oil varieties introduced from the north)was used as the research material to construct a high-density genetic linkage map. The F2 population was planted in Chongqing in the summer of 2021, and each F2 plant was sown individually. The F2:3 population was planted in Chongqing in the summer of 2022; the F2:4 population was planted in Yunnan in the winter of 2022; the F2:5 population was planted in Chongqing in the summer of 2023; the F2:6 population was planted in Yunnan in the winter of 2023; the F2:7 population was planted in Chongqing in the summer of 2024. The F2:3-2:7 families were sown in single rows. The row length was 1 m, the row width was 0.5 m, and the plant spacing was 0.2 m. A unified field management model was adopted. After the plants matured, fully-matured seeds were harvested and air-dried for subsequent determination of fatty acid content.
4.2. DNA Extraction and SSR Genotyping
The young leaves of 186 individual plants from the F2 population were selected, and the DNA was extracted using the CTAB method modified by Zhang et al. In addition to selecting and downloading some SSR primer sequences from the public soybean marker database Soybase (http://www.soybase.org) for this study, the results of parental re-sequencing were also compared with the soybean reference genome (Wm82. a4. v1) sequence. The InDel sites between the two parents were screened, and InDel primers were designed. All primers were synthesized by Sangon Biotech (Shanghai) Co., Ltd. A total of 2933 pairs of SSR primers evenly distributed on 20 soybean chromosomes and 866 pairs of InDel primers were used to screen polymorphic primers between the two parents. The primers showing polymorphism between the parents were selected to detect the marker genotypes of the F2 population. During data statistics, if the band pattern was the same as that of CJC2, it was recorded as A; if it was the same as that of JY166, it was recorded as B. If a heterozygous pattern (showing both A and B) appeared, it was recorded as H, and the missing band pattern was recorded as U.
4.3. Determination of Traits
A GC-2010 gas chromatograph was used to determine five components of soybean fatty acids, including palmitic acid, stearic acid, oleic acid, linoleic acid, and linolenic acid. Chromatographic column model: DB-WAX (30 mm×0.246 mm×0.25 µm), stationary phase: polyethylene glycol. Each sample was measured 3 times repeatedly, and the average value was finally taken as the data. Excel 2020 and Origin 2020 were used to conduct statistical analysis on the phenotypic data.
The method is as follows: Weigh 0.2 g of soybean seeds, grind them thoroughly and transfer them into a 5 mL test tube. Quickly add 2 mL of petroleum ether: diethyl ether (1:1), mix well and let it stand for 40 min. Add 1 mL of potassium hydroxide - methanol (0.4 mol/L) solution and mix thoroughly. After reacting for 30 min, add distilled water along the wall of the test tube. After standing for stratification, pipette 1 mL of the supernatant into an autosampling vial.
The reaction conditions are as follows: column temperature 185℃, vaporization chamber temperature 250℃, detection chamber temperature 250℃, carrier gas (nitrogen) flow rate 60 mL/min, hydrogen flow rate 40 mL/min, air flow rate 400 mL/min, peak retention time 13 minutes, and injection volume 2 µL.
4.4. Map Construction and QTL Detection
The JoinMap 4.0 software was used to conduct linkage analysis between markers and construct a genetic linkage map. The Kosambi mapping function was employed for genetic linkage analysis. The MapQTL 6.0 software was used to perform quantitative trait locus (QTL) mapping and effect detection of soybean fatty acid content traits in the F2 generation and its derived populations.
In this study, QTLs with a LOD≥3.0 were considered as potential QTLs. The additive effects were based on the background of CJC2. A positive effect indicated that the allele from CJC2 increased the phenotypic value of the trait, while a negative effect indicated that the allele from Jiyu 166 increased the phenotypic value of the trait. The QTLs were named following the rules established by McCouch et al. in 1997, using the format of “q + trait name + chromosome number + serial number”, such as qPA01.1 and qSA03.1.
4.5. Candidate Genes Prediction
The stable QTLs detected in all four environments were analyzed using the soybean database (SoyBase, http://www.soybase.org), and genes within the QTL intervals were searched. Gene Ontology (GO) term enrichment analysis and gene function annotation were performed on the genes within the intervals. The gene families and sub-families, molecular functions, biological processes, and metabolic pathways of the genes in the identified QTLs were analyzed. Finally, candidate genes related to fatty acids content were screened out.
5. Conclusions
Based on the genetic linkage map previously constructed in the laboratory, this study further densified it and constructed a high-density genetic linkage map containing 761 markers with an average distance of 1.94 cM. Using the MQM model method, a total of 49 QTLs related to soybean fatty acids content were identified. Through GO enrichment analysis and gene function annotation, 5 candidate genes affecting fatty acids content were finally determined. The results of this study provide a theoretical basis for improving the fatty acids ratio of soybeans and enhancing the quality traits of soybeans.
Author Contributions
J.Z. as the corresponding authors designed, supervised the study and revised the manuscript. P.T. and X.G. performed the study, analyzed data, involved in the writing of the manuscript. H.S. and X.L. involved in data analyses. L.Z., J.H.and X.C.involved in sample collection and preparation.
Funding
Collection, Utilization and Innovation of Germplasm Resources by Research Institutes and Enterprises of Chongqing (cqnyncw-kqlhtxm).
Institutional Review Board Statement
Not applicable.
Informed Consent Statement
Not applicable.
Data Availability Statement
The datasets used and/or analyzed during the current study are
available from the corresponding author upon reasonable request.
Conflicts of Interest
All authors declare that they have no financial or other conflicts of interest in relation to this research and its publication.
References
- Han, L.D. , Gai, J. Y., Zhang, W. M. Research status of soybean nutritional components. Seed 2003, 57–59. [Google Scholar]
- Bellaloui, N.; Bruns, H.A.; Abbas, H.K.; Mengistu, A.; Fisher, D.K.; Reddy, K.N. Agricultural practices altered soybean seed protein, oil, fatty acids, sugars, and minerals in the midsouth USA. Frontiers in plant science 2015, 6, 31. [Google Scholar] [CrossRef]
- Clevinger, E.M.; Biyashev, R.; Haak, D.; Song, Q.; Pilot, G.; Saghai Maroof, M.A. Identification of quantitative trait loci controlling soybean seed protein and oil content. PloS one 2023, 18, e0286329. [Google Scholar] [CrossRef] [PubMed]
- Dou, X.; Zhang, L.; Wang, X.; Yang, R.; Wang, X.; Ma, F.; Yu, L.; Mao, J.; Li, H.; Wang, X. , et al. Identification and validation of metabolic markers for adulteration detection of edible oils using metabolic networks. Metabolites 2020, 10. [Google Scholar] [CrossRef] [PubMed]
- Chen, X.Z. , Yang, J. Y., Li, X., et al. Nutrition of soybean and human health. New Agricultural Technologies 2004. [Google Scholar]
- Delaney, B.; Appenzeller, L.M.; Munley, S.M.; Hoban, D.; Sykes, G.P.; Malley, L.A.; Sanders, C. Subchronic feeding study of high oleic acid soybeans (event dp-3Ø5423-1) in sprague-dawley rats. Food and chemical toxicology : an international journal published for the British Industrial Biological Research Association 2008, 46, 3808–3817. [Google Scholar] [CrossRef]
- Hyten, D.L.; Pantalone, V.R.; Sams, C.E.; Saxton, A.M.; Landau-Ellis, D.; Stefaniak, T.R.; Schmidt, M.E. Seed quality qtl in a prominent soybean population. TAG. Theoretical and applied genetics. Theoretische und angewandte Genetik 2004, 109, 552–561. [Google Scholar] [CrossRef]
- Akond, M.; Liu, S.; Boney, M.; Kantartzi, S.K.; Meksem, K.; Bellaloui, N.; Lightfoot, D.A.; Kassem, M.A. Identification of quantitative trait loci (qtl) underlying protein, oil, and five major fatty acids’ contents in soybean. American Journal of Plant Sciences 2014, 05, 158–167. [Google Scholar] [CrossRef]
- Ha, B.K.; Kim, H.J.; Velusamy, V.; Vuong, T.D.; Nguyen, H.T.; Shannon, J.G.; Lee, J.D. Identification of quantitative trait loci controlling linolenic acid concentration in pi483463 (glycine soja). TAG. Theoretical and applied genetics. Theoretische und angewandte Genetik 2014, 127, 1501–1512. [Google Scholar] [CrossRef]
- Pathan, S.M.; Vuong, T.; Clark, K.; Lee, J.D.; Shannon, J.G.; Roberts, C.A.; Ellersieck, M.R.; Burton, J.W.; Cregan, P.B.; Hyten, D.L. , et al. Genetic mapping and confirmation of quantitative trait loci for seed protein and oil contents and seed weight in soybean. Crop Science 2013, 53, 765–774. [Google Scholar] [CrossRef]
- Priolli, R.H.G.; Campos, J.B.; Stabellini, N.S.; Pinheiro, J.B.; Vello, N.A. Association mapping of oil content and fatty acid components in soybean. Euphytica 2014, 203, 83–96. [Google Scholar] [CrossRef]
- Diers, B.W.; Shoemaker, R.C. Restriction fragment length polymorphism analysis of soybean fatty acid content. Journal of the American Oil Chemists Society 1992, 69, 1242–1244. [Google Scholar] [CrossRef]
- Li, Z.; Wilson, R.F.; Rayford, W.E.; Boerma, H.R. Molecular mapping genes conditioning reduced palmitic acid content in n87-2122-4 soybean. Crop Science 2002, 42, 373–378. [Google Scholar]
- Li, H.; Zhao, T.; Wang, Y.; Yu, D.; Chen, S.; Zhou, R.; Gai, J. Genetic structure composed of additive qtl, epistatic qtl pairs and collective unmapped minor qtl conferring oil content and fatty acid components of soybeans. Euphytica 2011, 182. [Google Scholar] [CrossRef]
- Xie, D.; Han, Y.; Zeng, Y.; Chang, W.; Teng, W.; Li, W. Ssr- and snp-related qtl underlying linolenic acid and other fatty acid contents in soybean seeds across multiple environments. Molecular Breeding 2011, 30, 169–179. [Google Scholar] [CrossRef]
- Zhong, Y.; Li, X.; Wang, S.; Li, S.; Zeng, Y.; Cheng, Y.; Ma, Q.; Wang, Y.; Pang, Y.; Nian, H. , et al. Mapping and identification of qtls for seed fatty acids in soybean (glycine max l.). Journal of Integrative Agriculture 2024, 23, 3966–3982. [Google Scholar] [CrossRef]
- Zhou, Z.; Jiang, Y.; Wang, Z.; Gou, Z.; Lyu, J.; Li, W.; Yu, Y.; Shu, L.; Zhao, Y.; Ma, Y. , et al. Resequencing 302 wild and cultivated accessions identifies genes related to domestication and improvement in soybean. Nature Biotechnology 2015, 33, 408–414. [Google Scholar] [CrossRef]
- Bachlava, E.; Dewey, R.E.; Burton, J.W.; Cardinal, A.J. Mapping and comparison of quantitative trait loci for oleic acid seed content in two segregating soybean populations. Crop Science 2009, 49, 433–442. [Google Scholar] [CrossRef]
- Jiang, A.; Liu, J.; Gao, W.; Ma, R.; Tan, P.; Liu, F.; Zhang, J. Construction of a genetic map and qtl mapping of seed size traits in soybean. Frontiers in Genetics 2023, 14. [Google Scholar] [CrossRef]
- Jason T., C. Tzen, Y.-z.C., Pascal Laurent, Chandra Ratnayake, and Anthony H. C. Huang. Lipids, proteins, and structure of seed oil bodies from diverse species. Plant physiology 1993, 101, 267–276. [Google Scholar]
- Chen, X.G., Z. H.. Research and application of DNA molecular marker technology. Mol. Plant Breed 2019, 17(6), 1970–1977. [Google Scholar]
- Wu, X.L.; He, C.Y.; Wang, Y.J.; Zhang, Z.Y.; Dongfang, Y.; Zhang, J.S.; Chen, S.Y.; Gai, J.Y. [construction and analysis of a genetic linkage map of soybean]. Yi chuan xue bao = Acta genetica Sinica 2001, 28, 1051–1061. [Google Scholar]
- Do, P.T.; Nguyen, C.X.; Bui, H.T.; Tran, L.T.N.; Stacey, G.; Gillman, J.D.; Zhang, Z.J.; Stacey, M.G. Demonstration of highly efficient dual grna crispr/cas9 editing of the homeologous gmfad2-1a and gmfad2-1b genes to yield a high oleic, low linoleic and α-linolenic acid phenotype in soybean. BMC plant biology 2019, 19, 311. [Google Scholar] [CrossRef] [PubMed]
- Cregan, P.B.; Jarvik, T.; Bush, A.L.; Shoemaker, R.C.; Lark, K.G.; Kahler, A.L.; Kaya, N.; VanToai, T.T.; Lohnes, D.G.; Chung, J. , et al. An integrated genetic linkage map of the soybean genome. Crop Science 1999, 39, 1464–1490. [Google Scholar] [CrossRef]
- Liu, J.; Jiang, A.; Ma, R.; Gao, W.; Tan, P.; Li, X.; Du, C.; Zhang, J.; Zhang, X.; Zhang, L. , et al. Qtl mapping for seed quality traits under multiple environments in soybean (glycine max l.). Agronomy 2023, 13. [Google Scholar]
- 26. Qi, H.; Wang, W.; Tang, X.; Xue, Y.; Cao, D.; Liu, X.; Luan, X.; Du, J.; Qiu, L., QTL Mining of Protein and Oil Content in Elite Soybean Germplasm. Journal of Plant Genetic Resources 2023, 24(05), 1435–1447.
- Zhu, X.; Leiser, W.L.; Hahn, V.; Würschum, T. Identification of seed protein and oil related qtl in 944 rils from a diallel of early-maturing european soybean. The Crop Journal 2021, 9, 238–247. [Google Scholar] [CrossRef]
- Cardinal, A.J.; Whetten, R.; Wang, S.; Auclair, J.; Hyten, D.; Cregan, P.; Bachlava, E.; Gillman, J.; Ramirez, M.; Dewey, R. , et al. Mapping the low palmitate fap1 mutation and validation of its effects in soybean oil and agronomic traits in three soybean populations. TAG. Theoretical and applied genetics. Theoretische und angewandte Genetik 2014, 127, 97–111. [Google Scholar] [CrossRef]
- Reinprecht, Y.; Poysa, V.W.; Yu, K.; Rajcan, I.; Ablett, G.R.; Pauls, K.P. Seed and agronomic qtl in low linolenic acid, lipoxygenase-free soybean (glycine max (l.) merrill) germplasm. Genome 2006, 49, 1510–1527. [Google Scholar] [CrossRef]
- Panthee, D.R.; Pantalone, V.R.; Saxton, A.M. Modifier qtl for fatty acid composition in soybean oil. Euphytica 2006, 152, 67–73. [Google Scholar] [CrossRef]
- Fan, S.; Li, B.; Yu, F.; Han, F.; Yan, S.; Wang, L.; Sun, J. Analysis of additive and epistatic quantitative trait loci underlying fatty acid concentrations in soybean seeds across multiple environments. Euphytica 2015, 206, 689–700. [Google Scholar] [CrossRef]
- Qi, Z.-m.; Wu, Q.; Han, X.; Sun, Y.-n.; Du, X.-y.; Liu, C.-y.; Jiang, H.-w.; Hu, G.-h.; Chen, Q.-s. Soybean oil content qtl mapping and integrating with meta-analysis method for mining genes. Euphytica 2011, 179, 499–514. [Google Scholar] [CrossRef]
- Yao, Y.; You, Q.; Duan, G.; Ren, J.; Chu, S.; Zhao, J.; Li, X.; Zhou, X.; Jiao, Y. Quantitative trait loci analysis of seed oil content and composition of wild and cultivated soybean. BMC plant biology 2020, 20, 51. [Google Scholar] [CrossRef] [PubMed]
- Phansak, P.; Soonsuwon, W.; Hyten, D.L.; Song, Q.; Cregan, P.B.; Graef, G.L.; Specht, J.E. Multi-population selective genotyping to identify soybean [glycine max (l.) merr.] seed protein and oil qtls. G3 (Bethesda, Md.) 2016, 6, 1635–1648. [Google Scholar] [CrossRef]
- Huo, W.; Li, B.; Kuang, J.; He, P.; Xu, Z.; Wang, J. Functional characterization of the steroid reductase genes gmdet2a and gmdet2b form glycine max. International journal of molecular sciences 2018, 19. [Google Scholar] [CrossRef]
- Zheng, H.; Rowland, O.; Kunst, L. Disruptions of the arabidopsis enoyl-coa reductase gene reveal an essential role for very-long-chain fatty acid synthesis in cell expansion during plant morphogenesis. The Plant cell 2005, 17, 1467–1481. [Google Scholar] [CrossRef]
- Arias, C.L.; Quach, T.; Huynh, T.; Nguyen, H.; Moretti, A.; Shi, Y.; Guo, M.; Rasoul, A.; Van, K.; McHale, L. , et al. Expression of atwri1 and atdgat1 during soybean embryo development influences oil and carbohydrate metabolism. Plant biotechnology journal 2022, 20, 1327–1345. [Google Scholar] [CrossRef]
- Wu, J.; Wang, Q.; Han, W.; Zhao, Q.; Sun, D.; Shen, Z. Qtl mapping and candidate gene screening for enhancing oil content in silage maize. Plants (Basel, Switzerland) 2025, 14. [Google Scholar] [CrossRef]
- Otyama, P.I.; Chamberlin, K.; Ozias-Akins, P.; Graham, M.A.; Cannon, E.K.S.; Cannon, S.B.; MacDonald, G.E.; Anglin, N.L. Genome-wide approaches delineate the additive, epistatic, and pleiotropic nature of variants controlling fatty acid composition in peanut (arachis hypogaea l.). G3 (Bethesda, Md.) 2022, 12. [Google Scholar] [CrossRef]
- Lusk, H.J.; Neumann, N.; Colter, M.; Roth, M.R.; Tamura, P.; Yao, L.; Shiva, S.; Shah, J.; Schrick, K.; Durrett, T.P. , et al. Lipidomic analysis of arabidopsis t-DNA insertion lines leads to identification and characterization of c-terminal alterations in fatty acid desaturase 6. Plant & cell physiology 2022, 63, 1193–1204. [Google Scholar]
- Reinprecht, Y.; Pauls, K.P. Microsomal omega-3 fatty acid desaturase genes in low linolenic acid soybean line rg10 and validation of major linolenic acid qtl. Front Genet 2016, 7, 38. [Google Scholar] [CrossRef] [PubMed]
- Li, Y.H.; Reif, J.C.; Ma, Y.S.; Hong, H.L.; Liu, Z.X.; Chang, R.Z.; Qiu, L.J. Targeted association mapping demonstrating the complex molecular genetics of fatty acid formation in soybean. BMC genomics 2015, 16, 841. [Google Scholar] [CrossRef] [PubMed]
- Akond, M.; Yuan, J.; Liu, S.; Kantartzi, S.K.; Meksem, K.; Bellaloui, N.; Lightfoot, D.A.; Kassem, M.A.; Willenborg, C. Detection of qtl underlying seed quality components in soybean [glycine max (l.) merr.]. Canadian Journal of Plant Science 2018, 98, 881–888. [Google Scholar] [CrossRef]
Figure 1.
Organogram of fatty acid content in the F2 population under six environments.
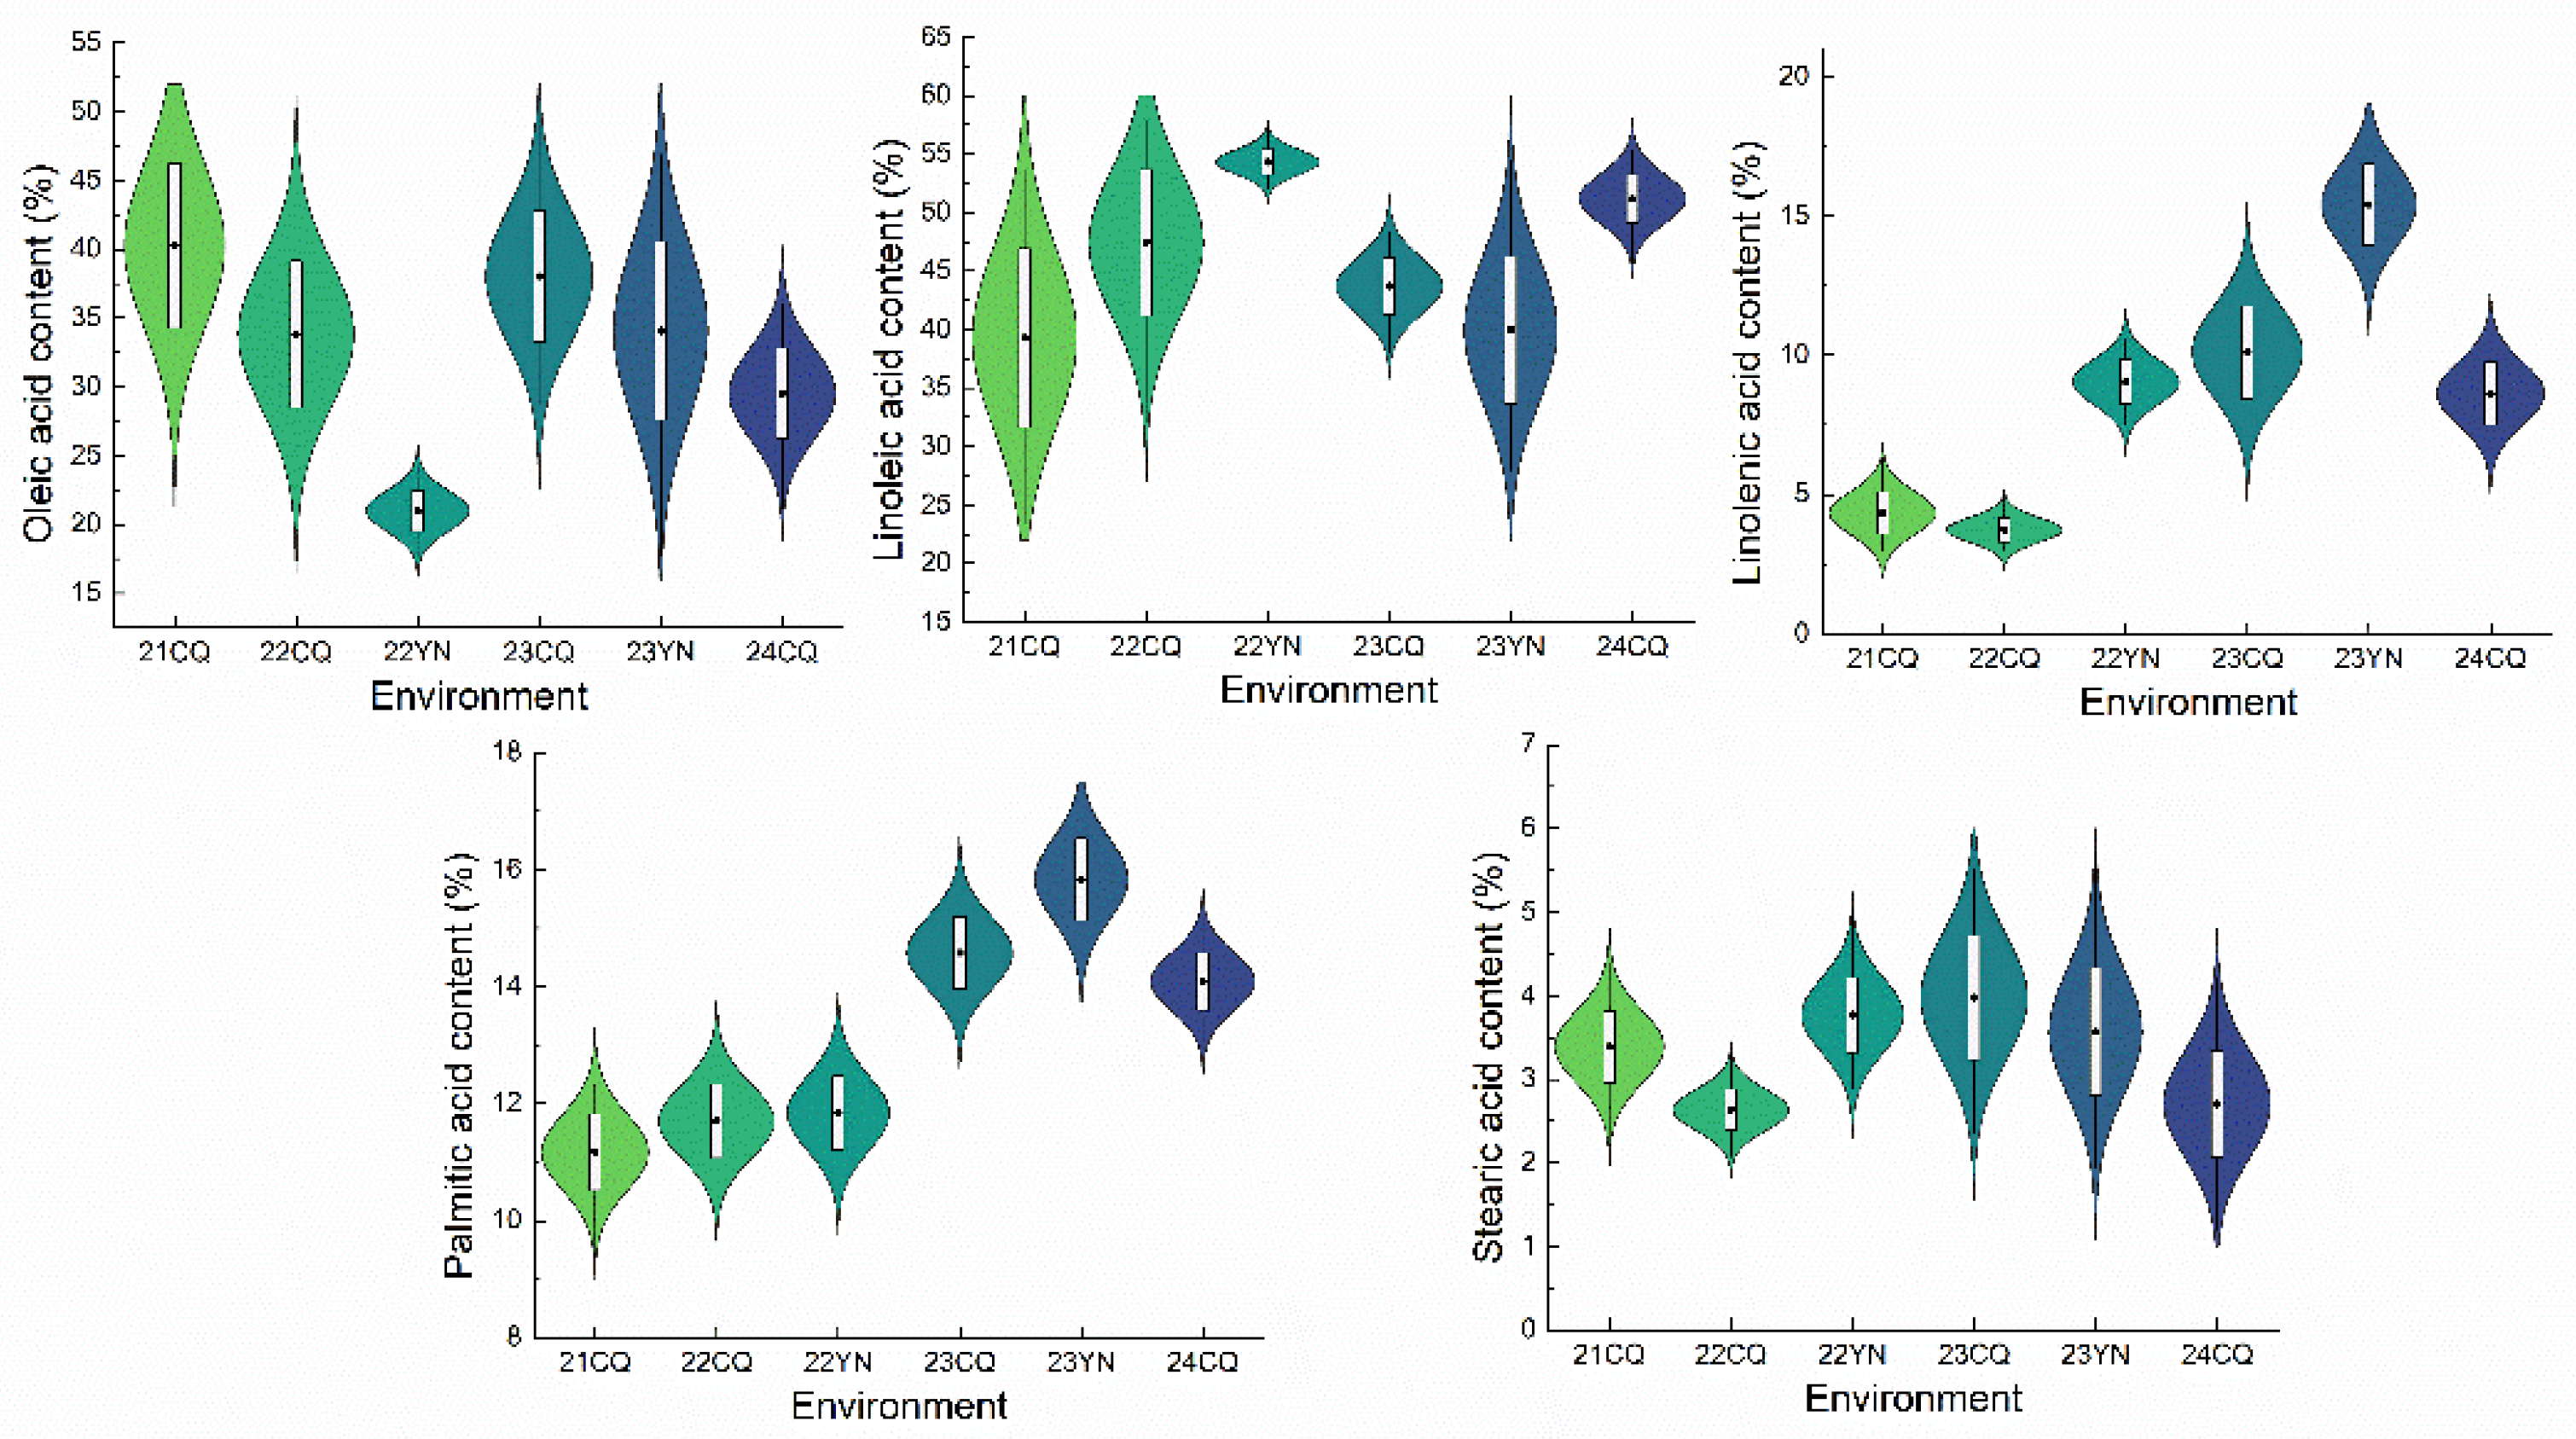
Figure 2.
Correlation analysis of the contents of five fatty acids. Note: The darkness of the color inside the circles indicates the degree of correlation. Dark blue represents positive correlation, and dark red represents negative correlation. The size of the circles and the values in the boxes correspond to the degree of correlation and the correlation coefficient between the components, respectively. * and ** indicate significant differences at P < 0.05 and P < 0.01, respectively.
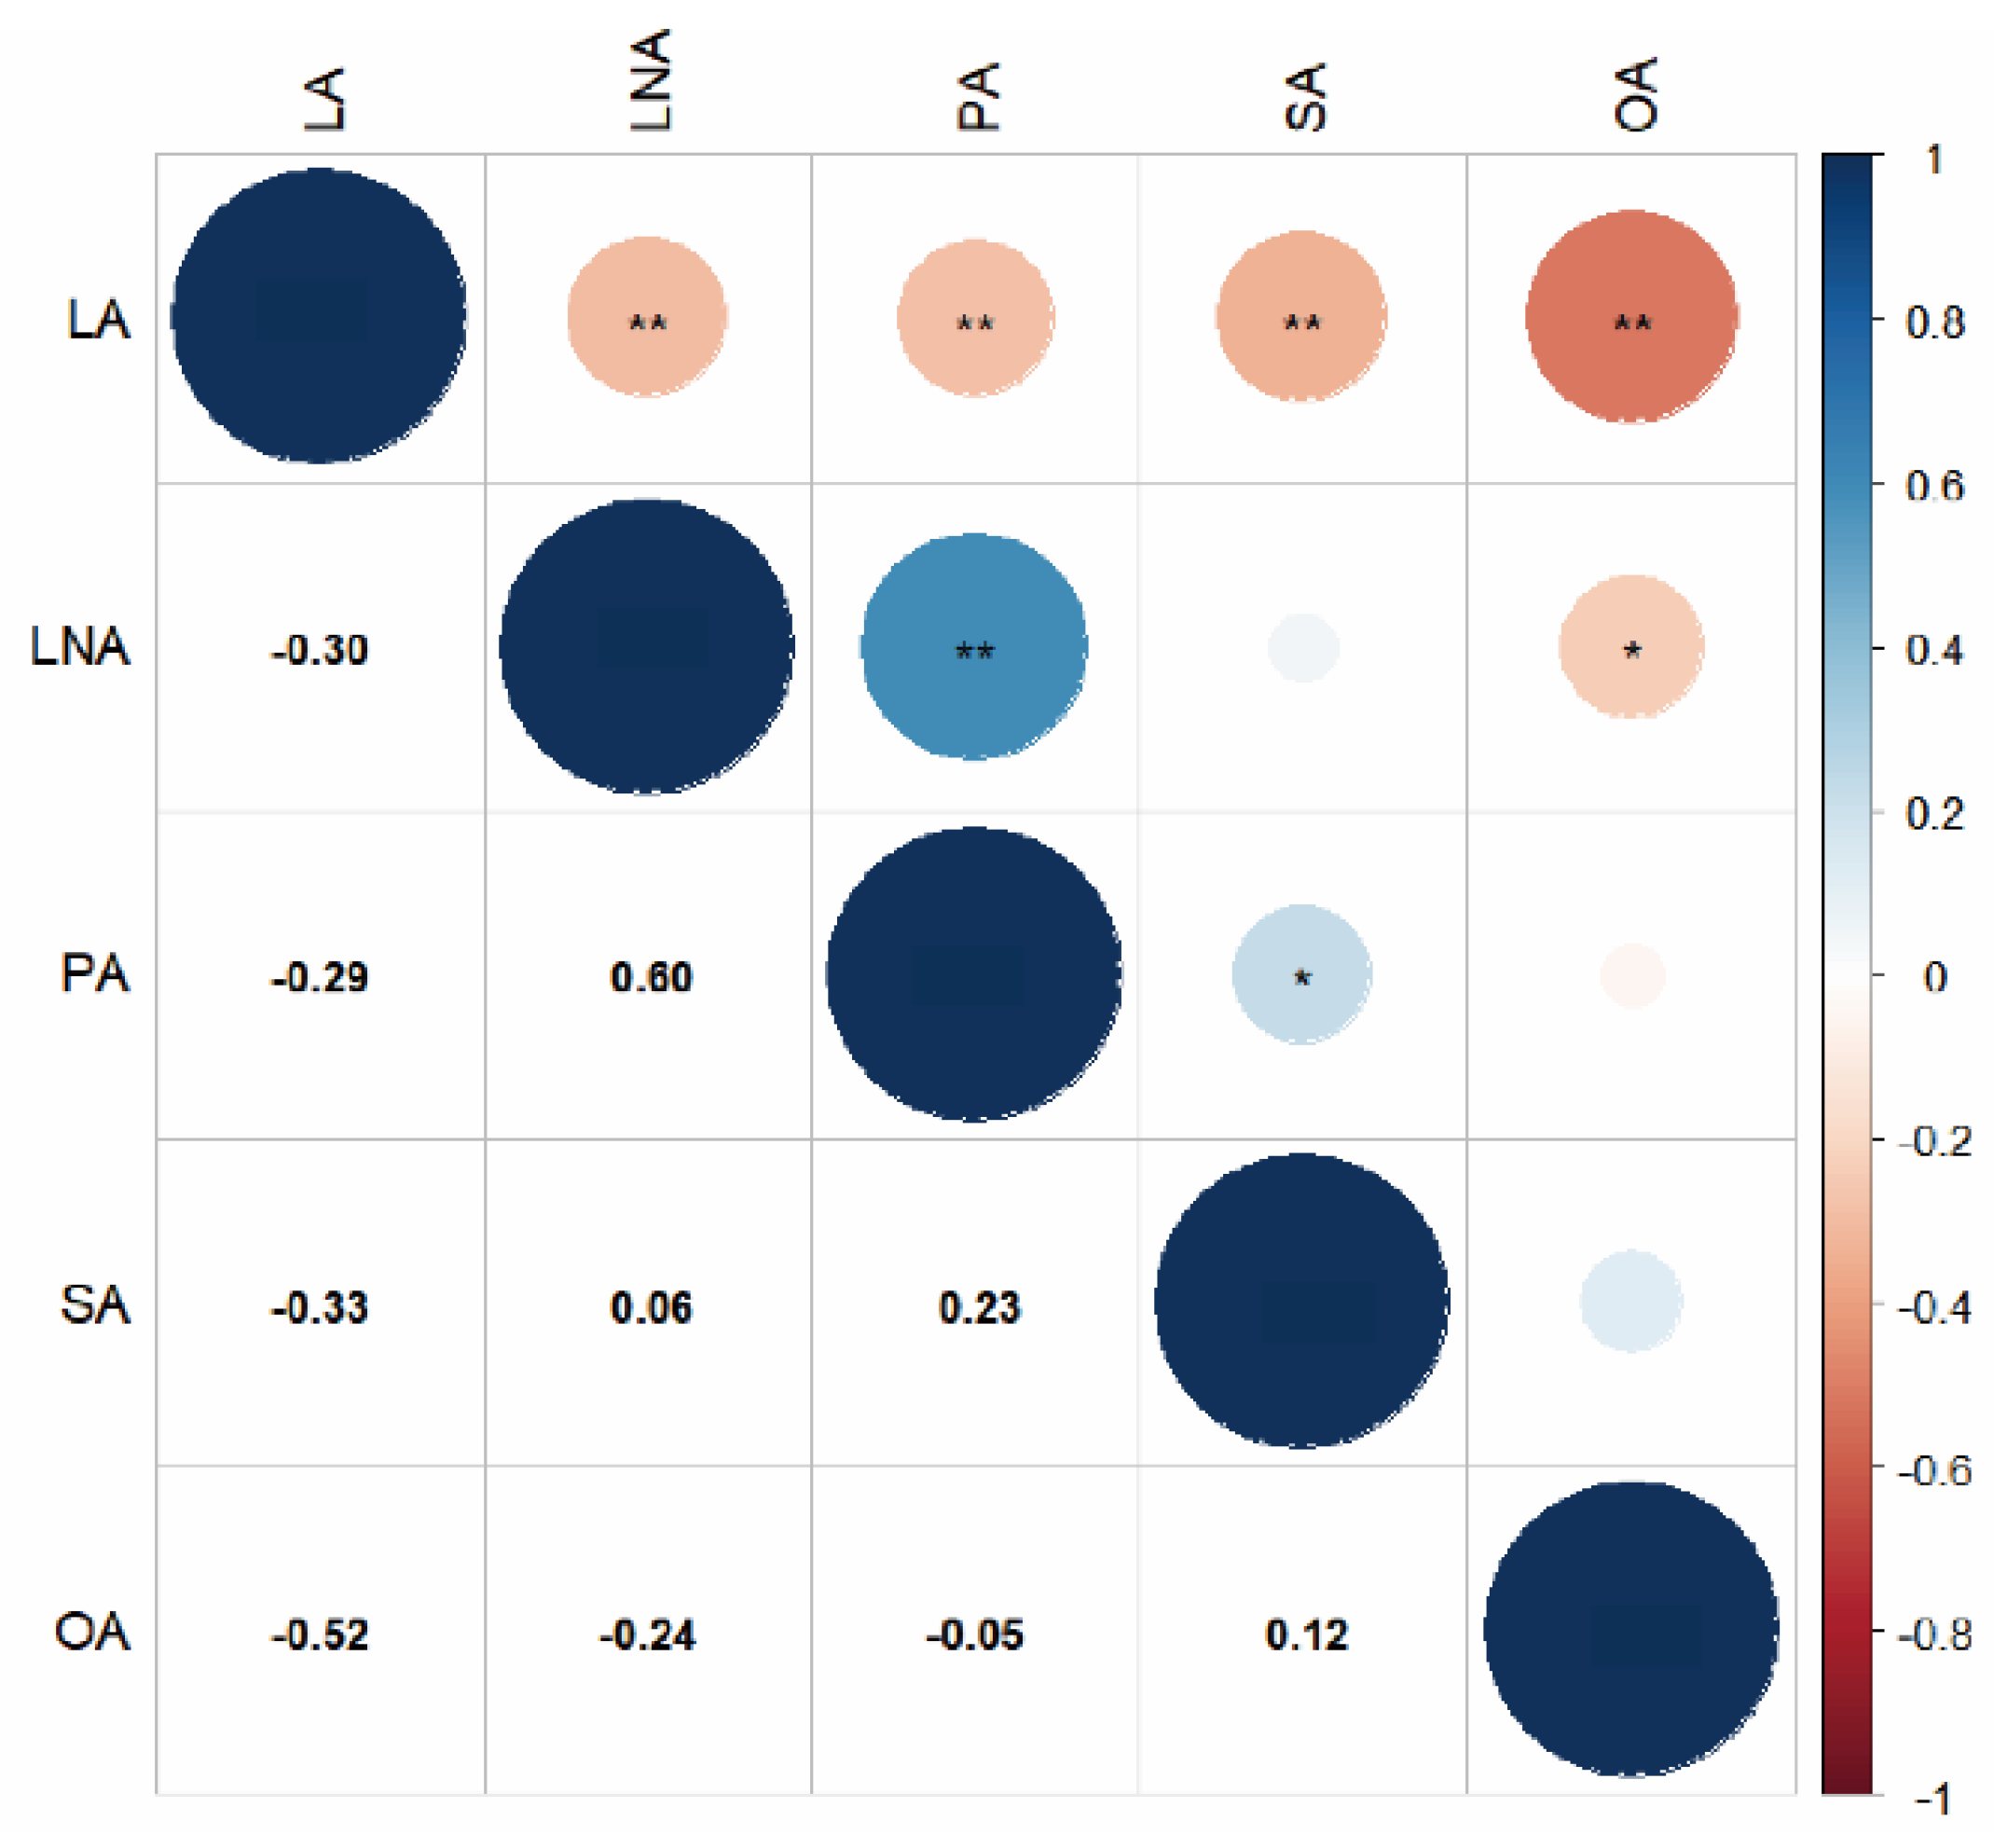
Figure 3.
Linkage map derived from (CJC2 × JY166) F2 population.
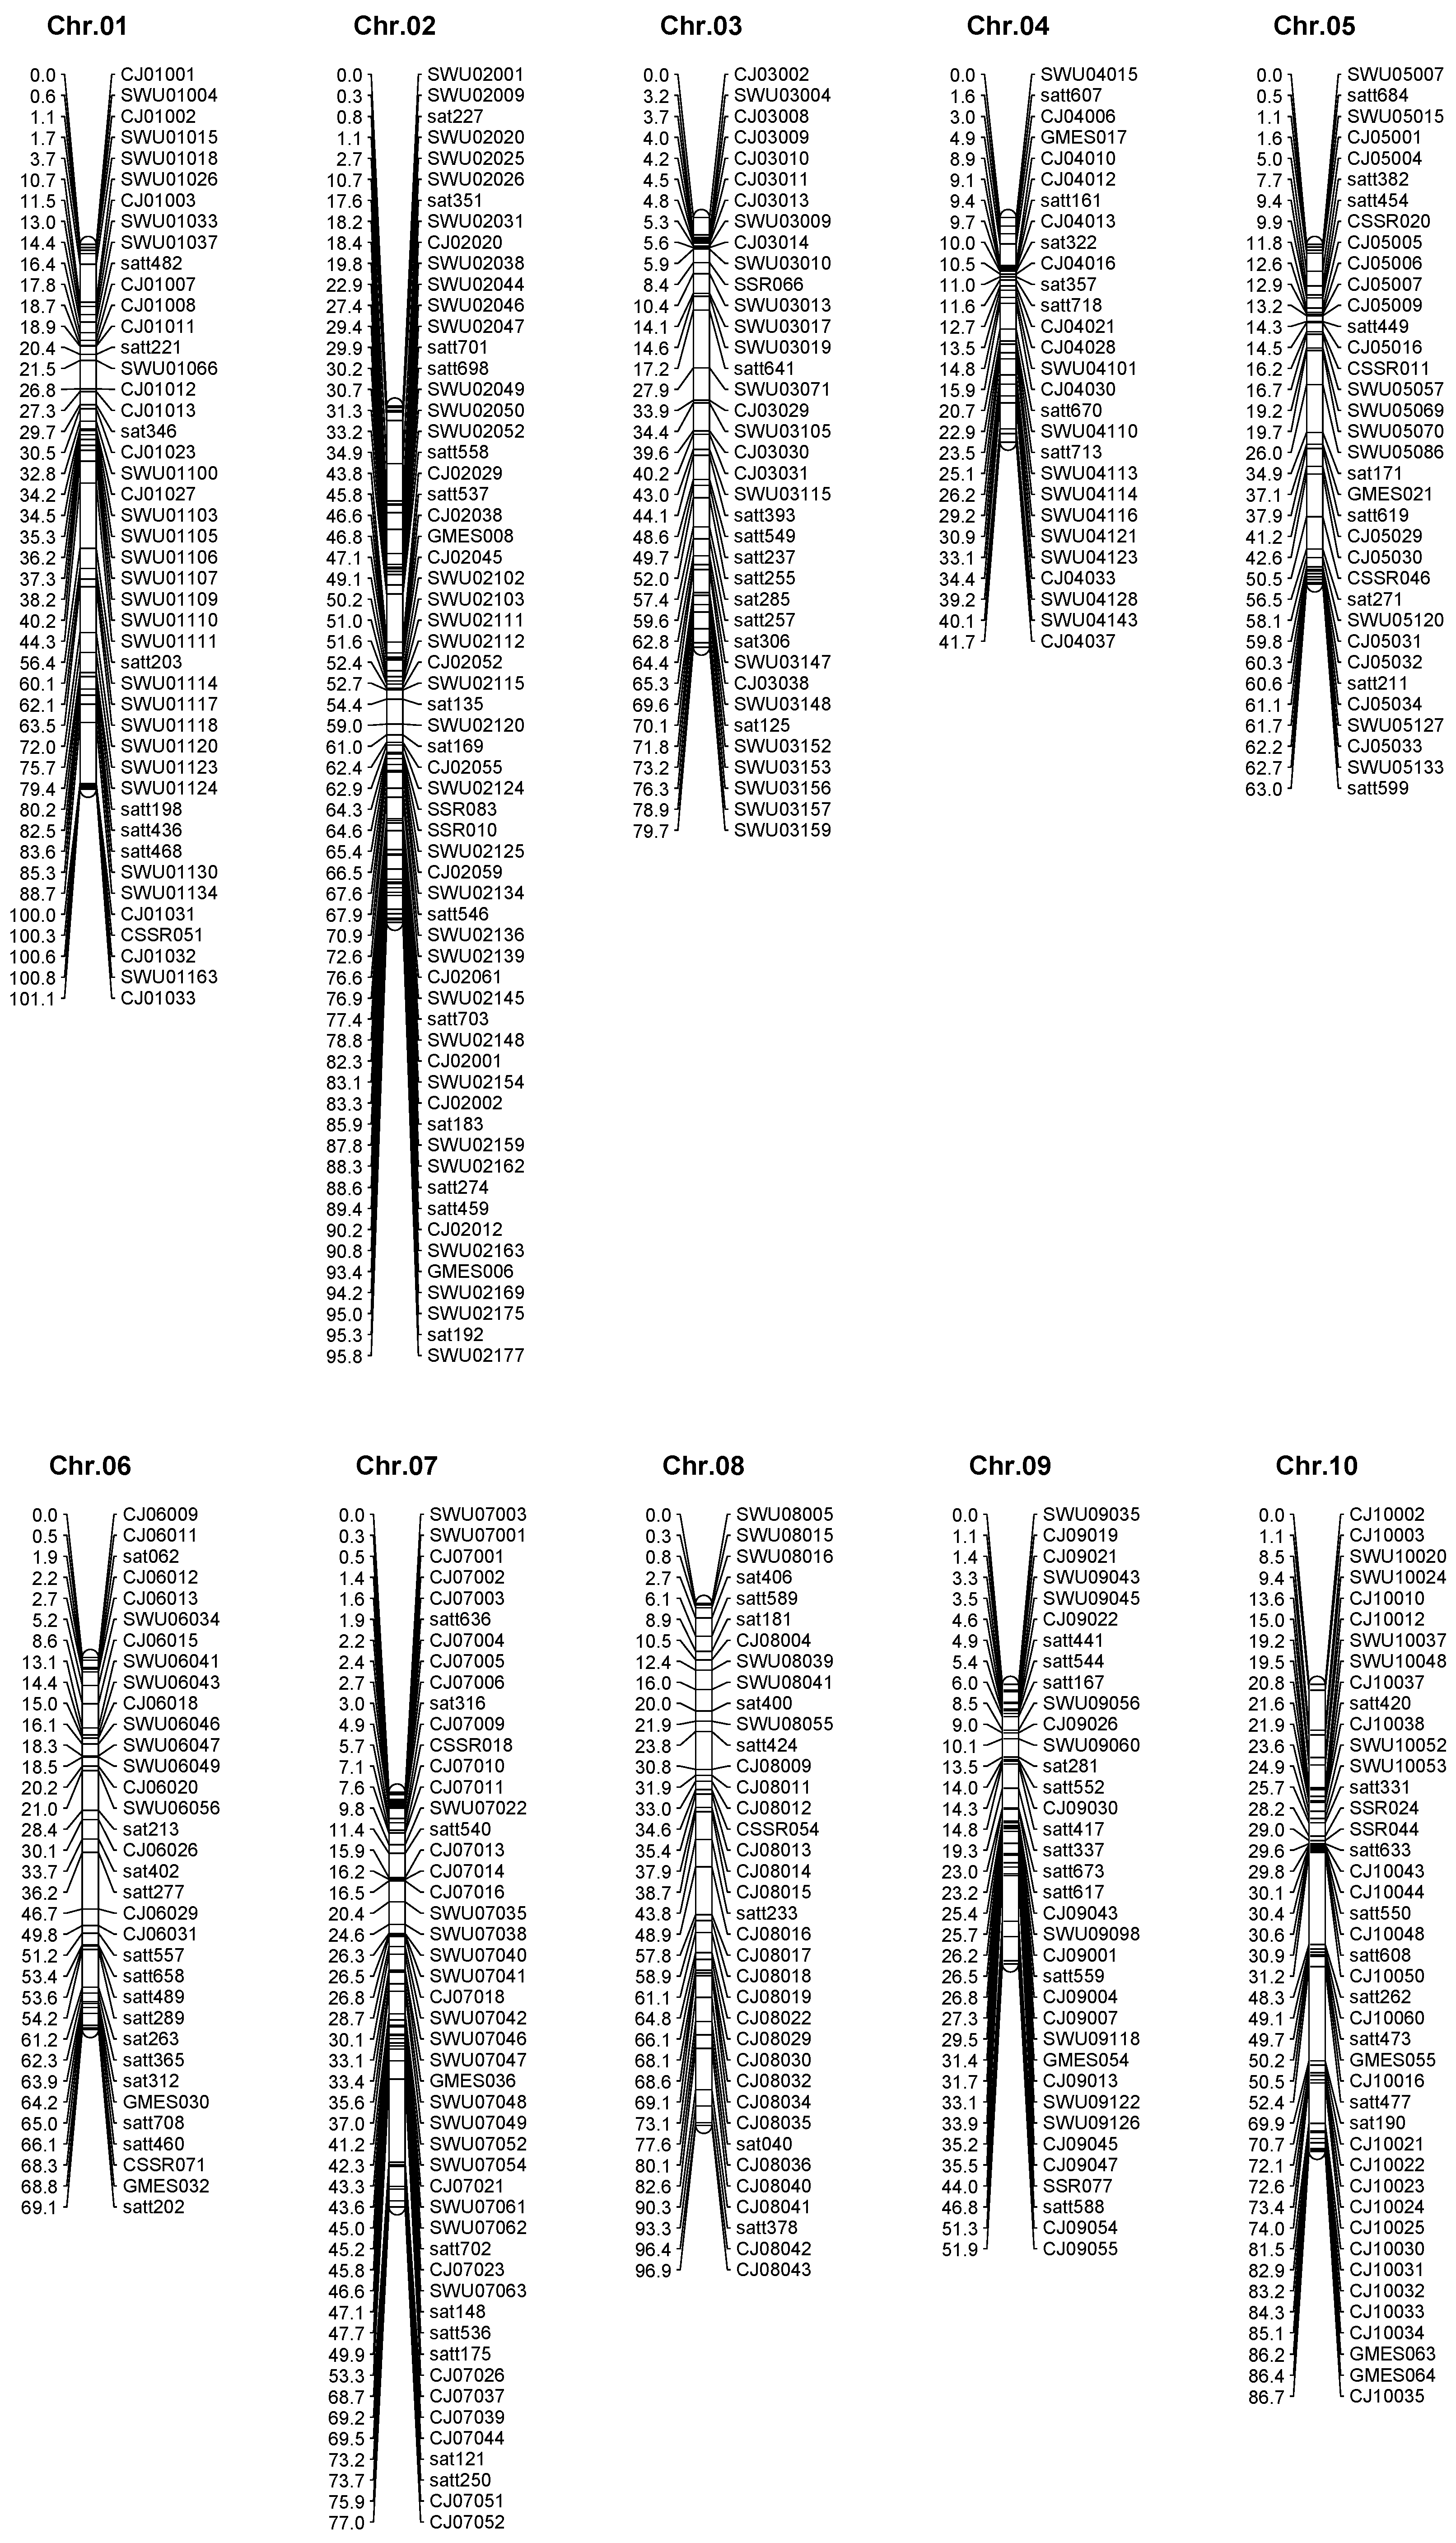
Figure 4.
Detected QTL for five fatty acid in seeds derived from (CJC2 × JY166) population.
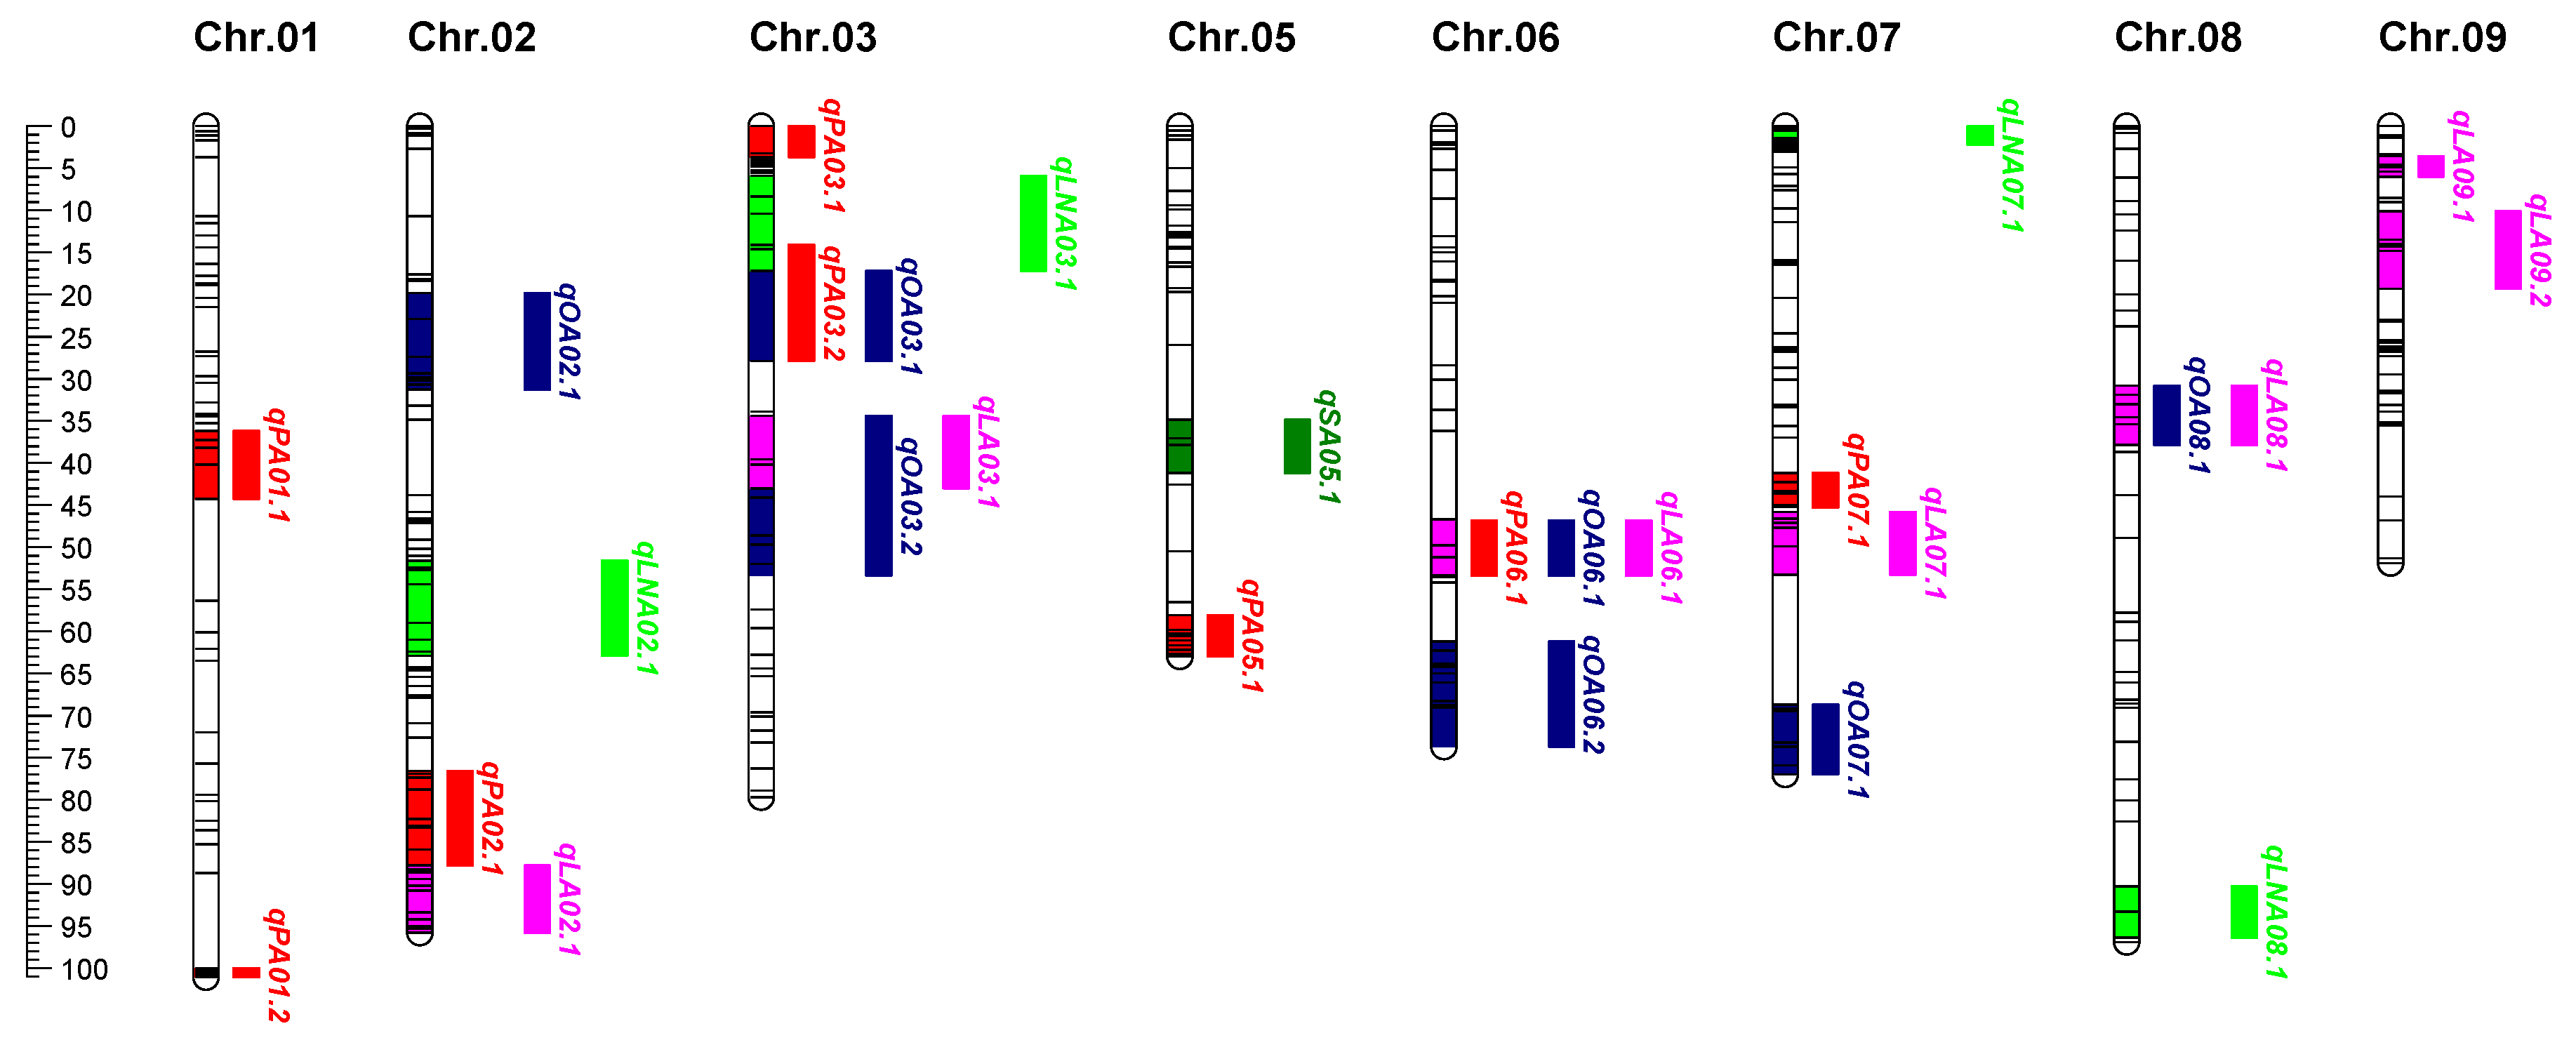
Figure 5.
GO term enrichment analysis of the genes located within the four stable QTLs.
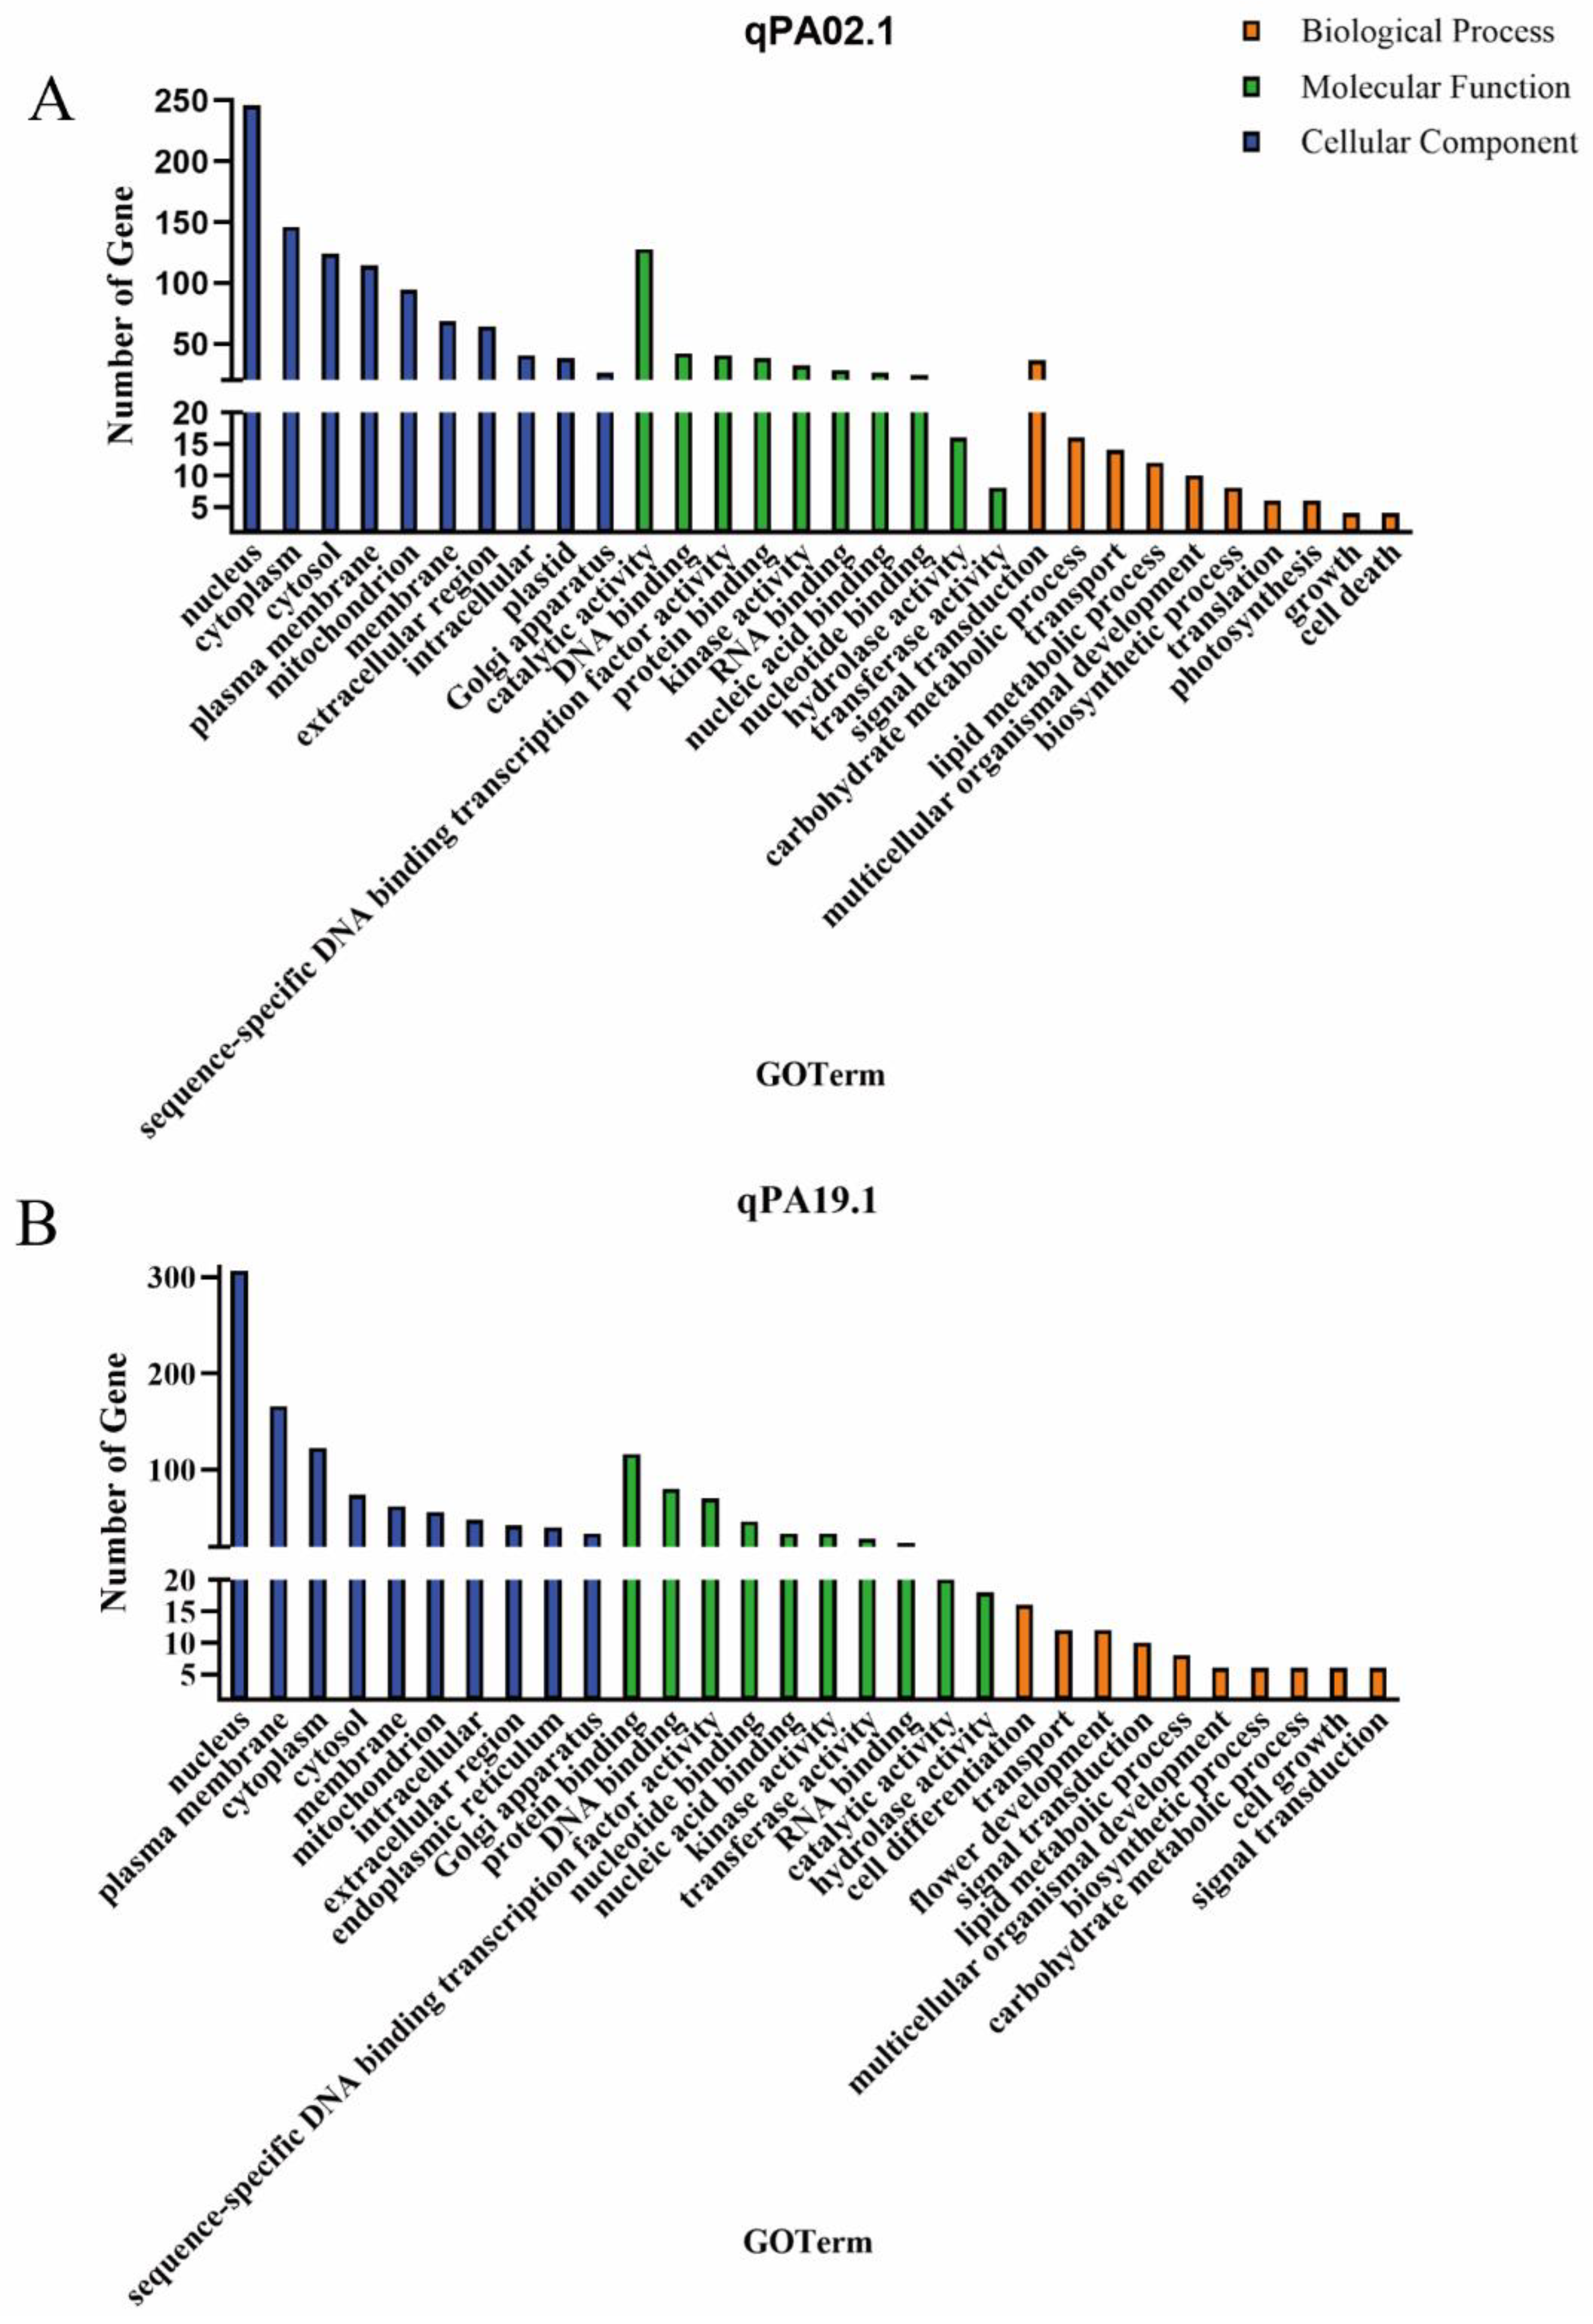
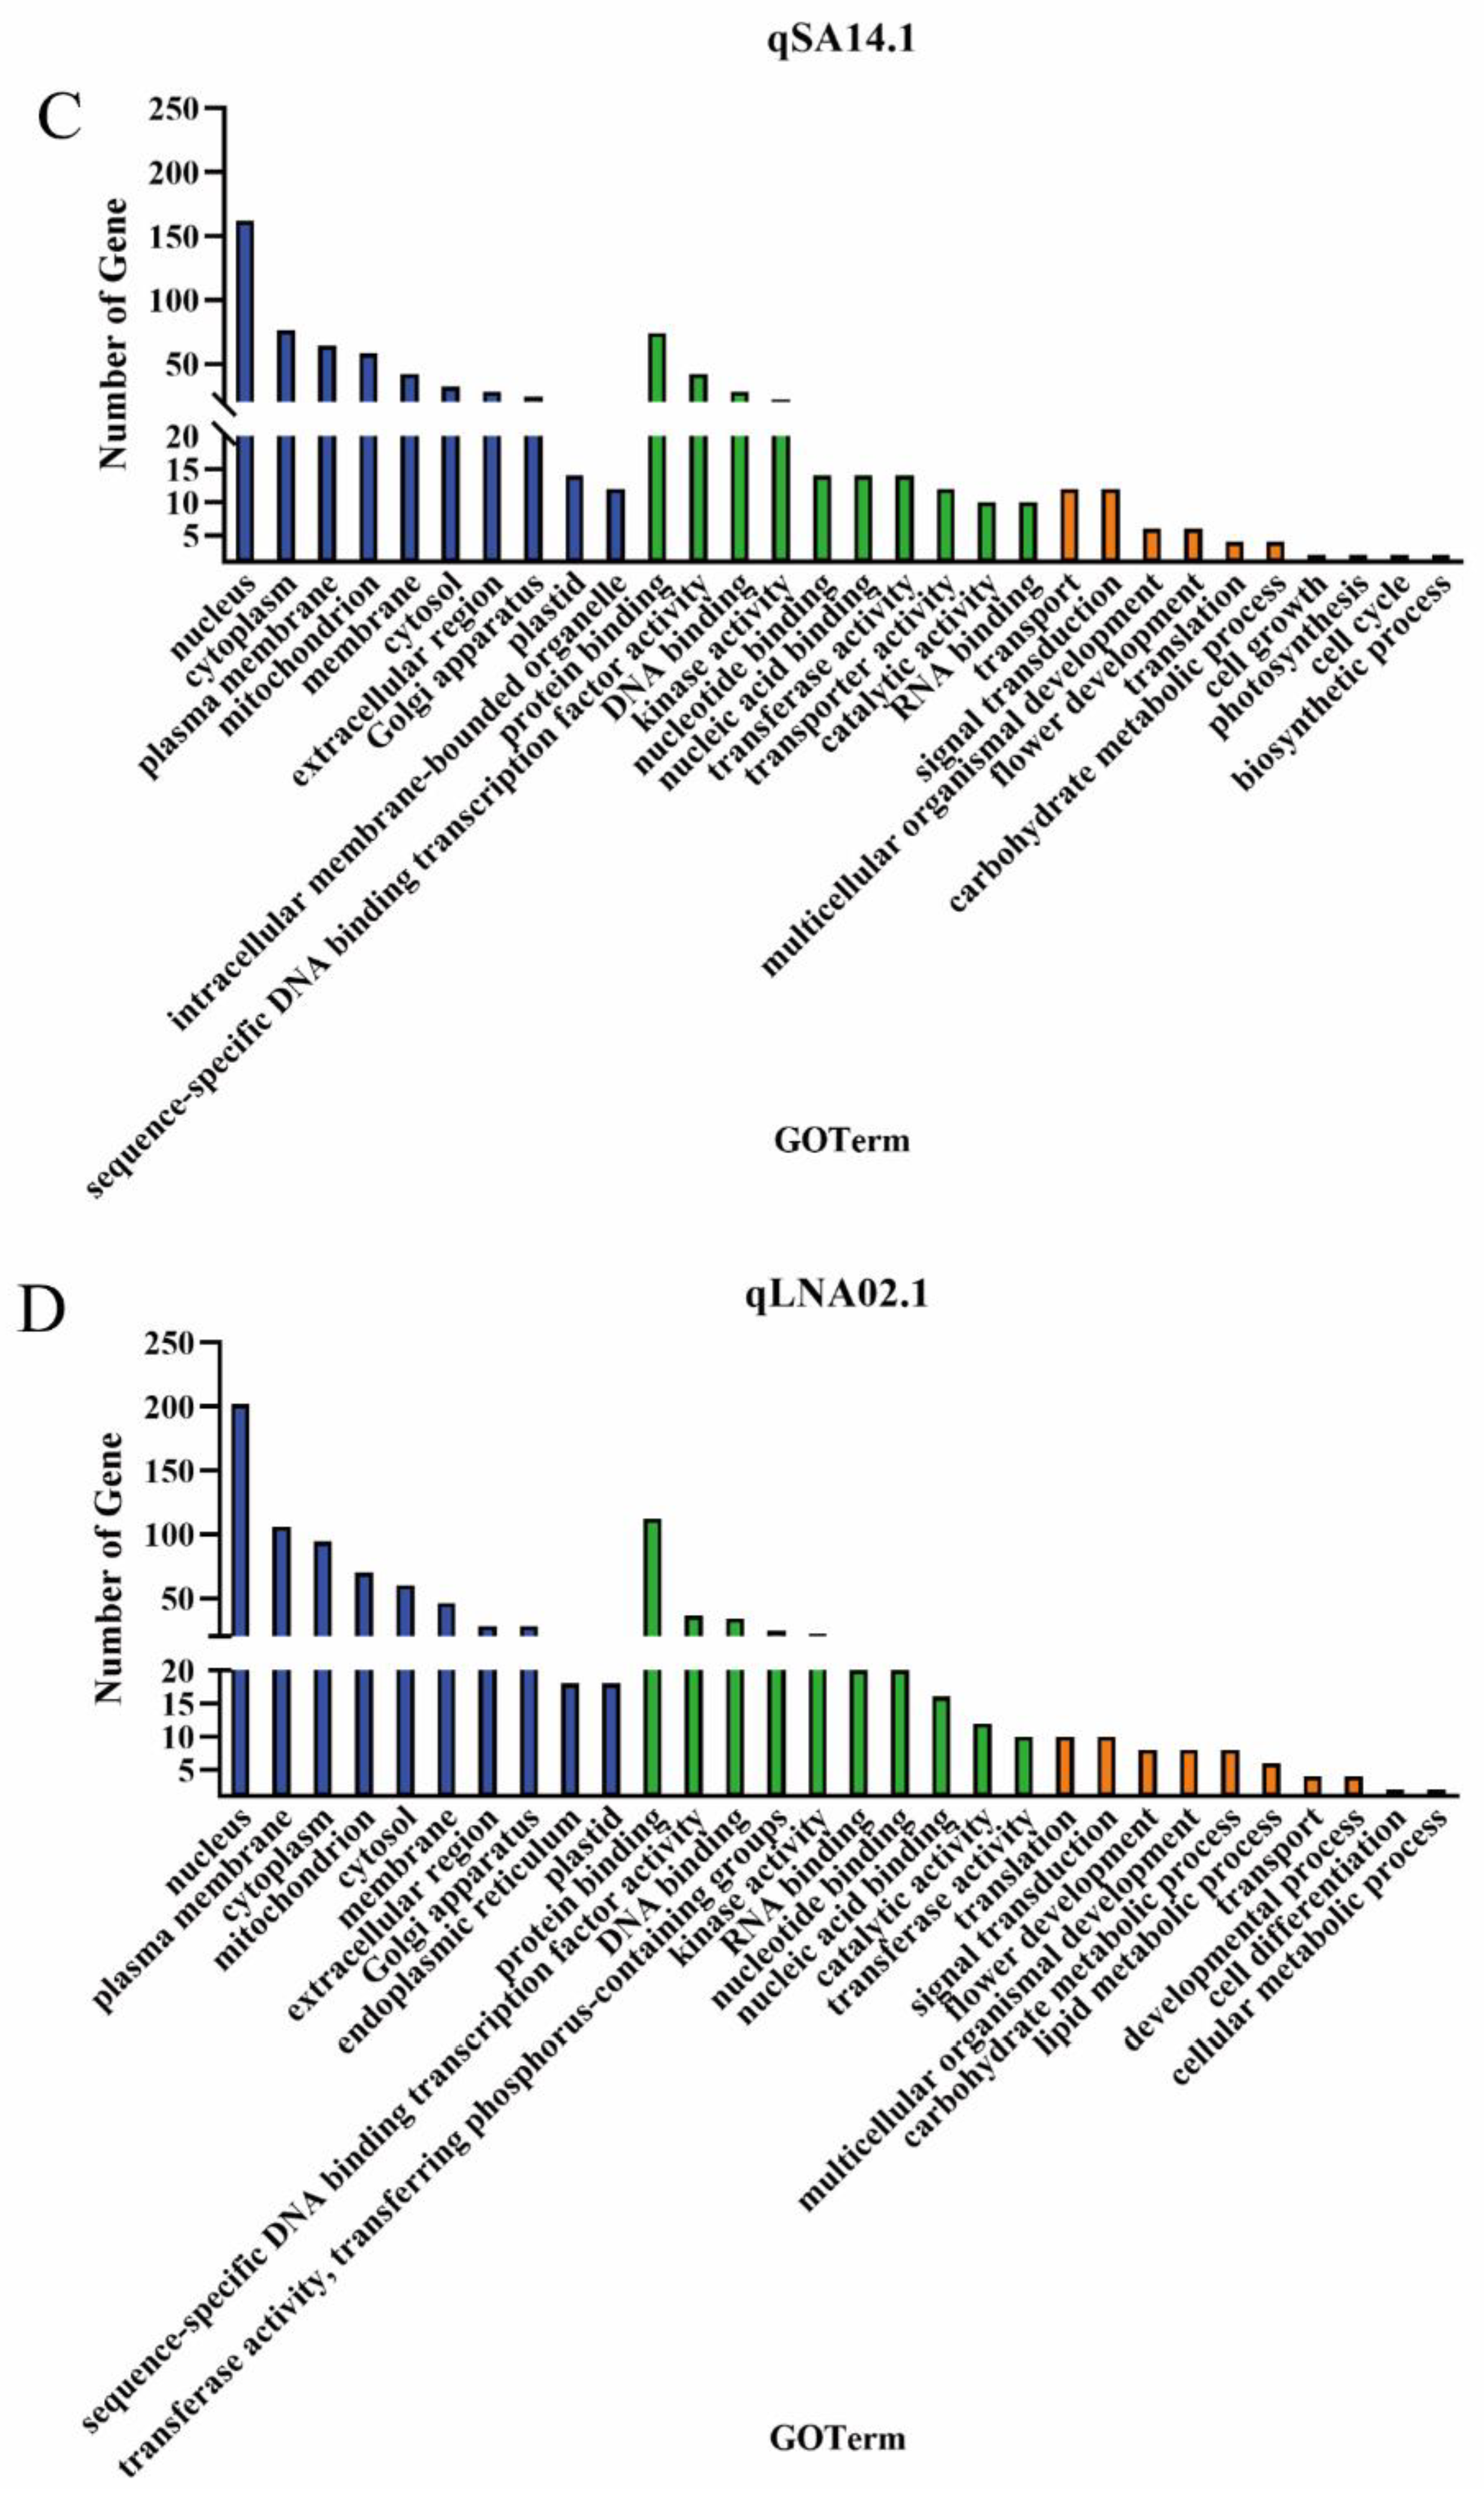

Table 1.
Phenotypic analysis of fatty acid content in the F2 population and its parents under six environments.
Table 1.
Phenotypic analysis of fatty acid content in the F2 population and its parents under six environments.
| Traits | Env. | Parent | Population | |||||||||
| CJC2 | JY166 | Mean | Min | Max | SD | Variance | CV(%) | Skewness | Kurtosis | |||
| PA | 21CQ | 11.28 | 9.46 | 11.17 | 8.98 | 12.32 | 0.65 | 0.42 | 0.06 | -0.60 | 0.67 | |
| 22CQ | 11.32 | 10.40 | 11.70 | 9.82 | 13.37 | 0.64 | 0.40 | 0.06 | -0.34 | 0.76 | ||
| 22YN | 11.59 | 10.88 | 11.83 | 10.40 | 13.17 | 0.64 | 0.41 | 0.05 | 0.06 | -0.65 | ||
| 23CQ | 14.21 | 12.37 | 14.58 | 12.82 | 16.04 | 0.62 | 0.39 | 0.04 | -0.35 | 0.76 | ||
| 23YN | 15.95 | 14.56 | 15.83 | 13.91 | 16.95 | 0.70 | 0.49 | 0.04 | -0.44 | -0.30 | ||
| 24CQ | 14.89 | 13.42 | 14.08 | 12.78 | 15.06 | 0.49 | 0.24 | 0.03 | -0.18 | 0.26 | ||
| SA | 21CQ | 1.83 | 3.55 | 3.39 | 2.20 | 4.40 | 0.43 | 0.19 | 0.13 | -0.16 | 0.09 | |
| 22CQ | 1.77 | 2.79 | 2.63 | 1.77 | 3.45 | 0.26 | 0.06 | 0.10 | 0.43 | 0.82 | ||
| 22YN | 2.59 | 3.62 | 3.77 | 2.88 | 5.18 | 0.45 | 0.20 | 0.12 | 0.50 | 0.87 | ||
| 23CQ | 2.26 | 2.87 | 3.98 | 2.34 | 5.52 | 0.75 | 0.56 | 0.19 | -0.08 | -0.52 | ||
| 23YN | 2.65 | 3.76 | 3.57 | 1.93 | 5.72 | 0.76 | 0.58 | 0.21 | 0.40 | -0.14 | ||
| 24CQ | 1.96 | 3.47 | 2.70 | 1.18 | 4.23 | 0.64 | 0.41 | 0.24 | 0.31 | -0.19 | ||
| OA | 21CQ | 39.23 | 37.64 | 40.38 | 28.42 | 50.70 | 6.05 | 36.54 | 0.15 | -0.10 | -0.77 | |
| 22CQ | 33.26 | 31.38 | 33.81 | 22.10 | 46.34 | 5.34 | 28.53 | 0.16 | 0.22 | -0.47 | ||
| 22YN | 20.87 | 19.34 | 20.99 | 17.64 | 24.09 | 1.48 | 2.18 | 0.07 | 0.05 | -0.63 | ||
| 23CQ | 37.57 | 35.78 | 38.03 | 28.74 | 50.88 | 4.77 | 22.76 | 0.13 | 0.65 | 0.44 | ||
| 23YN | 40.92 | 34.34 | 34.07 | 17.73 | 46.93 | 6.47 | 41.86 | 0.19 | -0.24 | 0.26 | ||
| 24CQ | 31.54 | 28.66 | 29.51 | 21.22 | 35.94 | 3.30 | 10.89 | 0.11 | -0.17 | -0.32 | ||
| LA | 21CQ | 38.47 | 42.13 | 39.27 | 23.33 | 53.56 | 7.66 | 58.67 | 0.20 | -0.16 | -0.74 | |
| 22CQ | 48.97 | 51.97 | 47.43 | 32.11 | 57.86 | 6.27 | 39.20 | 0.13 | -0.51 | -0.30 | ||
| 22YN | 53.32 | 55.25 | 54.31 | 52.08 | 57.21 | 1.08 | 1.17 | 0.02 | 0.24 | 0.16 | ||
| 23CQ | 49.53 | 50.11 | 43.71 | 38.07 | 48.35 | 2.43 | 5.88 | 0.06 | -0.23 | -0.42 | ||
| 23YN | 36.40 | 40.16 | 39.95 | 27.97 | 54.40 | 6.30 | 39.64 | 0.16 | 0.23 | -0.30 | ||
| 24CQ | 49.73 | 52.34 | 51.17 | 5.73 | 55.32 | 2.11 | 4.45 | 0.04 | -0.24 | -0.20 | ||
| LNA | 21CQ | 5.34 | 4.17 | 4.33 | 3.01 | 6.29 | 0.77 | 0.60 | 0.18 | 0.49 | -0.38 | |
| 22CQ | 4.68 | 3.45 | 3.73 | 2.92 | 5.01 | 0.46 | 0.20 | 0.12 | 0.88 | 0.57 | ||
| 22YN | 9.87 | 8.22 | 9.04 | 7.49 | 10.63 | 0.81 | 0.66 | 0.09 | 0.02 | -0.99 | ||
| 23CQ | 10.31 | 9.15 | 10.11 | 4.74 | 13.42 | 1.66 | 2.76 | 0.16 | -0.39 | 0.52 | ||
| 23YN | 15.46 | 13.72 | 15.41 | 11.50 | 17.95 | 1.46 | 2.14 | 0.09 | -0.66 | 0.17 | ||
| 24CQ | 9.26 | 7.72 | 8.62 | 6.29 | 10.94 | 1.12 | 1.26 | 0.13 | -0.12 | -0.52 | ||
Note: CJC2: Changjiangchun2, JY166: Jiyu166, palmitic acid (PA), stearic acid (SA), oleic acid (OA), linoleic acid (LA), linolenic acid (LNA), CQ: Chongqing, YN: Yunnan.
Table 2.
Distribution of markers on the chromosomes of the F2 population (CJC2 × JY166).
| Chromosome | Loci | Length | Average interval |
| Chr.1 | 45 | 101.1 | 2.25 |
| Chr.2 | 62 | 95.8 | 1.55 |
| Chr.3 | 37 | 79.7 | 2.15 |
| Chr.4 | 28 | 41.7 | 1.49 |
| Chr.5 | 35 | 63.0 | 1.80 |
| Chr.6 | 34 | 69.1 | 2.03 |
| Chr.7 | 49 | 77.0 | 1.57 |
| Chr.8 | 37 | 96.9 | 2.62 |
| Chr.9 | 36 | 51.9 | 1.44 |
| Chr.10 | 43 | 86.7 | 2.02 |
| Chr.11 | 21 | 47.7 | 2.27 |
| Chr.12 | 25 | 75.0 | 3.00 |
| Chr.13 | 40 | 76.3 | 1.91 |
| Chr.14 | 36 | 63.6 | 1.77 |
| Chr.15 | 36 | 48.1 | 1.34 |
| Chr.16 | 23 | 72.1 | 3.13 |
| Chr.17 | 38 | 34.1 | 0.90 |
| Chr.18 | 50 | 99.7 | 1.99 |
| Chr.19 | 63 | 95.5 | 1.52 |
| Chr.20 | 23 | 100.7 | 4.38 |
| total | 761 | 1475.7 | 1.94 |
Table 3.
QTL for five fatty acid in seeds identified over two environments.
| QTL | Env.a | Chr. | Nearest Maker | Interval (cM) | LOD | PVE (%) | Additive | Dominance |
| qPA01.1 | 22YN | 1 | SWU01110 | 36.20-44.29 | 5.44 | 14.2 | -0.27 | -0.07 |
| 23CQ | 1 | SWU01107 | 36.20-40.18 | 6.6 | 16.4 | 0.17 | 0.49 | |
| 23YN | 1 | SWU01109 | 38.20-44.29 | 3.62 | 10.5 | 0.12 | 0.49 | |
| qPA01.2 | 22CQ | 1 | CJ01032 | 100.02-101.12 | 5.14 | 12 | -0.07 | 0.51 |
| 24CQ | 1 | CSSR051 | 100.02-101.12 | 4.15 | 10.6 | 0.20 | -0.17 | |
| qPA02.1 | 22CQ | 2 | sat183 | 83.35-85.87 | 3.06 | 7.3 | 0.03 | -0.34 |
| 22YN | 2 | satt703 | 76.64-82.26 | 5.67 | 14.7 | 0.29 | 0.34 | |
| 22CQ | 2 | sat183 | 83.35-87.80 | 3.37 | 8.7 | 0.24 | 0.08 | |
| 24CQ | 2 | satt703 | 76.64-82.26 | 4.51 | 11.5 | 0.25 | 0.06 | |
| qPA03.1 | 22YN | 3 | CJ03002 | 0-3.70 | 5.74 | 14.9 | 0.16 | 0.38 |
| 23CQ | 3 | CJ03002 | 0-3.15 | 3 | 7.8 | 0.24 | -0.22 | |
| 23YN | 3 | CJ03002 | 0-3.15 | 3.34 | 9.8 | 0.27 | -0.33 | |
| qPA03.2 | 22CQ | 3 | satt641 | 17.16-27.92 | 3.23 | 7.7 | 0.08 | 0.35 |
| 23CQ | 3 | SWU03019 | 14.63-27.92 | 3.23 | 8.4 | 0.20 | 0.12 | |
| 24CQ | 3 | SWU03019 | 14.07-17.16 | 5.03 | 12.7 | 0.21 | 0.10 | |
| qPA05.1 | 22YN | 5 | satt599 | 58.13-63.01 | 5.57 | 14.5 | 0.11 | 0.55 |
| 32YN | 5 | CJ05032 | 60.31-63.01 | 4.03 | 11.6 | 0.42 | 0.36 | |
| qPA06.1 | 22YN | 6 | CJ06029 | 46.75-53.38 | 3.48 | 9.3 | -0.12 | 0.34 |
| 23YN | 6 | CJ06029 | 46.75-51.17 | 5.23 | 14.8 | 0.33 | -0.02 | |
| qPA07.1 | 22YN | 7 | SWU07054 | 41.17-45.25 | 6.5 | 16.7 | -0.34 | 0.13 |
| 23YN | 7 | SWU07054 | 41.17-43.34 | 3.58 | 10.4 | 0.21 | -0.34 | |
| qPA16.1 | 22YN | 16 | CSSR010 | 34.84-45.36 | 4.78 | 12.6 | 0.31 | 0.05 |
| 24CQ | 16 | CSSR010 | 39.76-47.29 | 5.01 | 12.7 | 0.21 | -0.19 | |
| qPA18.1 | 21CQ | 18 | SWU18177 | 93.38-99.70 | 5.08 | 12.2 | 0.31 | 0.17 |
| 22CQ | 18 | SWU18177 | 94.19-99.70 | 5.98 | 13.8 | 0.32 | 0.48 | |
| qPA19.1 | 21CQ | 19 | satt527 | 66.36-72.38 | 4 | 9.7 | 0.19 | -0.33 |
| 22CQ | 19 | CJ19020 | 69.92-72.38 | 3.29 | 7.8 | 0.18 | -0.15 | |
| 23CQ | 19 | SSR030 | 69.92-72.48 | 3.74 | 9.6 | 0.19 | -0.21 | |
| 24CQ | 19 | SWU19125 | 71.29-75.38 | 8.16 | 19.8 | 0.28 | -0.06 | |
| qPA19.2 | 22CQ | 19 | sat245 | 92.76-95.53 | 3.59 | 8.5 | -0.20 | 0.20 |
| 22YN | 19 | SWU19138 | 84.86-95.53 | 6.3 | 16.2 | 0.24 | 0.42 | |
| qPA20.1 | 22CQ | 20 | CJ20023 | 40.37-48.60 | 4.45 | 10.4 | 0.27 | 0.31 |
| 22YN | 20 | satt270 | 32.93-40.91 | 4.31 | 12.4 | 0.30 | -0.17 | |
| 24CQ | 20 | satt270 | 32.93-40.91 | 4.1 | 10.5 | 0.20 | -0.12 | |
| qSA05.1 | 21CQ | 5 | GMES021 | 34.89-37.90 | 3.82 | 9.3 | -0.21 | 0.02 |
| 22CQ | 5 | GMES021 | 34.89-41.24 | 6.83 | 15.6 | -0.15 | 0.03 | |
| 22YN | 5 | satt619 | 34.89-41.24 | 4.77 | 12.5 | -0.22 | -0.43 | |
| qSA12.1 | 22CQ | 12 | CJ12008 | 6.50-19.75 | 5.61 | 13 | -0.11 | 0.10 |
| 23CQ | 12 | CJ12009 | 17.81-24.19 | 7.01 | 17.3 | -0.40 | -0.22 | |
| qSA14.1 | 21CQ | 14 | satt534 | 59.18-63.64 | 5.65 | 13.5 | -0.24 | -0.13 |
| 22CQ | 14 | SWU14116 | 58.64-63.64 | 10.64 | 23.2 | -0.18 | 0.07 | |
| 22YN | 14 | satt474 | 55.39-59.72 | 3.92 | 10.4 | -0.22 | -0.17 | |
| 23CQ | 14 | CJ14037 | 51.86-60.26 | 4.08 | 10.5 | -0.36 | 0.00 | |
| qSA16.1 | 21CQ | 16 | SWU16118 | 63.62-72.07 | 5.12 | 12.3 | -0.17 | -0.26 |
| 22CQ | 16 | SWU16118 | 63.62-71.54 | 2.85 | 6.8 | -0.10 | 0.01 | |
| 23CQ | 16 | SWU16118 | 63.62-72.07 | 5.06 | 12.8 | -0.38 | 0.13 | |
| qSA18.1 | 22CQ | 18 | CJ18006 | 48.34-52.98 | 4.71 | 11 | -0.13 | 0.01 |
| 22YN | 18 | CJ18030 | 50.82-54.9 | 7.35 | 18.7 | -0.25 | -0.19 | |
| 23CQ | 18 | SWU18062 | 45.9-48.34 | 3.04 | 7.9 | -0.23 | -0.17 | |
| qSA20.1 | 21CQ | 20 | CJ20022 | 20.88-24.89 | 3.56 | 8.7 | -0.06 | -0.31 |
| 22YN | 20 | CJ20021 | 20.88-24.89 | 7.24 | 18.4 | -0.36 | -0.38 | |
| qOA02.1 | 23CQ | 2 | satt558 | 30.70-43.80 | 3.58 | 9.20 | 0.93 | 2.62 |
| 24CQ | 2 | SWU02044 | 19.81-31.25 | 4.84 | 12.30 | 1.46 | 0.49 | |
| qOA03.1 | 22CQ | 3 | satt641 | 17.16-27.92 | 3.97 | 9.40 | -0.94 | 3.80 |
| 23YN | 3 | SWU03071 | 17.16-27.92 | 3.19 | 9.30 | 0.42 | 0.73 | |
| qOA03.2 | 22YN | 3 | CJ03030 | 34.41-43.01 | 3.88 | 10.30 | 0.40 | -0.62 |
| 23YN | 3 | SWU03115 | 39.60-44.13 | 3.91 | 11.30 | -3.33 | -1.49 | |
| qOA06.1 | 22YN | 6 | satt557 | 46.75-53.38 | 3.84 | 10.20 | 0.69 | 0.19 |
| 23YN | 6 | CJ06029 | 46.75-49.81 | 3.06 | 9.00 | -2.43 | 0.26 | |
| qOA06.2 | 22YN | 6 | CSSR071 | 65.00-69.10 | 3.93 | 10.50 | 0.64 | -0.01 |
| 23CQ | 6 | sat312 | 61.19-66.09 | 3.38 | 8.70 | 1.91 | -0.04 | |
| qOA07.1 | 22CQ | 7 | CJ07044 | 68.69-73.72 | 5.31 | 12.30 | 2.45 | 1.49 |
| 22YN | 7 | CJ07052 | 73.72-77.03 | 3.5 | 9.40 | 0.66 | -0.30 | |
| 24CQ | 7 | CJ07052 | 75.94-77.03 | 3.36 | 8.70 | 1.31 | -1.11 | |
| qOA08.1 | 22YN | 8 | CJ08013 | 30.78-37.90 | 7.02 | 17.90 | 0.88 | 0.01 |
| 23YN | 8 | CJ08009 | 30.78-32.96 | 3.61 | 10.50 | -3.03 | -1.14 | |
| qOA10.1 | 22CQ | 10 | CJ10033 | 81.53-86.72 | 4.06 | 9.60 | 1.78 | 4.01 |
| 24CQ | 10 | CJ10030 | 81.53-86.72 | 3.26 | 8.40 | 1.82 | 0.39 | |
| qOA13.1 | 23CQ | 13 | satt569 | 9.11-14.59 | 4.71 | 12.00 | 2.70 | -1.62 |
| 24CQ | 13 | CJ13025 | 11.56-14.59 | 3.51 | 9.10 | 1.27 | -1.75 | |
| qOA13.2 | 22CQ | 13 | sat154 | 25.59-32.93 | 3.59 | 8.50 | -0.74 | 3.21 |
| 23CQ | 13 | CSSR074 | 21.87-25.59 | 3.31 | 8.60 | 2.05 | 0.13 | |
| qLA02.1 | 22CQ | 2 | CJ02012 | 88.61-93.37 | 4.89 | 11.4 | 2.30 | 3.05 |
| 23CQ | 2 | sat192 | 87.80-95.82 | 6.62 | 16.4 | -1.30 | -0.56 | |
| qLA03.1 | 22CQ | 3 | CJ03030 | 34.41-43.01 | 3.21 | 7.6 | 1.84 | -1.74 |
| 22YN | 3 | CJ03030 | 34.41-43.01 | 4.76 | 12.5 | -0.34 | 0.45 | |
| 23YN | 3 | CJ03030 | 34.41-43.01 | 4.68 | 13.4 | 3.71 | 2.97 | |
| qLA06.1 | 22YN | 6 | CJ06031 | 46.75-51.17 | 3.4 | 9.1 | -0.44 | 0.03 |
| 23YN | 6 | CJ06031 | 46.75-53.38 | 5.08 | 14.4 | 3.40 | -0.52 | |
| qLA07.1 | 22CQ | 7 | CJ07044 | 53.34-69.50 | 4.55 | 10.7 | -2.62 | -1.67 |
| 22YN | 7 | CJ07026 | 49.91-53.34 | 4.59 | 12.1 | -0.51 | 0.29 | |
| 23YN | 7 | satt536 | 45.79-53.34 | 3.96 | 11.4 | 2.91 | -0.97 | |
| qLA08.1 | 22YN | 8 | CJ08013 | 30.78-37.90 | 6.22 | 16 | -0.59 | -0.15 |
| 23YN | 8 | CJ08009 | 30.78-32.96 | 3.85 | 11.1 | 3.16 | 0.68 | |
| qLA09.1 | 23CQ | 9 | satt167 | 3.55-5.99 | 3.67 | 9.5 | -1.02 | 0.02 |
| 24CQ | 9 | CJ09022 | 3.55-5.44 | 3.42 | 8.9 | 0.28 | 1.17 | |
| qLA09.2 | 22CQ | 9 | satt417 | 14.01-19.33 | 3.46 | 8.2 | 0.92 | -3.45 |
| 23YN | 9 | sat281 | 10.10-14.82 | 4.91 | 14 | 2.17 | 4.22 | |
| qLA12.1 | 22YN | 12 | CJ12008 | 6.50-22.26 | 4.49 | 11.8 | -0.47 | 0.14 |
| 23CQ | 12 | CJ12009 | 19.75-22.54 | 3.15 | 8.2 | 0.94 | 0.27 | |
| qLA19.1 | 22YN | 19 | sat245 | 91.67-94.71 | 3.36 | 9 | -0.13 | 0.60 |
| 23CQ | 19 | SWU19145 | 91.67-94.71 | 3.48 | 9 | -0.71 | -1.09 | |
| qLA20.1 | 22CQ | 20 | CJ20021 | 16.34-24.89 | 3.63 | 8.6 | -1.62 | -4.40 |
| 24CQ | 20 | CJ20021 | 16.34-20.88 | 2.59 | 6.8 | -0.72 | 0.33 | |
| qLA20.2 | 22YN | 20 | CSSR041 | 32.93-40.37 | 3.07 | 8.3 | 0.05 | 0.64 |
| 24CQ | 20 | CSSR041 | 32.93-40.37 | 3.93 | 10.1 | -0.78 | 0.51 | |
| qLNA02.1 | 22CQ | 2 | CJ02052 | 51.56-54.36 | 4.14 | 9.7 | -0.16 | -0.24 |
| 22YN | 2 | SWU02115 | 51.56-59.01 | 8.28 | 20.8 | -0.14 | -0.71 | |
| 23CQ | 2 | SWU02120 | 52.66-62.94 | 6.53 | 16.2 | -0.82 | -0.47 | |
| 24CQ | 2 | sat169 | 59.01-62.94 | 5.71 | 14.3 | -0.41 | 0.56 | |
| qLNA03.1 | 22CQ | 3 | SWU03017 | 10.38-17.16 | 3.87 | 9.1 | -0.13 | 0.32 |
| 24CQ | 3 | SSR066 | 5.89-14.07 | 3.55 | 9.2 | -0.35 | -0.50 | |
| qLNA07.1 | 23CQ | 7 | SWU07001 | 0-1.89 | 5.16 | 13.1 | 0.17 | -1.17 |
| 23YN | 7 | CJ07002 | 0.54-2.16 | 3.62 | 10.5 | 0.54 | -0.60 | |
| qLNA08.1 | 23CQ | 8 | satt378 | 90.26-96.39 | 3.97 | 10.2 | -0.68 | -0.14 |
| 23YN | 8 | CJ08041 | 90.26-96.39 | 3.17 | 9.3 | -0.59 | -0.35 | |
| qLNA10.1 | 23CQ | 10 | satt477 | 48.33-52.42 | 6.46 | 16.1 | -0.87 | -0.60 |
| 23YN | 10 | satt262 | 48.33-50.49 | 3.46 | 10.1 | -0.29 | -0.87 | |
| qLNA11.1 | 22CQ | 11 | SWU11120 | 30.27-38.80 | 4.05 | 9.5 | -0.11 | 0.29 |
| 22YN | 11 | SWU11123 | 33.33-38.80 | 3.1 | 8.3 | 0.20 | 0.36 | |
| 24CQ | 11 | SWU11123 | 32.78-38.80 | 3.21 | 8.3 | -0.39 | 0.35 | |
| qLNA17.1 | 22CQ | 17 | sat220 | 30.60-34.14 | 5.1 | 11.9 | -0.24 | 0.11 |
| 24CQ | 17 | sat220 | 30.60-34.14 | 5.16 | 13 | -0.61 | 0.02 | |
| qLNA18.1 | 22CQ | 18 | SWU18175 | 96.12-99.70 | 4.78 | 11.2 | 0.30 | 0.16 |
| 22YN | 18 | SWU18175 | 96.93-99.70 | 3.75 | 10 | 0.20 | -0.37 | |
| 24CQ | 18 | SWU18175 | 96.93-99.70 | 3.22 | 8.3 | 0.47 | -0.09 | |
| qLNA19.1 | 23CQ | 19 | SWU19012 | 8.41-18.61 | 4.01 | 10.3 | -0.60 | -0.39 |
| 24CQ | 19 | SWU19017 | 13.16-18.61 | 3.24 | 8.4 | -0.35 | -0.38 |
Table 4.
Candidate genes for fatty acids of Soybean.
| QTL | Candidate gene | Homolog in Arabidopsis | Gene description |
| qPA02.1 | Glyma.02G273300 | AT3G55360 | 3-oxo-5-alpha-steroid 4-dehydrogenase family protein |
| qPA19.1 | Glyma.19G170100 | AT5G43940 | GroES-like zinc-binding dehydrogenase family protein |
| qSA14.1 | Glyma.14G173500 | AT1G55020 | lipoxygenase 1 |
| qLNA02.1 | Glyma.02G203300 | AT4G30950 | fatty acid desaturase 6 |
| Glyma.02G227200 | AT5G05580 | fatty acid desaturase 8 |
Disclaimer/Publisher’s Note: The statements, opinions and data contained in all publications are solely those of the individual author(s) and contributor(s) and not of MDPI and/or the editor(s). MDPI and/or the editor(s) disclaim responsibility for any injury to people or property resulting from any ideas, methods, instructions or products referred to in the content. |
© 2025 by the authors. Licensee MDPI, Basel, Switzerland. This article is an open access article distributed under the terms and conditions of the Creative Commons Attribution (CC BY) license (http://creativecommons.org/licenses/by/4.0/).
Copyright: This open access article is published under a Creative Commons CC BY 4.0 license, which permit the free download, distribution, and reuse, provided that the author and preprint are cited in any reuse.


